Abstract
Contemporary research on electric vehicle (EV) consumption is predominantly focused on the vehicle’s powertrain and battery technology. However, the analyses indicate that the actual state of the various electrical subsystems in the vehicle can have a significant impact on the overall consumption figures. The primary objective of this article is to demonstrate the capabilities of our vehicle simulation model, which was developed with a particular focus on the electrical subsystems of vehicles, when employed in a 3D digital representation of a real environment. The central scientific contribution of this work is the systematic quantification of subsystem-level energy usage in real-world scenario simulation. This provides a novel framework for the evaluation of EV energy distribution, thereby informing future strategies and models.
1. Introduction
Recent advancements in diverse domains are progressively concentrating on the optimisation of systems and the augmentation of their efficiency. This phenomenon is also evident in the automotive industry. It is evident that the vast majority of the leading Original Equipment Manufacturers (OEMs) are firmly committed to the pursuit of sustainable development and the mitigation of emissions. Major European manufacturers have committed to European Union 2030 climate targets to reduce the net greenhouse gas emissions [1]. There are several reasons for this phenomenon. It is evident that this action possesses significant marketing value. Secondly, it is evident that the pursuit of sustainable development is fundamentally incompatible with the utilisation of conventional internal combustion engines. It is therefore imperative to enhance the usability of electrically powered vehicles. The issue of the vehicles’ usability is most acutely experienced in everyday life, as evidenced by their limited range and protracted charging times. It is widely perceived that these vehicles lack the same level of agility as their internal combustion counterparts. This is a significant deterrent for potential buyers. A number of research directions have been proposed to address these issues. The two principal approaches to development are the enhancement of battery capacity and the optimisation of energy usage in vehicles. A proportion of researchers have identified the enhancement of battery technology as a potential solution to this issue. Research is underway to develop solutions that will enhance storage capacity [2], expedite charging processes [3], and facilitate rapid battery pack replacement [4,5]. In principle, this represents the more conventional approach to the development of electric vehicles for their present utilisation. The issue with this proposal is that, based on current knowledge, expanding energy storage capacity would require significant financial investment and physical implementation. In contrast, the research trajectory that has been selected is more aligned with the aforementioned optimisation of energy usage in vehicles.
1.1. Optimisation
It is imperative to provide a balanced overview of the advantages and disadvantages of the optimisation approach. In essence, the application of optimisation techniques in the energy consumption of electric vehicles provides a foundation for the development of a system that can be adapted to existing production vehicles with minimal hardware modifications, with the majority of these modifications occurring at the software level. As we move closer to the optimal system architecture, we can achieve more efficient operation and, as a result, a more sustainable system. It must be acknowledged that there are a number of complicating factors to consider. For instance, the electrically powered vehicles currently available on the market vary in their operational characteristics, depending on the manufacturer [6]. In order to optimise each vehicle properly, it would be necessary to develop and adapt the system individually. It is imperative to acknowledge that, given the nature of a reverse engineering process, the degree of system integration will invariably fall short of 100%. This inherent limitation poses a significant risk, as it may result in residual components or vulnerabilities remaining within the system.
1.2. Battery Electric Vehicles
It is evident that the energy optimisation of battery electric vehicles (BEVs) necessitates a consideration of the low-voltage (LV) energy distribution system. Recent studies have indicated a shift in vehicle development towards increased energy consumption within the low-voltage system [7] and implementation of more complex Electronic Control Units (ECUs) [8], new sensors, by-wire systems [9,10] and more accurate actuators. In light of the aforementioned rationales, it is considered beneficial to implement a comprehensive vehicle-level simulation that incorporates significant low-voltage system load. This would facilitate the identification of the vehicle’s utilisation of diverse systems and the subsequent assessment of energy consumption. It is evident that the utilisation of this apparatus will facilitate the optimisation of the vehicle system’s energy consumption. The innovative aspect of this work lies in the integration of subsystem-level modelling with high-resolution environmental simulation, thereby providing insights for future EV energy management and fleet planning strategies.
2. Simulation Approach
The selection of an appropriate simulation environment and simulation actor represents a pivotal component in attaining optimal outcomes with regard to the energy consumption of a vehicle. In order to facilitate a meaningful comparison, a simulation environment and vehicle that is straightforward to use and based on real data has been selected. It is imperative that the validation of the simulation data is conducted in conjunction with real-world data at a subsequent point in time.
2.1. Simulation Environment
In the context of the simulation environment, a range of possibilities was investigated, including open roads, closed roads, and vehicle test tracks. In order to gain insight into the functionality of the system in a real-world traffic environment populated by multiple road users, the open roads approach is recommended. Nevertheless, it must be noted that a significant disadvantage is presented by the fact that these vehicles are not under our control; therefore, their motions and behaviour cannot be replicated without conducting an advanced measurement in which all relevant actors are measured in all situations. It is also important to note that the environmental reproduction of this system is challenging. There is a lack of high-precision data regarding roads, vehicles, and other environmental elements. In the event of a closed road, the opportunity arises to exercise control over the relevant road users according to the desired parameters. However, the requisite high-precision environmental data remains unavailable. Therefore, the ZalaZONE High Speed Handling Course (ZZHSH) Proving Ground dataset in MATLAB R2024b has been selected for analysis. The generation of this dataset was the result of a collaborative effort between BME and MathWorks [11]. It is stated that the database contains a high-resolution digital map of the Proving Ground. In this environment, the simulation of the system is possible with a high degree of reliability.
The 3D environment simulation is implemented in the Simulink model by means of the Simulation 3D Scene from Vehicle Dynamic Blockset [12]. The ZalaZONE 3D Scene has been developed for the purpose of simulating high-speed vehicle manoeuvres, with a particular focus on steering, damping, braking, and acceleration performance. As demonstrated in Figure 1, the 3D simulation data is interconnected with the vehicle model through a series of data processing operations. This data processing is important to change the 3D world data from the simulation coordinate system to the vehicle coordinate system. The interface between the vehicle model framework and the 3D environment is a Vehicle Body 3DOF Dual Track Block. The X, Y coordinate and heading information is forwarded to the 3D environment, and the feedback data from the Simulation 3D Actor Transform Get block is then transmitted to the vehicle simulation framework input. The subsequent subsection will provide a comprehensive overview of the vehicle model framework.
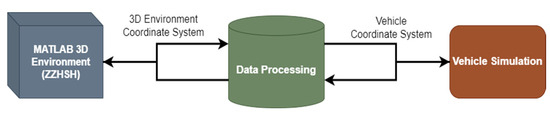
Figure 1.
The 3D environment and the vehicle model are connected.
2.2. Simulated Vehicle
In order to conduct a simulation, it is necessary to select an actor, i.e., the vehicle. In relation to the vehicle, it is imperative that we consider the integration of vehicles into the environment. The utilisation of a BEV was of paramount importance. It is imperative to possess a comprehensive understanding of the vehicle systems in order to facilitate the effective implementation of the subsystems. It should be noted that, in order to facilitate subsequent validation, it was necessary to utilise vehicles that were available for real-time validation. In this instance, a simulation model for two BEVs was created. The two vehicles under scrutiny are the Mitsubishi i-MiEV (manufactured by Mitsubishi Motors Corporation in Tokyo, Japan) and the Jaguar i-Pace (manufactured by Jaguar Land Rover in Coventry, United Kingdom). The selection of these two vehicles was made on the basis that, at the time of writing, these two pure electric vehicles were physically available for a more accurate calibration of the simulation. As demonstrated in Table 1, it is evident that a range of OEMs adopt varied approaches when designing and constructing BEVs. In the design process of the aforementioned vehicles, Mitsubishi and Jaguar adopted different perspectives.

Table 1.
Vehicle specification comparison.
Consideration of the reasons for choosing these vehicles may be explained. There are two reasons: at the time, there were only two vehicles available for study. However, there are more significant reasons, as evidenced by data. Firstly, a considerable body of research on electric vehicles has revealed a remarkably consistent pattern of daily usage. Most BEV users opt for this type of vehicle when travelling in urban areas or for short city-based routes. The findings of the studies indicate that vehicle price and category do not have a significant effect on daily usage [13]. A further key rationale for establishing a highly adaptable simulation framework for different BEV platforms is that this would enable simulations to emulate realistic behaviours. It is evident that the two platforms can provide sufficient evidence regarding the simulation, which indicates that it can produce data representative of real-world vehicle behaviour, as supported by the observation that most BEVs are suited to the simulation.
The i-MiEV is an economical electric vehicle intended for general city use, while the i-Pace is a high-end vehicle with advanced dynamic capabilities. As the table illustrates, the i-MiEV possesses a considerably diminished battery capacity. The vehicle is equipped with a motor of reduced power, yet its weight is less than half that of the Jaguar. Concerning the 12-volt power distribution system, it can be observed that the I-Pace is the vehicle that exhibits a higher level of advantage, with features including an adaptive lighting system, an advanced in-vehicle infotainment (IVI) system, and an electro-hydraulic power braking system (PBS). IVI systems include all car entertainment systems. In the Mitsubishi, this includes a 100W stereo radio with six speakers. In the Jaguar, it includes a navigation system and 15 speakers with a total power output of 825W.
3. Simulation Setup
As previously stated, the software of choice for simulations is MATLAB Simulink. The 3D Scene Simulation reference coordinate system, which is based on the ZZHSH, was utilised during the course of the simulation. However, the authors of the aforementioned study have proposed an initial point for the simulation [11]. In order to employ a more realistic approach, a different 0 point was utilised, as can be observed in Figure 2. The initial and final locations were defined at the midpoint of the service route, as it was deemed more pertinent to initiate and conclude the measurement system at this point. The adoption of this approach was necessitated by the requirement to ensure the validity of the subsequent data analysis.
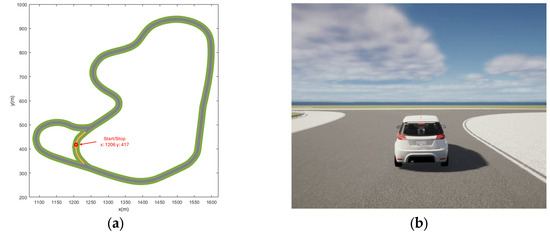
Figure 2.
ZalaZONE High-Speed Handling in simulation. (a) shows the course from above; (b) displays a 3D vehicle model of an imaginary vehicle, positioned at the initial location.
The construction of the base vehicle simulation model was undertaken in accordance with the following requirements. It is imperative that the system be capable of straightforward adaptation to a variety of vehicle models and systems. The primary objective of the simulation was to adapt as many vehicles as possible. Furthermore, it must be emphasised that the simulation should be run in real time or even faster to ensure the validity of the results. It is imperative to note that the acquisition of this knowledge was of paramount importance, as it has enabled us to develop a sophisticated simulation model capable of replicating extended road trips. This model permits the utilisation of the battery’s full capacity, thereby facilitating the simulation of uninterrupted operation. The aforementioned phenomenon is contingent upon the stability of the model. The stability of the simulation was also a pivotal consideration. Finally, it should be noted that the importation of the simulation was also essential in providing a defined framework for the purpose of ensuring the comparability of the simulation results. In the future, research will be conducted into the development of simplified mathematical models for subsystem consumption. The subsequent figure offers an introduction to the high-level adaptive vehicle simulation framework schematic (see Figure 3). The base simulation framework utilised for these vehicle models is identical, yet the model is configured to accommodate the distinct characteristics of each vehicle system.
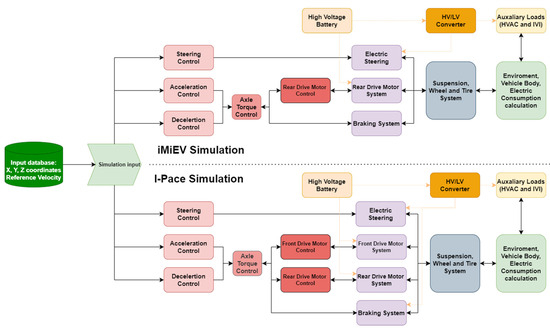
Figure 3.
Schematic diagram of the vehicle simulation framework.
The following explanation provides a comprehensive introduction to the simulation framework. The simulation employs a driver model created with Stanley’s control algorithm, incorporating both lateral and longitudinal trajectories. These models use reference data and 3D simulation feedback to calculate vehicle path and define steering, acceleration, and deceleration commands for the vehicle model. Acceleration and deceleration requests are converted into axle torque requests. Motor control and braking subsystems receive this torque as input. Steering, motor torque request, and brake requests are then sent to a vehicle tyre, wheel, and suspension models. It is important to note that all signals are handled by a wheel and suspension model specifically created for this purpose. The model displays dual output characteristics. The system’s output signal corresponds to the axle speed, serving as feedback to regulate the vehicle, motor, and braking systems. Concurrently, it produces an output indicating front and rear axle forces. In the subsequent model, these forces were utilised, employing a Vehicle Body 3DOF Dual Track block to represent the vehicle chassis. In this sub-model, the energy consumption of the different subsystems is summarised, utilised, and calculated. The used electric subsystems in the vehicle simulation have been created using models from a range of publications which have been already defined [14,15,16]. It is evident that these models do not align precisely with our system. Consequently, we have implemented modifications and parameterisations.
4. Simulation Results
In order to effectively demonstrate the remarkable differences between the two vehicle simulation results, a total of three distinct scenarios were defined. The scenarios that have been defined are as follows:
- Acceleration time from standstill to 100 km/h;
- Use the ZalaZONE 3D scenario with a fixed reference speed;
- Use the ZalaZONE 3D scenario, which has a realistic speed profile.
4.1. Acceleration Test
The initial simulation result was initiated with the straight-line acceleration scenario. This scenario is optimal for the purpose of evaluating the vehicle dynamics and the utilisation of the electric system in the case of the vehicles. In the standard configuration for this manoeuvre, the vehicle IVI was deactivated. The phenomenon can be explained by the fact that, in this instance, the system generates solely base energy consumption, while dynamic consumption remains unmeasurable within this context. It is also important to note that, in this instance, EPAS energy consumption was zero, given that there was no steering wheel motion. As demonstrated in Figure 4 and Figure 7, the acceleration dynamics of the simulated vehicle from 0 to 100 km/h are in accordance with the catalogue data for such vehicles.
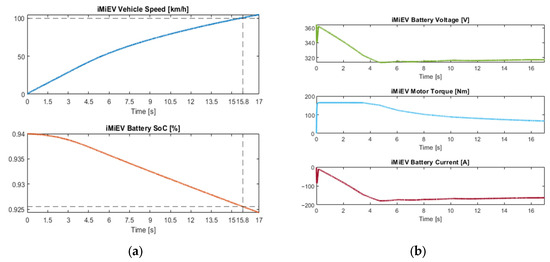
Figure 4.
i-MiEV straight-line (a) acceleration with (b) information about the powertrain.
4.2. Fix Speed
The utilisation of a fixed speed profile through the ZZHSH on Proving Ground has been demonstrated to be a reliable method of assessing the power consumption differences between vehicles. The speed in question was defined as 30 km/h. This was determined to be the optimal speed for navigating the corners without causing significant tyre slippage in either vehicle. The result is demonstrated in Figure 5, in which the vehicle velocity and the SOC level of the vehicle are presented based on elapsed time.
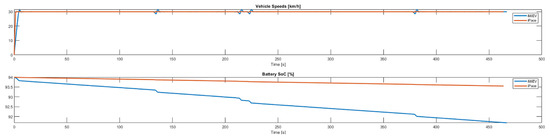
Figure 5.
Vehicle velocity and battery discharge curves for the fixed speed profile scenario, based on time.
4.3. Speed Profile
The final scenario considered was the ZZHSH track usage with a realistic speed profile. In this particular scenario, the focus is on the investigation of the functionality of the implemented electrical subsystems. In this particular instance, the activation of a low-voltage subsystem was also initiated. In both cases, the vehicle’s low-beam headlamp function was engaged, and the radio was adjusted to a low volume setting. In this particular instance, it is imperative to consider the energy consumption of the EPAS. The subsystem power consumption is illustrated in Figure 6. The figure’s upper subplots illustrate the vehicle’s velocity and the angle of its steering for the purpose of reference. As illustrated in the lower subplots of the figures, the actual consumption of the electric subsystem and propulsion system consumption is demonstrated.
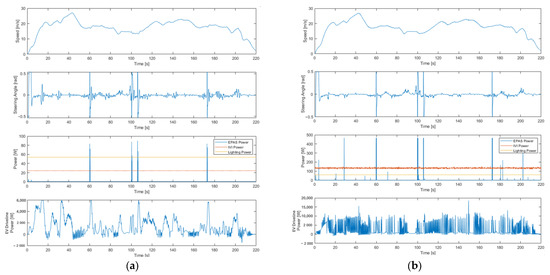
Figure 6.
Energy consumption for realistic speed profile. The lower subplots in the figure show the actual energy consumption based on elapsed time. (a) shows iMiEV results; (b) shows i-Pace results.
With regard to the IVI systems, it is evident that the low utilisation of the system results in different energy consumption levels, which are dependent on the varying power requirements of the audio systems. Nevertheless, the utilisation of lightning energy is found to be comparable in both cases, with this similarity being attributable to the technology employed in the headlamps. In consideration of the EPAS energy, it is evident that the energy usage peaks attributable to the high-degree corners are distinct.
4.4. The Results of the i-MiEV Case Study
With regard to the acceleration test, the i-MiEV requires 15.6 s to complete the task [17]. It is important to note that the figures demonstrate a realistic electric consumption profile.
In the context of the fixed-speed test, the battery’s State of Charge (SOC) data is of paramount importance. It is evident that the vehicle is equipped with a battery of relatively modest capacity. Consequently, in order to substantiate our findings in a real-world setting, it is imperative to take the battery’s charging level into consideration prior to the initiation of the test.
In the event of a realistic speed profile, the low weight of the i-MiEV is indicative of the low energy usage of the EPAS system. As demonstrated in the final section of the figures, the driveline energy usage of the vehicle is realistic, given its physical dimensions.

Figure 7.
i-Pace straight-line (a) acceleration with (b) information about the powertrain.
Figure 7.
i-Pace straight-line (a) acceleration with (b) information about the powertrain.

4.5. The Results of the i-Pace Case Study
With regard to the acceleration test, the i-Pace requires 4.8 s to reach its desired velocity [18]. It is evident that the i-Pace displays a minimal considerable (SoC) level. The vehicle’s specifications are notable for their inclusion of a substantial battery pack and two engines with high torque density.
As illustrated in the diagram, when the speed profile is of a realistic nature, it is evident that the steering system requires a substantial quantity of energy when the steering angular velocity is elevated. The diagram also demonstrates a high level of energy consumption within the propulsion system.
5. Conclusions
In conclusion, the results of the study may be summarised as follows: The initial plan was to develop a comprehensive vehicle simulation, encompassing the low-voltage system and vehicle-level energy consumption. The aforementioned objective is attained as evidenced by the figures presented. In the acceleration scenario, the simulated vehicle dynamics demonstrate a high degree of alignment with the catalogue data for these vehicles. The fixed-speed scenario facilitates the identification of substantial discrepancies in the battery capacity of the simulated vehicles. The speed profile-based ZZHSH scenario enables the assessment of the behaviour of the implemented LV subsystem in a dynamic system and its impact on the full vehicle energy consumption.
In future research, it is imperative to compare the simulation data with real measurements. Once it is ascertained that the models accurately represent the original vehicles, the subsequent stage of the research can commence. At this point, the energy usage can be optimised based on different scenarios. This optimisation has the potential to facilitate the development of a more reliable and secure system for the future of electric vehicle energy distribution systems.
Author Contributions
Conceptualization, Á.T., E.N. and J.G.P.; Methodology, Á.T. and E.N.; Software, E.N.; Validation, E.N. and Á.T.; Formal Analysis, Á.T.; Investigation, E.N.; Resources, Á.T., J.G.P. and E.N.; Writing—Original Draft Preparation, E.N.; Writing—Review and Editing, Á.T. and J.G.P.; Visualisation, E.N.; Supervision, Á.T.; Project Administration, Á.T.; Funding Acquisition, Á.T., J.G.P. and E.N. All authors have read and agreed to the published version of the manuscript.
Funding
This research was funded by NO. 2024-2.1.2-EKÖP-KDP-2024-00005 and has been implemented with the support provided by the Ministry of Culture and Innovation of Hungary from the National Research, Development and Innovation Fund, financed under the EKÖP_KDP-24-1-BME-16 funding scheme.
Institutional Review Board Statement
Not applicable.
Informed Consent Statement
Not applicable.
Data Availability Statement
Dataset available on request from the authors.
Conflicts of Interest
The author declare that the research was conducted in the absence of any commercial or financial relationships that could be construed as a potential conflict of interest.
References
- Commission, E. 2030 Climate Targets. Available online: https://climate.ec.europa.eu/eu-action/climate-strategies-targets/2030-climate-targets_en. (accessed on 17 April 2025).
- Mohammadi, F.; Saif, M. A comprehensive overview of electric vehicle batteries market. e-Prime–Adv. Electr. Eng. Electron. Energy 2023, 3, 100127. [Google Scholar] [CrossRef]
- Khalid, M.; Ahmad, F.; Panigrahi, B.K.; Al-Fagih, L. A comprehensive review on advanced charging topologies and methodologies for electric vehicle battery. J. Energy Storage 2022, 53, 105084. [Google Scholar] [CrossRef]
- Kotak, Y.; Marchante Fernández, C.; Canals Casals, L.; Kotak, B.S.; Koch, D.; Geisbauer, C.; Trilla, L.; Gómez-Núñez, A.; Schweiger, H.G. End of electric vehicle batteries: Reuse vs. recycle. Energies 2021, 14, 2217. [Google Scholar] [CrossRef]
- Nurdiawati, A.; Agrawal, T.K. Creating a circular EV battery value chain: End-of-life strategies and future perspective. Resour. Conserv. Recycl. 2022, 185, 106484. [Google Scholar] [CrossRef]
- Thangavel, S.; Mohanraj, D.; Girijaprasanna, T.; Raju, S.; Dhanamjayulu, C.; Muyeen, S. A comprehensive review on electric vehicle: Battery management system, charging station, traction motors. IEEE Access 2023, 11, 20994–21019. [Google Scholar] [CrossRef]
- Nagy, E.; Torok, A. Comparison of Simulation- and Regression-Based Approaches to Estimating Electric Car Power Consumption. Appl. Sci. 2025, 15, 513. [Google Scholar] [CrossRef]
- Naqvi, S.S.A.; Jamil, H.; Iqbal, N.; Khan, S.; Khan, M.A.; Qayyum, F.; Kim, D.H. Evolving electric mobility energy efficiency: In-depth analysis of integrated electronic control unit development in electric vehicles. IEEE Access 2024, 12, 15957–15983. [Google Scholar] [CrossRef]
- Li, D.; Tan, C.; Ge, W.; Cui, J.; Gu, C.; Chi, X. Review of brake-by-wire system and control technology. Actuators 2022, 11, 80. [Google Scholar] [CrossRef]
- Husain, S.S.; Kadhim, M.Q.; Al-Obaidi, A.S.M.; Hasan, A.F.; Humaidi, A.J.; Al Husaeni, D.N. Design of robust control for vehicle steer-by-wire system. Indones. J. Sci. Technol. 2023, 8, 197–216. [Google Scholar] [CrossRef]
- MATLAB. ZalaZONE Automotive Proving Ground High-Speed Handling Course—High-Speed Handling Course 3D Envment. Available online: https://www.mathworks.com/help/vdynblks/ref/zalazoneautomotiveprovinggroundhighspeedhandlingcourse.html. (accessed on 23 April 2025).
- Simulation 3D Scene Configuration—Scene Configuration for 3D Simulation Environment—Simulink. Available online: https://www.mathworks.com/help/releases/R2024b/vdynblks/ref/simulation3dsceneconfiguration.html (accessed on 23 April 2025).
- Cui, D.; Wang, Z.; Liu, P.; Wang, S.; Zhang, Z.; Dorrell, D.G.; Li, X. Battery Electric Vehicle Usage Pattern Analysis Driven by Massive Real-World Data. Energy 2022, 250, 123837. [Google Scholar] [CrossRef]
- Zhengqi, L.; Zhongqian, H.; Chaohua, L.; Feng, L.; Xikun, L.; Hang, J. Model and Simulation of Electric Power Steering System in Permanent Magnet Synchronous Motor. In Proceedings of the 2023 2nd International Conference on Futuristic Technologies (INCOFT), Belagavi, India, 24–26 November 2023; pp. 1–5. [Google Scholar]
- Model an Anti-Lock Braking System—MATLAB. Simulink. Available online: https://www.mathworks.com/help/simulink/slref/modeling-an-anti-lock-braking-system.html (accessed on 23 April 2025).
- Vehicle HVAC System. Available online: https://www.mathworks.com/help/hydro/ug/vehicle-hvac.html. (accessed on 23 April 2025).
- Mitsubishi I-MiEV. Available online: https://ev-database.org/uk/car/1029/Mitsubishi-i-MiEV. (accessed on 3 May 2025).
- All-Electric Jaguar I-Pace Specifications. Available online: https://www.jaguar.com/jaguar-range/i-pace/specifications/index.html. (accessed on 5 May 2025).


Disclaimer/Publisher’s Note: The statements, opinions and data contained in all publications are solely those of the individual author(s) and contributor(s) and not of MDPI and/or the editor(s). MDPI and/or the editor(s) disclaim responsibility for any injury to people or property resulting from any ideas, methods, instructions or products referred to in the content. |
© 2025 by the authors. Licensee MDPI, Basel, Switzerland. This article is an open access article distributed under the terms and conditions of the Creative Commons Attribution (CC BY) license (https://creativecommons.org/licenses/by/4.0/).