Abstract
This study aims to enhance safety within the Budapest tram network by developing methods to assess and manage tram drivers’ cognitive workload. While defensive driving reduces accident risk, it becomes less effective when drivers are mentally overloaded. There is currently no reliable method to objectively measure this workload, which this research aims to develop. Trams frequently interact with unpredictable road users, increasing the likelihood of sudden braking and related injuries. Using accident data, high-risk locations were identified, and cognitive workload was assessed via eye-tracking (blinks and fixations) in a tram simulator. Participants drove two predefined routes and responded to unexpected events as they would in real traffic. Results reveal a correlation between blink/fixation frequency and cognitive load, enabling the identification of mentally demanding locations. These insights support targeted interventions to reduce driver workload and enhance operational safety.
1. Introduction
Trams are electric urban transport vehicles running on dedicated tracks and are essential to public transit in cities like Budapest, which has a 150 km network. Their efficiency, high capacity, and low emissions support sustainable urban mobility, though shared road sections and intersections increase the risk of conflicts with other traffic. Safe operation requires high levels of attention and anticipation from drivers, but cognitive overload, especially under time pressure, can impair situational awareness, contributing to accidents and highlighting the need for better training and systemic improvements [1,2].
Human attention has a limited capacity, so performance is significantly impaired when faced with multiple simultaneous tasks or rapid successive stimuli [3,4]. The research results highlight that a driver’s attention can be easily overloaded by complex traffic situations or using on-board interfaces. The effects of these cognitive constraints and attentional mechanisms make it particularly appropriate to develop an objective, reliable measurement methodology to identify and quantify traffic situations and intersections that induce increased mental load.
Inattentional blindness describes the phenomenon where an unexpected but visible visual stimulus goes unnoticed because another task diverts or distracts a person’s attention [5]. This is due to the limited capacity of conscious processing: the human brain has a finite capacity to process information, so if attentional resources are concentrated on a particular task, other stimuli do not reach conscious perception. Another similar phenomenon is attentional blink, a brief “refractory period” of attention when processing two rapidly successive stimuli [6]. If the first target stimulus is followed by the second within a very short time, around 200–500 ms, it is often impossible to consciously perceive the second stimulus. This occurs when the attentional resources required to process the second stimulus exceed the maximum available capacity—the second signal simply “misses” conscious perception [7].
An experiment with tram drivers in Athens assessed how road design and operational factors affect perceived safety and driving stress [8]. The findings revealed that alignment type, pedestrian crossings, and the density of vulnerable road users (VRUs) significantly impacted perceived safety, while stress was primarily influenced by route unfamiliarity, passenger load, and delays. Interestingly, perceived safety and stress were not directly correlated; experienced drivers often felt confident in riskier situations if they were familiar with the route.
Emergency braking refers to a process in which the tram decelerates rapidly, potentially causing standing passengers to lose their balance and fall, and seated passengers to be jolted from their seats. This sudden deceleration or stop can lead to personal injuries and damage to passengers’ personal belongings [9]. Passenger discomfort and injury risks during braking events are key concerns for standing passengers in trams and buses, where sudden changes in speed can lead to loss of balance and increased strain, as shown through a smartphone-based discomfort index linked to acceleration data [10].
Tram drivers encounter numerous dangerous situations during their work. Most of these occur due to road users’ irregular and inattentive behavior. According to internal statistics provided by the Budapest Transport Privately Held Corporation (BKV) [11], Table 1 below shows the distribution of road accidents on the Budapest tram network between 2019 and 2023.

Table 1.
The distribution of road accidents on the Budapest tram network (Budapest Transport Privately Held Corporation statistics) [11].
The most prominent sources of danger include when a vehicle traveling parallel to a tram turns left in front of the tram at an intersection. Another potential hazard arises at intersections that are regulated solely by traffic signs. These intersections may be difficult for drivers to see clearly or present particularly complex traffic situations (e.g., multiple traffic junctions meet simultaneously). It is also important to highlight that the improper behavior of pedestrians can lead to hazardous situations; they can step in front of the tram unexpectedly, possibly also between the tram cars, which is an entirely invisible area for tram drivers. They can also be difficult to notice from a sufficient distance away in the dark and in poor visibility conditions [9].
When driving in a simulated environment, participants experience less stress and are more likely to adopt a relaxed and experimental driving style than real-life driving situations [12]. This indicates that the nature of the environment influences behavior, which may be further affected by the presence of measurement tools.
Our research aims to develop a methodology to objectively assess the mental workload of tram drivers in complex traffic situations. By quantifying their cognitive load, we can identify necessary changes to the infrastructure or traffic rules applied. Eye-tracking glasses were used to measure the tram driver’s physiological metrics while vehicle parameters were logged simultaneously.
2. Materials and Methods
The measurements were conducted using a tram simulator (Lander, San Sebastian, Spain) (Figure 1). The simulator models a Tatra T5C5K tram. In terms of design, three 55 inch main monitors show the view from the cab, supplemented by two 15 inch ones on the instrument panel for less frequently used control functions. In addition, there are also physical controls identical to the real tram. Using the simulator is cost-effective and standardizes conditions, allowing all participants to perform tasks under the same circumstances, improving the comparability and validity of the results. Participants drive along a set route and face unexpected traffic situations, responding at their discretion.
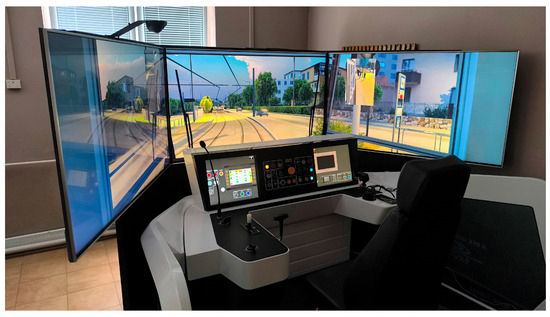
Figure 1.
Tram simulator type Tatra T5C5K.
The study focused on identifying complex and high-stress traffic situations encountered by tram drivers and quantifying their cognitive load under these conditions. Based on accident statistics and driver feedback, intersections were identified for analysis. Measurements were conducted in both traffic directions at each site to account for directional differences in visibility and cognitive demand.
To simulate real-world driving behavior, participants navigated two predefined routes in the tram simulator, which included unpredictable events requiring spontaneous responses. Participants were instructed to drive as they would under real-life operational conditions prior to the test. The cognitive load was evaluated in relation to a reference section and average baseline, highlighting segments where mental strain was notably high. The following scenarios were selected and predefined in the simulator study:
- Pedestrians are crossing the tracks at unauthorized locations.
- Cars turn left in front of the tram.
- Objects (e.g., a parked car or a box) obstruct the track clearance of the tram.
For our measurements, we utilized eye-tracking (ET) goggles by Pupil Labs that continuously record the subject’s pupil movements through two infrared cameras [13]. Pupil Neon ET glasses equipped with dual infrared cameras were used to record pupil movements, gaze direction, blink frequency and duration, and fixation times in real time. These parameters provided reliable indicators of cognitive workload.
In a study, eye movement and blink data were recorded from four participants (A, B, C, D) while driving a predetermined route. The aim was to explore the extent to which selected traffic junctions place cognitive strain on drivers. During the analysis of the measurement data, two main indicators were examined: fixation frequency (fixations/minute) and blink frequency (blinks/minute), which, according to previous research, are reliable indicators of mental strain [14]. An increase in fixation frequency generally indicates an increase in the amount of visual information to be processed, thus increasing attentional demand. In contrast, blink frequency typically decreases when the task becomes more cognitively demanding.
Post-test questionnaires captured subjective perceptions of stress and difficulty across intersections. The test environment and data collection tools were designed to minimize discomfort and bias, ensuring the ecological validity of the results. The data enabled structured analysis for targeted interventions and safety improvements.
3. Results
The locations were selected based on identified accident-prone zones within the tramway network. At both Döbrentei Square and the Halász Street intersection, road vehicles intersect the tram tracks at angles of approximately 45° and 90°. Traffic control at these sites is exclusively implemented through “Give Way” and “STOP” traffic signs. Additionally, a designated cycle crossing is located at Döbrentei Square, intersecting the tramway alignment orthogonally (90°). At the Halász Street intersection, two pedestrian crossings are present, where tram vehicles are legally required to yield to the pedestrians. The final location, referred to as the interlaced track (known as “Fonódó” in Hungarian) section, constitutes an alignment where the spacing between the tram tracks is less than the track gauge, thereby functionally classifying it as a single-track segment. From an operational safety perspective, this configuration presents an elevated collision risk due to the possibility of opposing tram movements. To mitigate such risks, railway signaling and interlocking systems are deployed. When a single red aspect is displayed on the signal, passing the signal is strictly prohibited in accordance with operational safety protocols.
This phase of the experiment was conducted with the participation of four individuals (A–D). All participants held valid tram driver certifications and had accumulated a minimum of two hours of prior operation within the simulator. Furthermore, each participant possessed comprehensive familiarity with the selected locations. Table 2, shown below, presents the participants’ demographic and experiential data.
Table 2.
Demographic and experiential data of the participants.
Based on the data obtained, Table 3 and Table 4 present the blink frequency (blinks/min) and fixation frequency (fixations/min) of four drivers (A–D) across six traffic locations. The data reveals marked individual differences and section-specific variations in visual behavior.
Table 3.
Blink frequency (blinks/min) for each driver (A to D) at different locations.
Table 4.
Fixation frequency (fixation/min) for each driver (A to D) at different locations.
In terms of blink frequency, Driver A consistently exhibited the highest mean value at 38.16 blinks/min, showing considerable variation between sections (SD = 9.51). Driver B, in contrast, had a significantly lower average of 11.95 blinks/min, which is 68.7% less than Driver A’s. Notably, Driver B showed an extremely low blink rate at Halász utca North (1.77 blinks/min), likely indicating intense visual focus or cognitive load. Driver C demonstrated the most consistent blinking pattern, with a low standard deviation of 3.99, suggesting stable visual demand across sections.
Section-wise, Halász utca South had the highest average blink rate (38.00 blinks/min), standing 51% above the overall section mean (25.15 blinks/min), while Halász utca North presented the greatest variability (SD = 17.68), indicating that driver responses to this location were the most inconsistent.
Regarding fixation frequency, Driver A again led with a mean of 176.23 fixations/min, which is 36.2% higher than the group average of 129.86 fix/min and suggests heightened attentional engagement. Driver C was once again the most stable across sections (SD = 8.36), and Driver B displayed a wide variation in fixations (SD = 23.38), especially peaking at Fonódó North (173.06 fix/min). Interestingly, Döbrentei tér South recorded the highest overall mean fixation rate at 152.07 fix/min, whereas Halász utca South showed the most uniform driver response (SD = 12.87).
Comparing blink and fixation patterns reveals that drivers with higher blink frequencies also tend to have higher fixation rates (e.g., Driver A). However, this is not universally true (e.g., Driver D). This interplay suggests complex underlying factors such as driver experience, environmental complexity, or fatigue levels affecting visual behavior.
To further analyze the relationship between blink and fixation frequency across different urban sections, a Linear Mixed-Effects Model was applied with blink rate as the dependent variable, fixation rate and location (section) as fixed effects, and driver identity as a random effect (Table 5). This approach accounts for repeated measurements within drivers and systematic variation due to environmental context.
Table 5.
Linear Mixed-Effects Model analysis results.
The model revealed that fixation rate was not a significant predictor of blink rate (p = 0.891), confirming previous findings from correlation analysis that these two eye metrics are largely independent in this context. This suggests that blink and fixation frequencies likely respond to different cognitive or perceptual demands and should be considered as complementary indicators in driver monitoring systems.
Among the sections, Halász utca North emerged as a statistically significant location, associated with a notably higher blink rate (β = +12.73 blinks/min, p = 0.004) compared to the baseline (Döbrentei tér North). This indicates a consistent increase in blinking among all drivers in that specific area, even after accounting for individual differences. One plausible explanation for this result is the presence of a large advertisement pillar positioned directly in the tram driver’s field of view at Halász utca North. This intrusive visual stimulus could act as a source of distraction, increasing blink frequency due to heightened visual processing demands, frequent shifts in focus, or cognitive disengagement triggered by cluttered visual scenes.
4. Discussion
This study aimed to objectively quantify cognitive load during tram driving using eye movement parameters, specifically blink and fixation frequency. Based on a simulator, the experimental design allowed for controlled repetition of traffic scenarios, ensuring comparability while maintaining ecological validity. Our findings emphasize how complex urban environments, particularly certain intersections, influence visual behavior and, consequently, the mental workload of tram drivers.
Notably, we observed an increased blink frequency at Halász utca North across all drivers, which was statistically significant even after accounting for individual differences. This suggests that this location imposes a unique visual or cognitive burden. Our observational analysis indicated that a large advertisement pillar obstructing the driver’s line of sight likely contributes to this burden. This intrusive element may disrupt visual continuity, increase the need for re-fixation, and lead to cognitive disengagement, consistent with previous studies linking visual clutter to blinking frequency [7]. Unlike most other locations, Halász utca North triggered a marked, shared physiological response among drivers, despite their diverse visual processing profiles. This underscores the value of eye-tracking metrics in assessing urban infrastructure.
Interestingly, the fixation rate did not statistically predict the blink rate (p = 0.891), highlighting the independence of these two metrics. This finding suggests that fixation frequency reflects task-driven attentional demand, whereas blinking is more sensitive to fluctuations in cognitive load and disengagement. This aligns with earlier research indicating that while fixations increase during visually demanding tasks, blink suppression is a more direct indicator of mental load [3,14].
The significant variability among drivers, especially noted in the random effects of the Linear Mixed-Effects Model, emphasizes the importance of individual differences in cognitive and visual processing. For instance, Driver B consistently exhibited lower blink and fixation frequencies, particularly at Halász utca North, which may indicate a heightened visual focus or a unique coping strategy under stress. These variations highlight the necessity for adaptive driver monitoring systems that consider baseline visual behaviors rather than relying solely on absolute thresholds.
These results suggest several actionable recommendations from a traffic safety and design perspective. First, locations with statistically high cognitive load indicators, such as Halász utca North, should be prioritized for visual decluttering or design interventions. Second, simulators combined with eye-tracking technology provide a cost-effective and scalable method for evaluating infrastructure before it is implemented in the real world. Finally, incorporating inter-individual baselines into future driver assistance systems could significantly enhance the detection of inattention or overload accuracy.
Despite their inherent limitations, this study also validates the use of simulator environments in workload research. Although simulated driving may reduce stress levels compared to real-world driving [12], our findings indicate that specific stimuli—especially unexpected events or visually demanding sections—still elicit meaningful physiological responses. Therefore, simulator studies remain a valuable tool for preliminary infrastructure assessments and the development of driver monitoring systems.
The study’s main limitation is the small sample size (n = 4), which may restrict the generalizability of our findings despite a repeated-measures design. While the simulated environment allows for control and standardization, it cannot fully capture the psychological demands of real-world driving. Future research should include larger, more diverse samples and compare simulator and field data to improve ecological validity. Additionally, incorporating metrics like saccade amplitude, pupil dilation, and head movement could provide a more thorough cognitive load assessment. Longitudinal studies on the effects of fatigue or experience over time could also offer valuable insights into how mental workload changes in dynamic situations.
5. Conclusions
This study confirms that fixation frequency and blink rate are effective, objective indicators of cognitive load in tram drivers. The combined use of these measures enables reliable identification of high-demand traffic segments and highlights inter-individual differences in visual behavior. These findings support integrating eye-tracking methods into driver assessment protocols and infrastructure evaluations to enhance safety and reduce cognitive strain in urban transport systems.
The primary objective of the research is the development of an innovative measurement system that can be utilized for conducting traffic safety studies related to tramway operations. The proposed system is designed to be applicable not only to the Budapest tram network but also to tramway infrastructures in other urban environments.
In addition, particular emphasis is placed on identifying and addressing the issues revealed during the measurements and throughout the research process, with the aim of providing solutions that are also advantageous for the public transport operator. However, in order to draw further conclusions, additional measurements are required, the planning and execution of which are currently in progress.
Author Contributions
Conceptualization, M.N., A.F.B. and V.N.; methodology, M.N.; software, M.N.; validation, M.N., A.F.B. and V.N.; formal analysis, M.N. and V.N.; investigation, M.N.; resources, M.N., and V.N.; data curation, A.F.B.; writing—original draft preparation, M.N., A.F.B. and V.N.; writing—review and editing, M.N., A.F.B. and V.N.; visualization, M.N. and V.N.; supervision, M.N. and V.N.; project administration, V.N.; funding acquisition, V.N. All authors have read and agreed to the published version of the manuscript.
Funding
This research received no external funding.
Institutional Review Board Statement
Not applicable.
Informed Consent Statement
Informed consent was obtained from all subjects involved in the study.
Data Availability Statement
Data are contained within the article.
Acknowledgments
The research was supported by the European Union within the framework of the National Laboratory for Artificial Intelligence. (RRF-2.3.1-21-2022-00004).
Conflicts of Interest
The authors declare no conflicts of interest. Attila Ferenc Bagosi was employed by the company Budapest Transport Privately Held Corporation (BKV) and declare that the research was conducted in the absence of any commercial or financial relationships that could be construed as a potential conflict of interest.
References
- Naweed, A.; Rose, J. “It’s a Frightful Scenario”: A Study of Tram Collisions on a Mixed-Traffic Environment in an Australian Metropolitan Setting. Procedia Manuf. 2015, 3, 2706–2713. [Google Scholar] [CrossRef]
- Raza, M.; Muslam, M.M.A.; Murtaza, M.; Cheng, C.-T.; Albahlal, B.M. Driving Through the Mind: Investigating Driver Cognitive Impairment with Physiological Measures of Mental Workload. School of Computing Technologies, STEM College, RMIT University, Melbourne, Victoria, Australia. 2024; Preprints. [Google Scholar]
- Abbas-Zadeh, M.; Hossein-Zadeh, G.A.; Vaziri-Pashkam, M. Dual-Task Interference in a Simulated Driving Environment: Serial or Parallel Processing? Front. Psychol. 2021, 11, 579876. [Google Scholar] [CrossRef] [PubMed]
- Juhász, A.; Molnár, M.S. A Gépjárművezetés Közbeni Mobiltelefonhasználat Hatása a Figyelemre. Belügyi Szle. 2022, 70, 1177–1192. [Google Scholar] [CrossRef]
- Matias, J.; Belletier, C.; Izaute, M.; Lutz, M.; Silvert, L. The Role of Perceptual and Cognitive Load on Inattentional Blindness: A Systematic Review and Three Meta-Analyses. Q. J. Exp. Psychol. 2022, 75, 1844–1875. [Google Scholar] [CrossRef] [PubMed]
- Tang, M.F.; Ford, L.; Arabzadeh, E.; Enns, J.T.; Visser, T.A.W.; Mattingley, J.B. Neural Dynamics of the Attentional Blink Revealed by Encoding Orientation Selectivity during Rapid Visual Presentation. Nat. Commun. 2020, 11, 434. [Google Scholar] [CrossRef] [PubMed]
- Amir, N.; Tishby, N.; Nelken, I. A Simple Model of the Attentional Blink and Its Modulation by Mental Training. PLoS Comput. Biol. 2022, 18, e1010398. [Google Scholar] [CrossRef] [PubMed]
- Tzouras, P.G.; Farah, H.; Papadimitriou, E.; van Oort, N.; Hagenzieker, M. Tram Drivers’ Perceived Safety and Driving Stress Evaluation. A Stated Preference Experiment. Transp. Res. Interdiscip. Perspect. 2020, 7, 100205. [Google Scholar] [CrossRef]
- Naznin, F.; Currie, G.; Logan, D. Key Challenges in Tram/Streetcar Driving from the Tram Driver’s Perspective—A Qualitative Study. Transp. Res. Part F Traffic Psychol. Behav. 2017, 49, 39–48. [Google Scholar] [CrossRef]
- George, T.K.; Gadhia, H.M.; Sukumar, R. Sensing discomfort of standing passengers in public rail transportation systems using a smart phone. In Proceedings of the 2013 10th IEEE International Conference on Control and Automation (ICCA), Hangzhou, China, 12 June 2013; pp. 1509–1513. [Google Scholar]
- Szőnyi, L. Budapest Transport Privately Held Corporation, Internal Statistics. Budapest Transport Privately Held Corporation (BKV). 2024; Unpublished work. [Google Scholar]
- Ekanayake, H.B.; Backlund, P.; Ziemke, T.; Ramberg, R.; Hewagamage, K.P.; Lebram, M. Comparing Expert Driving Behavior in Real World and Simulator Contexts. Int. J. Comput. Games Technol. 2013, 2013, 891431. [Google Scholar] [CrossRef]
- Dierkes, K.; Pfeffer, T. Neon Pupillometry Test Report-An Evaluation of Neon’s Pupillometry Feature. Pupil Labs 2024, 1–17. [Google Scholar] [CrossRef]
- Nagy, V.; Kovács, G. Multidimensional Bus Driver Behaviour Study—Pilot. In Mobilitás és Környezet: Jövőformáló Járműipari Kutatások Konferenciakiadvány; Szauter, F., Pup, D., Csikor, D., Földesi, R., Nagy, B.M., Eds.; 2023; pp. 88–103. Available online: https://jkk-web.sze.hu/wp-content/uploads/2023/10/2023-oszi-konferencia-tanulmanykotet_ARNL.pdf (accessed on 30 July 2025).

Disclaimer/Publisher’s Note: The statements, opinions and data contained in all publications are solely those of the individual author(s) and contributor(s) and not of MDPI and/or the editor(s). MDPI and/or the editor(s) disclaim responsibility for any injury to people or property resulting from any ideas, methods, instructions or products referred to in the content. |
© 2025 by the authors. Licensee MDPI, Basel, Switzerland. This article is an open access article distributed under the terms and conditions of the Creative Commons Attribution (CC BY) license (https://creativecommons.org/licenses/by/4.0/).