Abstract
Traffic safety continues to be a pressing worldwide issue, with young drivers especially exposed to accidents because of limited experience, reckless behaviors, and risky practices such as driving under the influence of alcohol or other substances. In this scenario, reliable methods to evaluate psychomotor and sensory abilities essential for safe driving are highly needed. This study presents the development of a Virtual Reality (VR) prototype aimed at enhancing psychometric testing. The platform incorporates immersive environments to assess peripheral vision, reaction time, and motor accuracy, implemented with Oculus Quest 2, Blender, and Unity. The VR-based system was validated through black-box testing and user satisfaction surveys with a sample of 80 licensed drivers in single-session evaluations. The findings demonstrate that VR increases both precision and realism in psychomotor evaluations: 81.25% of participants perceived the scenarios as realistic, and 85% agreed that the system effectively measured critical driving skills. While a few users experienced minor discomfort, 97.5% recommended its application in practical assessments. This study highlights VR as a robust alternative to conventional psychometric/psychotechnical tests, capable of improving measurement reliability and user engagement and paving the way for more efficient and inclusive driver training initiatives.
1. Introduction
Road safety represents one of the main challenges at a global level due to the high incidence of traffic accidents with fatal or disabling consequences. Among the many factors that influence this problem, drivers’ behavior is positioned as a determining component. Young drivers, during their first months of independent driving experience, are more likely to be involved in serious road accidents [1,2]. This age group manifests risky behaviors such as speeding, driving under the influence of alcohol, failure to use a seat belt, reckless maneuvers such as constant lane change, driving at a short distance from other vehicles, and the improper use of mobile devices while driving [3,4,5,6].
The perception of road safety also varies depending on age and driving experience. Young drivers generally have a more superficial and less favorable assessment of road rules and good practices [1,2,3,4,5]. Although many claim to be sufficiently familiar with traffic regulations, they perceive that police surveillance prioritizes strategic location for the punishment of offenders, rather than prevention in critical areas [7]. Likewise, aggressive driving occurs more frequently in this population segment, significantly increasing the risk of accidents [5,8,9]. Against this backdrop, it is essential to promote educational and awareness-raising strategies aimed at modifying risky behaviors and strengthening a preventive road culture. Information campaigns and the application of rigorous regulations have proven to have a positive impact on the transformation of perceptions and attitudes towards driving [9,10]. In addition, the use of predictive models based on the analysis of past behaviors—such as infractions and driving errors—makes it possible to anticipate possible incidents and apply preventive interventions [11,12]. In this line, the development of intelligent technologies, such as vehicle sensors and machine learning algorithms, have enhanced the ability to identify unsafe patterns and emit immediate feedback, optimizing the driver’s response [11,12].
VR has established itself as an innovative tool of great value in the field of road safety education. This technology makes it possible to generate immersive simulated environments that replicate complex traffic scenarios, facilitating the practice of critical skills without exposing users to real risks [13,14,15]. VR makes it possible to recreate challenging situations—such as driving in adverse weather conditions or crossing congested avenues—by providing a safe space for learning and decision-making [16,17,18]. In addition, it incorporates real-time evaluation mechanisms and immediate feedback, favoring the process of correcting errors and strengthening competencies [19]. Educational institutions have implemented VR programs to teach children how to cross the street safely, while driving schools have adopted this technology to train new drivers in various conditions, strengthening their practical preparation [20,21]. VR simulations have been shown to reflect behaviors consistent with those observed in real life, validating their use as a reliable educational medium [22].
At the same time, psychometric tests have emerged as key tools for the assessment of sensory, motor, cognitive and psychological abilities necessary for safe driving [23]. Countries such as Poland have implemented these assessments for decades with the aim of diagnosing the driver’s fundamental competencies [24]. In the Ecuadorian context, the Organic Law on Land Traffic and Road Safety (Art. 94) establishes that the application of such tests is mandatory for obtaining or renewing licenses [25]. These assessments include computerized batteries that measure aspects such as visoperception, visual-motor coordination, complex attention, decision-making, impulse control, and planning, among others [26]. Its construct validity and consistency have been proven, showing significant correlations with drivers’ performance in real environments [27,28]. Likewise, tools such as the SimFit2Drive simulator have proven to be useful for detecting cognitive impairments, with moderate correlations with respect to standard neuropsychological metrics [29]. Although tests such as the Lane Change Task (LCT) did not show significant effects on cognition when evaluating electric vehicle drivers, they did show alterations in brain activity patterns recorded by EEG, indicating that subtle neurophysiological changes can occur even when behavioral performance appears unaffected [30,31].
Regarding neuropsychological assessment, instruments such as the Mini-Mental State Examination (MMSE) and Addenbrooke’s Cognitive Examination Revised (ACE-R) have been used to identify unsafe drivers, especially among older adults, with the ACE-R being more accurate in detecting relevant impairments [32]. Cognitive processing speed, sustained attention, and psychomotor functioning are domains that have shown strong association with performance in driving simulators [33,34]. Traditional methods based on flat screens and two-dimensional environments have limitations, particularly in the assessment of essential skills such as peripheral vision. This ability is crucial to perceive stimuli outside the central field and react appropriately to unforeseen elements of the road environment [35,36]. The incorporation of immersive technologies such as VR in psychometric tests could represent a significant evolution in the more accurate and realistic measurement of these competencies [37].
VR is a technology that offers an immersive experience that transforms the user’s perception by mixing visual, auditory, and tactile sensations in an interactive environment. This technology not only simulates visual and auditory information but also delivers tactile feedback, thereby creating interactive experiences that greatly enhance user engagement with the virtual environment [38,39,40]. Moreover, VR has already been integrated into neuropsychological assessments, standing out in psychometric tests. Tools such as the VR Everyday Assessment Lab (VR-EAL) have proven effective in assessing cognitive functions in realistic settings, meeting the criteria of the American Academy of Clinical Neuropsychology and the National Academy of Neuropsychology [41].
Recent research has reinforced the potential of immersive technologies in the context of driver assessment and training. For example, a proof-of-concept study employing a VR driving test with patients diagnosed with cirrhosis demonstrated that reaction times to hazardous events in immersive simulations were significantly associated with real-world accident history, supporting the use of VR as a feasible screening tool in sensitive populations [42]. Similarly, VR-based interventions targeting young drivers have shown reductions in risky driving behaviors, with participants exposed to immersive simulations demonstrating improved hazard perception and decision-making compared to traditional training methods [43].
Other contributions have examined VR as a means to reproduce real-life stressors or environmental complexities that affect driving performance. For instance, studies have indicated that VR simulations can effectively capture cognitive and behavioral changes that traditional psychometric instruments might overlook, particularly in relation to attention and executive function [44]. More recently, research has emphasized the integration of complex sensory cues, scenario variability, and ecological validity into VR-based driver assessment systems, with encouraging results in terms of predictive value for real-world performance [10]. Additional evidence includes recent validation studies of computerized driving simulator tests [45], the effectiveness of simulator-based evaluations [46], and research incorporating wearable sensors into VR environments to capture both behavioral and physiological responses [47]. Clinical investigations have also demonstrated how age and health-related factors influence simulator performance [48], while technical analyses highlight the importance of simulator size and fidelity in accurately replicating real-world driving conditions [49,50].
Nevertheless, despite the progress achieved, current VR platforms often remain limited in scope. Some systems employ simplified or narrowly focused tasks that do not cover the full range of psychometric constructs required in licensing contexts. Moreover, issues such as motion sickness, field-of-view restrictions, and a lack of validation against standardized psychometric benchmarks have been reported as persistent challenges [51]. Even when advanced VR technologies are incorporated, validation is frequently carried out with small or homogeneous samples, reducing the generalizability of the findings [52].
Taken together, these studies highlight both the promise and the persistent limitations of current VR-based approaches to driver assessment. A critical gap in the literature is the lack of a comprehensive and validated framework that not only replicates the psychometric rigor of conventional tests but also extends them through immersive, multisensory simulations. Addressing this gap requires platforms capable of simultaneously assessing peripheral vision, rapid responses to multimodal stimuli, fine visuomotor coordination, and decision-making under time constraints, all within ecologically valid virtual environments. The present study was specifically designed to address this gap by developing a VR-based psychometric that integrates three complementary tasks—peripheral vision, reaction time, and precision control—each assessing a distinct but interrelated component of driving aptitude. The peripheral vision task evaluates the ability to detect peripheral stimuli under simulated driving conditions; the reaction time task measures the speed and accuracy of responses to visual and auditory cues; and the precision task assesses fine visuomotor coordination through controlled object manipulation. Combined, these modules provide a comprehensive framework for evaluating the sensory-motor and cognitive skills essential for safe driving. The VR-based psychometric was validated through black-box testing and user satisfaction surveys, demonstrating both technical reliability and strong user acceptance. Overall, the findings confirm the system’s accuracy, usability, and potential to enhance the realism, engagement, and inclusivity of psychometric driver evaluations.
2. Materials and Methods
2.1. Background on Licensing Tests
Currently, there are several tests that are developed for people to obtain a driver’s license; among these are the theoretical test on knowledge of traffic laws and the psychometric evaluation that allows for the evaluation of the reaction capacity of drivers when subjected to audiovisual stimuli [53,54,55]. Therefore, the present study has been developed using a combination of advanced technologies to create a psychometric test based on VR. For the implementation of this system, devices and tools were selected that allowed for the creation of an immersive and controlled environment, suitable for evaluating different psychomotor and sensory skills of users.
2.2. Hardware and Devices
The main hardware used for the execution of the tests was Oculus Quest 2 (Meta Platforms, Inc., Menlo Park, CA, USA), a standalone VR headset that does not require a PC or console for its operation. This device was chosen due to its versatility and ease of use, allowing users to interact seamlessly with the virtual environment without the need for additional equipment. In addition, additional peripherals were integrated, such as Oculus controllers (Meta Platforms, Inc., Menlo Park, CA, USA), which facilitated the interaction of participants with the virtual environment, allowing psychomotor reactions and movements to be accurately measured. The controllers also provided tactile feedback through vibration, enhancing user immersion and supporting stimulus–response measurement.
2.3. Software and Development Environment
For the creation of the scenarios and objects within the VR environment, Blender 3.6 (Blender Foundation, Amsterdam, The Netherlands) was used, an open-source 3D modeling software that allowed for the design and animation of the interactive objects within the test environments. Specifically, Blender was employed to design and animate the interactive elements used in the psychometric tests, including peripheral targets, pedestrian figures appearing in the field of view, and the manipulable object used in the precision test.
Unity Engine 2022.3 LTS (Unity Technologies, San Francisco, CA, USA) was the primary development engine used to create the interactive virtual environment, designed with a modular architecture where each test was implemented as an independent module connected to a central controller. This structure provided flexibility, scalability, and the possibility of incorporating new tasks in future iterations. Unity made it possible to integrate all the visual and logical elements of the system, from the programming of the interaction to the visual representation of objects. In addition, the Fantastic City Generator plugin (Velasco Technologies, Madrid, Spain) was incorporated to facilitate the automatic creation of realistic urban environments, generating streets, buildings and other key elements of the city, necessary to recreate realistic driving situations. Here, Fantastic City Generator plugin was used to automatically generate the general urban setting—streets, buildings, and static environmental elements—while the Blender-designed models provided dynamic and task-specific components. These scenarios were fundamental to simulating the peripheral vision, reaction and accuracy tests that make up psychometric evaluations. In the current implementation, non-player characters (NPCs) were included as simple placeholders to simulate basic traffic agents. This approach allowed for efficient prototyping but may have reduced the visual realism of the environment, for this reason, future developments will incorporate more realistic assets, including photogrammetry-based resources.
2.4. Scoring Method
The scoring method was based on measurable performance indicators, such as reaction time, accuracy of responses to stimuli, error rates, and task completion. These results were categorized into performance levels (adequate, below average, deficient) according to predefined thresholds, following conventions of psychometric standards in driver licensing assessments. The predefined thresholds used to categorize performance levels were adapted from reference ranges reported in standardized psychotechnical driver assessment studies [26,27,45], which define normative values for reaction time, error rates, and precision tasks in driving-related psychomotor evaluations.
2.5. Test Design and Implementation
The design of the psychometric tests was carried out through an incremental and iterative methodology, structured in three phases: (i) Scenario design, where the visual and interactive elements of each test were created to ensure alignment with the cognitive and motor skills to be evaluated; (ii) Black-box testing, where each scenario was examined from the user’s perspective in order to detect technical errors, inconsistencies in task execution, and usability issues; and (iii) User testing, where participants interacted directly with the VR-based system, providing experiential feedback on clarity, realism, and comfort. In total, 80 participants were involved in these for all psychometric tests. Participants were recruited from the community of the Universidad Técnica de Manabí (Ecuador), based on the criterion of holding a valid driver’s license, with no financial or academic incentives offered. In addition to descriptive statistics, inferential analyses were conducted to explore potential differences across demographic groups. Specifically, one-way ANOVAs were performed by gender and by age group (20–29, 30–39, ≥40) for each of the survey items. This approach allowed us to assess whether participants’ perceptions of realism, ease of use, accuracy, usability, and physical discomfort differed systematically between demographic categories. This iterative process ensured progressive improvements in terms of technical reliability, measurement validity, and fidelity, as general VR development guidelines, thus consolidating a robust foundation for the use of VR in psychometric driver evaluations.
The peripheral vision test was developed, in which participants were required to identify objects that appeared in their peripheral field of vision within the simulated driving environment (Figure 1). In this environment, the user is faced with a simulation of a street in the city, where they must keep their gaze straight ahead while reacting to the appearance of a 3D model of a girl appearing in the peripheral vision range, i.e., outside the foveal vision range. On the one hand, in the peripheral vision test, participants indicated detection of the appearing object by pressing the main trigger on the right controller as soon as the peripheral target appeared. Reaction times were automatically recorded by the system. On the other hand, in the reaction test, participants responded to the visual or auditory stimuli—such as traffic light changes or siren sounds—by pressing the corresponding controller trigger, allowing the software to register the latency and accuracy of each response.
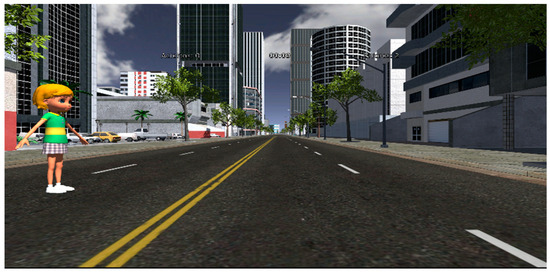
Figure 1.
Design for peripheral vision testing.
For the reaction test, users had to respond to a variety of visual stimuli, such as traffic lights that changed color, ambulances and sounds, measuring the speed and accuracy of their responses (Figure 2); this test is similar to conventional ones in which pedals are used, but for practical contexts only the controls of the Oculus Quest 2 are used.
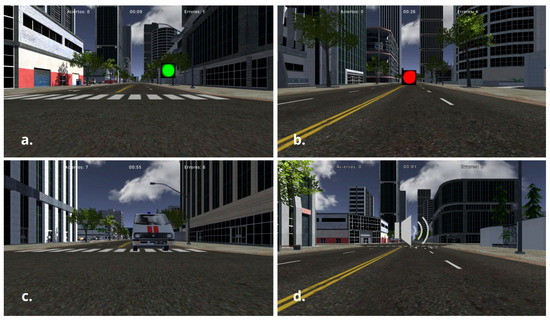
Figure 2.
Design for reaction testing: (a) traffic light turns green indicating permission to drive; (b) traffic light turns red requiring the participant to stop; (c) vehicle moving forward during the test; (d) visual indicator showing the detection of a stimulus.
The accuracy test consisted of a virtual maze in which participants had to move an object without colliding with the walls, evaluating its ability to control and handle in a virtual environment (Figure 3). In case of touching the wall, it was necessary to restart the route until the route was completed without errors. In the precision test, the participants viewed the maze from a first-person perspective, allowing them to perceive depth and spatial relationships naturally within the immersive environment. The movable object, a virtual sphere with a diameter of approximately 15 cm, was scaled to occupy about one-third of the corridor width, maintaining a narrow clearance between the sphere and the maze walls to demand precise motor control.
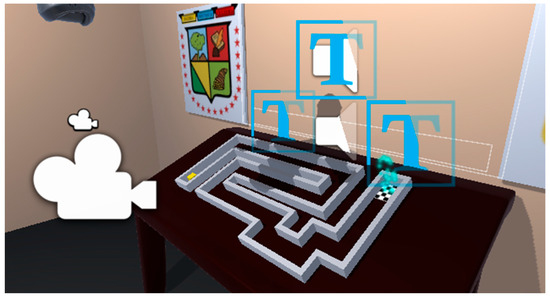
Figure 3.
Design for accuracy testing.
2.6. Validation and Data Collection
The tests were subjected to a user acceptance process, where participants interacted with the system and provided feedback on the experience. This feedback was essential to fine-tune the interface and interaction logic, improving the accuracy and usability of the platform. To validate the functionality of the system, black-box tests were performed. In each module, predefined inputs were used to check whether the system generated the expected behaviors, such as registering responses within the allowed reaction time, counting errors accurately, or restarting tasks when collisions occurred. These validation steps ensured that the system functioned according to its intended design without requiring access to internal code. Data collection involved recording the errors made by participants during the tests, which were then analyzed to evaluate the effectiveness of the system in measuring psychomotor and sensory skills. After the implementation of the VR system, empirical results were derived from black-box tests, specific functional tests (peripheral vision, reaction, and accuracy), and user acceptance surveys, thus validating both the performance of the developed VR and its perception by the evaluated participants.
2.7. Rationale for Test Selection and Relation to Driving Performance
The selection of the three psychomotor test items—peripheral vision, reaction time, and precision—was based on their established relevance to driver safety and their frequent inclusion in standardized psychotechnical evaluations. Peripheral vision has been consistently associated with hazard detection and situational awareness in real traffic environments, where deficits can increase accident risk due to delayed responses to lateral stimuli [26,33,35]. Reaction time, on the other hand, is one of the most widely studied predictors of accident involvement, as slower or inconsistent responses to visual or auditory cues can critically impair a driver’s ability to avoid collisions [27,28,34]. Precision tasks, requiring fine visuomotor coordination, reflect the capacity to control steering and vehicle positioning in constrained or dynamic environments, which have been linked to driving aptitude and reduced error rates in simulator-based assessments [29,32,45].
Recent research further reinforces the connection between these psychomotor domains and real-world driving performance. Validation studies of computerized driving simulator tests have demonstrated that peripheral vision and reaction assessments can reliably predict on-road performance and driving fitness across different populations [45,46,53]. Similarly, precision-based tasks have been highlighted as robust indicators of visuomotor control, a fundamental requirement for safe lane-keeping and maneuvering in complex scenarios [24,29,54]. Moreover, VR-based investigations have shown that immersive environments enhance the ecological validity of these measures by replicating multi-sensory conditions that closely resemble actual traffic situations [41,47,49].
The inclusion of these three test items in the present VR reflects both theoretical and empirical evidence linking them to essential driving skills. By integrating them into an immersive VR platform, the study seeks to replicate the psychometric rigor of conventional evaluations and capture behavioral nuances that are often missed in non-immersive contexts, thereby strengthening the correlation between test results and actual driving performance.
3. Results
A total of 80 participants with complete records were included in the study. The sample consisted of teachers (35%) and students (65%), all of whom held a valid driver’s license, which enabled comparisons between real-world driving experience and simulator-based assessments. Regarding gender distribution, 64% were male and 36% female. In terms of age, the largest group corresponded to participants aged 20–29 years (66.3%), followed by those aged 30–39 years (13.8%), and participants aged 40 years or older (20%).
3.1. Functional Assessment Using Black-Box Testing
The most relevant test results for each criterion are highlighted in Table 1. Thus, in the peripheral vision test, users obtained an average of 35.96 correct answers, with a range of 14 to 40 correct answers, and a standard deviation of 5.22, which indicates moderate variability in the performance of the participants. The average number of errors was 4.03, with a range of 0 to 14, and a standard deviation of 5.22, suggesting that some users had notable difficulties, while others did not make errors. The average time required to complete this test was 1 min and 6 s, with a range between 57 s and 1 min and 16 s, and a low standard deviation (0.0033), reflecting a consistent temporal execution among participants.

Table 1.
Results of psychometric VR tests (median and standard deviation for hits, errors, and completion time). Units: Hits and Errors (n); Time (min:s).
In the reaction test, the average number of correct answers was 34.74 (range: 17–40), with a standard deviation of 4.68, which indicates an acceptable level of general accuracy with slight dispersion. The errors averaged 5.26, with values between 0 and 23, and a standard deviation of 4.68, evidencing greater difficulty compared to the peripheral vision test. The mean execution time was 1 min and 17 s, ranging from 1:09 to 1:39, with a standard deviation of 0.0043, again showing consistency in the time invested, although slightly higher than in the previous test, possibly due to the greater visual and auditory complexity.
In the accuracy test, no quantifiable hits were recorded due to the nature of the activity (controlling an object within a maze without collisions). The average number of errors was 1.67 with a range of 0 to 20, and a standard deviation of 2.96, evidencing a lower number of general failures but with wide individual variability. The average time to complete this activity was 47 s, with a range of 19 s to 1 min and 39 s, and a standard deviation of 0.0043, which demonstrates a greater variability in temporal performance, probably influenced by fine motor skills and mastery of the virtual environment.
3.2. Usability Testing
After carrying out the tests with the users, a survey was carried out to determine the functionality and the level of satisfaction with the virtual environment. In the following subsections, the questions included in the user acceptance survey and the corresponding statistical results are presented in detail. To provide an overview, Figure 4 illustrates the general scheme of the results, highlighting the distribution of responses across the main evaluation dimensions. This figure serves as a visual summary that complements the descriptive statistics and helps contextualize the trends identified in the survey data.
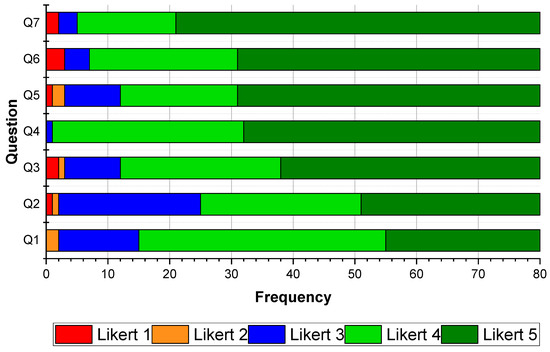
Figure 4.
Frequency distribution of participant responses to the user acceptance survey, measured on a five-point Likert scale.
3.2.1. Q1. Realism of Virtual Scenarios
The result indicates that participants rated with an average of 4.10 out of 5, suggesting that the virtual scenarios were perceived as quite realistic, although there is a small variability, reflected in the moderate standard deviation of 0.756. The mean is close to value 4, indicating a positive trend, but with some slightly less positive responses.
3.2.2. Q2. Ease of Use of the VR System
Participants rated the system’s user-friendliness with an average of 4.01, reflecting good acceptance in terms of user-friendliness. However, the standard deviation (0.907) is relatively high, suggesting that some participants might have found it more complicated to use the system. Despite this, the trend is 5, indicating that many users found the system easy to use.
3.2.3. Q3. Accuracy in the Capture of Psychosensory and Sensometric Skills
The meaning of 4.31 indicates that most participants felt that the VR accurately captures their psychomotor and sensometric skills. However, the standard deviation of 0.908 reveals a moderate dispersion in responses. The mode and media are 5, suggesting that a significant number of participants rated the accuracy as excellent.
3.2.4. Q4. Recommendation for the Use of VR for Testing
Participants showed a strong inclination towards recommending the use of VR, with an average of 4.59, reflecting a positive perception of VR compared to current tests. The low standard deviation (0.520) indicates high consistency in responses, and most participants (mode of 5) would recommend the use of VR.
3.2.5. Q5. Physical Discomfort or Eye Fatigue During Use
Although most participants did not experience physical discomfort or eye fatigue (with a mean of 4.41), the relatively high standard deviation (0.882) suggests that some did report discomfort when wearing the VR glasses. The media and mode at 5 reflect that a significant portion of the participants experienced no problems.
3.2.6. Q6. Adequate Duration of Tests
The duration of the tests was perceived as adequate by the participants (meaning 4.45), with a high tendency to consider that the time was sufficient (mode of 5). The standard deviation (0.899) suggests that although most agreed, there were some participants with differing opinions about duration.
3.2.7. Q7. Clarity of Test Indications
Finally, the clarity of the indications was rated very positively, with an average of 4.63, indicating that most participants easily understood what they should do during the tests. The low standard deviation (0.786) reflects little variability in responses, with a high level of satisfaction (mode of 5).
4. Discussion
4.1. General Findings and Realism of Scenarios
The results obtained in the implementation and evaluation of the VR simulator for psychometric tests confirm its potential as an effective immersive tool for the measurement of psychomotor and sensory skills relevant to driving. This finding is consistent with previous research [1,2,3], which emphasizes that appropriately designed VR environments can provide reliable and standardized conditions for assessment. Such environments ensure accuracy, controlled experimental settings, and objective measurement of sensory and motor responses, thereby supporting their suitability for applications in driver evaluation and related domains.
Regarding the realism of the scenarios, 81.25% of the participants rated virtual environments as realistic, a perception that reinforces the empirical evidence on the potential of VR to generate immersive, multisensory and motivating experiences. The present result converges with previous studies that have underscored the importance of realism and meaningful interaction in enhancing user engagement and strengthening the ecological validity of virtual assessments [14,38]. This effect was particularly evident in the peripheral vision test, in which participants achieved an average of 35.96 correct responses out of 40, accompanied by low variability in reaction times. There are consistent with earlier evidence indicating that responses to critical stimuli in the peripheral visual field are determined not solely by visual angle, but also by the efficiency of cognitive processing mechanisms involved in the detection and interpretation of such stimuli [34].
4.2. Psychomotor Test Performance
On the one hand, the reaction test yielded satisfactory performance outcomes, although with greater variability in error rates (range: 0–23), which underscores the inherent complexity of assessing behavior in dynamic and multisensory contexts. These findings are consistent with prior evidence demonstrating that both the modality of the stimulus and its associated cognitive load exert differentiated effects on rapid response tasks [28]. In the present VR, the integration of auditory stimuli contributed to a more comprehensive assessment framework, aligning with recommendations that highlight the importance of incorporating multiple sensory channels to enhance the validity and ecological fidelity of advanced simulation environments [37].
On the other hand, the precision test, although not reporting quantifiable correct responses under the same criteria as the previous tests, showed a low average error rate (1.67), indicating a high level of control by participants when faced with tasks requiring fine visuomotor coordination. This outcome is consistent with previous research suggesting that simulated tasks in VR can serve as reliable predictors of driving aptitude, particularly when they are designed to capture specific motor skills [27].
4.3. Usability, Acceptance, and Demographic Analyses
With respect to usability and user experience, the system achieved a high level of overall acceptance. Specifically, 93.75% of participants reported that the instructions were clear, and 91.25% positively evaluated the duration of the tests. Nevertheless, 15% of users experienced physical discomfort, and 31.25% did not perceive the system as easy to use. Although these proportions represent a minority, they identify important areas for improvement that should be addressed to further optimize the user experience. Such feedback is particularly valuable for maintaining a user-centered design approach, as emphasized in prior research on participatory design and iterative validation of VR-based educational simulators [14,21].
A large majority of participants (85%) reported that the VR accurately captured their sensory and psychomotor skills, thereby supporting its potential validity as an evaluation instrument. This perception was further reinforced by the fact that 97.5% of users indicated that they would recommend the implementation of such technology in real evaluation contexts, emphasizing both its accuracy and the high level of engagement it fostered during the experience. Here, serious games developed in VR not only allow for practical evaluation but also generate a more engaging and formative experience than traditional methods [16].
To complement the descriptive analysis, inferential statistics were conducted to examine potential gender-related differences in participants’ responses. Table 2 presents the results of the one-way ANOVA performed on all survey items (Q1–Q7).
Table 2.
Results of ANOVA by gender for each survey item.
The results indicate that male and female participants did not differ significantly in their evaluation of the VR psychometric test system. Both groups reported similar perceptions of realism, ease of use, accuracy of skill capture, and clarity of instructions. However, a notable exception emerged in Q5 (physical discomfort and eye strain), where female participants reported significantly higher levels of discomfort compared to males (F = 6.19, p = 0.015). Such insights highlight the importance of addressing ergonomic and usability aspects in the design of VR-based assessment systems to ensure inclusivity and user comfort across different demographic groups.
To further explore demographic influences, one-way ANOVAs were carried out across three age categories (20–29, 30–39, ≥40) for all survey items (Q1–Q7). The outcomes of these analyses, including F statistics and p-values, are presented in Table 3.
Table 3.
Results of ANOVA by age for each survey item.
The results indicate that there were no statistically significant age-related differences across most items (all p ≥ 0.05), suggesting that perceptions of realism, ease of use, clarity of instructions, and overall acceptance of the VR system were broadly consistent among participants aged 20–29, 30–39, and ≥40. Nonetheless, marginal trends were observed in two areas: older groups reported slightly lower ease of use (Q2) and somewhat higher levels of physical discomfort (Q5). These patterns align with prior evidence that cybersickness susceptibility and ergonomic sensitivity may increase with age in immersive environments. Taken together, these findings complement the gender-based analysis (Table 2), reinforcing that acceptance and perceived validity of the VR-based psychometric assessment are robust across demographic strata, while highlighting physical discomfort as the most sensitive dimension requiring targeted ergonomic refinements and onboarding strategies.
4.4. Comparison with Conventional Tools and Educational Value
Compared to conventional psychometric tools, such as flat-screen evaluations or mechanical devices (pedals, wheels), VR-based simulators provide a more comprehensive framework for assessing driver performance. Traditional tests often fail to capture complex variables such as peripheral vision, multisensory integration, or real-time visuomotor coordination, which are essential for safe driving [10,11]. Recent studies have emphasized the importance of multimodal data sources and adaptive evaluations, showing that advanced computational approaches and in-vehicle sensors can identify subtle behavioral deviations and risky patterns that remain undetected in traditional settings [12,48]. Similarly, high-fidelity VR environments mitigate the limitations of non-immersive tools by enabling the detection of both situational errors and cognitive overload, an aspect highlighted by works investigating simulator fidelity and user performance [50,51]. These findings reinforce the argument that VR provides superior ecological validity, offering more accurate and context-sensitive psychometric assessment methods.
In addition to improving the quality of psychotechnical evaluation, VR contributes significantly to road safety education and behavioral training. Serious games and immersive simulators have been shown to enhance engagement and learning outcomes, providing more effective skill acquisition than conventional didactic methods [13,14,15,16,17,18,19,23]. This educational value is complemented by their psychometric rigor: validation studies have demonstrated that VR-based simulators can reliably predict fitness to drive, particularly when focusing on sensory-motor and cognitive variables [46,47]. Moreover, research has underlined that simulator realism directly affects driver perception, performance, and acceptance, confirming that high-quality VR scenarios are not only feasible but preferable in both training and evaluation contexts [49,50]. Thus, VR emerges as a dual-purpose tool, bridging the gap between assessment and education, and surpassing the diagnostic and formative capacities of traditional psychometric approaches.
4.5. Heterogeneity in User Experience and Limitations
An additional aspect that warrants consideration is the heterogeneity observed in user experience. While the overall acceptance was high, a subset of participants reported physical discomfort (15%) and difficulties in perceiving the system as easy to use (31.25%). These differences can be attributed to several factors: (i) susceptibility to cybersickness, which has been identified as a common limitation in immersive VR systems [52]; (ii) variability in prior experience with VR technologies, as novice users tend to report higher cognitive load and fatigue [41]; (iii) demographic characteristics such as age, which have been shown to modulate tolerance to immersive simulations [34]; and (iv) ergonomic aspects of head-mounted displays, including weight distribution and field-of-view restrictions, which may impact comfort during prolonged use [51]. Future developments should, therefore, prioritize minimizing discomfort through adaptive calibration strategies, ergonomic improvements, and gradual familiarization protocols for less experienced participants.
Several limitations of this study should be acknowledged. First, the current VR-based system relied exclusively on the Oculus Quest 2 controllers, which provided vibration-based haptic feedback but did not reproduce the full tactile spectrum typically associated with driving hardware such as pedals or steering wheels. Second, although the sample of 80 participants enabled an initial assessment of feasibility, its relative homogeneity in terms of academic background may constrain the generalizability of the findings. Third, the virtual environments were generated using procedural design tools, which facilitated rapid prototyping but limited ecological realism; subsequent iterations will incorporate photogrammetry-based assets to enhance immersion and fidelity. Finally, while validation relied on black-box testing and user acceptance surveys, further benchmarking against standardized psychometric protocols will be necessary to consolidate the validity of the proposed framework. Taken together, these limitations suggest avenues for future research and refinement, particularly regarding realism, validity, and the broader applicability of VR-based psychometric assessments in licensing contexts.
5. Conclusions
This study presents and validates a VR-based simulator specifically designed for psychometric driver testing, demonstrating its feasibility as an immersive, standardized, and user-centered assessment tool. By integrating tests for peripheral vision, reaction speed with multimodal stimuli, and fine motor accuracy, the proposed system addresses critical dimensions of driving aptitude that are only partially covered by traditional psychometric tools. The empirical results support this contribution: participants achieved on average 35.96 correct responses in the peripheral vision test (out of 40) with low variability in reaction times, while the reaction test yielded an average of 34.74 correct answers with higher dispersion in error rates (0–23), highlighting the complexity of dynamic multisensory tasks. In the precision test, participants showed a low error rate (mean = 1.67 errors), confirming the system’s ability to capture fine visuomotor coordination.
The contribution of this work lies in bridging a gap in the current literature: whereas previous research has explored VR in road safety education or focused on isolated psychomotor tasks, this study introduces a comprehensive, validated framework that combines psychometric rigor with immersive technology. Furthermore, inferential analyses demonstrated that acceptance and perceived validity of the VR system were consistent across demographic groups, except for Q5 (physical discomfort) where female participants reported significantly higher discomfort (F = 6.19, p = 0.015). Overall, 85% of participants agreed that the simulator accurately captured their skills, and 97.5% would recommend its use in real evaluation contexts, confirming both its diagnostic precision and its pedagogical value. By combining robust psychometric assessment with immersive simulation, the present work advances the field and provides a solid foundation for the development of next-generation psychometric evaluation systems.
Author Contributions
Conceptualization, J.L.V. and A.A.-C.; methodology, J.L.V., A.A.-C., T.M.C.-Z. and D.M.Z.-P.; software, T.M.C.-Z. and D.M.Z.-P.; validation, J.L.V., A.A.-C., T.M.C.-Z., D.M.Z.-P., P.F.-A., D.V. and A.d.B.; formal analysis, J.L.V., A.A.-C., T.M.C.-Z. and D.M.Z.-P.; investigation, J.L.V., A.A.-C., T.M.C.-Z. and D.M.Z.-P.; resources, J.L.V., A.A.-C., T.M.C.-Z. and D.M.Z.-P.; data curation, J.L.V., A.A.-C., T.M.C.-Z. and D.M.Z.-P.; writing—original draft preparation, J.L.V., D.V. and A.d.B.; writing—review and editing, J.L.V., A.A.-C., P.F.-A., D.V. and A.d.B.; visualization, P.F.-A., D.V. and A.d.B.; supervision, P.F.-A., D.V. and A.d.B.; project administration, J.L.V. and A.A.-C. All authors have read and agreed to the published version of the manuscript.
Funding
This research received no external funding.
Institutional Review Board Statement
The study was conducted in accordance with the Declaration of Helsinki, and approved by Ethics Committee of Universidad Técnica de Manabí (Ecuador), CEISH-UTM (protocol code CEISH-UTM-INT_23-09-19_JLVZ, approved on 25 September 2023).
Informed Consent Statement
Informed consent was obtained from all subjects involved in the study.
Data Availability Statement
The original contributions presented in the study are included in the article; further inquiries can be directed to the corresponding authors.
Conflicts of Interest
The authors declare no conflicts of interest.
References
- Pajković, V.; Grdinić-Rakonjac, M. Age-related differences in attitudes and perception on road safety issues in Montenegro. Transp. Res. Procedia 2022, 6, 584–591. [Google Scholar] [CrossRef]
- Pajković, V.; Grdinić-Rakonjac, M. Road users’ attitudes and perception on selected road safety issues—Age-related comparison. Eur. Transp.—Trasp. Eur. 2021, 85, 7. [Google Scholar] [CrossRef]
- Farooq, D.; Juhasz, J. Statistical evaluation of risky driver behavior factors that influence road safety based on drivers age and driving experience in Budapest and Islamabad. Eur. Transp.—Trasp. Eur. 2020, 80, 2. [Google Scholar] [CrossRef]
- Farooq, D.; Juhasz, J. Analysis of Young Driver behaviour related to road safety issues in Pakistan and Hungary. In Proceedings of the World Congress on Civil, Structural, and Environmental Engineering, Budapest, Hungary, 8–10 April 2018. [Google Scholar] [CrossRef]
- Su, Z.; Woodman, R.; Smyth, J.; Elliott, M. The relationship between aggressive driving and driver performance: A systematic review with meta-analysis. Accid. Anal. Prev. 2023, 183, 106972. [Google Scholar] [CrossRef]
- Borovec, K. The relation of driver characteristics with their punishable behavior in traffic. Sigurnost 2023, 65, 373–393. [Google Scholar] [CrossRef]
- Alonso, F.; Esteban, C.; Montoro, L.; Useche, S.A. Knowledge, perceived effectiveness and qualification of traffic rules, police supervision, sanctions and justice. Cogent Soc. Sci. 2017, 3, 1393855. [Google Scholar] [CrossRef]
- Wang, W.; Yang, Y.; Chen, A.; Pan, Z. A scoring method for driving safety credit using trajectory data. In Proceedings of the 2019 IEEE SmartWorld, Ubiquitous Intelligence and Computing, Advanced and Trusted Computing, Scalable Computing and Communications, Internet of People and Smart City Innovation, SmartWorld/UIC/ATC/SCALCOM/IOP/SCI 2019, Leicester, UK, 19–23 August 2019; pp. 558–565. [Google Scholar] [CrossRef]
- Palk, G.; Freeman, J.; Kee, A.G.; Steinhardt, D.; Davey, J. The prevalence and characteristics of self-reported dangerous driving behaviours among a young cohort. Transp. Res. Part F Traffic Psychol. Behav. 2011, 14, 147–154. [Google Scholar] [CrossRef][Green Version]
- Saeidi, T.; Mishra, S.; Mehran, B. Influencing factors on drivers’ support for traffic safety laws in Canada. Case Stud. Transp. Policy 2024, 15, 101150. [Google Scholar] [CrossRef]
- Divyasri, C.; Neelima, N.; Smitha, T.V. Machine Learning for Road Safety Enhancement Through In-Vehicle Sensor Analysis. In Proceedings of the 2024 3rd International Conference on Electrical, Electronics, Information and Communication Technologies, ICEEICT 2024, Trichy, India, 24–26 July 2024. [Google Scholar] [CrossRef]
- Ucar, S.; Hoh, B.; Oguchi, K. Differential Deviation Based Abnormal Driving Behavior Detection. In Proceedings of the IEEE Conference on Intelligent Transportation Systems, ITSC, Indianapolis, IN, USA, 19–22 September 2021; pp. 1553–1558. [Google Scholar] [CrossRef]
- Chuah, K.M.; Chen, C.J.; Teh, C.S. ViSTREET: An educational virtual environment for the teaching of road safety skills to school students. In Lecture Notes in Computer Science (Including Subseries Lecture Notes in Artificial Intelligence and Lecture Notes in Bioinformatics); Springer: Berlin/Heidelberg, Germany, 2009; pp. 392–403. [Google Scholar] [CrossRef]
- Fokides, E.; Tsolakidis, C. A pilot project to teach road safety using desktop virtual reality. In Cases on Technology Enhanced Learning Through Collaborative Opportunities; Information Science Reference: Hershey, PA, USA, 2010; pp. 111–136. [Google Scholar] [CrossRef]
- Pandey, K.; Grimes, G.J.; Schwebel, D.C. A low cost approach to pediatric pedestrian safety in virtual reality. In Proceedings of the 2009 3rd Asia International Conference on Modelling and Simulation, AMS 2009, Bandung, Indonesia, 25–29 May 2009; pp. 549–554. [Google Scholar] [CrossRef]
- De Cet, G.; Baldassa, A.; Tagliabue, M.; Rossi, R.; Vianello, C.; Gastaldi, M. The Application of Immersive Virtual Reality for Children’s Road Education: Validation of a Pedestrian Crossing Scenario. In Lecture Notes in Computer Science (Including Subseries Lecture Notes in Artificial Intelligence and Lecture Notes in Bioinformatics); Springer: Berlin/Heidelberg, Germany, 2022; pp. 128–140. [Google Scholar] [CrossRef]
- Tzanavari, A.; Matsentidou, S.; Christou, C.G.; Poullis, C. User experience observations on factors that affect performance in a road-crossing training application for children using the CAVE. In Lecture Notes in Computer Science (Including Subseries Lecture Notes in Artificial Intelligence and Lecture Notes in Bioinformatics); Springer: Berlin/Heidelberg, Germany, 2014; pp. 91–101. [Google Scholar] [CrossRef]
- Khan, N.; Muhammad, K.; Hussain, T.; Nasir, M.; Munsif, M.; Imran, A.S.; Sajjad, M. An adaptive game-based learning strategy for children road safety education and practice in virtual space. Sensors 2021, 21, 3661. [Google Scholar] [CrossRef]
- Szczurowski, K.; Smith, M. ‘Woodlands’-A Virtual Reality Serious Game Supporting Learning of Practical Road Safety Skills. In Proceedings of the 2018 IEEE Games, Entertainment, Media Conference, GEM 2018, Galway, Ireland, 15–17 August 2018; pp. 427–435. [Google Scholar] [CrossRef]
- Raju, A.D.J.; Briyolan, B.G.; Stephy, K.A.; Byju, B. The Integration of Virtual Reality (VR) in Driver Education. In Proceedings of the 6th International Conference on Innovative Trends in Information Technology: Secure, Trustworthy and Socially Responsible AI, ICITIIT 2025, Kottayam, India, 21–22 February 2025. [Google Scholar] [CrossRef]
- Xuan, T.J.; Albert, Q. The study about using VR with smart phones for road safety awareness and timing. In Proceedings of the ACM International Conference Proceeding Series, Bali, Jakarta, Surabaya, Indonesia, 1–9 April 2019; pp. 142–146. [Google Scholar] [CrossRef]
- Gomes, A.; Alcaso, D.; Páris, C. TRAINER: Virtual Reality Game for Teaching Road Safety. In Lecture Notes in Bioengineering; Springer: Berlin/Heidelberg, Germany, 2023; pp. 413–422. [Google Scholar] [CrossRef]
- Sánchez, J.S.; Ortiz, J.S.; Mayorga, O.A.; Sánchez, C.R.; Andaluz, G.M.; Bonilla, E.L.; Andaluz, V.H. Virtual Simulator for the Taking and Evaluation of Psychometric Tests to Obtain a Driver’s License. In Augmented Reality, Virtual Reality, and Computer Graphics, Proceedings of the 6th International Conference, AVR 2019, Santa Maria al Bagno, Italy, 24–27 June 2019; Part I; Springer: Berlin/Heidelberg, Germany, 2019; pp. 138–149. [Google Scholar] [CrossRef]
- Biela, A.; Wontorczyk, A.; Gorbaniuk, O. Searching for Predictors of Safe Driving Behaviour as an Important Activity in Achieving an Integrated Traffic System. Research on the Behavioural Criterion of the Psychometric Test Validity for Drivers. J. Perspect. Econ. Political Soc. Integr. 2021, 27, 2. [Google Scholar] [CrossRef]
- LOTAIP_6_Ley-Organica-de-Transporte-Terrestre-Transito-y-Seguridad-Vial-2021.pdf. Available online: https://www.obraspublicas.gob.ec/wp-content/uploads/downloads/2021/08/LOTAIP_6_Ley-Organica-de-Transporte-Terrestre-Transito-y-Seguridad-Vial-2021.pdf (accessed on 27 July 2025).
- Innes, C.R.H.; Jones, R.D.; Anderson, T.J.; Hollobon, S.G.; Dalrymple-Alford, J.C. Performance in normal subjects on a novel battery of driving-related sensory-motor and cognitive tests. Behav. Res. Methods 2009, 41, 284–294. [Google Scholar] [CrossRef]
- Innes, C.R.H.; Jones, R.; Anderson, T.; Dalrymple-Alford, J.; Hayes, S.; Hollobon, S.; Severinsen, J.; Smith, G.; Nicholls, A. Prediction of driving ability in persons with brain disorders using sensory-motor and cognitive tests. In Proceedings of the Annual International Conference of the IEEE Engineering in Medicine and Biology—Proceedings, Shanghai, China, 1–4 September 2005; pp. 5439–5442. [Google Scholar] [CrossRef]
- Innes, C.R.H.; Jones, R.D.; Dalrymple-Alford, J.C.; Hayes, S.; Hollobon, S.; Severinsen, J.; Smith, G.; Nicholls, A.; Anderson, T.J. Sensory-motor and cognitive tests predict driving ability of persons with brain disorders. J. Neurol. Sci. 2007, 260, 188–198. [Google Scholar] [CrossRef]
- Pečečnik, K.S.; Medarević, J.; Čižman-Štaba, U.; Rutar, M.; Sremec, M.; Sodnik, J. Can Simulated Driving-Based Tasks Reliably Assess Fitness to Drive? In Lecture Notes in Networks and Systems; Springer: Dordrecht, The Netherlands, 2024; pp. 410–424. [Google Scholar] [CrossRef]
- He, Y.; Sun, W.; Leung, P.S.-W.; Chow, Y.-T. Effect of static magnetic field of electric vehicles on driving performance and on neuro-psychological cognitive functions. Int. J. Environ. Res. Public Health 2019, 16, 3382. [Google Scholar] [CrossRef]
- He, Y.; Leung, P.S.W. The effect of static magnetic field exposure to drivers cognitive ability. In Proceedings of the 2019 Joint International Symposium on Electromagnetic Compatibility, Sapporo and Asia-Pacific International Symposium on Electromagnetic Compatibility, EMC Sapporo/APEMC 2019, Sapporo, Japan, 3–7 June 2019; pp. 166–169. [Google Scholar] [CrossRef]
- Ferreira, I.S.; Simões, M.R.; Marôco, J. The Addenbrooke’s Cognitive Examination Revised as a potential screening test for elderly drivers. Accid. Anal. Prev. 2012, 49, 278–286. [Google Scholar] [CrossRef]
- Shanmugaratnam, S.; Kass, S.J.; Arruda, J.E. Age differences in cognitive and psychomotor abilities and simulated driving. Accid. Anal. Prev. 2010, 42, 802–808. [Google Scholar] [CrossRef]
- Aksan, N.; Anderson, S.W.; Dawson, J.D.; Johnson, A.M.; Uc, E.Y.; Rizzo, M. Cognitive functioning predicts driver safety on road tests 1 and 2 years later. J. Am. Geriatr. Soc. 2012, 60, 99–105. [Google Scholar] [CrossRef] [PubMed]
- Gimeno, P.T.; Cerezuela, G.P.; Crespo, A. Exploración Visual Y Movimientos Oculares En Conductores Con Distinta Experiencia: Una Revisión. An. Psicol./Ann. Psychol. 2004, 20, 1. [Google Scholar]
- Svärd, M.; Bärgman, J.; Victor, T. Detection and response to critical lead vehicle deceleration events with peripheral vision: Glance response times are independent of visual eccentricity. Accid. Anal. Prev. 2021, 150, 105853. [Google Scholar] [CrossRef]
- Sanchez-Mateo, S. Análisis del Comportamiento Visual del Conductor Aplicado a la Toma de Decisiones en Vehículos Autónomos. Ph.D. Thesis, Universidad Politécnica de Madrid, Madrid, Spain, 2023. [Google Scholar] [CrossRef]
- González, T.; Ibeas, C.; Gravert, I.; León, A.; Rojas, M. Characteristics of a Virtual Reality scenario for anatomy learning: A literature review. Rev. Española Educ. Médica 2022, 3, 3. [Google Scholar] [CrossRef]
- Xiong, J.; Hsiang, E.-L.; He, Z.; Zhan, T.; Wu, S.-T. Augmented reality and virtual reality displays: Emerging technologies and future perspectives. Light. Sci. Appl. 2021, 10, 216. [Google Scholar] [CrossRef]
- Xie, B.; Liu, H.; Alghofaili, R.; Zhang, Y.; Jiang, Y.; Lobo, F.D.; Li, C.; Li, W.; Huang, H.; Akdere, M.; et al. A Review on Virtual Reality Skill Training Applications. Front. Virtual Real. 2021, 2, 645153. [Google Scholar] [CrossRef]
- Kourtesis, P.; MacPherson, S.E. How immersive virtual reality methods may meet the criteria of the National Academy of Neuropsychology and American Academy of Clinical Neuropsychology: A software review of the Virtual Reality Everyday Assessment Lab (VR-EAL). Comput. Hum. Behav. Rep. 2021, 4, 100151. [Google Scholar] [CrossRef]
- Luciani, M.; De Maria, M.; Page, S.D.; Barbaranelli, C.; Ausili, D.; Riegel, B. Measuring Self-Care in the General Adult Population: Development and Psychometric Testing of the Self-Care Inventory. BMC Public Health 2022, 22, 598. [Google Scholar] [CrossRef]
- Navon—Eyal, M.; Taubman—Ben-Ari, O. Can Emotion Regulation Explain the Association between Age and Driving Styles? Transp. Res. Part F Traffic Psychol. Behav. 2020, 74, 439–445. [Google Scholar] [CrossRef]
- Fiorenzato, E.; Zabberoni, S.; De Simone, M.S.; Costa, A.; Tieri, G.; Taglieri, S.; Peppe, A.; Carlesimo, G.A.; Caltagirone, C.; Antonini, A.; et al. Effects of Virtual Reality Cognitive Training on Executive Function and Prospective Memory in Parkinson’s Disease and Healthy Aging. J. Neurol. Sci. 2025, 473, 123507. [Google Scholar] [CrossRef]
- Gårdinger, M.B.; Johansson, R.; Lidestam, B.; Selander, H. Validation of a Computerized Driving Simulator Test of Cognitive Abilities for Fitness-to-Drive Assessments. Front. Psychol. 2023, 14, 1294965. [Google Scholar] [CrossRef] [PubMed]
- Krasniuk, S.; Toxopeus, R.; Knott, M.; McKeown, M.; Crizzle, A.M. The Effectiveness of Driving Simulator Training on Driving Skills and Safety in Young Novice Drivers: A Systematic Review of Interventions. J. Saf. Res. 2024, 91, 20–37. [Google Scholar] [CrossRef] [PubMed]
- Boboc, R.G.; Butilă, E.V.; Butnariu, S. Leveraging Wearable Sensors in Virtual Reality Driving Simulators: A Review of Techniques and Applications. Sensors 2024, 24, 4417. [Google Scholar] [CrossRef]
- Roh, Y.S.; In Jang, K.; Lee, E.A.L. Influencing Factors and Learning Outcomes in Virtual Simulation Learning Experiences: A Structural Equation Modeling. Nurse Educ. Today 2025, 150, 106681. [Google Scholar] [CrossRef] [PubMed]
- Himmels, C.; Venrooij, J.; Parduzi, A.; Peller, M.; Riener, A. The Bigger the Better? Investigating the Effects of Driving Simulator Fidelity on Driving Behavior and Perception. Transp. Res. Part F Traffic Psychol. Behav. 2024, 101, 250–266. [Google Scholar] [CrossRef]
- Piaseczna, N.; Doniec, R.; Sieciński, S.; Barańska, K.; Jędrychowski, M.; Grzegorzek, M. Driving Reality vs. Simulator: Data Distinctions. Electronics 2024, 13, 2708. [Google Scholar] [CrossRef]
- Smyth, J.; Birrell, S.; Mouzakitis, A.; Jennings, P. Motion Sickness and Human Performance—Exploring the Impact of Driving Simulator User Trials. Adv. Intell. Syst. Comput. 2019, 786, 445–457. [Google Scholar] [CrossRef]
- Han, J.; Wang, X.; Wang, G. Modeling the Car-Following Behavior with Consideration of Driver, Vehicle, and Environment Factors: A Historical Review. Sustainability 2022, 14, 8179. [Google Scholar] [CrossRef]
- Jongen, S.; Perrier, J.; Vuurman, E.F.; Ramaekers, J.G.; Vermeeren, A. Sensitivity and Validity of Psychometric Tests for Assessing Driving Impairment: Effects of Sleep Deprivation. PLoS ONE 2015, 10, e0117045. [Google Scholar] [CrossRef]
- Roelofs, E.C.; Emons, W.H.M.; Verschoor, A.J. Exploring Task Features That Predict Psychometric Quality of Test Items: The Case for the Dutch Driving Theory Exam. Int. J. Test. 2021, 21, 80–104. [Google Scholar] [CrossRef]
- Cutler, B.L.; Kravitz, D.A.; Cohen, M.; Schinas, W. The Driving Appraisal Inventory: Psychometric Characteristics and Construct Validity1. J. Appl. Soc. Psychol. 1993, 23, 1196–1213. [Google Scholar] [CrossRef]
Disclaimer/Publisher’s Note: The statements, opinions and data contained in all publications are solely those of the individual author(s) and contributor(s) and not of MDPI and/or the editor(s). MDPI and/or the editor(s) disclaim responsibility for any injury to people or property resulting from any ideas, methods, instructions or products referred to in the content. |
© 2025 by the authors. Licensee MDPI, Basel, Switzerland. This article is an open access article distributed under the terms and conditions of the Creative Commons Attribution (CC BY) license (https://creativecommons.org/licenses/by/4.0/).