


Abstract
Industrial supervision can be expanded through the Internet of Things (IoT) without moving the control logic outside the PLC. This study evaluates a level-monitoring and control architecture using a point-to-point LoRa link between two Siemens S7-1200 PLCs; LoRaWAN is used solely as a conceptual architectural reference, and no gateway, network server, or OTAA/ABP procedures were implemented. An Arduino Uno with an Ethernet Shield W5100 exchanges variables with the PLC through Modbus TCP and transfers them via UART to Heltec LoRa ESP32 modules. Factory I/O simulates the process, and Adafruit IO provides remote supervision. The field campaign covered twelve locations between 10 and 120 m and 1200 frames. Reception, packet loss, RSSI, SNR, and the latency value calculated by the firmware were recorded. Overall reception was 94.17%, packet loss was 5.83%, and the mean latency value was 727.17 ms. The main contribution is the separation of local control from wireless communication and the quantitative evaluation of the link. Because the PLC maintained control when frames were lost, the solution is suitable for supervising slow processes, but not for critical loops. The results are specific to the evaluated radio and firmware configuration.
1. Introduction
Industry 4.0, the Internet of Things (IoT), and the Industrial Internet of Things (IIoT) are now widely used in industrial automation. Together, they link field devices, industrial controllers, and digital platforms so that plant personnel can supervise processes, analyze data, and make better-informed decisions [1,2]. PLCs, supervisory control and data acquisition (SCADA) systems, and IoT services can therefore operate within more flexible and interoperable architectures [3]. Building such systems requires more than adding a connected device; automation hardware, industrial protocols, and digital services must work as a coordinated whole [3,4].
Industry 5.0 broadens this transformation by placing greater emphasis on people, sustainability, and resilience. In the architecture studied here, the control decision remains in the PLC, remote supervision supports rather than replaces local control, and the process can continue when the external IoT connection is unavailable [5]. A recent review likewise identifies edge computing, digital twins, IoT, and human–machine collaboration as important enabling technologies for Industry 5.0 [6].
LoRa and LoRaWAN are particularly useful when small packets must travel long distances without high energy demand [7,8]. LoRa provides the radio-frequency physical layer, whereas LoRaWAN adds the network architecture, including access control, gateways, and network servers [9,10]. Link studies commonly report received signal strength (RSSI), signal-to-noise ratio (SNR), and packet delivery ratio (PDR), because these metrics describe coverage and reliability from different perspectives [11,12]. The radio tests in this study used raw point-to-point LoRa between two Heltec LoRa ESP32 modules. LoRaWAN is discussed only as a conceptual model for possible future access control, security, gateways, and network services; none of those LoRaWAN functions formed part of the field experiment. Previous work also shows that radio settings, scalability, energy use, and simulation tools should be considered during design rather than after deployment [13].
A tank-level value is not simply information for a display. It determines when the pump starts, when the valves open or close, and when an alarm must be raised. Recent studies have therefore connected cisterns and water tanks to IoT platforms, allowing operators to check levels remotely and reducing routine manual inspections [14,15]. Research on LoRa/LoRaWAN water-management systems also shows that these technologies can carry water-related data from dispersed or hard-to-reach locations [14,16]. Other low-cost LoRa implementations send water variables to gateways, local servers, or visualization platforms [11].
Factory I/O and Adafruit IO had separate roles in the system. Factory I/O reproduced the process and allowed the automation strategy to be checked before any physical installation [17,18]. Adafruit IO organized the selected variables in feeds and web dashboards for remote viewing. It supported supervision, but the PLC remained responsible for every control decision [19].
Against this background, we developed an IoT architecture for monitoring and controlling the level in a simulated process. The Siemens S7-1200 retains the main control program. An Arduino Uno with an Ethernet Shield W5100 bridges Modbus over the Transmission Control Protocol (Modbus TCP) and the Universal Asynchronous Receiver-Transmitter (UART) interface used by the Heltec LoRa ESP32 modules. The study separates the local control loop from the wireless supervision layer and then examines the link quantitatively at several distances. Its practical value lies in retaining the PLC program and existing inputs and outputs while preventing radio failures from interrupting local control. The PLC itself is not claimed as a scientific novelty.
1.1. Related Work and Contribution
LoRa and LoRaWAN are common choices in water-management projects because distributed sensors can communicate without extensive cabling. Monitoring and leak-detection studies frequently highlight their range and low energy demand [14]. Reviews of the field also cover water-quality monitoring, tank and reservoir control, and distribution networks [16]. Across these applications, continuous data acquisition, wireless transport, and remote visualization appear repeatedly as core functions [20].
Abubeker and Nuthalapati proposed a cloud-connected LoRaWAN system that measures tank level, displays it remotely, and controls a pump [21]. Saban et al. combined a PLC, a web application, and LoRa/LoRaWAN for an agricultural installation [22]. Both are relevant to the present work, although our architecture leaves the control decision in the PLC and treats the wireless path as an external communication layer. In related water-quality research, Sendra et al. tested a LoRa network in coastal areas [23], and Murti et al. combined sensors, LoRa communication, and cloud storage [24].
A useful comparison requires more than listing the final results, so the measurement procedures used in the closest studies were also examined. Saban et al. [22] carried out an outdoor campaign on a farm in Valencia. Their gateway was installed at approximately 24 m, and a LoRa Mote II was moved among eleven locations from 50 to 795 m. Ten messages were exchanged at each point using 867.1–868.5 MHz, a bandwidth of 125 kHz, spreading factor 7, coding rate 4/5, and +14 dB transmission power. Reception was determined from confirmed messages, while RSSI and SNR were recorded at each distance. Reception remained at 100% up to 415 m, decreased to 90% at 550 m, and ranged from 50% to 70% between 640 and 795 m. RSSI ranged from −36 to −109 dBm and SNR from 9 to −4 dB. Their study did not report a timing metric equivalent to the firmware-calculated latency value used here.
Abubeker and Nuthalapati [21] evaluated an ESP32 LoRa tank-automation system with a JSN-SR04T ultrasonic sensor in several environments. They related the distance between the node and gateway to energy consumption, RSSI, and SNR, but their timing definition differed from the firmware-calculated latency value used here. In the present campaign, the transmitter antenna was positioned at a height of 5 m and the receiver antenna at 2 m. Tests were performed at twelve positions from 10 to 120 m, with 100 frames per position, a frequency of 915 MHz, a bandwidth of 125 kHz, and one attempt per frame. Reception ranged from 85% to 100%, RSSI from −91 to −126 dBm, and the recorded latency value from 361 to 1382 ms. These published values are used as quantitative reference points rather than direct comparisons because the frequency, topology, antenna heights, hardware, number of messages, and timing procedures were not the same.
The papers suggested during review also illustrate how low-power embedded nodes can be adapted to very different tasks. Vivek et al. combined LoRa and GPS to track children [25]. Maheswaran et al. used temperature sensors, an ESP32, and a Telegram bot for cold-chain monitoring [26]. Although neither application concerns tank control, both show that embedded nodes can acquire and transmit field information. The defining feature of our proposal is that the Siemens S7-1200 PLC retains control authority.
Many embedded solutions place both acquisition and control in the microcontroller. Here, those functions remain in the Siemens S7-1200, while the Arduino-W5100 and LoRa ESP32 provide the communication interface. Factory I/O was used to verify the process, while only the variables needed for supervision were sent to the IoT layer. This division of control, communication, and visualization is consistent with IIoT architectures that distribute tasks among field equipment, edge resources, and digital services [27].
1.2. Research Objective and Questions
The study aimed to design and evaluate a modular IoT architecture that transports level variables and actuator states between PLC-based systems without moving the control decision outside the Siemens S7-1200. Three questions guided the work: (1) Can the PLC-Arduino-LoRa path exchange the required variables while the PLC retains its program? (2) How do reception, RSSI, SNR, and recorded latency change with distance? (3) What do the recorded timing value and packet loss imply for supervision and for any future control action that depends on the wireless link? Therefore, the contribution lies in the functional separation and the experimental definition of the conditions of use, not in the incorporation of a single hardware component.
2. Materials and Methods
An applied experimental approach was used to design, implement, and test the IoT architecture. The work was divided into three practical stages: simulation of the level process in Factory I/O, control with Siemens S7-1200 PLCs, and wireless communication through the Arduino-W5100 bridge and Heltec LoRa ESP32 modules. This arrangement allowed each functional layer to be examined separately. The PLC kept the process logic, while the external devices extended communication and remote supervision. The principal hardware comprised Siemens S7-1200 PLCs (Siemens AG, Munich, Germany), Arduino Uno boards (Arduino S.r.l., Monza, Italy), Ethernet Shield W5100 boards based on the W5100 controller (WIZnet Co., Ltd., Seongnam, Republic of Korea), and Heltec WiFi LoRa 32 V3 modules (Heltec Automation, Chengdu, China). The software included TIA Portal (Siemens AG, Munich, Germany; exact release not retained), Factory I/O 2.x (Real Games, Gondomar, Portugal; exact minor release not retained), and Adafruit IO (Adafruit Industries, LLC, Brooklyn, NY, USA; web platform without a fixed desktop version). The electronic modules used in the prototype were sourced from a local electronics re-tailer in Latacunga, Ecuador.
Node separation was the independent variable. Packet reception, packet loss, firmware-calculated latency, RSSI, and SNR were treated as dependent variables. The transmitter remained at one location with its antenna at 5 m, while the receiver was moved among the test points with its antenna at 2 m. Antenna orientation, the 100-frame test size, and the communication settings were kept unchanged at each location. These controls made the field campaign an experimental evaluation of the link rather than merely a functional demonstration of the prototype.
2.1. Application of the OSI Model to the Proposed Architecture
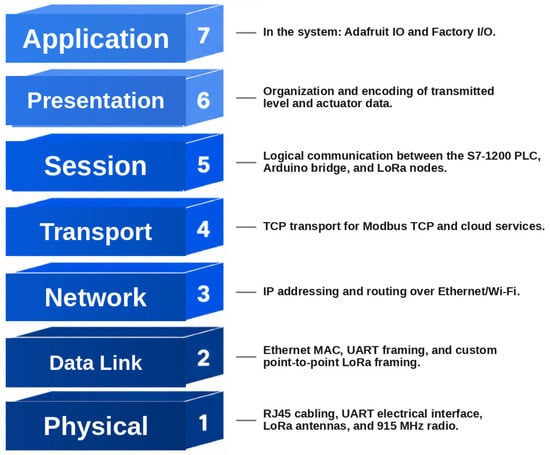
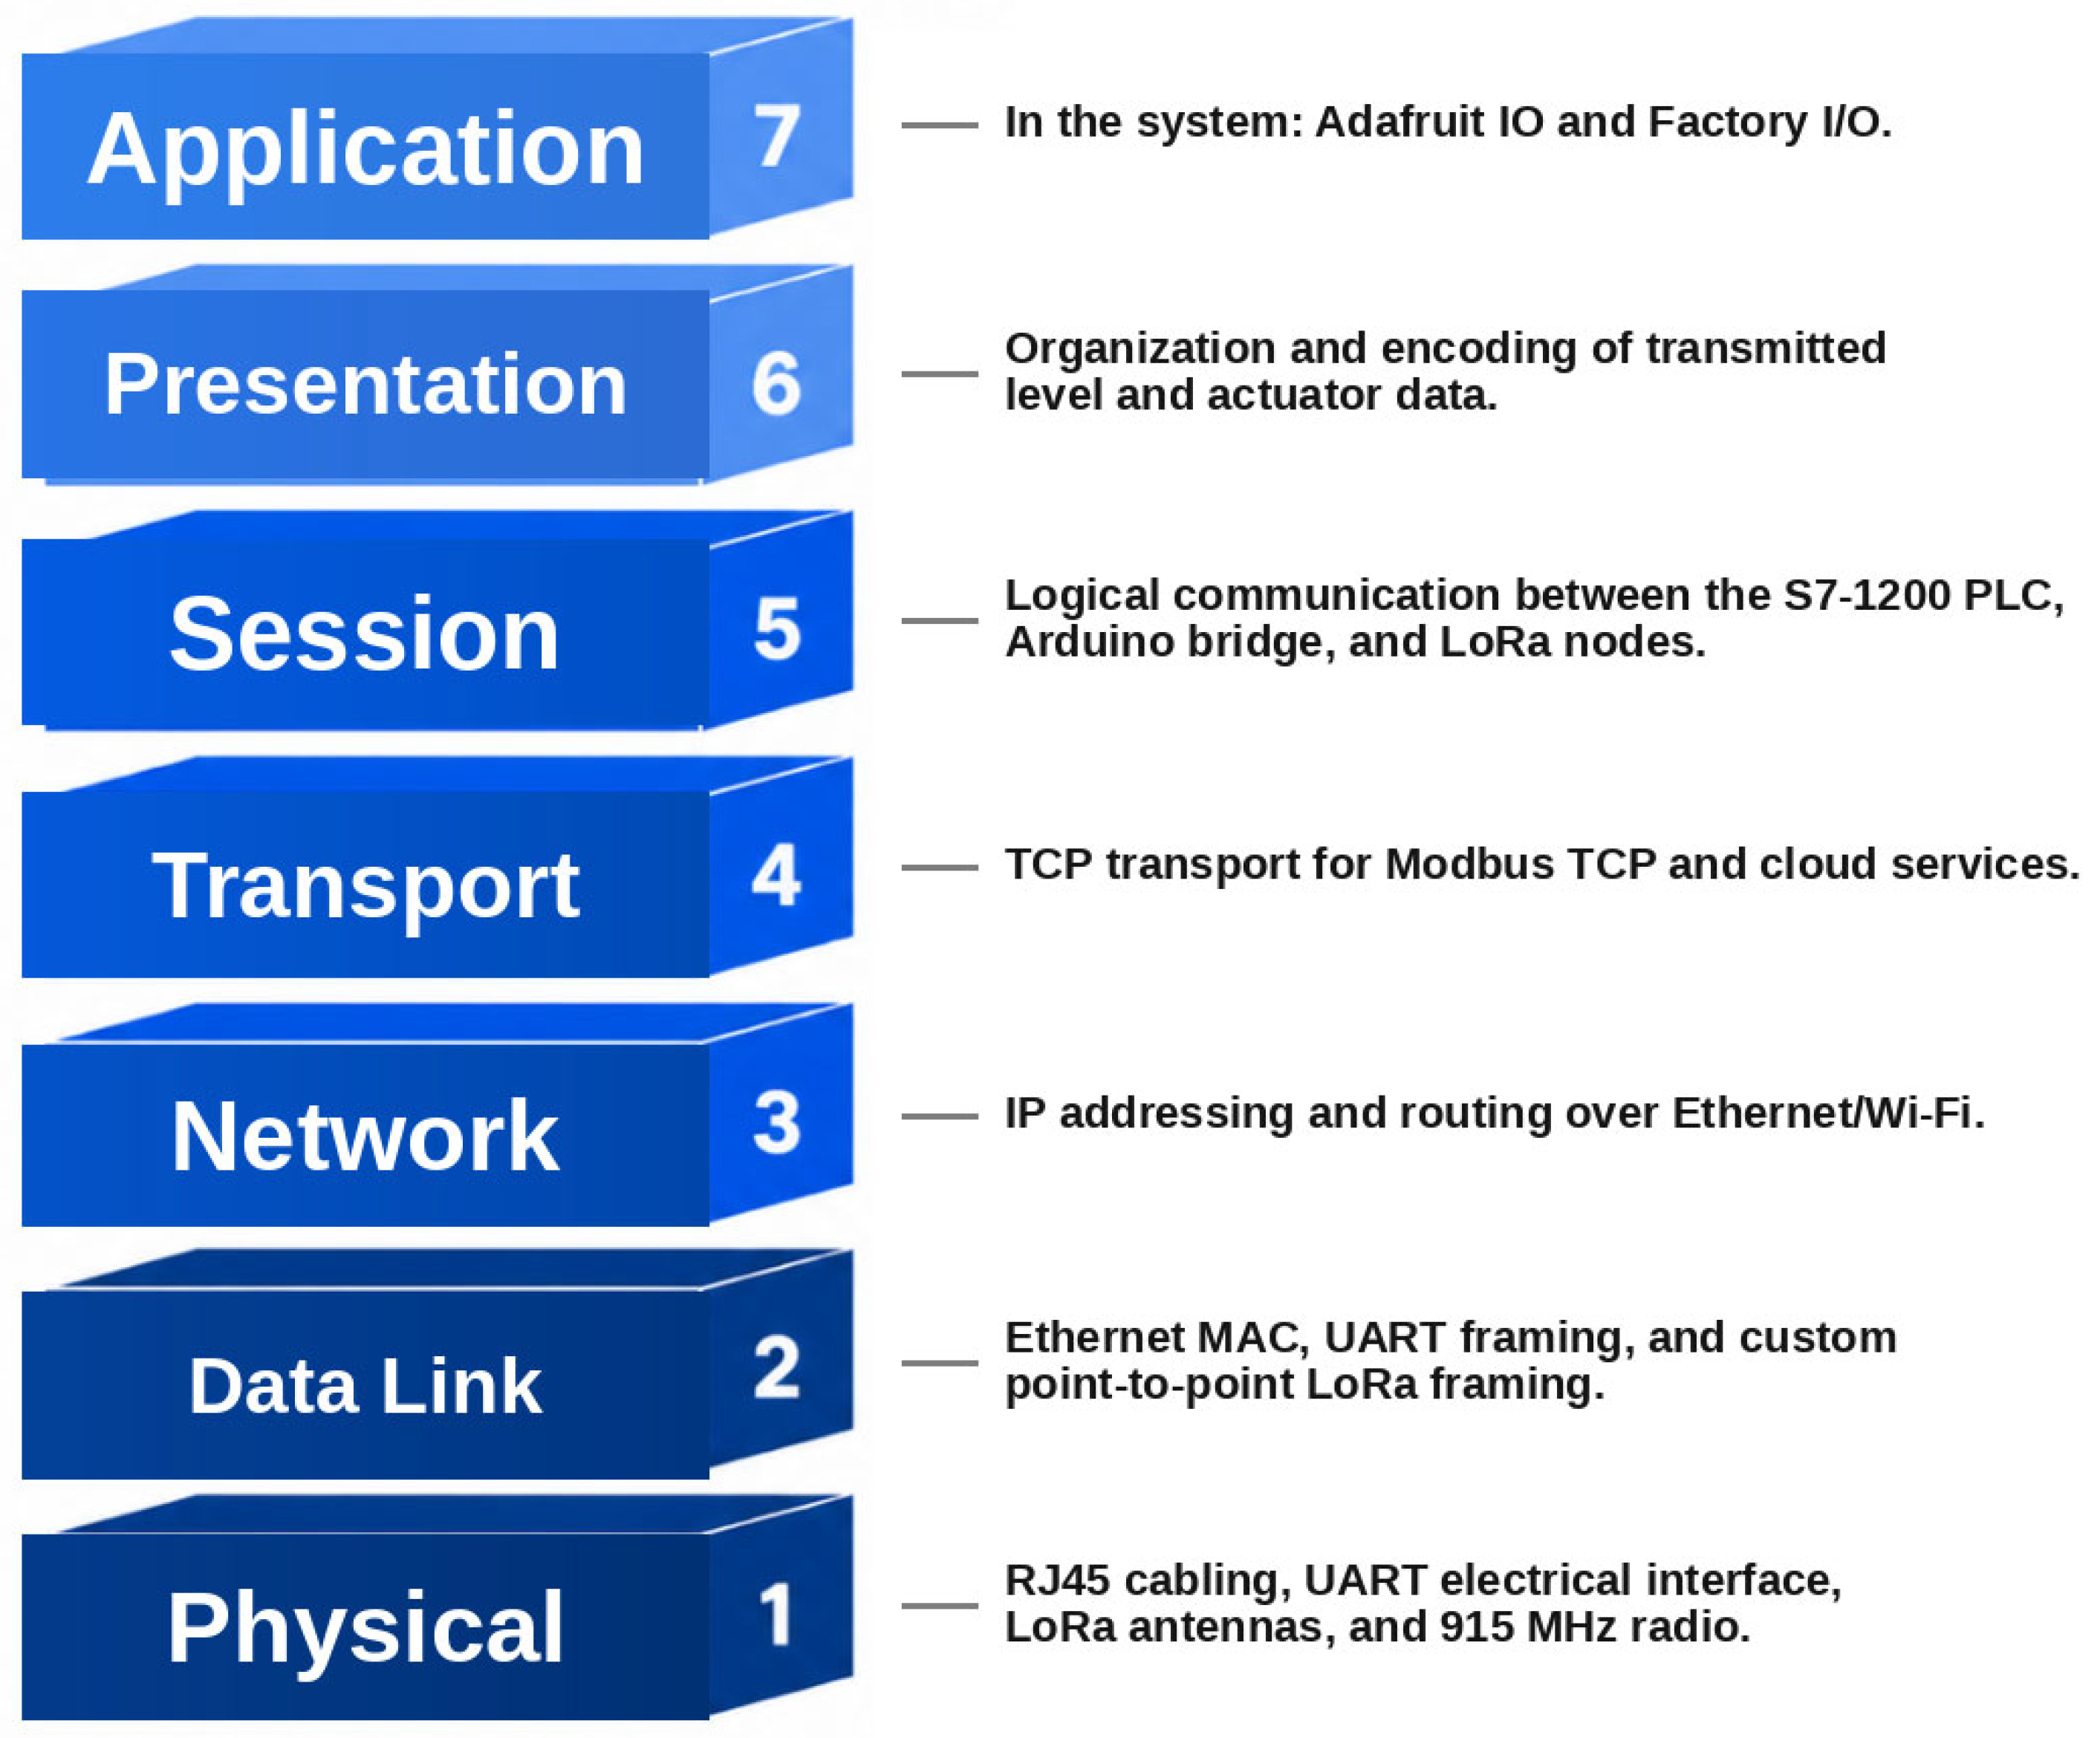
The OSI model provided a practical reference for organizing the communication path [28,29]. In the prototype, the lower layers correspond to identifiable hardware elements: RJ45 cabling, electrical signaling, UART communication, the LoRa antennas, and the sub-GHz radio link of the Heltec LoRa ESP32 boards.
Ethernet, IP addressing, and Modbus TCP carry the variables from the Siemens S7-1200 to the Arduino Uno and its W5100 shield. The bridge then passes the values to LoRa for transmission to the remote node, without requiring any change to the PLC program. At the application end, Factory I/O provides the process simulation and Adafruit IO provides remote visualization. Figure 1 summarizes this mapping.
Figure 1.
OSI model applied to the proposed communication system. Note: the figure represents the evaluated implementation; LoRaWAN is only cited as a conceptual architectural reference, and the implemented radio link corresponds to point-to-point LoRa.
2.2. System Architecture and Implementation
The prototype was assembled around three functional blocks. Factory I/O reproduced the tank, the Siemens S7-1200 PLCs executed the control sequence, and the Arduino-W5100 plus Heltec LoRa ESP32 hardware moved the selected variables across the wireless link. Adafruit IO provided the remote view [19]. Working with these blocks separately made it easier to verify the prototype step by step before considering a physical installation [30].
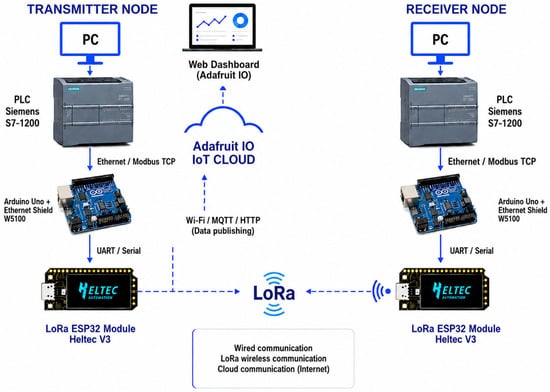
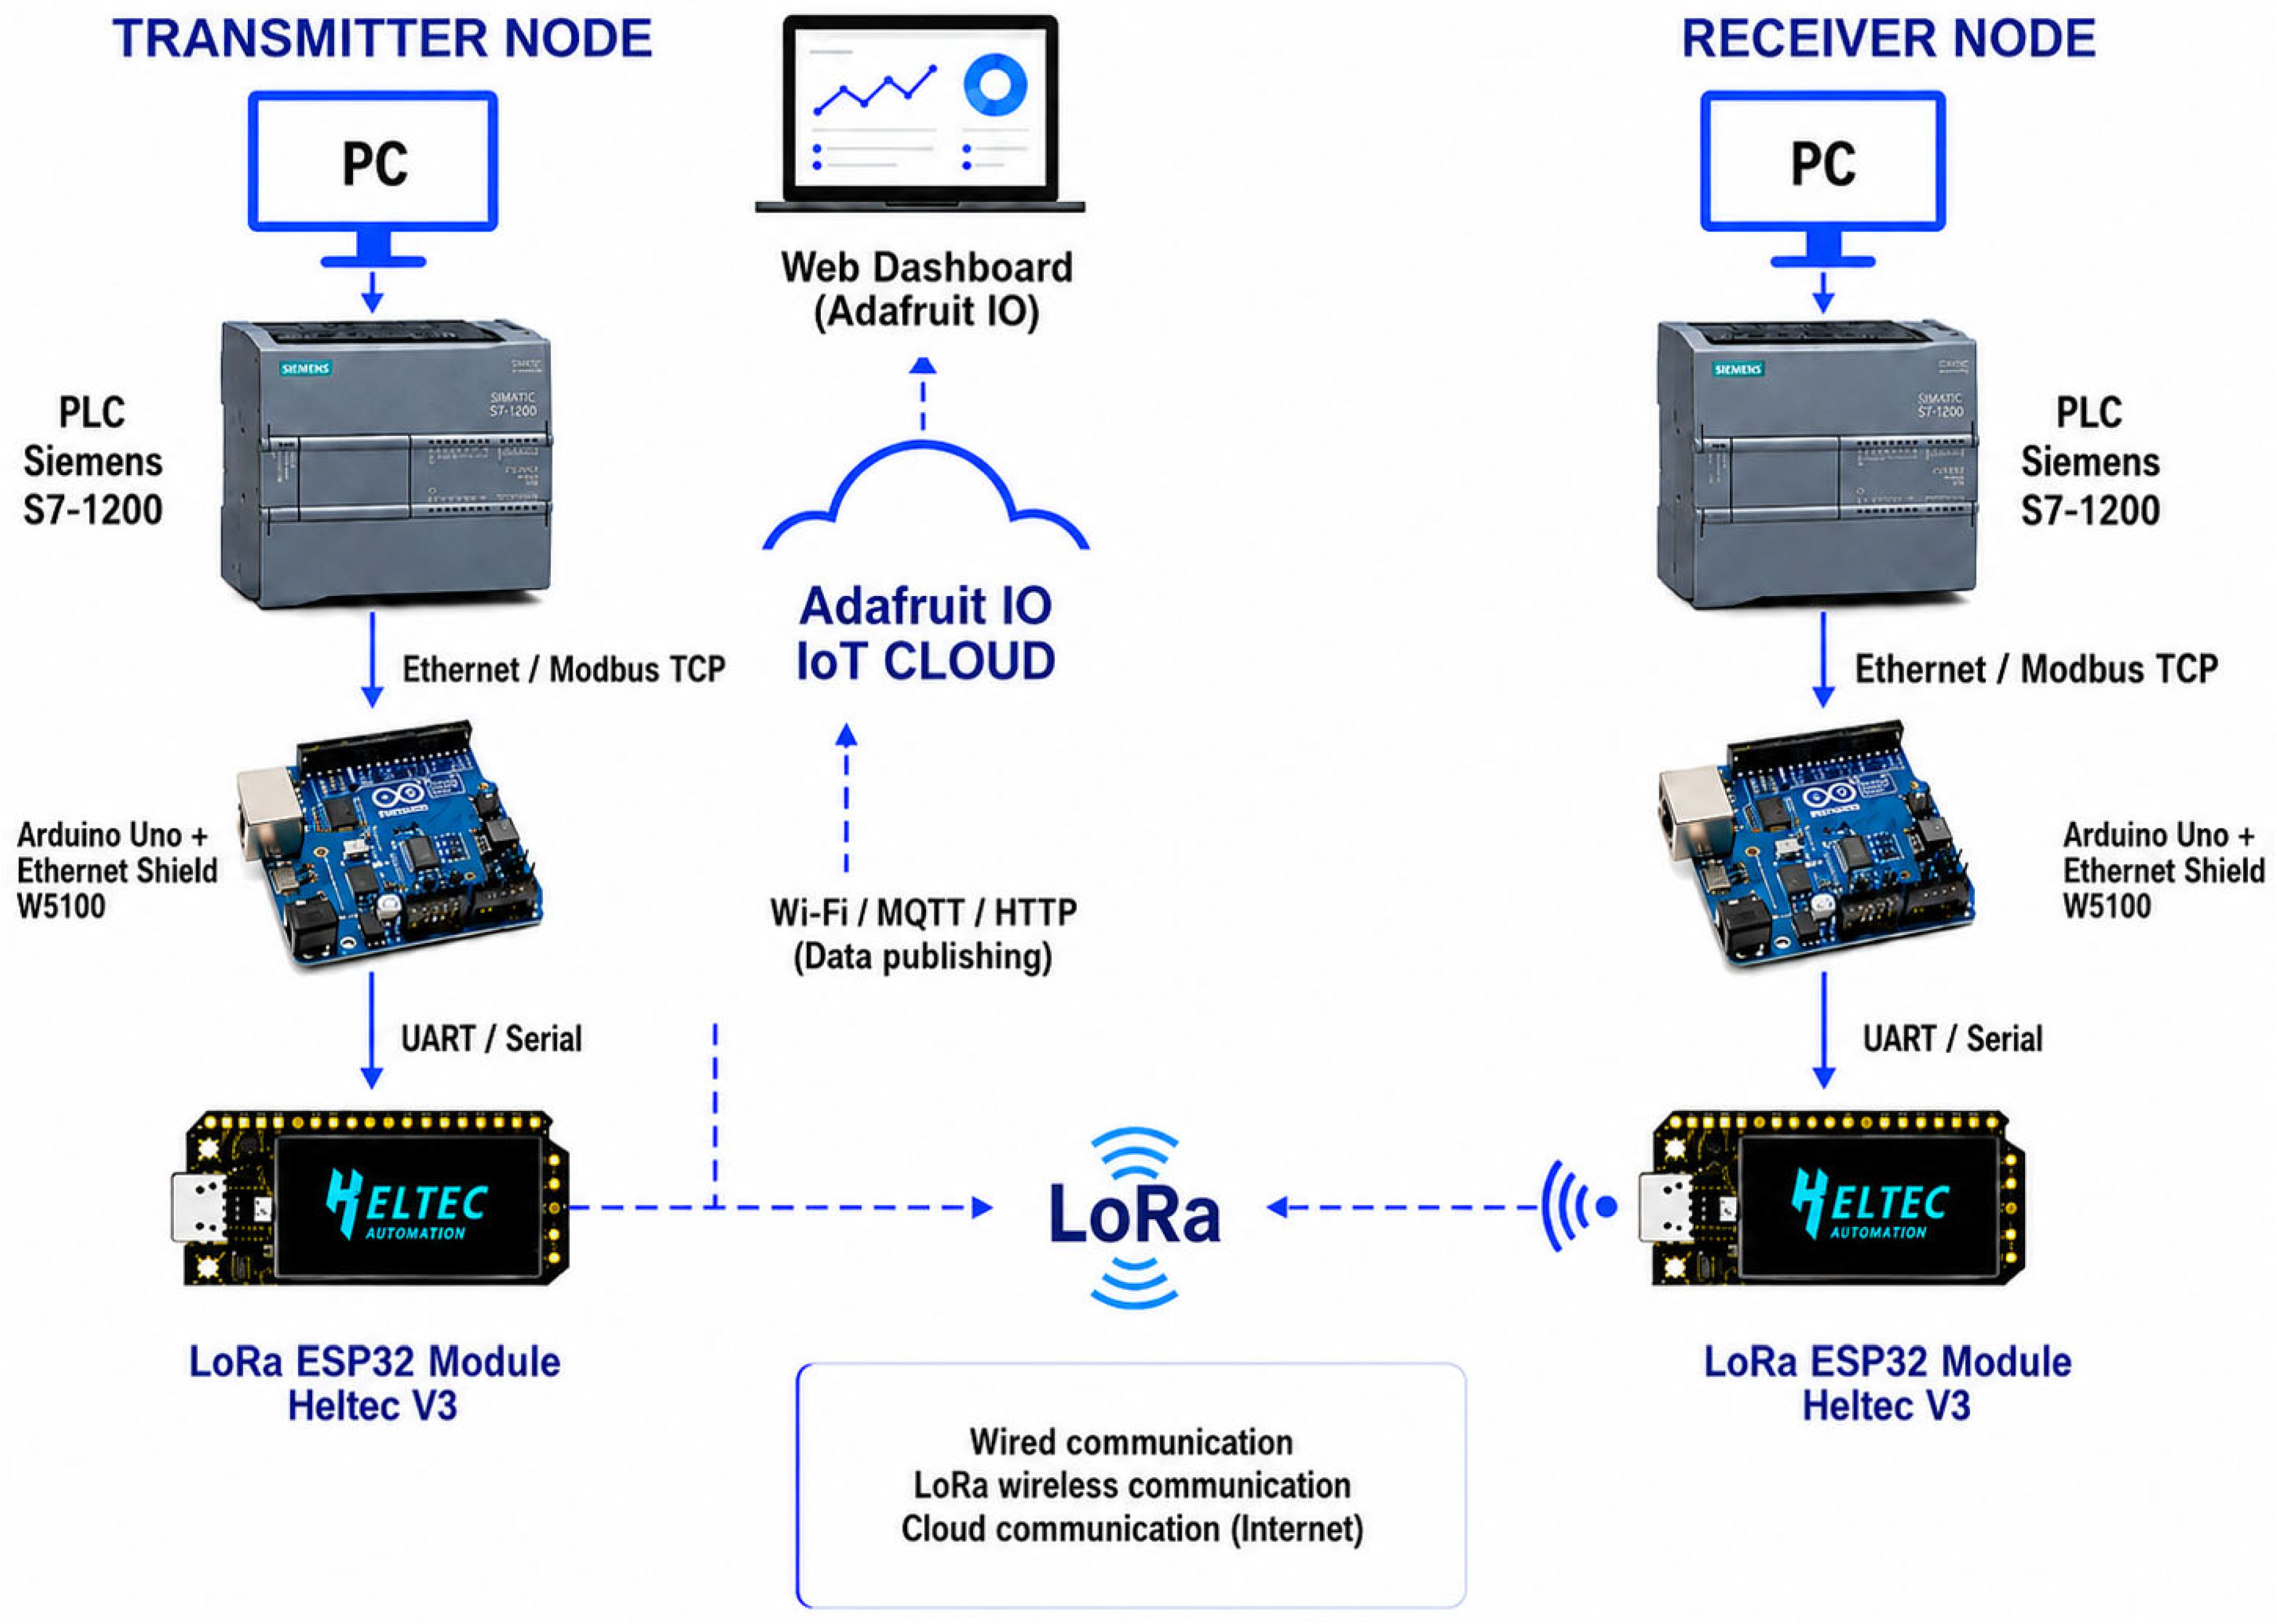
The PLC was programmed in TIA Portal and connected to the Arduino-W5100 over Ethernet using Modbus TCP [31]. Arduino collected the selected PLC variables and forwarded them by UART to the Heltec LoRa ESP32, which performed the wireless transmission. Control therefore stayed in the PLC; the remaining devices only carried the data.
Adafruit IO displayed the system variables through feeds and web dashboards. Because supervision was kept separate from industrial control, users could view tank level, actuator states, and LoRa-link conditions without changing the PLC program. Figure 2 summarizes the complete transmitter–receiver architecture.
Figure 2.
General architecture of the IoT system for level monitoring and control using an S7-1200 PLC and a point-to-point LoRa link.
2.3. Equipment and Software Used
Hardware and software were chosen to match the available industrial automation equipment, support the required protocols, and allow the prototype to be assembled in modules. Table 1 lists each component and its role in the system.
Table 1.
Equipment and software used in the proposed architecture.
2.4. Process Variables
The variables were selected from the level-control sequence and from the states of the simulated actuators. Tank level was the main analog value. Digital variables reported the pump, valves, alarms, and the status of the LoRa link. The selected variables are summarized in Table 2.
Table 2.
Process variables considered for level monitoring and control.
2.5. Configuration of the Siemens S7-1200 PLCs
The Siemens S7-1200 PLCs were first configured in TIA Portal. The tank variable, pump and valve commands, and the addresses needed for Modbus TCP communication with the Arduino-W5100 were defined in the PLC project. This division left the control program inside the PLC and placed external communication in the bridge hardware.
2.6. PLC-LoRa Communication Bridge
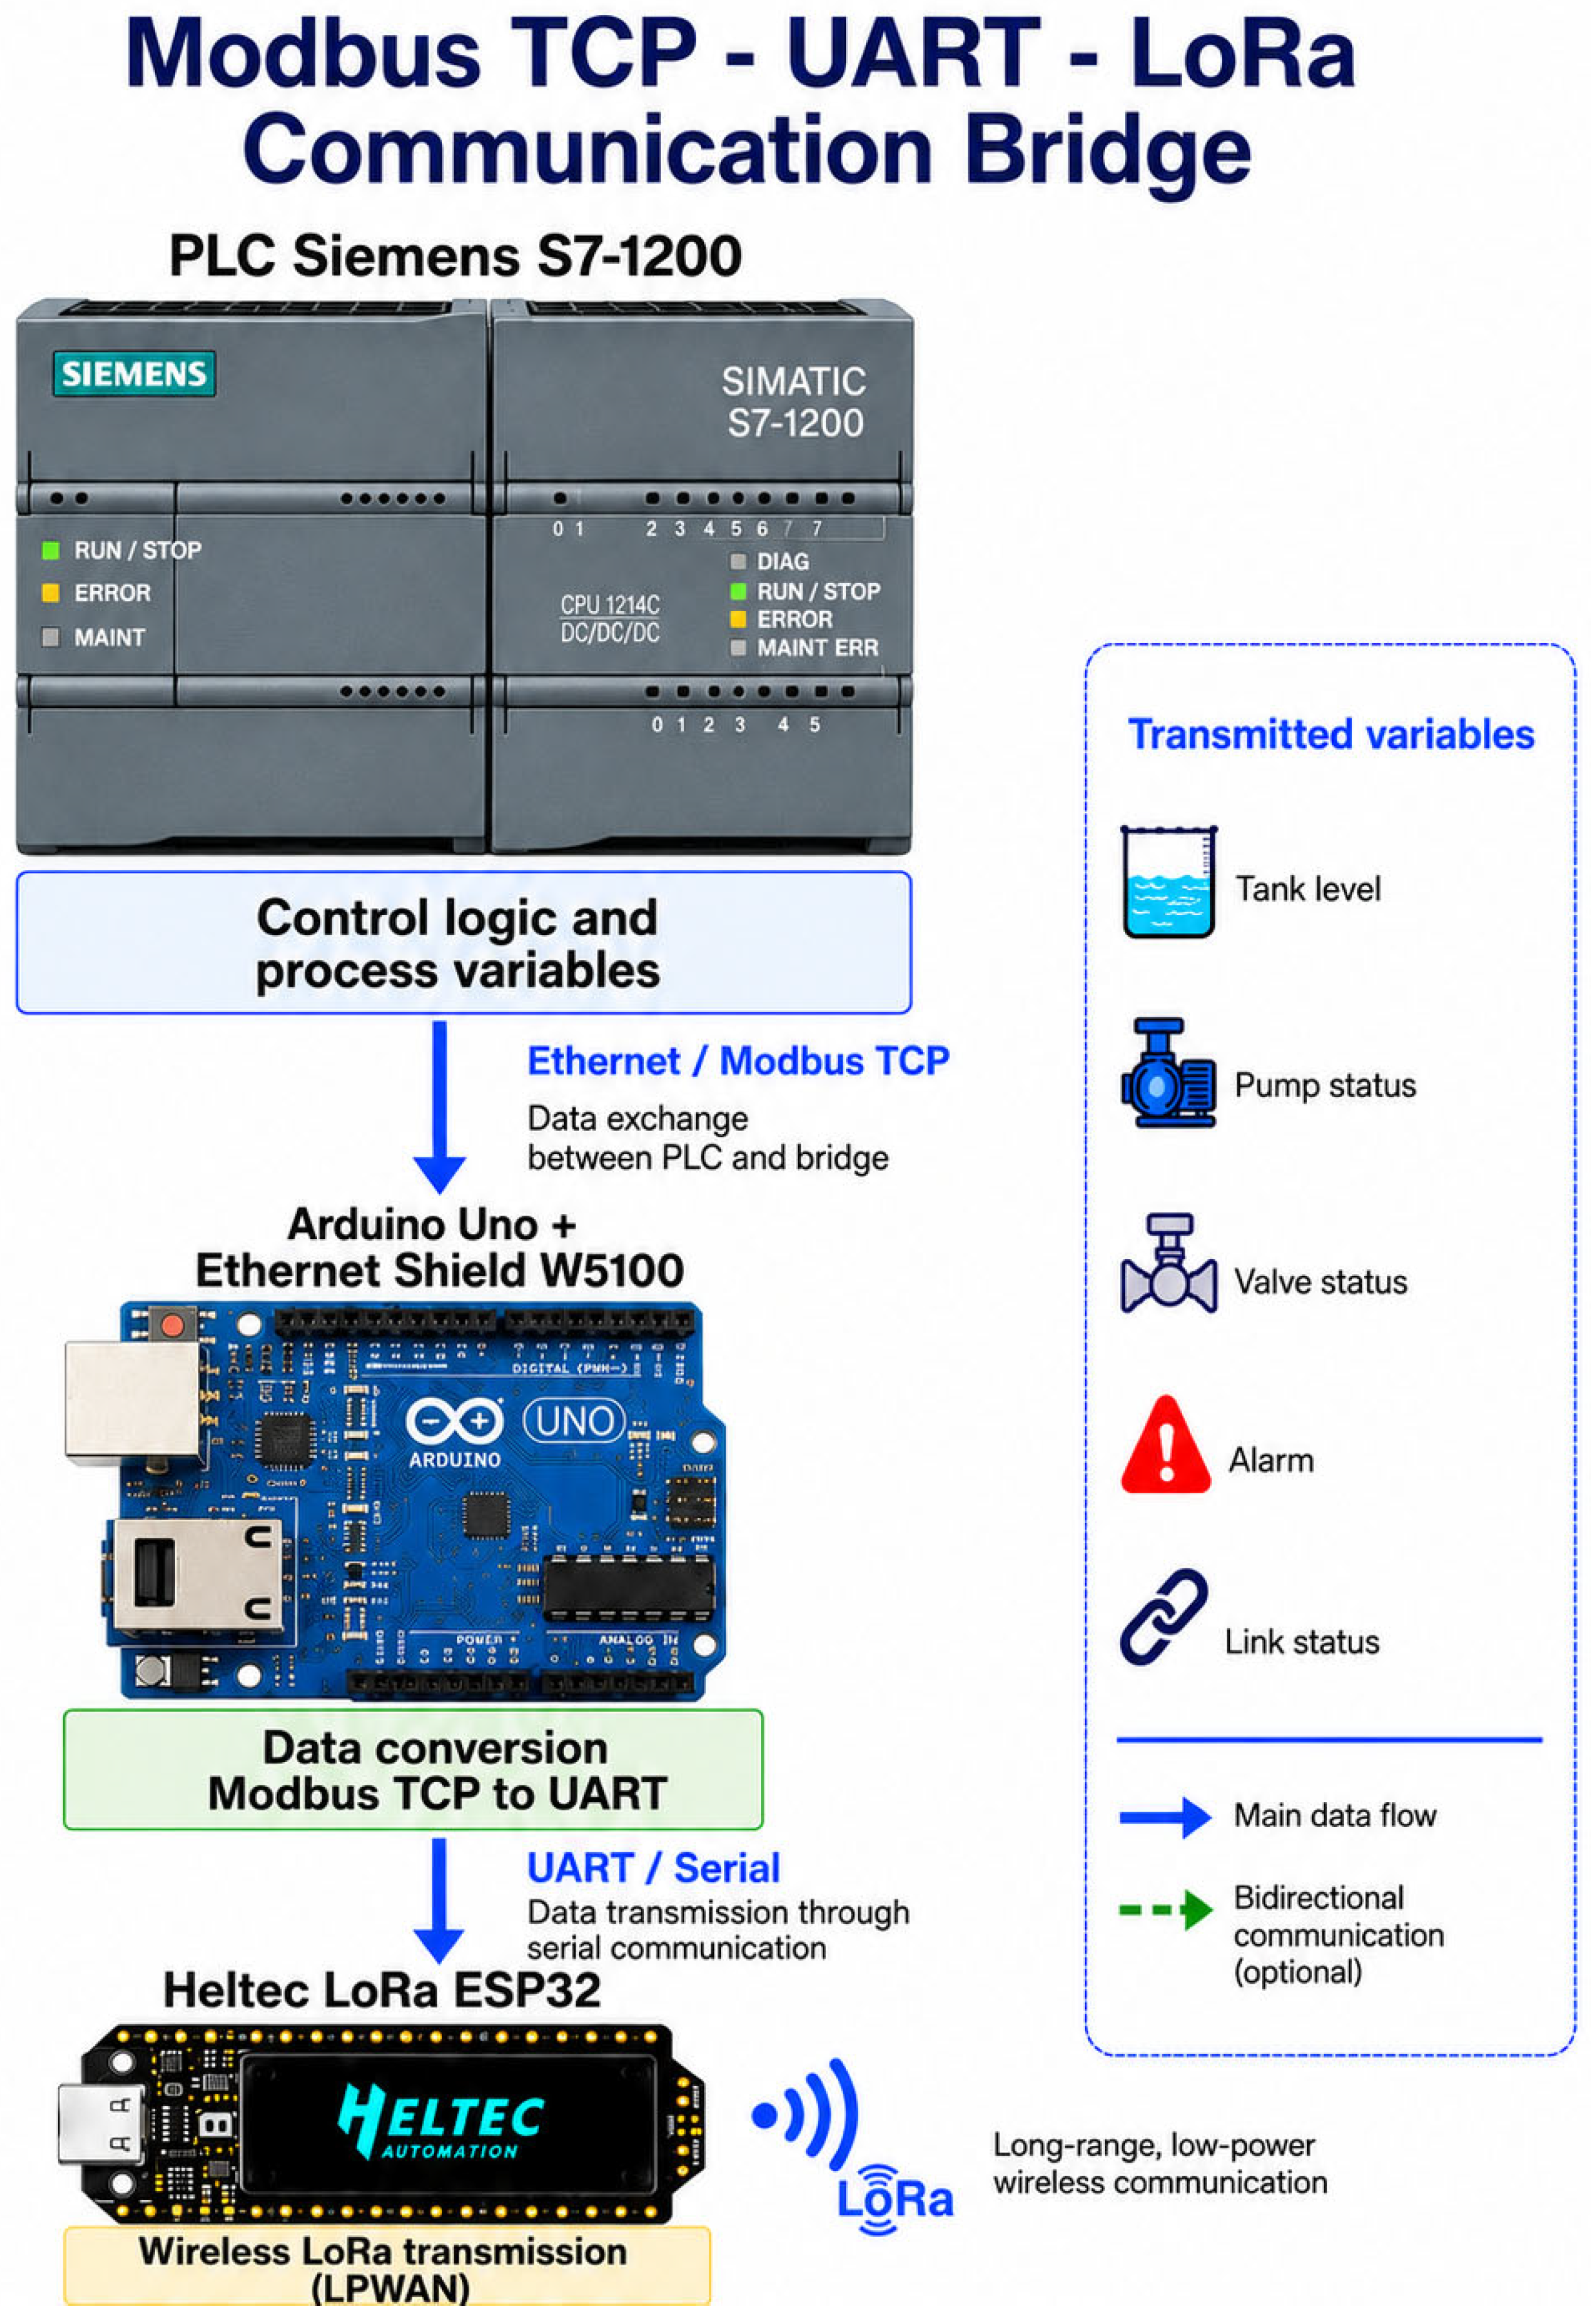
The PLC-LoRa bridge used an Arduino Uno with an Ethernet Shield W5100 because this hardware provided the RJ45 interface available for Modbus TCP to connect to the Siemens S7-1200. Arduino read the PLC registers, arranged the selected variables in a serial frame, and sent the frame to the Heltec LoRa ESP32. The UART link operated at 9600 bit/s with 8 data bits, no parity, and 1 stop bit (8N1).
All decisions for the pump, valves, and alarms remained in the PLC. Arduino did not control the process. Its task was to maintain the Ethernet connection through the W5100, read the Modbus TCP registers, and pass those values to the ESP32 over UART. This choice reflected both the hardware available for the study and the intention to keep industrial control separate from wireless communication.
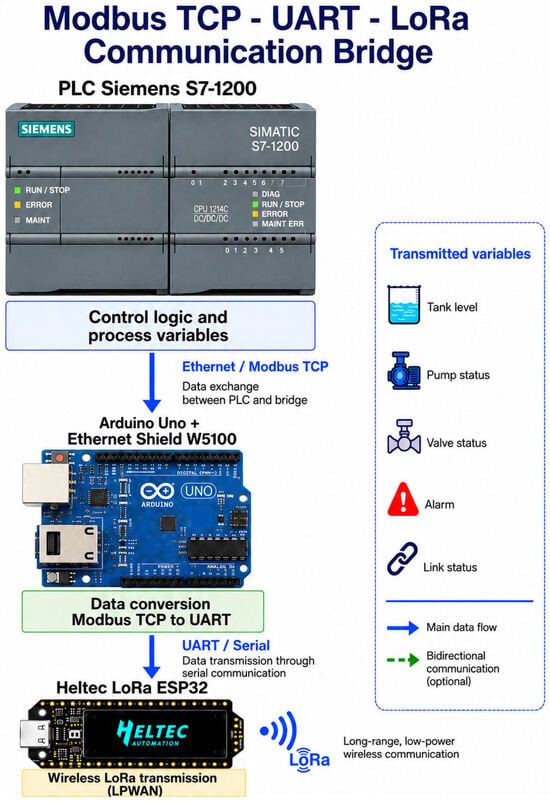
A design based solely on the ESP32 could connect directly to a Modbus TCP client through Wi-Fi or an external Ethernet controller, thereby reducing both the component count and the number of protocol stages. The Arduino-W5100 bridge was retained because it was the wired RJ45 hardware available for the study, allowed existing Modbus TCP code to be reused, reduced development time, and permitted the Ethernet and LoRa sections to be debugged independently. At 9600 bit/s with 8N1 framing, each transmitted byte occupies 10 serial bits (approximately 1.04 ms per byte); therefore, UART serialization, buffering, and parsing necessarily contributed to the minimum recorded delay of 361 ms. However, the payload length and stage-specific timestamps were not retained, so the exact UART contribution cannot be isolated, and the total delay should not be attributed solely to the LoRa radio. Figure 3 summarizes the Modbus TCP–UART–LoRa communication bridge.
Figure 3.
Modbus TCP-UART-LoRa communication bridge of the proposed architecture, showing the separation between PLC control logic and wireless transmission.
2.7. LoRa ESP32 Module, Antenna, and Radio Frequency
Two Heltec LoRa ESP32 boards provided the wireless link. Each board combines an ESP32 controller, a LoRa transceiver, and an OLED display. The boards received the serial frame from the Arduino, sent it out, and displayed information to help confirm reception. The process generated a small data payload, so the range and energy demand were more important than a high data rate [32,33].
Each LoRa board was equipped with an external sub-GHz antenna. During the measurements, node height, orientation, and position were kept as stable as field conditions allowed because even small changes can affect RSSI, SNR, recorded latency, and packet reception. The antenna model, nominal gain, radiation pattern, polarization response, and cable/connector losses were neither recorded nor calibrated. Therefore, unknown pattern nulls or polarization mismatch, together with local multipath propagation, could contribute to non-monotonic RSSI values, including the lower RSSI at 10 m than at 20 m. The reported metrics describe the installed configuration as a whole—radio, antenna, settings, firmware, and propagation environment—and should not be interpreted as a general performance specification for all ESP32/LoRa modules.
LoRa employs the Chirp Spread Spectrum (CSS), spreading each symbol across the channel bandwidth as a chirp. Its processing gain and chirp correlation allow reception at negative SNR and improve resistance to noise, narrowband interference, and some multipath effects [33]. These characteristics strengthen the radio link, but they are not encryption. In a LoRaWAN network, upper-layer AES-128 mechanisms add device authentication, message integrity, and payload confidentiality [34].
2.8. Simulation in Factory I/O
Before the radio campaign, the level process was reproduced in Factory I/O. The main PLC read the simulated tank level and operated the pump and valves according to the programmed sequence. Testing the logic in simulation reduced the risk of making the first adjustments on a physical plant [17,18].
2.9. Experimental Configuration and LoRa Communication Test
Field tests were conducted in an open area in Lasso, Latacunga. The transmitter remained fixed with its antenna at 5 m. The receiver antenna was positioned at a height of 2 m and moved through twelve locations from 10 to 120 m in 10 m intervals. At each location, 100 frames were transmitted, for a total of 1200 transmissions. For each distance, the values displayed by the LoRa module and its firmware were recorded in consolidated form in a spreadsheet: RSSI, SNR, calculated latency, packets sent, received, and lost, and reception percentage. The OLED displays were checked on site to confirm transmission and reception. The distance campaign covered the 915 MHz LoRa link; Modbus TCP remained on wired Ethernet through TCP port 502. Frames were sent once, without automatic retries. Each distance was evaluated in one session, and the irregular results at 10, 70, and 120 m were not repeated. Reception, RSSI, SNR, and the recorded single-attempt latency were used to evaluate link quality.
The experimental configuration was as follows. The radio path used a Heltec LoRa ESP32 transmitter and a receiver in point-to-point configuration. The Arduino-ESP32 UART interface operated at 9600 bit/s, with 8 data bits, no parity, and 1 stop bit (8N1). The transmitting antenna was installed at 5 m, whereas the receiving antenna was placed at 2 m. At each point, 100 frames were transmitted, for a total of 1200 transmissions. LoRa operated at 915 MHz with a bandwidth of 125 kHz within the 915–928 MHz reference band. External sub-GHz antennas with SMA/IPEX connectors were used, although their model, gain, radiation pattern, and polarization response were not recorded. The PLC-Arduino connection used Ethernet/Modbus TCP on port 502. Adafruit IO used 2.4 GHz Wi-Fi for supervision and was outside the LoRa distance test. The spreading factor, coding rate, and transmission power were not retained in a verifiable record and were therefore excluded from the quantitative interpretation.
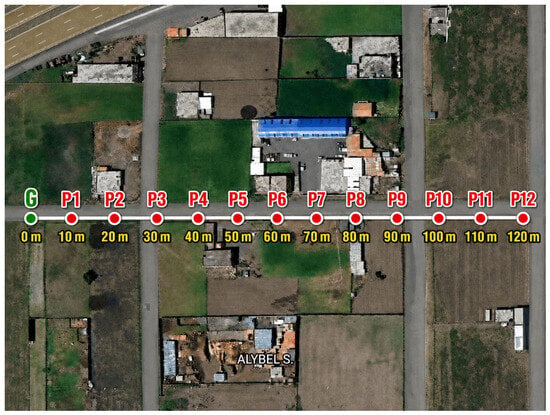
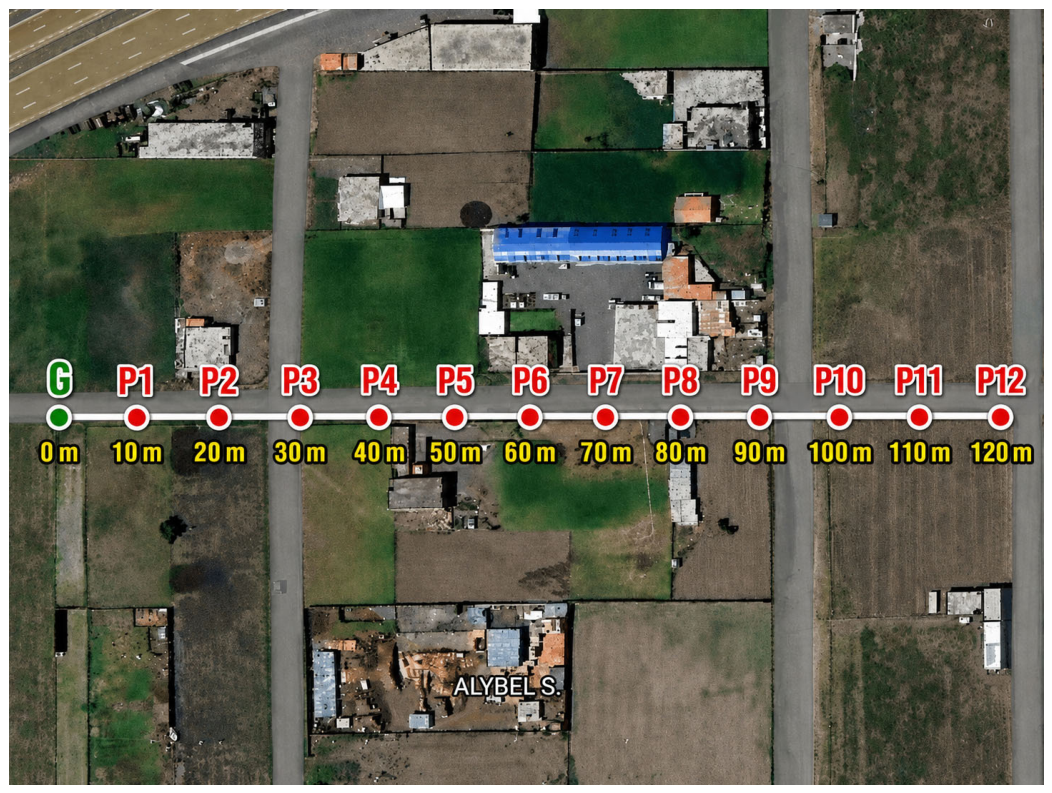
For the field route, the receiver moved sequentially from P1 to P12. Consecutive locations were 10 m farther from the transmitter, producing observations across the full 10–120 m range shown in Figure 4.
Figure 4.
Location of the test points used to evaluate LoRa communication. Note: G denotes the fixed transmitter position, and P1–P12 denote the receiver test locations.
At each point, the available record was examined in terms of packet reception, packet loss, firmware-calculated latency, RSSI, and SNR. Together, these values indicated whether the frame arrived and how link conditions changed along the route.
The consolidated spreadsheet retains, for each of the twelve distances, the columns test, distance (m), calculated RSSI (dBm), calculated SNR (dB), calculated latency (ms), sent, received, lost, and reception (%). RSSI and SNR values were read from the LoRa module, whereas latency corresponds to the value displayed by the firmware during each test. Independent timestamps and reception acknowledgments were not retained to verify a one-way measurement or calculate round-trip time (RTT). Therefore, the manuscript reports this field as a timing indicator of the evaluated configuration, without attributing it to automatic synchronization between the nodes. Each frame had a single attempt, and no automatic retries were applied.
Equation (1). Packet-reception rate.
Equation (2). Packet loss.
Equation (3). Average recorded latency.
Equation (4). Mean RSSI.
Equation (5). Mean SNR.
Equation (6). Range of recorded latency.
Equation (7). RSSI change between the end points.
where the field campaign did not include a separate spectrum analyzer measurement. The noise level was therefore estimated at each point from the receiver readings as Nest (dBm) = RSSI (dBm) − SNR (dB). This is a packet-level estimate, not a calibrated measurement of the ambient noise floor.
2.10. Criterion for Analyzing the Influence on Control Quality
The LoRa path was deliberately kept outside the fast feedback loop. Tank level, pump operation, and valve commands continued to be processed locally by the PLC. For that reason, the study does not link the wireless network to overshoot, settling time, or tracking error; those control indicators were not tested under packet loss. Communication was considered at two levels. Local control continuity did not rely on the radio link, whereas remote supervision or future remote commands could be affected by late or missing frames. No strict real-time deadline was specified, so the results are relevant to slow-process supervision but do not demonstrate deterministic wireless control.
Pr = packets received.
Pe = packets sent.
Li = latency value calculated by the firmware in each test.
n = total number of measurements.
RSSI = received signal strength.
SNR = signal-to-noise ratio.
Lmax = maximum recorded latency value.
Lmin = minimum recorded latency value.
2.11. Analysis and Reproducibility Strategy
The data were examined in two stages. First, reception, packet loss, recorded latency, RSSI, and SNR were calculated for each distance. Equation (11) reports the difference between the maximum and minimum recorded latency divided by the 110 m route length; it is a normalized range, not the slope between the endpoints. Equation (12) reports the change in RSSI between 10 and 120 m. A least-squares regression was then fitted to the twelve points to describe the overall trends in recorded latency and RSSI. The resulting slopes and R2 values were used only as descriptive statistics.
Only one 100-frame session was available for each distance. Confidence intervals and inferential tests were therefore not appropriate. The interpretation is limited to this campaign and explicitly accounts for the non-monotonic behavior observed at several points.
3. Results
The two Siemens S7-1200 PLCs exchanged information successfully through the PLC-Arduino-LoRa path. The Arduino Uno and W5100 shield converted Modbus TCP data to UART, while the PLC continued to execute the level-control program.
At every distance, the transmitted frame carried tank level and actuator-state information. The Arduino-W5100 bridge read these variables from the PLC and delivered them to the LoRa module. The receiving node obtained the frame without a direct cable connection between the two PLCs. The functional validation is summarized in Table 3, and the distance-dependent results are presented in Table 4.
Table 3.
Functional validation of the implemented architecture.
Table 4.
Experimental LoRa communication results as a function of distance.
Factory I/O displayed the level process as it evolved. When the simulated tank reached the programmed thresholds, the PLC changed the pump and valve states according to the control sequence. This confirmed the logic before the wireless link was evaluated.
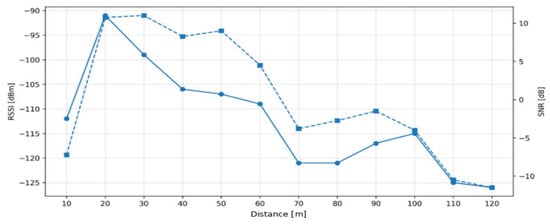
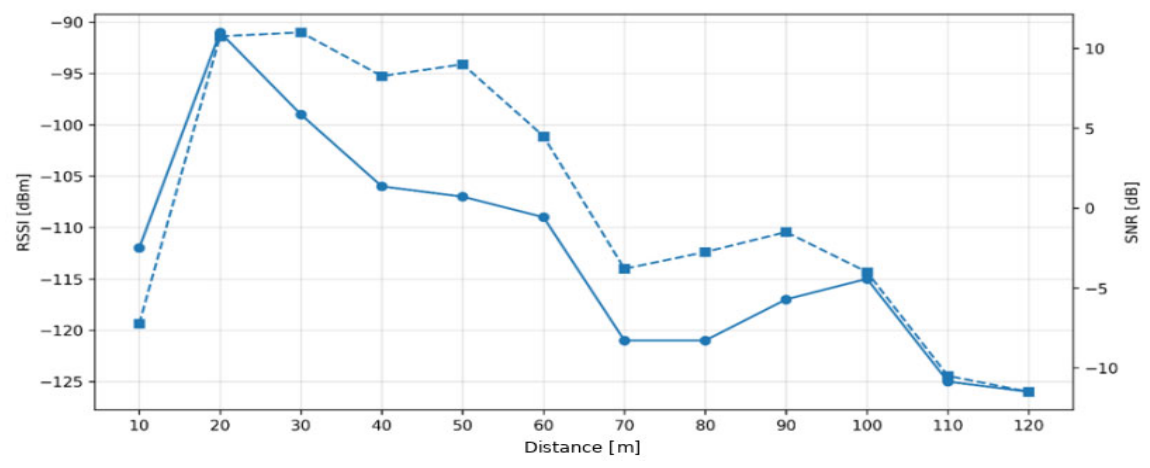
The overall behavior agrees with the type of application for which LoRa and LoRaWAN are commonly used: moving small amounts of information over distance [7,14]. RSSI, SNR, and packet reception were used to characterize the link because these measures are standard in LoRa performance studies [11,12]. The technology is also used in water-monitoring systems to push variables to storage and visualization services [15,35]. The RSSI and SNR trends are shown in Figure 5.
Figure 5.
RSSI and SNR behavior as a function of distance.
The campaign transmitted 1200 packets, of which 1130 reached the receiver. Overall reception was therefore 94.17%, and packet loss was 5.83%. The latency calculated by the firmware was not constant. It ranged from 361 to 1382 ms, with a mean of 727.17 ms. The highest recorded delays occurred mainly beyond 90 m, especially at 90, 100, and 110 m. Signal attenuation may have contributed, although local interference and changes in propagation conditions are also plausible explanations. These timing values describe this campaign and do not constitute calibrated one-way latency measurements.
Distance did not produce a uniform change at every point. RSSI was −112 dBm at 10 m but improved to −91 dBm at 20 m. At 70 m, SNR was −4 dB, and the recorded latency was 491 ms. The 120 m point also interrupted the overall trend: reception was 90%, and recorded latency decreased to 855 ms, compared with 89% and 1323 ms at 100 m, and 85% and 1382 ms at 110 m. Multipath propagation, antenna orientation, temporary obstructions, and local interference may explain part of this variation. Because antenna gain and radiation pattern were not calibrated, a location-dependent pattern null or polarization mismatch could also help explain why RSSI was worse at 10 m than at 20 m. Since no distance was repeated, the contribution of each factor cannot be separated. Distance is therefore treated as an overall trend rather than an exact point-by-point predictor.
Equation (8). Overall reception based on the packets received.
Equation (9). Overall loss based on the packets not received.
Equation (10). Latency range between the minimum and maximum values.
Equation (11). Latency range normalized by route length.
Equation (12). RSSI rate of change between the end points.
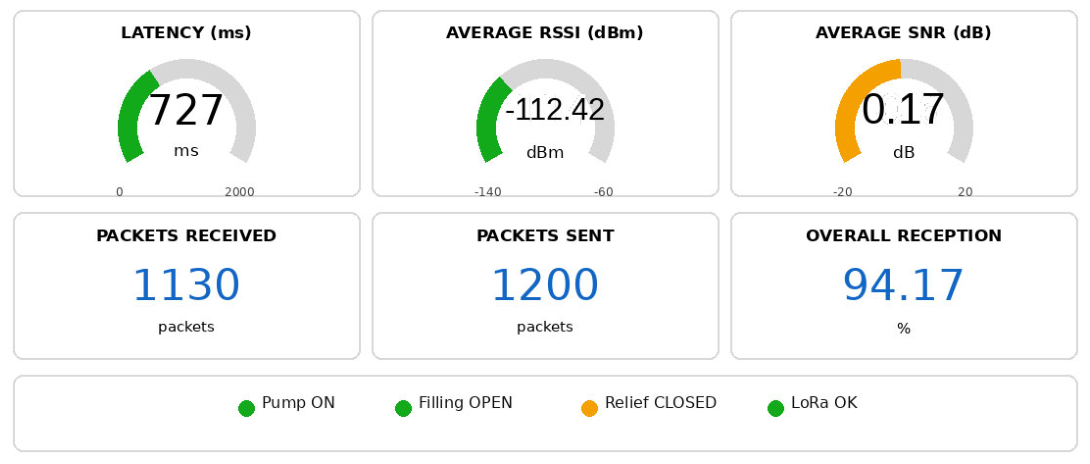
Across the twelve locations, mean RSSI was −112.42 dBm, with point averages ranging from −91 to −126 dBm. Mean SNR was 0.17 dB. Average reception was 98.33% between 10 and 60 m and 90.00% between 70 and 120 m, although adjacent points did not change monotonically. Equation (11) divides the recorded latency range (1382–361 ms) by the 110 m route and yields 9.28 ms/m; this value is a normalized range, not a regression coefficient. Equation (12) uses only the RSSI readings at 10 and 120 m and yields −0.13 dBm/m. When all twelve points were fitted, the slope of recorded latency was 8.69 ms/m (R2 = 0.672), and the RSSI slope was −0.238 dBm/m (R2 = 0.654). These regressions capture the overall trend but leave substantial local variation unexplained. The RSSI-SNR noise estimate had a mean of −112.59 dBm and ranged from −118.25 to −101.75 dBm. Because the noise floor was not measured independently, these values are reported only as estimates.
3.1. Effect of Recorded Latency and Packet Loss on the Control System
The mean recorded latency was 727.17 ms, and the maximum was 1382 ms. These values show that the implementation operates on a timing scale of hundreds of milliseconds; however, because clock synchronization was not verified, they should not be interpreted as an exact one-way latency measurement. A loss rate of 5.83% corresponds to approximately one missing frame in every seventeen transmissions. The observed delay and packet loss made the dashboard information less current and, without reception acknowledgment, could postpone or prevent a remote command.
The filling and emptying sequence remained unchanged during the tests because the PLC already contained the variables and logic required to operate the pump and valves. The link can therefore support monitoring of a relatively slow level process. The available evidence is not sufficient for safety interlocks, emergency stops, or fast control loops. Remote commands would require additional safeguards, including acknowledgments, bounded retries, timestamps, stale-data checks, timeouts, and a safe local mode after communication loss.
3.2. Remote Visualization Through Adafruit IO
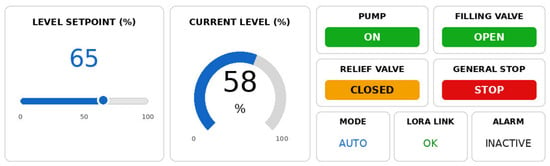
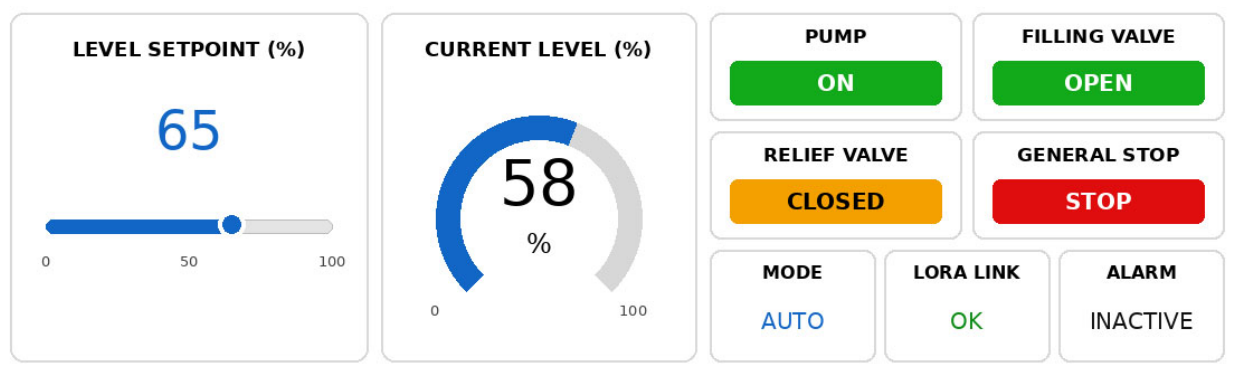
Remote supervision was extended to a web dashboard in Adafruit IO. The dashboard used feeds for the level setpoint, measured level, pump state, filling-valve state, relief-valve state, general stop, operating mode, LoRa-link state, and alarm condition. This arrangement placed the key process and link variables on one screen. Adafruit IO remained a visualization layer, while the PLC continued as the main controller [20].
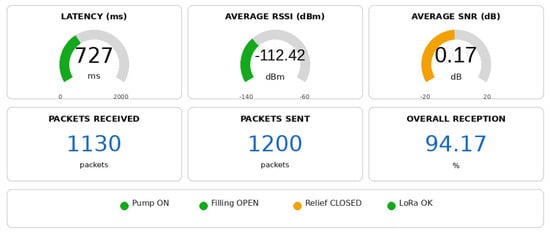
Figure 6 and Figure 7 show the two dashboard views used during supervision. Figure 6 combines the setpoint and current level with the states of the pump, valves, operating mode, alarm, and LoRa link. Figure 7 shows the dashboard field labeled “latency,” which in this manuscript corresponds to the firmware-calculated latency indicator described in Section 2.9, together with RSSI, SNR, packets sent, packets received, and reception. Table 5 contains the consolidated values used for interpretation. The interface therefore allows the operator to review process conditions and communication behavior from the same remote platform.
Figure 6.
Control view of the Adafruit IO dashboard for the level system.
Figure 7.
Monitoring view of the LoRa–link metrics on the Adafruit IO dashboard.
Table 5.
Quantitative indicators obtained from the LoRa communication tests.
3.3. Importance of Link-Quality Metrics
RSSI, SNR, and reception describe different parts of the wireless link. RSSI indicates the power observed at the receiver, SNR places that signal in relation to noise, and reception records the practical outcome—whether the process frame arrived. A frame cannot be judged from RSSI alone. Reading the three metrics together helps identify locations where communication still works but has less margin and a higher risk of late or missing information.
The three metrics did not order the test points in the same way. At 100 m, for instance, RSSI was −115 dBm, but reception was only 89%. At 70 and 80 m, RSSI was lower at −121 dBm, yet reception reached 90% and 94%, respectively. This result shows why RSSI, SNR, and reception should be considered together. In an uncontrolled outdoor setting, none of them is a deterministic predictor on its own.
The measured ranges should not be treated as a universal specification for the Heltec ESP32. They describe the operating envelope of the particular hardware, antennas, firmware, settings, and site used in this campaign. Their practical purpose is to indicate when antenna placement, radio settings, location, or acknowledgment mechanisms may need to be revised before deployment.
4. Discussion
The results show that an S7-1200 control system can be connected to an external IoT layer without transferring its main logic out of the PLC. This is consistent with recent IIoT research that links established automation equipment to digital platforms, industrial communication, and remote supervision [4,30]. Keeping local control separate from the IoT interface also contributes to resilience, an Industry 5.0 objective because the process can continue locally if the external connection is interrupted [5].
The architecture differs from the tank-automation system reported by Abubeker and Nuthalapati [21]. Their solution is embedded, whereas the present design retains the PLC, uses an industrial process simulation, and sends variables through a Modbus TCP-UART-LoRa path. Arduino-W5100 and LoRa are therefore communication resources outside the controller rather than the location of the control logic.
4.1. Comparison with Similar Studies
Table 6 compares the studies using the same practical questions: What is the application? Where are control and processing performed? Which communication route is used? What experimental evidence is reported? This avoids reducing the comparison to the simple presence or absence of a PLC.
Table 6.
Structured comparison with related studies.
The comparison makes clear that the PLC is not proposed as a novel substitute for a microcontroller. The contribution comes from combining existing industrial control, protocol conversion, and a quantitative radio-link assessment, while separating ordinary supervision from time-critical control requirements.
Cost-Effectiveness, Energy Efficiency, and Architecture Selection
The reviewed systems use different combinations of microcontrollers, cloud services, and LoRa/LoRaWAN [15,21,22,24]. In [21], acquisition, communication, and automation are integrated into a compact embedded design. The present architecture distributes those tasks: the PLC performs local control, the Arduino-W5100 provides Ethernet and Modbus TCP, and the ESP32-LoRa handles the radio link. A compact embedded design may be preferable for a new stand-alone installation. A PLC-based design can be attractive when an existing program, field inputs and outputs, and established maintenance practices must be retained.
No equivalent comparison of purchase cost, engineering effort, maintenance, or energy consumption was included in the experiment. The study therefore does not claim that the PLC option is cheaper or more energy efficient. Cost-effectiveness would require a life-cycle assessment, and energy efficiency would require measurements from both architectures under comparable operating cycles. The evidence supports only the functional benefits observed here: local control continued, and communication failures remained isolated from the process logic.
4.2. Implications of Recorded Latency and Packet Loss
Frames were still received at 120 m, although the second half of the route generally showed weaker link conditions. The change was not continuous. RSSI at 10 m was worse than at 20 m, and the 120 m point had better reception and recorded latency than the 100 and 110 m points. Outdoor campaigns often show similar local variation because of multipath propagation, shadowing, antenna orientation, temporary obstacles, and interference [22]. In this campaign, the uncalibrated antenna gain and radiation pattern provide an additional possible explanation for the 10 m anomaly. The overall reception rate of 94.17% only applies to this hardware, site, and test session. The evaluated radio path was point-to-point LoRa rather than a LoRaWAN network, and it did not use encryption or authentication. The packet-loss and latency values are also specific to the unverified spreading factor, coding rate, and transmission-power configuration used by the firmware/library during the test. Local PLC operation was unaffected. However, a critical command that depended on this link could arrive late or fail to arrive; that scenario was outside the experiment.
4.3. Study Limitations
The hydraulic process was evaluated in Factory I/O rather than in a physical plant with installed sensors. Each distance was represented by one 100-frame session, and the unusual points at 10, 70, and 120 m were not repeated. Repeatability and within-location variation therefore cannot be quantified. In addition to distance, multipath propagation, temporary obstructions, radio interference, and antenna orientation may have influenced the measurements. The antenna model, nominal gain, radiation pattern, polarization response, and connector/cable losses were not calibrated, which limits interpretation of the non-monotonic RSSI behavior. The spreading factor, coding rate, and transmission power could not be recovered from a verifiable firmware record; consequently, the reception, packet-loss, and latency conclusions are specific to the unverified library configuration used in this campaign. In addition, no verifiable record of clock synchronization between the nodes was retained. The “calculated latency” field in the data sheet is therefore interpreted as a firmware timing indicator rather than a calibrated one-way latency or RTT. These limitations do not eliminate the value of the feasibility test, but they restrict the conclusions to the recorded configuration and campaign.
4.4. Scope of the Scientific Contribution
The work goes beyond assembling a set of devices. It separates PLC control from wireless communication, documents the complete Modbus TCP-UART-LoRa path, and evaluates that path through reception, packet loss, firmware-calculated latency, RSSI, and SNR. This structure allows the continuity of local control and the limitations of remote supervision to be analyzed separately.
The most transferable part of the study is its evaluation procedure. It shows how a modular architecture can be characterized, compared with related work, and reported without hiding irregular data points behind a single overall trend. The numerical results are specific to the evaluated hardware, antennas, radio settings, and propagation environment and are not presented as universal values. Because SF, CR, and transmission power were not retained in a verifiable form, packet loss and recorded latency should be interpreted only for this campaign and not as a reproducible performance specification for the Heltec platform.
5. Conclusions
An IoT architecture was designed and implemented to monitor and control levels through LoRa communication between Siemens S7-1200 PLCs. Factory I/O, the PLCs, an Arduino Uno, an Ethernet Shield W5100, and Heltec LoRa ESP32 modules were integrated in the prototype. The PLC remained the process controller; the external hardware formed the communication layer. The practical contribution is the separation of local control from wireless communication and the experimental definition of the operating range of that external layer.
Taken as a whole, the study offers a method for adding and evaluating a communication layer without removing process control from the PLC. The radio link is examined with complementary metrics, descriptive regressions, comparison with related work, and an explicit account of the experiment’s limitations.
The Arduino-W5100 bridge communicated with the PLC through Modbus TCP and transferred the variables to the LoRa board over UART at 9600 bit/s in 8N1 format. Arduino did not control the tank. It provided the Ethernet interface, read the PLC registers, and transferred their values to the ESP32. As a result, the S7-1200 retained the logic, and the wired and wireless sections could be evaluated independently. The 9600 bit/s serial stage necessarily added serialization, buffering, and parsing time.
The field campaign produced 94.17% overall reception, 5.83% packet loss, and a mean recorded latency value of 727.17 ms. Link conditions generally became less favorable with distance, although RSSI, SNR, reception, and recorded latency did not change monotonically at every location. The results support the link as a supervision channel for a slow process. They do not demonstrate its suitability for a time-critical wireless control loop. The packet-loss and timing results remain specific to the unverified radio configuration used during the campaign.
Factory I/O was used to verify the level sequence in simulation, and Adafruit IO served as the remote supervision layer. The conclusions only apply to the tested arrangement: a simulated process, 915 MHz LoRa, a 5 m transmitting antenna, a 2 m receiving antenna, and the parameters that were actually recorded. The experiment did not evaluate physical sensors, a verified spreading factor, coding rate, transmission power, calibrated antenna gain, radiation pattern, synchronized one-way timing, an independently measured noise floor, total cost, or comparative energy use. It also did not place the control loop on the network. Accordingly, no economic, energy-efficiency, deterministic-control, or calibrated one-way-latency advantage is claimed beyond the measurements reported.
Author Contributions
N.M.H.A., L.O.F., L.N. and G.I.Y. contributed to the conception and design of the study, data acquisition and analysis, and the drafting or critical revision of the manuscript. All authors have read and agreed to the published version of the manuscript.
Funding
This research received no external funding.
Data Availability Statement
The data used in this study correspond to actual measurements collected during the field campaign. The consolidated spreadsheet includes the columns Test, Distance (m), Calculated RSSI (dBm), Calculated SNR (dB), Calculated Latency (ms), Sent, Received, Lost, and Reception (%). These values support the twelve points reported in Table 4. Individual records for each of the 1200 frames were not retained.
Conflicts of Interest
The authors declare no conflict of interest.
References
- Román-Salinas, R.V.; Díaz-Martínez, M.A.; Ruíz-Hernández, S.; Cervantes-Zubirías, G.; Morales-Rodríguez, M.A. El internet de las cosas y la industria 4.0: Aplicaciones en el campo de la ingeniería industrial. Rev. UIS Ing. 2024, 23, 111–130. [Google Scholar] [CrossRef] [Scilit]
- Soori, M.; Arezoo, B.; Dastres, R. Internet of Things for Smart Factories in Industry 4.0, a Review. Internet Things Cyber-Phys. Syst. 2023, 3, 192–204. [Google Scholar] [CrossRef] [Scilit]
- Folgado, F.J.; Calderón, D.; González, I.; Calderón, A.J. Review of Industry 4.0 from the Perspective of Automation and Supervision Systems: Definitions, Architectures and Recent Trends. Electronics 2024, 13, 782. [Google Scholar] [CrossRef] [Scilit]
- Liu, Z.; Davoli, F.; Borsatti, D. Industrial Internet of Things (IIoT): Trends and Technologies. Future Internet 2025, 17, 213. [Google Scholar] [CrossRef] [Scilit]
- van Erp, T.; Carvalho, N.G.P.; Gerolamo, M.C.; Gonçalves, R.; Rytter, N.G.M.; Gladysz, B. Industry 5.0: A new strategy framework for sustainability management and beyond. J. Clean. Prod. 2024, 461, 142271. [Google Scholar] [CrossRef] [Scilit]
- Maddikunta, P.K.R.; Pham, Q.-V.; Prabadevi, B.; Deepa, N.; Dev, K.; Gadekallu, T.; Ruby, R.; Liyanage, M. Industry 5.0: A survey on enabling technologies and potential applications. J. Ind. Inf. Integr. 2022, 26, 100257. [Google Scholar] [CrossRef] [Scilit]
- Bonilla, V.; Campoverde, B.; Yoo, S.G. A Systematic Literature Review of LoRaWAN: Sensors and Applications. Sensors 2023, 23, 8440. [Google Scholar] [CrossRef] [Scilit] [PubMed]
- Jouhari, M.; Saeed, N.; Alouini, M.-S.; Amhoud, E.M. A Survey on Scalable LoRaWAN for Massive IoT: Recent Advances, Potentials, and Challenges. IEEE Commun. Surv. Tutor. 2023, 25, 1841–1876. [Google Scholar] [CrossRef] [Scilit]
- Lorincz, J.; Levarda, K.; Čagalj, M.; Kukuruzović, A. A Comprehensive Analysis of LoRa Network Wireless Signal Quality in Indoor Propagation Environments. J. Sens. Actuator Netw. 2025, 14, 111. [Google Scholar] [CrossRef] [Scilit]
- Milarokostas, C.; Tsolkas, D.; Passas, N.; Merakos, L. A Comprehensive Study on LPWANs With a Focus on the Potential of LoRa/LoRaWAN Systems. IEEE Commun. Surv. Tutor. 2023, 25, 825–867. [Google Scholar] [CrossRef] [Scilit]
- Fragkopoulos, M.; Panagiotakis, S.; Kostakis, M.; Markakis, E.K.; Astyrakakis, N.; Malamos, A. Experimental Assessment of Common Crucial Factors That Affect LoRaWAN Performance on Suburban and Rural Area Deployments. Sensors 2023, 23, 1316. [Google Scholar] [CrossRef] [Scilit] [PubMed]
- Chapungo, N.J.; Postolache, O. Experimental Evaluation of LoRaWAN Connectivity Reliability in Remote Rural Areas of Mozambique. Sensors 2025, 25, 6027. [Google Scholar] [CrossRef] [Scilit] [PubMed]
- Almuhaya, M.A.M.; Jabbar, W.A.; Sulaiman, N.; Abdulmalek, S. A Survey on LoRaWAN Technology: Recent Trends, Opportunities, Simulation Tools and Future Directions. Electronics 2022, 11, 164. [Google Scholar] [CrossRef] [Scilit]
- Alghamdi, A.M.; Khairullah, E.F.; Al Mojamed, M.M. LoRaWAN Performance Analysis for a Water Monitoring and Leakage Detection System in a Housing Complex. Sensors 2022, 22, 7188. [Google Scholar] [CrossRef] [Scilit] [PubMed]
- Wister, M.A.; Leon, E.; Alejandro-Carrillo, A.; Pancardo, P.; Hernandez-Nolasco, J.A. Using IoT for Cistern and Water Tank Level Monitoring. Appl. Syst. Innov. 2024, 7, 112. [Google Scholar] [CrossRef] [Scilit]
- Khairullah, E.F.; Alghamdi, A.M.; Al Mojamed, M.M.; Zeadally, S. LoRaWAN-based smart water management IoT applications: A review. J. Inf. Telecommun. 2025, 9, 420–446. [Google Scholar] [CrossRef] [Scilit]
- Vargas, H.; Heradio, R.; Donoso, M.; Farias, G. Teaching automation with Factory I/O under a competency-based curriculum. Multimed. Tools Appl. 2023, 82, 19221–19246. [Google Scholar] [CrossRef] [Scilit]
- Nowakowski, W.; Bojarczak, P. Simulation of automatic control systems in the Factory I/O platform. J. Autom. Electron. Electr. Eng. 2025, 7, 37–45. [Google Scholar] [CrossRef] [Scilit]
- Mishra, D.; Yadav, P.; Yadav, V.; Srivastava, R.; Agrawal, K.K.; Yadav, R.S. Adafruit IO Based Smart Irrigation System using MQTT Protocol for Urban Farming. J. Comput. Sci. 2022, 18, 374–381. [Google Scholar] [CrossRef] [Scilit]
- Zulkifli, C.Z.; Garfan, S.; Talal, M.; Alamoodi, A.H.; Alamleh, A.; Ahmaro, I.Y.Y.; Sulaiman, S.; Ibrahim, A.B.; Zaidan, B.B.; Ismail, A.R.; et al. IoT-Based Water Monitoring Systems: A Systematic Review. Water 2022, 14, 3621. [Google Scholar] [CrossRef] [Scilit]
- Abubeker, K.M.; Nuthalapati, A. Cloud Based LoRaWAN Enabled Water Tank Automation Framework. Procedia Comput. Sci. 2025, 252, 768–775. [Google Scholar] [CrossRef] [Scilit]
- Saban, M.; Bekkour, M.; Amdaouch, I.; El Gueri, J.; Ait Ahmed, B.; Chaari, M.Z.; Ruiz-Alzola, J.; Rosado-Muñoz, A.; Aghzout, O. A Smart Agricultural System Based on PLC and a Cloud Computing Web Application Using LoRa and LoRaWan. Sensors 2023, 23, 2725. [Google Scholar] [CrossRef] [Scilit] [PubMed]
- Sendra, S.; Parra, L.; Jimenez, J.M.; Garcia, L.; Lloret, J. LoRa-based Network for Water Quality Monitoring in Coastal Areas. Mob. Netw. Appl. 2023, 28, 65–81. [Google Scholar] [CrossRef] [Scilit]
- Murti, M.A.; Saputra, A.R.A.; Alinursafa, I.; Ahmed, A.N.; Yafouz, A.; El-Shafie, A. Smart system for water quality monitoring utilizing long-range-based Internet of Things. Appl. Water Sci. 2024, 14, 69. [Google Scholar] [CrossRef] [Scilit]
- Vivek, B.; Arulmurugan, A.; Maheswaran, S.; Shafiq, I.M.; Mohanaprasad, S.; Praveenkumar, P. Smart-Child Tracking System with LoRa and GPS Technology. In Proceedings of the 2024 15th International Conference on Computing Communication and Networking Technologies (ICCCNT), Kamand, India, 24–28 June 2024; pp. 1–7. [Google Scholar] [CrossRef] [Scilit]
- Maheswaran, S.; Gomathi, R.D.; Sathesh, S.; Poovizhi, S.; Ridhish, R.; Nanthakkumaran, S.; Chinnadurai, M. Intelligent Cold Chain Security: Nano Power Temperature Sensors, ESP32 and Telegram Bot Integration for Temperature Assurance and Environmental Harm Prevention. J. Environ. Nanotechnol. 2024, 13, 17–25. [Google Scholar] [CrossRef] [Scilit]
- Farahani, B.; Monsefi, A.K. Smart and collaborative industrial IoT: A federated learning and data space approach. Digit. Commun. Netw. 2023, 9, 436–447. [Google Scholar] [CrossRef] [Scilit]
- Yavuzer Aslan, F.Y.; Aslan, B. Comparison of IoT Protocols with OSI and TCP/IP Architecture. Int. J. Eng. Res. Dev. 2023, 15, 333–343. [Google Scholar]
- Mansour, M.; Gamal, A.; Ahmed, A.I.; Said, L.A.; Elbaz, A.; Herencsar, N.; Soltan, A. Internet of Things: A Comprehensive Overview on Protocols, Architectures, Technologies, Simulation Tools, and Future Directions. Energies 2023, 16, 3465. [Google Scholar] [CrossRef] [Scilit]
- Calderón, D.; Folgado, F.J.; González, I.; Calderón, A.J. Implementation and Experimental Application of Industrial IoT Architecture Using Automation and IoT Hardware/Software. Sensors 2024, 24, 8074. [Google Scholar] [CrossRef] [Scilit] [PubMed]
- Dao, Q.-T.; Nguyen, L.-T.; Ha, T.-K.; Nguyen, V.-H.; Nguyen, T.-A. Investigation of Secure Communication of Modbus TCP/IP Protocol: Siemens S7 PLC Series Case Study. Appl. Syst. Innov. 2025, 8, 65. [Google Scholar] [CrossRef] [Scilit]
- Almeida, D.A.; Altamirano, J.C.; Cañizares, M.R.; Játiva, P.P.; Guaña-Moya, J.; Sánchez, I. Gateway-Free LoRa Mesh on ESP32: Design, Self-Healing Mechanisms, and Empirical Performance. Sensors 2025, 25, 6036. [Google Scholar] [CrossRef] [Scilit] [PubMed]
- Maleki, A.; Nguyen, H.H.; Bedeer, E.; Barton, R. A Tutorial on Chirp Spread Spectrum Modulation for LoRaWAN: Basics and Key Advances. IEEE Open J. Commun. Soc. 2024, 5, 4578–4612. [Google Scholar] [CrossRef] [Scilit]
- Hessel, F.; Almon, L.; Hollick, M. LoRaWAN Security: An Evolvable Survey on Vulnerabilities, Attacks and their Systematic Mitigation. ACM Trans. Sens. Netw. 2022, 18, 70. [Google Scholar] [CrossRef] [Scilit]
- Pires, L.M.; Gomes, J. River Water Quality Monitoring Using LoRa-Based IoT. Designs 2024, 8, 127. [Google Scholar] [CrossRef] [Scilit]

Disclaimer/Publisher’s Note: The statements, opinions and data contained in all publications are solely those of the individual author(s) and contributor(s) and not of MDPI and/or the editor(s). MDPI and/or the editor(s) disclaim responsibility for any injury to people or property resulting from any ideas, methods, instructions or products referred to in the content. |
© 2026 by the authors. Licensee MDPI, Basel, Switzerland. This article is an open access article distributed under the terms and conditions of the Creative Commons Attribution (CC BY) license.