


Abstract
A quasi-static bond-based peridynamic framework combines source-connected fracture-path reconstruction with topology-triggered hydraulic loading. Local failed-bond evidence determines candidate path extensions, while source connectivity and two-sided support govern their acceptance. Each accepted extension updates the pressure-loaded boundary before mechanical equilibrium is restored. At the finest tested spacing, the computed crack openings agree with the Sneddon solution and independent finite-element solutions to within 4.3% for two orientations. Initiation-pressure errors relative to linear elastic fracture mechanics remain below 9%. The directional hydraulic-fracturing validation compares the predicted initiation pressure with the experimental value and the predicted path direction with that given by a mixed-mode criterion. The damage band widens more slowly than the connected path extends. A cavity–tunnel application isolates the role of pressure on newly formed surfaces. At a common cavity pressure, updating the loaded path produces a 40.45 mm pre-intersection equilibrium path, compared with 10.62 mm when fracture pressure is confined to the initial defect. The two loading treatments have the same initiation pressure but markedly different subsequent growth. Characterizing subsequent rock-bridge degradation therefore requires accounting for both initiation pressure and the evolving pressure-loaded boundary.
1. Introduction
Hydraulic fracturing couples fluid flow, solid deformation, and fracture growth in rock. Fluid pressure opens discontinuities, while the evolving geometry changes flow paths and pressure distribution [1]. Initial defects and stress state affect fracture initiation and trajectory [2], and natural fractures influence subsequent fracture interactions and propagation lengths [3]. Field hydraulic-jacking tests in pressure tunnels distinguish fracture opening from continued propagation [4]. Describing both initiation and the evolving pressure-loaded path is therefore important for pressure-driven rock fracture.
Numerical descriptions of hydraulic fracture differ in their treatment of discontinuities and fluid transport. The phase-field method (PFM) regularizes crack growth [5] and couples deformation with fluid flow [6]. Three-dimensional hydromechanical models capture branching in heterogeneous porous media [7]. Liu et al. [8] developed a three-dimensional hydromechanical coupled-element partition method that represents fractures within a background mesh without additional degrees of freedom. The formulation uses cubic-law-based equivalent permeability to couple fracture opening and fluid transport and captures hydraulic-fracture interaction with natural fractures. Hybrid boundary-element and finite-element formulations represent growing and intersecting fractures [9], while dynamic PFM formulations address crack-width evaluation during propagation [10]. The extended finite-element method represents growth across layered media and weak interfaces [11]. Nonlocal damage models provide another route: Liu and Xia [12] use a nonlocal damage model that couples modified stiffness degradation with damage-dependent permeability to simulate hydraulic fracturing. Interfaces and spatially variable hydromechanical properties further affect penetration, deflection, and path asymmetry [13,14].
Peridynamics (PD) describes deformation and fracture through nonlocal interactions between material points [15]. Its meshfree discretization represents initiation and propagation through local bond failure [16]. Energy-based corrections account for incomplete neighborhoods near free surfaces [17]. Dimensionless bond-based formulations also address numerical accuracy [18]. Bond-based peridynamics (BB-PD) provides the mechanical basis for the present study.
Hydromechanical BB-PD formulations have been developed for pressurized and fluid-driven fracture in fissured porous rock [19]. Ordinary state-based PD incorporates fluid–solid interaction and pressure on newly formed crack surfaces [20]. Hybrid formulations combine the finite-element method (FEM) with PD to model hydraulic fracture in saturated porous media [21]. Qin et al. introduced macroscopic fracture tracing and fracture-surface interaction in a PD hydraulic-fracture network model [22] and extended this approach to three dimensions [23]. Other PD studies address bedding interfaces [24], natural-fracture damage [25], and dual-horizon treatments of discontinuous mechanical interactions [26].
These studies establish fracture tracing and hydraulic connectivity as important parts of PD hydraulic-fracture modeling. A remaining issue for prescribed-pressure propagation is how local fracture evidence defines an admissible pressure-loaded boundary and how updating that boundary affects subsequent growth. Three objects must be distinguished: the local failed-bond field, the reconstructed macroscopic fracture path, and its source-connected pressure-loaded part. Distributed or isolated bond failure does not by itself identify a continuous surface that can receive source pressure. This distinction also affects the interpretation of initiation pressure and later fracture growth.
The present study links these three objects through a topology-triggered quasi-static BB-PD formulation. An accepted, source-connected extension changes the pressure-loaded boundary before equilibrium is restored at the current pressure. Common geometric weights make crack opening and hydraulic force transfer work-conjugate. The study aims to formulate the coupled update of the fracture path and pressure loading and assess crack opening, initiation, and directional propagation against analytical, independent numerical, and experimental references. It also aims to isolate the role of the evolving pressure-loaded boundary in cavity–tunnel rock-bridge degradation.
Section 2 presents the formulation and topology-triggered procedure. Section 3 verifies crack opening and initiation against analytical and independent FEM solutions. Section 4 compares initiation pressure with a sandstone experiment and path direction with a mixed-mode criterion. Section 5 examines cavity–tunnel rock-bridge fracture and the effect of updating the pressure-loaded boundary. Section 6 discusses the methodological scope and limitations. Section 7 presents the conclusions.
2. Bond-Based Peridynamic Hydraulic-Fracture Formulation
2.1. Bond-Based Peridynamic Solid and Fracture Model
The solid follows the classical BB-PD formulation [15,16]. A material point i interacts with points j in its initial family . The reference bond vector and relative displacement are and , respectively. The family is constructed in the initial configuration and remains fixed during fracture propagation.
The geometric bond stretch is
With and , its small-strain linearization is
The two forms are equivalent to first order. The linearized stretch in Equation (2) is used for both mechanical equilibrium and tensile bond failure throughout Section 3, Section 4 and Section 5.
The force transmitted by a linear microelastic bond is
where and are the material-point volumes, is the influence function, is the partial-volume correction, and is the bond-history variable. The influence function is . Interior points on a square grid have ; boundary-point volumes follow their tributary areas. The partial-volume factor is unity for and decreases linearly to zero at . The corrected micromodulus is expressed as
where is the surface-correction factor. Incomplete neighborhoods near external boundaries, holes, and initial cracks are treated using the energy-based surface correction of Le and Bobaru [17]. This correction compensates for the stiffness bias caused by neighborhood truncation. The correction factors are evaluated from the initial configuration and remain fixed during subsequent fracture growth. During fracture growth, failed bonds cease to transmit force, while surviving bonds retain their initially calibrated surface-correction factors and critical stretches.
Quasi-static equilibrium at material point i requires
where is the body-force density and is the equivalent hydraulic force. Section 2.2 defines this force on pressurized boundaries and source-connected fracture surfaces.
For a two-dimensional plane-strain BB-PD solid, the micromodulus is calibrated from Young’s modulus as [16]
where E is Young’s modulus, h is the model thickness, and is the horizon radius. The classical BB-PD formulation imposes the Poisson-ratio constraint . Separated crack faces are treated without contact or friction.
Fracture is introduced through an energy-based critical-stretch criterion. The uncorrected critical stretch is related to the fracture energy by [16]
The corresponding surface-corrected threshold is
For mode-I fracture toughness , the plane-strain energy-release rate is
where . The stiffness and critical-stretch corrections satisfy , so that the fracture-energy calibration is preserved after surface correction. The tensile threshold therefore corresponds to the critical energy of the linearized bond law.
Bond failure is irreversible. The bond-history variable is updated according to
The bond law is linear elastic and perfectly brittle: each bond loses its load-carrying capacity completely at the tensile threshold. Failed bonds remain inactive, and the mechanical families remain fixed. The failed-bond field supplies the local evidence for path reconstruction in Section 2.2.
2.2. Source-Connected Fracture-Path Reconstruction and Hydraulic Loading
Qin et al. traced macroscopic fractures and identified connections within fracture networks in a coupled PD model [22]. Their three-dimensional model examined fracture-height growth and interaction with natural fractures [23]. Here, the local failed-bond field guides path reconstruction. An accepted extension of a source-connected tip adds a pressure-loaded segment for the next equilibrium solution at the same source pressure.
Failed bonds near the current tip provide the local propagation direction. For a failed bond b with unit direction , the orientation tensor is
where contains bonds that failed during propagation. Their midpoints lie within one horizon radius of the current tip. The initial defect bonds are excluded. Midpoints within of the tip seed a local connected set, which is extended through midpoint separations no greater than . Only this tip-connected set contributes to . The eigenvector associated with its distinct largest eigenvalue defines the local fracture normal . The corresponding tangent is perpendicular to and is oriented along the forward direction of the existing path. This gives one candidate direction per tip. When the two eigenvalues are indistinguishable at numerical precision, no extension is proposed at that tip.
The forward projection of the local failed-bond set determines the path increment,
where is the midpoint of failed bond b, is the current path tip, denotes the positive part, and is the material-point spacing. A positive forward projection defines a candidate extension. Pressure stations lie at the path vertices. Their spacing on the initial defects is for the directional-fracturing validation and for the rock-bridge application. Each accepted extension adds its endpoint as a station, so the new spacing equals the segment length. At every station, at least one intersecting failed bond with endpoints on opposite sides of the path must contribute positive weight.
The fracture segments connected to the prescribed fluid source form the pressurized fracture path,
where is the set of accepted fracture segments and denotes the pressurized source boundary. Connectivity is inherited by appending segments to a source-connected path. Independent failed-bond clusters remain outside and do not receive internal pressure. For a prescribed straight crack, the specified crack geometry directly defines .
The relative displacement across the reconstructed path defines the fracture opening. At station , the signed normal opening is
where and denote the endpoints of a failed bond intersecting the path on strictly opposite sides. Collinear intersections and endpoints lying on the path are excluded. Let be the arclength of the bond–path intersection. The weights are , where is the piecewise-linear hat function on the ordered path stations. They are normalized as , with nonzero support required at each station. At an interior station, the tangent follows the chord joining the adjacent stations; at an endpoint, it follows the adjacent segment. The normal is perpendicular to this tangent. The opening retains its sign.
The source pressure is applied normally to both sides of . Taking from the negative side toward the positive side, the pressure tractions are
The hydraulic formulation prescribes a spatially uniform source pressure, , along the evolving source-connected path. Each accepted extension is assumed to be filled with fluid at the source pressure before the next mechanical equilibrium calculation. This approximation applies when the hydraulic equilibrium timescale is short relative to those of physical loading and fracture growth and when viscous pressure losses along the connected path are small. On a pressurized circular boundary, the traction acts radially from the cavity into the solid. The prescribed-pressure feedback couples changes in the pressure-loaded boundary to mechanical equilibrium and subsequent bond failure.
Surface traction is distributed to material points using the tributary length of each fracture station. The equivalent hydraulic force is
where h is the model thickness, is the tributary length associated with station , and and are the normalized distribution weights on the two sides of the fracture. They satisfy . For each side, is the sum of over candidate bonds whose corresponding endpoint is material point i. The tributary length is half the sum of the adjacent segment lengths at an interior station and half the adjacent segment length at a path endpoint. Thus, is the loaded area on each face. Using the same weights for opening and force transfer makes the fracture-pressure work conjugate to the discrete opening measure. For a given path geometry, the work of the distributed material-point forces equals the pressure work associated with the measured crack opening. This avoids a mismatch between the loading and displacement measures. The term represents the source-boundary force. For a circular source of radius R, its wall-point weights are the angular tributary arc lengths, , multiplied by thickness and pressure and directed radially into the solid.
Bond failure updates the failed-bond field, while each accepted path extension updates and thereby the pressure-loaded boundary for the next equilibrium solution.
2.3. Topology-Triggered Hydraulic-Fracture Propagation Procedure
Fracture propagation is advanced through a topology-triggered quasi-static procedure. During continued propagation, each admissible change to the topology of the source-connected fracture path updates the pressure-loaded boundary. The mechanical equilibrium problem is then solved again at the current source pressure. Inertial effects are neglected. At each pressure level, the topology and equilibrium updates continue until propagation converges or the prescribed termination event occurs. Algorithm 1 summarizes the procedure used in the validation and engineering application.
| Algorithm 1 Topology-triggered hydraulic-fracture propagation procedure |
|
Bond failure changes the mechanical stiffness, and an accepted path extension changes the pressure-loaded boundary. A state equilibrated before either update is therefore not generally equilibrated afterward. Mechanical equilibrium is accepted at a relative force-residual tolerance of . The residual is evaluated over the free degrees of freedom and normalized by the larger norm of the internal and applied forces. At fixed pressure, the sequence of equilibrium, bond failure, path reconstruction, and pressure-boundary update is repeated until the stretch of every surviving breakable bond is below its critical value and admissible path growth ceases.
With the current bond states and pressure-loaded path held fixed, the equilibrium displacement and linearized bond stretches depend affinely on source pressure. The prescribed far-field preload supplies the pressure-independent contribution. Using the fixed-topology linear pressure response, the next failure pressure is determined as the first pressure above the current level at which the maximum linearized stretch-to-threshold ratio among surviving breakable bonds reaches unity. These pressure increments define a quasi-static loading sequence. The termination criterion depends on the problem and is specified alongside the path-admission rules for each example.
Energy accounting between consecutive equilibria at fixed pressure includes source-wall and fracture-pressure work, the change in elastic energy, and the energy removed with newly failed bonds. The latter is evaluated at the actual pre-failure stretches and compared with the critical bond energy. The excess records threshold overshoot during fixed-pressure failure sequences. Static re-equilibration releases additional energy, which is calculated from the displacement increment and the updated stiffness. Changes in the pressure-load functional at unchanged displacement are recorded separately from deformation work.
3. Verification Against Analytical and Finite-Element Solutions
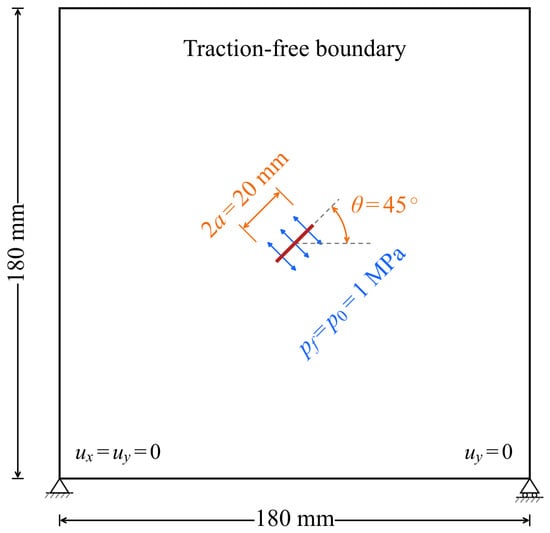
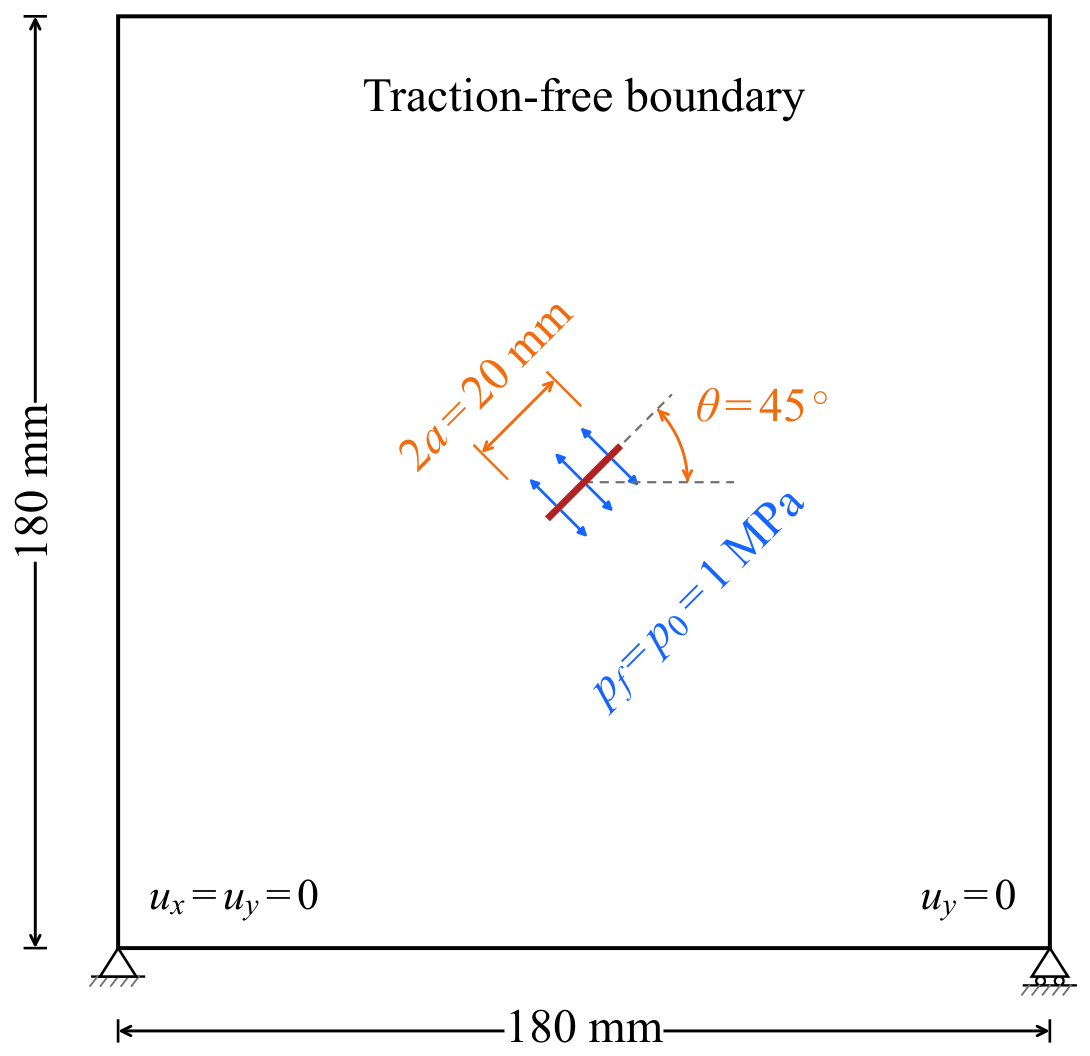
A centrally pressurized crack is considered in a plane-strain domain, as shown in Figure 1. The crack length is . Two orientations, and , are examined under a uniform crack-face pressure of . The red line denotes the crack, blue arrows indicate normal pressure loading, and orange annotations mark the crack length and inclination. The external boundaries are traction free. The lower-left corner is fixed in both directions, and the vertical displacement at the lower-right corner is constrained to suppress rigid-body motion. The material parameters are , , and , giving . The model thickness is .
Figure 1.
Geometry and boundary conditions of the centrally pressurized-crack verification.
The Sneddon solution for a uniformly pressurized crack in an infinite elastic plane provides the analytical opening profile [27],
where s is the local coordinate along the crack and . The maximum analytical opening is . Linear elastic fracture mechanics (LEFM) gives the initiation pressure
The analytical initiation pressure is . An independent plane-strain FEM solution uses linear triangular elements in the same finite domain. Separate nodes on the two crack faces represent the displacement discontinuity. The opening comparisons use for PD and a local crack-region element size of for FEM. The PD initiation check uses the linearized stretch in Equation (2).
Table 1 summarizes the horizon-ratio sensitivity for the crack at fixed . The initiation pressure is identified when the first tensile bond reaches its surface-corrected critical stretch. The relative error is . The average number of active interactions is evaluated after insertion of the initial crack and before further bond failure. Increasing the horizon ratio from 3 to 4 reduces the error only slightly, from to , while the average interaction count increases from 35.70 to 67.21. The error increases to at a ratio of 5. A larger horizon extends nonlocal averaging over a wider region and alters the local crack-tip field. Increasing the horizon therefore need not reduce the initiation-pressure error monotonically. A nominal horizon ratio of approximately 3 is therefore selected as a balance between prediction accuracy and computational cost. The subsequent calculations use , following the slight horizon enlargement adopted by Nguyen and Oterkus [28] to include material points at the nominal horizon boundary.
Table 1.
Horizon-ratio sensitivity of the crack-initiation prediction. LEFM denotes linear elastic fracture mechanics.
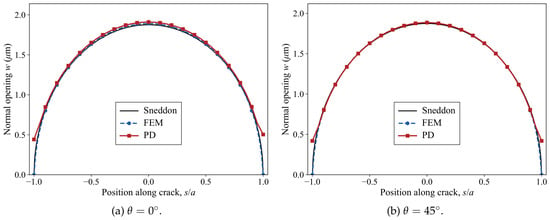
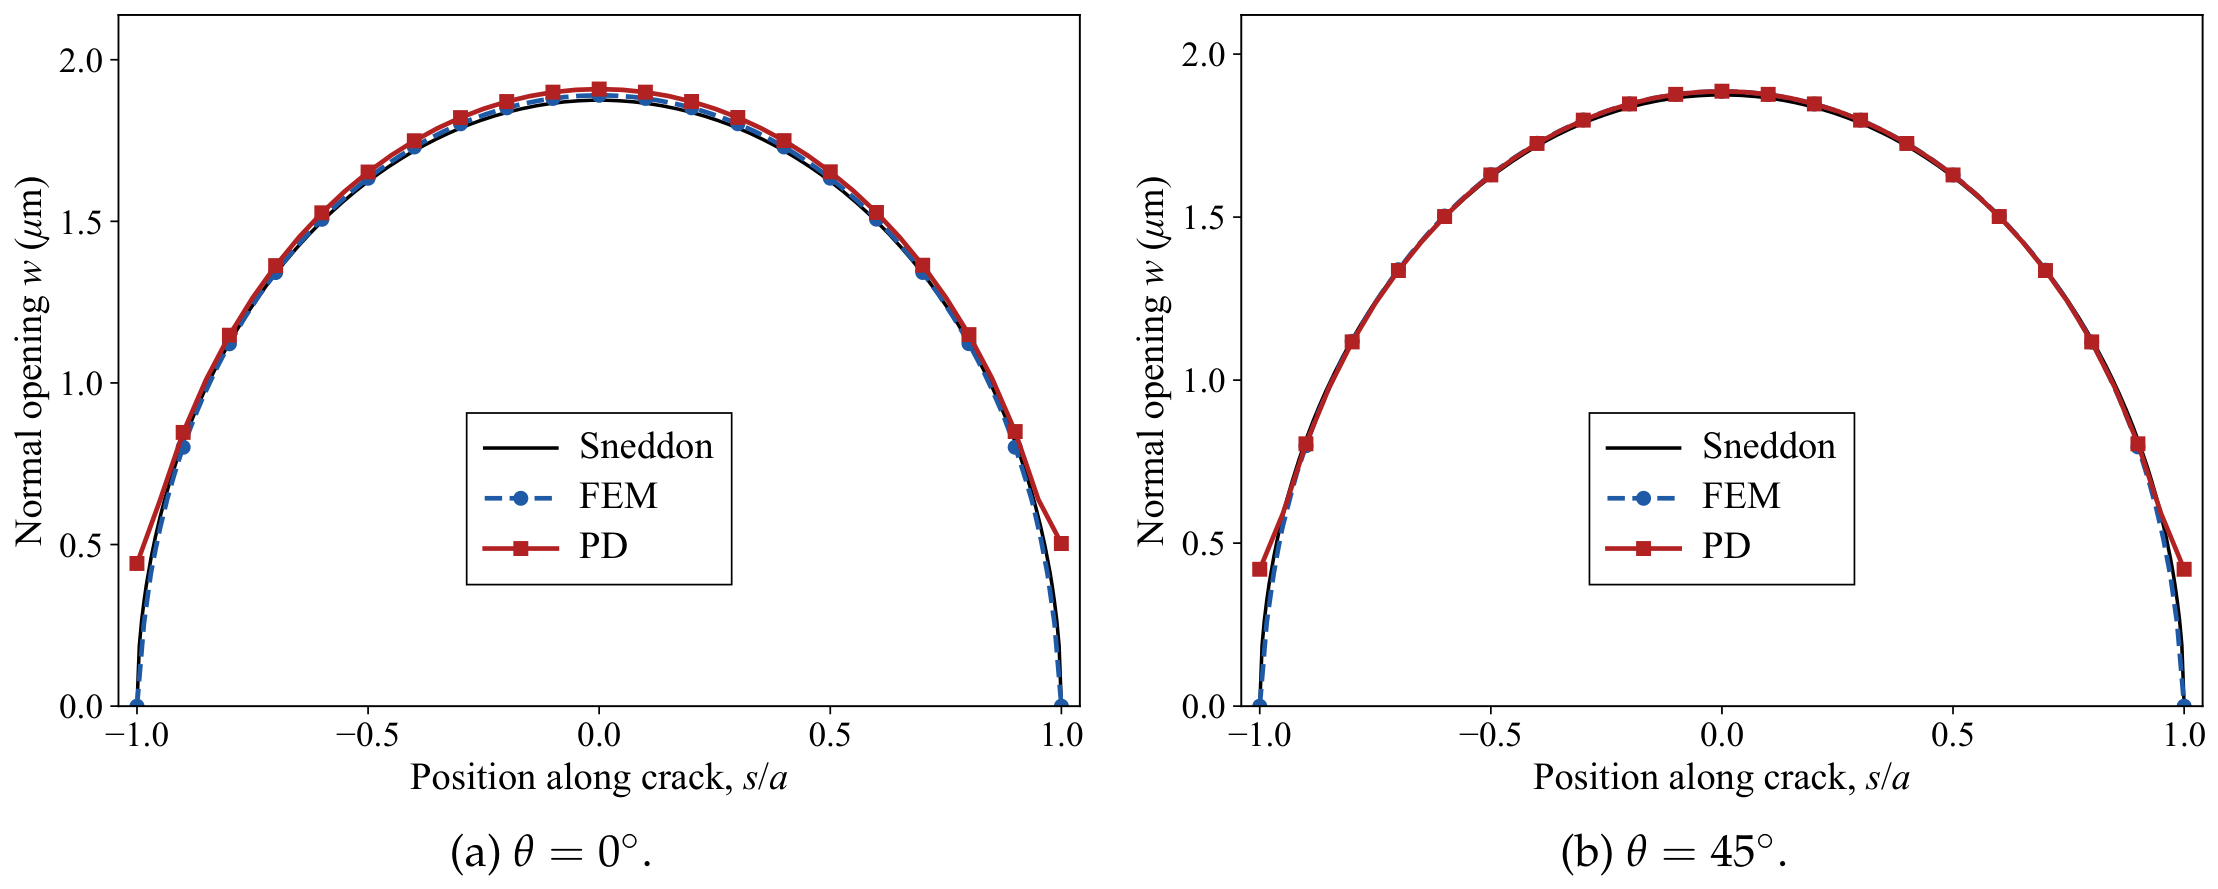
Figure 2a compares the opening profiles for the crack. The PD and FEM solutions reproduce the elliptical analytical profile. The PD opening has a relative error of against the analytical solution and a relative difference of from FEM. For the crack in Figure 2b, the corresponding values are and . Both measures use on 401 uniformly spaced positions along the crack. The maximum PD openings are and for the two orientations, compared with the analytical value of .
Figure 2.
Crack-opening profiles from peridynamics (PD), the finite-element method (FEM), and the analytical solution.
Table 2 examines point-spacing refinement for the crack at fixed . The horizon decreases with point spacing, while the geometry, material properties, and loading remain unchanged. All PD opening profiles are compared with the same FEM reference at . Refinement from to reduces the opening error against the analytical solution from to and the difference from FEM from to . The initiation pressure decreases from to , approaching the LEFM value of .
Table 2.
Point-spacing refinement for the horizontal pressurized crack at .
At , the predicted initiation pressures are for the crack and for the crack. Their absolute relative errors against the LEFM value are and , respectively. Opening accuracy is comparable for the two orientations. Initiation pressure retains a measurable dependence on crack orientation relative to the lattice. Rotating the crack changes the discrete bond directions and the sampling of its faces and tips. The first-bond failure threshold therefore exhibits lattice-induced anisotropy even though the underlying continuum material is isotropic.
4. Validation Against Directional Hydraulic-Fracturing Experiment
4.1. Initiation and Fracture-Path Evolution
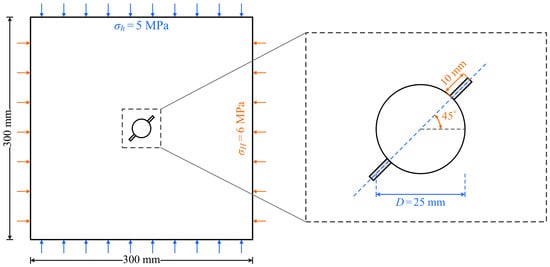
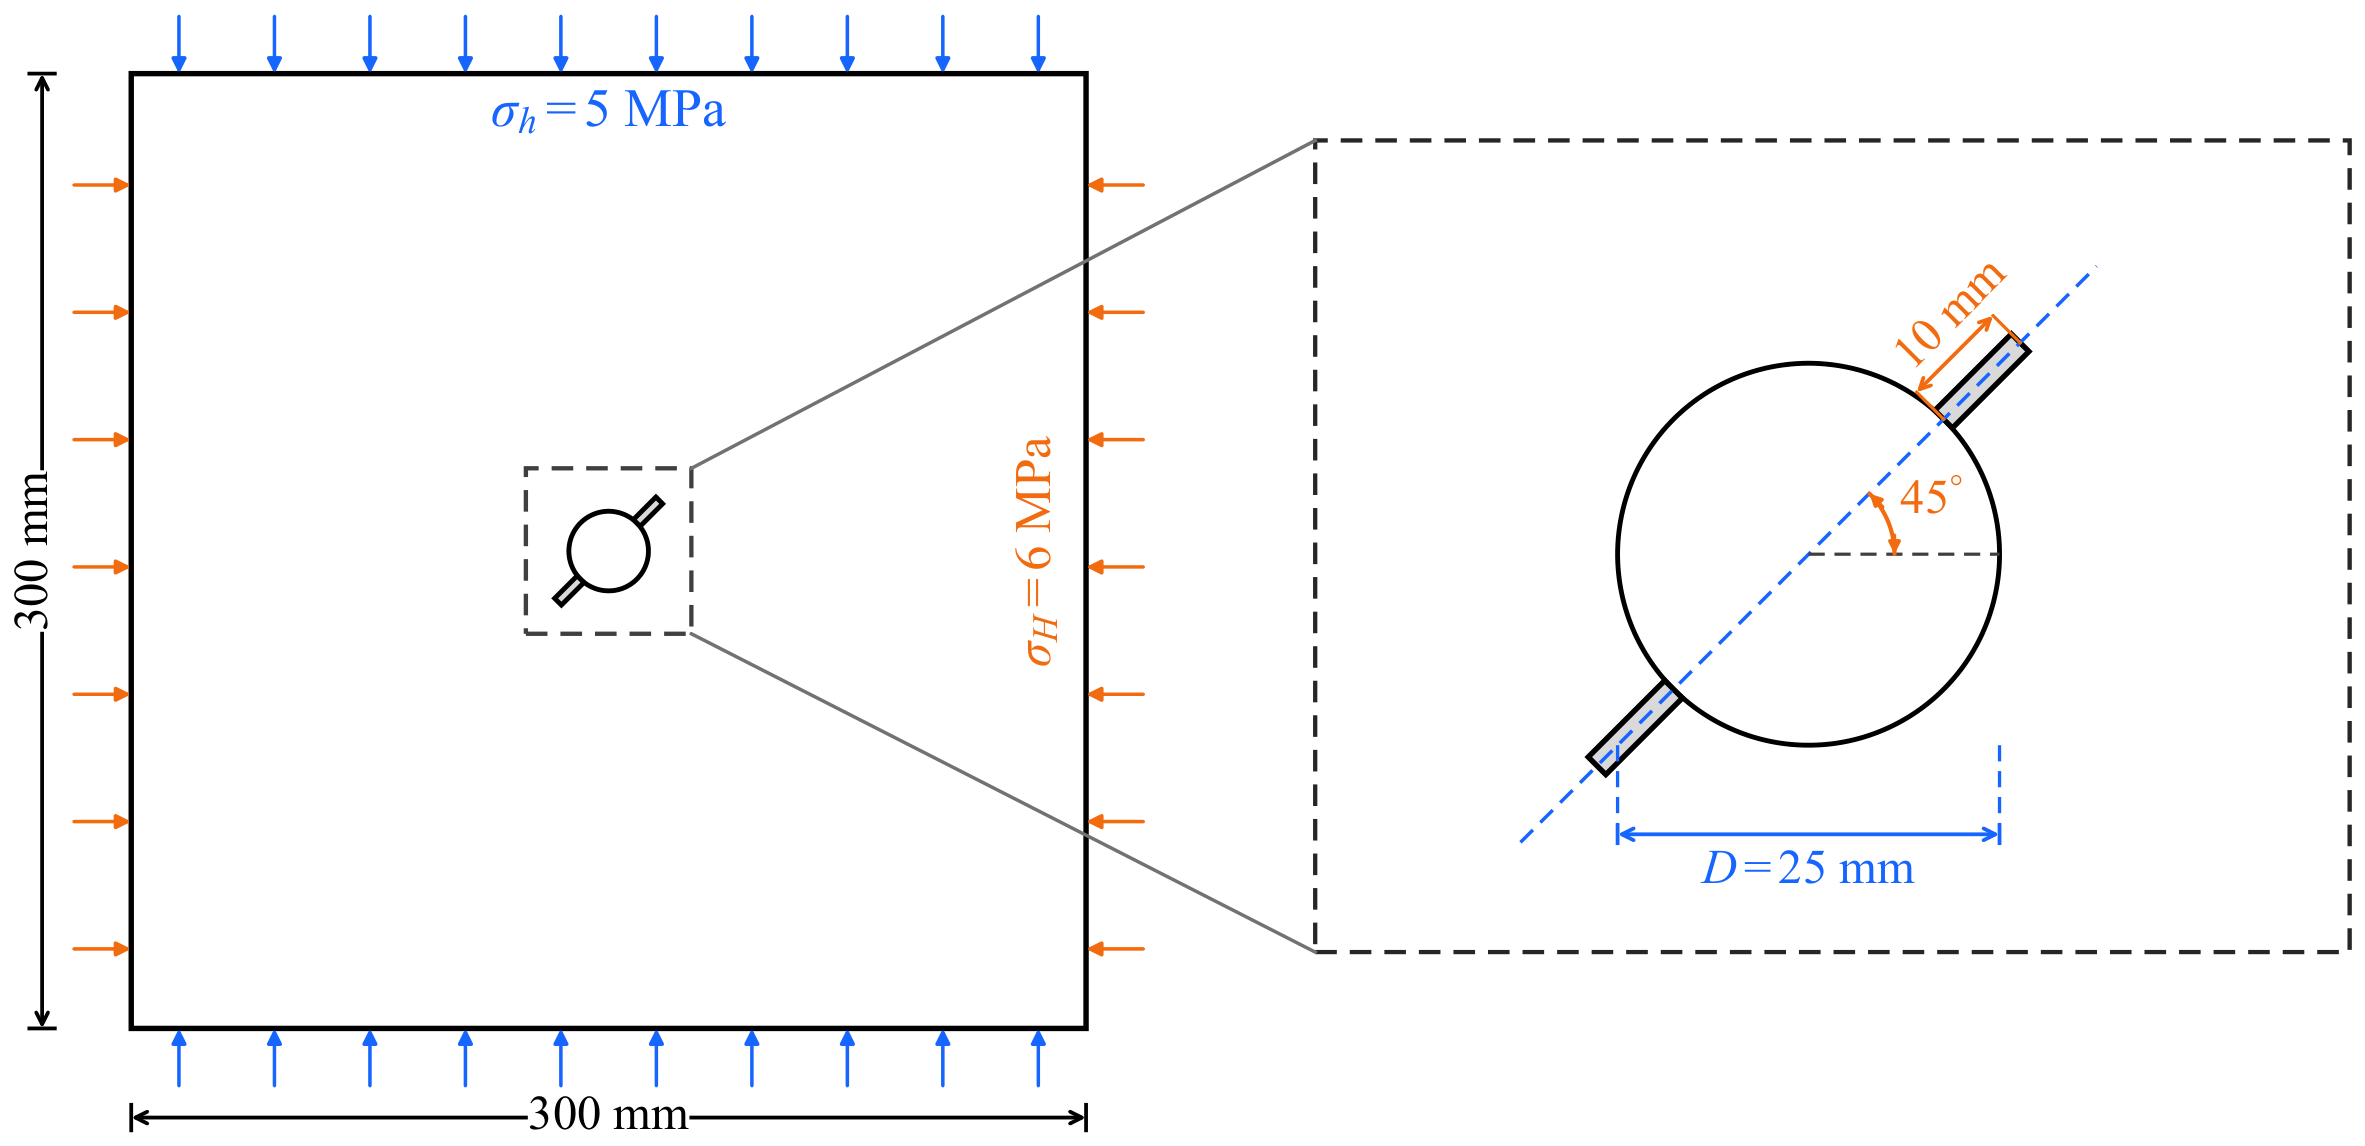
The validation uses the directional hydraulic-fracturing experiment reported by Liu et al. [29]. A plane-strain section of the cubic specimen is considered. Figure 3 shows the domain with a central borehole. Two prefabricated cracks extend from the borehole at to the major in-plane compressive-stress direction. The applied in-plane stresses are and , indicated by the orange and blue boundary arrows in Figure 3, respectively.
Figure 3.
Geometry and loading of the specimen in the directional hydraulic-fracturing test.
The reported fracture toughness is [29]. A representative elastic modulus of and the plane-strain bond-based value are adopted, giving . The horizon ratio is , following Section 3. The main initiation and propagation results use and phase A, defined by the dimensionless lattice offsets . The phase-A results provide a refinement comparison. Failure is evaluated with the linearized stretch in Equation (2), consistent with the equilibrium force law. The prescribed pressure acts on the borehole and the source-connected crack surfaces. The experiment used a fluid viscosity of and an injection rate of [29]. The present prescribed-pressure representation is assessed through initiation pressure and fracture-path direction.
Liu et al. [29] report an experimental initiation pressure of and a mixed-mode prediction of . Table 3 summarizes the PD results across the tested lattice phases; initiation pressure varies non-monotonically with point spacing. The closest agreement occurs at , with pressures of – and relative differences of – from the experiment. At , the relative differences are – across the two phases. The phase-A calculation shown in Figure 4 and Figure 5 gives , or above the experimental value.
Table 3.
Sensitivity of the initiation pressure to point spacing and lattice phase.
Figure 4.
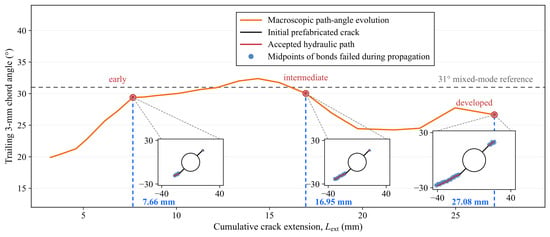
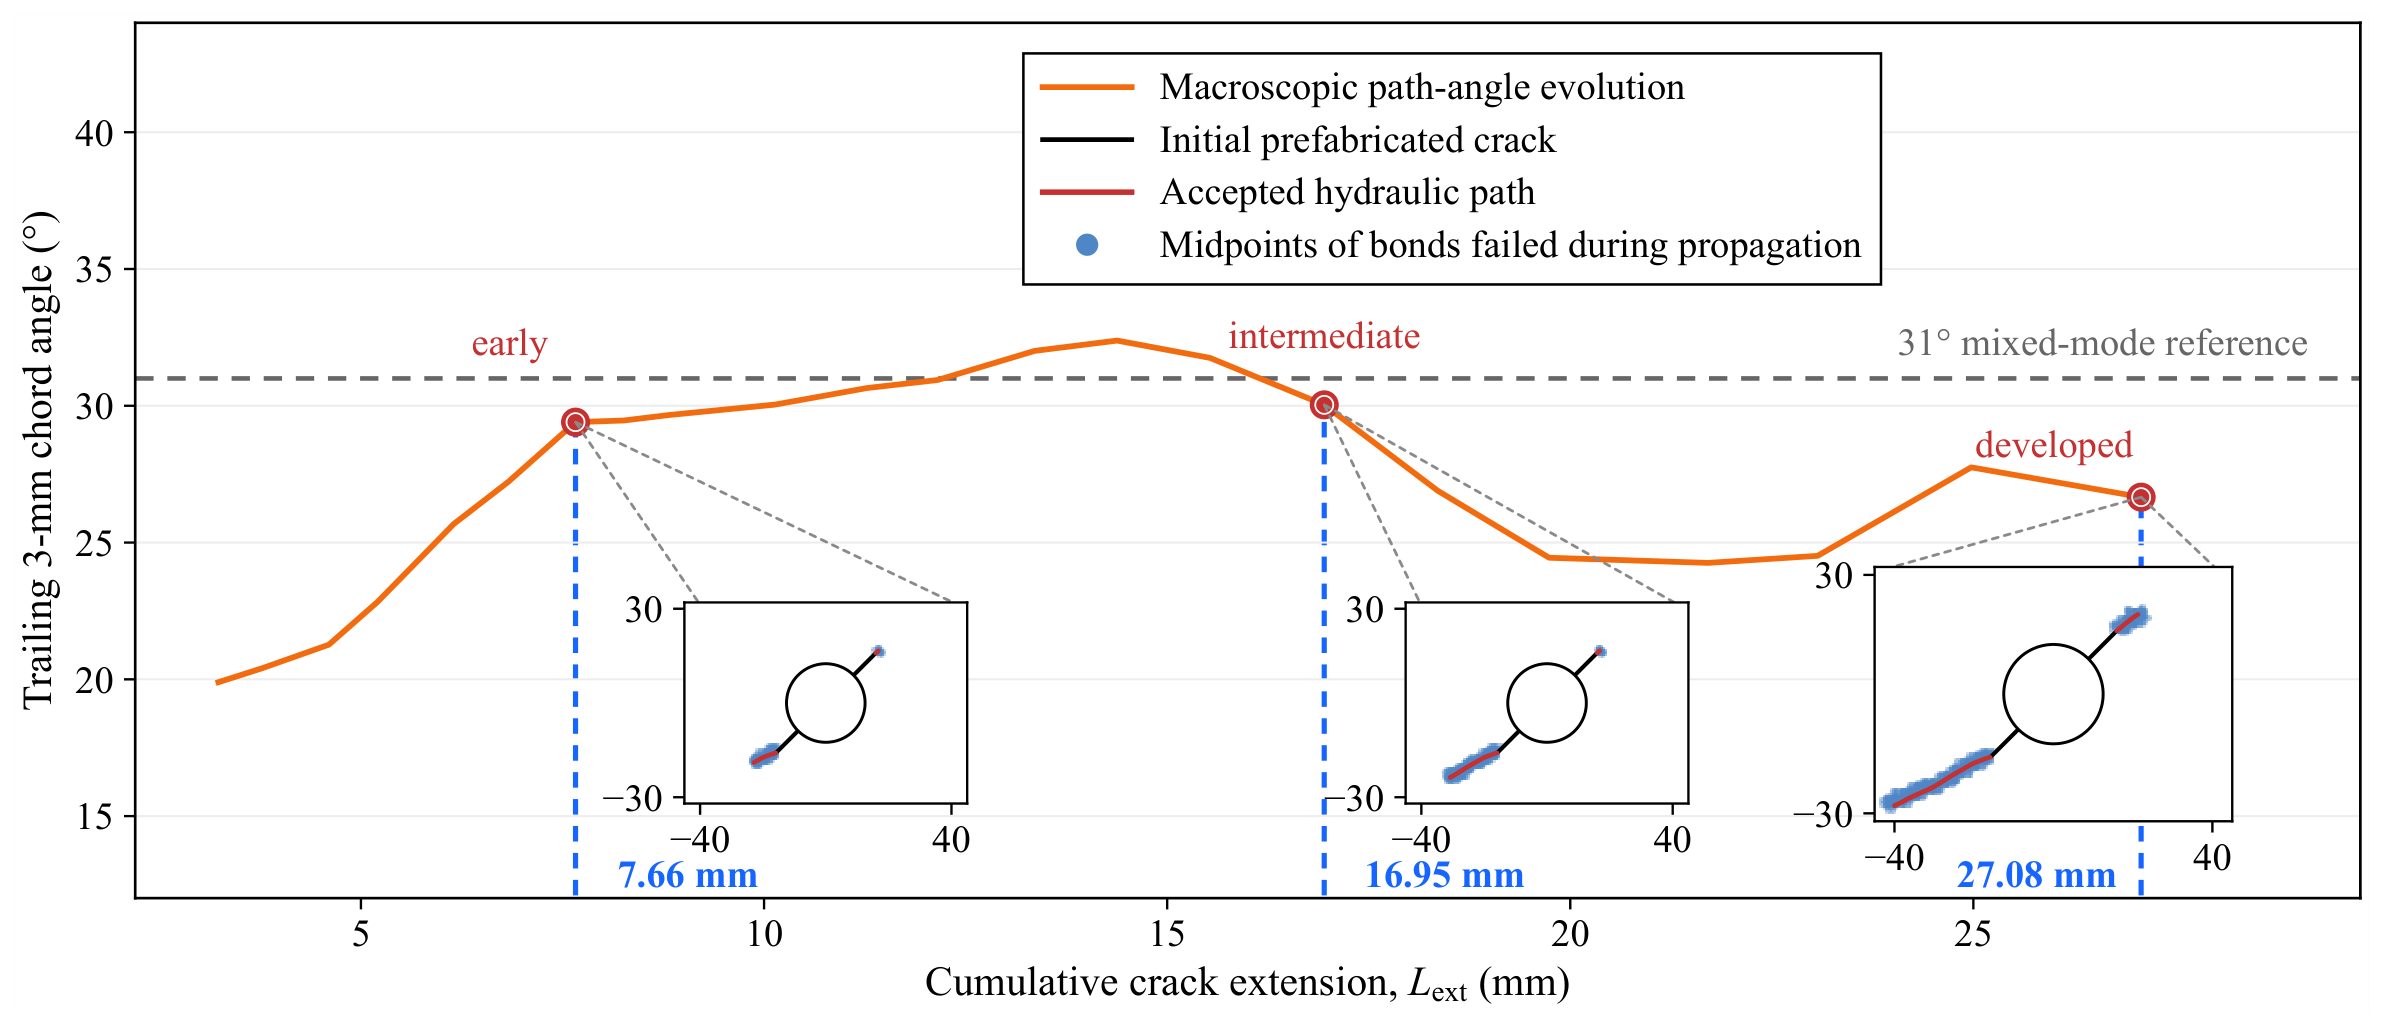
Predicted fracture growth and path-angle evolution for the directional hydraulic-fracturing test; the mixed-mode reference is obtained from the mixed-mode criterion of Liu et al. [29].
Figure 5.
Damage localization around the accepted hydraulic fracture path.
Initiation is defined as the first tensile bond failure. This local maximum-stretch criterion is sensitive to bond orientation and lattice phase near the notch tip. Refinement at fixed also reduces the physical horizon. These changes alter the sampled crack-tip field and produce the non-monotonic variation in pressures reported in Table 3. In the phase-A calculation, the first failed-bond midpoint lies from a notch tip, and subsequent source-connected growth develops from that tip. This spatial sequence supports first bond failure as a numerical measure of initiation.
Figure 4 shows the macroscopic path-angle evolution for and phase A. The blue bands in the insets comprise the midpoints of bonds that failed during propagation. The angle is measured from a trailing chord relative to the major in-plane compressive-stress direction. At , the mixed-mode initiation criterion of Liu et al. [29] predicts a deflection of from the initial crack. Rounding the corresponding absolute direction of gives the mixed-mode reference. The early, intermediate, and developed states correspond to crack extensions of , , and . Their trailing-chord angles are , , and , respectively.
At , the phase-A and phase-B calculations give trailing-chord angles of and at extensions of and , respectively. The early state gives at . Their deviations from the mixed-mode reference are , , and . These results show similar early propagation directions across the tested lattices, despite the greater variation in initiation pressure.
Liu et al. [29] report the fracture deflection angle as a function of crack extension for this specimen. Both the experimental and numerical paths turn from the initial notch toward the major in-plane compressive-stress direction. At common extension lengths of , , and , the numerical deflections are , , and , compared with experimental estimates of approximately , , and . These common-length samples are distinct from the three saved configurations in Figure 4. The simulation turns more at the first two locations and less at the third. Experimental angles are approximate readings of the local tangent to the fitted post-test trace; numerical angles use the trailing chord of the dominant branch. Both are measured relative to the initial notch. The three saved numerical configurations occur at a fixed source pressure of . In the constant-rate experiment, the inlet pressure fell during post-peak growth [29].
The three phase-A states in Figure 4 were used for a local sensitivity check. The failed-bond fields and pre-update tip positions were held fixed. Varying the midpoint connectivity radius and step-length cap separately by preserved the original admission decisions and candidate directions. The largest change in a single extension was . Trailing-chord lengths of 2, 3, and gave angular spreads of , , and at the three stages. Stricter opposing-side support or additional pressure stations changed some local admission decisions.
4.2. Damage Localization During Fracture Growth
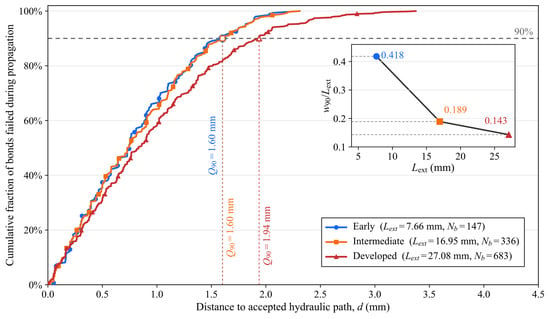
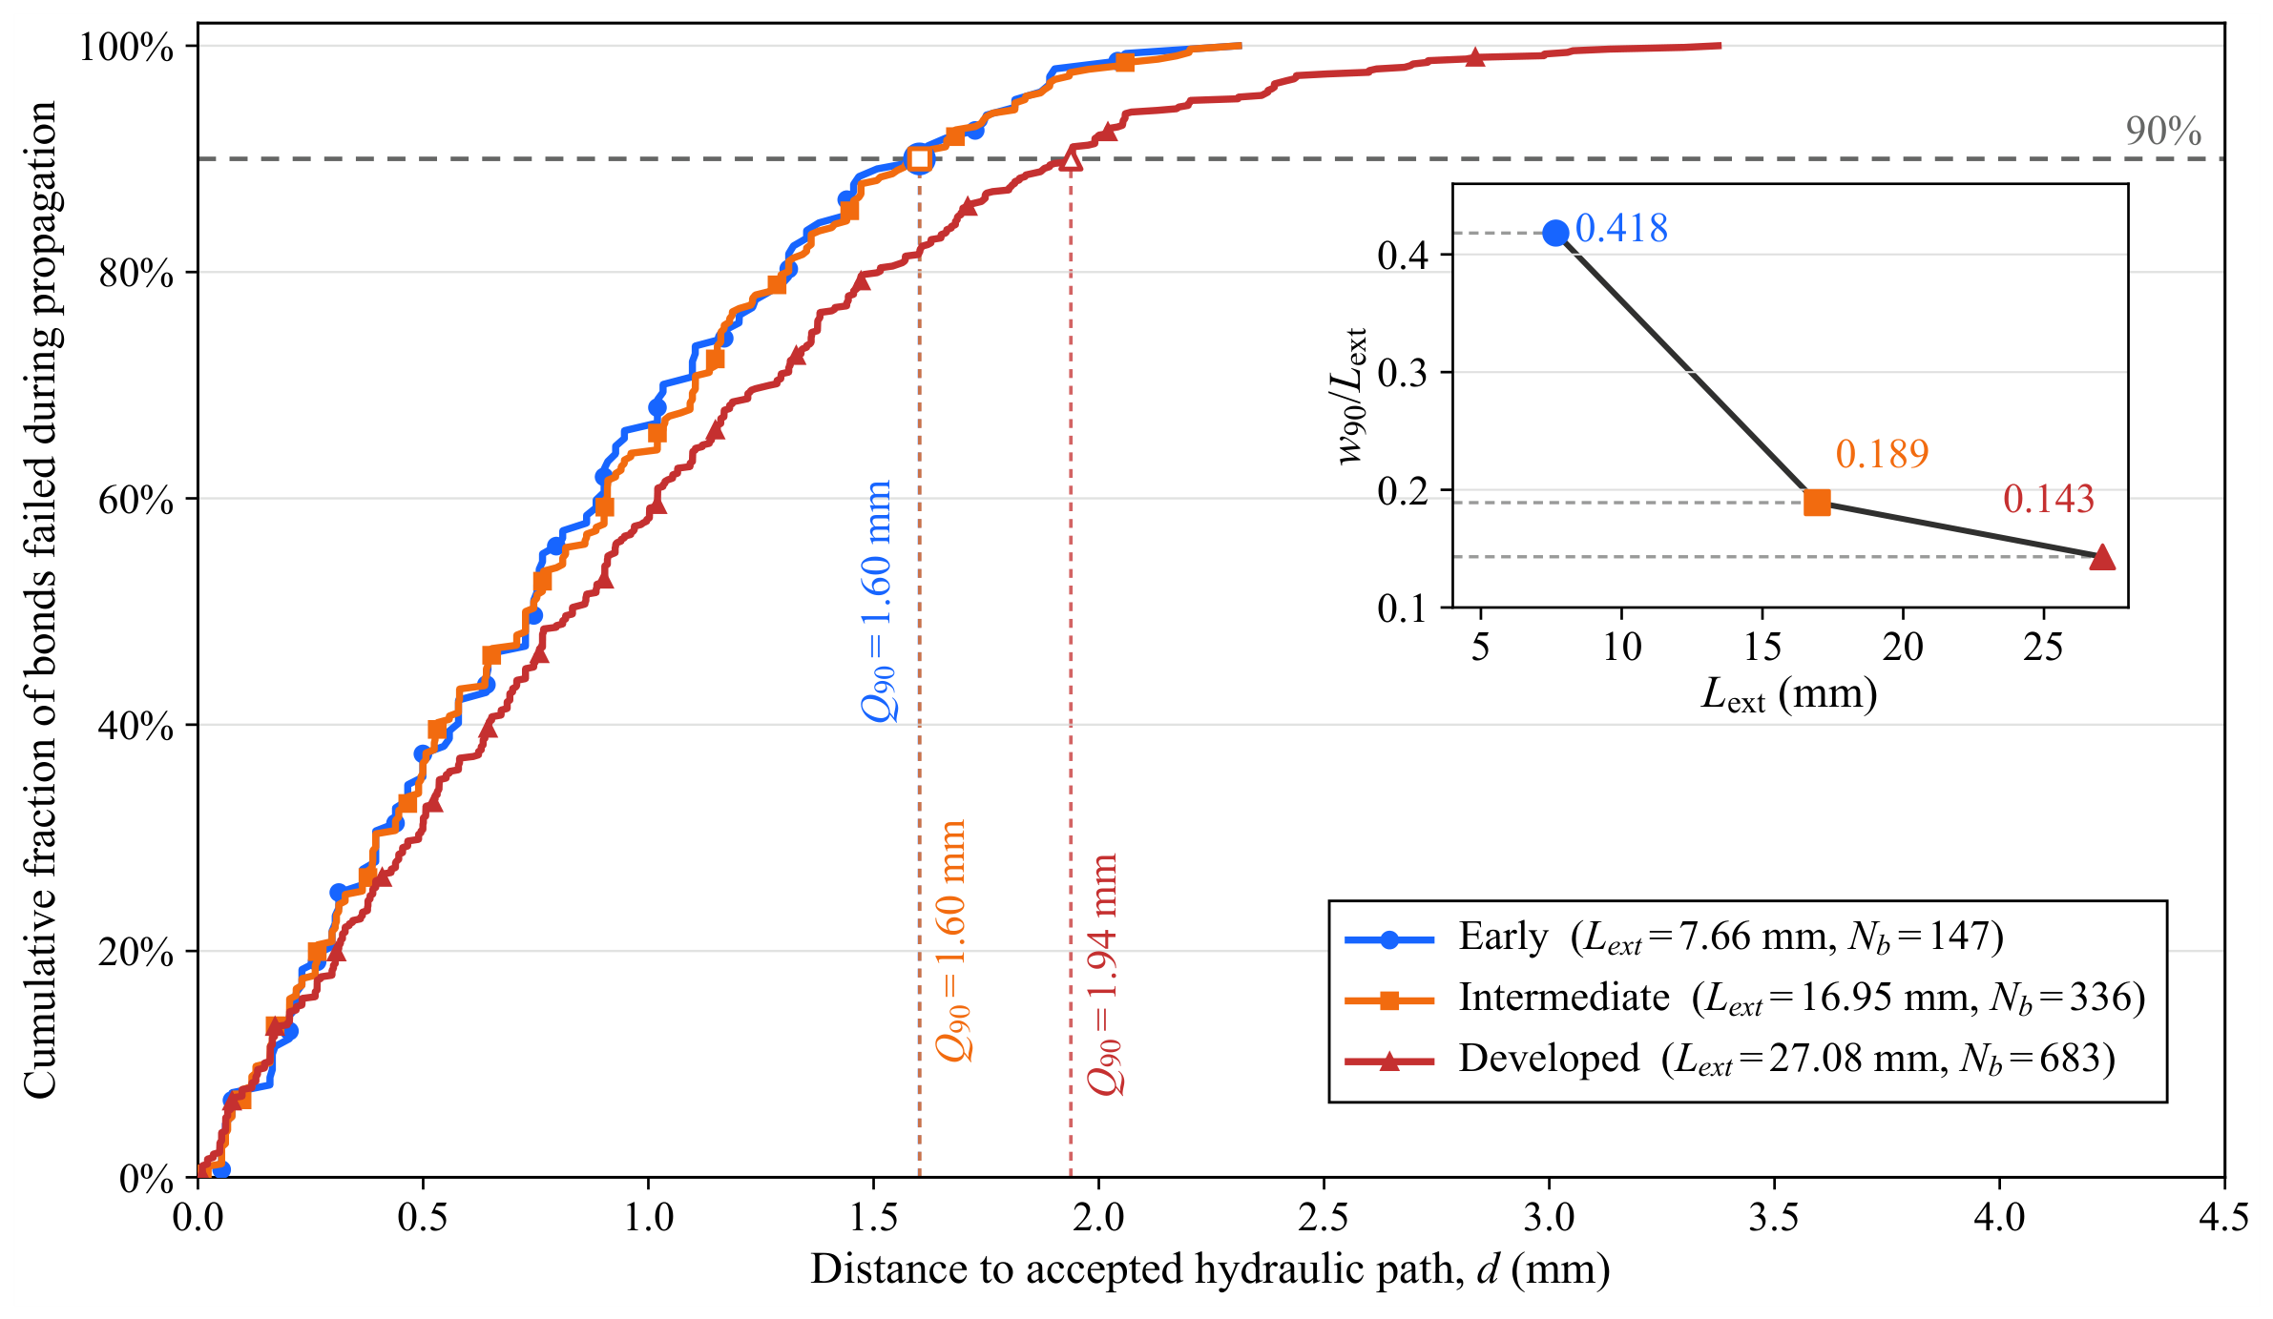
Bonds that failed during propagation form a finite band around the accepted hydraulic path. Their total number is denoted by . The minimum distance from each failed-bond midpoint to the propagated portions of the path is denoted by d. Its 90th percentile is , and the two-sided localization width is . Figure 5 shows the distributions of d at three propagation stages. The corresponding values are , , and , giving , , and . The width is similar at the early and intermediate stages and increases at the developed stage.
The inset of Figure 5 shows that the normalized width decreases from to and then to . The damage band broadens in absolute terms, but its width grows more slowly than the connected fracture length. Path extension and transverse damage spread therefore describe different aspects of fracture development. This distinction supports treating the source-connected macroscopic hydraulic path separately from the surrounding distributed damage band. The band records local failure, whereas the accepted path defines the surface carrying pressure.
5. Engineering Application: Pressurized Cavity–Tunnel Rock-Bridge Failure
5.1. Problem Configuration and Numerical Setup
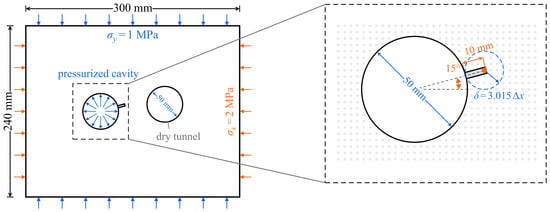
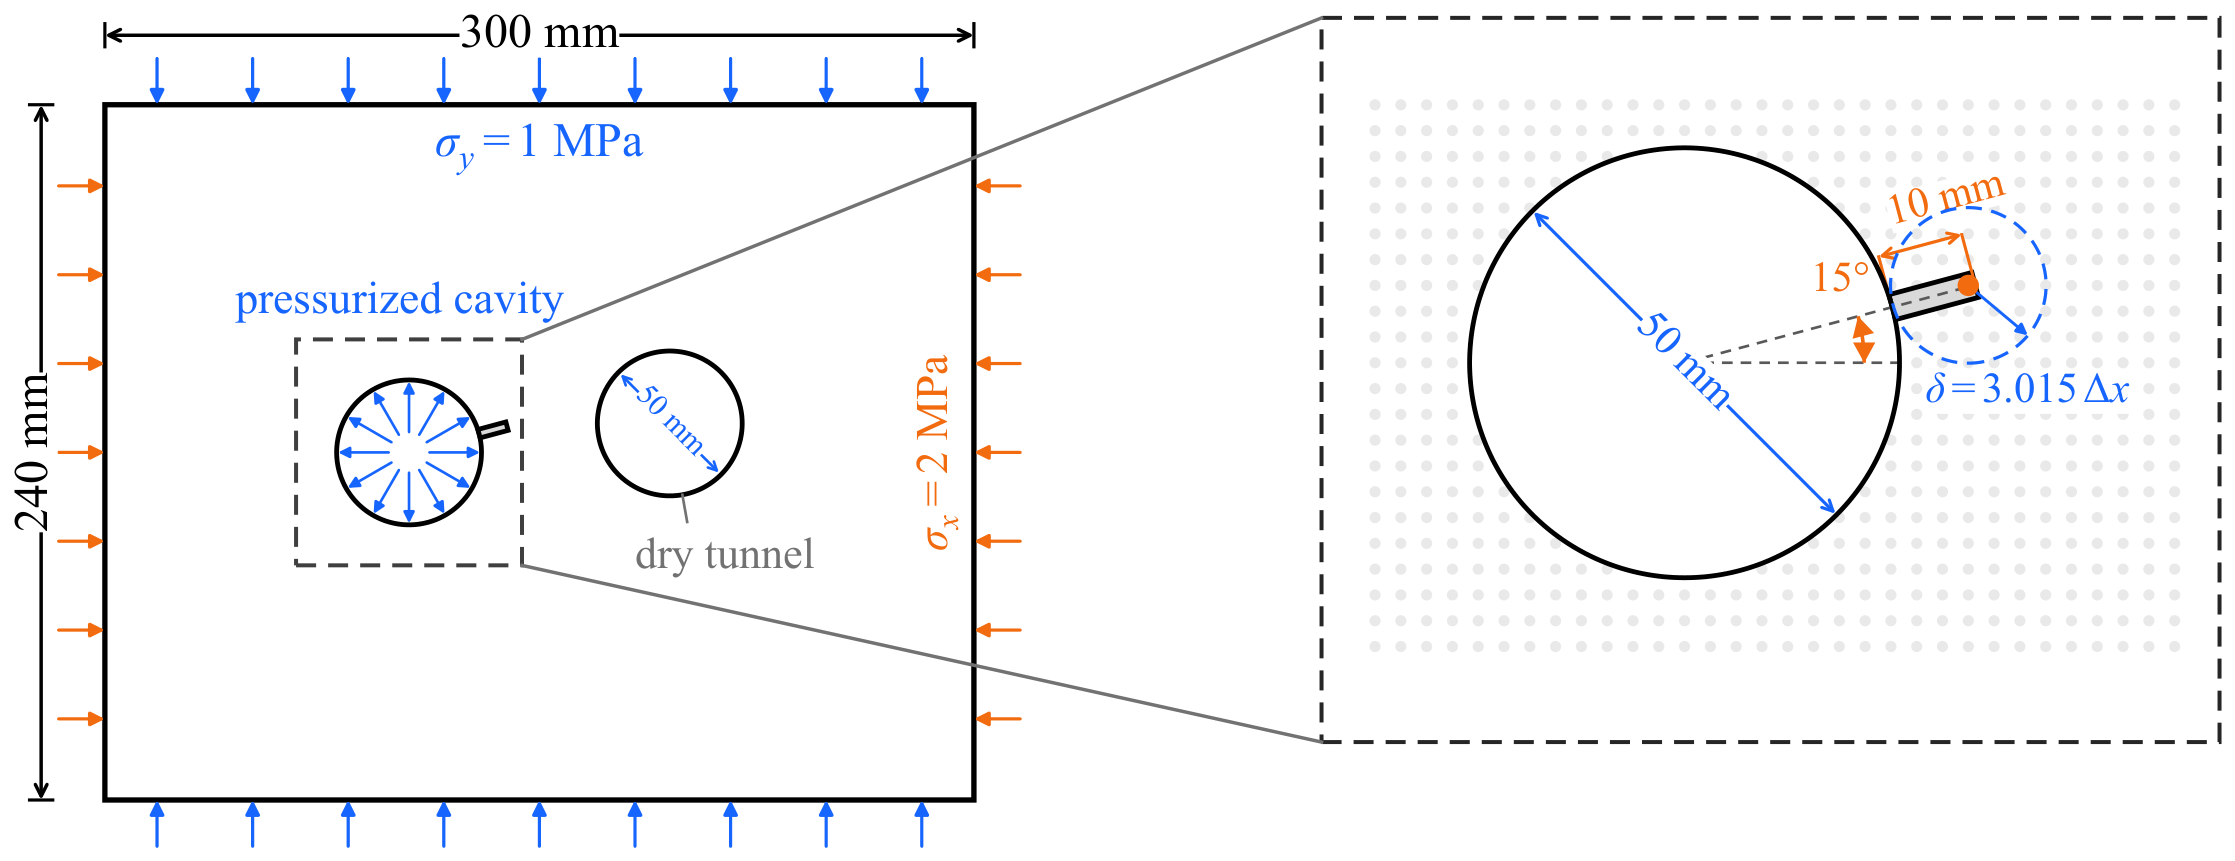
A pressurized cavity–tunnel configuration is used to examine progressive rock-bridge fracture. Figure 6 shows the plane-strain domain. A pressurized cavity and a dry tunnel are centered at mm and mm, respectively. Both are circular with a diameter of . The minimum rock-bridge distance between the ideal circular boundaries is approximately . A initial defect extends from the cavity wall at to the positive x direction. Subsequent growth follows the local failed-bond field.
Figure 6.
Configuration and discretization of the pressurized cavity–tunnel rock-bridge problem.
The material parameters are , , and , corresponding to . Compressive far-field stresses of and are imposed through the corresponding affine displacements on the outer boundary. In Figure 6, the orange and blue outer-boundary arrows indicate and , respectively. The radial blue arrows indicate pressure acting on the cavity wall. The point spacing is , with . Failure uses the linearized stretch in Equation (2). The initial mechanical family remains fixed, and bond failure is irreversible.
The prescribed cavity pressure starts at . It increases after bond failure and admissible path extension have ceased at the current pressure level. The same pressure acts on the cavity wall and the accepted source-connected fracture path. Path admission additionally requires positive signed openings at all pressure stations. Each accepted extension updates the pressure-loaded boundary for the next equilibrium solution. The tunnel wall remains traction free. The terminal condition is the first intersection of the reconstructed path with an exposed face of the discrete tunnel boundary.
Elastic PD and FEM solutions are compared for the same rock-bridge geometry and boundary conditions, with a fixed defect and a source pressure. The relative change in FEM crack-face opening is between the two finest of three successively refined meshes. Table 4 compares five horizon ratios at . Ratios of and give similar opening errors, but the energy error is smaller at . Increasing the ratio to and 4 reduces the energy error further while increasing both the opening error and the interaction count. This trade-off supports the choice of .
Table 4.
Horizon-ratio sensitivity of the fixed-defect elastic rock-bridge response.
5.2. Progressive Rock-Bridge Fracture
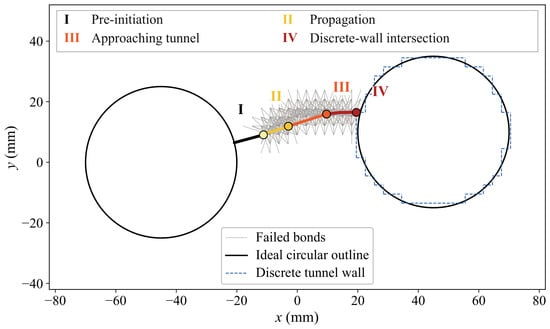
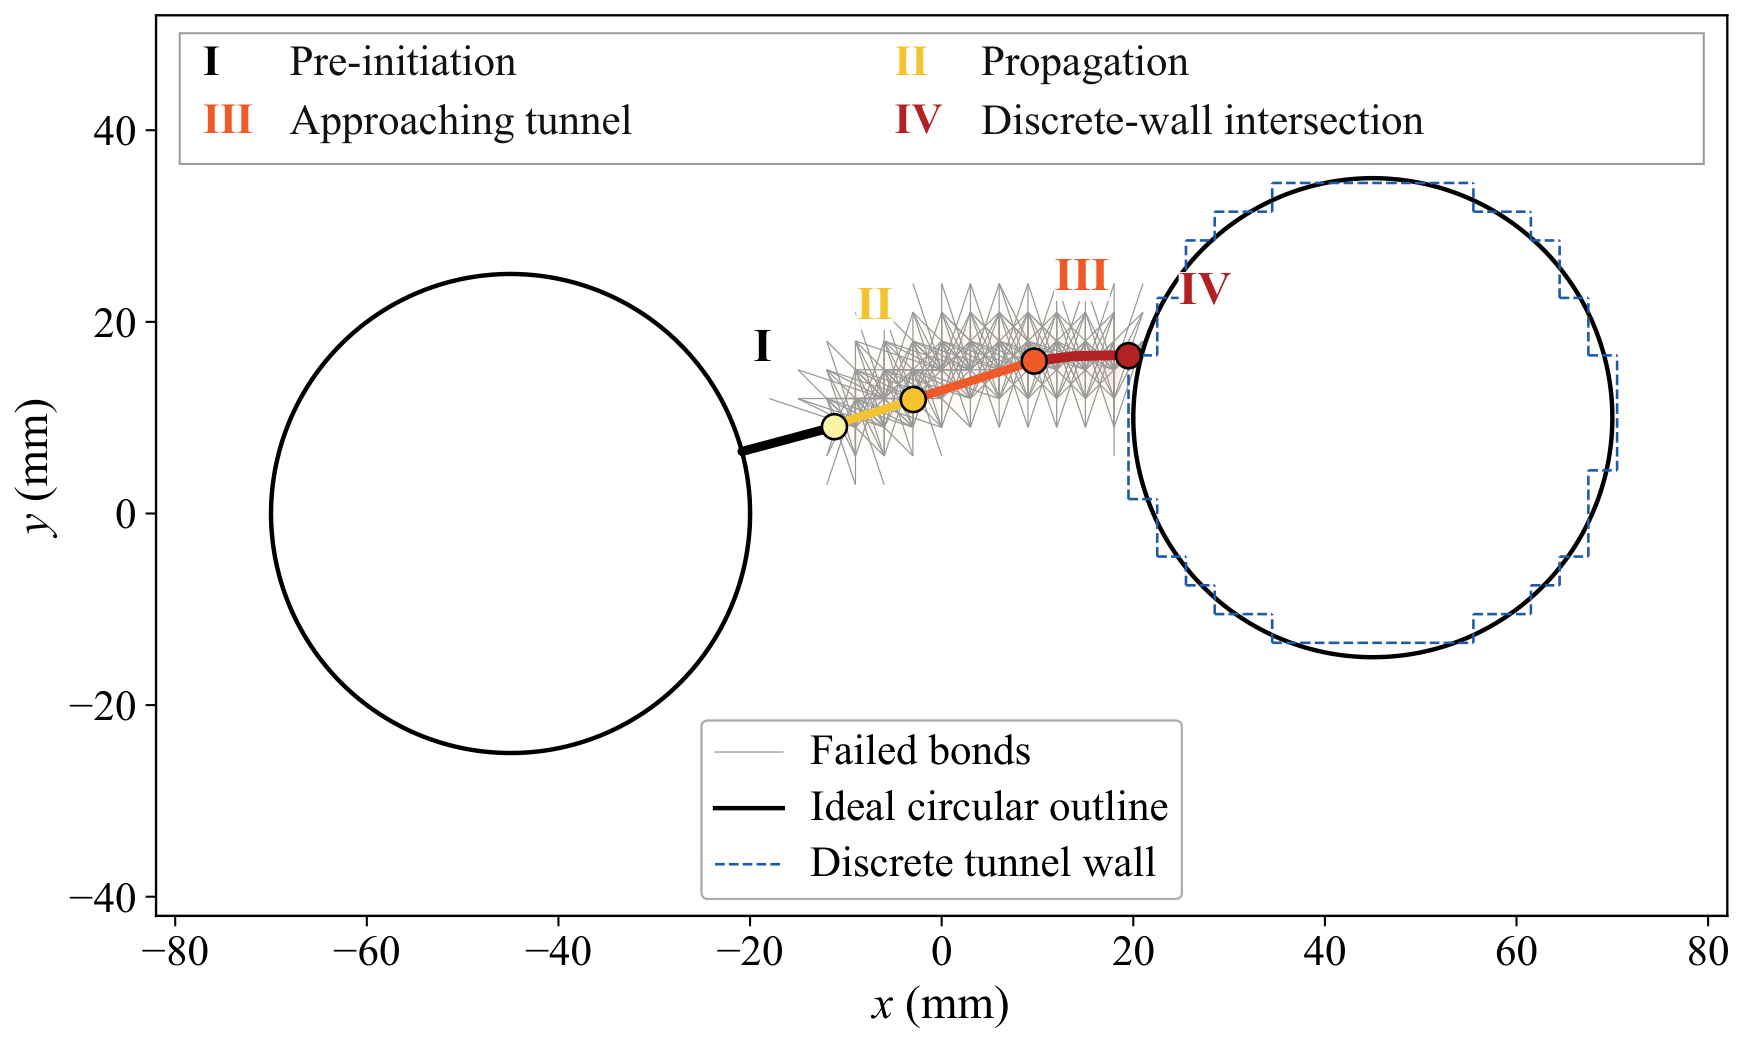
Figure 7 shows the spatial progression of fracture through the rock bridge. Stage I precedes the first new bond failure at , with the path confined to the initial defect. New bond failures originate at the defect tip and support path extension into the bridge at Stage II, where . By Stage III, at , the path approaches the tunnel. The failed-bond band follows the reconstructed path through the intervening rock.
Figure 7.
Pressure-driven evolution of the reconstructed source-connected fracture. Stage IV marks the first intersection with the discrete tunnel wall.
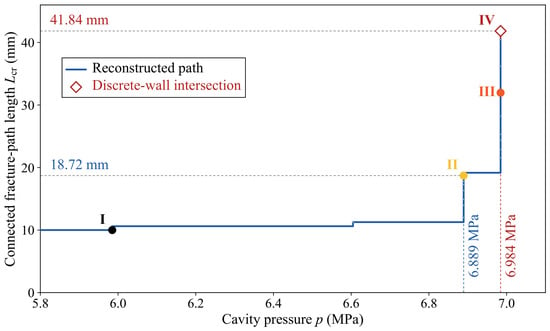
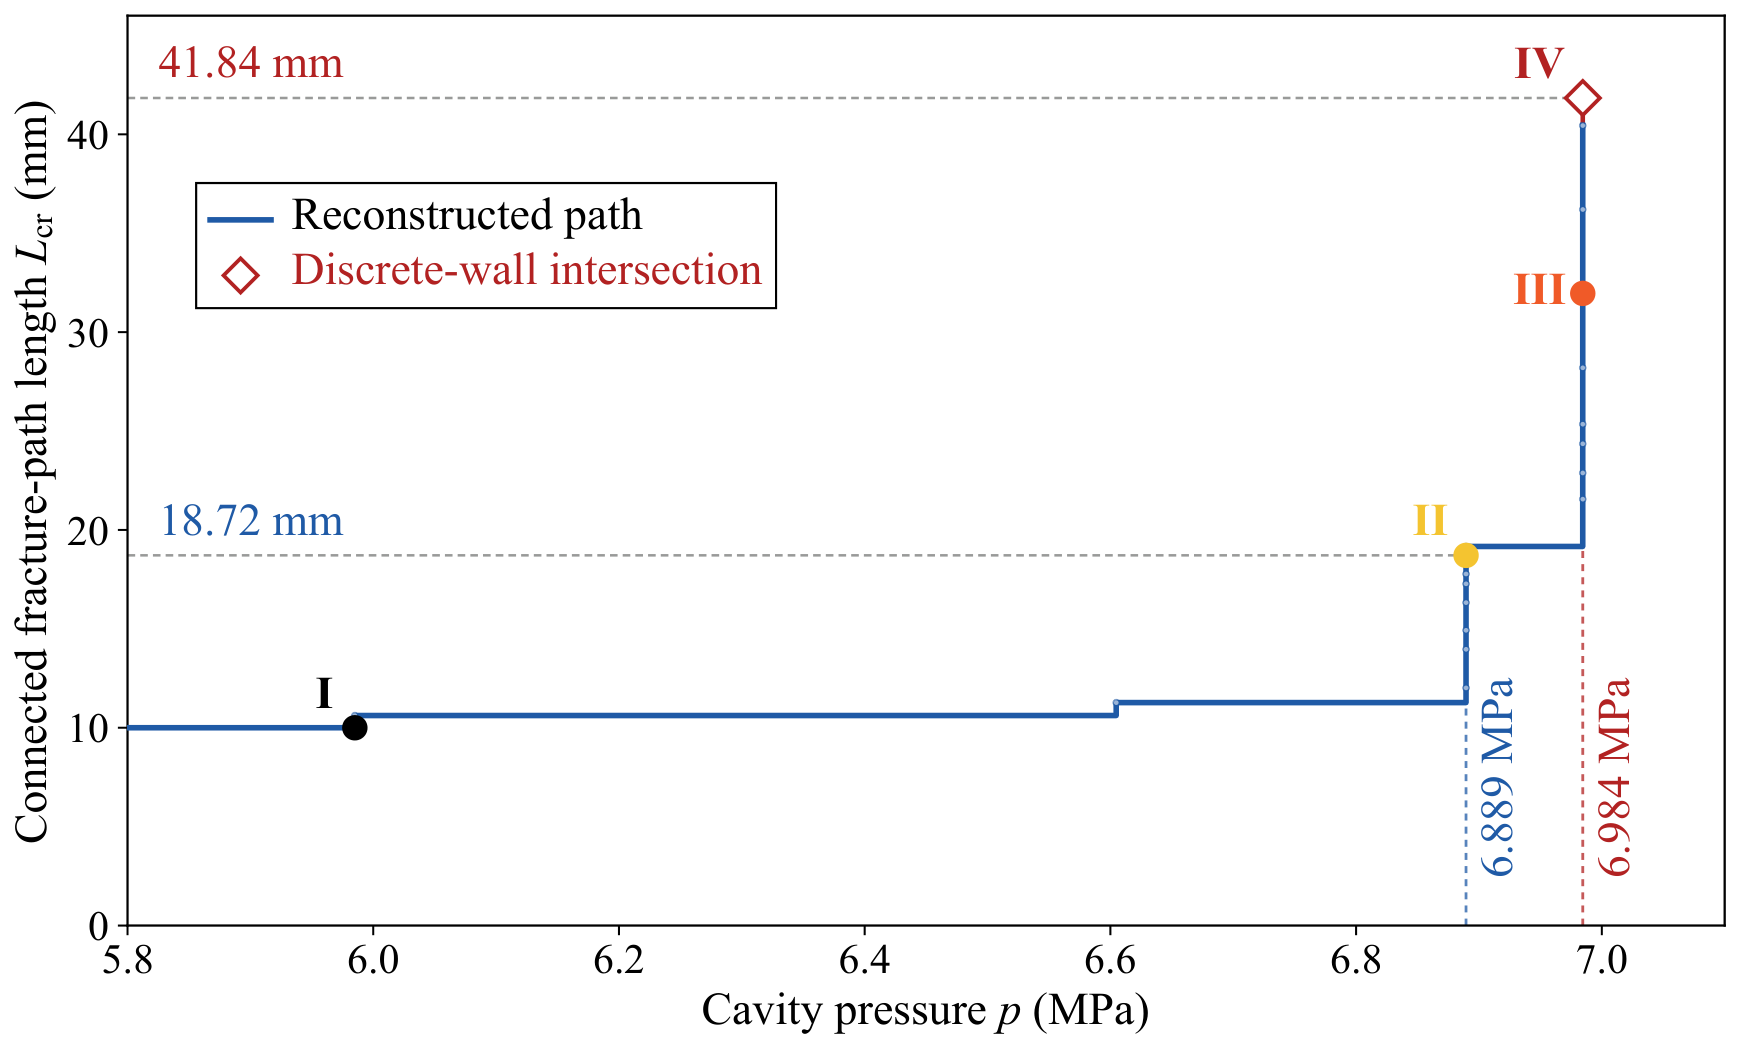
At , the last pre-intersection equilibrium has a source-connected path. The relative force residual is , and the maximum stretch-to-threshold ratio among surviving breakable bonds is . Failed bonds near the tip support another path extension at the same pressure. The next accepted segment reaches the discrete tunnel wall, increasing the reconstructed path length to (Stage IV). This stage records the first geometric intersection using the preceding equilibrium displacement field.
Figure 8 relates path extension to the imposed pressure. The markers labeled I–IV in Figure 8 correspond to the four fracture-growth stages shown in Figure 7. Several extensions occur within the same fixed-pressure propagation step. From Stages II to IV, the path grows from to as pressure increases from to . Path length resolves the substantial growth within this narrow pressure interval. The shortest tip-to-wall distance reaches at the last pre-intersection equilibrium and zero at Stage IV. The ideal circular outline and discrete wall are distinguished in Figure 7.
Figure 8.
Pressure-driven evolution of the connected fracture-path length. The open diamond denotes the first intersection with the discrete tunnel wall.
Table 5 summarizes the four configurations. The cumulative failed-bond count includes only propagation-induced failures and excludes the initial defect bonds. The path length and remaining ligament quantify rock-bridge degradation, and the intersection pressure identifies the terminal intersection condition.
Table 5.
Representative configurations of rock-bridge fracture and path development.
5.3. Role of Pressure Loading on Newly Formed Fractures
A control calculation isolates the effect of pressure on newly formed surfaces. Geometry, material parameters, discretization, mechanical boundary conditions, failure criteria, and reconstruction rules are held fixed. The control applies pressure to the cavity wall and initial defect. Both calculations start from the initial configuration and reach .
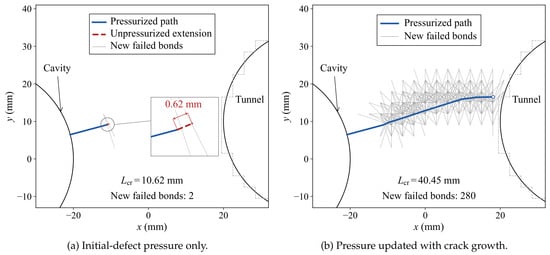
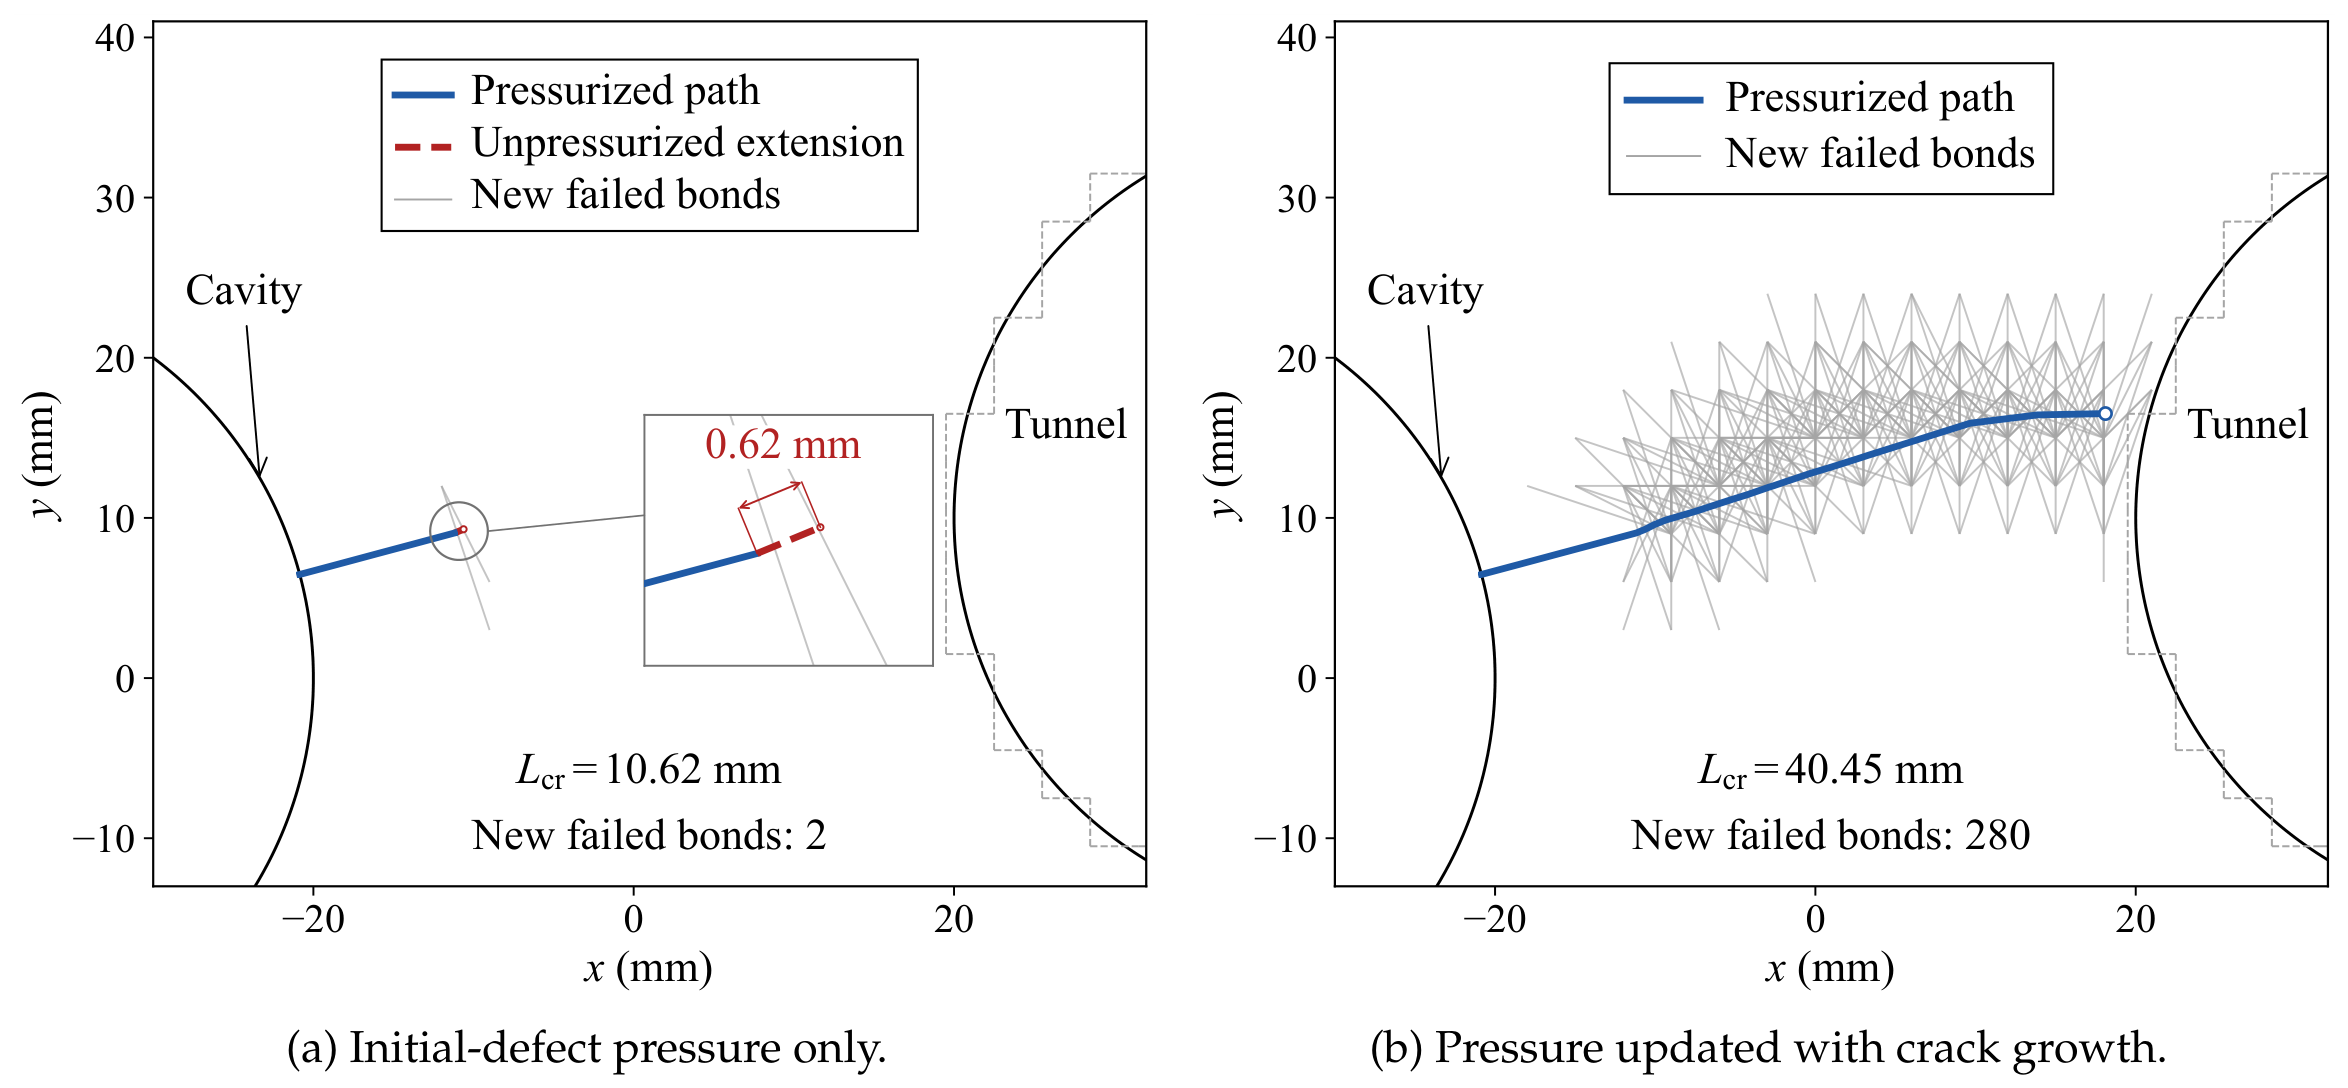
Both calculations produce the first new bond failure at but differ markedly during subsequent growth. With pressure confined to the cavity and initial defect, two new bonds fail, and the path reaches a length of (Figure 9a). The extension remains unpressurized. With pressure updated along the accepted path, 280 new bonds fail and the equilibrium path reaches (Figure 9b). The respective tip-to-discrete-wall distances are and . Blue lines mark pressure-loaded paths, and grey lines mark newly failed bonds. Figure 9b shows the intermediate mechanical equilibrium immediately preceding the Stage IV geometric event. The grey dashed outlines mark the discrete tunnel wall.
Figure 9.
Effect of pressure-boundary updating.
The contrast between Figure 9a,b isolates the effect of extending the pressure-loaded boundary. Initiation pressure alone therefore does not characterize subsequent rock-bridge degradation.
At and the original lattice phase, the source-connected path reaches the discrete tunnel wall on all three grids (Table 6).
Table 6.
Grid refinement of the cavity–tunnel response at .
Refinement from 3 to lowers the first-intersection pressure by and lengthens the pre-intersection equilibrium path under updated loading by . From 2 to , the pressure rises by and the path shortens by . Both quantities vary non-monotonically with refinement. On the three successively finer grids, the path under updated loading is , , and times as long as the path under initial-defect-only loading, respectively.
Sensitivity to the horizon ratio and lattice phase is examined on the grid at a common propagation stage: the first mechanical equilibrium at which the updated-loading path reaches or exceeds a total length of . With the original phase, horizon ratios of 2, , and 4 require pressures of , , and , respectively. At , shifting the lattice by half a grid spacing in both coordinate directions raises this pressure to , an increase of . The corresponding updated-loading and initial-defect-only paths are and at the same pressure. Each comparison retains a substantially longer path under updated loading at the examined propagation stage.
Experiments also distinguish initiation from propagation. Liu et al. [2] examined initiation from prefabricated crack tips under different inclinations and confining stresses. Dehghan [3] showed that fracture interaction depends on approaching angle and differential stress. Pressure-tunnel hydraulic-jacking tests identified opening events followed by pressure plateaus during propagation [4].
For the curved fracture paths in both the validation case based on the hydraulic-fracturing experiments of Liu et al. [29] and the cavity–tunnel rock-bridge example, the mapped pressure forces are nearly balanced, with normalized resultant errors below . The normalized moment residuals range from to , owing to small tangential offsets between opposing weighted loads. Across the recorded bond failures, the energy removed at the actual failure stretches exceeds the critical bond-energy total by and in the validation and rock-bridge calculations, respectively. This excess arises because some bonds fail at stretches above the critical value during fixed-pressure updates. At the last rock-bridge bond-failure update before intersection, the pressure work comprises the elastic-energy increment , the critical bond-failure energy , the above-threshold contribution , and the energy released during static re-equilibration . These energy quantities correspond to an out-of-plane thickness of .
The signed openings along the initial defects and reconstructed source-connected paths were evaluated at 113 stored mechanical equilibrium states to examine whether the pressure-loaded fracture surfaces remained open. All 3026 pressure-station evaluations yielded positive openings. For the three lattice configurations of the validation case ( phase A and phases A and B), the minimum openings ranged from to . In the rock-bridge calculation, the minimum opening was over the examined equilibria and at the last pre-intersection equilibrium, corresponding to a path length of .
6. Discussion
The source-connected fracture path is reconstructed from local failed bonds, building on the macroscopic fracture-tracing approaches of Qin et al. [22,23]. Each accepted extension updates the pressure-loaded boundary before the next equilibrium calculation at the same source pressure. The same geometric weights are used to define normal opening and distribute pressure forces. This construction keeps the discrete pressure work consistent with the opening measure while distinguishing the hydraulic fracture path from the surrounding distributed damage.
In the cavity–tunnel example, the two loading treatments give the same initiation pressure. Their responses diverge once the fracture extends beyond the initial defect. Pressure on newly formed faces drives the connected path farther toward the tunnel and leaves a shorter intact ligament. On each of the three grids, the last pre-intersection equilibrium path under updated loading is about four times as long as the path under initial-defect-only loading at the same pressure. Initiation pressure characterizes onset, while path length and the remaining ligament describe subsequent rock-bridge degradation.
On the curved paths examined in both examples, the opposing pressure loads give negligible resultant forces and small residual moments. The energy accounting distinguishes elastic storage, the critical and above-threshold portions of the energy removed with failed bonds, and the energy released as equilibrium is restored. These terms describe the energy change between successive quasi-static equilibria at fixed pressure. The signed openings were positive at all examined pressure stations, indicating that the reconstructed paths remained open at the recorded equilibria.
The parallel-plate cubic law [30] provides a conditional estimate of pressure loss when the calculated openings are treated as smooth-slot apertures. In the directional hydraulic-fracturing validation based on Liu et al. [29], the two developed branches are and long, each including its initial defect. At the experimental viscosity of , the corresponding local-flow bounds are and per millimeter of out-of-plane extent. Under the smooth-slot assumption, local flows below these bounds correspond to an estimated pressure drop of less than of the source pressure.
For the horizontal crack, grid refinement generally reduces the opening and initiation-pressure errors. In the directional-fracturing simulation, changes in point spacing or lattice phase alter the bonds that sample the notch-tip field. Initiation pressure varies non-monotonically with spacing, whereas the early propagation direction changes little. The horizon also affects the tip field through nonlocal averaging. In the rock bridge, all three grids reach the discrete tunnel wall, but the intersection pressure and pre-intersection path length vary with spacing. At a common propagation stage, the longer paths under updated pressure loading also persist across the horizon ratios and lattice phases examined.
The formulation uses two-dimensional plane strain, classical BB-PD with , and quasi-static prescribed-pressure loading. Progressive brittle bond failures produce localized damage and connected fracture growth. Quasi-brittle softening in sandstone can alter crack-tip stress transfer and influence initiation pressure and fracture growth. Neighborhood truncation along newly formed fracture faces can also influence local stiffness and crack opening. The initial surface corrections remain fixed during fracture growth. Shojaei et al. [31] proposed optimized nodal influence weights to address truncated neighborhoods near free surfaces and cracks. Liu et al. [8] developed a three-dimensional hydromechanical coupled-element formulation that represents evolving fracture surfaces and couples fracture opening with fluid transport.
7. Conclusions
- 1.
- A topology-triggered BB-PD framework links local bond failure to a source-connected pressure-loaded fracture path. Supported path extensions update hydraulic loading at fixed pressure, while common weights keep pressure-force transfer conjugate to the opening measure.
- 2.
- At the finest tested spacing, crack-opening comparisons with analytical and independent FEM solutions agree within for horizontal and inclined cracks. Initiation-pressure errors against LEFM remain below . Horizontal-crack refinement reduces both opening and initiation-pressure errors, while lattice-orientation dependence remains evident.
- 3.
- Across the tested lattices, the directional validation yields early macroscopic path directions close to the mixed-mode reference across the tested lattices. Initiation pressure is more sensitive than the early path direction to point spacing and lattice phase. The damage band widens more slowly than the connected path extends, supporting their separate use as transverse and longitudinal fracture measures.
- 4.
- In the cavity–tunnel application, updating the loaded path produces a pre-intersection equilibrium path, compared with when pressure is confined to the initial defect. Both treatments have the same initiation pressure. Initiation pressure alone is therefore insufficient to characterize subsequent rock-bridge degradation; the evolving pressure-loaded boundary must also be considered.
Author Contributions
Conceptualization, T.L. and X.X.; methodology, T.L.; software, T.L.; validation, T.L. and S.H.; formal analysis, T.L.; investigation, T.L. and S.H.; resources, S.H. and X.X.; data curation, T.L.; writing—original draft preparation, T.L.; writing—review and editing, S.H. and X.X.; visualization, T.L.; supervision, X.X.; project administration, S.H. and X.X.; funding acquisition, S.H. All authors have read and agreed to the published version of the manuscript.
Funding
This research was funded by the National Natural Science Foundation of China, grant number 52308355.
Institutional Review Board Statement
Not applicable.
Informed Consent Statement
Not applicable.
Data Availability Statement
The data presented in this study are available on request from the corresponding author.
Conflicts of Interest
The authors declare no conflicts of interest. The funders had no role in the design of the study; in the collection, analyses, or interpretation of data; in the writing of the manuscript; or in the decision to publish the results.
References
- Chen, B.; Barboza, B.R.; Sun, Y.; Bai, J.; Thomas, H.R.; Dutko, M.; Cottrell, M.; Li, C. A Review of Hydraulic Fracturing Simulation. Arch. Comput. Methods Eng. 2022, 29, 1–58. [Google Scholar] [CrossRef] [Scilit]
- Liu, Z.; Yang, J.; Yang, L.; Ren, X.; Peng, X.; Lian, H. Experimental Study on the Influencing Factors of Hydraulic Fracture Initiation From Prefabricated Crack Tips. Eng. Fract. Mech. 2021, 250, 107790. [Google Scholar] [CrossRef] [Scilit]
- Dehghan, A.N. An Experimental Investigation Into the Influence of Pre-Existing Natural Fracture on the Behavior and Length of Propagating Hydraulic Fracture. Eng. Fract. Mech. 2020, 240, 107330. [Google Scholar] [CrossRef] [Scilit]
- Ødegaard, H.; Nilsen, B. Simplified Hydraulic Jacking Test to Assess Fracture Normal Stress for Unlined Pressure Tunnels: A Field Experiment Using the Rapid Step-Rate Test. Rock Mech. Rock Eng. 2023, 56, 647–668. [Google Scholar] [CrossRef] [Scilit]
- Heider, Y. A Review on Phase-Field Modeling of Hydraulic Fracturing. Eng. Fract. Mech. 2021, 253, 107881. [Google Scholar] [CrossRef] [Scilit]
- Wilson, Z.A.; Landis, C.M. Phase-Field Modeling of Hydraulic Fracture. J. Mech. Phys. Solids 2016, 96, 264–290. [Google Scholar] [CrossRef] [Scilit]
- Li, W.; Frash, L.P.; Lei, Z.; Carey, J.W.; Chau, V.T.; Rougier, E.; Meng, M.; Karra, S.; Nguyen, H.T.; Rahimi-Aghdam, S.; et al. Investigating Poromechanical Causes for Hydraulic Fracture Complexity Using a 3D Coupled Hydro-Mechanical Model. J. Mech. Phys. Solids 2022, 169, 105062. [Google Scholar] [CrossRef] [Scilit]
- Liu, S.; Zhang, Z.; Huang, Z. Three-Dimensional Hydraulic Fracture Simulation with Hydromechanical Coupled-Element Partition Method. Int. J. Geomech. 2021, 21, 04021162. [Google Scholar] [CrossRef] [Scilit]
- Hu, J.; Mood, C.G.; Mear, M.E. An Efficient Computational Framework for Height-Contained Growing and Intersecting Hydraulic Fracturing Simulation via SGBEM–FEM. Comput. Methods Appl. Mech. Eng. 2024, 419, 116653. [Google Scholar] [CrossRef] [Scilit]
- Shahoveisi, S.; Vahab, M.; Shahbodagh, B.; Eisenträger, S.; Khalili, N. Phase-Field Modelling of Dynamic Hydraulic Fracturing in Porous Media Using a Strain-Based Crack Width Formulation. Comput. Methods Appl. Mech. Eng. 2024, 429, 117113. [Google Scholar] [CrossRef] [Scilit]
- Zhong, Y.; Yu, H.; Wang, Q.; Chen, X.; Ke, X.; Huang, H.; Wu, H. Hydraulic Fracturing in Layered Heterogeneous Shale: The Interaction Between Adjacent Weak Interfaces. Eng. Fract. Mech. 2024, 303, 110115. [Google Scholar] [CrossRef] [Scilit]
- Liu, C.; Xia, X. A Modified Nonlocal Macro–Micro-Scale Damage Model for the Simulation of Hydraulic Fracturing. Modelling 2025, 6, 58. [Google Scholar] [CrossRef] [Scilit]
- Wang, Q.; Yu, H.; Xu, W.; Huang, H.; Li, F.; Wu, H. How Does the Heterogeneous Interface Influence Hydraulic Fracturing? Int. J. Eng. Sci. 2024, 195, 104000. [Google Scholar] [CrossRef] [Scilit]
- Sarmadi, N.; Harrison, M.; Mousavi Nezhad, M.; Fisher, Q.J. Hydraulic Fracture Propagation in Layered Heterogeneous Rocks With Spatially Non–Gaussian Random Hydromechanical Features. Rock Mech. Rock Eng. 2024, 57, 8117–8140. [Google Scholar] [CrossRef] [Scilit]
- Silling, S.A. Reformulation of Elasticity Theory for Discontinuities and Long-Range Forces. J. Mech. Phys. Solids 2000, 48, 175–209. [Google Scholar] [CrossRef] [Scilit]
- Silling, S.A.; Askari, E. A Meshfree Method Based on the Peridynamic Model of Solid Mechanics. Comput. Struct. 2005, 83, 1526–1535. [Google Scholar] [CrossRef] [Scilit]
- Le, Q.V.; Bobaru, F. Surface Corrections for Peridynamic Models in Elasticity and Fracture. Comput. Mech. 2018, 61, 499–518. [Google Scholar] [CrossRef] [Scilit]
- Hu, C.; Chen, X. Dimensionless Modelling of Bond-Based Peridynamic Models and Strategies for Enhancing Numerical Accuracy. Modelling 2025, 6, 99. [Google Scholar] [CrossRef] [Scilit]
- Zhou, X.P.; Wang, Y.T.; Shou, Y.D. Hydromechanical Bond-Based Peridynamic Model for Pressurized and Fluid-Driven Fracturing Processes in Fissured Porous Rocks. Int. J. Rock Mech. Min. Sci. 2020, 132, 104383. [Google Scholar] [CrossRef] [Scilit]
- Zhang, Y.; Huang, D.; Cai, Z.; Xu, Y. An Extended Ordinary State-Based Peridynamic Approach for Modelling Hydraulic Fracturing. Eng. Fract. Mech. 2020, 234, 107086. [Google Scholar] [CrossRef] [Scilit]
- Ni, T.; Pesavento, F.; Zaccariotto, M.; Galvanetto, U.; Zhu, Q.-Z.; Schrefler, B.A. Hybrid FEM and Peridynamic Simulation of Hydraulic Fracture Propagation in Saturated Porous Media. Comput. Methods Appl. Mech. Eng. 2020, 366, 113101. [Google Scholar] [CrossRef] [Scilit]
- Qin, M.; Yang, D.; Chen, W.; Xia, X. Hydraulic Fracturing Network Modeling Based on Peridynamics. Eng. Fract. Mech. 2021, 247, 107676. [Google Scholar] [CrossRef] [Scilit]
- Qin, M.; Yang, D.; Chen, W. Three-Dimensional Hydraulic Fracturing Modeling Based on Peridynamics. Eng. Anal. Bound. Elem. 2022, 141, 153–166. [Google Scholar] [CrossRef] [Scilit]
- Lu, Y.; Cai, Z.; Huang, D.; Yao, X.; Ma, Q.; Chen, D. Peridynamic Modeling and Analysis of Interfacial Crack Propagation by Hydraulic Fracturing in Layered Shale. Comput. Geotech. 2025, 184, 107280. [Google Scholar] [CrossRef] [Scilit]
- Jin, A.; Huang, X.; Zhao, H.; Zhu, W. Damage Evolution Characteristics of Natural Fractures During Hydraulic Fracturing Process: A Peridynamic Hydro-Mechanical Coupling Model. Comput. Geosci. 2025, 29, 22. [Google Scholar] [CrossRef] [Scilit]
- Bezem, K.; Haeri, S.; TerMaath, S. A Dual-Horizon Peridynamics–Discrete Element Method Framework for Efficient Short-Range Contact Mechanics. Modelling 2025, 6, 131. [Google Scholar] [CrossRef] [Scilit]
- Sneddon, I.N. The Distribution of Stress in the Neighbourhood of a Crack in an Elastic Solid. Proc. R. Soc. London. Ser. A Math. Phys. Sci. 1946, 187, 229–260. [Google Scholar] [CrossRef] [Scilit]
- Nguyen, C.T.; Oterkus, S. Peridynamics for the Thermomechanical Behavior of Shell Structures. Eng. Fract. Mech. 2019, 219, 106623. [Google Scholar] [CrossRef] [Scilit]
- Liu, Z.; Yang, L.; Lian, H.; Feng, Z.; Yang, D. Experimental Study of Directional Fracturing in Sandstones with Prefabricated Cracks in the Axial Direction of Borehole. J. China Coal Soc. 2019, 44, 2057–2065. [Google Scholar] [CrossRef]
- Witherspoon, P.A.; Wang, J.S.Y.; Iwai, K.; Gale, J.E. Validity of Cubic Law for Fluid Flow in a Deformable Rock Fracture. Water Resour. Res. 1980, 16, 1016–1024. [Google Scholar] [CrossRef] [Scilit]
- Shojaei, A.; Ongaro, G.; Hermann, A.; Silling, S.A.; Trovalusci, P.; Cyron, C.J. Surface and Boundary Corrections in Peridynamics Using Optimized Nodal Influence Weights. Int. J. Numer. Methods Eng. 2026, 127, e70385. [Google Scholar] [CrossRef] [Scilit]

Disclaimer/Publisher’s Note: The statements, opinions and data contained in all publications are solely those of the individual author(s) and contributor(s) and not of MDPI and/or the editor(s). MDPI and/or the editor(s) disclaim responsibility for any injury to people or property resulting from any ideas, methods, instructions or products referred to in the content. |
© 2026 by the authors. Licensee MDPI, Basel, Switzerland. This article is an open access article distributed under the terms and conditions of the Creative Commons Attribution (CC BY) license.