


Abstract
Predicting fluid flow through rough fractures is critical for subsurface engineering, yet conventional models relying on equivalent hydraulic aperture often fail to capture the complex effects of aperture heterogeneity and spatial correlation. This study proposes a novel flow resistance framework that directly characterizes fracture permeability without assuming uniform apertures. We introduce an aperture-weighted segmentation method to identify flow bottlenecks and derive an effective hydraulic aperture formula incorporating the Hurst exponent to quantify surface roughness and spatial variability. The model is validated against high-fidelity lattice Boltzmann simulations across diverse synthetic fracture geometries, demonstrating superior accuracy compared to classical cubic law and existing empirical corrections. Results show that flow resistance, rather than permeability, serves as a more fundamental descriptor for irregular fractures, as it inherently accounts for localized constrictions and tortuosity. The proposed approach bridges the gap between micro-scale aperture statistics and macro-scale flow behavior, offering a physically consistent and computationally efficient tool for modeling fractured media. This work advances the understanding of structure–flow relationships in rough fractures and provides a robust alternative to traditional aperture-based parameterizations in reservoir simulation, geothermal energy extraction, and groundwater remediation applications.
1. Introduction
Fracture networks, comprising single fractures with fractal surfaces and variable apertures connected in series and parallel [1,2,3], constitute the dominant pathways for fluid flow in porous media [4,5]. Elucidating how the geometric configuration of fracture networks governs flow behavior is of critical importance to a wide range of engineering applications, including coalbed methane exploration and development [6,7], hydraulic fracturing [8], enhanced geothermal systems, regional groundwater migration and post-rainfall moisture dynamics in infrastructure layers such as pavement unbound materials [9,10], and so on [11]. Accurate characterization of fluid flow within such networks fundamentally relies on a thorough understanding of the flow mechanisms in individual discrete fractures [12,13].
The flow properties of a fracture are governed by its aperture distribution, motivating numerous aperture-based permeability models [14,15]. The classical cubic law relates the flow rate Q to the cube of the aperture b under the assumption of smooth parallel plates [16,17]. However, natural fracture surfaces are fractal and irregular, causing spatial aperture variability that significantly alters permeability [18,19,20]. Mechanical stress [21,22], chemical dissolution [23,24], and mineral precipitation [25] further modify aperture distributions [26,27,28]. The combined effects of aperture heterogeneity [29], surface roughness [30], and flow path tortuosity determine the effective hydraulic aperture [31,32]. Among these, aperture variation exerts the dominant control on flow, while surface roughness can be characterized through aperture statistics [33,34,35]. Accurately characterizing aperture variability and its influence on permeability therefore remains essential.
As discussed above, aperture governs fracture flow capacity [36]. However, the inherent spatial variability of natural fractures makes direct aperture measurement difficult [18]. Moreover, multiple aperture definitions exist—vertical [37], perpendicular [38,39], and segment aperture [37]—each reflecting different geometric interpretations. The perpendicular aperture measures the gap normal to the local fracture trend, while the segment aperture is defined as the perpendicular distance between two fitted surface segments. Although conceptually clear, segment aperture is challenging to measure due to the non-uniqueness of segmentation [40,41]. Since permeability depends critically on the chosen aperture definition, inconsistent definitions introduce significant uncertainty into permeability evaluation.
Spatial aperture variation creates heterogeneous flow resistance within a fracture. Small-aperture zones act as bottlenecks with high resistance [20,25,42], while large-aperture zones offer low resistance. Talon et al. [25] segmented fractures into bottleneck and normal regions connected in series to evaluate permeability. However, natural fractures often contain multiple bottlenecks, necessitating finer segmentation [15,20,29]. Consequently, how segmentation schemes affect permeability evaluation becomes critical. Ju et al. [29] divided fractures into variable-length segments based on profile morphology and evaluated permeability assuming matched top and bottom surfaces. Yet this matching assumption oversimplifies real fractures with mismatched walls, leading to non-unique segmentation [36,43]. To avoid this ambiguity, the present study adopts aperture as the unique basis for segmentation.
Permeability and flow resistance are the two fundamental parameters used to characterize flow through fractures [4,6,44,45]. Permeability quantifies the capacity of a medium to transmit fluid under a pressure gradient, depending directly on petrophysical rock properties such as porosity, pore geometry, and formation layering, which can be accurately evaluated from field data using physics-constrained neural network models [46], independent of fluid characteristics [47]. Fractures enhance permeability by increasing both porosity and connectivity, yet their contribution is inherently anisotropic and direction-dependent [11,45]. Fracture permeability is typically evaluated via the cubic law or its modifications [29,48,49], which relate flow rate to aperture. Alternatively, Darcy’s law can be applied using the pressure gradient along the fracture; however, this requires careful treatment of anisotropy and spatially varying cross-sectional areas [50,51,52]. For single fractures, the variability in aperture and cross-sectional geometry introduces significant uncertainty into permeability estimation regardless of which formulation is employed.
Flow resistance, serving as an extensive conduit metric directly analogous to electrical circuit resistance, characterizes the total frictional effects, both fluid–solid and fluid–fluid, that fractures impose on flow [31,53,54]. Unlike permeability, which reflects local transport capacity, flow resistance is governed by the overall fracture morphology rather than local features. This study therefore focuses on the flow mechanism in simplified 2D fractured conduits, analyzing how fracture morphology controls flow resistance and deriving an evaluation model. The main contributions are: (1) constructing self-affine fractures with variable apertures; (2) establishing a unique aperture measurement method and characterizing its spatial distribution; (3) developing a segmentation scheme that partitions fractures into large- and small-aperture components; (4) correcting the effective aperture by incorporating roughness and fractal properties of the aperture distribution; and (5) deriving a flow resistance model for rough fractures by combining serial connectivity among segments with the local cubic law. This work clarifies how aperture controls flow resistance and demonstrates the critical role of optimized segmentation in fracture flow analysis, providing a theoretical and methodological foundation for studying fluid flow through fracture networks.
2. Derivation of Flow Resistance Model
2.1. Limitations of the Term Permeability in Application
Permeability k is the fundamental parameter characterizing the capacity of a porous medium to transmit fluid [29,48,55,56]. As an intrinsic property dependent solely on material structure rather than fluid characteristics, it is determined via Darcy’s law from the linear relationship between flow rate Q and pressure difference :
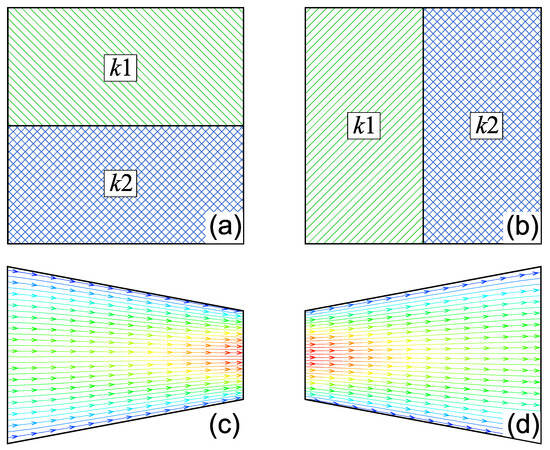
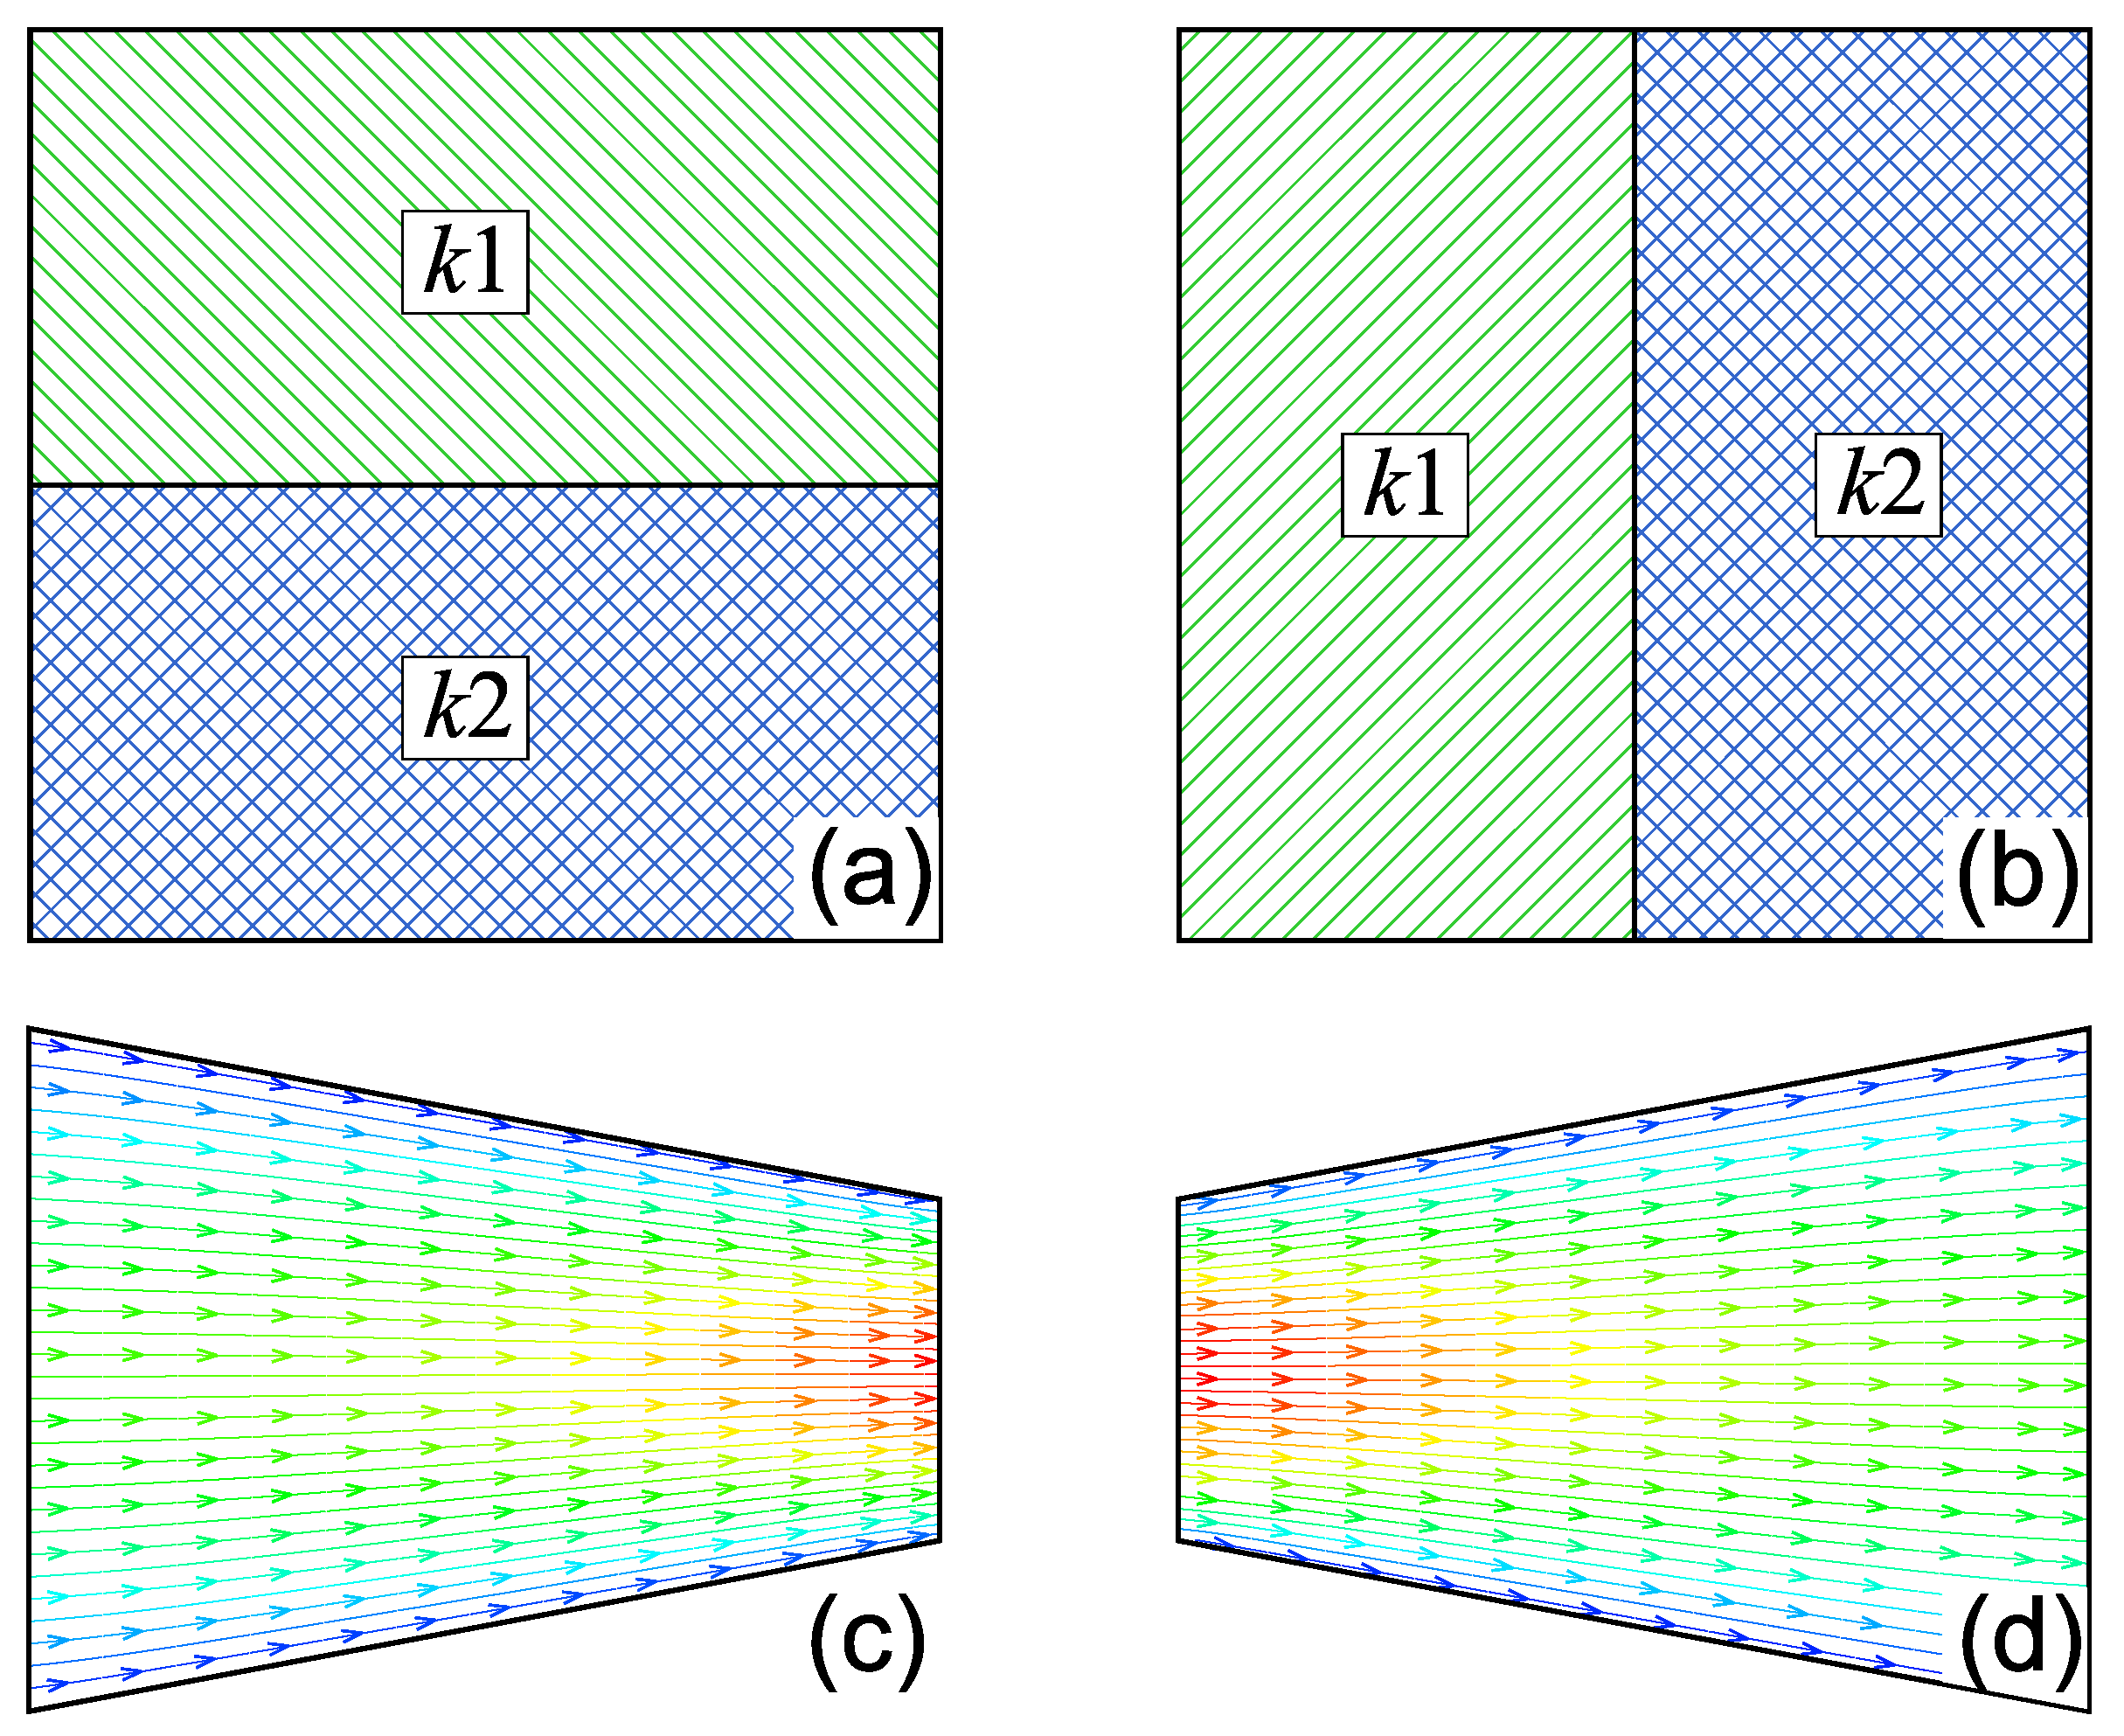
where is the fluid dynamic viscosity, and A and L are the cross-sectional area and length of the medium, respectively. However, permeability is an intensive property that cannot be obtained by spatially averaging the values of constituent materials in a heterogeneous block. Figure 1 illustrates this non-averaging behavior and the resulting uncertainty through four examples with left-to-right flow: (a) two materials with permeabilities and arranged in parallel, and (b) the same materials connected in series.
Figure 1.
Permeability illustration: (a) a parallel model with and , (b) a series model, (c) a trapezium-shaped object with smaller outlet, (d) the 180-degree-rotated (c). In (c,d), the color gradient from blue to red indicates increasing flow velocity.
For case (a), the total flow rate equals the sum through each material. If the interface is impermeable, the overall permeability is the thickness-weighted average , where and are the respective widths. However, if the materials are hydraulically connected across the interface, velocity contrasts alter the flow field, causing the effective permeability to deviate from this average; this constitutes the parallel model for fractures [57,58].
For case (b), mass conservation requires equal flow rates through both materials, while the total pressure drop is additive. Combining these conditions with Darcy’s law yields the harmonic mean , defining the series model [4,59].
Cases (c) and (d) are trapezoidal conduits with impermeable boundaries, where (d) is a 180-degree rotation of (c). The left boundary height is twice the right (). Under laminar flow with pressure difference , Equation (1) gives and . Since Q is identical for both under the same pressure , it follows that , demonstrating strong directional dependence of permeability on inlet–outlet orientation.
In Figure 1c,d, streamlines indicate flow direction, with color mapping velocity magnitude (blue to red). Velocity is higher in narrower aperture regions. Using = 0.002 Pa, = 0.001 Pa·s, horizontal length m (2048 lattice units), and boundary heights of m (left, 1536 lattice units) and m (right, 768 lattice units), the computed 2D flow rate is m2/s, yielding m2 and m2. These results confirm that permeability in heterogeneous geometries is inherently anisotropic.
The above analysis demonstrates that permeability alone is insufficient to characterize fluid transport in irregular geometries, particularly those with mismatched inlet and outlet areas. Conventional studies often focus on regular shapes, inadvertently neglecting such geometric asymmetry; this can lead to misapplication of permeability and an incomplete understanding of flow behavior. Therefore, this work aims to clarify the limitations of permeability and identify a more robust parameter for characterizing flow conductance or resistance in heterogeneous media.
2.2. The Derivation of Flow Resistance and Its Basic Laws
The analogy between fluid flow and electric current is well established, with both systems exhibiting parallel and series configurations [59,60,61]. By Ohm’s law, electrical components obey well-defined parallel and series resistance rules, where the resistance is governed solely by the geometry and resistivity of the material.
where R is the resistance, is the resistivity, and L and A are the length and cross-sectional area of the conductor, respectively. Resistivity is an intrinsic material property governing current obstruction, whereas resistance depends on both resistivity and geometry. Through this analogy, pressure difference corresponds to voltage U, and flow rate Q to current I. Combining Ohm’s law with Equation (1) yields:
The ratio defines the flow resistance [62], which depends on both the object’s geometry and the fluid’s dynamic viscosity. Comparing with Equation (2) reveals that is analogous to electrical resistivity ; this quantity is therefore defined as the flow resistivity . Since both and inherently incorporate fluid viscosity, it is necessary to decouple fluid properties from geometric characteristics. Following the relationship between permeability k and hydraulic conductivity K [, where is fluid density and g is gravitational acceleration], we introduce a modified flow rate , yielding a viscosity-independent flow resistance expressed as:
Consequently, is independent of fluid properties and has unit of m−3. The corresponding flow resistivity depends solely on permeability. This distinction mirrors the electrical analogy: is an intrinsic material property, whereas is a geometric property of the specific object.
Using , the effective flow resistance for series–parallel configurations can be expressed as:
where and represent the flow resistance of the two objects, respectively. This relationship is the same as that of a circuit.
In Section 1, the permeabilities for cases (c) and (d) are m2 and m2, respectively. Using from Equation (4), both yield an identical flow resistance m−3. This result is confirmed by the geometric expression , which gives the same value. The agreement demonstrates that , unlike permeability, provides a unified descriptor of fluid flow through channels with different geometries.
3. Methods and Theories
3.1. Construction of Fractal Fracture Morphology
Fractures are widely recognized as self-affine surfaces with spatially variable apertures [20,44,45,63]. To investigate the effects of aperture heterogeneity on nonlinear flow through such fractures, we generated a series of rough-walled fracture geometries using fractional Brownian motion (FBM) [64,65]. FBM is a generalization of classical Brownian motion whose stochastic increment follows a normal distribution with zero mean and variance . Accordingly, the probability density function is given by:
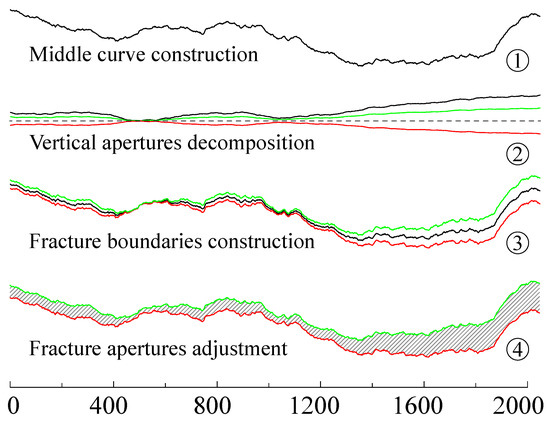
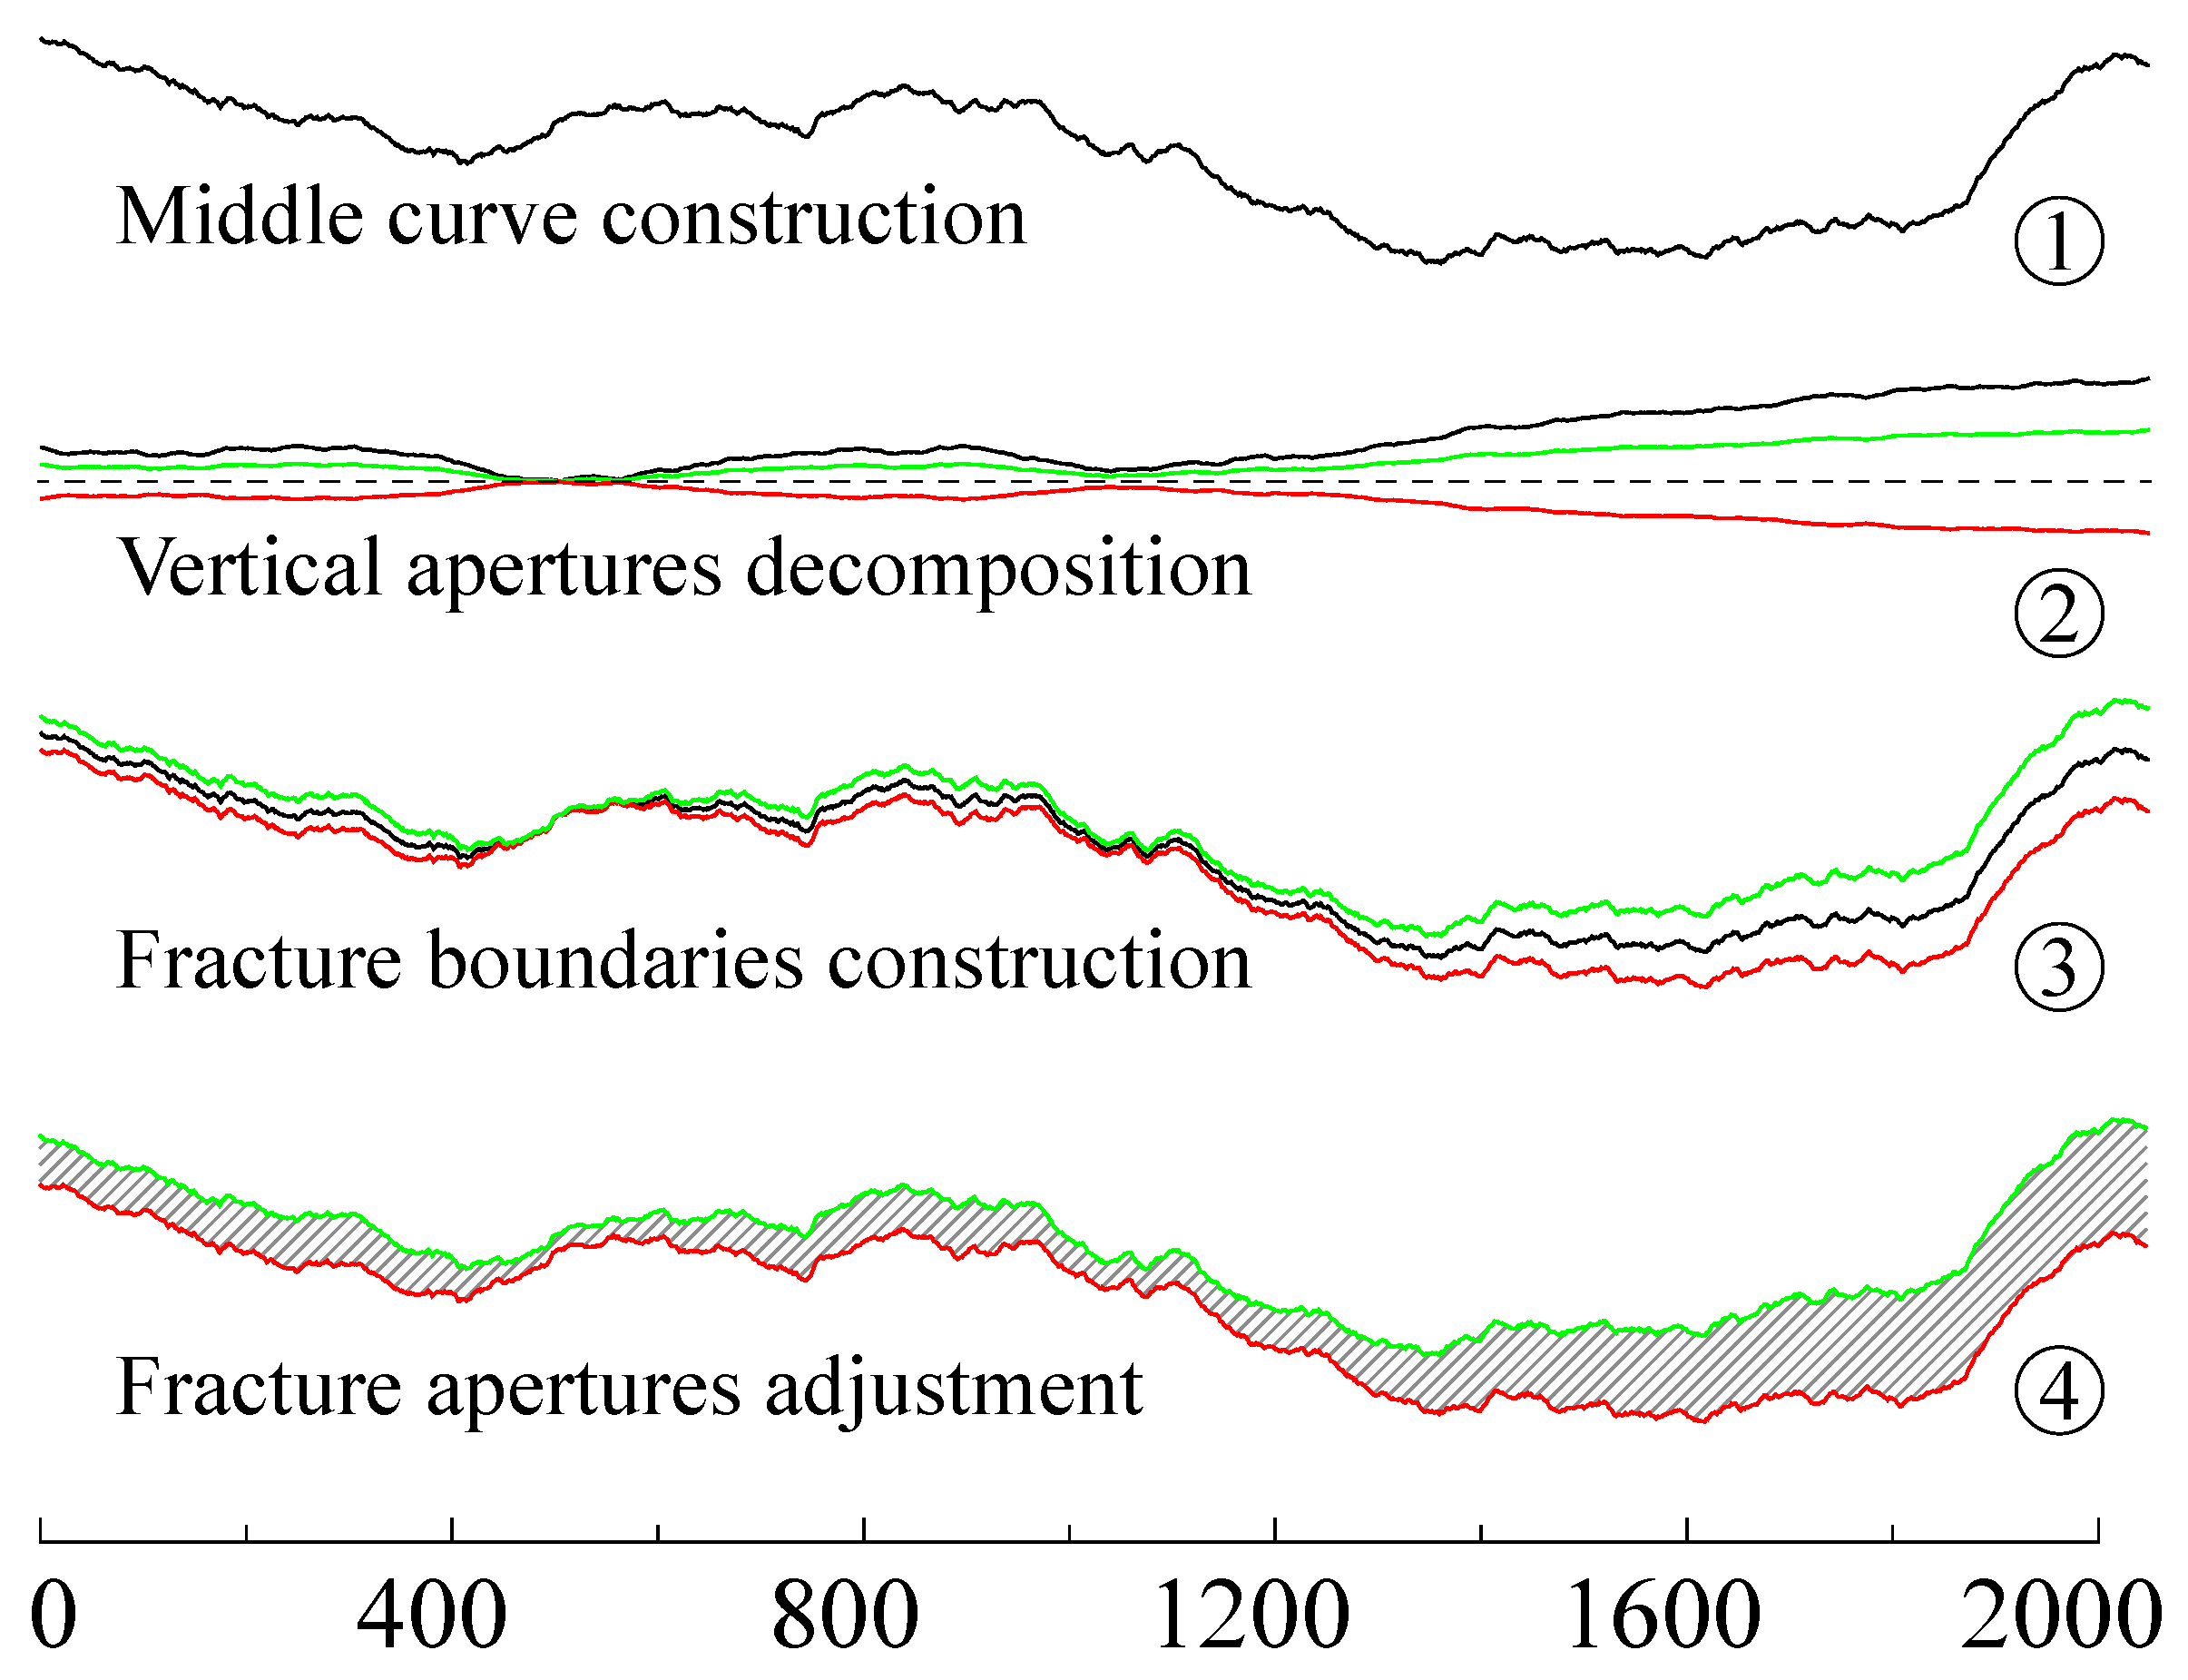
where is the time increment, is the volatility of FBM, and H is the Hurst exponent. The stochastic process is governed by and H, enabling the generation of self-affine profiles with tunable roughness. The fracture construction procedure using these profiles is illustrated in Figure 2 and comprises four steps:
Figure 2.
Fracture construction processes: (1) middle curve, (2) vertical aperture curve (Black) and its decomposition (Green: the top boundary, red: bottom boundary, dashed: zero), (3) reconstruction of fracture boundaries (Black: midline of step (1), green and red lines represent the top and bottom boundaries superimposed on the midline, respectively), (4) fracture aperture adjustment.
A fracture consists of two boundary profiles separated by an aperture field. Once both boundaries are defined, the composite morphology is fully determined. In step (1), a self-affine profile is generated via FBM and serves as the fracture midline. In step (2), a vertical aperture distribution is generated; its minimum value is zero (dashed line at ). This distribution is then split symmetrically about : the upper half (green) defines the top boundary, and the lower half (red), obtained by axial reflection of the green curve, defines the bottom boundary. Steps (3) and (4) complete the fracture geometry as shown in Figure 2.
In step (3), the upper and lower aperture components from step (2) are superimposed onto the midline to construct the top and bottom boundaries, respectively. As shown in Figure 2, this direct superposition may produce contact points between the two boundaries. In two-dimensional models, such contacts yield zero local aperture and thus infinite flow resistance, rendering the configuration physically meaningless. To eliminate this issue, the top boundary is translated upward by a prescribed offset, which simultaneously resolves the contact problem and enriches the aperture distribution. The resulting green top boundary, red bottom boundary, and the intervening aperture field together define the final fracture morphology [step (4)]. The horizontal axis labels indicate the number of control points used to discretize each rough profile.
3.2. Measurement of Fracture Apertures and Their Scale-Invariant Characterization
Fracture apertures play a critical role in fluid flow because the flow rate scales with the cube of the aperture (the cubic law) [14,40,66]. Accurately defining and measuring fracture apertures is therefore essential for evaluating flow behavior. Given the bottleneck effect of the smallest aperture on fluid flow [20,25], the orthogonal aperture at each point on the fracture boundary is adopted as the local aperture. The orthogonal aperture is, by definition, the minimum aperture and is straightforward to compute. An additional advantage is that it guarantees a unique aperture distribution regardless of whether measurement proceeds from the upper or lower boundary.
With this definition, the aperture distribution of a single fracture can be obtained. For smooth parallel-plate fractures, the distribution is uniform, whereas for rough fractures the apertures exhibit fractal characteristics. Characterizing the aperture distribution of natural rough fractures therefore requires evaluating the scale invariance of the aperture field. Traditionally, the fractal dimension D of a rough profile is estimated from the power-law relation between the measurement scale r and the measured length , i.e., . However, this relation holds strictly only for self-similar objects and must be applied with caution to self-affine fractals.
Based on the general fractal topography framework of Jin et al. [67,68], characterizing the fractal behavior of self-affine profiles requires decomposing the scaling lacunarity P into directional components ( and in the x- and y-directions, respectively). In two dimensions, the Hurst exponent is then evaluated as , which is classically related to the fractal dimension by . Dong et al. [69] demonstrated that the relation does not hold for self-affine fractals and instead proposed the equivalent vertical height , where is the average measured length over a horizontal interval .
The equivalent vertical height obeys a power-law scaling , from which the Hurst exponent H is determined for each fracture aperture distribution in the present study. The scaling lacunarity relation follows directly from this expression.
3.3. Derivation of Flow Resistance Model for Variable-Aperture Fractures
For smooth parallel fractures, the aperture is uniform, and flow obeys the classical cubic law. Surface roughness in natural fractures disrupts laminar flow, making permeability evaluation difficult. The effect of profile roughness is commonly estimated using the standard deviation of surface height:
where W is the fracture width and is the mechanical aperture. and are:
Reported values of C vary widely (e.g., 17, 8.8, and 20.5) [14,16,70], and the origin of this discrepancy remains unclear [71], limiting the model’s practical applicability. Furthermore, this formulation requires the roughness to be small relative to the aperture so that the Reynolds equation remains valid [43,66]; at higher roughness, alone no longer captures the flow resistance [72,73].
To overcome this limitation, the fracture is discretized into segments and the local cubic law is applied. This approach relies on two assumptions: (i) the flow rate is constant across all segments, allowing the cubic law (or its variants) to be evaluated locally; and (ii) the total pressure drop equals the sum of segment-wise pressure drops. Combining these conditions yields the hydraulic aperture of the entire fracture. Below we present the local cubic law without correction terms:
where n is the number of fracture segments. denotes the mean local aperture, and i indexes each segment. W is the width of the fracture. Roughness effects can be incorporated into Equation (10) in a straightforward manner.
This equation also lacks a roughness correction term, which becomes necessary when segment-scale roughness significantly affects flow. We therefore revise Equation (11) as:
where is the standard deviation of local apertures. The inclusion of the width parameter W renders the model theoretically applicable to 3D single fractures. For 2D fractures, the width is set to .
Physically, surface roughness reduces the effective hydraulic aperture. Moreover, even for profiles sharing the same roughness factor, different fractal dimensions produce distinct spatial fluctuation patterns [70,74]. To capture this additional influence, the Hurst exponent H is introduced as a complementary roughness descriptor. Because the precise functional dependence on H remains undetermined, it is represented here by a general function . Once is calibrated, the model can fully quantify fracture flow resistance.
3.4. Fracture Segmentation Based on Aperture Size Distribution
As described in Section 3.3, fractures are discretized into segments to estimate flow properties. Early approaches used uniform segment lengths or visually determined divisions [15,37,75]. Ju et al. [29] proposed variable-length segmentation to better conform to the fracture profile geometry. However, this method treats the profile itself as the segmentation reference, requiring matched top and bottom surfaces; different profiles yield inconsistent segmentations. Natural fractures often exhibit shear displacement, surface erosion, and other complexities that violate this assumption [31,76], limiting the applicability of profile-based segmentation despite its advantages over uniform division.
In this study, we adapt the variable-length method for fractures with spatially varying apertures. Because discrepancies between top and bottom surface morphologies lead to non-unique profile-based segmentations, a unique segmentation reference is required. The aperture field directly governs flow rate and, once defined, provides an unambiguous basis for segmentation. We therefore use the perpendicular aperture distribution along the fracture as the segmentation object.
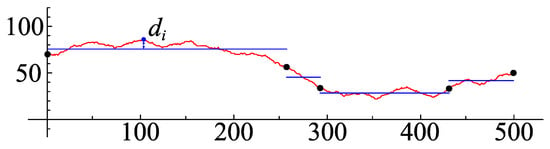
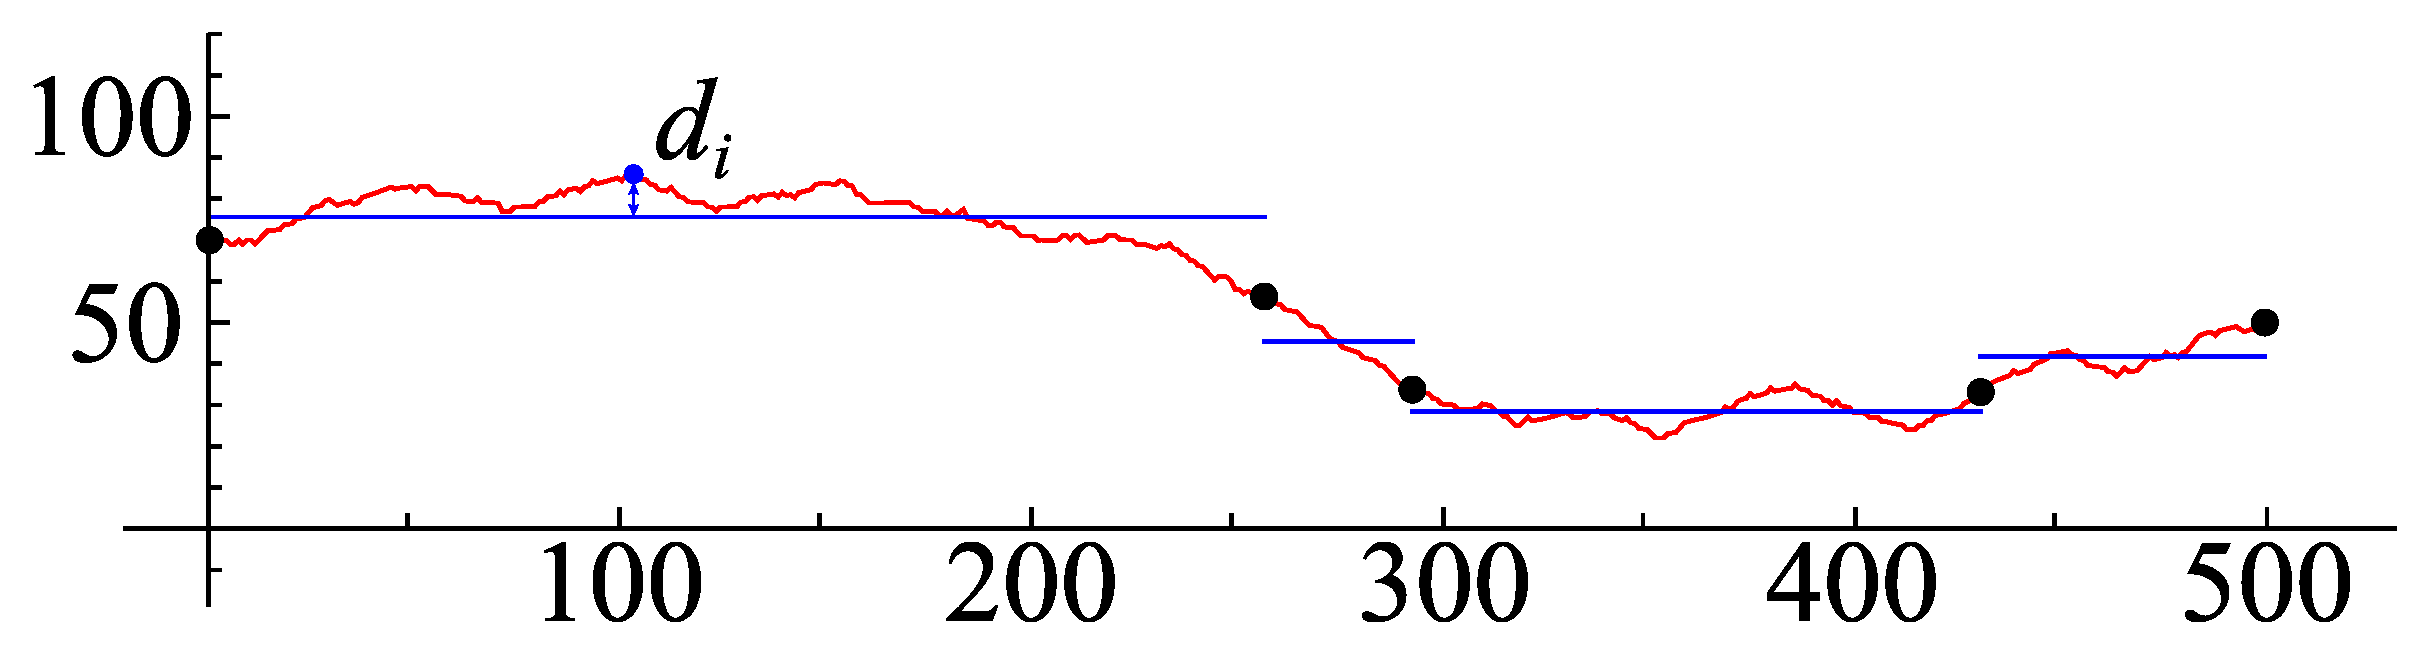
Perpendicular apertures vary continuously even when the top and bottom profiles are identical. Moreover, both experiments and simulations have confirmed that single-fracture flow is highly sensitive to aperture distribution [34,77]. To account for the differential influence of local apertures on flow, we incorporate aperture weighting into the segmentation scheme. Following the cubic dependence in the cubic law and the approach of Dong and Ju [20], the inverse cubic aperture is adopted as the weight function. Accordingly, the objective function is revised as:
where is the perpendicular distance from the aperture profile (red) to its trend line (blue), as illustrated in Figure 3.
Figure 3.
Illustration of the search objective function, where is the distance from the fracture aperture distribution (red line) to its current average trend line (blue line).
Optimal segmentation corresponds to the minimum of the objective function, which is obtained using the cuckoo search (CS) algorithm. CS is an evolutionary algorithm inspired by the brood parasitism of cuckoos; its incorporation of Lévy flights can yield superior search efficiency compared with particle swarm optimization and genetic algorithms [78,79]. Because this study focuses on the flow resistance model for single fractures, a detailed exposition of CS is omitted here; readers are referred to Yang and Deb [79] and Cheung et al. [80] for comprehensive descriptions.
3.5. Numerical Simulation of Fluid Flow
Research on fluid flow through rough fractures primarily relies on analytical derivation, physical experiments [2,70,81], and numerical simulations [15,29,82]. Among these approaches, numerical simulation offers greater flexibility in parameter control and higher accuracy [70,83,84].
The Navier–Stokes equations for single-phase incompressible Newtonian flow can be solved by various numerical methods, including the Finite Element Method (FEM), the Finite Difference Method (FDM), and Smoothed Particle Hydrodynamics (SPH). The lattice Boltzmann method (LBM) distinguishes itself as a mesoscopic, bottom-up approach that avoids solving the Poisson pressure equation, resulting in a simpler algorithmic structure [85,86]. Moreover, because both collision and streaming operations are local, LBM is particularly well suited for flows in media with complex boundary geometries, such as porous and fractured media [87,88].
The lattice Boltzmann simulations were performed using the open-source Palabos framework (version 2.0r0). The solver employs a two-dimensional D2Q9 lattice with a multiple-relaxation-time (MRT) collision operator. All relaxation rates are uniformly set to , corresponding to a dimensionless relaxation time and kinematic viscosity .
Flow through the porous medium is driven solely by a pressure gradient; no external body force is applied. Zou–He pressure boundary conditions are imposed at the inlet () and outlet (), with densities fixed to and , respectively, yielding a prescribed pressure difference of in lattice units. Solid obstacles are defined by a geometry mask field: cells marked as solid employ the half-way bounce-back scheme for no-slip walls, while void cells use standard MRT dynamics. The domain is initialized with a linear equilibrium density profile and zero velocity to accelerate convergence. Steady state is deemed reached when the relative change in total kinetic energy between successive sampling intervals falls below .
4. Results and Discussion
Following aperture measurement, fracture segmentation, and LBM simulation, we performed the corresponding analyses. All results are presented in lattice units for clarity and simplicity. In the LBM framework, the computational domain is discretized into a regular lattice where solid and void phases are represented by black and white pixels, respectively; each pixel (lattice node) has a unit length of 1. Although lattice-unit quantities can be converted to SI units via established scaling rules [85], this study does not target a specific physical fracture, and all results are therefore reported directly in lattice units without conversion.
4.1. Distribution Characteristics and Scale Invariance of Fracture Apertures
First, a series of rough fractures are synthesized using FBM and the construction method described in Section 3.1. Each fracture morphology is encoded as “M1mH2hA3aK4k”, where the uppercase letters M, H, A, and K denote the middle curve, vertical-aperture Hurst exponent, vertical-aperture amplitude, and aperture adjustment range, respectively, and the lowercase indices m, h, a, and k indicate their respective parameter levels.
Because the middle curves exhibit relatively low roughness, five parameter sets with high Hurst exponents are used for their synthesis. The corresponding pairs are {0.2178, 0.9999}, {0.3186, 0.95}, {0.4665, 0.90}, {0.6830, 0.85}, and {1.0, 0.80}, assigned to levels m = 1–5.
The vertical-aperture morphology is likewise governed by and H, but spans a much wider roughness range. Accordingly, six Hurst exponents are selected: (Table 1). For each H, is adjusted so that the peak-to-valley height difference falls within a prescribed interval; these values are listed in Table 1, where columns correspond to increasing peak-to-valley differences. Six target peak-to-valley differences ({0.0001, 20, 40, 60, 80, 100}) are considered, so both h and a in the encoding range from 1 to 6.
Table 1.
The parameter settings for vertical apertures.
When the fracture is constructed by combining the middle curve with the vertical apertures, the minimum aperture may be zero, yielding zero permeability and rendering flow simulation meaningless. To avoid this, a uniform base aperture k is added to each fracture. Four base-aperture values (12, 22, 32, and 42 lattice units) are employed to ensure numerical accuracy; these correspond to levels k = 1–4 in the encoding scheme. With all four control variables fully specified, the complete set of synthetic fractures comprises realizations.
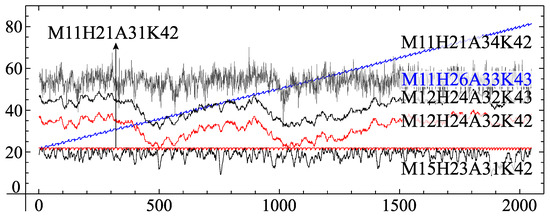
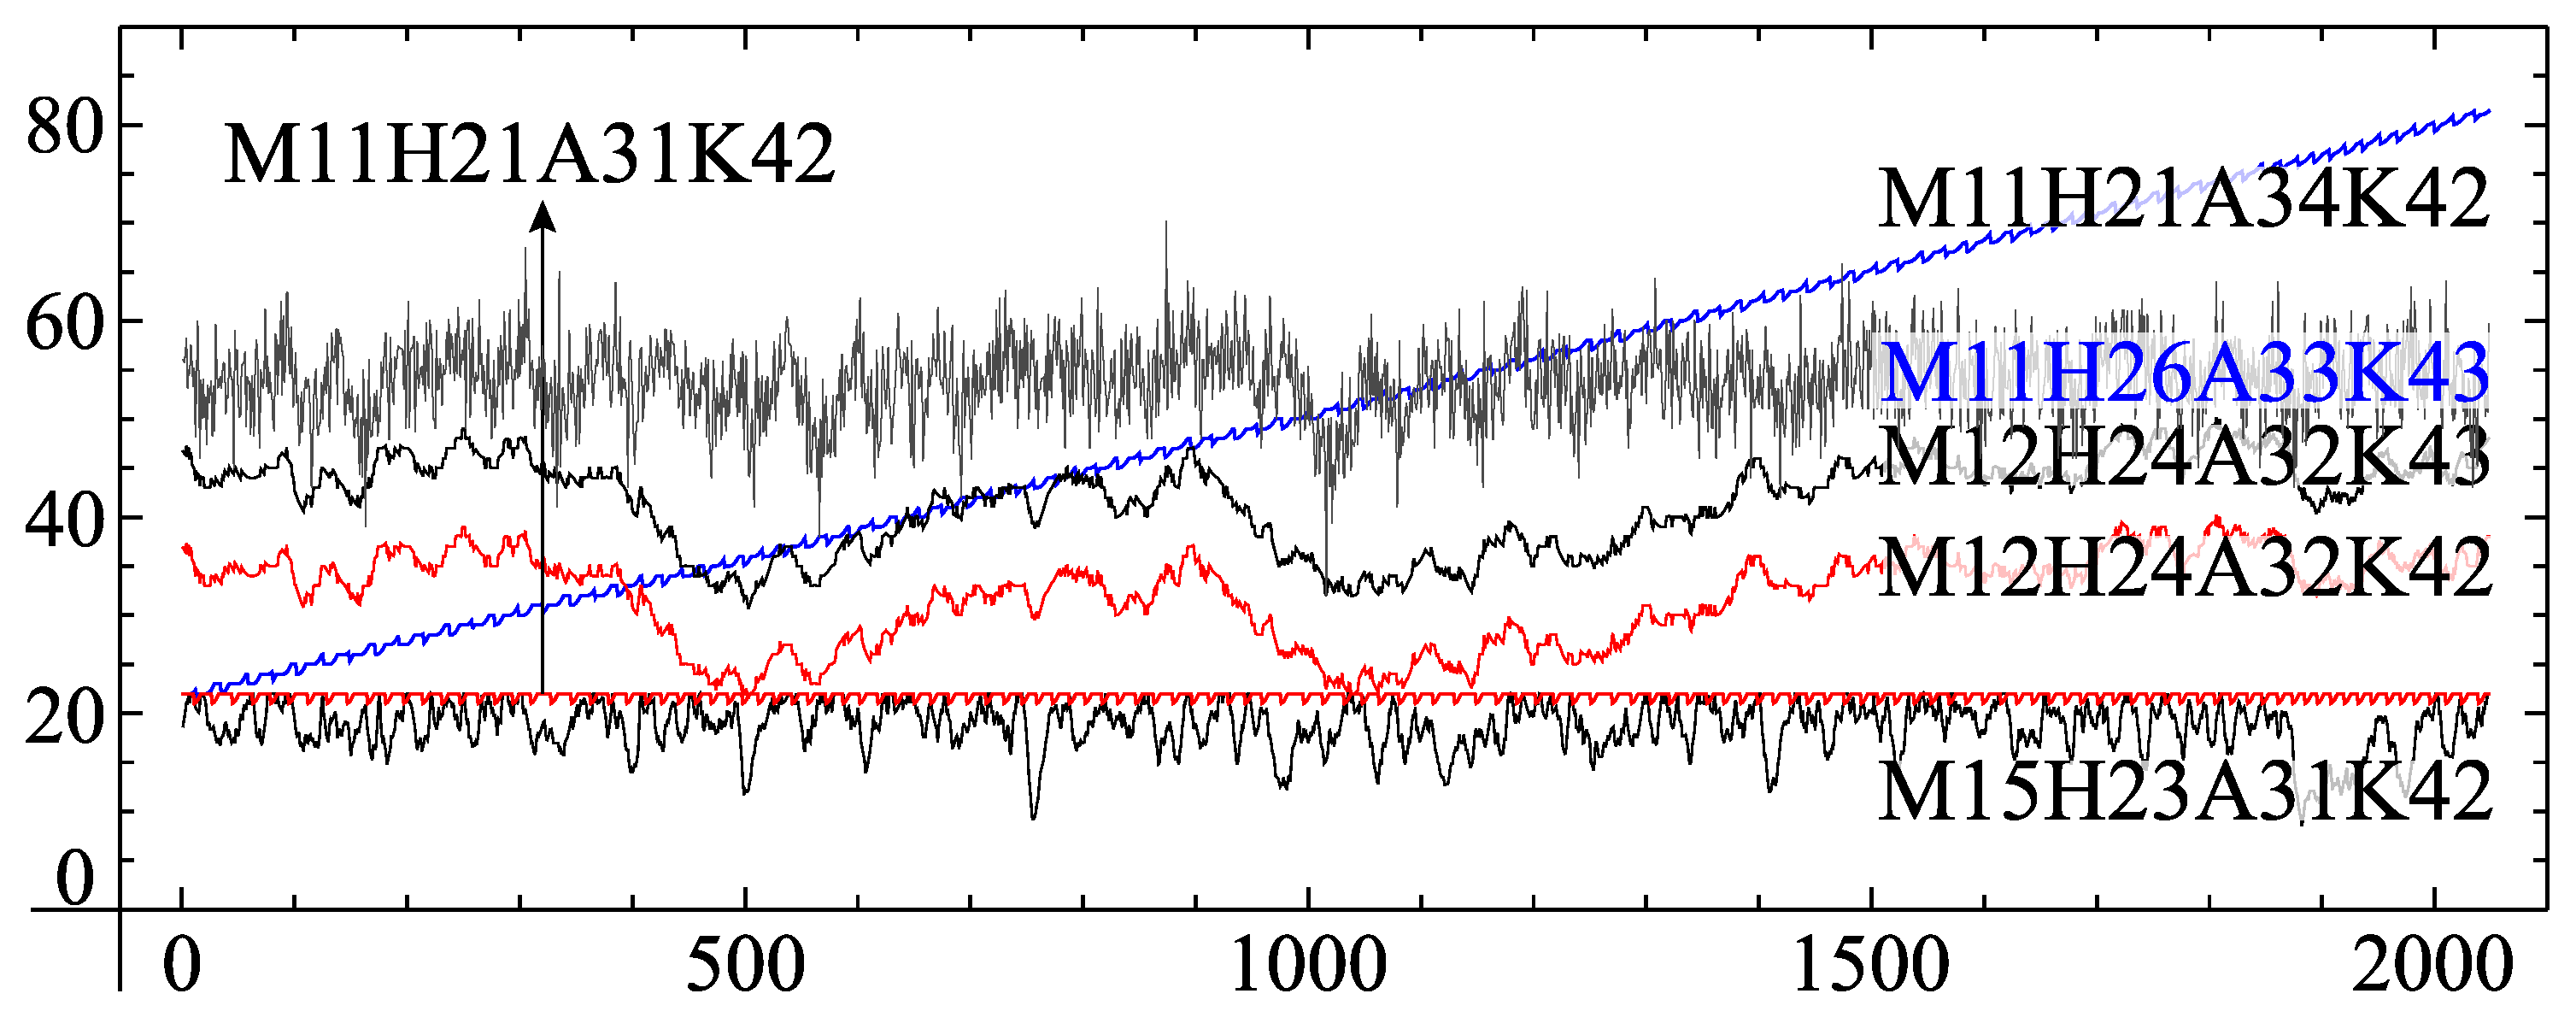
The perpendicular apertures of the constructed fractures are then evaluated using the measurement method described in Section 3.2. Selected results are compared in Figure 4, where the abscissa denotes the horizontal position along the fracture and the ordinate represents the local perpendicular aperture. The profiles exhibit pronounced spatial variability and roughness, which act as hydraulic barriers to fluid flow and motivate the detailed analysis of aperture variation presented below.
Figure 4.
Perpendicular aperture distributions of fractures with different morphologies.
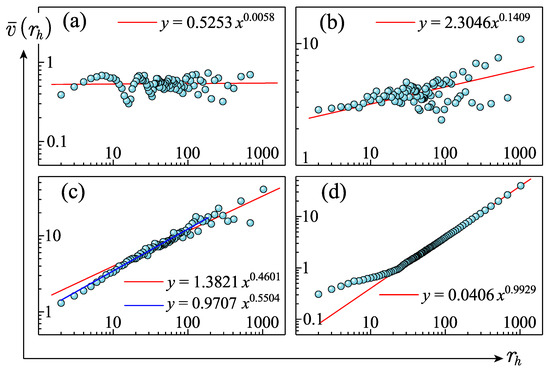
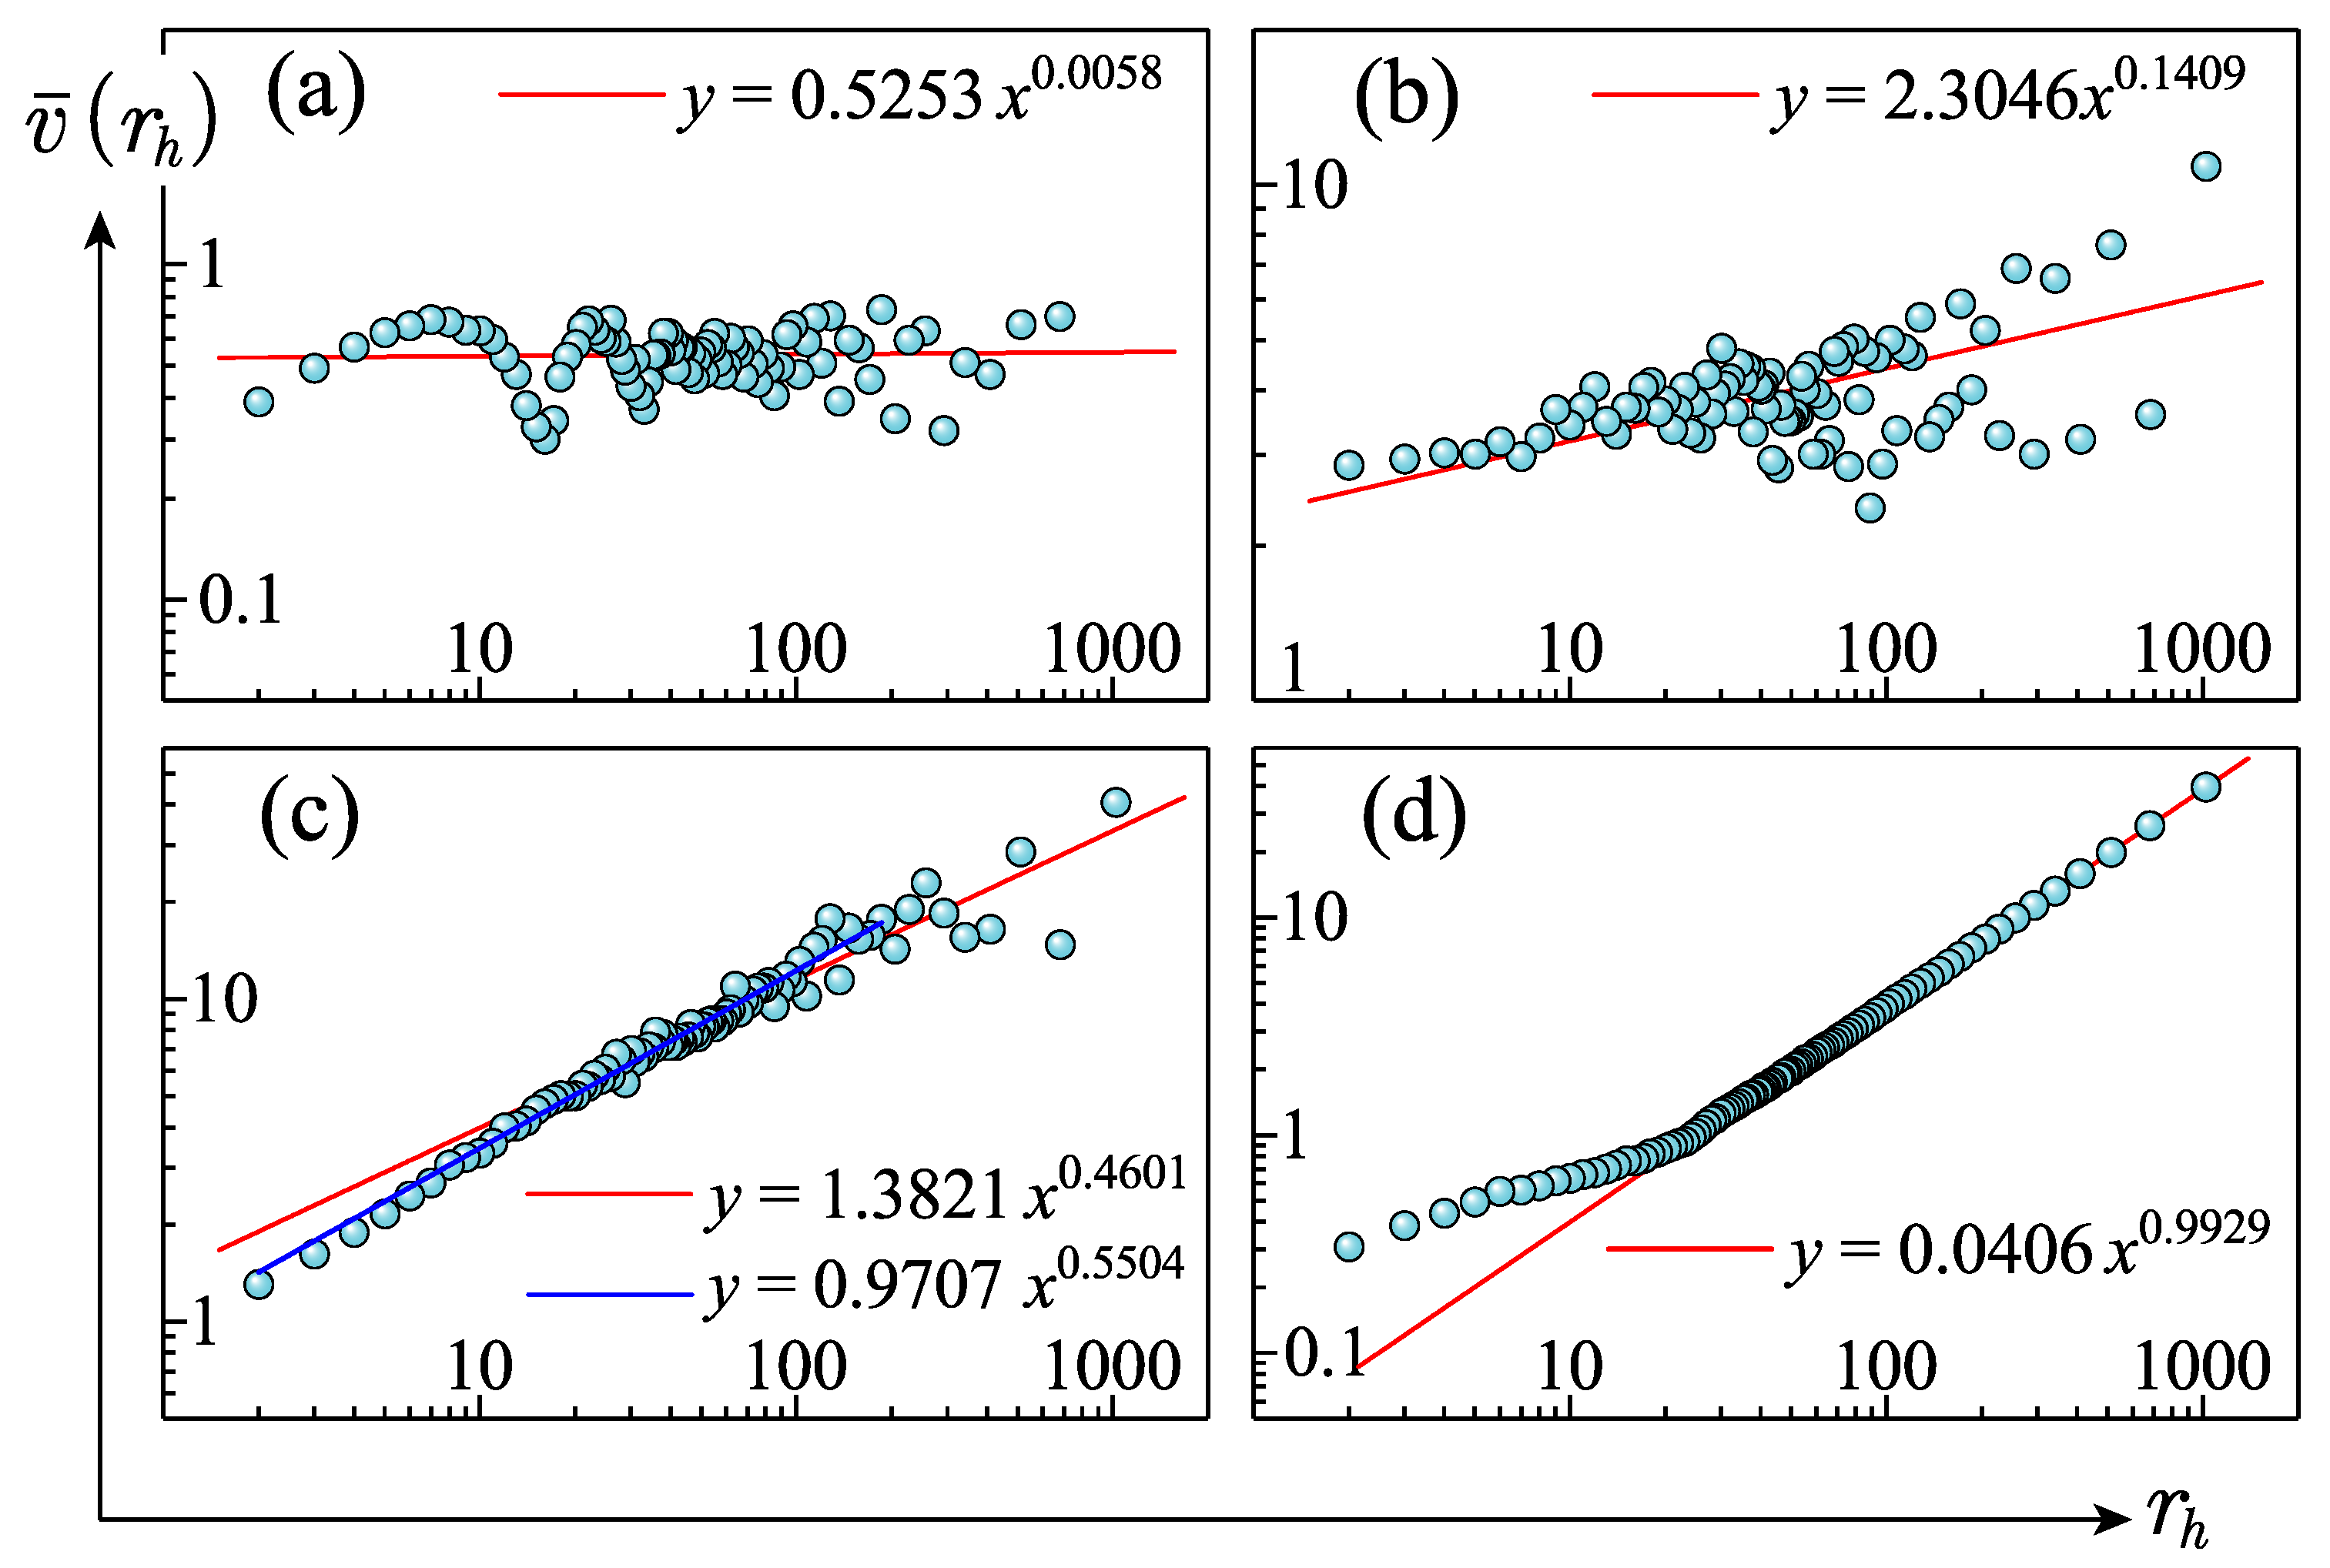
Owing to the irregular nature of fracture apertures, fractal theory has been widely adopted to characterize their spatial variability and roughness [8,40,67]. Following the fractal topography framework proposed by Jin et al. [67,89], this study examines the scale-invariant properties of the aperture profiles. Figure 5 illustrates this scale invariance through the power-law relationship between and . As established in Section 3.2, the exponent of this power law corresponds to the Hurst exponent H of the fracture aperture, which varies with the underlying aperture distribution. Four representative cases—M11H21A31K43, M11H26A33K43, M11H21A35K43, and M13H24A34K43—are plotted on log–log axes in Figure 5a–d.
Figure 5.
Scale invariance demonstrated via the power-law relationship between and . Subfigures (a), (b), (c), and (d) correspond to M11H21A31K43, M11H26A33K43, M11H21A35K43, and M13H24A34K43, respectively.
In Figure 5a, remains nearly constant across the range of , indicating that the equivalent vertical height is essentially independent of the observation scale. Aperture profiles exhibiting this behavior are approximately horizontal, as exemplified by M11H21A31K42 and M15H23A31K42 in Figure 4; their upper and lower surfaces are identical or differ only marginally. Fractures displaying this type of scale invariance are classified as Type I, and the complete list is provided in Table 2.
Table 2.
Fracture types corresponding to different parameters.
Figure 5b corresponds to Type II fractures (Table 2). The associated aperture profiles in Figure 4 reveal extreme roughness, and the power-law relationship between and is consequently weak. As indicated in Table 2, the encoding h = 6 for Type II fractures corresponds to a Hurst exponent of 0.0001, confirming the highly irregular nature of the vertical apertures.
Figure 5c,d both exhibit clear power-law relationships, with most data points closely following the linear fit on log–log axes. These cases correspond to Type III fractures in Table 2, with (c) and (d) representing subtypes III-1 and III-2, respectively. From the scaling relation , the slope of the fitted line directly yields the Hurst exponent H of the aperture distribution. This exponent quantifies the spatial variability of fracture apertures and serves as a key parameter characterizing the hydraulic resistance induced by aperture roughness. Accordingly, it is adopted as one of two governing parameters in the corrected effective hydraulic aperture model described in Section 4.3.
4.2. Numerical Simulation Results
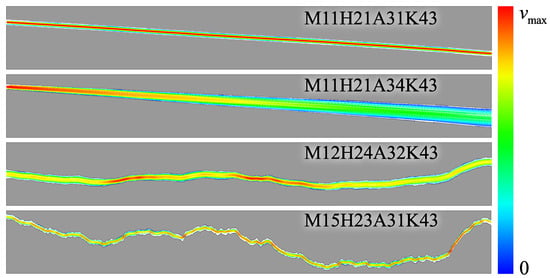
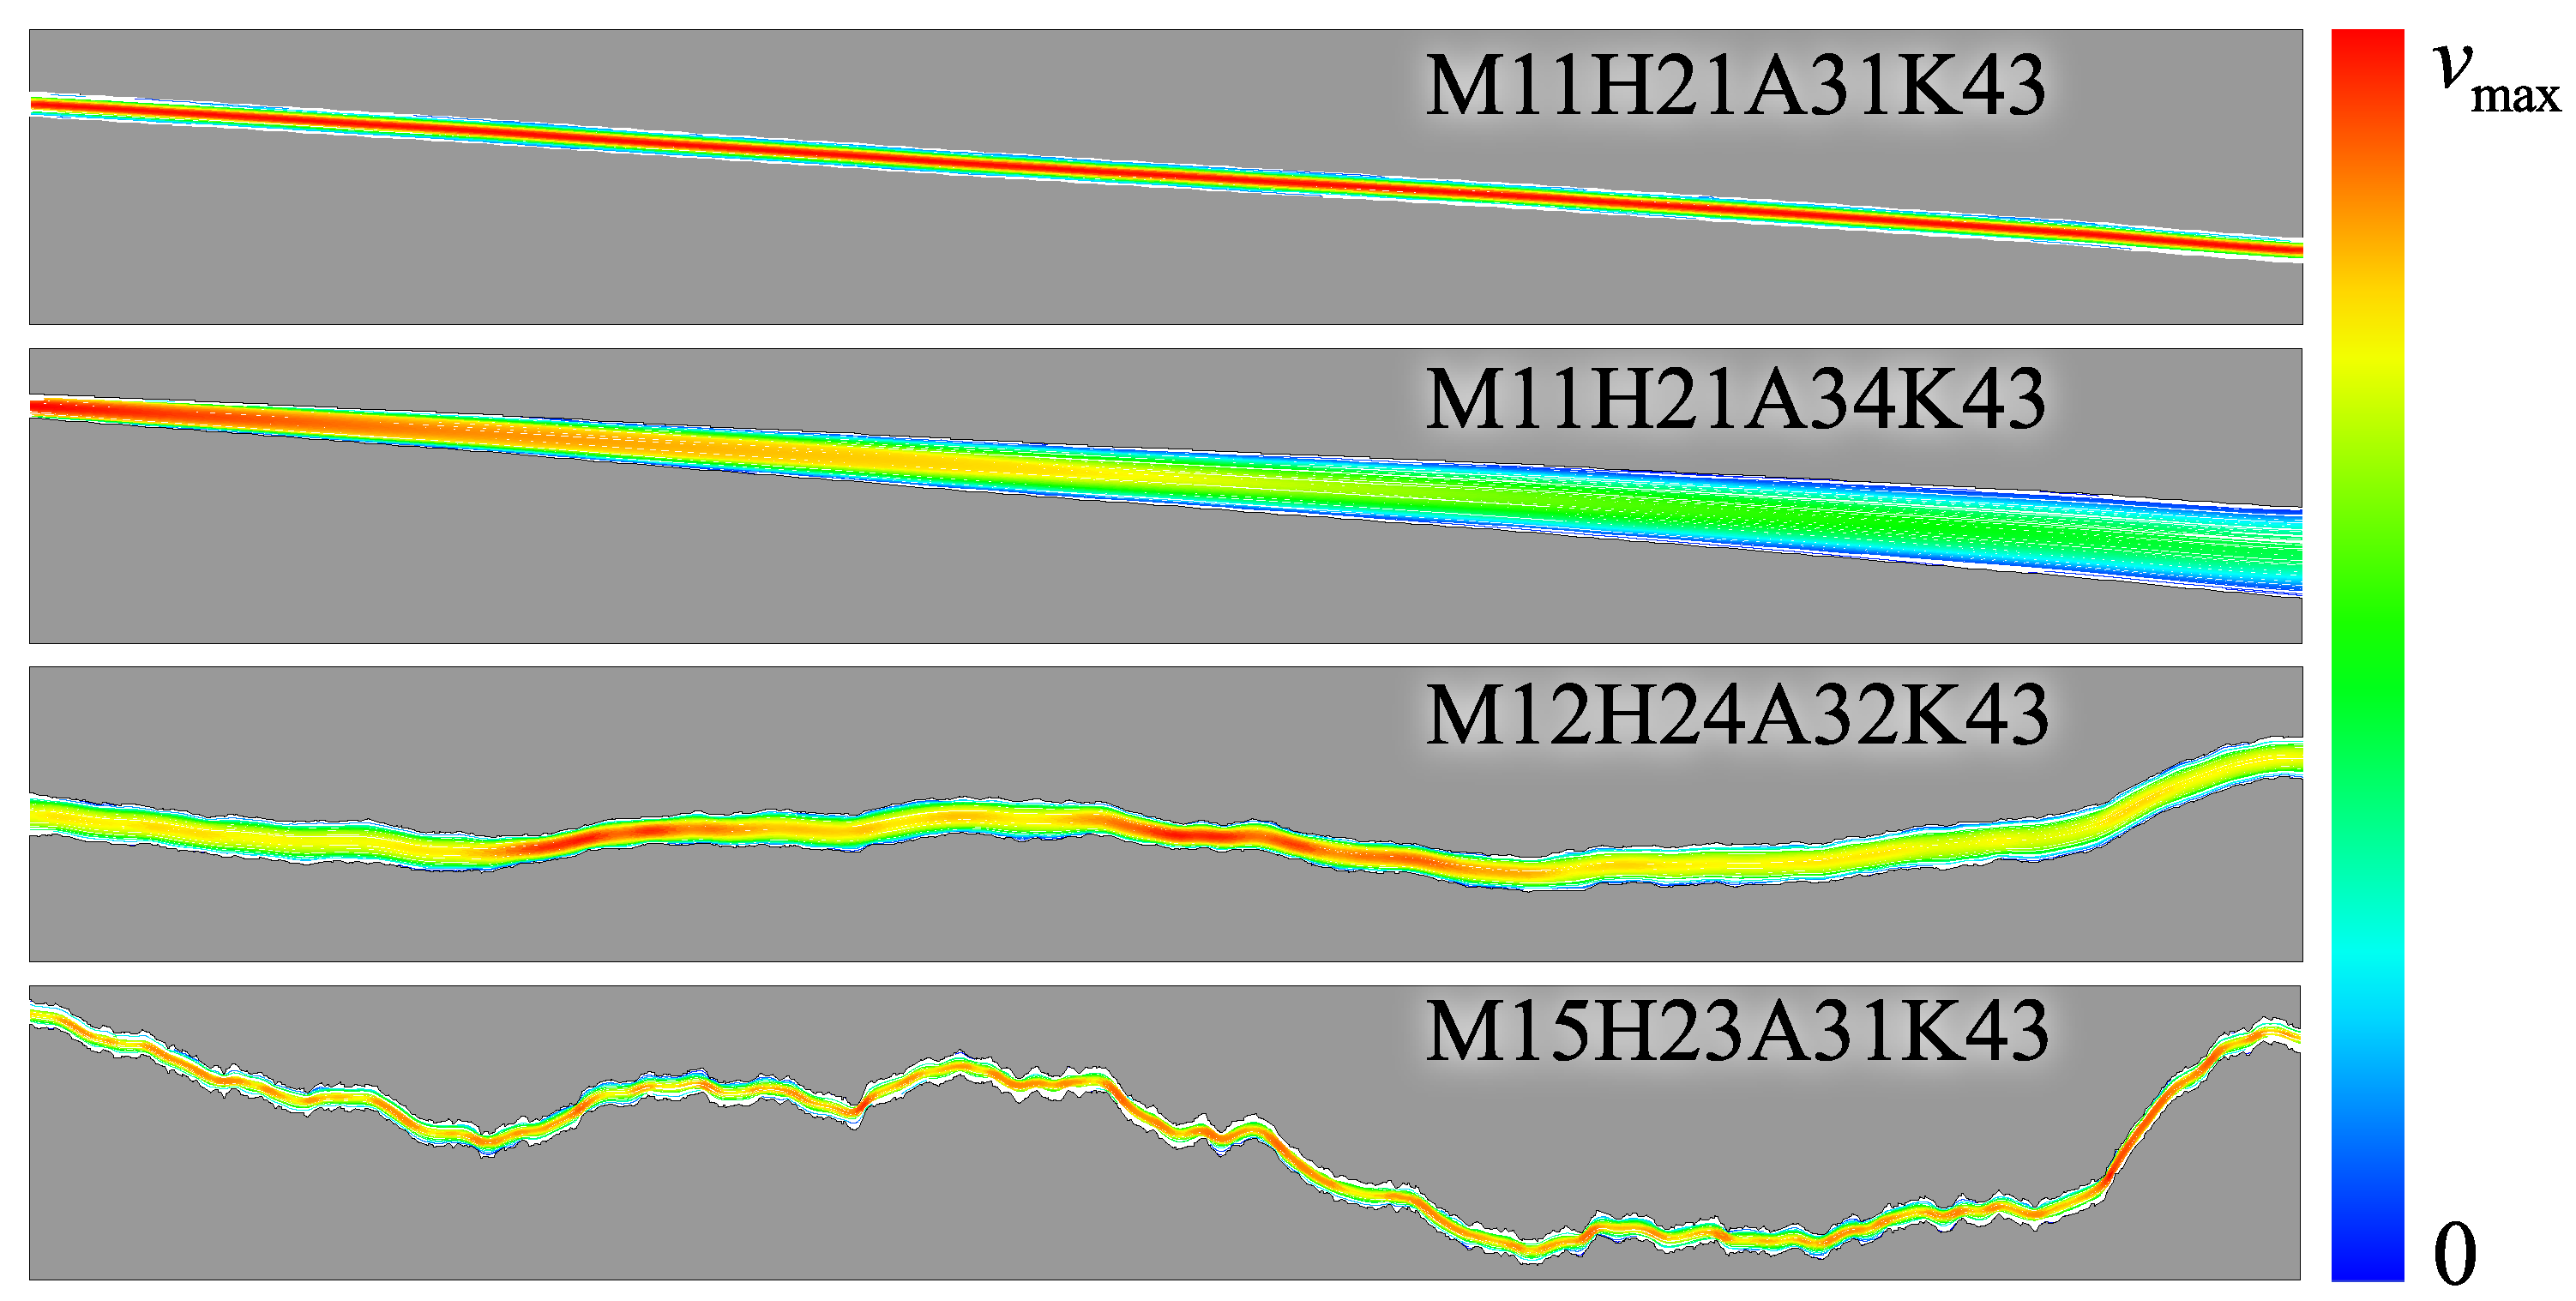
Figure 6 presents the steady-state velocity fields obtained from LBM simulations in fractures with variable apertures. The color map ranges from blue to red, corresponding to increasing flow velocity. For fractures with relatively uniform apertures, the velocity distribution is nearly homogeneous. In contrast, for fractures with pronounced aperture variability—particularly cases (b) and (d)—the velocity field closely mirrors the aperture profile: narrower sections exhibit higher local velocities due to mass conservation.
Figure 6.
The distribution of flow velocity in variable-aperture fractures.
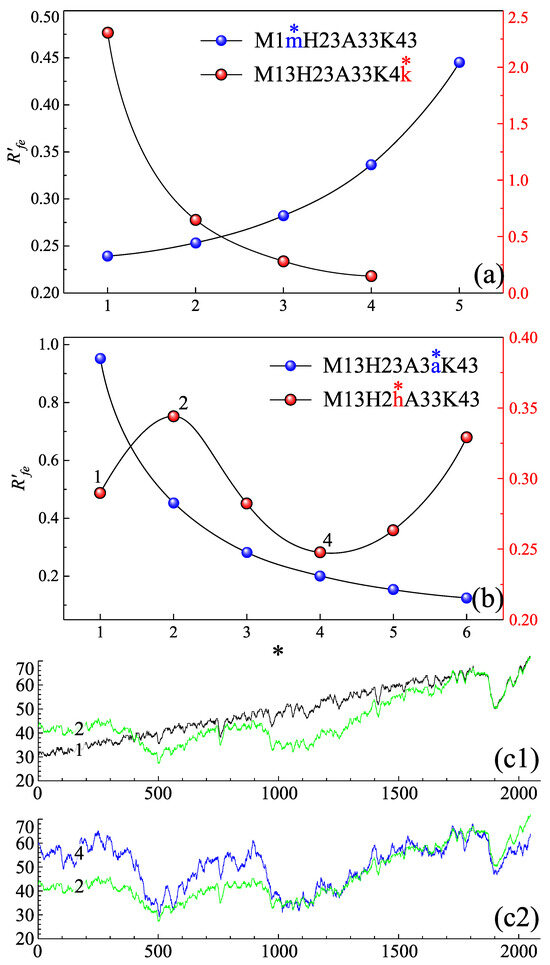
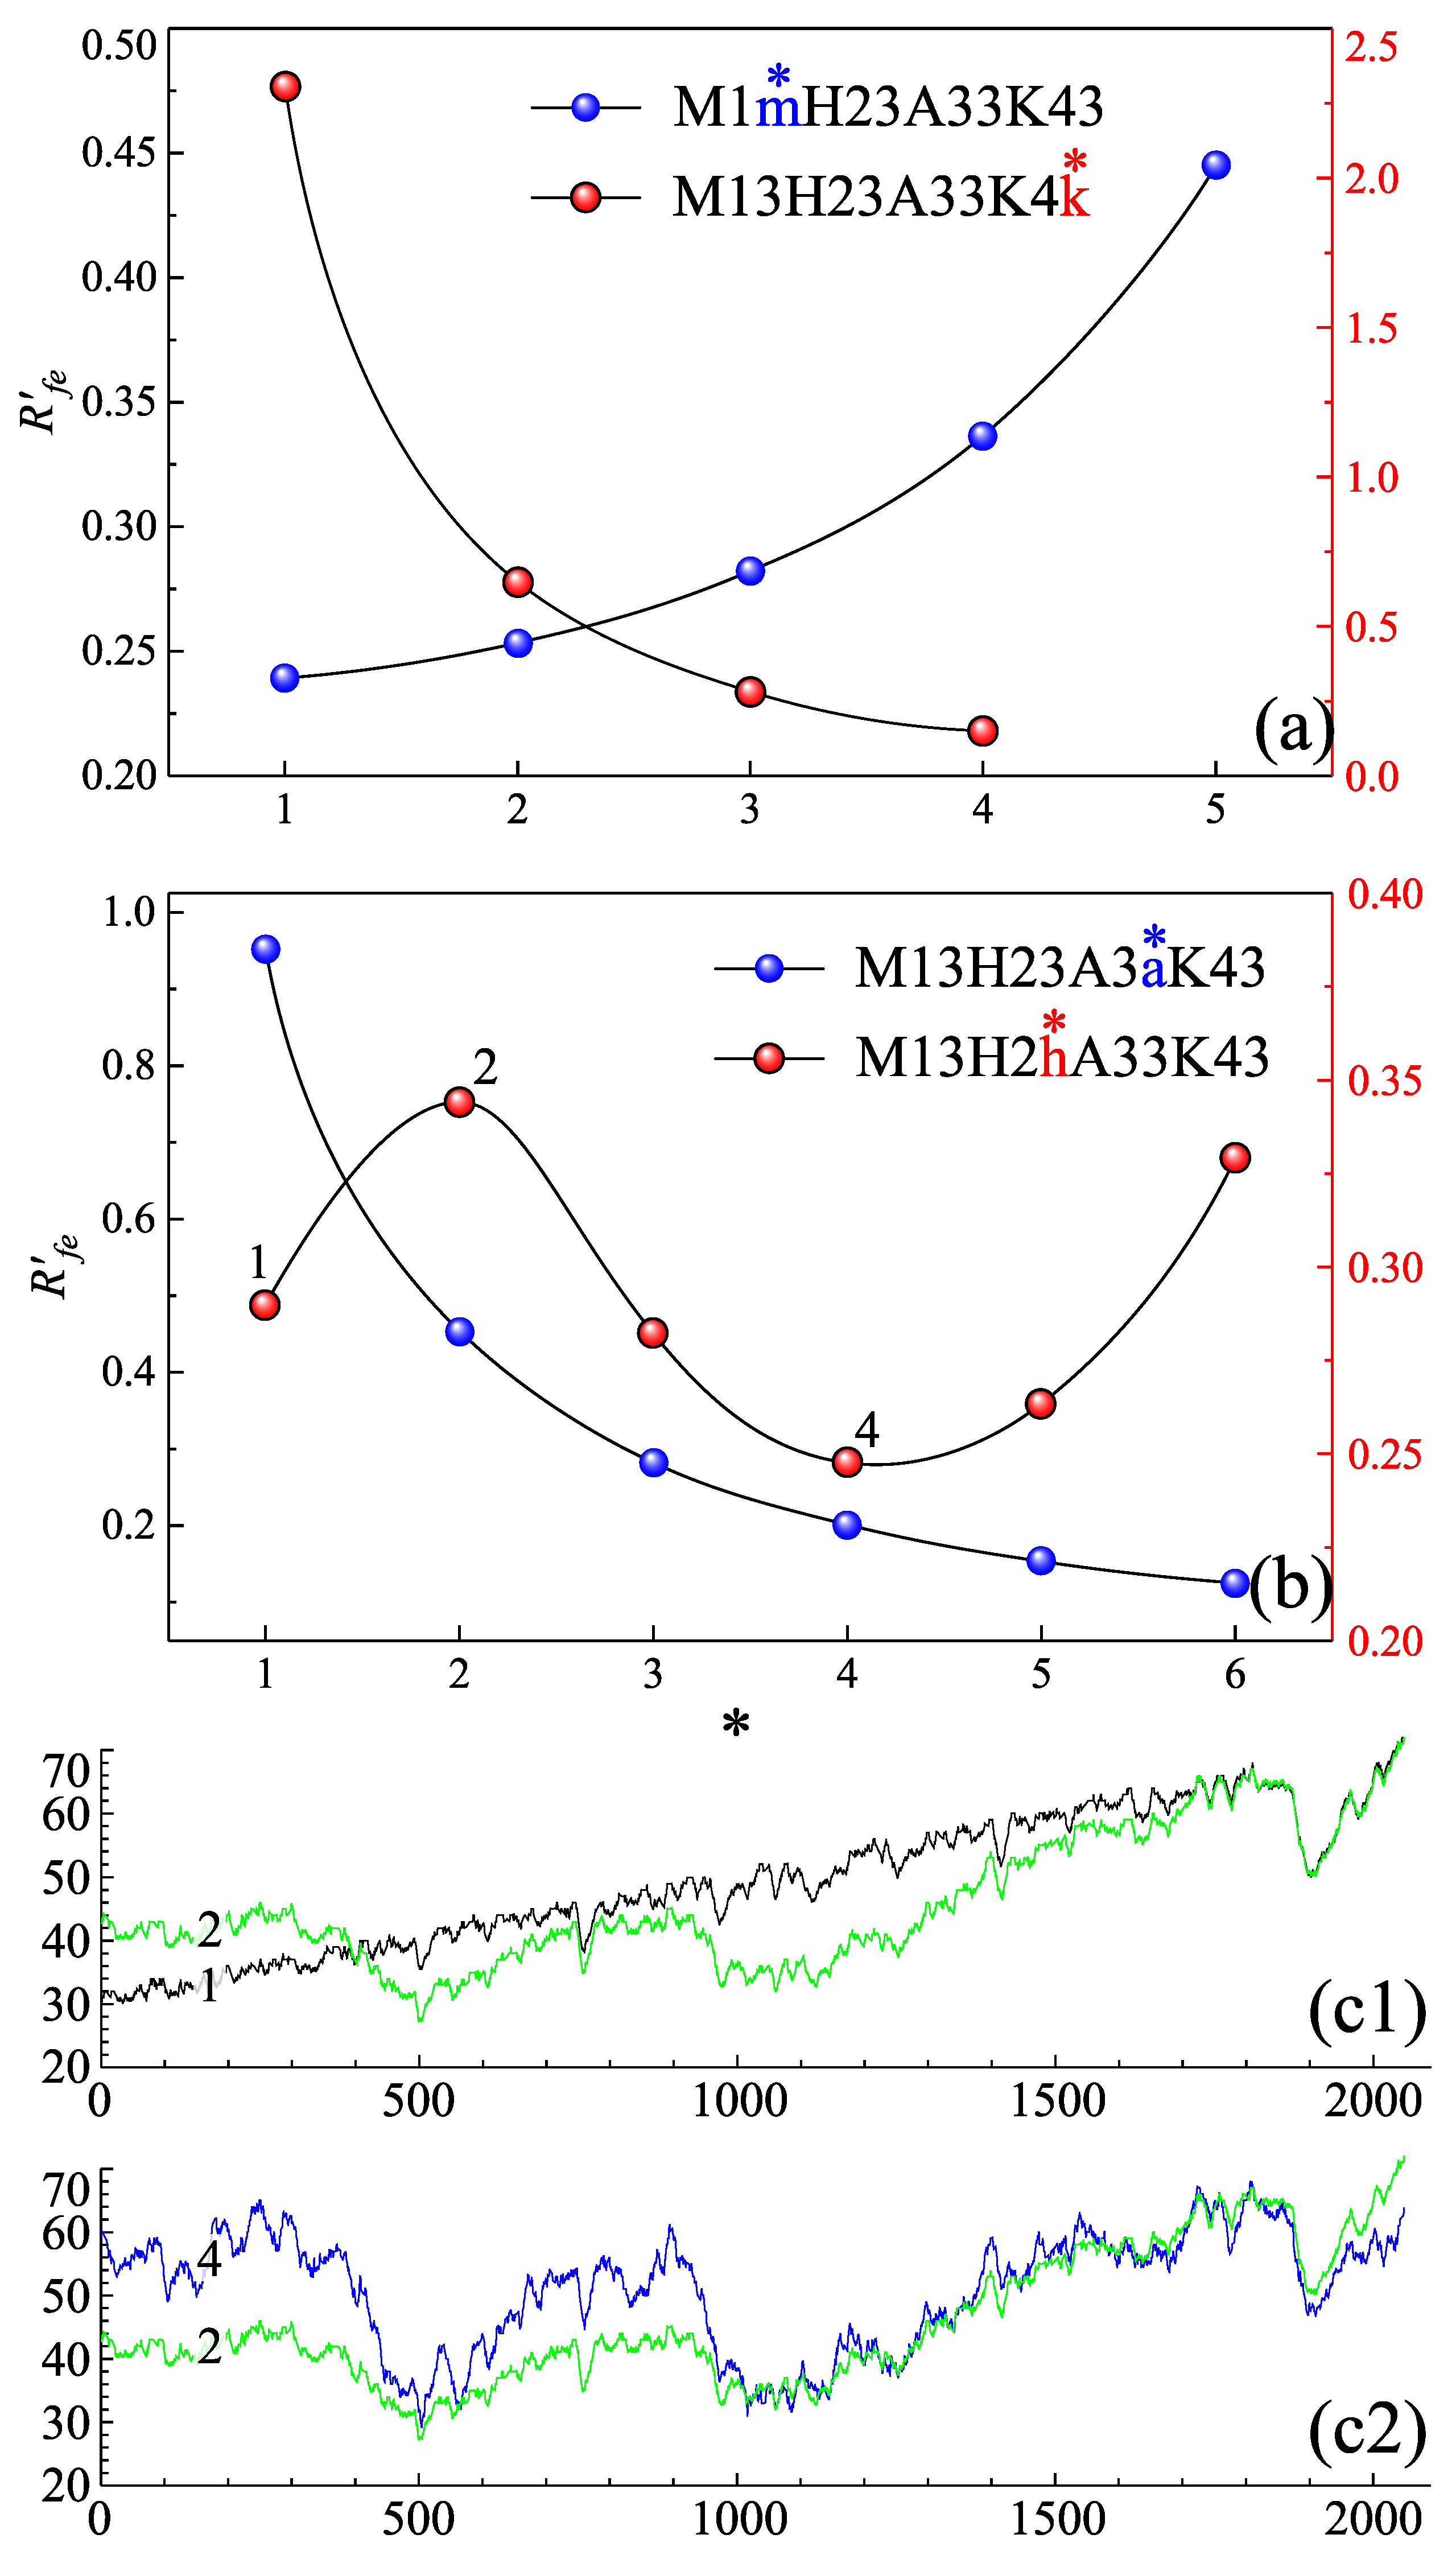
Given the simulated velocity field and the prescribed boundary conditions, the modified flow rate and the pressure drop are readily determined. The flow resistance for each fracture is then computed via Equation (4). Following the nomenclature introduced in Section 4.1, where fractures are encoded as “M1mH2hA3aK4k”, the parametric dependence of is examined in Figure 7. Panels (a) and (b) each contain four curves corresponding to the parameters m, h, a, and k, respectively; the left and right vertical axes refer to the blue and red data series.
Figure 7.
(a,b) The effects of fracture parameters on the flow resistance, and the four curves represent the effects of “m”, “h”, “a”, and “k” respectively. The “*” on these variables indicate the current values, which are also used as the horizontal axis labels. (c1,c2) Comparison of the aperture distribution of fractures in (b) with labels of “1”, “2”, and “4”.
The results demonstrate that in rough fractures is governed by their morphological and structural characteristics. In Figure 7a, the red markers show that decreases monotonically with increasing mean fracture aperture, while the blue markers indicate that increases with the roughness of the middle curve. Figure 7b further reveals the influence of the two vertical-aperture parameters, H and amplitude. The blue markers indicate that a larger vertical-aperture amplitude corresponds to lower flow resistance. In contrast, the sinusoidal trend shown by the red markers demonstrates that the dependence of on H is non-monotonic. To clarify this behavior, Figure 7(c1,c2) compare the aperture distributions of the fractures labeled “1”, “2”, and “4” in panel (b). These comparisons reveal that the effective apertures at points “1” and “4” are larger than those at point “2”, consistent with the observed variation in flow resistance.
4.3. Verification of Flow Resistance Model
To elucidate the mechanism by which aperture variability governs fracture flow resistance, it is necessary to predict from the geometric morphology. The fractures are first segmented using the weighting scheme illustrated in Figure 3, which accounts for the spatial variation in local aperture. The flow resistance is then evaluated via Equation (12), in which remains an unknown function and is temporarily denoted by the symbol . By combining this model with the flow resistance values obtained from LBM simulations, the functional form of can be determined.
For a given fracture, is uniquely determined; equivalently, each Hurst exponent corresponds to a single value of . Based on the large ensemble of pairs extracted from all simulated fractures, a regression analysis yields the specific functional relationship , where denotes the base of the natural logarithm.
Substituting this fitted expression for into Equation (12) gives:
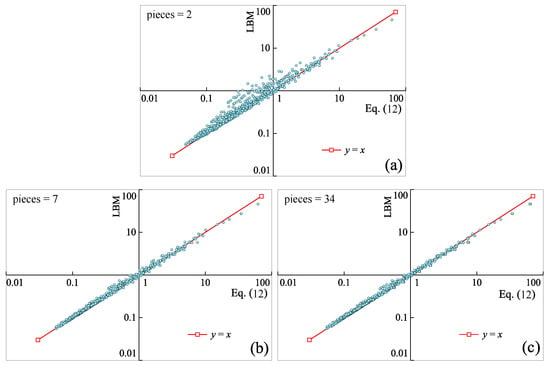
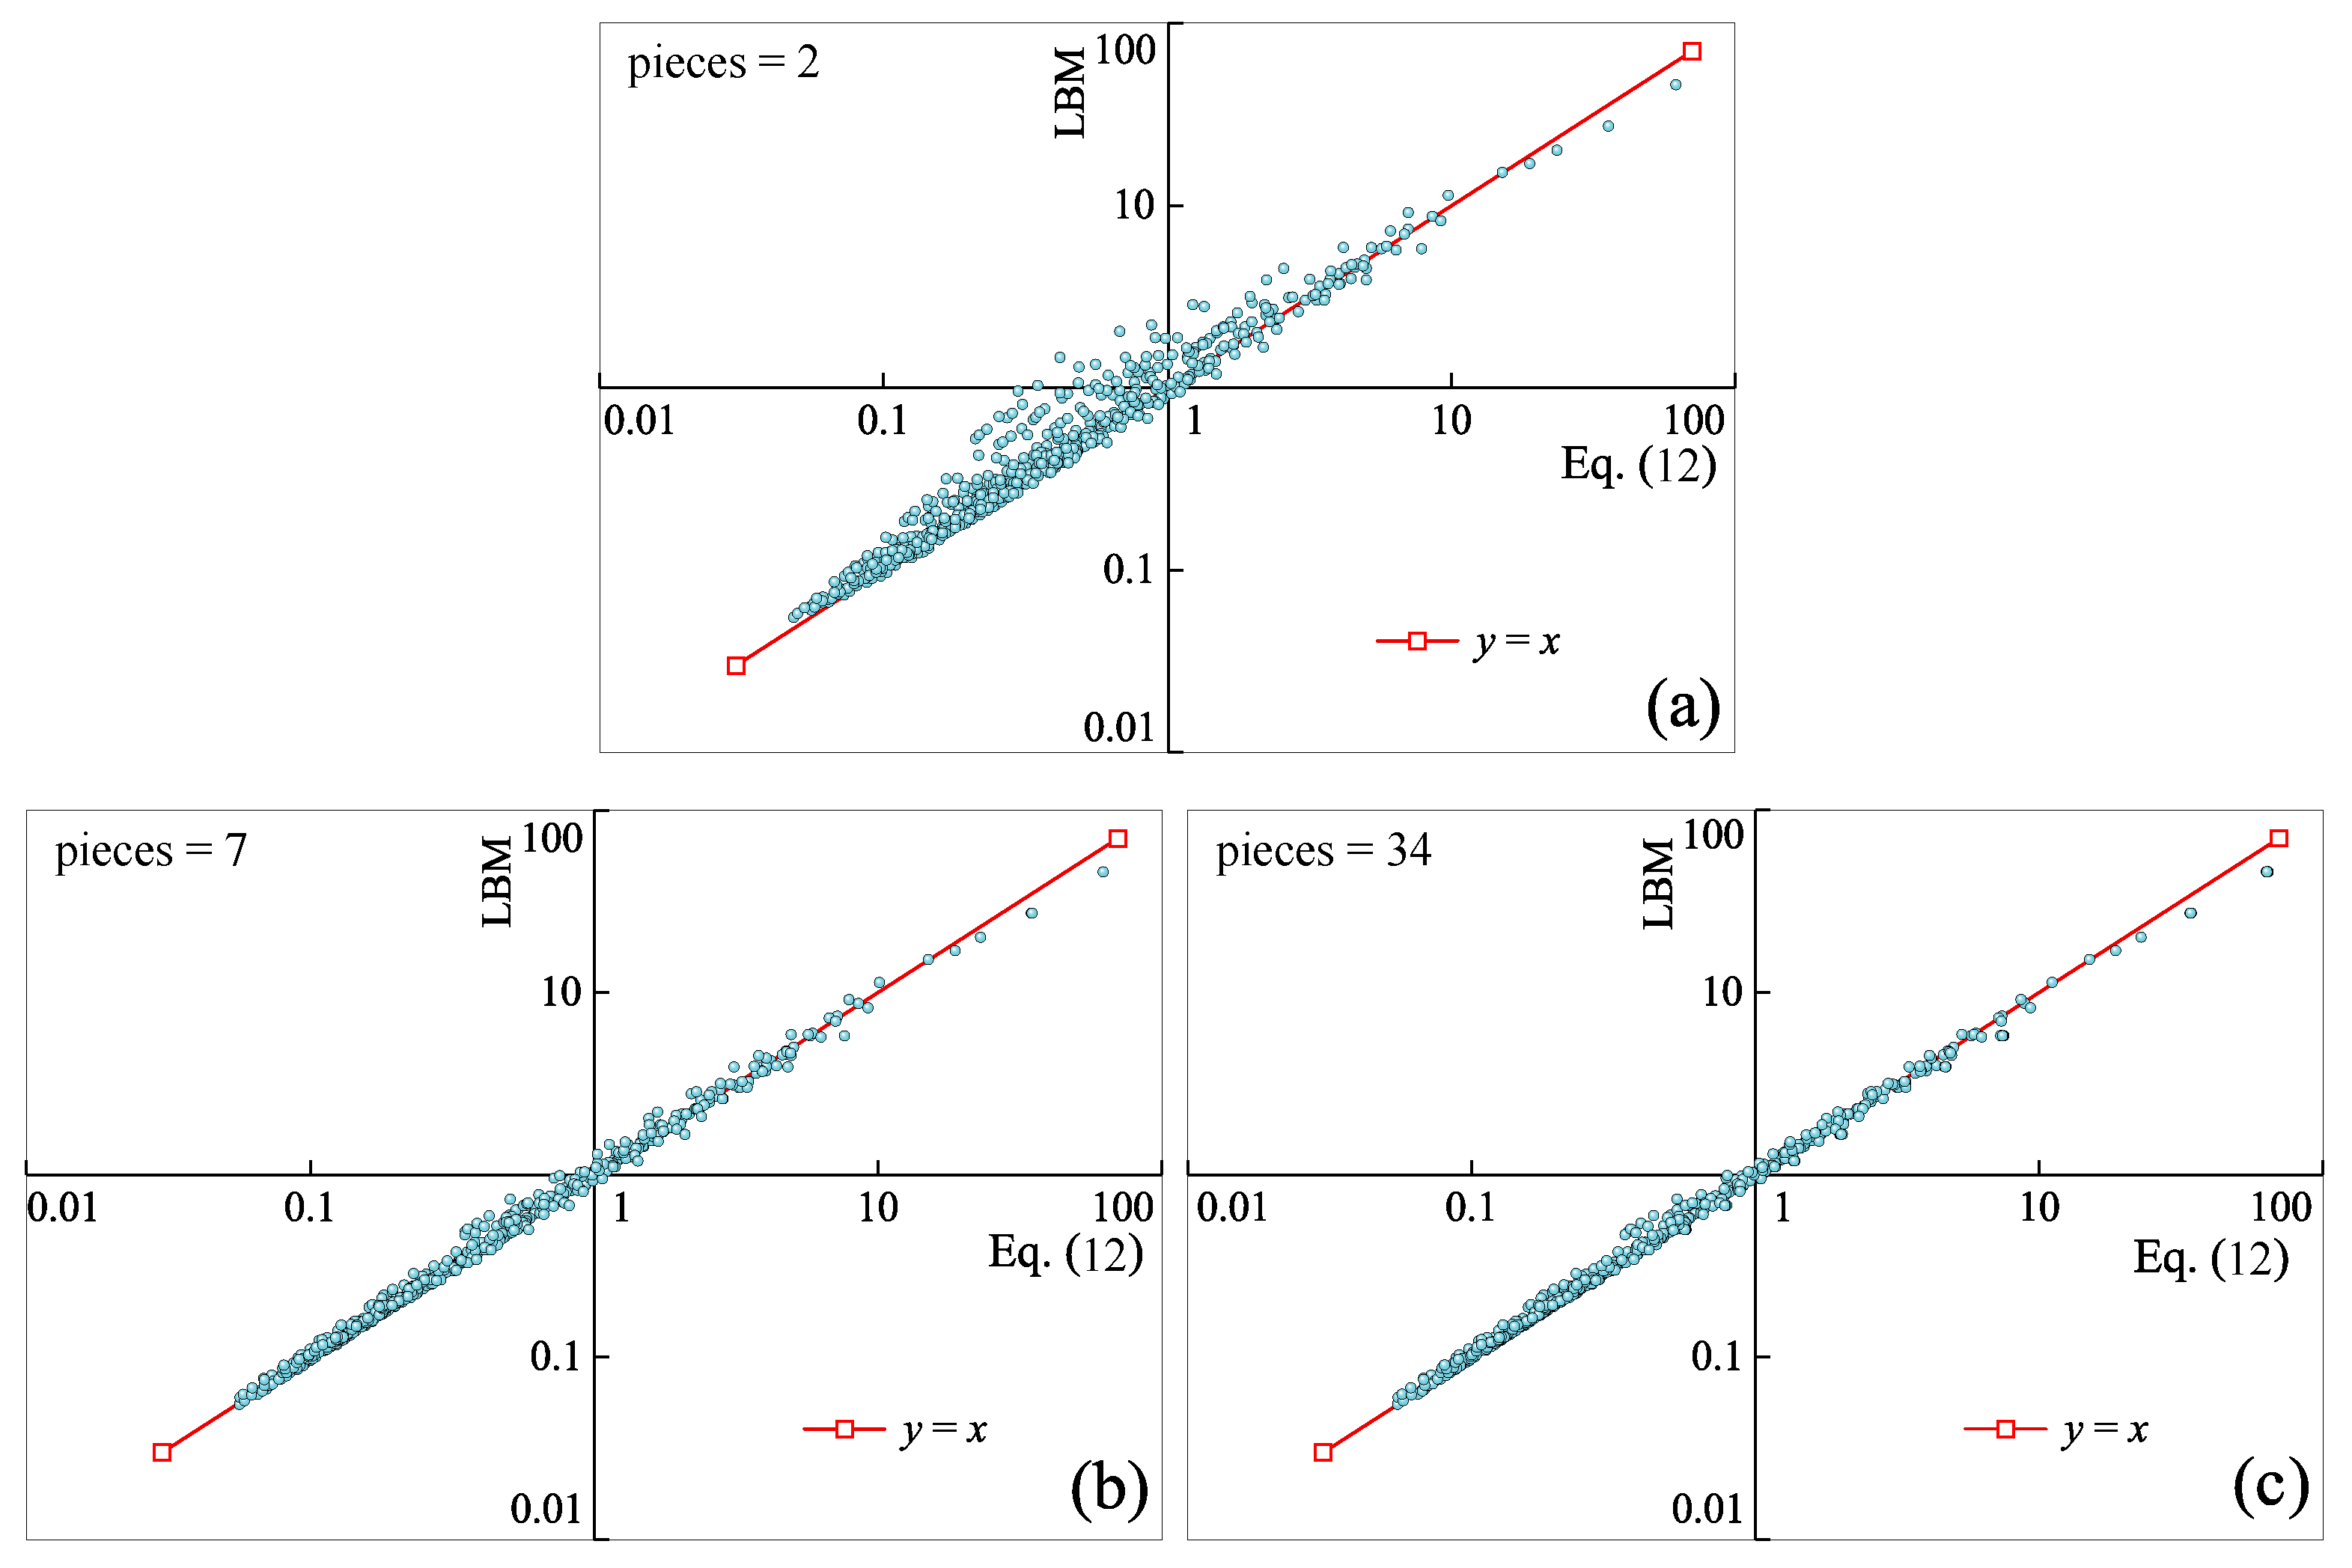
The proposed model enables direct calculation of flow resistance from fracture geometry by treating the total resistance as the series summation of connected fragments. Consequently, the segmentation scheme directly influences the predicted . To evaluate this sensitivity, fractures are segmented into 2–34 fragments, and the corresponding values computed via Equation (14) are compared with LBM simulation results in Figure 8.
Figure 8.
Comparison of flow resistance, with horizontal and vertical axes representing the flow resistance according to LBM simulation results and Equation (14) respectively. (a–c) The results when fractures are segmented into 2, 7, and 34 fragments, respectively. These three graphs are in log–log coordinates.
In the three panels of Figure 8, the red line with square markers denotes the reference , while the light-blue scatter points represent flow resistance values computed from LBM results via Equation (14). From top to bottom, the segment numbers are 2, 7, and 34, respectively. The progressive convergence of the data points toward the reference line demonstrates that the morphology-based increasingly agrees with the simulation as segmentation is refined, thereby validating Equation (14). Moreover, spans approximately three orders of magnitude, confirming the broad applicability of the model.
These results indicate that the flow resistance of rough fractures is governed by the aperture distribution, roughness characteristics, and Hurst exponent. The derived model effectively integrates both roughness and fractal mechanisms, and the weighted segmentation strategy successfully captures the dominant influence of narrow-aperture regions on fluid flow.
4.4. Performance of the Resistance Model Compared to Other Models
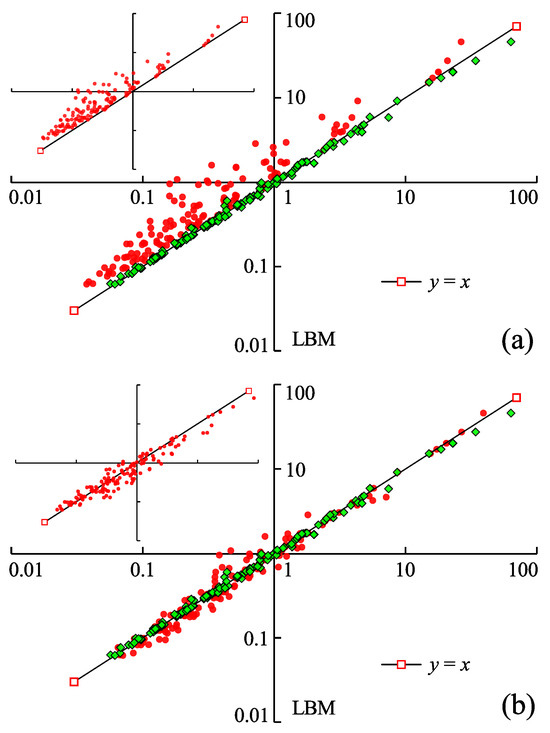
This section compares Equation (14) with existing models. Because few models directly evaluate fracture flow resistance, we derive resistance expressions from established permeability models. For example, the cubic law yields . Five such models are selected for comparative validation; their permeability and corresponding flow resistance formulations are summarized in Equation (15):
Among these models, (1) is the cubic law, while (2) and (3) share a similar form with different coefficients. Model (4) is an empirical permeability relation established from physical experiments to account for roughness [14]; the constant 8.8 in this equation has also been reported as 17 or 20.5 in other studies [90]. Model (5) is the triple-effect permeability model proposed by Zheng et al. [19] for rough fractures with asymmetric wall profiles, which modifies the cubic law by introducing hydraulic tortuosity , surface tortuosity , and surface roughness . Notably, takes a form analogous to in model (4). Using the fracture geometry and the five models above, flow resistance values are computed and compared in Figure 9.
Figure 9.
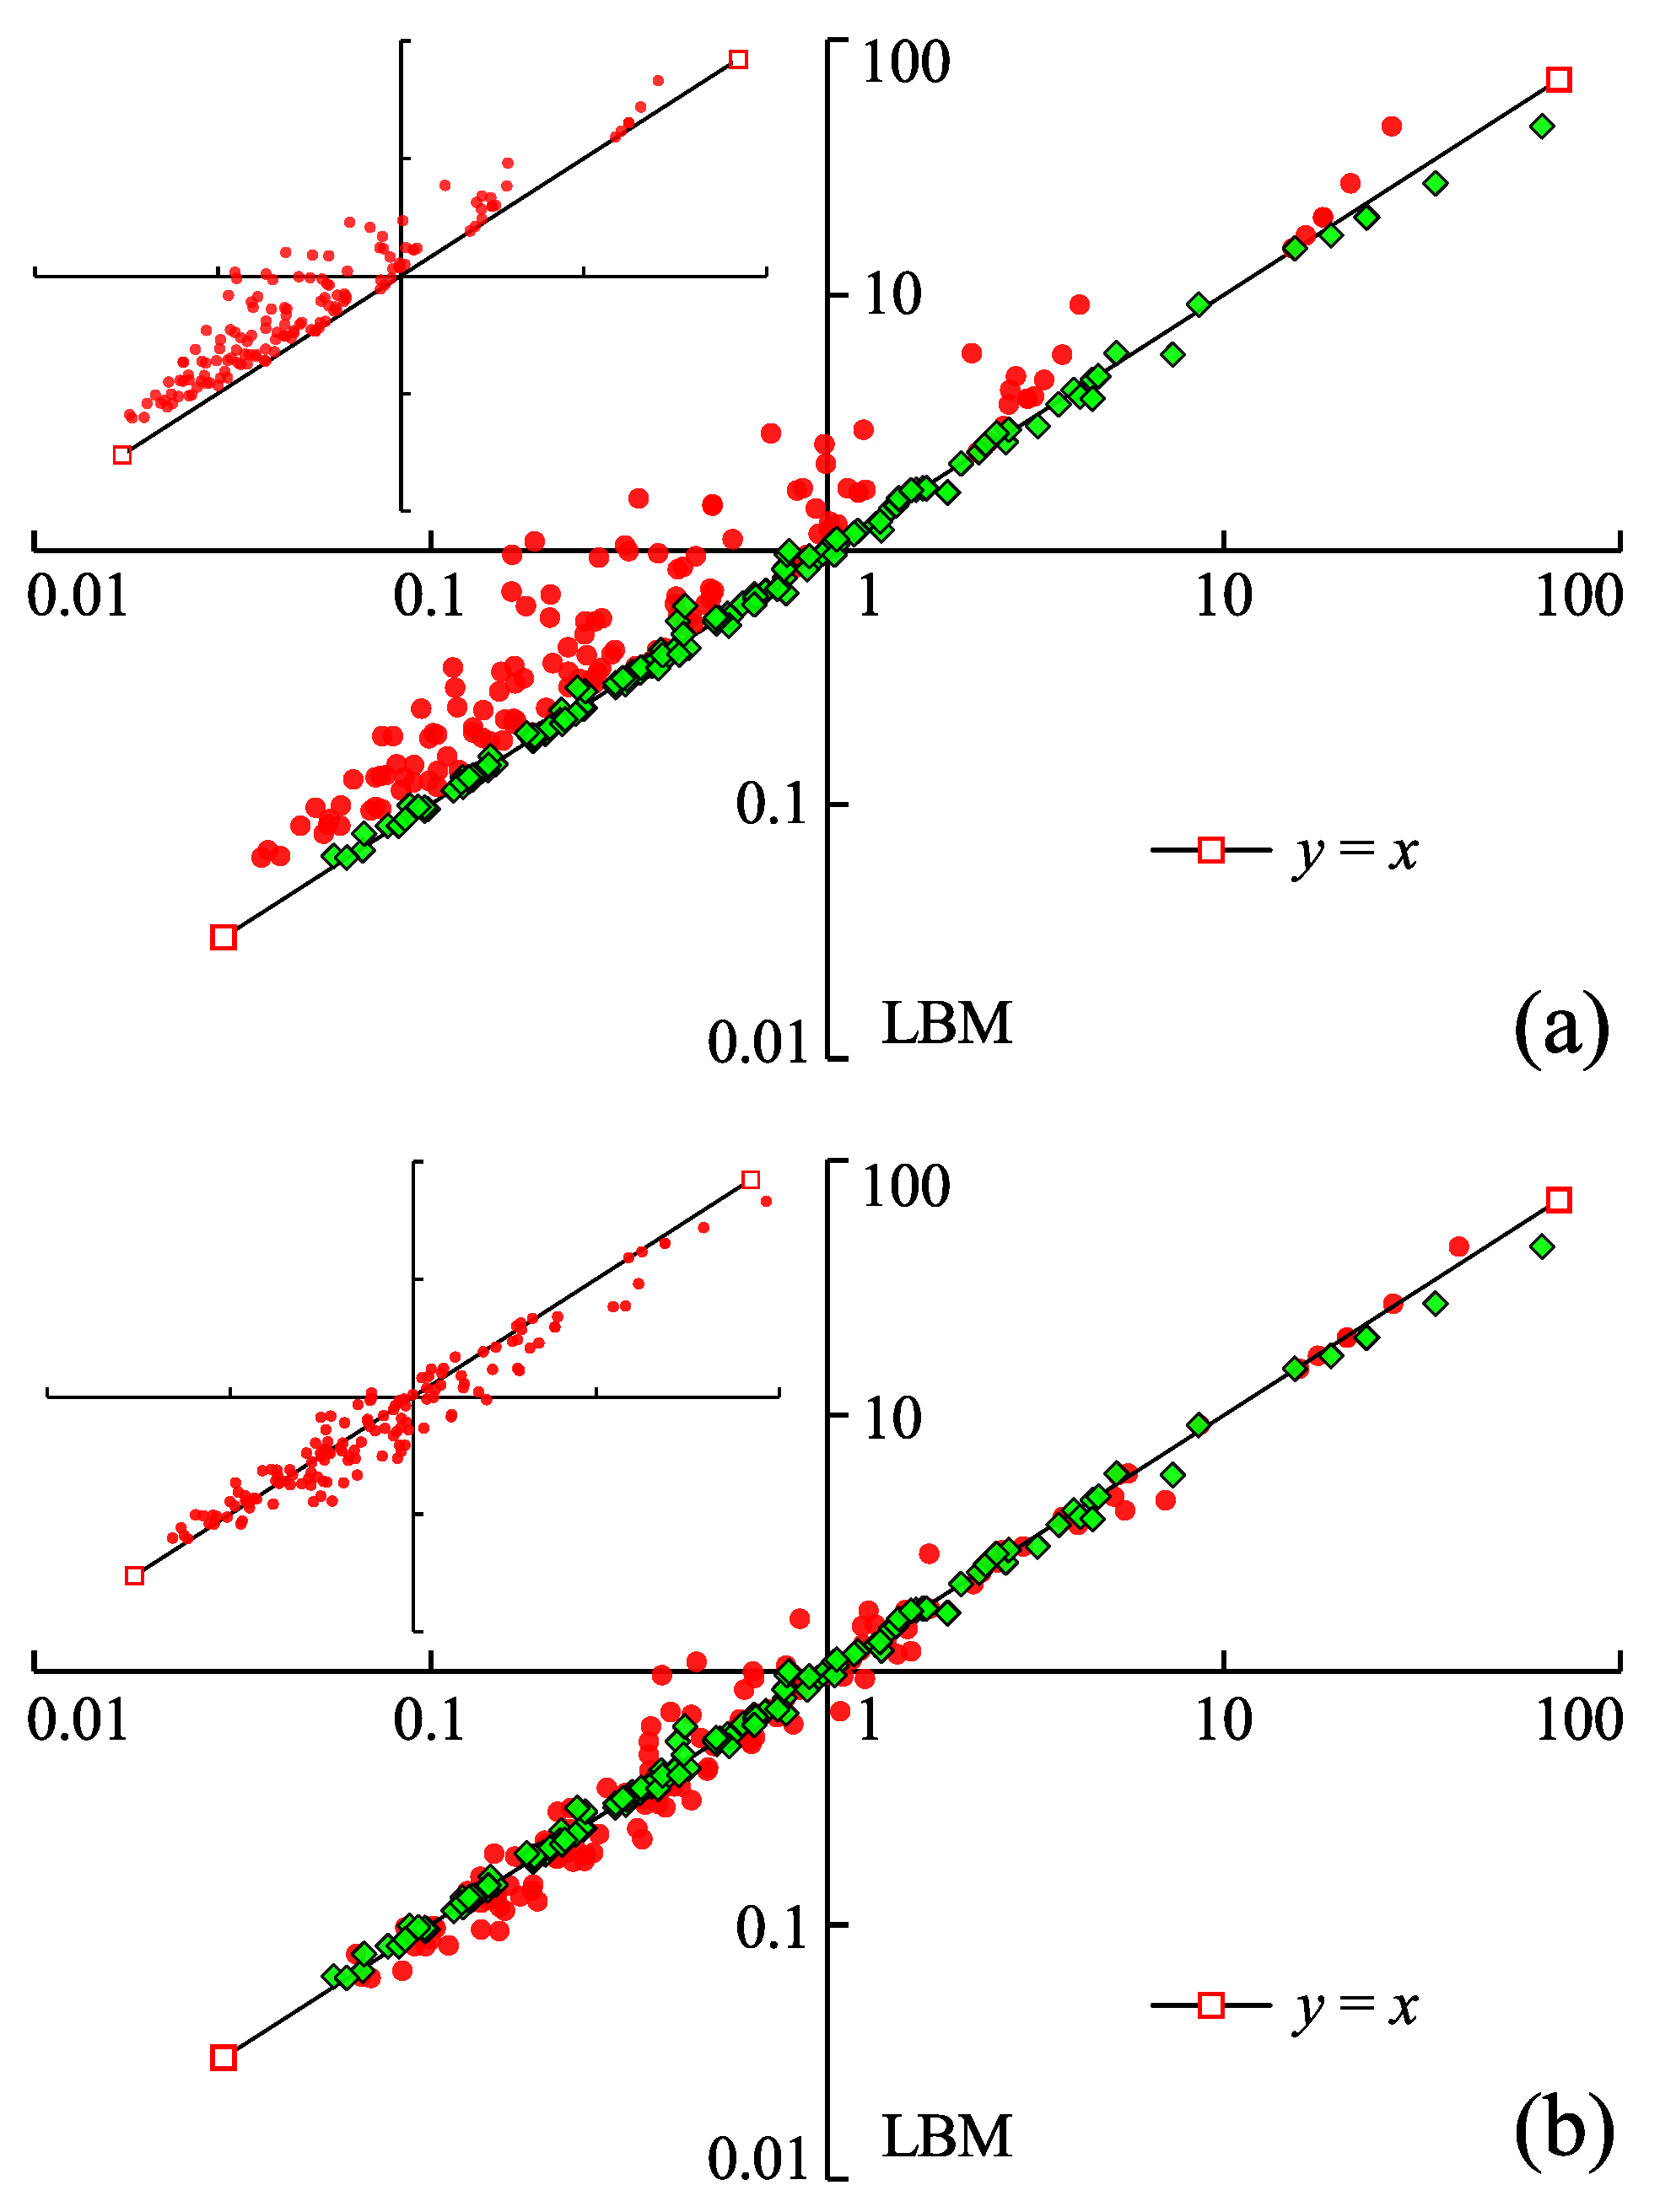
Comparison of flow resistance between Equation (14) and models in Equation (15). The horizontal axis and the vertical axis represent the flow resistance according to the models and the LBM simulation. The green marks are the results of Equation (14), while the red marks in (a,b) are the results of (1) and (4). The subfigures in (a,b) are the flow resistance of (2) and (5).
The green squares in Figure 9a,b represent the comparison between Equation (14) and LBM flow resistance, identical to those shown in Figure 8c. The red points correspond to models (1), (2), (4), and (5) from Equation (15), presented in panel (a), subfigure in (a), (b), and subfigure in (b), respectively. In panel (a), the red points lie above the reference line , indicating that the cubic law overestimates flow resistance by neglecting roughness effects. Similarly, the points in the subfigure in (a) also fall above , demonstrating that the correction factor is insufficient to capture these effects. Model (3) is excluded from this comparison because it yields negative values.
In figure (b), it is shown that the result of model (4) is distributed around as well. In this model, the coefficient is 8.8; however, in the initial test, it is set to 17, and the points are mostly distributed under , indicating that overestimates the roughness effects on fluid flow. Compared with the green squares, the red points are more discrete, meaning the performance of model (4) is poorer than that of Equation (14).
The subfigure in (b) shows the flow resistance calculated using model (5), which exhibits behavior similar to model (4). Following Zheng et al. [19], hydraulic tortuosity was replaced by surface tortuosity to simplify calculations, such that . Because contains two unknown parameters ( and ), these were determined by fitting the relationship between and . With fitted values of and , more data points fall below compared with the other three panels.
From the comparisons above, it can be seen that the flow resistance calculated by applying Equation (14) is closer to the simulation value. Specifically, our model achieves a coefficient of determination () of 0.9974, significantly outperforming the five benchmark models, which yield values of 0.8536, 0.8915, 0.9413, 0.975, and 0.6919, respectively. In addition, another point to note is that all the apertures used to calculate the flow resistance are the mean values of perpendicular apertures rather than the vertical aperture. This proves that the perpendicular aperture is the proper metric for measuring fracture apertures.
Although the present study is based on 2D simulations, the results provide a valuable foundation for predicting three-dimensional flow in rough fractures. Equation (12) formulates a three-dimensional single-fracture flow resistance model; however, its applicability within the current model framework warrants further verification. Marafini et al. [91] demonstrated that 2D models can reproduce essential 3D hydraulic trends when flow is dominated by well-connected preferential pathways and out-of-plane heterogeneity is not controlling. Although their analysis was conducted in the context of porous media, the underlying rationale is directly transferable to rough fractures, thereby providing methodological support for using the present 2D-derived resistance formulation as a basis for 3D single-fracture flow prediction.
5. Conclusions
This study proposes a segmented flow resistance model for rough fractures, Equation (14), which integrates aperture distribution, roughness, and fractal properties through weighted segmentation. Validation against LBM simulations confirms accurate predictions across three orders of magnitude in , with convergence improving as segment number increases. Comparative analysis with five existing models demonstrates that the proposed model outperforms all benchmarks: the cubic law and its corrections systematically overestimate resistance, while empirical and triple-effect models exhibit greater scatter. The weighted segmentation strategy effectively captures the dominant influence of narrow-aperture regions, and mean perpendicular apertures are confirmed as the appropriate geometric metric. Overall, the model unifies roughness and fractal mechanisms within a single analytical framework, providing a physically grounded alternative to purely empirical correlations for fracture permeability prediction.
Author Contributions
Conceptualization, Y.W. (Ying Wu) and J.D.; methodology, H.W.; software, X.L.; validation, J.D.; formal analysis, Y.Q.; investigation, Y.W. (Yirui Wang); resources, J.D.; data curation, J.D.; writing—original draft preparation, Y.W. (Ying Wu); writing—review and editing, J.D.; visualization, Y.W. (Yirun Wang); supervision, J.D.; project administration, Y.W. (Ying Wu); funding acquisition, J.D. All authors have read and agreed to the published version of the manuscript.
Funding
This work is supported by the National Natural Science Foundation of China (Grant No. 42502167), the Science and Technology Innovation Leading Talent Support Program of Henan Province (Grant No. 254000510028), the Fundamental Research Funds for the Universities of Henan Province (Grant Nos. NSFRF220427, NSFRF220204), the Doctoral Foundation of Henan Polytechnic University (Grant No. B2021-78), and the Henan Postdoctoral Foundation.
Data Availability Statement
The raw data supporting the conclusions of this article will be made available by the authors on request.
Acknowledgments
The authors have reviewed and edited the output and take full responsibility for the content of this publication.
Conflicts of Interest
The authors declare no conflicts of interest.
References
- Jin, Y.; Zheng, J.; Liu, X.; Pan, J.; Liu, S. Control Mechanisms of Self-Affine, Rough Cleat Networks on Flow Dynamics in Coal Reservoir. Energy 2019, 189, 116146. [Google Scholar] [CrossRef] [Scilit]
- Suzuki, A.; Watanabe, N.; Li, K.; Horne, R.N. Fracture Network Created by 3-D Printer and Its Validation Using CT Images. Water Resour. Res. 2017, 53, 6330–6339. [Google Scholar] [CrossRef] [Scilit]
- Liu, J.; Wang, Z.; Xu, Y.; Wu, B.; Xia, K. A novel permeability model incorporating damage evolution under thermo-hydro-mechanical condition: Development and verification. Acta Geotech. 2025, 20, 5427–5441. [Google Scholar] [CrossRef] [Scilit]
- Wang, B.; Jin, Y.; Chen, Q.; Zheng, J.; Zhu, Y.; Zhang, X. Derivation of Permeability–Pore Relationship for Fractal Porous Reservoirs Using Series–Parallel Flow Resistance Model and Lattice Boltzmann Method. Fractals 2014, 22, 1440005. [Google Scholar] [CrossRef] [Scilit]
- Jing, Y.; Armstrong, R.T.; Ramandi, H.L.; Mostaghimi, P. Topological Characterization of Fractured Coal: Topological Characterization of Coal. J. Geophys. Res. Solid Earth 2017, 122, 9849–9861. [Google Scholar] [CrossRef] [Scilit]
- Kirkby, A.; Heinson, G.; Krieger, L. Relating Permeability and Electrical Resistivity in Fractures Using Random Resistor Network Models. J. Geophys. Res. Solid Earth 2016, 121, 1546–1564. [Google Scholar] [CrossRef] [Scilit]
- Teng, T.; Wang, Y.; Ren, C.; Chen, Y. Modelling and simulation on anisotropic non-Darcy seepage characteristics of gas in naturally fractured coal. Geomech. Energy Environ. 2026, 46, 100828. [Google Scholar] [CrossRef] [Scilit]
- Wang, H. Hydraulic Fracture Propagation in Naturally Fractured Reservoirs: Complex Fracture or Fracture Networks. J. Nat. Gas Sci. Eng. 2019, 68, 102911. [Google Scholar] [CrossRef] [Scilit]
- Li, R.; Prozzi, J.A.; Hong, F. Quantification of Post-Rainfall Moisture Content in Pavement Unbound Layers Using Long-Term Pavement Performance Data. Transp. Res. Rec. J. Transp. Res. Board 2026, 2680, 660–672. [Google Scholar] [CrossRef] [Scilit]
- Xing, K.; Qian, J.; Zhao, W.; Ma, H.; Ma, L. Experimental and Numerical Study for the Inertial Dependence of Non-Darcy Coefficient in Rough Single Fractures. J. Hydrol. 2021, 603, 127148. [Google Scholar] [CrossRef] [Scilit]
- Kirkby, A.; Heinson, G. Three-Dimensional Resistor Network Modeling of the Resistivity and Permeability of Fractured Rocks. J. Geophys. Res. Solid Earth 2017, 122, 2653–2669. [Google Scholar] [CrossRef] [Scilit]
- Dong, Y.; Fu, Y.; Yeh, T.C.J.; Wang, Y.L.; Zha, Y.; Wang, L.; Hao, Y. Equivalence of Discrete Fracture Network and Porous Media Models by Hydraulic Tomography. Water Resour. Res. 2019, 55, 3234–3247. [Google Scholar] [CrossRef] [Scilit]
- Mukherjee, S.; Rajabi, M.; Esterle, J. Relationship between Coal Composition, Fracture Abundance and Initial Reservoir Permeability: A Case Study in the Walloon Coal Measures, Surat Basin, Australia. Int. J. Coal Geol. 2021, 240, 103726. [Google Scholar] [CrossRef] [Scilit]
- Lomize, G.M. Flow in Fractured Rocks; Gosenergoizdat: Moscow, Russia, 1951. (In Russian)
- Jin, Y.; Dong, J.B.; Zhang, X.Y.; Li, X.; Wu, Y. Scale and Size Effects on Fluid Flow through Self-Affine Rough Fractures. Int. J. Heat Mass Transf. 2017, 105, 443–451. [Google Scholar] [CrossRef] [Scilit]
- Louis, C. A Study of Groundwater Flow in Jointed Rock and Its Influence on the Stability of Rock Masses; Imperial College of Science and Technology: London, UK, 1969. [Google Scholar]
- Yin, Q.; Ma, G.; Jing, H.; Wang, H.; Su, H.; Wang, Y.; Liu, R. Hydraulic Properties of 3D Rough-Walled Fractures during Shearing: An Experimental Study. J. Hydrol. 2017, 555, 169–184. [Google Scholar] [CrossRef] [Scilit]
- Neuville, A.; Toussaint, R.; Schmittbuhl, J. Fracture Aperture Reconstruction and Determination of Hydrological Properties: A Case Study at Draix (French Alps). Hydrol. Processes 2012, 26, 2095–2105. [Google Scholar] [CrossRef] [Scilit]
- Zheng, J.; Jin, Y.; Liu, X.; Wang, C.; Liu, X. Validity of Triple-Effect Model for Fluid Flow in Mismatched, Self-Affine Fractures. Adv. Water Resour. 2020, 140, 103585. [Google Scholar] [CrossRef] [Scilit]
- Dong, J.; Ju, Y. Quantitative Characterization of Single-Phase Flow through Rough-Walled Fractures with Variable Apertures. Geomech. Geophys. Geo-Energy Geo-Resour. 2020, 6, 42. [Google Scholar] [CrossRef] [Scilit]
- Ye, Z.; Yang, J.; Xiong, F.; Huang, S.; Cheng, A. Analytical Relationships between Normal Stress and Fluid Flow for Single Fractures Based on the Two-Part Hooke’s Model. J. Hydrol. 2022, 608, 127633. [Google Scholar] [CrossRef] [Scilit]
- Gan, L.; Liu, Y.; Zhang, Z.; Shen, Z.; Xu, L.; Zhang, H.; Ma, H. Experimental investigation into the permeability evolution of rough fractures in limestone under complex service conditions. Bull. Eng. Geol. Environ. 2025, 84, 162. [Google Scholar] [CrossRef] [Scilit]
- Lang, P.S.; Paluszny, A.; Zimmerman, R.W. Hydraulic Sealing Due to Pressure Solution Contact Zone Growth in Siliciclastic Rock Fractures: Pressure Solution in Rough Fractures. J. Geophys. Res. Solid Earth 2015, 120, 4080–4101. [Google Scholar] [CrossRef] [Scilit]
- Li, Y.; Qian, H.; Zheng, H.; Li, L. Upscaling three-dimensional permeability in fractured rock masses through discrete fracture networks. Sci. China Technol. Sci. 2026, 69, 1720701. [Google Scholar] [CrossRef] [Scilit]
- Talon, L.; Auradou, H.; Hansen, A. Permeability Estimates of Self-Affine Fracture Faults Based on Generalization of the Bottleneck Concept. Water Resour. Res. 2010, 46, W07601. [Google Scholar] [CrossRef] [Scilit]
- Develi, K.; Babadagli, T. Experimental and Visual Analysis of Single-Phase Flow through Rough Fracture Replicas. Int. J. Rock Mech. Min. Sci. 2015, 73, 139–155. [Google Scholar] [CrossRef] [Scilit]
- Huang, N.; Liu, R.; Jiang, Y. Numerical Study of the Geometrical and Hydraulic Characteristics of 3D Self-Affine Rough Fractures during Shear. J. Nat. Gas Sci. Eng. 2017, 45, 127–142. [Google Scholar] [CrossRef] [Scilit]
- Zhang, Q.; Luo, S.; Ma, H.; Ma, L.; Qian, J. Experimental Study on Quantifying the Surface Form of Artificial Tension Fractures in Granite Samples. J. Hydrol. 2020, 584, 124680. [Google Scholar] [CrossRef] [Scilit]
- Ju, Y.; Dong, J.; Gao, F.; Wang, J. Evaluation of Water Permeability of Rough Fractures Based on a Self-Affine Fractal Model and Optimized Segmentation Algorithm. Adv. Water Resour. 2019, 129, 99–111. [Google Scholar] [CrossRef] [Scilit]
- Schmittbuhl, J.; Steyer, A.; Jouniaux, L.; Toussaint, R. Fracture Morphology and Viscous Transport. Int. J. Rock Mech. Min. Sci. 2008, 45, 422–430. [Google Scholar] [CrossRef] [Scilit]
- Seybold, H.J.; Carmona, H.A.; Filho, F.A.L.; Araújo, A.D.; Filho, F.N.; Andrade, J.S. Flow through Three-Dimensional Self-Affine Fractures. Phys. Rev. Fluids 2020, 5, 104101. [Google Scholar] [CrossRef] [Scilit]
- Sun, Z.; Zou, L.; Wang, L.; Zhou, J.Q.; Cui, Z.; Wu, Q. Anisotropy of non-Darcian flow in rock fractures subjected to cyclic shearing. J. Rock Mech. Geotech. Eng. 2025, 17, 6373–6387. [Google Scholar] [CrossRef] [Scilit]
- Bandyopadhyay, K.; Mallik, J.; Shajahan, R.; Agarwal, N. Closing the Gap between Analytical and Measured Coal Permeability. Fuel 2020, 281, 118752. [Google Scholar] [CrossRef] [Scilit]
- Wang, M.; Chen, Y.F.; Ma, G.W.; Zhou, J.Q.; Zhou, C.B. Influence of Surface Roughness on Nonlinear Flow Behaviors in 3D Self-Affine Rough Fractures: Lattice Boltzmann Simulations. Adv. Water Resour. 2016, 96, 373–388. [Google Scholar] [CrossRef] [Scilit]
- Dou, Z.; Chen, Z.; Zhou, Z.; Wang, J.; Huang, Y. Influence of eddies on conservative solute transport through a 2D single self-affine fracture. Int. J. Heat Mass Transf. 2018, 121, 597–606. [Google Scholar] [CrossRef] [Scilit]
- Madadi, M. Fluid Flow and Conduction in Two-Dimensional Fractures with Rough, Self-Affine Surfaces: A Comparative Study. J. Geophys. Res. 2003, 108, 2396. [Google Scholar] [CrossRef] [Scilit]
- Oron, A.P.; Berkowitz, B. Flow in Rock Fractures: The Local Cubic Law Assumption Reexamined. Water Resour. Res. 1998, 34, 2811–2825. [Google Scholar] [CrossRef] [Scilit]
- Ge, S. A governing equation for fluid flow in rough fractures. Water Resour. Res. 1997, 33, 53–61. [Google Scholar] [CrossRef] [Scilit]
- Mourzenko, V.V.; Thovert, J.F.; Adler, P.M. Permeability of a Single Fracture; Validity of the Reynolds Equation. J. Phys. II 1995, 5, 465–482. [Google Scholar] [CrossRef] [Scilit]
- Wang, Z.; Xu, C.; Dowd, P. A Modified Cubic Law for Single-Phase Saturated Laminar Flow in Rough Rock Fractures. Int. J. Rock Mech. Min. Sci. 2018, 103, 107–115. [Google Scholar] [CrossRef] [Scilit]
- Noiriel, C.; Gouze, P.; Madé, B. 3D Analysis of Geometry and Flow Changes in a Limestone Fracture during Dissolution. J. Hydrol. 2013, 486, 211–223. [Google Scholar] [CrossRef] [Scilit]
- Drazer, G.; Koplik, J. Permeability of Self-Affine Rough Fractures. Phys. Rev. E 2000, 62, 8076–8085. [Google Scholar] [CrossRef] [Scilit]
- Dejam, M.; Hassanzadeh, H.; Chen, Z. Shear Dispersion in a Rough-Walled Fracture. SPE J. 2018, 23, 1669–1688. [Google Scholar] [CrossRef] [Scilit]
- Zheng, J.; Jin, Y.; Dong, J.; Liu, S.; Zhang, Q.; Song, H.; Huang, P. Reexamination of the Permeability-Aperture Relationship for Rough Fractures with Mismatched Self-Affine Surfaces. J. Hydrol. 2022, 609, 127727. [Google Scholar] [CrossRef] [Scilit]
- Azizmohammadi, S.; Matthäi, S.K. Is the Permeability of Naturally Fractured Rocks Scale Dependent? Water Resour. Res. 2017, 53, 8041–8063. [Google Scholar] [CrossRef] [Scilit]
- Zhan, W.; Chen, Y.; Liu, Q.; Li, J.; Sacchi, M.D.; Zhuang, M.; Liu, Q.H. Simultaneous prediction of petrophysical properties and formation layered thickness from acoustic logging data using a modular cascading residual neural network (MCARNN) with physical constraints. J. Appl. Geophys. 2024, 224, 105362. [Google Scholar] [CrossRef] [Scilit]
- Maillot, J.; Davy, P.; Le Goc, R.; Darcel, C.; de Dreuzy, J. Connectivity, Permeability, and Channeling in Randomly Distributed and Kinematically Defined Discrete Fracture Network Models: Permeability of Discrete Fracture Network. Water Resour. Res. 2016, 52, 8526–8545. [Google Scholar] [CrossRef] [Scilit]
- Wang, Z.; Xu, C.; Dowd, P.; Xiong, F.; Wang, H. A Nonlinear Version of the Reynolds Equation for Flow in Rock Fractures with Complex Void Geometries. Water Resour. Res. 2020, 56, e2019WR026149. [Google Scholar] [CrossRef] [Scilit]
- Zhang, H.; Zhang, J.; Du, S.; Ren, J.; Zhao, H.; Li, W.; Ding, M.; Wang, T. Permeability Characteristics of Filled Fractured Coal-Rock Mass Under Stress–Seepage Coupling. Rock Mech. Rock Eng. 2025, 58, 11899–11920. [Google Scholar] [CrossRef] [Scilit]
- Li, X.; Jiang, Z.; Couples, G.G. A Stochastic Method for Modelling the Geometry of a Single Fracture: Spatially Controlled Distributions of Aperture, Roughness and Anisotropy. Transp. Porous Media 2019, 128, 797–819. [Google Scholar] [CrossRef] [Scilit]
- Auradou, H.; Drazer, G.; Hulin, J.P.; Koplik, J. Permeability Anisotropy Induced by the Shear Displacement of Rough Fracture Walls. Water Resour. Res. 2005, 41. [Google Scholar] [CrossRef] [Scilit]
- Ferreira, C.A.; Nick, H.M. A correlation for the matrix-driven increase in hydraulic permeability of rough-walled fractures. J. Hydrol. 2025, 662, 133790. [Google Scholar] [CrossRef] [Scilit]
- Zhang, Q.; Luo, S.; Ma, H.; Wang, X.; Qian, J. Simulation on the Water Flow Affected by the Shape and Density of Roughness Elements in a Single Rough Fracture. J. Hydrol. 2019, 573, 456–468. [Google Scholar] [CrossRef] [Scilit]
- Wu, K.; Olson, J.; Balhoff, M.T.; Yu, W. Numerical Analysis for Promoting Uniform Development of Simultaneous Multiple-Fracture Propagation in Horizontal Wells. SPE Prod. Oper. 2017, 32, 41–50. [Google Scholar] [CrossRef] [Scilit]
- Zhang, T.; Sun, S.; Song, H. Flow Mechanism and Simulation Approaches for Shale Gas Reservoirs: A Review. Transp. Porous Media 2019, 126, 655–681. [Google Scholar] [CrossRef] [Scilit]
- Zhao, M.; Jin, Y.; Liu, X.; Zheng, J.; Liu, S. Characterizing the Complexity Assembly of Pore Structure in a Coal Matrix: Principle, Methodology, and Modeling Application. J. Geophys. Res. Solid Earth 2020, 125, e2020JB020110. [Google Scholar] [CrossRef] [Scilit]
- Zhu, H.; Huo, Q.; Fan, J.; Pang, S.; Chen, H.; Yi, C. The Depth–Width Correlation for Shrinkage-Induced Cracks and Its Influence on Chloride Diffusion into Concrete. Materials 2020, 13, 2751. [Google Scholar] [CrossRef] [Scilit]
- Scheidegger, A.E. The Physics of Flow Through Porous Media, 3rd ed.; University of Toronto Press: Toronto, ON, Canada; Buffalo, NY, USA, 1974. [Google Scholar]
- Bear, J.; Cheng, A.H.D. Modeling Groundwater Flow and Contaminant Transport; Springer: Dordrecht, The Netherlands, 2010. [Google Scholar] [CrossRef] [Scilit]
- Mi, L.; Jiang, H.; Cao, Y.; Fang, S.; Liu, H.; Zhou, Y.; An, C.; Yan, B. Comprehensive Apparent Permeability Model Coupled Shale Gas Transfer Mechanisms in Natural Fractures and Matrix. J. Pet. Sci. Eng. 2019, 172, 878–888. [Google Scholar] [CrossRef] [Scilit]
- Xu, P.; Yu, B.; Feng, Y.; Liu, Y. Analysis of Permeability for the Fractal-like Tree Network by Parallel and Series Models. Phys. A Stat. Mech. Its Appl. 2006, 369, 884–894. [Google Scholar] [CrossRef] [Scilit]
- Back, L. Estimated Mean Flow Resistance Increase during Coronary Artery Catheterization. J. Biomech. 1994, 27, 169–175. [Google Scholar] [CrossRef] [Scilit]
- Lee, J.; Kang, J.M.; Choe, J. Experimental Analysis on the Effects of Variable Apertures on Tracer Transport. Water Resour. Res. 2003, 39, 1015. [Google Scholar] [CrossRef] [Scilit]
- Magdziarz, M.; Weron, A.; Burnecki, K.; Klafter, J. Fractional Brownian Motion Versus the Continuous-Time Random Walk: A Simple Test for Subdiffusive Dynamics. Phys. Rev. Lett. 2009, 103, 180602. [Google Scholar] [CrossRef] [Scilit]
- Wiener, N. Differential-Space. J. Math. Phys. 1923, 2, 131–174. [Google Scholar] [CrossRef] [Scilit]
- Lavrov, A. Radial Flow of Non-Newtonian Power-Law Fluid in a Rough-Walled Fracture: Effect of Fluid Rheology. Transp. Porous Media 2014, 105, 559–570. [Google Scholar] [CrossRef] [Scilit]
- Jin, Y.; Liu, X.; Song, H.; Zheng, J.; Pan, J. General Fractal Topography: An Open Mathematical Framework to Characterize and Model Mono-Scale-Invariances. Nonlinear Dyn. 2019, 96, 2413–2436. [Google Scholar] [CrossRef] [Scilit]
- Jin, Y.; Wang, C.; Liu, S.; Quan, W.; Liu, X. Systematic Definition of Complexity Assembly in Fractal Porous Media. Fractals 2020, 28, 2050079. [Google Scholar] [CrossRef] [Scilit]
- Dong, J.; Ju, Y.; Gao, F.; Xie, H. Estimation of the Fractal Dimension of Weierstrass–Mandelbrot Function Based on Cuckoo Search Methods. Fractals 2017, 25, 1750065. [Google Scholar] [CrossRef] [Scilit]
- Zhang, Y.; Chai, J. Effect of Surface Morphology on Fluid Flow in Rough Fractures: A Review. J. Nat. Gas Sci. Eng. 2020, 79, 103343. [Google Scholar] [CrossRef] [Scilit]
- Brown, S.R. Fluid Flow through Rock Joints: The Effect of Surface Roughness. J. Geophys. Res. Solid Earth 1987, 92, 1337–1347. [Google Scholar] [CrossRef] [Scilit]
- Renshaw, C.E. On the Relationship between Mechanical and Hydraulic Apertures in Rough-Walled Fractures. J. Geophys. Res.-Solid Earth 1995, 100, 24629–24636. [Google Scholar] [CrossRef] [Scilit]
- Zhang, Y.; Chai, J.; Cao, C.; Xu, Z. Investigating Izbash’s Law on Characterizing Nonlinear Flow in Self-Affine Fractures. J. Pet. Sci. Eng. 2022, 215, 110603. [Google Scholar] [CrossRef] [Scilit]
- Hong, E.S.; Lee, J.S.; Lee, I.M. Underestimation of Roughness in Rough Rock Joints. Int. J. Numer. Anal. Methods Geomech. 2008, 32, 1385–1403. [Google Scholar] [CrossRef] [Scilit]
- Zhu, H.G.; Xie, H.P.; Yi, C.; Jiang, Y.D.; Liu, J.X.; Lai, S.L.; Dong, X. Anlaysis of Properties of Fluid Flow in Rock Fractures. China J. Rock Mech. Eng. 2013, 32, 657–663. (In Chinese) [Google Scholar]
- Auradou, H.; Drazer, G.; Boschan, A.; Hulin, J.P.; Koplik, J. Flow Channeling in a Single Fracture Induced by Shear Displacement. Geothermics 2006, 35, 576–588. [Google Scholar] [CrossRef] [Scilit]
- Auradou, H. Influence of Wall Roughness on the Geometrical, Mechanical and Transport Properties of Single Fractures. J. Phys. D. Appl. Phys. 2009, 42, 214015. [Google Scholar] [CrossRef] [Scilit]
- Walton, S.; Hassan, O.; Morgan, K.; Brown, M. Modified Cuckoo Search: A New Gradient Free Optimisation Algorithm. Chaos Solitons Fractals 2011, 44, 710–718. [Google Scholar] [CrossRef] [Scilit]
- Yang, X.S.; Deb, S. Engineering Optimisation by Cuckoo Search. Int. J. Math. Model. Numer. Optim. 2010, 1, 330–343. [Google Scholar] [CrossRef] [Scilit]
- Cheung, N.J.; Ding, X.; Shen, H. A Nonhomogeneous Cuckoo Search Algorithm Based on Quantum Mechanism for Real Parameter Optimization. IEEE Trans. Cybern. 2017, 47, 391–402. [Google Scholar] [CrossRef] [Scilit]
- Cui, W.; Yu, Y.; Cheng, W.; Zang, J.; Yuan, Z. Study on seepage characteristics of coal fracture networks based on fractal theory and micro-CT. Bull. Eng. Geol. Environ. 2026, 85, 438. [Google Scholar] [CrossRef] [Scilit]
- Konzuk, J.S.; Kueper, B.H. Evaluation of Cubic Law Based Models Describing Single-Phase Flow through a Rough-Walled Fracture. Water Resour. Res. 2004, 40, W02402. [Google Scholar] [CrossRef] [Scilit]
- Wang, L.C.; Cardenas, M.B.; Slottke, D.T.; Ketcham, R.A.; Sharp, J.M. Modification of the Local Cubic Law of Fracture Flow for Weak Inertia, Tortuosity, and Roughness. Water Resour. Res. 2015, 51, 2064–2080. [Google Scholar] [CrossRef] [Scilit]
- Yan, T.; Xu, X.; Liu, J.; Zhang, Y.; Arif, M.; Xu, X.; Wang, Q. Data-driven predictive model of coal permeability based on microscopic fracture structure characterization. J. Rock Mech. Geotech. Eng. 2025, 17, 4476–4489. [Google Scholar] [CrossRef] [Scilit]
- Succi, S. The Lattice Boltzmann Equation for Fluid Dynamics and Beyond, 1st ed.; Oxford University Press: Oxford, UK, 2001. [Google Scholar]
- Qian, Y.H.; D’Humieres, D.; Lallemand, P. Lattice BGK Models for Navier-Stokes Equatioin. Europhys. Lett. 1992, 17, 479–484. [Google Scholar] [CrossRef] [Scilit]
- Jin, Y.; Li, X.; Zhao, M.; Liu, X.; Li, H. A Mathematical Model of Fluid Flow in Tight Porous Media Based on Fractal Assumptions. Int. J. Heat Mass Transf. 2017, 108, 1078–1088. [Google Scholar] [CrossRef] [Scilit]
- Gutfraind, R.; Hansen, A. Study of Fracture Permeability Using Lattice Gas Automata. Transp. Porous Media 1995, 18, 131–149. [Google Scholar] [CrossRef] [Scilit]
- Jin, Y.; Wu, Y.; Li, H.; Zhao, M.; Pan, J. Definition of Fractal Topography to Essential Understanding of Scale-Invariance. Sci. Rep. 2017, 7, 46672. [Google Scholar] [CrossRef] [Scilit]
- Xie, L.Z.; Gao, C.; Ren, L.; Li, C.B. Numerical Investigation of Geometrical and Hydraulic Properties in a Single Rock Fracture during Shear Displacement with the Navier–Stokes Equations. Environ. Earth Sci. 2015, 73, 7061–7074. [Google Scholar] [CrossRef] [Scilit]
- Marafini, E.; La Rocca, M.; Fiori, A.; Battiato, I.; Prestininzi, P. Suitability of 2D modelling to evaluate flow properties in 3D porous media. Transp. Porous Media 2020, 134, 315–329. [Google Scholar] [CrossRef] [Scilit]

Disclaimer/Publisher’s Note: The statements, opinions and data contained in all publications are solely those of the individual author(s) and contributor(s) and not of MDPI and/or the editor(s). MDPI and/or the editor(s) disclaim responsibility for any injury to people or property resulting from any ideas, methods, instructions or products referred to in the content. |
© 2026 by the authors. Licensee MDPI, Basel, Switzerland. This article is an open access article distributed under the terms and conditions of the Creative Commons Attribution (CC BY) license.