


Abstract
The COVID-19 pandemic and the resulting mobility restrictions significantly disrupted urban traffic patterns. This study quantitatively assesses the impact of these restrictions on vehicle flow at a signalized central intersection in Cluj-Napoca, Romania, through an integrated methodology combining continuous radar-based traffic measurements and AI (Artificial Intelligence)-assisted video analysis. Traffic data were collected before the pandemic (November 2019) and during the lockdown period (April 2020), enabling a comparative evaluation of flow characteristics and vehicle arrival patterns. Under constrained observational conditions, vehicle arrivals were modeled using a probabilistic framework grounded in Poisson distribution. The findings indicate a dramatic contraction of mobility demand, with traffic volumes declining in 2020 to 9.55% of pre-pandemic levels. The probabilistic assessment highlights the predominance of free-flow regimes under reduced demand and confirms the adequacy of the Poisson model in low-density traffic scenarios. The obtained results contribute to a better understanding of urban traffic dynamics under extreme mobility disruptions and provide a transferable methodological framework for probabilistic traffic modeling, resilience-oriented urban mobility planning, and data-driven traffic management.
1. Introduction
Urban mobility systems are characterized by continuous growth in travel demand and increasing pressure on road infrastructure, facing major challenges such as climate change associated with transport-related emissions, deterioration of urban quality of life, and prolonged daily travel times [1]. From an engineering perspective, these challenges are directly reflected in traffic flow dynamics, congestion levels, and the operational performance of traffic control systems.
The global spread of SARS-CoV-2 (COVID-19 or Coronavirus Disease 2019) in early 2020 led to the implementation of unprecedented mobility restrictions worldwide [2,3,4]. These measures caused an abrupt contraction in vehicular travel demand, creating a natural experimental setting for examining traffic flow behavior under low-demand conditions.
Several previous studies have investigated the impact of COVID-19 mobility restrictions on urban traffic dynamics. During lockdown periods, traffic volumes decreased significantly, and movement patterns changed significantly, according to research undertaken in multiple cities around the world. For example, remote sensing and video-based monitoring techniques were utilized to assess traffic activity prior to and during the pandemic, offering useful insights into large-scale mobility disruptions and their spatial distribution [5]. These studies demonstrate the relevance of understanding traffic dynamics during extreme demand reductions and give a valuable foundation for evaluating probabilistic traffic modeling strategies.
Traffic congestion generates substantial economic losses and adversely affects the efficiency of urban transport systems. Urban mobility is a key determinant of economic competitiveness [6,7,8]. From a traffic modeling standpoint, significant demand fluctuations provide an opportunity to assess the robustness and validity of statistical models commonly used for vehicle arrival estimation.
Ensuring sustainable, reliable, and efficient urban mobility requires the implementation of strategic planning instruments such as Sustainable Urban Mobility Plans (SUMP), which rely on quantitative traffic analysis and predictive modeling approaches [9,10,11]. In this context, evaluating the statistical distribution of vehicle arrivals under atypical operating conditions becomes particularly relevant for calibrating and validating probabilistic traffic models.
This study investigates daytime vehicular traffic dynamics in Cluj-Napoca, Romania, employing the Poisson distribution as the primary modeling framework. The main objective is to estimate and compare vehicle arrival distributions before and during the lockdown period, based on traffic data collected in November 2019 and April 2020. The research focuses on short time-interval flow variations, the suitability of the Poisson distribution for modeling low-demand traffic regimes, and the quantitative assessment of traffic reduction relative to baseline conditions.
In Romania, a state of emergency was declared on 16 March 2020 through Decree No. 195 [12], introducing strict mobility restrictions. These measures resulted in a rapid and significant decline in traffic volumes.
At the global level, mobility reduction during the pandemic was associated with an estimated 5.4% decrease in greenhouse gas emissions in 2020 [13,14,15,16]. This reduction is directly linked to lower vehicular traffic volumes, highlighting the importance of accurately quantifying traffic flows during large-scale disruptions.
By integrating radar-based traffic measurements, AI-assisted video analysis, and probabilistic modeling, this paper proposes a methodological framework for assessing vehicular traffic behavior under extreme mobility conditions.
The remainder of the paper is organized as follows:
Section 2 presents a review of the relevant literature concerning traffic dynamics during the COVID-19 pandemic and probabilistic approaches for modeling vehicle arrivals.
Section 3 describes the data acquisition framework, including radar-based traffic measurements and AI-assisted video processing, together with the methodological approach adopted for probabilistic modeling.
Section 4 presents the main results of the analysis and the statistical validation of the proposed model.
Section 5 discusses the implications of the findings for urban traffic behavior and mobility resilience under extreme demand reductions.
Finally, Section 6 summarizes the main conclusions of the study and outlines directions for future research.
2. Literature Review
Several previous studies have analyzed the impact of COVID-19 mobility restrictions on urban traffic volumes and mobility patterns in different cities worldwide. These studies reported significant reductions in traffic demand and substantial modifications in temporal travel patterns during lockdown periods.
International studies conducted between 2020 and 2022 consistently reported substantial reductions in urban mobility following the implementation of COVID-19-related restrictions. Most research documented significant declines in both public transport usage and private vehicular traffic volumes.
El-Geneidy et al. [17] reported reductions of 80–90% in public transport ridership in countries with strict mobility restrictions. Similar analyses conducted across Europe, Asia, and North America indicated traffic volume reductions ranging from 50% to 90% during the initial months of the pandemic [18,19,20,21,22,23,24,25,26,27].
From a vehicular traffic perspective, the literature highlights:
- Decreases in traffic intensity of up to 70% at urban intersections [23].
- Increases in average travel speeds under low-demand conditions [27].
- Structural shifts in modal distribution and temporal travel patterns [19,20,21,22,23,24].
These findings confirm that the pandemic period generated an atypical traffic regime characterized by low demand levels and significant modifications in flow dynamics.
Simulation-based approaches have been widely applied to analyze intersection performance and to support decision-making regarding the conversion between different intersection control types, such as roundabouts and signalized intersections [28].
Beyond descriptive analyses of mobility reduction, several studies have investigated the statistical properties of vehicle arrivals using probabilistic models, particularly the Poisson distribution [29]. The Poisson framework is widely applied to model independent vehicle arrivals over short time intervals and is generally considered appropriate for low- to moderate-density traffic conditions.
Peköz et al. [30] employed the Poisson distribution to estimate traffic flow within a stationary ergodic intersection model. Abul-Magd et al. [31] used a Poisson-based approach to analyze the transition from free-flow to congested traffic regimes. The analytical formulation of inter-vehicle spacing and time-headway distributions has also been derived using Poisson assumptions combined with Wigner’s Surmise [32].
Maya et al. [33] proposed a bilinear and convolutional Poisson-based framework for multi-segment traffic flow estimation, integrating machine learning algorithms and stochastic variational Bayesian techniques to enable real-time parameter updates. Yang et al. [34] developed a Poisson-based analytical model for vehicle platoon behavior at signalized intersections. Thomas et al. [35] demonstrated that seasonal traffic noise variability followed a Poisson distribution in Almelo, the Netherlands.
Additional applications include queue delay evaluation and signal timing optimization based on Poisson assumptions [36], intersection transit-time modeling [37], and congestion anticipation using vehicle trajectory data weighted within a Poisson-based framework [38].
However, most of these studies were conducted under normal operating conditions or focused primarily on congestion analysis. Limited research has addressed extreme low-demand regimes induced by large-scale mobility restrictions.
Current literature reveals a significant gap in:
- Validating Poisson distribution under severely reduced urban traffic conditions characterized by fluctuating demand and atypical flow behavior.
- Robustly estimating vehicle arrival distributions based on limited datasets collected during large-scale disruptions.
- Integrating continuous radar-based traffic measurements with AI-assisted trajectory extraction to develop probabilistic models capable of adapting to dynamic urban contexts.
Advanced methods for estimating intersection control delay using passive traffic sensors and detector-based measurements [39] have been proposed to improve real-time traffic performance assessment and support adaptive traffic management strategies.
Few studies combine multisensory data acquisition (radar and video), artificial intelligence-based vehicle detection, and probabilistic modeling within a unified framework for analyzing lockdown traffic conditions.
3. Materials and Methods
To improve the clarity of the methodological framework adopted in this study, the overall research procedure is summarized in Figure 1. The workflow illustrates the analysis’s main steps, which include traffic data collection, video-based vehicle detection using AI algorithms, traffic measurement aggregation and preprocessing, probabilistic modeling of vehicle arrivals using Poisson distribution, and statistical validation of the results.
Figure 1.
Research methodology workflow for probabilistic modeling of urban traffic during COVID-19 mobility restrictions.
3.1. Traffic Data Collection Methodology
3.1.1. Fixed Traffic Surveillance Camera
To analyze vehicular traffic behavior before and during the COVID-19 pandemic, two complementary data acquisition methods were employed:
- Continuous cross-sectional traffic measurements and
- Video-based analysis using fixed surveillance cameras.
The video monitoring system (Figure 2) consists of fixed cameras installed at the analyzed intersection and integrated into the municipal traffic management system.
Figure 2.
Fixed traffic surveillance camera (photo by the author).
The deployed cameras enable continuous intersection-level monitoring, providing detailed information on vehicle trajectories, vehicle classification, and kinematic parameters such as instantaneous speed and estimated acceleration. The analyzed video recordings were collected during two distinct periods: November 2019 (representing normal traffic conditions) and April 2020 (corresponding to the lockdown period).
Subsequently, the video data were processed to detect and classify moving objects (vehicles and pedestrians) and to extract relevant traffic parameters, as described in the following subsection.
The surveillance cameras form part of the urban traffic management infrastructure [8], which includes adaptive signal control systems and traffic sensors. This integration ensures consistency between video-derived data and operational traffic control parameters, facilitating a comprehensive analysis of vehicular flow dynamics.
3.1.2. Continuous Traffic Measurements
To evaluate macroscopic traffic parameters, namely vehicle flow and average travel speed, an automatic radar-based detection system (Speed Detection Radar—SDR Data Collect) was employed (Figure 3) [40].
Figure 3.
Vehicle detecting equipment SDR (photo by the author).
The SDR Data Collect device operates using microwave radar technology at a frequency of 24.125 GHz and determines the speed of moving objects based on the Doppler effect principle [41,42]. The Doppler effect occurs when the device emits an electromagnetic wave toward a moving object and the reflected wave returns to the radar sensor with a frequency shift proportional to the relative velocity (Figure 4).
Figure 4.
Operating principle of SDR Data Collect based on the radar Doppler effect.
Within the experimental framework, the SDR unit was installed in a cross-sectional configuration relative to the direction of travel and operated continuously (24 h/day) for seven consecutive days in November 2019 and seven consecutive days in April 2020.
The dataset collected included:
- The number of vehicles detected within predefined time intervals.
- The instantaneous speed of each detected vehicle.
- The direction of travel.
These measurements enabled a quantitative and dynamic characterization of traffic flow conditions [43,44].
The main technical characteristics of the SDR Data Collect system are summarized in Table 1 [41].
Table 1.
Technical specifications of the SDR Data Collect system.
The Doppler frequency shift depends on the electromagnetic wavelength and the relative velocity between the radar sensor and the moving target. It can be expressed as [45]:
The phase of the baseband signal is defined as:
The unit vector representing the direction from the radar sensor to the target is defined as:
where is the carrier frequency, is the speed of the electromagnetic wave propagation, represents the initial coordinates of the target in the radar coordinate system (U,V,W), is the translation vector, respectively represents the coordinates of the target after translation (U1,V1,W1), is the distance from the radar sensor to the reference coordinate system (X,Y,Z), is the translation velocity, is the translation velocity at time t, denotes the rotation matrix, and denotes the skew-symmetric matrix.
These formulations describe the relationship between phase variation and relative motion, enabling velocity estimation through Doppler shift analysis.
The SDR system was configured using the dedicated myTrafficData application [46], which enables parameter setting, real-time monitoring, and cloud-based data storage (Figure 5).
Figure 5.
myTrafficData application interface and SDR Data Collect device (photo by the author).
Calibration of the detection geometry was performed by correlating the radar position with the roadway cross-section geometry to minimize measurement errors. The device was installed at a horizontal angle of 45° relative to the longitudinal axis of the roadway and a vertical angle of 78°, resulting in an elliptical detection zone aligned with the monitored traffic section.
The 45° horizontal configuration enables longitudinal velocity estimation through cosine correction of the Doppler component, ensuring accurate measurement of vehicle speed along the travel direction.
3.1.3. Traffic Measurements Using Image Processing
Following radar-based data acquisition, the video recordings obtained from the fixed surveillance cameras were processed using the Data From Sky (DFS) platform (Figure 6) [47,48,49,50].
Figure 6.
Traffic detection using Data From Sky (photo by the author).
The DFS platform enables automated object detection and tracking in video sequences through deep learning algorithms based on Convolutional Neural Networks (CNN). In the present study, only recordings from fixed cameras were used (LIGHT module), without employing aerial imagery.
In this study, the Data From Sky platform is used as an external video analytics tool to automate vehicle detection and trajectory extraction. The internal architecture of the deep learning detection model and its training datasets are proprietary to the software provider, resulting in falling outside the scope of this study. As a result, the platform is viewed as a measurement tool rather than the subject of algorithmic evaluation.
Within the accepted framework, AI-based video processing is largely used to enable vehicle detection, classification, and trajectory verification, while fundamental statistical analysis and probabilistic modeling rely on radar-based traffic observations. Potential detection errors due to object occlusion, lighting circumstances, or camera field-of-view restrictions are all recognized as common sources of measurement variability in video-based traffic monitoring systems.
Video processing allowed object-level extraction of a comprehensive set of traffic-related parameters, including spatial position in each frame, full movement trajectory, vehicle classification, estimated speed, estimated acceleration, and total traversal time within the monitored area. The processed data was exported as compressed Tracking Log files containing frame-level information for each detected object, thereby supporting subsequent quantitative analysis and advanced statistical modeling (Figure 7) [50].
Figure 7.
Functional block diagram of the Data From Sky platform.
The video data processing pipeline consisted of two main stages:
- Georegistration, involving the establishment of correspondence between image pixels and real-world coordinates using fixed infrastructural reference points.
- Object detection and tracking, comprising identification, classification, and trajectory monitoring of vehicles within the analyzed sequences.
The georegistration process enabled the transformation of image-space coordinates into metric spatial coordinates, ensuring accurate estimation of vehicle speed and travel distance, as well as consistency of derived kinematic parameters [51].
3.2. Research Methodology
The dataset obtained through radar-based measurements and AI-assisted video processing was used to analyze vehicle arrival distributions and to estimate traffic flow probabilities using the Poisson distribution framework. A comparative analysis was conducted for two distinct traffic regimes: (i) normal operating conditions (November 2019) and (ii) reduced-mobility conditions during the lockdown period (April 2020).
In the adopted framework, radar-based measurements constitute the primary source of traffic flow data used for estimating arrival rates and calibrating the probabilistic model. The AI-assisted video processing on the Data From Sky platform was largely used for vehicle detection validation, object classification, and trajectory consistency checks. A probabilistic model based on the Poisson distribution was then used to define the stochastic structure of vehicle arrivals and reconstruct the temporal distribution of traffic demand during the lockout.
To ensure methodological transparency and repeatability, the data processing procedure used in this investigation is outlined below. Radar sensors deployed at the intersection under study were used to collect traffic information. The radar-based counts were averaged over 15 min intervals to determine vehicle arrival rates. Based on observed traffic counts, the Poisson parameter λ was determined for each interval. The probabilistic model was then used to reconstruct the temporal distribution of traffic flows across a 24 h period.
3.2.1. Case Study Site Description
The analyzed location was Lucian Blaga Square, situated in the central area of Cluj-Napoca, Romania (46°46′ N, 23°35′ E) [52]. The selected intersection represents a complex signalized urban node characterized by multiple entry and exit branches and significant temporal variability in vehicular demand.
The intersection is supplied by one three-lane arterial (Clinicilor Street) and three two-lane arterials (Victor Babeș Street, Petru Maior Street, and Gheorghe Șincai Street). Outbound traffic is distributed toward two two-lane arterials (Napoca Street and Republicii Street) and one single-lane branch (Petru Maior Street) (Figure 8).
Figure 8.
The analyzed area (https://cluj-city.map2web.eu/) (accessed on 11 February 2026).
The site was selected due to its operational relevance to the objectives of the study. It is classified as a recurrently congested urban node during peak hours and serves as a strategic connection between the main west–east and north–south corridors of the urban network. Its configuration enables the observation of transitions between congestion-prone and free-flow regimes under varying demand conditions, thereby providing an appropriate framework for assessing the validity of the Poisson distribution across distinct operational states [53].
The intersection operates under adaptive signal control integrated within the municipal traffic management system. This configuration generates a mixed traffic regime influenced by both vehicular demand and signal control logic. The presence of adaptive signalization is particularly relevant for arrival distribution analysis, as signal cycles may introduce temporal correlations between successive vehicles, potentially affecting the independence assumptions underlying Poisson-based modeling.
3.2.2. Traffic Measurements (Year 2019)
The measurements conducted in November 2019 were intended to characterize the normal operational regime of the analyzed intersection and to provide the reference dataset subsequently used for estimating the parameters of the Poisson distribution.
Raw data, consisting of individual vehicle detections [54] (Table 2), were aggregated into 15 min intervals. This temporal resolution was selected to reduce random variability inherent in individual detections, ensure compatibility with typical signal cycle durations, and enhance the stability of the λ parameter estimation within the Poisson framework. Additionally, the chosen aggregation interval facilitated the identification of congestion-prone periods.
Table 2.
Vehicle classification schemes (ARX—Automatic Road Analyzer).
For each entry and exit branch (Figure 9 and Table 3; Figure 10 and Table 4), the following performance indicators were computed (Figure 11 and Table 5; Figure 12 and Table 6):
Figure 9.
Traffic flow at the entrance to Lucian Blaga Square (2019): (a) Clinicilor Street, (b) Victor Babeș Street, (c) Petru Maior Street, (d) Gheorghe Șincai Street.
Table 3.
Traffic flow at the entrance to Lucian Blaga Square (2019).
Figure 10.
Traffic flow at the exit of Lucian Blaga Square (2019): (a) Petru Maior Street, (b) Napoca Street, (c) Republicii Street.
Table 4.
Traffic flow at the exit to Lucian Blaga Square (2019).
Figure 11.
Average traffic speed at the entrance to Lucian Blaga Square (2019): (a) Clinicilor Street, (b) Victor Babeș Street, (c) Petru Maior Street, (d) Gheorghe Șincai Street.
Table 5.
Average traffic speed at the entrance to Lucian Blaga Square (2019).
Figure 12.
Average traffic speed at the exit of Lucian Blaga Square (2019): (a) Petru Maior Street, (b) Napoca Street, (c) Republicii Street.
Table 6.
Average traffic speed at exit from Lucian Blaga Square (2019).
- Vehicular flow (vehicles/15 min).
- Total daily flow (vehicles/day).
- Average speed (km/h).
- 15th percentile speed (v15—15th percentile speed).
- 85th percentile speed (v85—85th percentile speed).
- Standard deviation of speed.
- Coefficient of variation in traffic flow.
The daily traffic volumes recorded during 21–27 November 2019 indicate a cumulative total of 273,996 vehicles at the intersection entries and 273,668 vehicles at the exits. The relative difference of 0.12% confirms measurement consistency and appropriate sensor positioning. This minor discrepancy is attributed to vehicles accessing or exiting the nearby underground parking facility and does not indicate detection losses.
The 15 min aggregated analysis highlights pronounced diurnal variations in traffic flow, with two distinct peak periods corresponding to morning and afternoon commuting hours. An increased coefficient of variation was observed during transition intervals between free-flow and congested regimes, indicating heightened instability in traffic conditions during these intermediate phases.
Average speed values, together with the 15th (v15) and 85th (v85) percentile speeds, confirm the presence of a mixed traffic regime. During low-demand intervals, traffic operated under predominantly free-flow conditions, whereas peak hours exhibited a saturated regime characterized by reduced speeds and increased dispersion.
Video recordings from the fixed surveillance cameras located at Lucian Blaga Square were processed using the DFS Viewer utility to determine the daily traffic distribution for the analyzed approaches (Figure 13).
Figure 13.
Traffic detection using DFS Viewer (photo by the author).
The video-processing platform displays intermediate metrics in pixel-based units (e.g., kpx/h), which correlate to internal detection and motion-tracking indicators. These numbers are only utilized to analyze video frames internally and cannot be directly read as physical traffic flow amounts. All traffic flow indicators given in this study are expressed in standard traffic engineering units (vehicles per hour) and are based on validated vehicle counts obtained by radar measurements.
Table 7 presents a summary of the data obtained from the processing of video recordings.
Table 7.
Traffic values 2019—DFS measurement.
The unit “kpx/h” refers to an internal pixel-based motion indication generated by the video-processing platform, not a physical traffic flow unit. The traffic indicators utilized in the analysis are expressed as vehicles per hour.
To assess the consistency between the two measurement methods, traffic flows obtained from radar detection and video processing were compared for synchronized 5 min intervals. The average discrepancy between the two systems was approximately 9%.
This difference can be attributed to the technological and operational characteristics of the detection systems. First, the detection domains differ substantially: the radar operates on a defined cross-sectional detection line, whereas the video system captures a two-dimensional observation area. Second, object occlusion and overlapping trajectories may introduce counting inaccuracies in video-based detection. Additionally, objects located near the boundaries of the camera’s field of view may be affected by geometric distortions or partial information loss, further contributing to the observed deviations.
The traffic flow values aggregated at 15 min intervals were used to estimate the Poisson parameter λ for each entry and exit branch.
The 2019 dataset defines the baseline traffic regime and serves as the reference condition for evaluating the changes observed in 2020, thereby enabling the assessment of the suitability of the Poisson distribution under different demand levels.
3.2.3. Traffic Measurements (Year 2020)
The traffic monitoring campaign conducted during the lockdown period covered a continuous interval of seven days. This duration was chosen because urban traffic patterns often have a weekly cycle, allowing for the recording of both weekday and weekend traffic dynamics. April 2020 was chosen as the observation period because it coincides with the period with the most stringent mobility restrictions imposed under Romania’s COVID-19 state of emergency. During this time, educational institutions shuttered, numerous commercial activities were temporarily stopped and mobility demand reduced. Furthermore, the radar-based monitoring equipment operated autonomously on internal battery power, providing reliable continuous observations for around a week.
The measurements corresponding to the lockdown period (April 2020) were conducted using the same methodological framework applied in 2019, ensuring direct comparability of results. Specifically, continuous radar-based measurements (SDR Data Collect) were complemented by video processing through the DFS platform. Data aggregation was performed at 15 min intervals, maintaining the temporal resolution adopted for the reference year.
Table 8 presents an example of video-based measurements for a representative interval (7 April 2020, 08:50–08:55), used to validate object detection and classification accuracy.
Table 8.
Traffic values 2020—DFS measurement.
The aggregated radar-based traffic flows recorded during April 2020 indicate a substantial reduction in daily traffic volume, reaching an average of 9.55% of the mean daily value observed in November 2019.
The reduction ratio was calculated as
where represents the mean daily traffic flow during the lockdown period and denotes the corresponding mean daily flow during the reference period.
This result reflects an extremely low-demand traffic regime characterized by the disappearance of conventional peak-hour patterns and a flattened diurnal distribution. Furthermore, a significant decrease in flow variability was observed, accompanied by increased stability of average speeds, indicating operating conditions approaching free flow with minimal vehicle interactions.
Due to the DFS platform’s processing capacity limits for extended datasets, video recordings were only available for extremely brief observation windows during the lockdown period. In the methodological framework utilized in this investigation, video data were mostly used to test the vehicle recognition and classification procedure, as well as to confirm the consistency of radar-based traffic measures. The reconstruction of the daily traffic profile and statistical analysis of traffic flows were primarily based on continuous radar observations, which offered complete temporal coverage of the investigated period. As a result, the video dataset’s restricted temporal coverage has no meaningful effect on the robustness of the study conclusions.
For the statistical characterization of vehicle arrivals, the 15 min aggregated flow values were used to estimate the Poisson parameter λ, following the same estimation procedure applied for the 2019 dataset.
3.2.4. The Mathematical Model for Traffic Distribution
To analyze vehicle arrival patterns under the mobility restrictions imposed in 2020, a probabilistic framework based on the Poisson distribution was adopted. The Poisson model is appropriate for arrival-type stochastic processes characterized by discrete, independent events occurring within a finite time interval.
The fundamental assumptions of the model are:
- i.
- Vehicle arrivals within sufficiently short time intervals are statistically independent.
- ii.
- The probability of more than one arrival within an infinitesimal interval is negligible.
- iii.
- The expected arrival rate remains constant within each aggregation interval.
The Poisson probability mass function is defined as
where represents the probability of observing exactly n vehicles within time interval t, denotes the mean arrival rate (vehicles per unit time), n is the observed vehicle count and t corresponds to the aggregation interval (15 min).
The arrival rate parameter λ was estimated separately for each 15 min interval using experimental radar measurements from April 2020 [55]:
where represents the observed vehicle count within interval i. Accordingly, the process is treated as a non-homogeneous Poisson process, with a time-varying arrival rate reflecting diurnal traffic dynamics.
Preliminary variance analysis indicated slight overdispersion . To assess model robustness, a negative binomial formulation was tested as an alternative count model. The generalized log-linear specification of the arrival rate is
To explicitly address overdispersion, a stochastic error component was introduced:
Conditional on the probability mass function becomes
Integrating over the gamma-distributed error term yields the negative binomial distribution:
where ) denotes the gamma function and , and is the dispersion parameter.
Model parameters were estimated using maximum likelihood:
Goodness-of-fit tests indicated that the Poisson model provides a satisfactory approximation for the analyzed intervals; therefore, the final estimation framework is based on the Poisson distribution.
Video-based observations from 2020 covered only limited time windows. The 2019 dataset, consisting of continuous 24 h measurements aggregated at 15 min intervals, was used as a structural reference.
Given that uniform traffic conditions within 15 min samples were confirmed through DFS-based analysis, the corresponding 5 min equivalent flow was derived as
where represents the 15 min aggregated flow.
The parameter λ was calculated using observations for the data recorded in 2020. Given the data provided in Equation (5), the probability that vehicles arrive in a time interval was calculated (Figure 14).
Figure 14.
The probability of vehicles arriving in a time interval.
Since the 2020 video data covered short observation windows, the estimated probabilistic model was used to reconstruct the full daily traffic profile:
where denotes the estimated traffic flow for interval i, and is the corresponding estimated arrival rate. This formulation preserves dimensional consistency and maintains the physical interpretation of traffic flow as the expected value of the Poisson process.
The index i corresponds to 15 min intervals for both measured (2019) and estimated (2020) datasets. To reflect the legally imposed night-time traffic restrictions during lockdown (22:00–06:00), the corresponding probability values P(t) were set to zero for these intervals (Figure 15). Notably, 2019 measurements during the same period already exhibited minimal traffic volumes.
Figure 15.
Vehicle traffic at 15 min interval in 2020.
The reconstructed 24 h traffic profile was validated using NCSS 2022 (Number Cruncher Statistical System, version 22.0.9) Statistical Software [56]. The goodness-of-fit analysis yielded a probability level of 0.98, confirming strong agreement between observed and modeled vehicle counts (Figure 16).
Figure 16.
Comparative results: traffic flow distribution over 24 h.
Comparison of the estimated daily profiles for 2019 and 2020 reveals:
- A pronounced reduction in overall traffic intensity.
- Attenuation of traditional morning and afternoon peaks.
- Substantial flattening of the diurnal distribution.
- Structural modification of temporal demand patterns.
These findings indicate a redistribution of mobility demand across the day and a significant reduction in traffic concentration during conventional peak periods.
The proposed modeling framework enables estimation of traffic behavior under severe mobility restrictions using limited observational data, offering a transferable tool for analyzing extreme mobility scenarios and supporting resilience-oriented urban traffic planning.
To evaluate the robustness of the Poisson formulation, an alternative count model based on the negative binomial distribution was also examined. When count data demonstrates overdispersion, the negative binomial distribution is frequently used in traffic flow modeling. However, analysis of the observed traffic counts revealed that the variance-to-mean ratio remained near unity under the studied low-demand traffic regime. Furthermore, values very near to zero were obtained when the dispersion parameter was estimated using the negative binomial formulation, indicating minimal divergence from the equidispersion condition. As a result, the Poisson model was considered suitable and statistically appropriate for modeling the vehicle arrival process in the current investigation. The Poisson model is also preferred due to its simplicity and interpretability when the equidispersion assumption is approximately satisfied.
4. Results
4.1. Traffic Flow Characteristics Before the Pandemic (2019)
Continuous measurements conducted in November 2019 indicate that traffic at Lucian Blaga Square operated under recurrent high-volume conditions, particularly during peak periods.
The cumulative inflow over the seven monitored days (Figure 9, Table 3) reached 273,996 vehicles, while the cumulative outflow (Figure 10, Table 4) was 273,668 vehicles, corresponding to a relative difference of only 0.12%. This negligible imbalance confirms global flow conservation within the intersection and validates the consistency of sensor positioning and data acquisition.
The average daily inflow was approximately 39,142 vehicles/day, ranging between 31,189 and 44,150 vehicles/day. The corresponding average daily outflow was 39,095 vehicles/day, indicating an almost symmetric distribution of traffic volumes. The coefficient of variation in daily volumes (11–13%) reflects moderate variability, typical of central urban areas characterized by mixed land use (administrative, medical, academic).
The highest daily inflow (44,150 vehicles/day) was recorded on 21 November 2019, corresponding to a regular working day with intense urban activity.
Mean entry speeds (Figure 11, Table 5) ranged between 36.80 and 39.78 km/h, whereas mean exit speeds (Figure 12, Table 6) varied between 43.05 and 46.81 km/h. The average difference of approximately 7–8 km/h between entry and exit speeds reflects the dynamic processes governing intersection operation. Vehicle deceleration and queue formation upstream of the stop line reduce entry speeds, while downstream acceleration and flow dispersion increase exit speeds. This difference is further influenced by the adaptive signal control system, which modulates green times and temporally redistributes traffic demand.
Peak intervals were characterized by inflows reaching 220–250 vehicles per 15 min interval on major approaches, accompanied by mean speeds dropping below 35 km/h, indicating operation close to saturation conditions.
The combined analysis of flow and speed reveals a clear inverse relationship between traffic intensity and mean speed, consistent with the fundamental diagram of traffic flow (flow–density–speed relationship). Increased demand during peak hours leads to reduced speeds and higher dispersion, confirming the presence of congestion dynamics.
Overall, the 2019 dataset reflects an urban traffic system operating in a dynamic equilibrium state, characterized by high and recurrent volumes, predictable temporal variability, and systematic queue formation during peak periods. This operational regime defines the baseline reference condition for subsequent comparison with the pandemic period.
4.2. Traffic Conditions During COVID-19 Restrictions (2020)
Traffic measurements conducted in April 2020, during the state of emergency, revealed a pronounced structural reduction in mobility demand at the analyzed intersection.
AI-assisted video processing detected 28 vehicles and 7 pedestrians within a representative 5 min interval. When compared with the equivalent reference period in 2019, these values correspond to approximately 9.55% of the pre-pandemic vehicular traffic and approximately 5% of the pedestrian activity level. This magnitude of reduction confirms a near-collapse of regular urban mobility patterns during lockdown conditions.
Despite the drastic decrease in traffic volumes, the mean vehicle speed recorded during the analyzed interval in 2020 was 36.27 km/h, a value comparable to the entry speed observed under normal conditions. The absence of a proportional increase in speed indicates that traffic performance remained structurally constrained by signal timing and intersection control logic rather than by demand levels alone.
Although traffic volumes decreased dramatically during the lockdown period, the average vehicle speeds did not increase proportionally. This behavior can be explained by numerous variables unique to metropolitan traffic environments. First, stated speed restrictions and urban road layout limit vehicle speeds, especially in low-demand conditions. Second, the investigated intersection is regulated by traffic signals, which means that vehicle progression is still determined by signal timing and mandatory stopping intervals, independent of traffic demand. As a result, the operational regime becomes predominantly control-dominated rather than demand-driven.
This observation is also consistent with basic traffic flow diagrams, which show that when traffic demand is low, the system normally functions in a regime of low flow and moderate speeds rather than an unconstrained increase in speed.
This effect has also been documented in previous research on urban traffic dynamics in low-demand environments.
4.3. Probabilistic Modeling of Vehicle Arrivals
In this study, the probabilistic model was used to reconstruct the temporal distribution of traffic volumes over a 24 h period, with its parameters calibrated using continuous radar-based traffic measurements, which served as the core empirical dataset for the analysis. The model does not replace direct measurements but rather provides a statistical framework for estimating vehicle arrival distributions over time intervals where direct observations may be limited. The projected arrival rates, like any other probabilistic reconstruction approach, are subject to uncertainty. However, the consistency of modeled and observed traffic patterns, as well as the goodness-of-fit study, suggests that the rebuilt daily profile is a reliable approximation of traffic dynamics during the investigated lockdown period.
Although continuous radar measurements provide complete traffic counts for the period under consideration, the probabilistic modeling framework is used to define the stochastic nature of vehicle arrivals rather than to replace empirical data. In this context, the Poisson model is used to estimate the arrival rate parameter and explain the probability distribution that governs vehicle arrivals across time. The reconstructed daily traffic profile thus reflects a statistical interpretation of the temporal demand distribution obtained from the probabilistic model calibrated with radar-based measurements.
The Poisson distribution was employed to model vehicle arrivals at the intersection during the state of emergency, treating arrivals as a discrete time-dependent stochastic process. The model was formulated as a non-homogeneous Poisson process, with the arrival rate estimated separately for each 15 min interval based on the experimental data collected in April 2020.
Radar-based measurements obtained during the lockdown period revealed exceptionally low traffic activity at night, with multiple consecutive 15 min intervals indicating zero or near-zero vehicle arrivals. Under these conditions, the related Poisson arrival probability is insignificant. For modeling reasons, these probabilities were approximated as zero in the reconstructed daily profile, reflecting the experimentally observed absence of traffic demand rather than an externally imposed limitation.
The estimated values of ranged between 0 and 1.6 vehicles/min during active daytime periods, with a daily average of 0.42 vehicles/min, corresponding to approximately 25 vehicles per 15 min interval. These values reflect a severely reduced demand regime compared to the 2019 baseline.
The Poisson probability mass function was used to compute the likelihood of observing n vehicles within a given time interval t.
The variance-to-mean ratio for the 2020 dataset was close to unity (), indicating minimal deviation from the equidispersion property characteristic of Poisson processes.
A chi-square goodness-of-fit test yielded a significance level of p = 0.98, confirming that the Poisson distribution adequately describes the arrival process under restricted traffic conditions. To assess potential overdispersion, a negative binomial formulation was also tested. Maximum likelihood estimation of the dispersion parameter α produced values approaching zero (α → 0), indicating that overdispersion effects were negligible in the low-demand regime.
Consequently, the Poisson model was considered sufficient for reconstructing the daily traffic profile.
Using the estimated values, the 2020 daily traffic curve was reconstructed. The resulting profile reveals an almost complete suppression of the morning peak (07:00–09:00) and a pronounced attenuation of the afternoon peak (16:00–18:00). Overall, the diurnal variation appears substantially flattened, indicating a redistribution and homogenization of mobility demand throughout the day. Traffic volumes between 22:00 and 06:00 approached zero, consistent with the mobility restrictions in force during the analyzed period.
Compared to 2019, peak-hour flow rates decreased by approximately 88–92%, depending on the approach, while the average daily flow dropped to approximately 9–12% of pre-pandemic levels. These results confirm a structural transition from a peak-dominated regime to a uniformly low-intensity arrival process, statistically compatible with near-ideal Poisson behavior. The reconstruction should therefore be interpreted as a probabilistic estimate rather than an exact deterministic representation of traffic flows.
4.4. Model Validation
Statistical validation of the probabilistic framework was performed using NCSS Statistical Software [56], applying the chi-square (χ2) goodness-of-fit test to evaluate the agreement between observed and Poisson-estimated frequencies.
The observed vehicle arrival frequencies and those predicted by the Poisson model were compared using the χ2 goodness-of-fit test. Traffic counts collected at 15 min intervals during the monitored observation period were used for the analysis. To make sure that the expected frequency in each bin met the minimal threshold necessary for the validity of the χ2 approximation, observed and expected frequencies were sorted into bins established according to vehicle count ranges. The provided p-value was obtained by computing test statistics using pooled data from all intervals. The number of degrees minus one minus the number of estimated parameters in the Poisson model was used to get the number of degrees of freedom. Because the test was performed on the aggregated dataset rather than on individual interval-level tests, no multiple testing procedure was used.
To evaluate the statistical significance of the differences between the two observation periods, a Welch two-sample t-test was performed on the daily traffic volumes recorded in 2019 and 2020. Traffic demand decreased significantly during the lockdown, according to the test (t = 18.62, p < 0.001). Cohen’s d was used to further quantify the degree of this change, and the result was an effect size of 6.84, suggesting a very significant difference between the two traffic regimes.
The compliance of the observed vehicle arrival frequencies with the Poisson distribution was further evaluated using a χ2 goodness-of-fit test. At the significance level α = 0.05, the null hypothesis—that vehicle arrivals follow a Poisson distribution—cannot be rejected, according to the computed test statistic of χ2 = 4.87 with 6 degrees of freedom (p = 0.56). This result indicates that the data from experiments and the probabilistic model are in good accord.
The variance-to-mean ratio of the observed arrival numbers was used for additional validation. This ratio was roughly 1.08 for the examined intervals, which closely matched the Poisson distribution’s equidispersion feature. On the other hand, peak-hour observations from the 2019 sample showed variance-to-mean ratios more than 1.4, indicating overdispersion linked to vehicle platooning and congestion impacts.
The near-unit dispersion observed in 2020 suggests that, under severely reduced demand, inter-vehicle dependence and platooning effects are substantially diminished. As a result, the independence assumption underlying the Poisson process becomes more realistic compared to normal traffic conditions.
A comparative assessment between 2019 and 2020 is summarized in Table 9.
Table 9.
Comparative assessment between 2019 and 2020.
To evaluate the statistical significance of the differences between the two observation periods, a Welch two-sample t-test was performed on daily traffic volumes reported in 2019 and 2020. This test was chosen because it enables the comparison of mean values from two independent samples without assuming equal variances. The results show a considerable reduction in traffic demand during the lockdown period (p < 0.001), indicating a structural change in urban mobility patterns.
The extent of the difference demonstrates the extraordinary impact of COVID-19 mobility restrictions on urban transportation demand.
The results confirm that mobility restrictions imposed in 2020 led to a severe reduction in congestion phenomena, the disappearance of the characteristic bimodal daily traffic profile, and a substantial decrease in temporal variability. Moreover, the statistical behavior of vehicle arrivals became increasingly compatible with the fundamental assumptions of the Poisson model.
This transition reflects a shift from a near-capacity operational regime in 2019—characterized by vehicle interdependence and queue formation—to a low-density, free-flow-dominant regime in 2020, characterized by rare and nearly independent arrival events.
The probabilistic model demonstrates robustness under extremely low-demand conditions and provides a reliable tool for estimating traffic behavior in exceptional mobility scenarios. Given the statistical validation and engineering consistency of the results, the Poisson framework can be considered adequate for describing vehicle arrival distributions during the analyzed lockdown period.
5. Discussion
5.1. Interpretation of Traffic Reduction Under Mobility Restrictions
The results demonstrate a profound structural disruption of urban mobility patterns during the COVID-19 emergency period. Traffic volumes decreased to approximately 9–12% of the 2019 reference level, while pedestrian activity declined to nearly 5%, indicating an almost complete contraction of routine urban mobility at the analyzed central node.
Compared to international findings reporting reductions between 60% and 90%, the observed 88–92% peak-hour reduction places the studied intersection at the upper bound of global impact levels. This heightened sensitivity can be attributed to the functional characteristics of the location, which include a high concentration of administrative institutions, academic facilities, medical services, and commuter-dominated trip patterns. The closure of institutions and the large-scale adoption of remote work directly suppressed the dominant travel demand components.
Importantly, the elimination of the bimodal peak structure and the flattening of the diurnal distribution indicate that restrictions induced not merely a quantitative reduction in volume, but a structural reorganization of temporal demand patterns. The disappearance of pronounced morning and afternoon peaks reflects the collapse of commuting-driven mobility.
The improved compatibility of 2020 data with the assumptions of the Poisson distribution further supports this structural interpretation. Under near-capacity conditions (2019), vehicle interdependence, queue formation, and platooning introduce correlations that violate independence assumptions. Under extremely low demand (2020), arrivals approximate independent rare events, explaining the superior performance of the Poisson model.
These findings suggest that central urban nodes are highly sensitive to institutional activity patterns and that mobility restrictions can rapidly trigger a transition toward a free-flow dominant regime accompanied by fundamental changes in temporal demand structure. This has direct implications for emergency mobility planning and SUMP-based scenario modeling.
5.2. Traffic Regime Transition and Flow Characteristics
In 2019, the intersection operated close to capacity during peak periods, as indicated by high flow rates and reduced mean speeds. The observed flow–speed relationship is consistent with operation near the descending branch of the fundamental diagram, where increased density leads to speed reduction and congestion onset. The likely volume-to-capacity ratio (v/c) approached unity during peak intervals (07:00–09:00 and 16:00–18:00), resulting in recurrent queue formation and shockwave propagation.
During the 2020 restrictions, peak flows decreased by 88–92%, shifting the system to a fundamentally different operational regime. The v/c ratio fell well below unity, eliminating queue formation mechanisms and significantly reducing vehicle interactions. Temporal variability decreased, and the arrival process became statistically closer to independent random events.
Notably, mean speeds did not increase proportionally to the dramatic demand reduction. This indicates that intersection performance under low demand was constrained primarily by signal control logic rather than capacity limitations. In 2019, traffic dynamics were governed predominantly by demand pressure and vehicle interaction effects. In 2020, system behavior became control-dominated rather than capacity-dominated.
This shift reflects a structural transition in the governing mechanisms of the traffic system—from interaction-driven congestion to regulation-driven flow stabilization.
5.3. Suitability of the Poisson Modeling Framework
The Poisson framework relies on two core assumptions:
- Statistical independence of arrival events.
- Equidispersion (variance approximately equal to the mean).
The Poisson model’s independence assumption has been evaluated using a number of supplementary indicators that were obtained from the combined traffic measurements. First, the observed arrival counts’ variance-to-mean ratio was close to unity (≈1.08), which is in line with Poisson processes’ equidispersion property. Second, persistent autocorrelation patterns that are usually linked to vehicle platooning or upstream signal coordination were not found in the temporal development of traffic over successive 15 min intervals. Finally, compared to typical urban traffic conditions, the assumption of statistically independent arrivals is more likely because of the exceptionally low traffic density seen during the lockdown period, which significantly decreased inter-vehicle contacts.
Under normal urban traffic conditions, these assumptions are frequently violated due to platooning, upstream signal coordination, congestion wave propagation, and vehicle interdependence. Such conditions typically generate overdispersion and correlated arrivals.
During the lockdown period, reduced density significantly diminished inter-vehicle interactions. The observed variance-to-mean ratio (≈1.08) closely approaches the theoretical Poisson condition. The high χ2 goodness-of-fit significance level (p = 0.98) confirms strong agreement between observed and theoretical distributions.
Testing a negative binomial formulation yielded dispersion parameters approaching zero (α → 0), indicating negligible overdispersion. Consequently, the Poisson model provides a statistically sufficient and parsimonious description of vehicle arrivals under severely reduced demand.
Under congested or near-capacity traffic conditions, vehicle arrivals are strongly influenced by queue formation, signal coordination, and platooning effects generated by upstream intersections. These mechanisms introduce temporal correlations between successive arrivals, which frequently result in overdispersion in perceived traffic numbers. However, in low-demand traffic conditions, vehicle interactions become substantially less common, and the arrival process resembles a series of random and nearly independent events. As a result, the statistical independence assumption becomes more reasonable, and the variance-to-mean ratio approaches unity, in accordance with the Poisson distribution’s equidispersion feature. These qualities make the Poisson framework ideal for simulating vehicle arrivals in extremely low-demand traffic scenarios.
This behavior has been frequently observed in traffic flow studies analyzing unsaturated or low-demand traffic regimes.
5.4. Methodological Implications of AI-Based Video Processing
The integration of radar-based detection (SDR) and AI-assisted video processing (DFS platform) enabled multi-source validation of traffic volumes and classifications.
Radar measurements provide precise cross-sectional counts and instantaneous speed estimation, while video-based deep learning detection captures full-scene dynamics, enabling trajectory reconstruction, classification, acceleration estimation, and interaction analysis.
The observed ~9% discrepancy between radar and video measurements reflects methodological differences in detection geometry rather than a major systematic error. Radar operates on a defined cross-sectional plane, whereas video detection covers a two-dimensional field with potential edge distortions and occlusion effects. The strong temporal correlation between the two datasets confirms coherent representation of flow dynamics.
The hybrid sensing framework enhances robustness, reduces systematic bias associated with single-sensor approaches, and demonstrates the potential of AI-supported monitoring for probabilistic modeling and operational diagnostics of urban intersections.
5.5. Urban Resilience and Traffic Management Implications
The observed collapse of mobility demand provides insights into urban traffic system resilience. In transport engineering terms, resilience can be defined as the ability of the system to absorb extreme external shocks, maintain operational stability, and recover to its original regime.
Despite a 90% demand reduction, the signalized intersection maintained stable operation without systemic malfunction. Adaptive signal control remained functional under atypical arrival distributions, suggesting robust regulatory logic capable of accommodating extreme demand fluctuations.
The probabilistic framework developed in this study offers practical utility for extreme scenario modeling, emergency mobility planning, resilience testing, and rapid reconstruction of daily traffic profiles from limited observations. Such capability is particularly relevant for sudden disruptions, including pandemics, natural disasters, or security-related mobility restrictions.
While the study focuses on a single central intersection, the methodological approach is transferable to other urban nodes, provided that:
- i.
- Baseline reference data are available.
- ii.
- Low-demand observations exist for comparative calibration.
- iii.
- Arrival processes remain sufficiently sparse to satisfy probabilistic assumptions.
However, extrapolation to multilane coordinated corridors, high-speed freeway segments, or multimodal hubs must be undertaken cautiously, as different interaction dynamics may invalidate the independence assumption. Future research should therefore investigate whether similar probabilistic behavior emerges across diverse infrastructure typologies and varying demand structures.
6. Conclusions
This study investigated the impact of COVID-19 mobility restrictions on urban traffic dynamics at a central signalized intersection in Cluj-Napoca, Romania, using an integrated framework combining continuous radar measurements and AI-assisted video processing.
The findings reveal an extreme structural contraction of mobility demand. Vehicle volumes decreased to approximately 9.55% of the pre-pandemic baseline, while pedestrian activity declined to nearly 5%. Beyond this quantitative reduction, a fundamental transformation of the temporal traffic structure was observed, characterized by the disappearance of morning and afternoon peak periods and a pronounced flattening of the diurnal profile.
From an operational perspective, the intersection transitioned from a near-capacity, congestion-prone regime (2019) to a low-density, free-flow dominant regime (2020), governed primarily by signal control logic rather than demand pressure. Despite the dramatic reduction in flow, average speeds did not increase proportionally, confirming the persistent structural influence of signal regulation on performance metrics.
The probabilistic modeling framework based on the Poisson distribution—supplemented by a negative binomial robustness test—demonstrated strong agreement with observed data under reduced demand conditions. The variance-to-mean ratio approaching unity and the high χ2 goodness-of-fit (p = 0.98) confirm that, under sparse traffic conditions, vehicle arrivals approximate an independent stochastic process more closely than under congested regimes dominated by inter-vehicle interactions and platooning effects.
The integration of radar detection and AI-based video analytics enabled multi-source validation of traffic volumes and strengthened the robustness of probabilistic parameter estimation. The proposed methodological framework allows reconstruction of daily traffic distributions from limited observational datasets and provides a transferable tool for modeling extreme mobility scenarios and supporting resilience-oriented traffic management strategies.
Overall, the study demonstrates that extreme mobility disruptions modify not only traffic intensity but also the stochastic structure of arrival processes, with direct implications for probabilistic modeling and operational traffic management under low-demand conditions.
The results of this study provide a few significant insights into the behavior of urban transportation systems under extreme mobility limits.
First, the data confirmed a substantial contraction in vehicular mobility across the lockdown period, with traffic volumes decreasing to 9–12% of pre-pandemic levels. This decline was accompanied by a structural shift in the daily traffic profile, as seen by the removal of the traditional bimodal peak structure and a significant flattening of diurnal demand distribution.
Second, the statistical research showed that when traffic demand is significantly lowered, the vehicle arrival process becomes more compatible with the Poisson distribution assumptions. Vehicle arrivals in low-density traffic regimes are nearly independent stochastic events, as indicated by the high χ2 goodness-of-fit value and a variance-to-mean ratio nearing unity.
Third, integrating radar-based traffic measurements with AI-assisted video processing was helpful in getting accurate traffic flow data and validating probabilistic modeling approaches. The proposed methodology thus provides a transferable structure for reconstructing traffic demand profiles in situations where observational data is limited, such as during large-scale mobility disruptions.
Several limitations must be acknowledged.
First, the temporal coverage of the 2020 data was restricted to a limited lockdown window. The 24 h traffic profile was reconstructed through probabilistic extrapolation, which introduces uncertainty.
Second, the reference measurements (November 2019) and lockdown measurements (April 2020) were collected in different seasons. Although seasonal effects in central urban nodes are expected to be moderate, influences related to meteorological conditions and daylight duration cannot be entirely excluded. Although the reference dataset is from November 2019 and the lockdown dataset is from April 2020, traffic demand in the analyzed urban intersection is largely determined by commuting and educational mobility patterns, which are relatively consistent during both the autumn and spring semesters. Nevertheless, seasonal variations due to weather conditions, daylight duration, or other contextual factors may contribute to extra unpredictability in traffic levels. As a result, the potential seasonal influence should be addressed when evaluating the quantitative comparison of the two datasets.
Third, the analysis focused on a single signalized urban intersection. While representative of mixed-use central areas, generalization to other infrastructure typologies—such as coordinated arterial corridors, freeway segments, or multimodal hubs—should be undertaken cautiously.
Finally, the adopted approach was predominantly macroscopic. Microscopic trajectory analysis, detailed queue dynamics modeling, and behavioral adaptation assessment were beyond the scope of the present study.
Future research should:
- Assess the applicability of the probabilistic framework across diverse network typologies and operational contexts.
- Investigate post-restriction recovery phases and potential rebound effects in mobility demand.
- Integrate microscopic traffic simulation and dynamic queue modeling to capture fine-scale interaction mechanisms.
- Evaluate the long-term stability of stochastic arrival patterns under hybrid work regimes and evolving mobility behaviors.
Such extensions would further clarify the boundary conditions under which Poisson-based modeling remains valid and enhance its integration into adaptive traffic management and resilience-oriented urban mobility planning.
Author Contributions
Conceptualization, N.F. and C.I.; methodology, N.F. and C.I.; software, N.F.; validation, N.F. and M.D.; formal analysis, C.I.; resources, C.I.; data curation, C.I. and M.D.; writing—original draft preparation, C.I.; writing—review and editing, C.I.; visualization, N.F., C.I. and M.D.; supervision, N.F.; project administration, N.F. All authors have read and agreed to the published version of the manuscript.
Funding
The APC was funded by MDPI/Vehicle.
Data Availability Statement
The processed traffic datasets generated and analyzed during the current study are available from the corresponding author upon reasonable request for research purposes.
Acknowledgments
This paper and the research behind it would not have been possible without the support of the project Just Streets—Horizon 2020 and Data from Sky system, developed by RCE systems s.r.o. and of Monitoring and Road Safety Department within Cluj-Napoca City—Hall, Romania.
Conflicts of Interest
The authors declare no conflicts of interest.
Abbreviations
The following abbreviations are used in this manuscript:
| AI | Artificial Intelligence |
| ARX | Automatic Road Analyzer |
| CNN | Convolutional Neural Networks |
| COVID-19 | Coronavirus Disease 2019 |
| DFS | Data From Sky |
| Kpx/h | kilo-pixels/hour |
| NCSS | Number Cruncher Statistical System |
| px | pixels |
| SDR | Speed Detection Radar |
| SUMP | Sustainable Urban Mobility Plans |
| χ2 | chi-square test |
| v15 | 15th percentile speed |
| v85 | 85th percentile speed |
References
- Urban Mobility Strategies During COVID-19. Available online: https://www.eiturbanmobility.eu/wp-content/uploads/2021/03/Urban-mobility-strategies-during-COVID-19_long-1.pdf (accessed on 11 February 2026).
- Pandey, S.; Yadav, B.; Pandey, A.; Tripathi, T.; Khawary, M.; Kant, S.; Tripathi, D. Lessons from SARS-CoV-2 Pandemic: Evolution, Disease Dynamics and Future. Biology 2020, 9, 141. [Google Scholar] [CrossRef] [Scilit] [PubMed]
- Nazir, R.; Ali, J.; Rasul, I.; Widemann, E.; Shafiq, S. Eco-Environmental Aspects of COVID-19 Pandemic and Potential Control Strategies. Int. J. Environ. Res. Public Health 2021, 18, 3488. [Google Scholar] [CrossRef] [Scilit] [PubMed]
- Lipfert, F.W.; Wyzga, R.E. COVID-19 and the Environment, Review and Analysis. Environments 2021, 8, 42. [Google Scholar] [CrossRef] [Scilit]
- Macioszek, E.; Kurek, A. Extracting Road Traffic Volume in the City before and during COVID-19 through Video Remote Sensing. Remote Sens. 2021, 13, 2329. [Google Scholar] [CrossRef] [Scilit]
- Taqi, H.M.M.; Ahmed, H.N.; Paul, S.; Garshasbi, M.; Ali, S.M.; Kabir, G.; Paul, S.K. Strategies to Manage the Impacts of the COVID-19 Pandemic in the Supply Chain: Implications for Improving Economic and Social Sustainability. Sustainability 2020, 12, 9483. [Google Scholar] [CrossRef] [Scilit]
- Khalifa, S.A.M.; Swilam, M.M.; El-Wahed, A.A.A.; Du, M.; El-Seedi, H.H.R.; Kai, G.; Masry, S.H.D.; Abdel-Daim, M.M.; Zou, X.; Halabi, M.F.; et al. Beyond the Pandemic: COVID-19 Pandemic Changed the Face of Life. Int. J. Environ. Res. Public Health 2021, 18, 5645. [Google Scholar] [CrossRef] [Scilit]
- Muhammad, S.; Long, X.; Salman, M. COVID-19 pandemic and environmental pollution: A blessing in disguise? Sci. Total Environ. 2020, 728, 138820. [Google Scholar] [CrossRef] [Scilit]
- Planul de Mobilitate Urbană Durabilă Cluj-Napoca 2021–2030. (In Romanian) Available online: https://www.clujmet.ro/wp-content/uploads/2022/01/PMUD_Cluj-Napoca_Draft-final.pdf (accessed on 11 February 2026).
- Sustainable Urban Mobility Planning and Monitoring. Available online: https://transport.ec.europa.eu/transport-themes/urban-transport/sustainable-urban-mobility-planning-and-monitoring_en (accessed on 11 February 2026).
- FY 2022-26 U.S. DOT Strategic Plan and Progress Report. Available online: https://www.transportation.gov/dot-strategic-plan (accessed on 29 August 2024).
- Decretul Nr. 195 Din 16 Martie 2020. (In Romanian) Available online: https://legislatie.just.ro/Public/DetaliiDocumentAfis/223831 (accessed on 18 August 2024).
- Global Carbon Emissions Rebound Close to Pre-COVID Levels. Available online: https://globalcarbonbudget.org/global-carbon-emissions-rebound-close-to-pre-covid-levels/ (accessed on 11 February 2026).
- Nath, D.; Sasikumar, K.; Nath, R.; Chen, W. Factors Affecting COVID-19 Outbreaks across the Globe: Role of Extreme Climate Change. Sustainability 2021, 13, 3029. [Google Scholar] [CrossRef] [Scilit]
- Wołowiec, T.; Myroshnychenko, I.; Vakulenko, I.; Bogacki, S.; Wiśniewska, A.M.; Kolosok, S.; Yunger, V. International Impact of COVID-19 on Energy Economics and Environmental Pollution: A Scoping Review. Energies 2022, 15, 8407. [Google Scholar] [CrossRef] [Scilit]
- Bulmez, A.M.; Brezeanu, A.-I.; Dragomir, G.; Talabă, O.-M.; Năstase, G. An Analysis of Romania’s Energy Strategy: Perspectives and Developments since 2020. Climate 2024, 12, 101. [Google Scholar] [CrossRef] [Scilit]
- El-Geneidy, A.; De Vos, J. Transport and COVID-19: Where are we now? Transp. Rev. 2024, 44, 245–247. [Google Scholar] [CrossRef] [Scilit]
- Institutul Național de Statistică. (In Romanian) Available online: https://insse.ro/cms/files/POCA/Impact-COVID-SNDDR2030.pdf (accessed on 11 February 2026).
- Bucsky, P. Modal share changes due to COVID-19: The case of Budapest. Transp. Res. Interdiscip. Perspect. 2020, 8, 100141. [Google Scholar] [CrossRef] [Scilit]
- Politis, I.; Georgiadis, G.; Papadopoulos, E.; Fyrogenis, I.; Nikolaidou, A.; Kopsacheilis, A.; Sdoukopoulos, A.; Verani, E. COVID-19 lockdown measures and travel behavior: The case of Thessaloniki, Greece. Transp. Res. Interdiscip. Perspect. 2021, 10, 100345. [Google Scholar] [CrossRef] [Scilit]
- Lockdown Movement Permit. (In Romanian). Available online: https://forma.gov.gr/en/ (accessed on 11 February 2026).
- Henke, I.; Pagliara, F.; Cartenì, A.; Coppola, P. The Impact of COVID-19 Pandemic on Public Transport: A Mobility Survey in Naples (South of Italy). Open Transp. J. 2023, 17. [Google Scholar] [CrossRef] [Scilit]
- Harantová, V.; Hájnik, A.; Kalašová, A.; Figlus, T. The Effect of the COVID-19 Pandemic on Traffic Flow Characteristics, Emissions Production and Fuel Consumption at a Selected Intersection in Slovakia. Energies 2022, 15, 2020. [Google Scholar] [CrossRef] [Scilit]
- Jenelius, E.; Cebecauer, M. Impacts of COVID-19 on public transport ridership in Sweden: Analysis of ticket validations, sales and passenger counts. Transp. Res. Interdiscip. Perspect. 2020, 8, 100242. [Google Scholar] [CrossRef] [Scilit] [PubMed]
- Ren, M.; Park, S.; Xu, Y.; Huang, X.; Zou, L.; Wong, M.S.; Koh, S.-Y. Impact of the COVID-19 pandemic on travel behavior: A case study of domestic inbound travelers in Jeju, Korea. Tour. Manag. 2022, 92, 104533. [Google Scholar] [CrossRef] [Scilit]
- Hong, Y.; Lu, K. The effect of quarantine policy on pollution emission and the usage of private transportation in urban areas. Nat. Sci. Rep. 2024, 14, 15752. [Google Scholar] [CrossRef] [Scilit]
- Li, D.; Lasenby, J. Investigating impacts of COVID-19 on urban mobility and emissions. Cities 2023, 135, 104246. [Google Scholar] [CrossRef] [Scilit]
- Owais, M.; Abulwafa, O.; Abbas, Y.A. When to Decide to Convert a Roundabout to a Signalized Intersection: Simulation Approach for Case Studies in Jeddah and Al-Madinah. Arab. J. Sci. Eng. 2020, 45, 7897–7914. [Google Scholar] [CrossRef] [Scilit]
- Yadav, S.K.; Akhter, Y. Statistical Modeling for the Prediction of Infectious Disease Dissemination with Special Reference to COVID-19 Spread. Front. Public Health 2021, 9, 645405. [Google Scholar] [CrossRef] [Scilit] [PubMed]
- Peköz, E.A.; Joglekar, N. Poisson Traffic Flow in a General Feedback Queue. J. Appl. Probab. 2002, 39, 630–636. [Google Scholar] [CrossRef] [Scilit]
- Abul-Magd, A.Y. Modelling highway-traffic headway distributions using Superstatistics. Phys. Rev. E 2007, 76, 057101. [Google Scholar] [CrossRef] [Scilit] [PubMed]
- Wigner’s Surmise. Available online: https://robertsweeneyblanco.github.io/Computational_Random_Matrix_Theory/Eigenvalues/Wigner_Surmise.html (accessed on 11 February 2026).
- Maya, O.; Kim, H.; Toda, H. Online Traffic Flow Prediction Using Convolved Bilinear Poisson Regression. In 18th IEEE International Conference on Mobile Data Management (MDM) 2017; IEEE: New York, NY, USA, 2017; pp. 134–143. [Google Scholar] [CrossRef] [Scilit]
- Yang, S.; Yang, X. The Application of the Queuing Theory in the Traffic Flow of Intersection. World Acad. Sci. Eng. Technol. Int. J. Math. Comput. Phys. Electr. Comput. Eng. 2014, 8, 986–989. [Google Scholar] [CrossRef]
- Thomas, T.; Weijermars, W.; Berkum, E. Variations in urban traffic volumes. Eur. J. Transp. Infrastruct. Res. 2008, 8, 251–263. [Google Scholar] [CrossRef] [Scilit]
- Viti, F.; van Zuylen, H.J. Queues and delays at signals: A general approach. In Proceedings INSTR 2007; van Zuylen, H.J., Ed.; 2007; pp. 1–9. [Google Scholar]
- Vandaele, N.; van Woensel, T.; Verbruggen, A. A queueing based traffic flow model. Transp. Res. Part D Transp. Environ. 2000, 5, 121–135. [Google Scholar] [CrossRef] [Scilit]
- Kong, X.; Xu, Z.; Shen, G.; Wang, J.; Yang, Q.; Zhang, B. Urban traffic congestion estimation and prediction based on floating car trajectory data. Future Gener. Comput. Syst. 2016, 61, 97–107. [Google Scholar] [CrossRef] [Scilit]
- Almutairi, A.; Yi, P.; Owais, M. New Approach for Estimating Intersection Control Delay From Passive Traffic Sensors at Network Level. IEEE Access 2024, 12, 2882–2900. [Google Scholar] [CrossRef] [Scilit]
- SDR Traffic Classifier. Available online: https://traffictechnology.co.uk/blog/portfolio/sdr-traffic-classifier/ (accessed on 11 February 2026).
- SDR Radar Traffic Classifier. Available online: https://www.datacollect.com/en/mobility-data-analysis/measuring-systems/sdr-radar-traffic-classifier/ (accessed on 11 February 2026).
- Preda, I.; Covaciu, D.; Florea, D.; Ciolan, G. Study of In-Traffic Vehicle Behaviour, Based on GPS and Radar Devices. In Proceedings of the ESFA 2009 International Conference, Bucharest, Romania, January 2009; Available online: https://www.researchgate.net/publication/263424362_Study_of_In-Traffic_Vehicle_Behaviour_Based_on_GPS_and_Radar_Devices (accessed on 11 February 2026).
- Data Collect Traffic Systems. Available online: https://datafromsky.com/trafficcamera/ (accessed on 11 February 2026).
- Chen, V.C.; Li, F.; Ho, S.-S.; Wechsler, H. Micro-Doppler effect in radar: Phenomenon, model, and simulation study. IEEE Trans. Aerosp. Electron. Syst. 2006, 42, 2–21. [Google Scholar] [CrossRef] [Scilit]
- Chen, V. The Micro-Doppler Effect in Radar, 2nd ed.; Artech House: Norwood, MA, USA, 2019. [Google Scholar]
- MyTrafficData Secure: Configure, Analyse and More. Available online: https://www.datacollect.com/en/mobility-data-analysis/mytrafficdata/ (accessed on 11 February 2026).
- Data from Sky Light. Available online: https://ai.datafromsky.com/light/ (accessed on 11 February 2026).
- Data from Sky Aerial. Available online: https://ai.datafromsky.com/aerial (accessed on 11 February 2026).
- Data from Sky Viewer. Available online: https://datafromsky.com/news/datafromsky-viewer-new-version-new-features/ (accessed on 11 February 2026).
- Conteo de Flujo y Programación de Semáforos, Mediante el Uso de Reconocimiento de Imágenes, Utilizando el Software DataFromSky. Available online: https://repositorio.uchile.cl/handle/2250/184342 (accessed on 11 February 2026).
- Dell’Acqua, G.; Wegman, F. (Eds.) Transport Infrastructure and Systems: Proceedings of the AIIT International Congress on Transport Infrastructure and Systems, Rome, Italy, 10–12 April 2017; CRC Press: Boca Raton, FL, USA, 2017. [Google Scholar]
- Cluj-Napoca, Romania Population 2024. Available online: https://worldpopulationreview.com/cities/romania/cluj-napoca (accessed on 11 February 2026).
- Strategia Integrată de Dezvoltare Urbană a Zonei Metropolitane Cluj. (In Romanian) Available online: https://documents1.worldbank.org/curated/en/099850010282239359/pdf/P172384038eb760700add008aa9b21cd8bf.pdf (accessed on 11 February 2026).
- ARX Classification Vehicles Schemes. Available online: https://mtehelp.tech-metrocount.com/Article.aspx?id=DB9FE70AC7 (accessed on 11 February 2026).
- Azimi, M.; Wali, M.M.; Qi, Y. Studying the Impact of the COVID-19 Pandemic on Bikeshares as a Mode of Shared Micromobility in Major Cities: A Case Study of Houston. Future Transp. 2024, 4, 270–282. [Google Scholar] [CrossRef] [Scilit]
- NCSS Statistical Software. Available online: https://www.ncss.com/software/ncss/ (accessed on 11 February 2026).
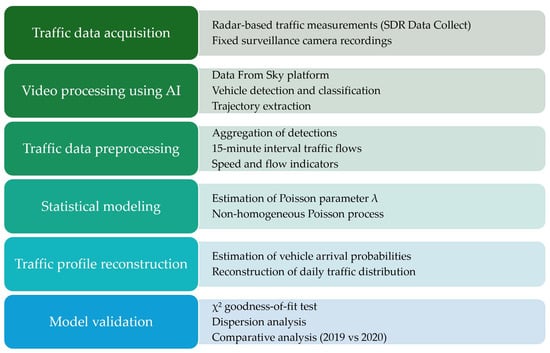
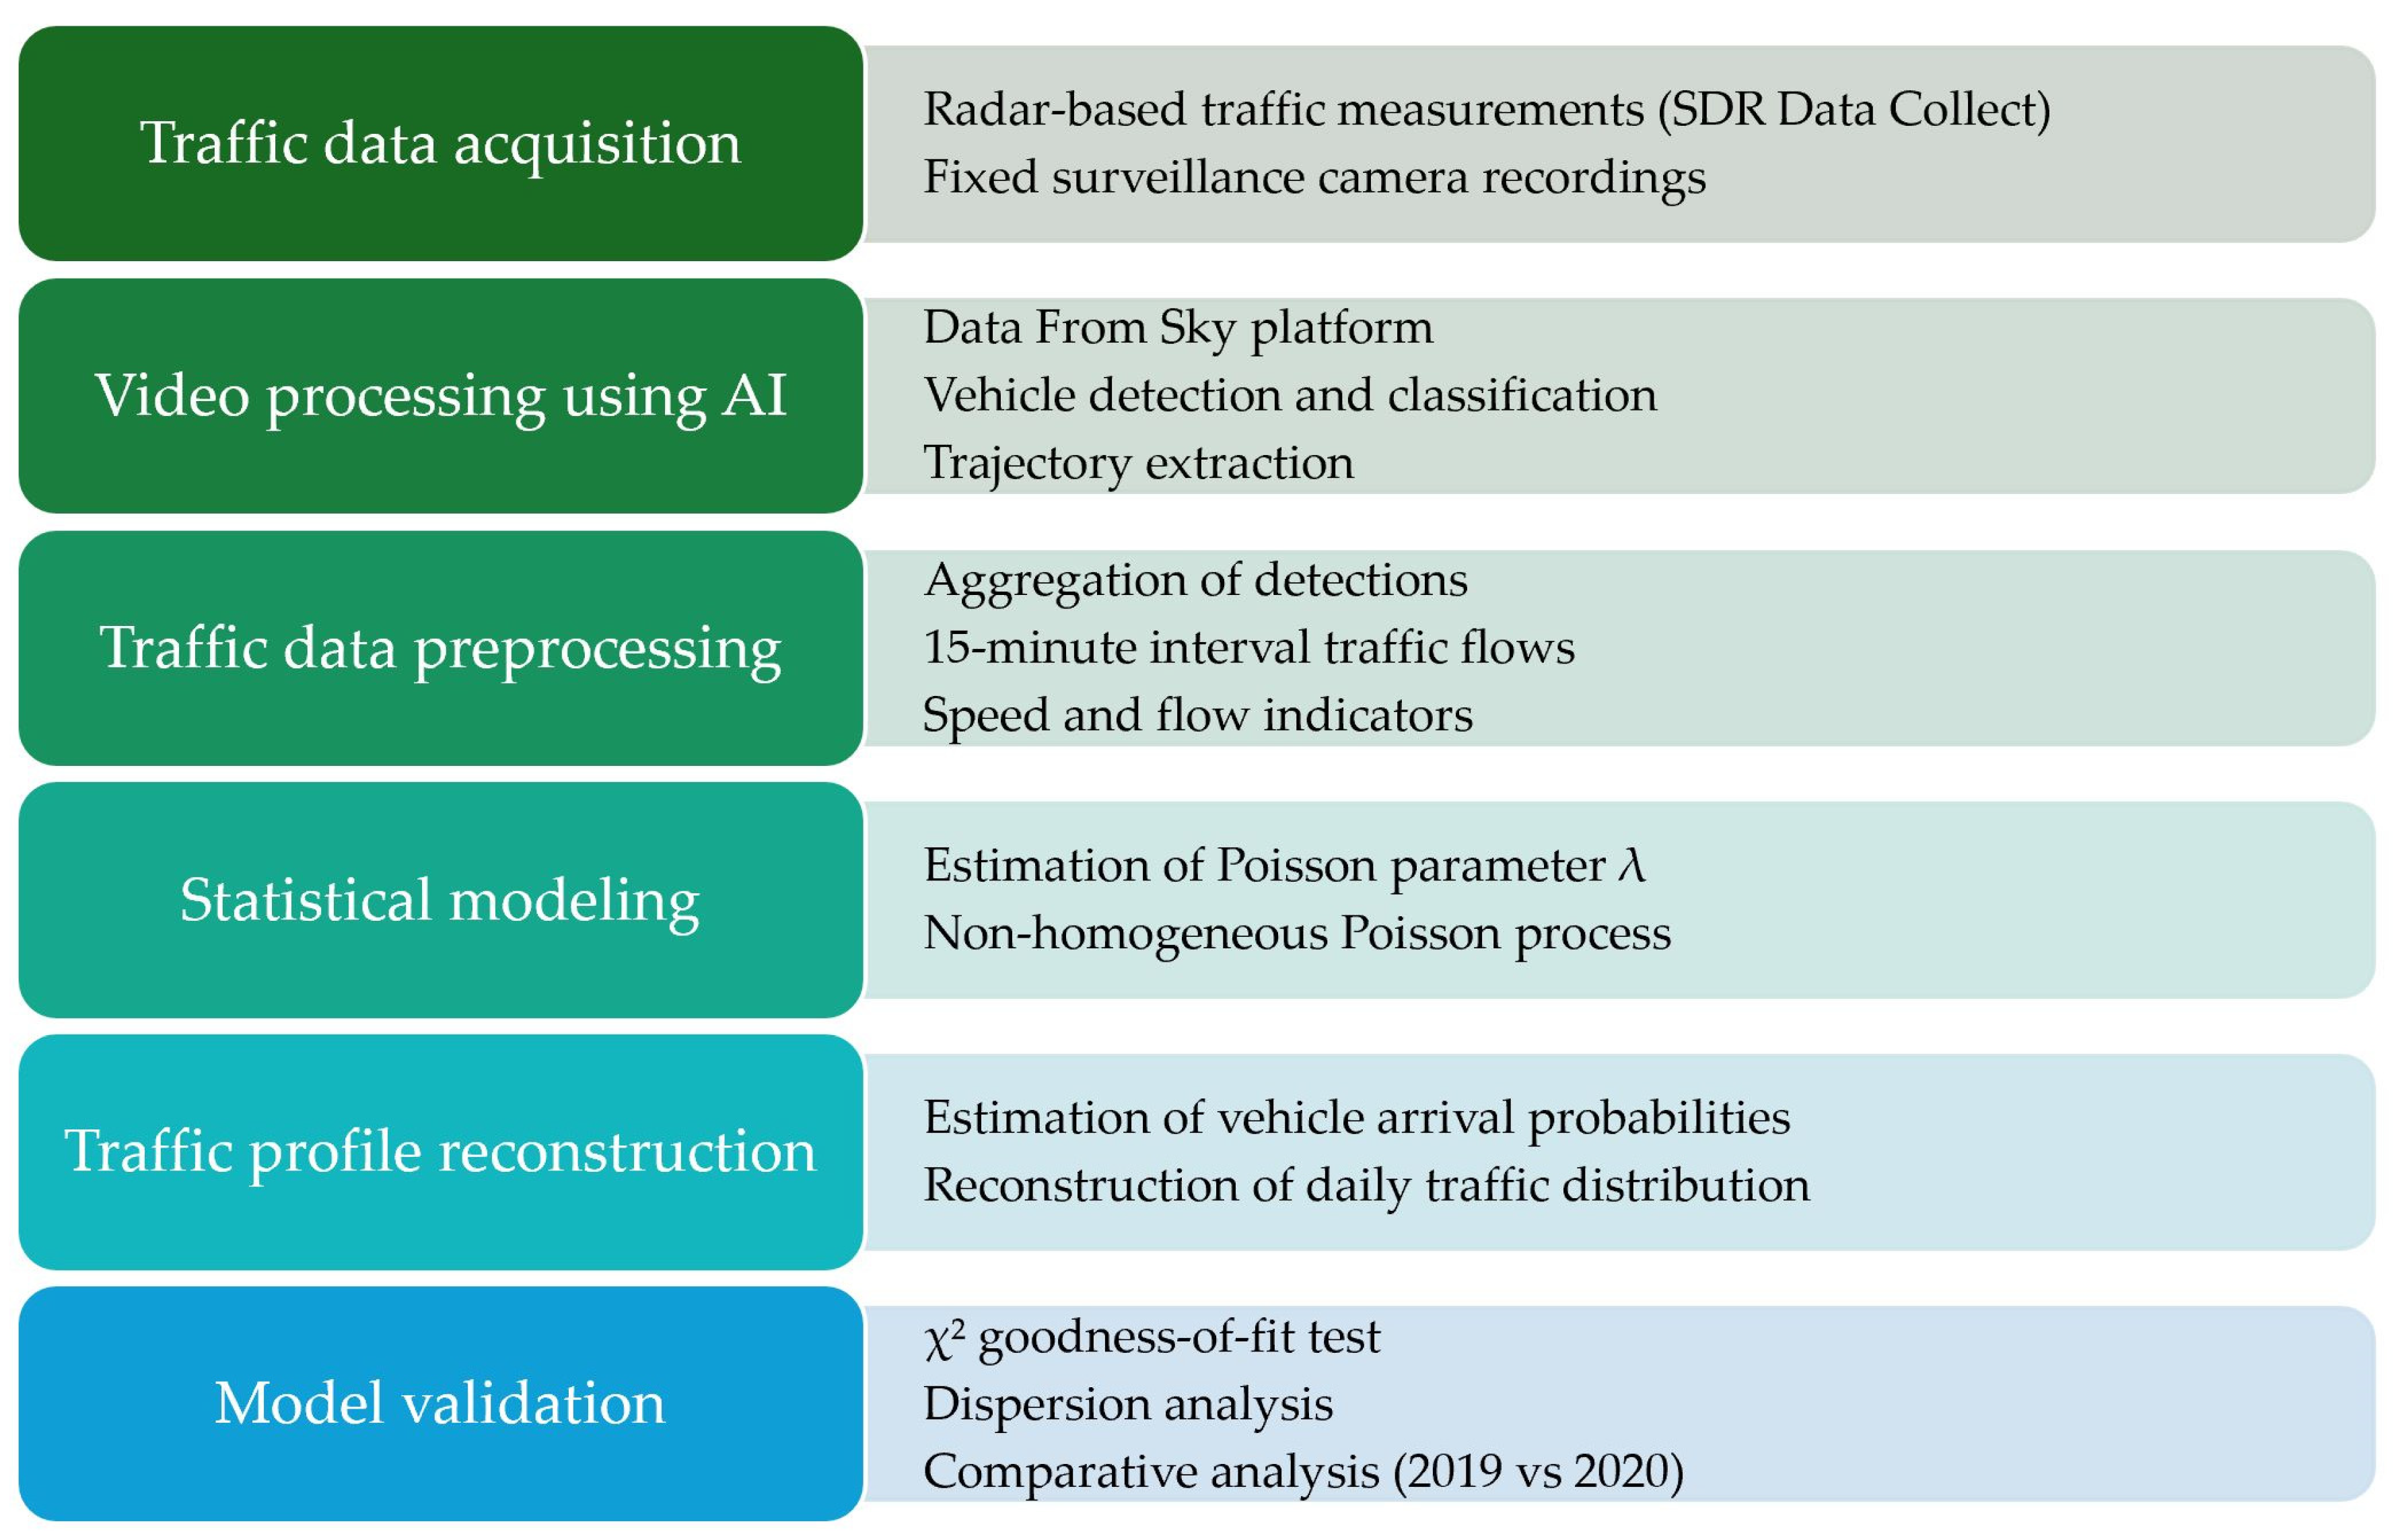
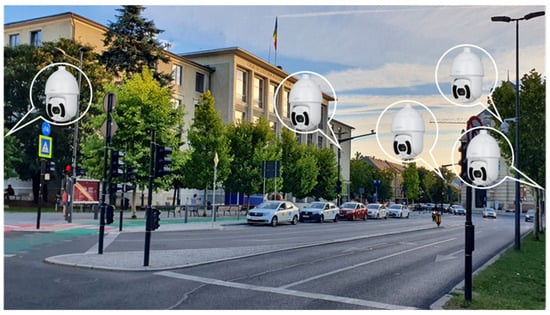
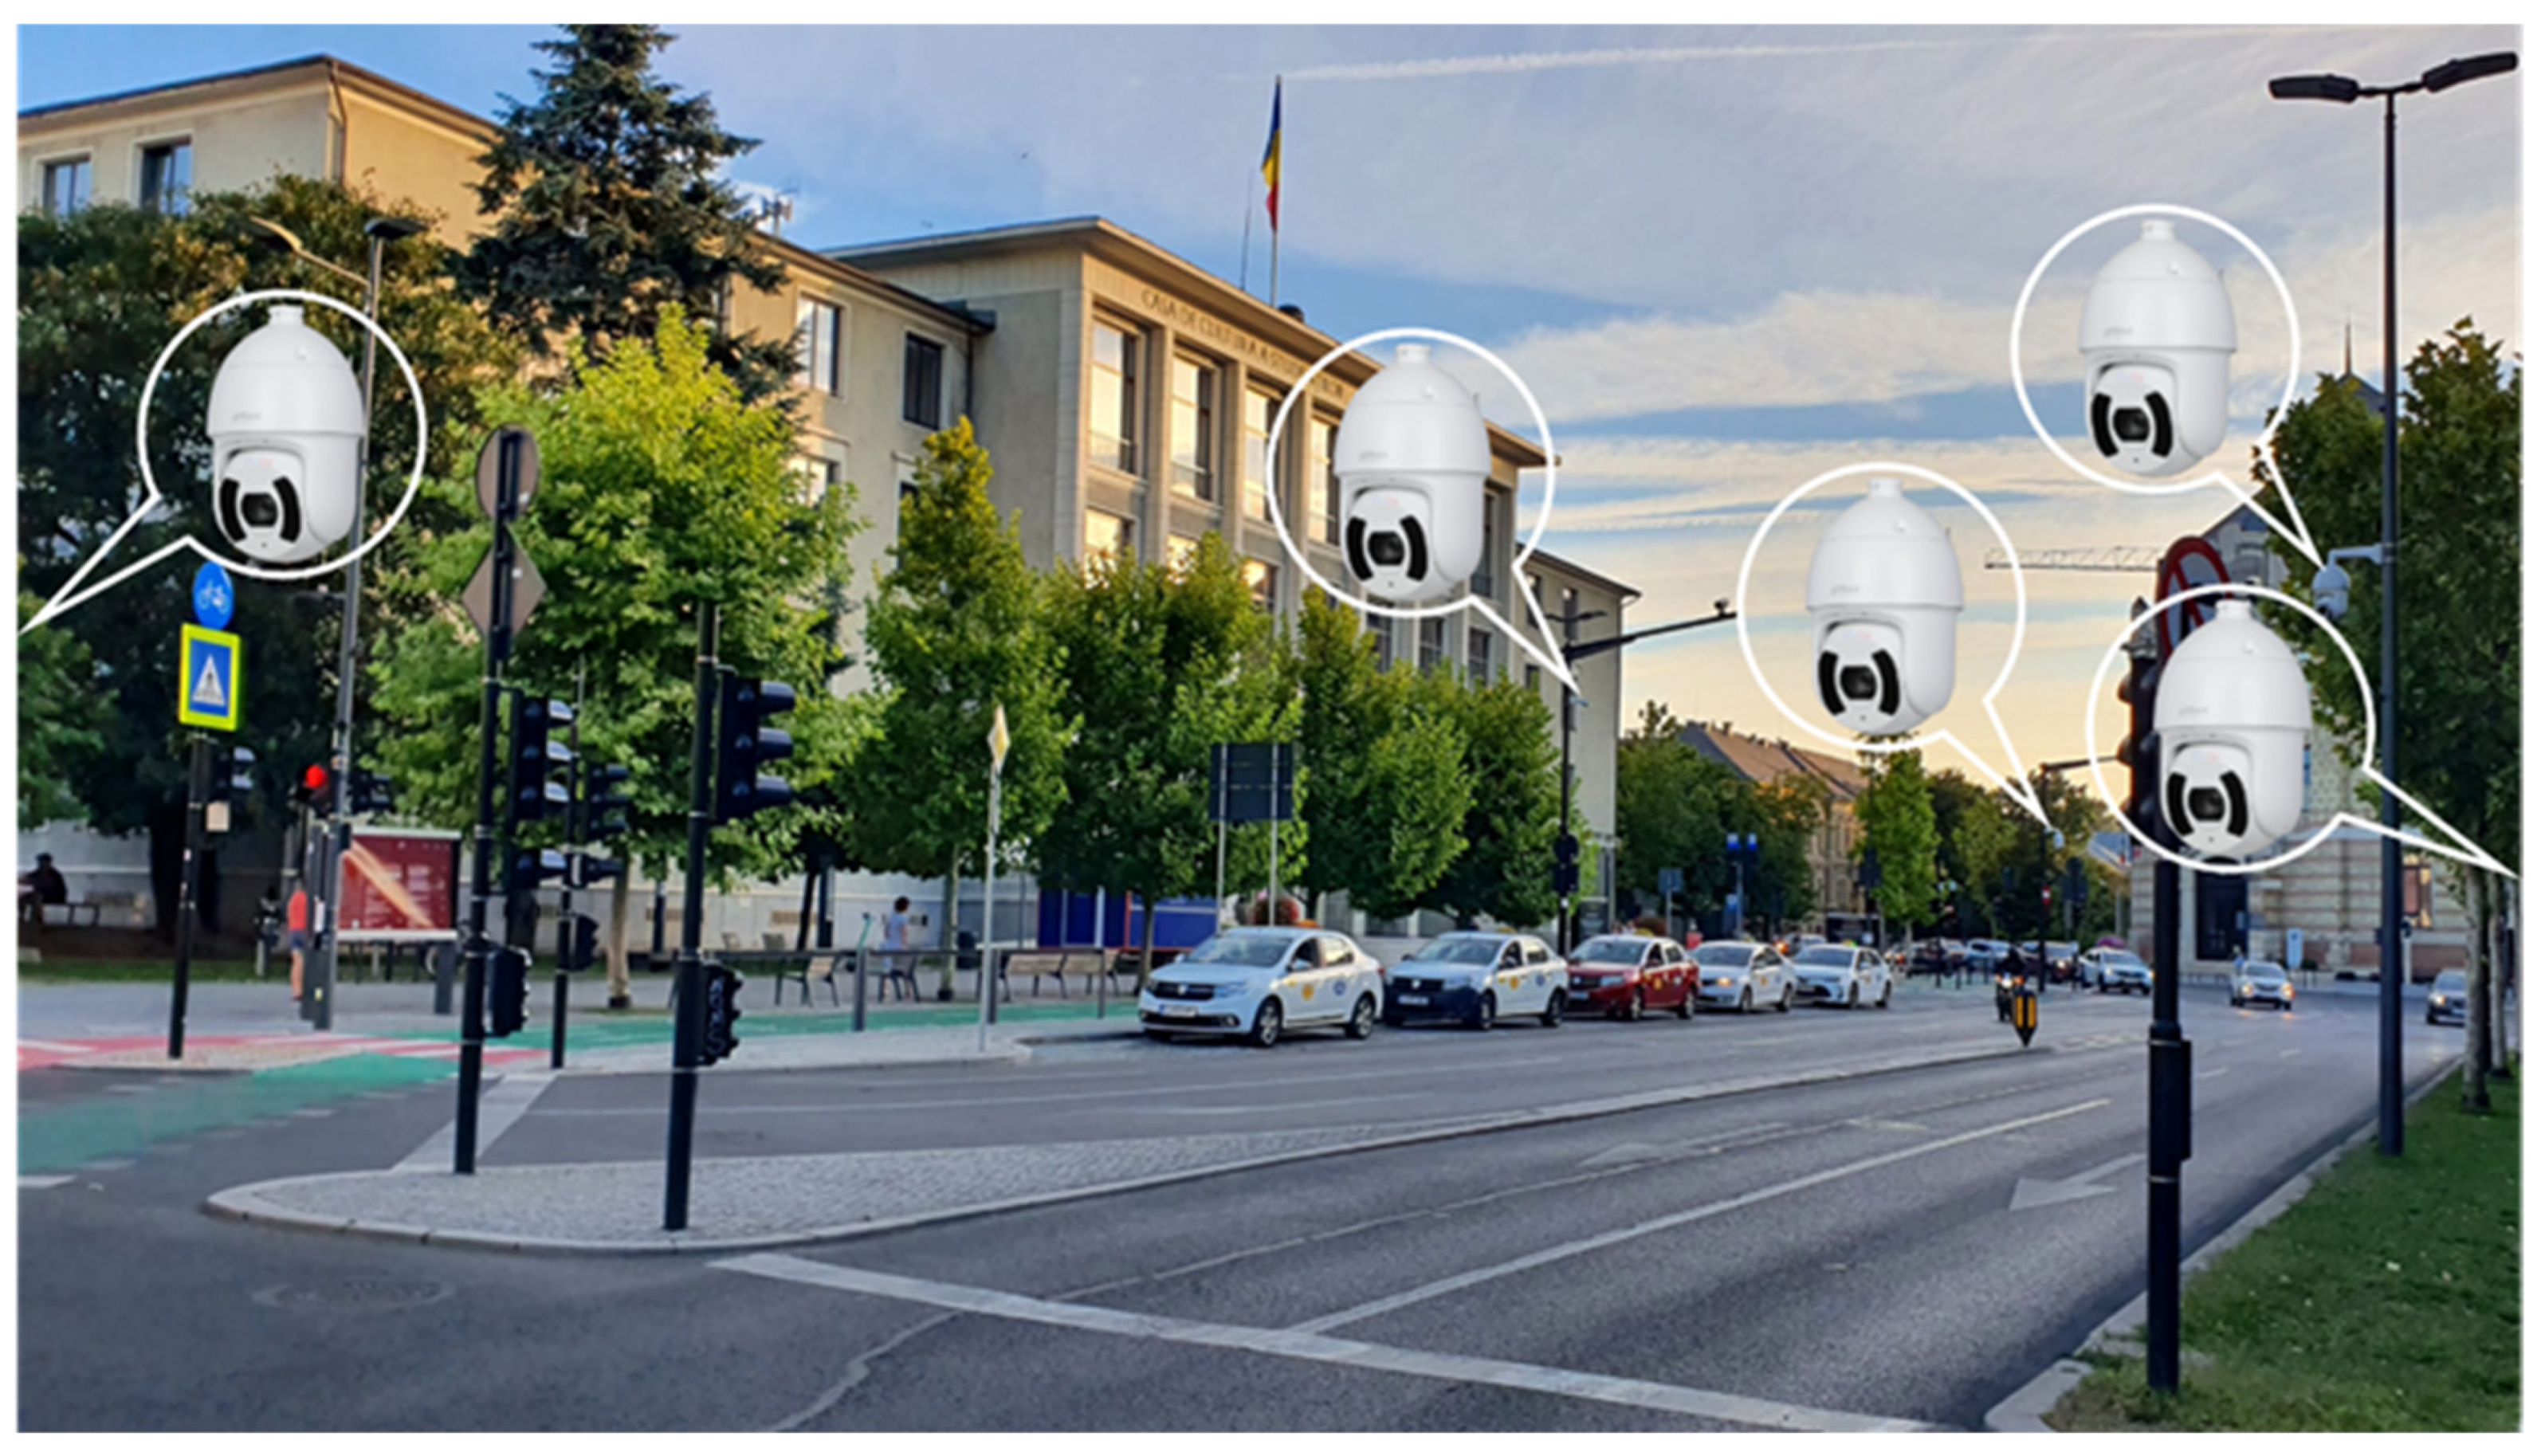
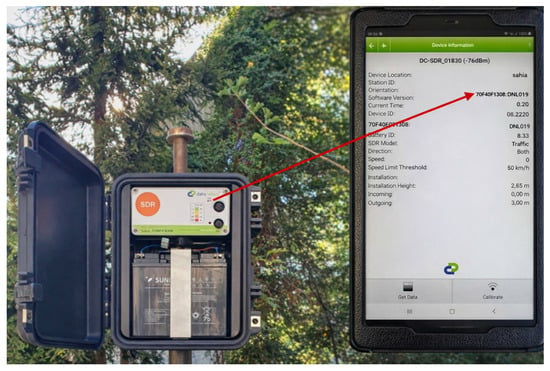
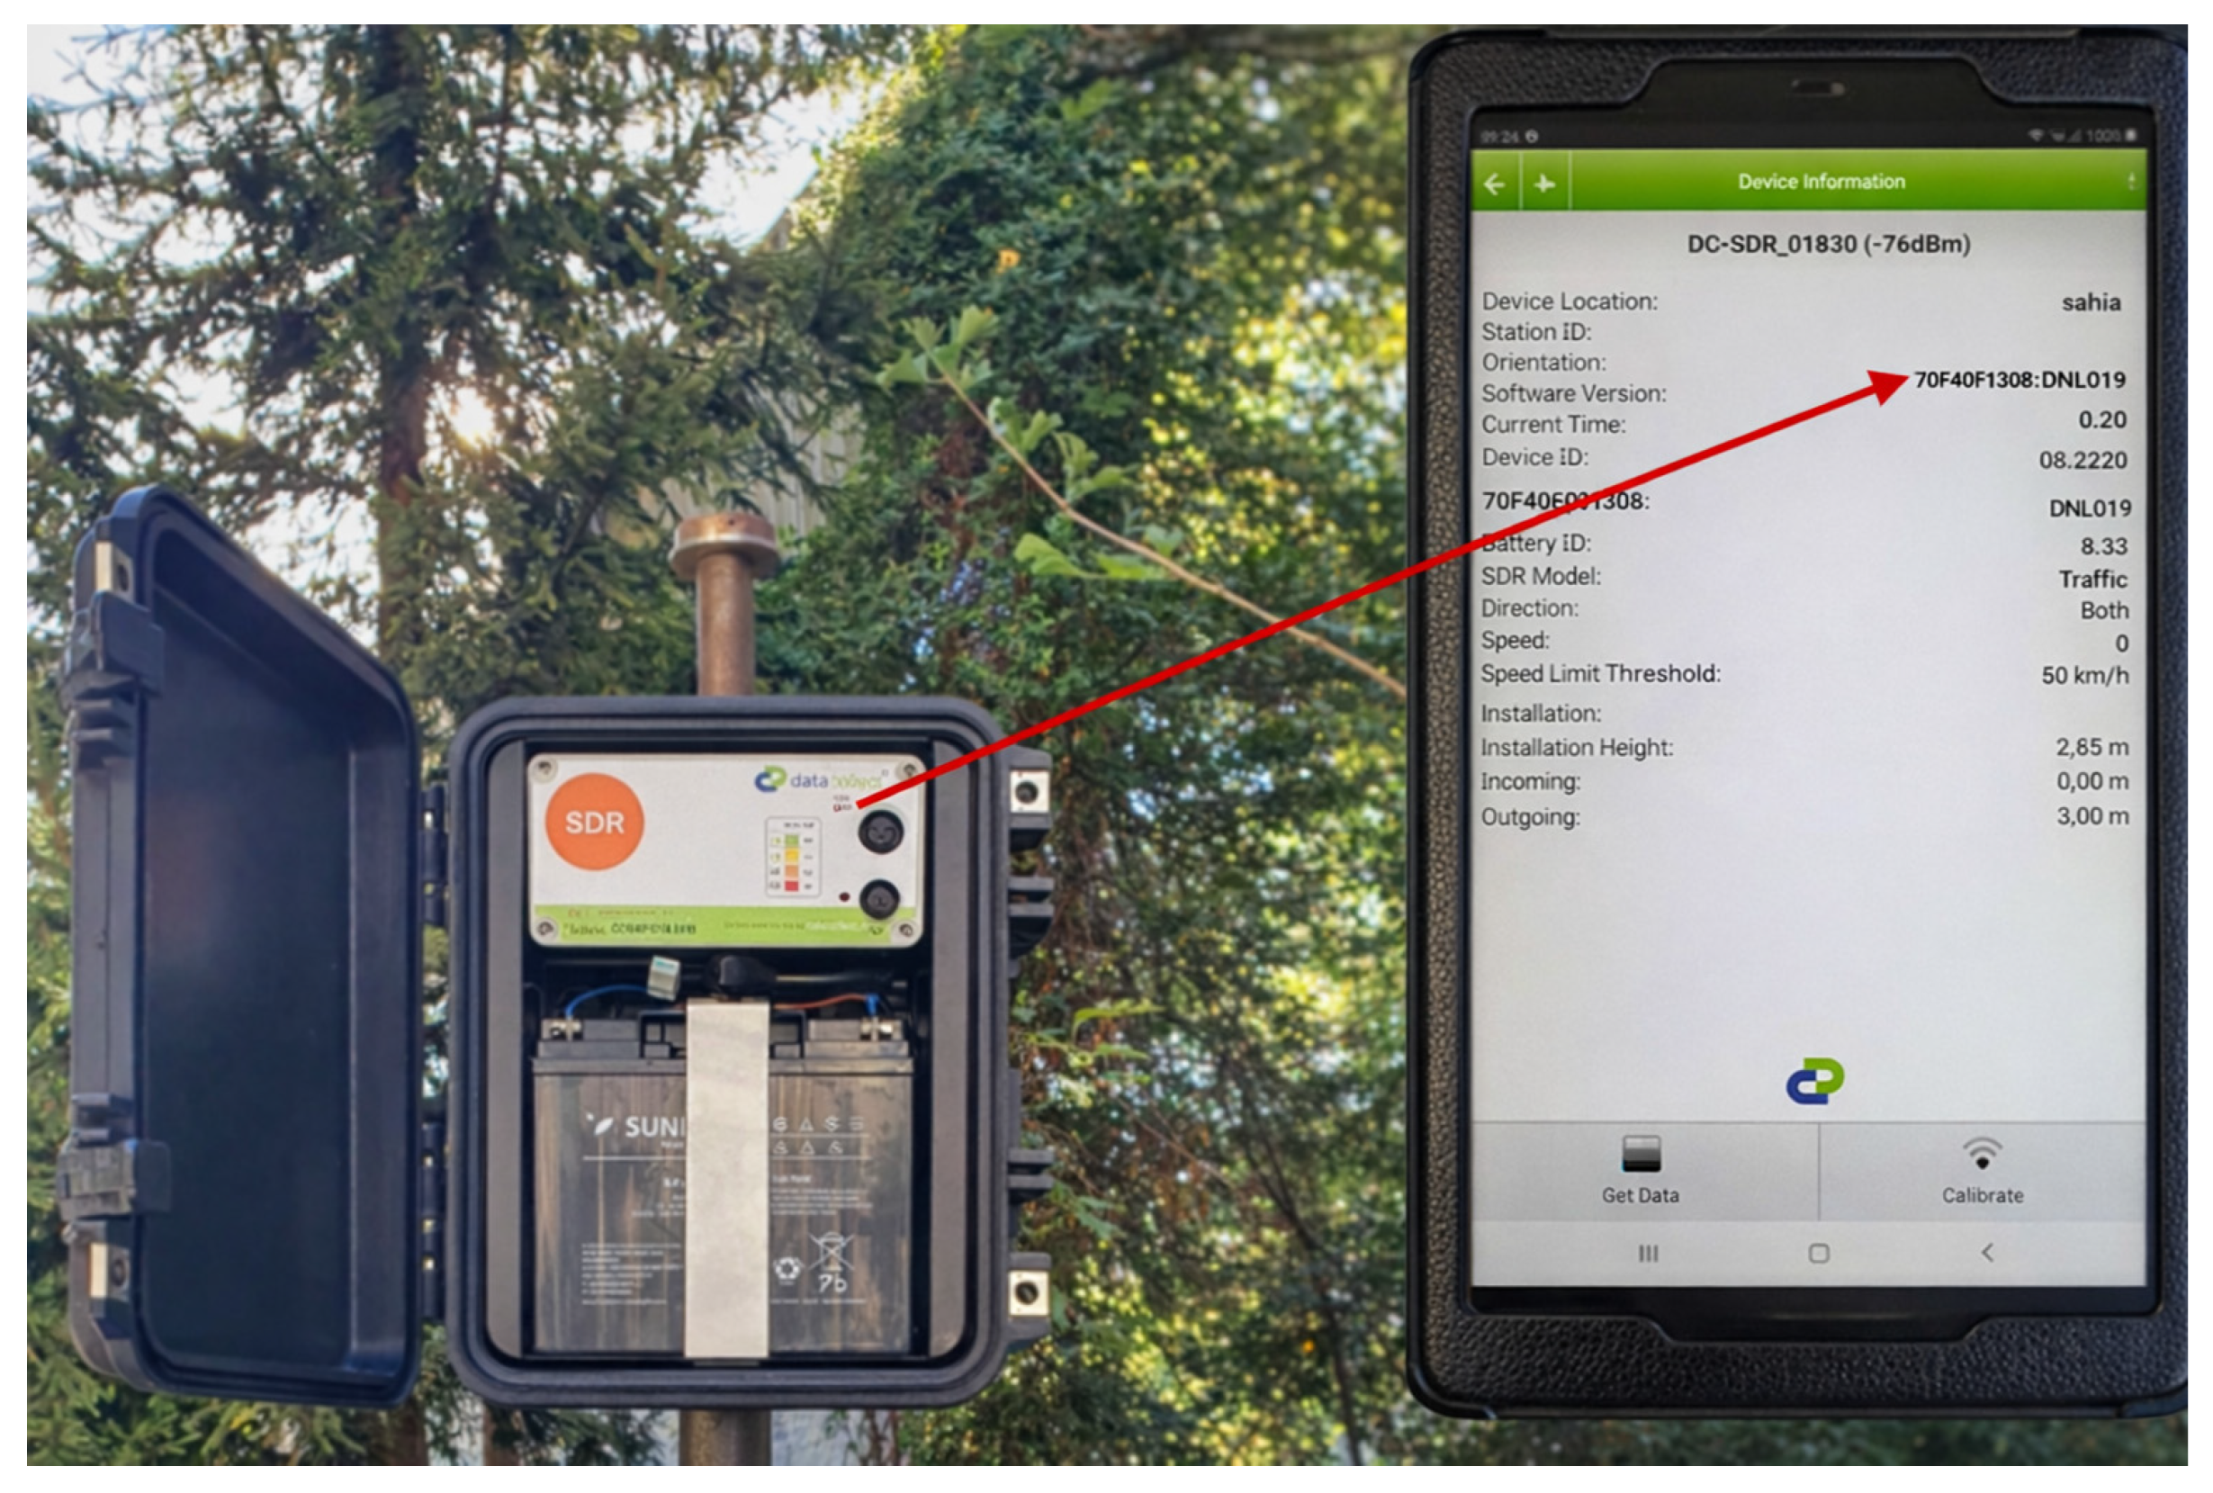
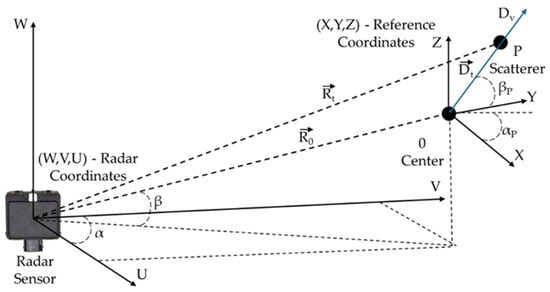
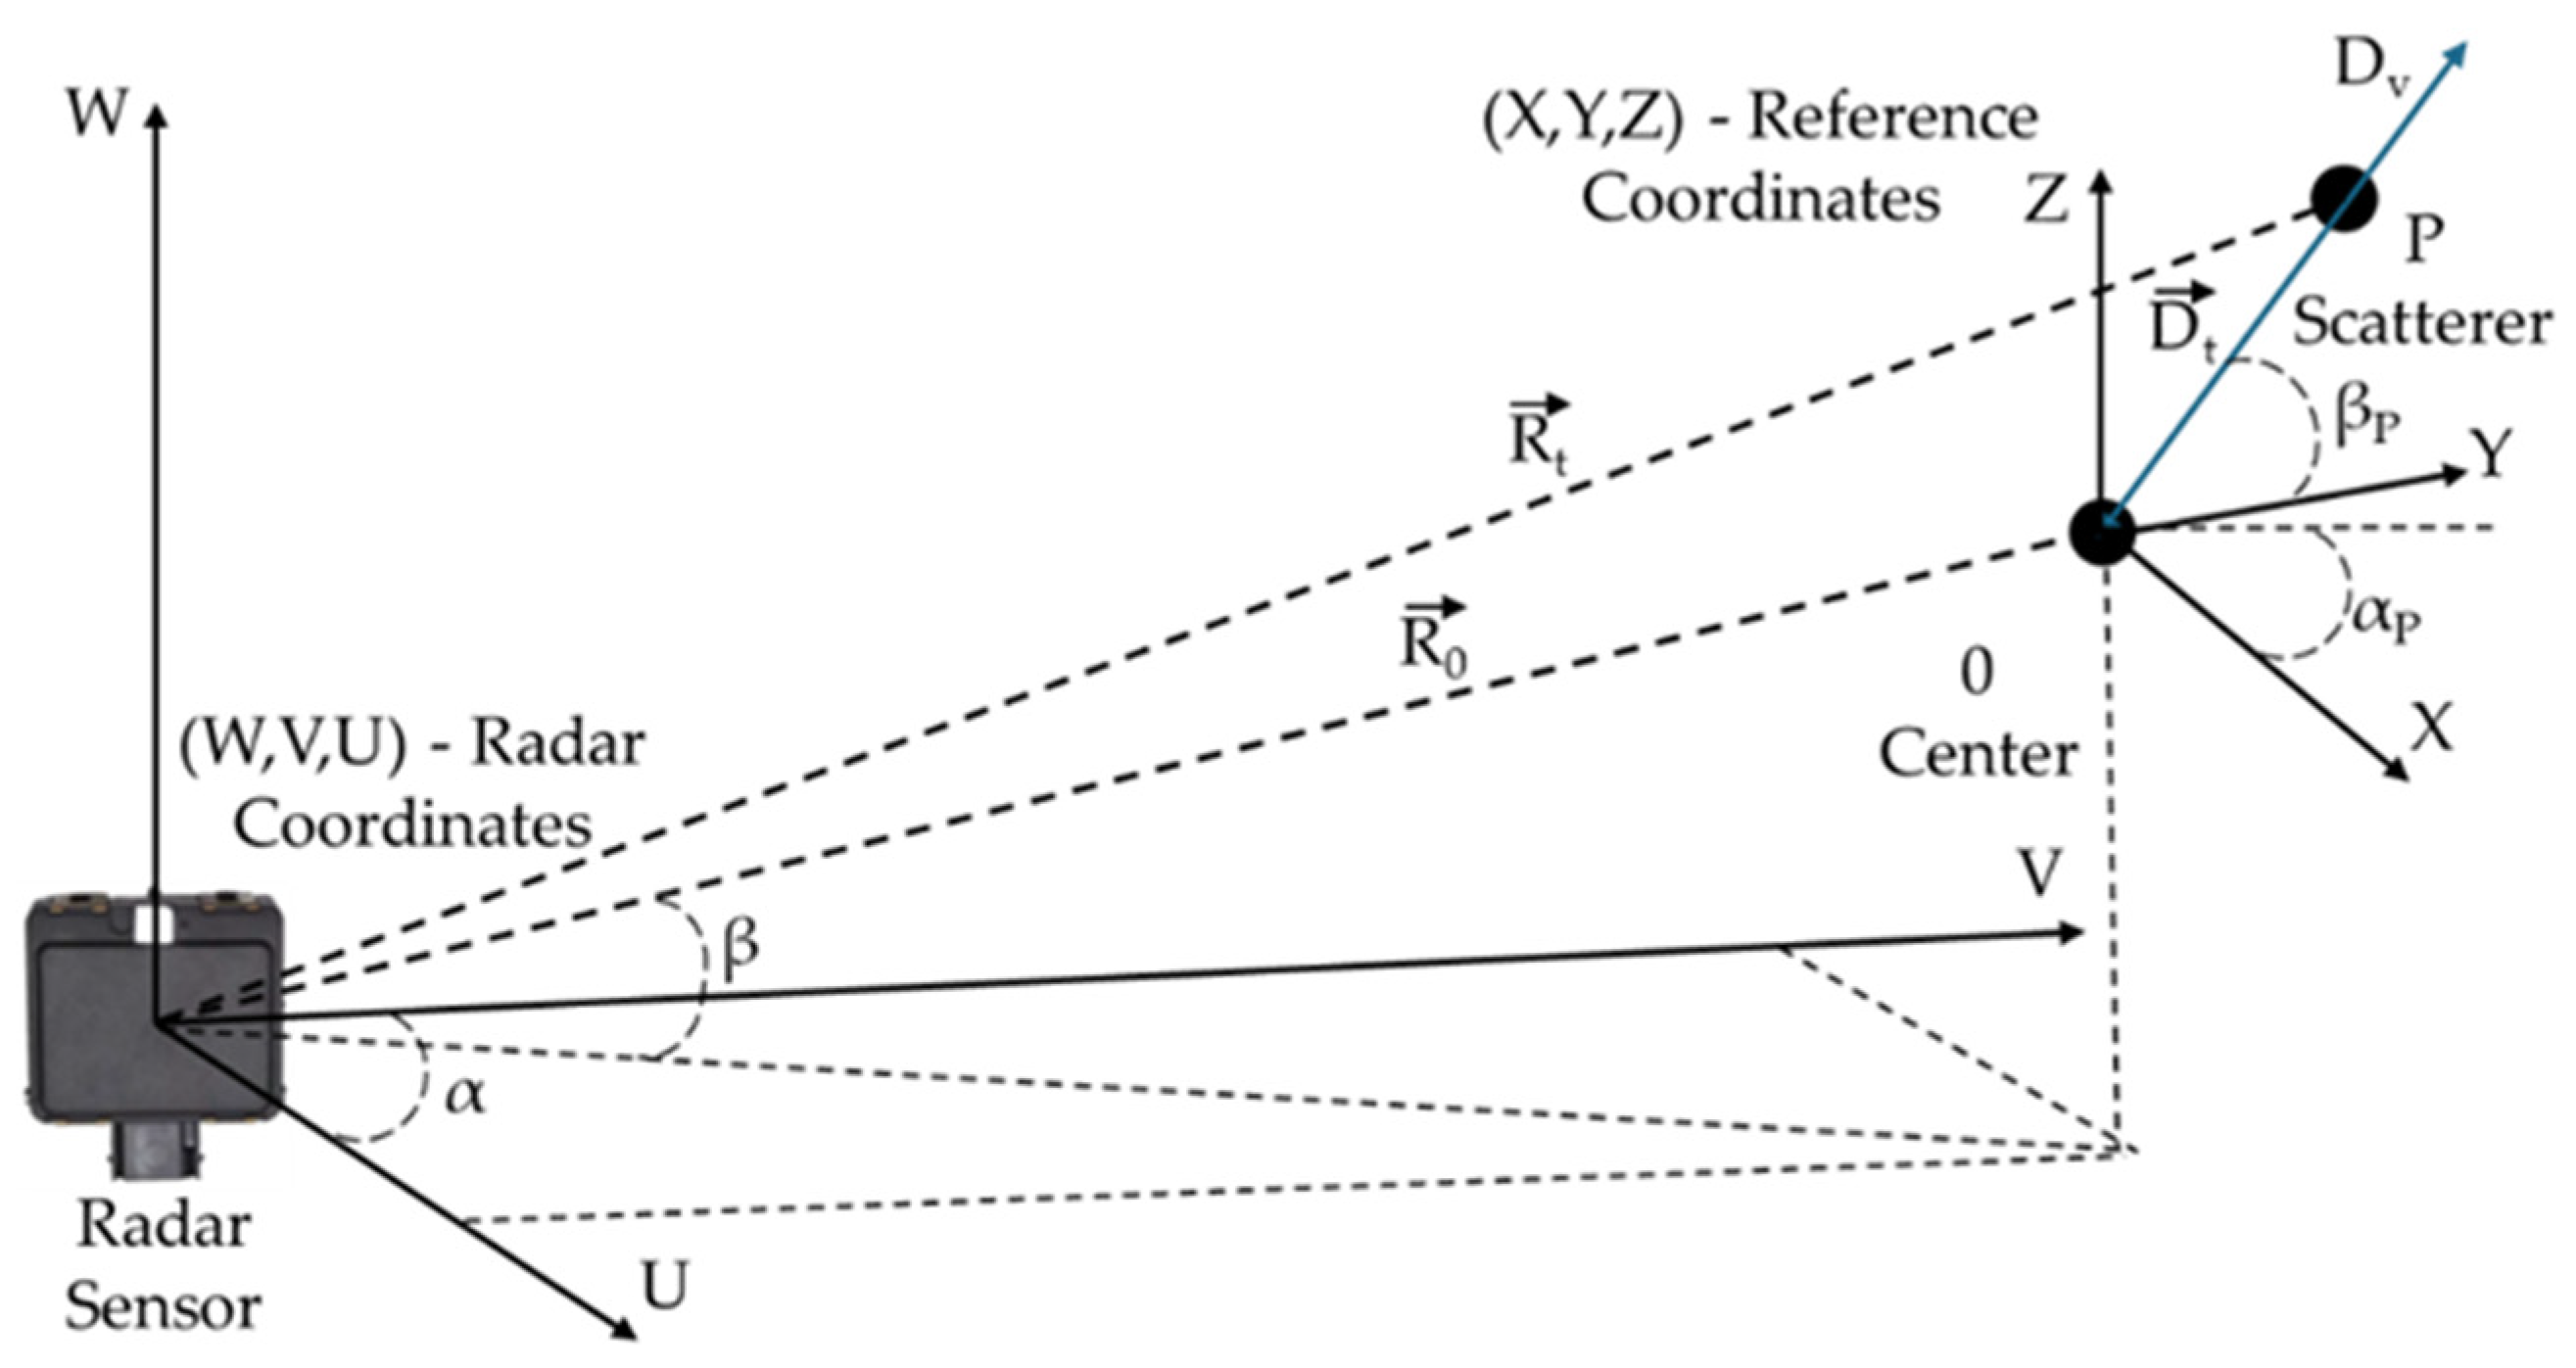
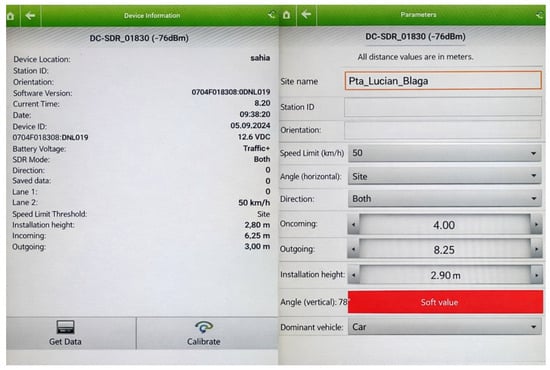
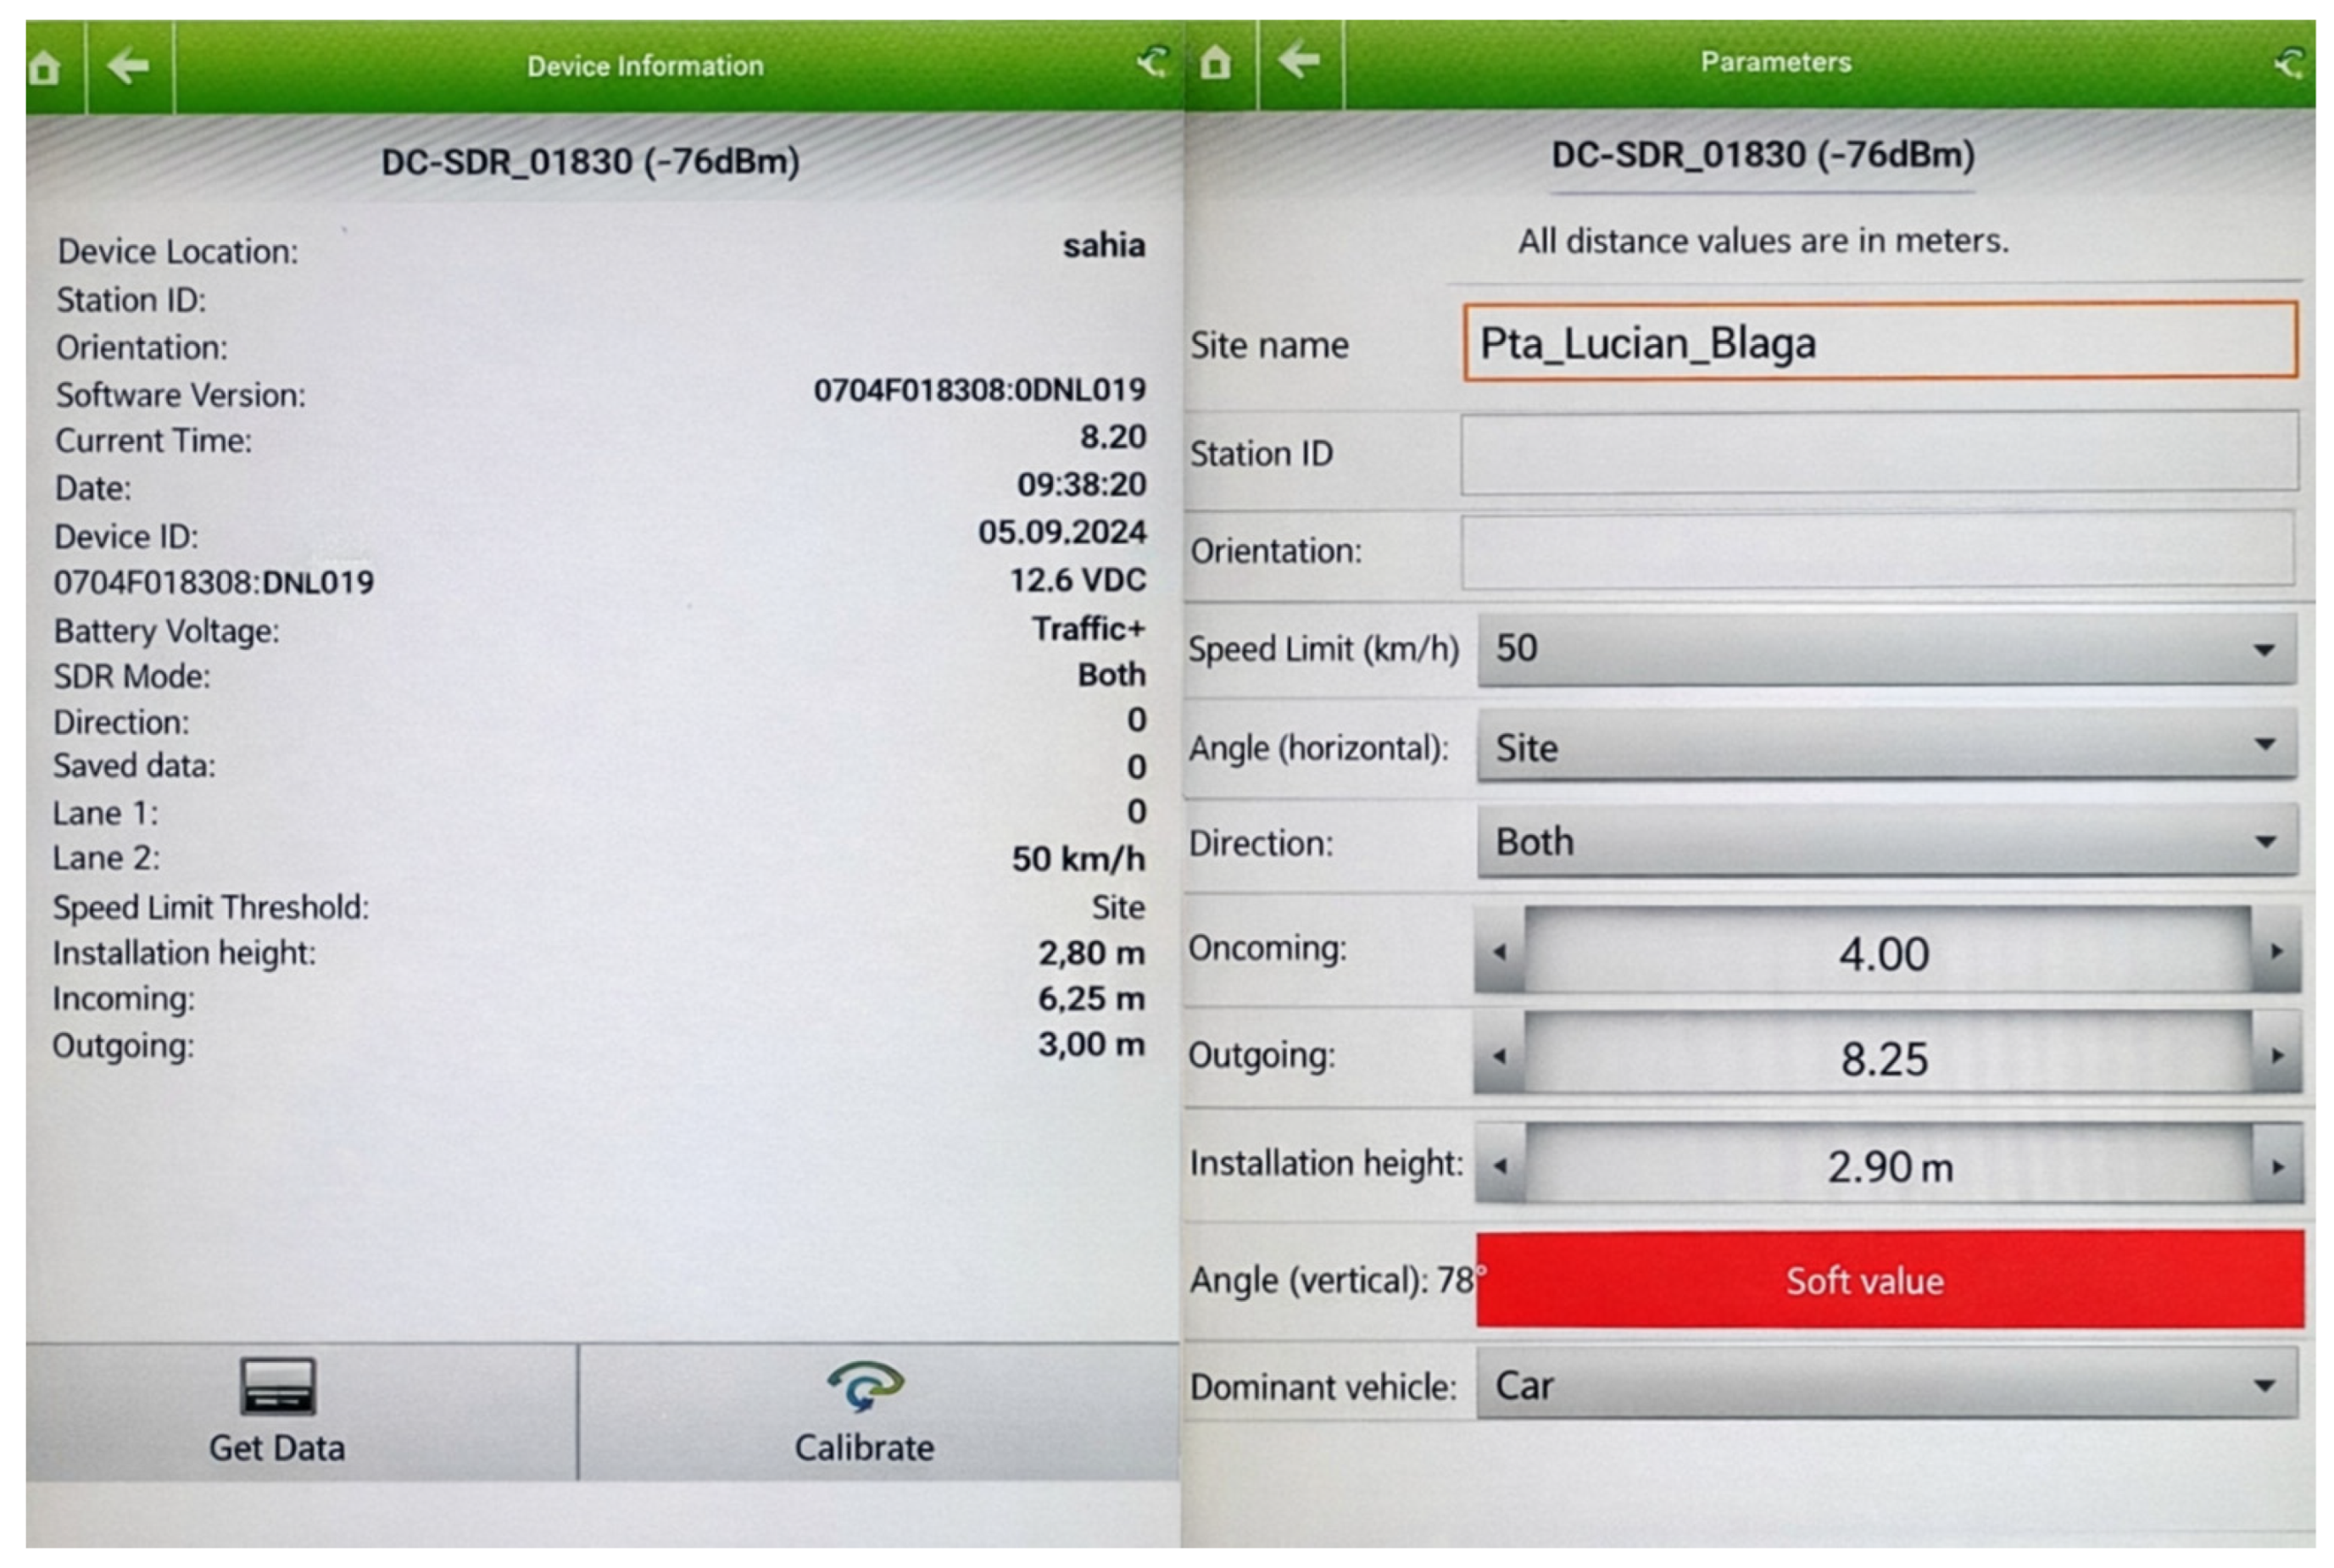
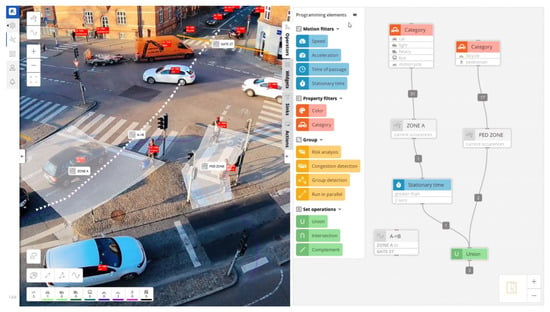
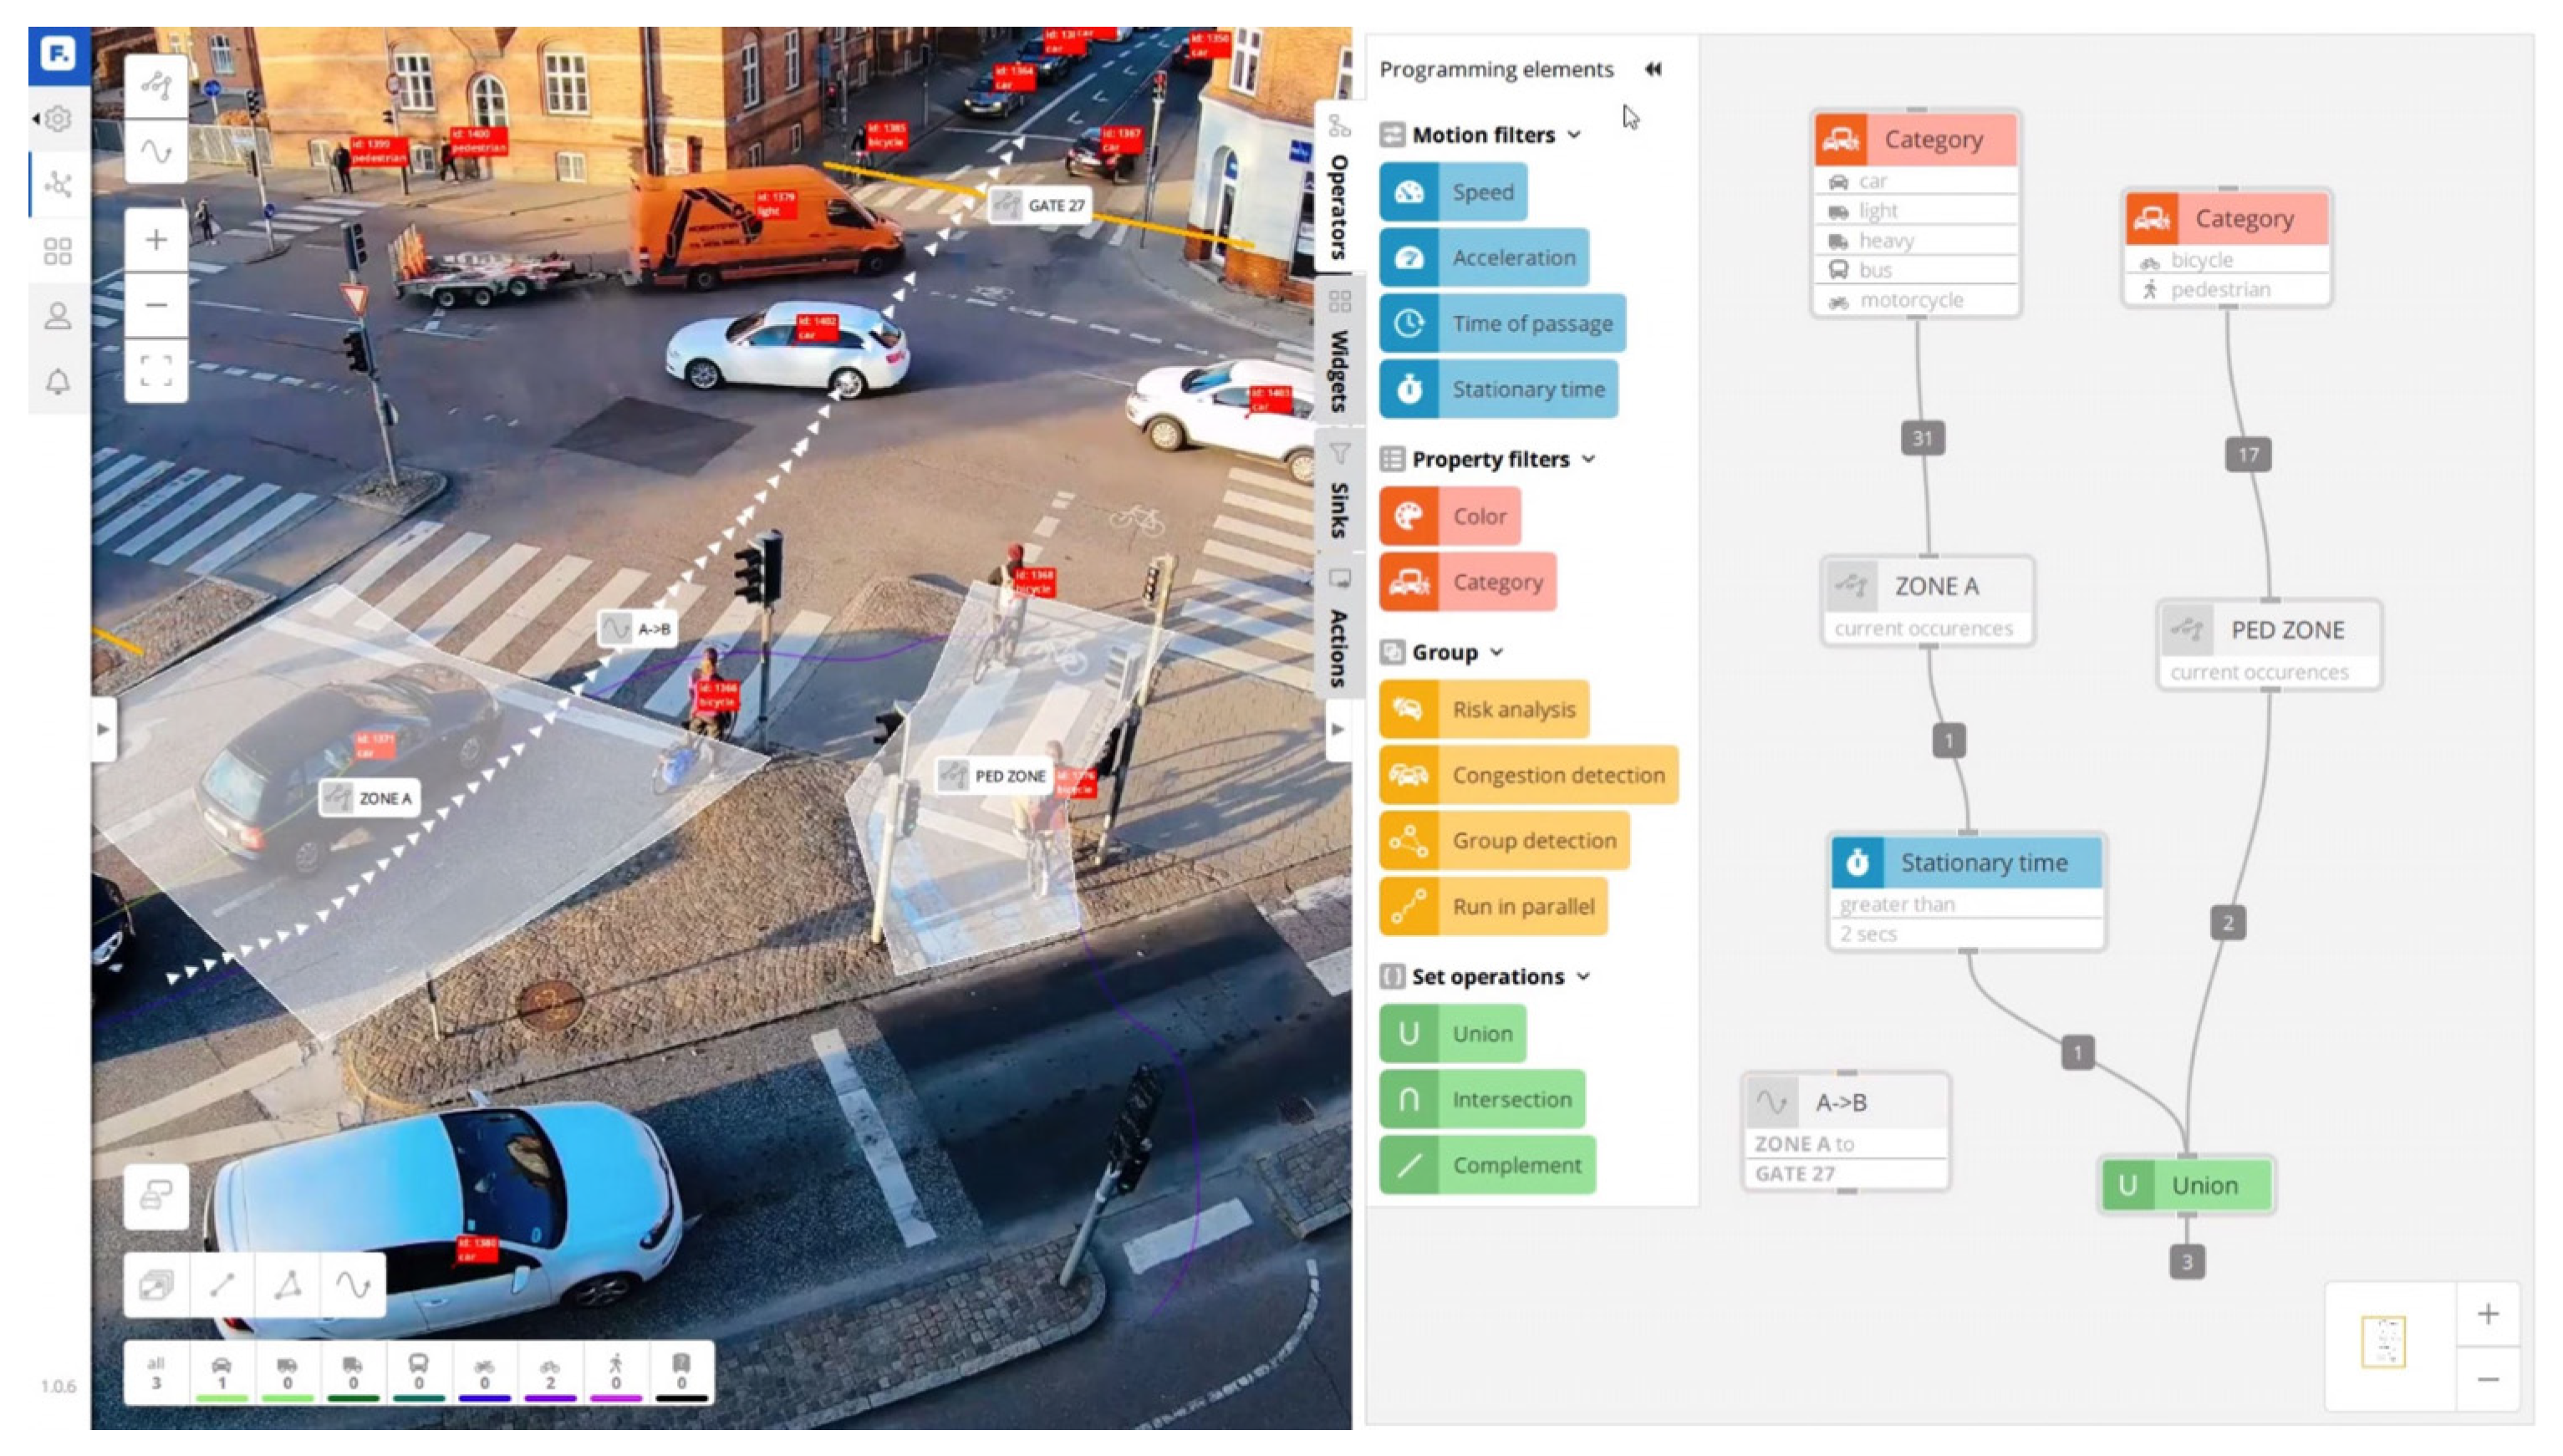
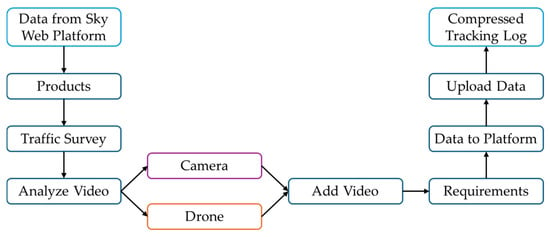
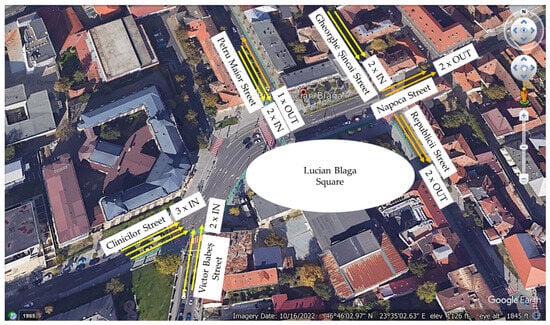
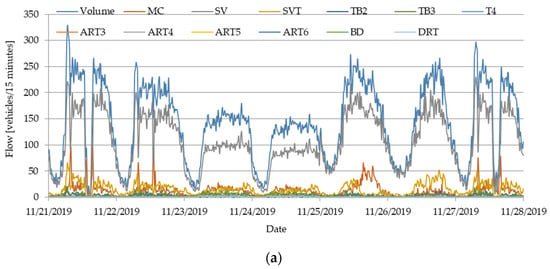
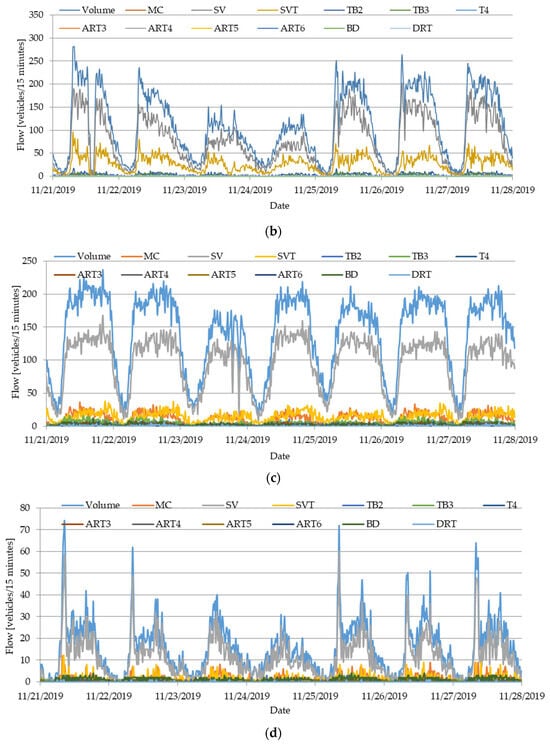
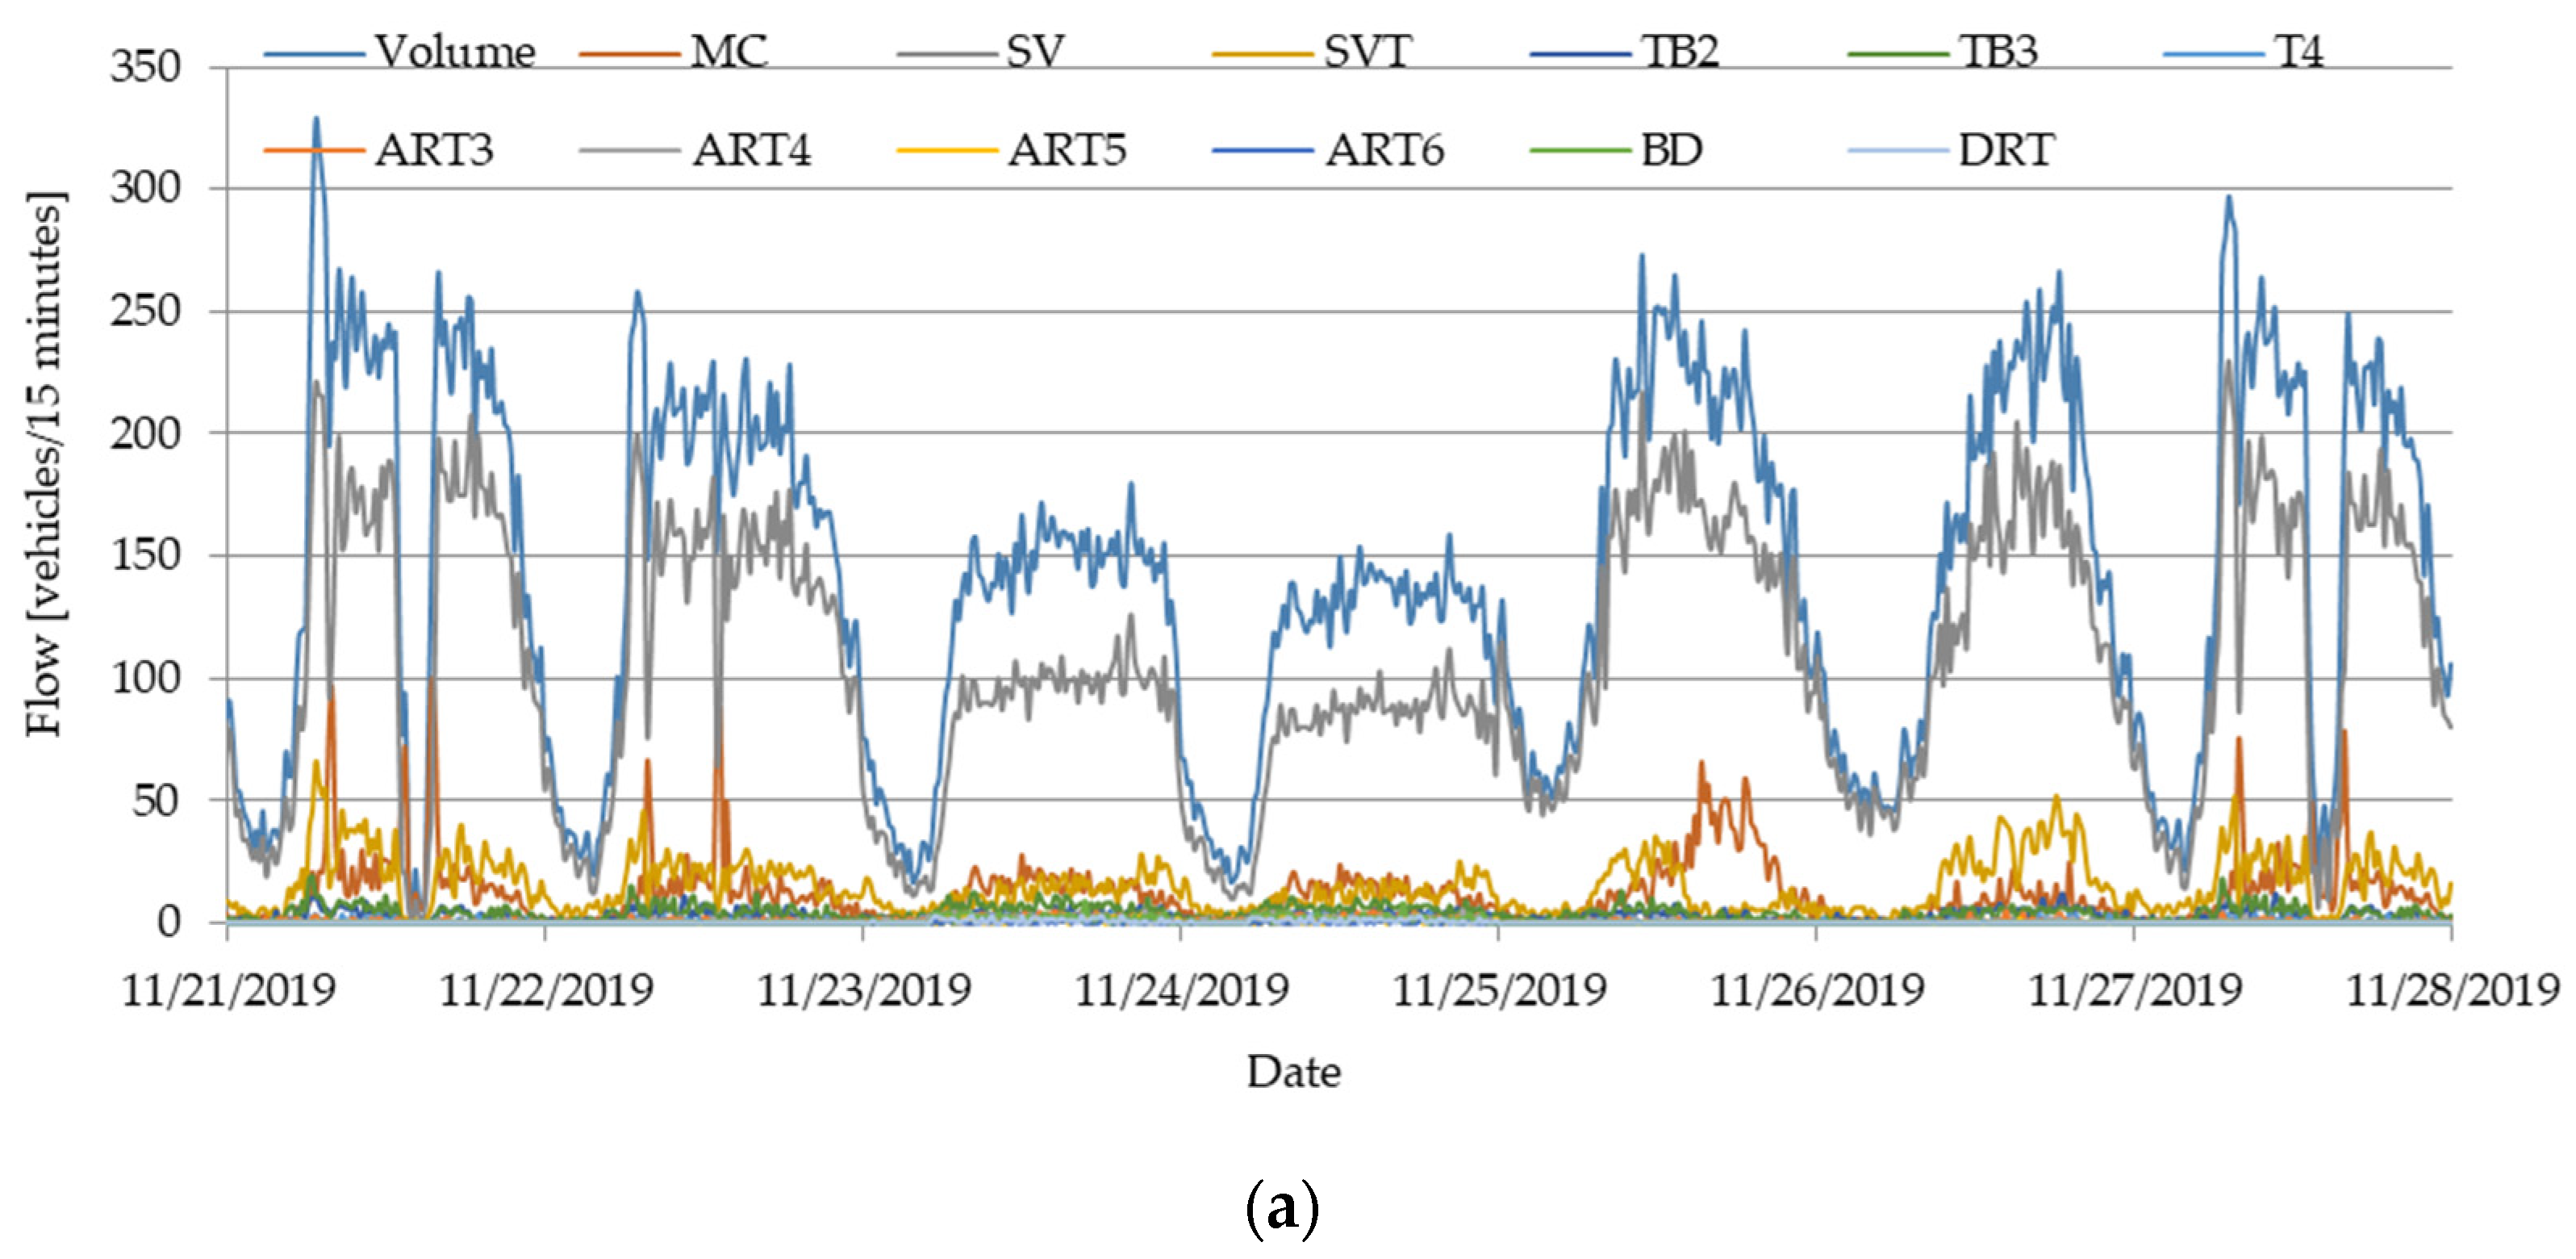
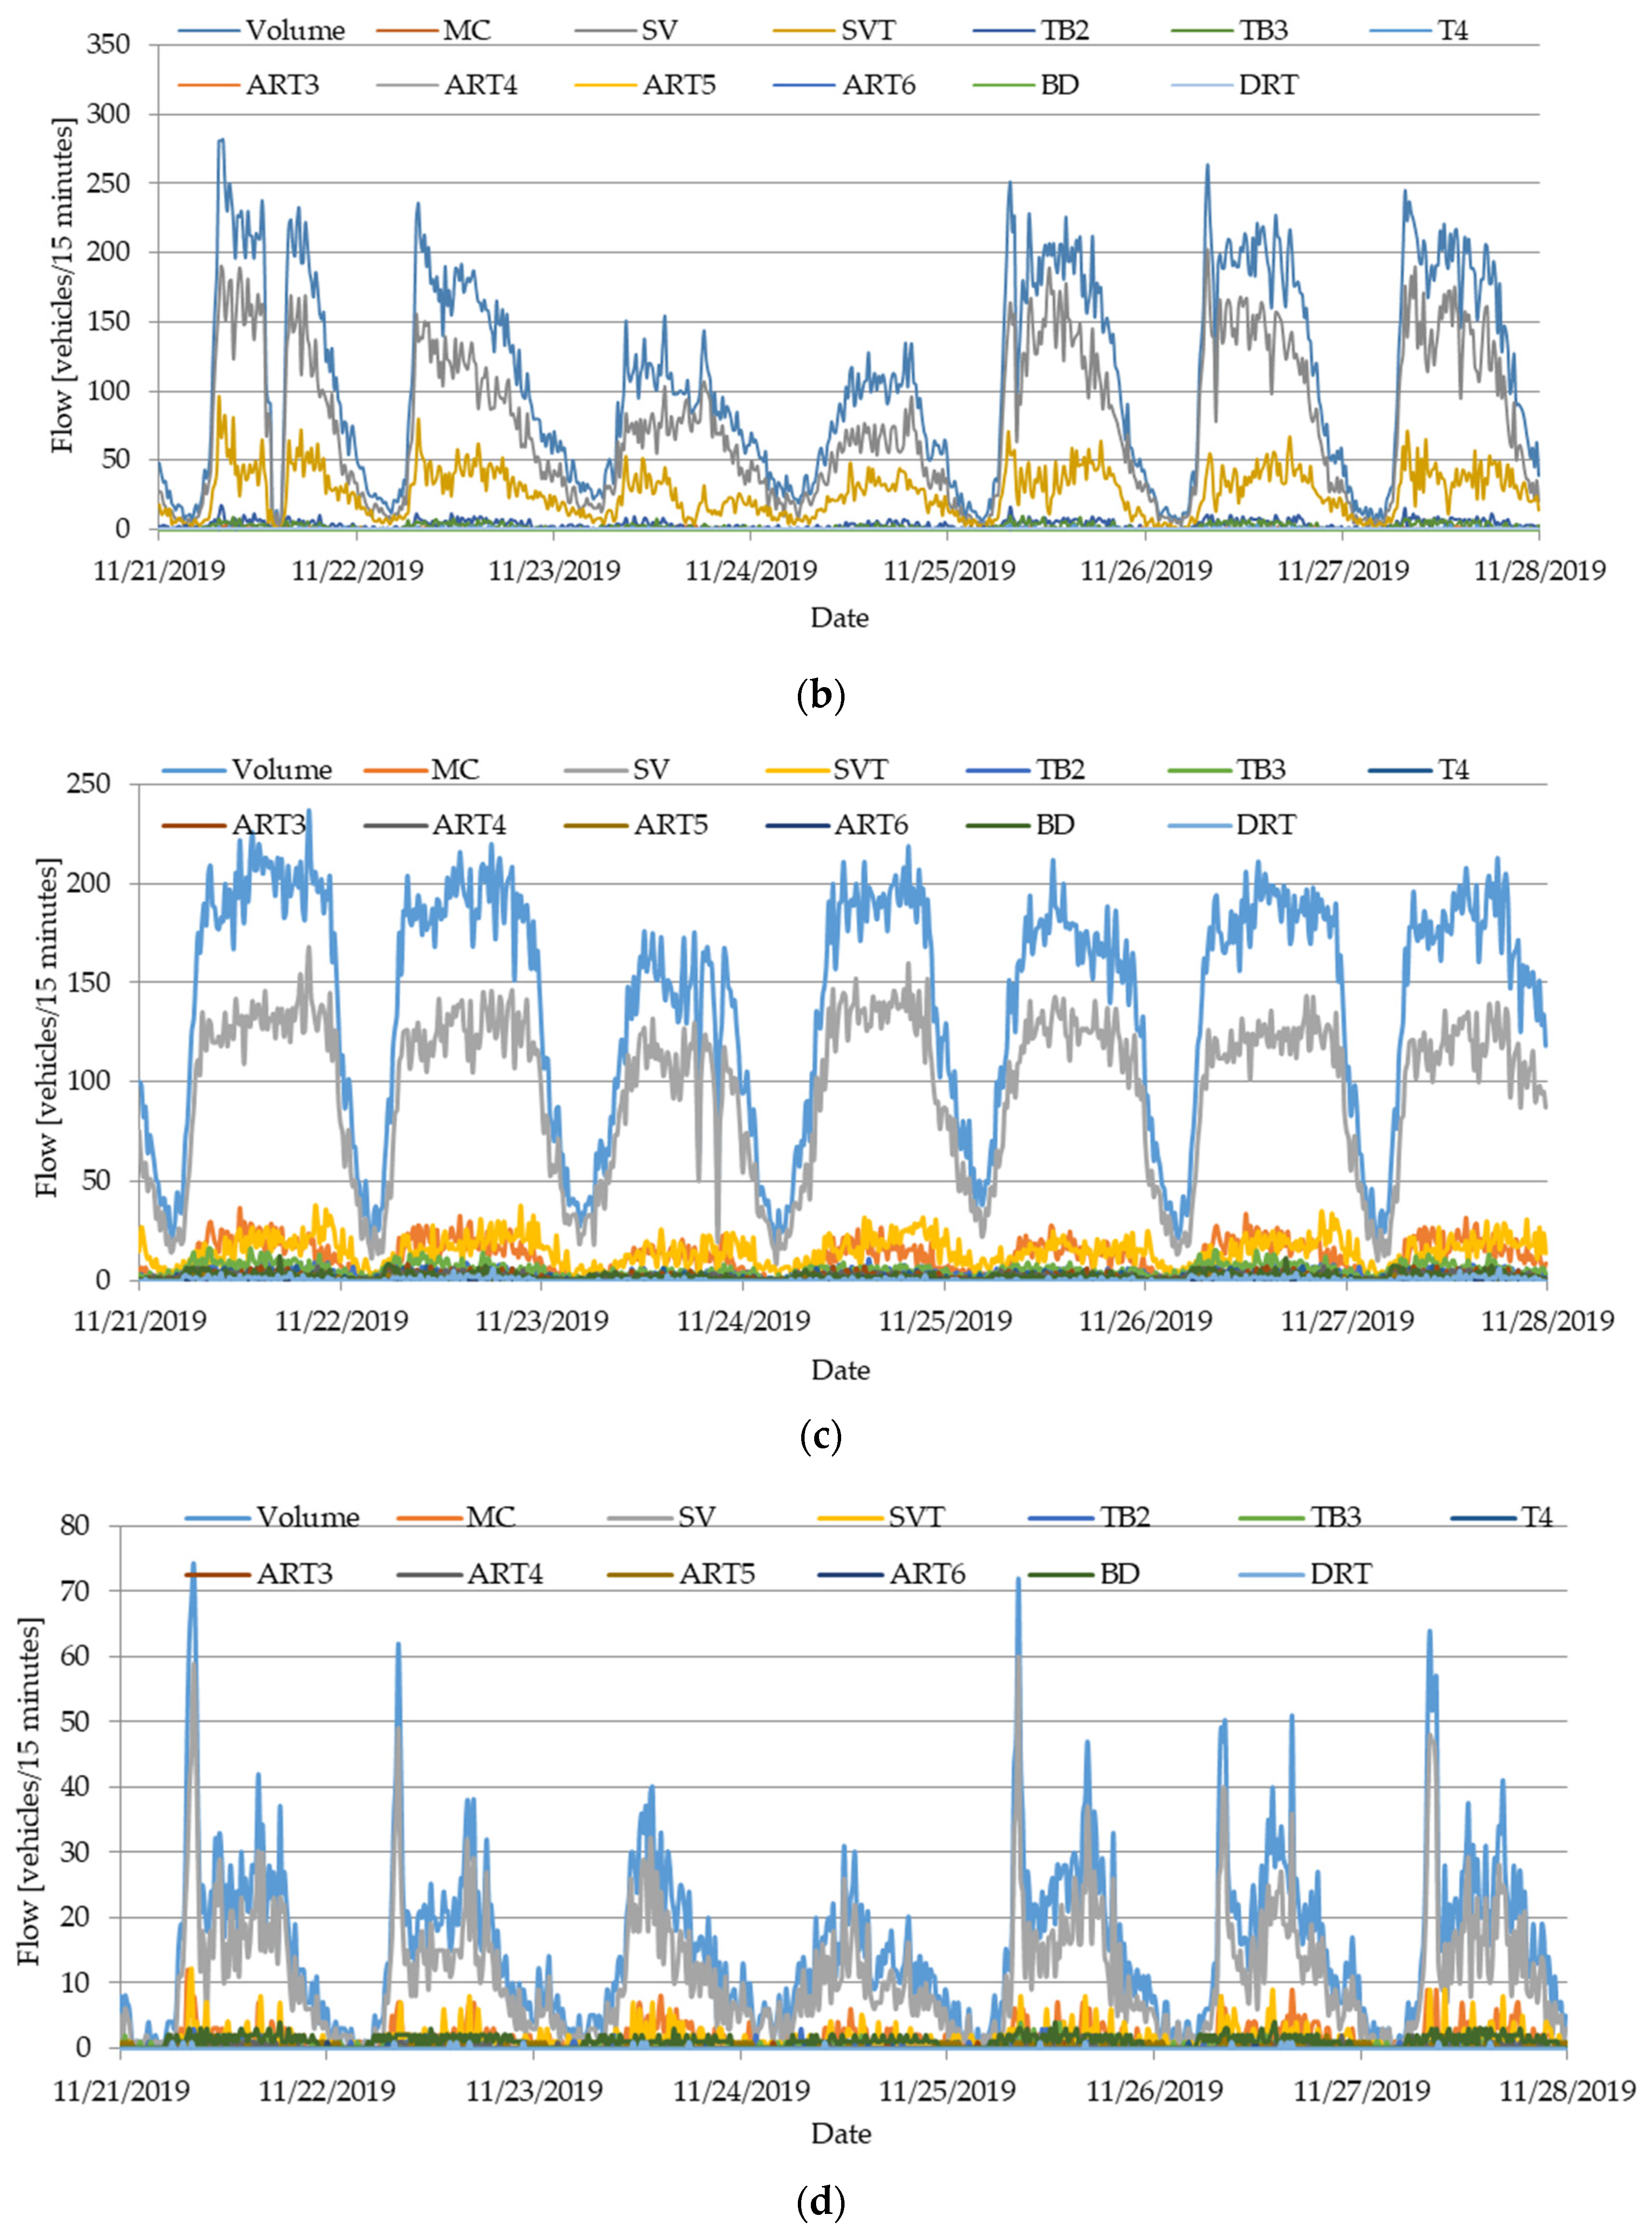
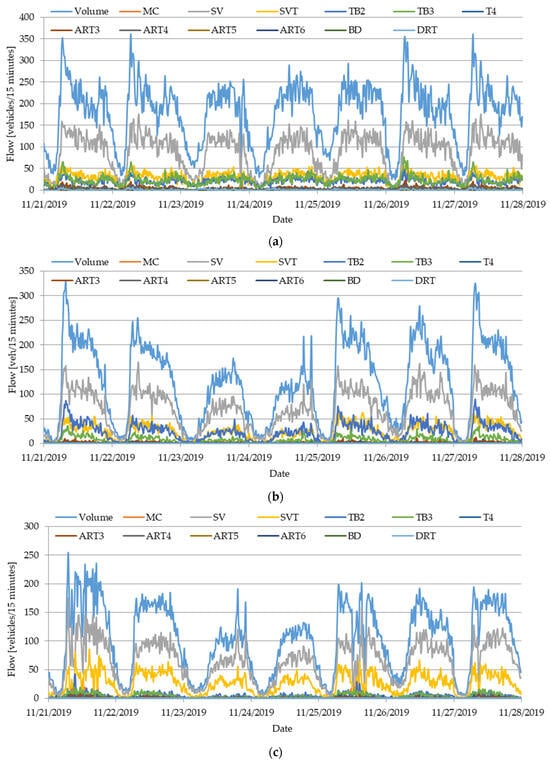
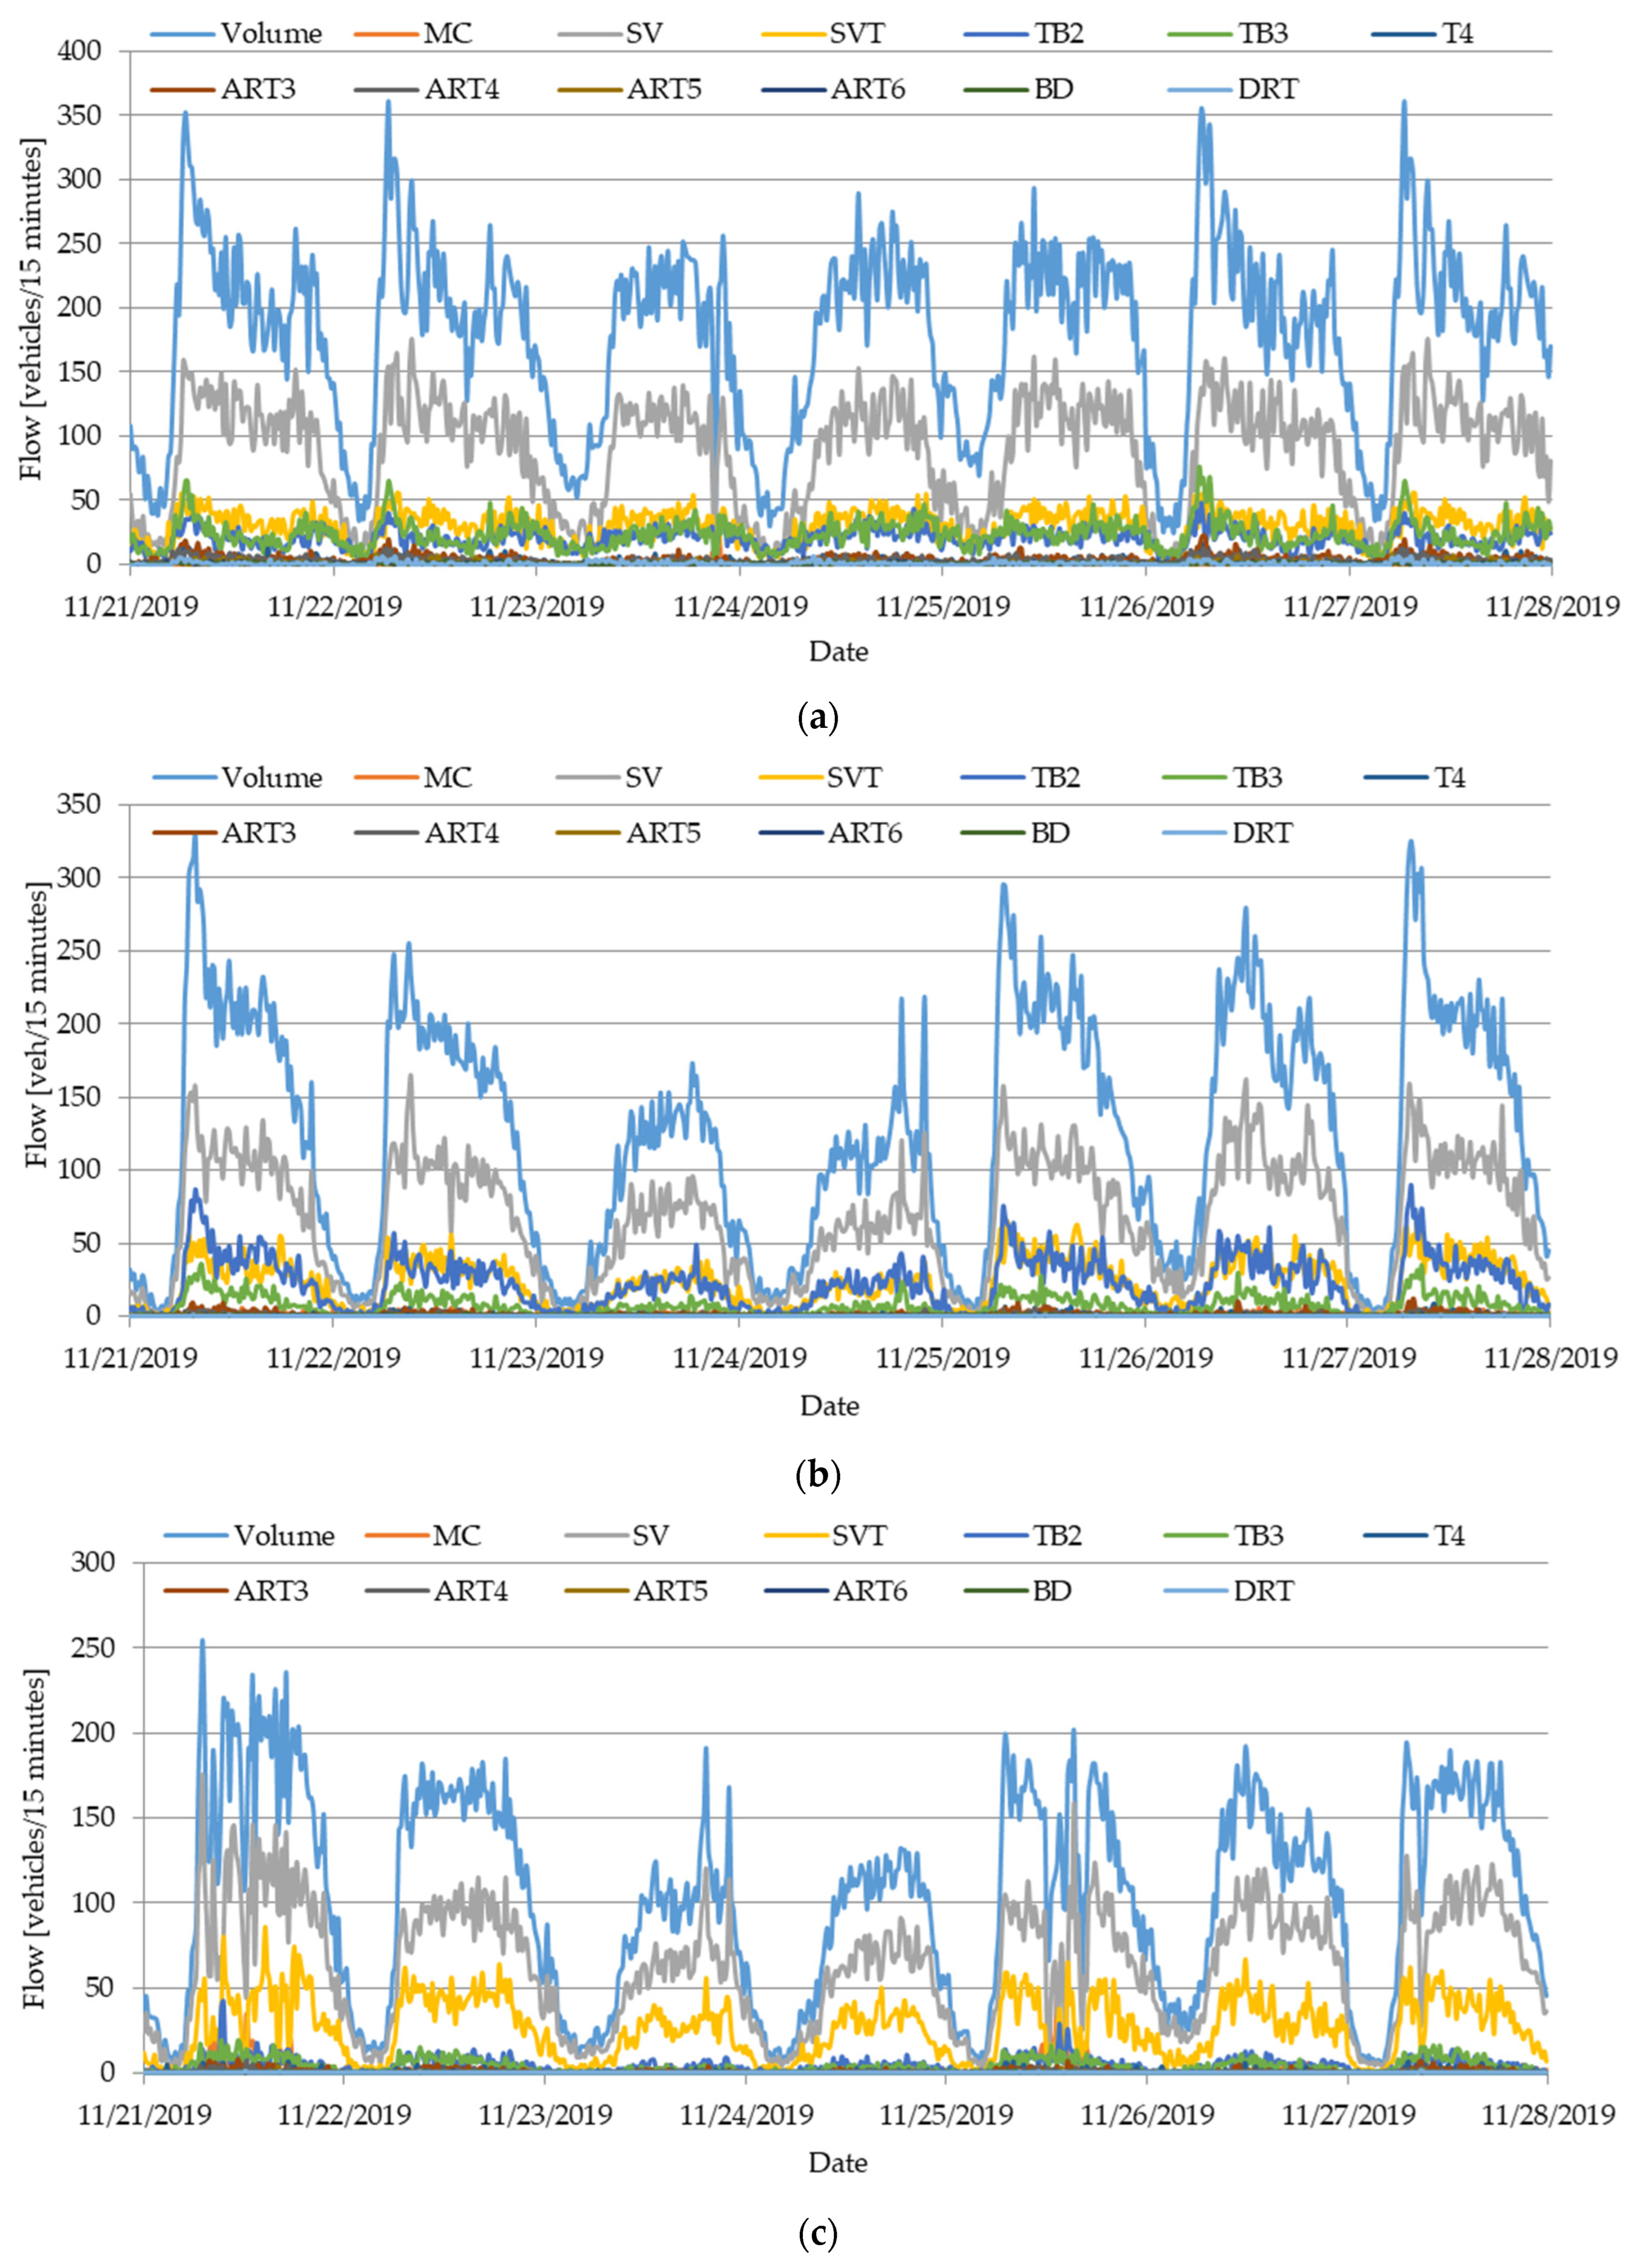
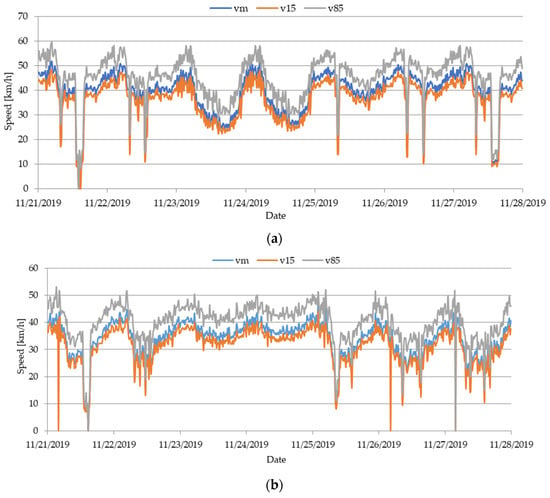
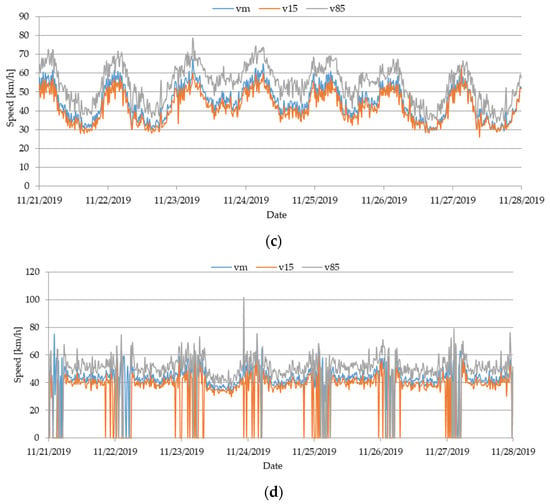
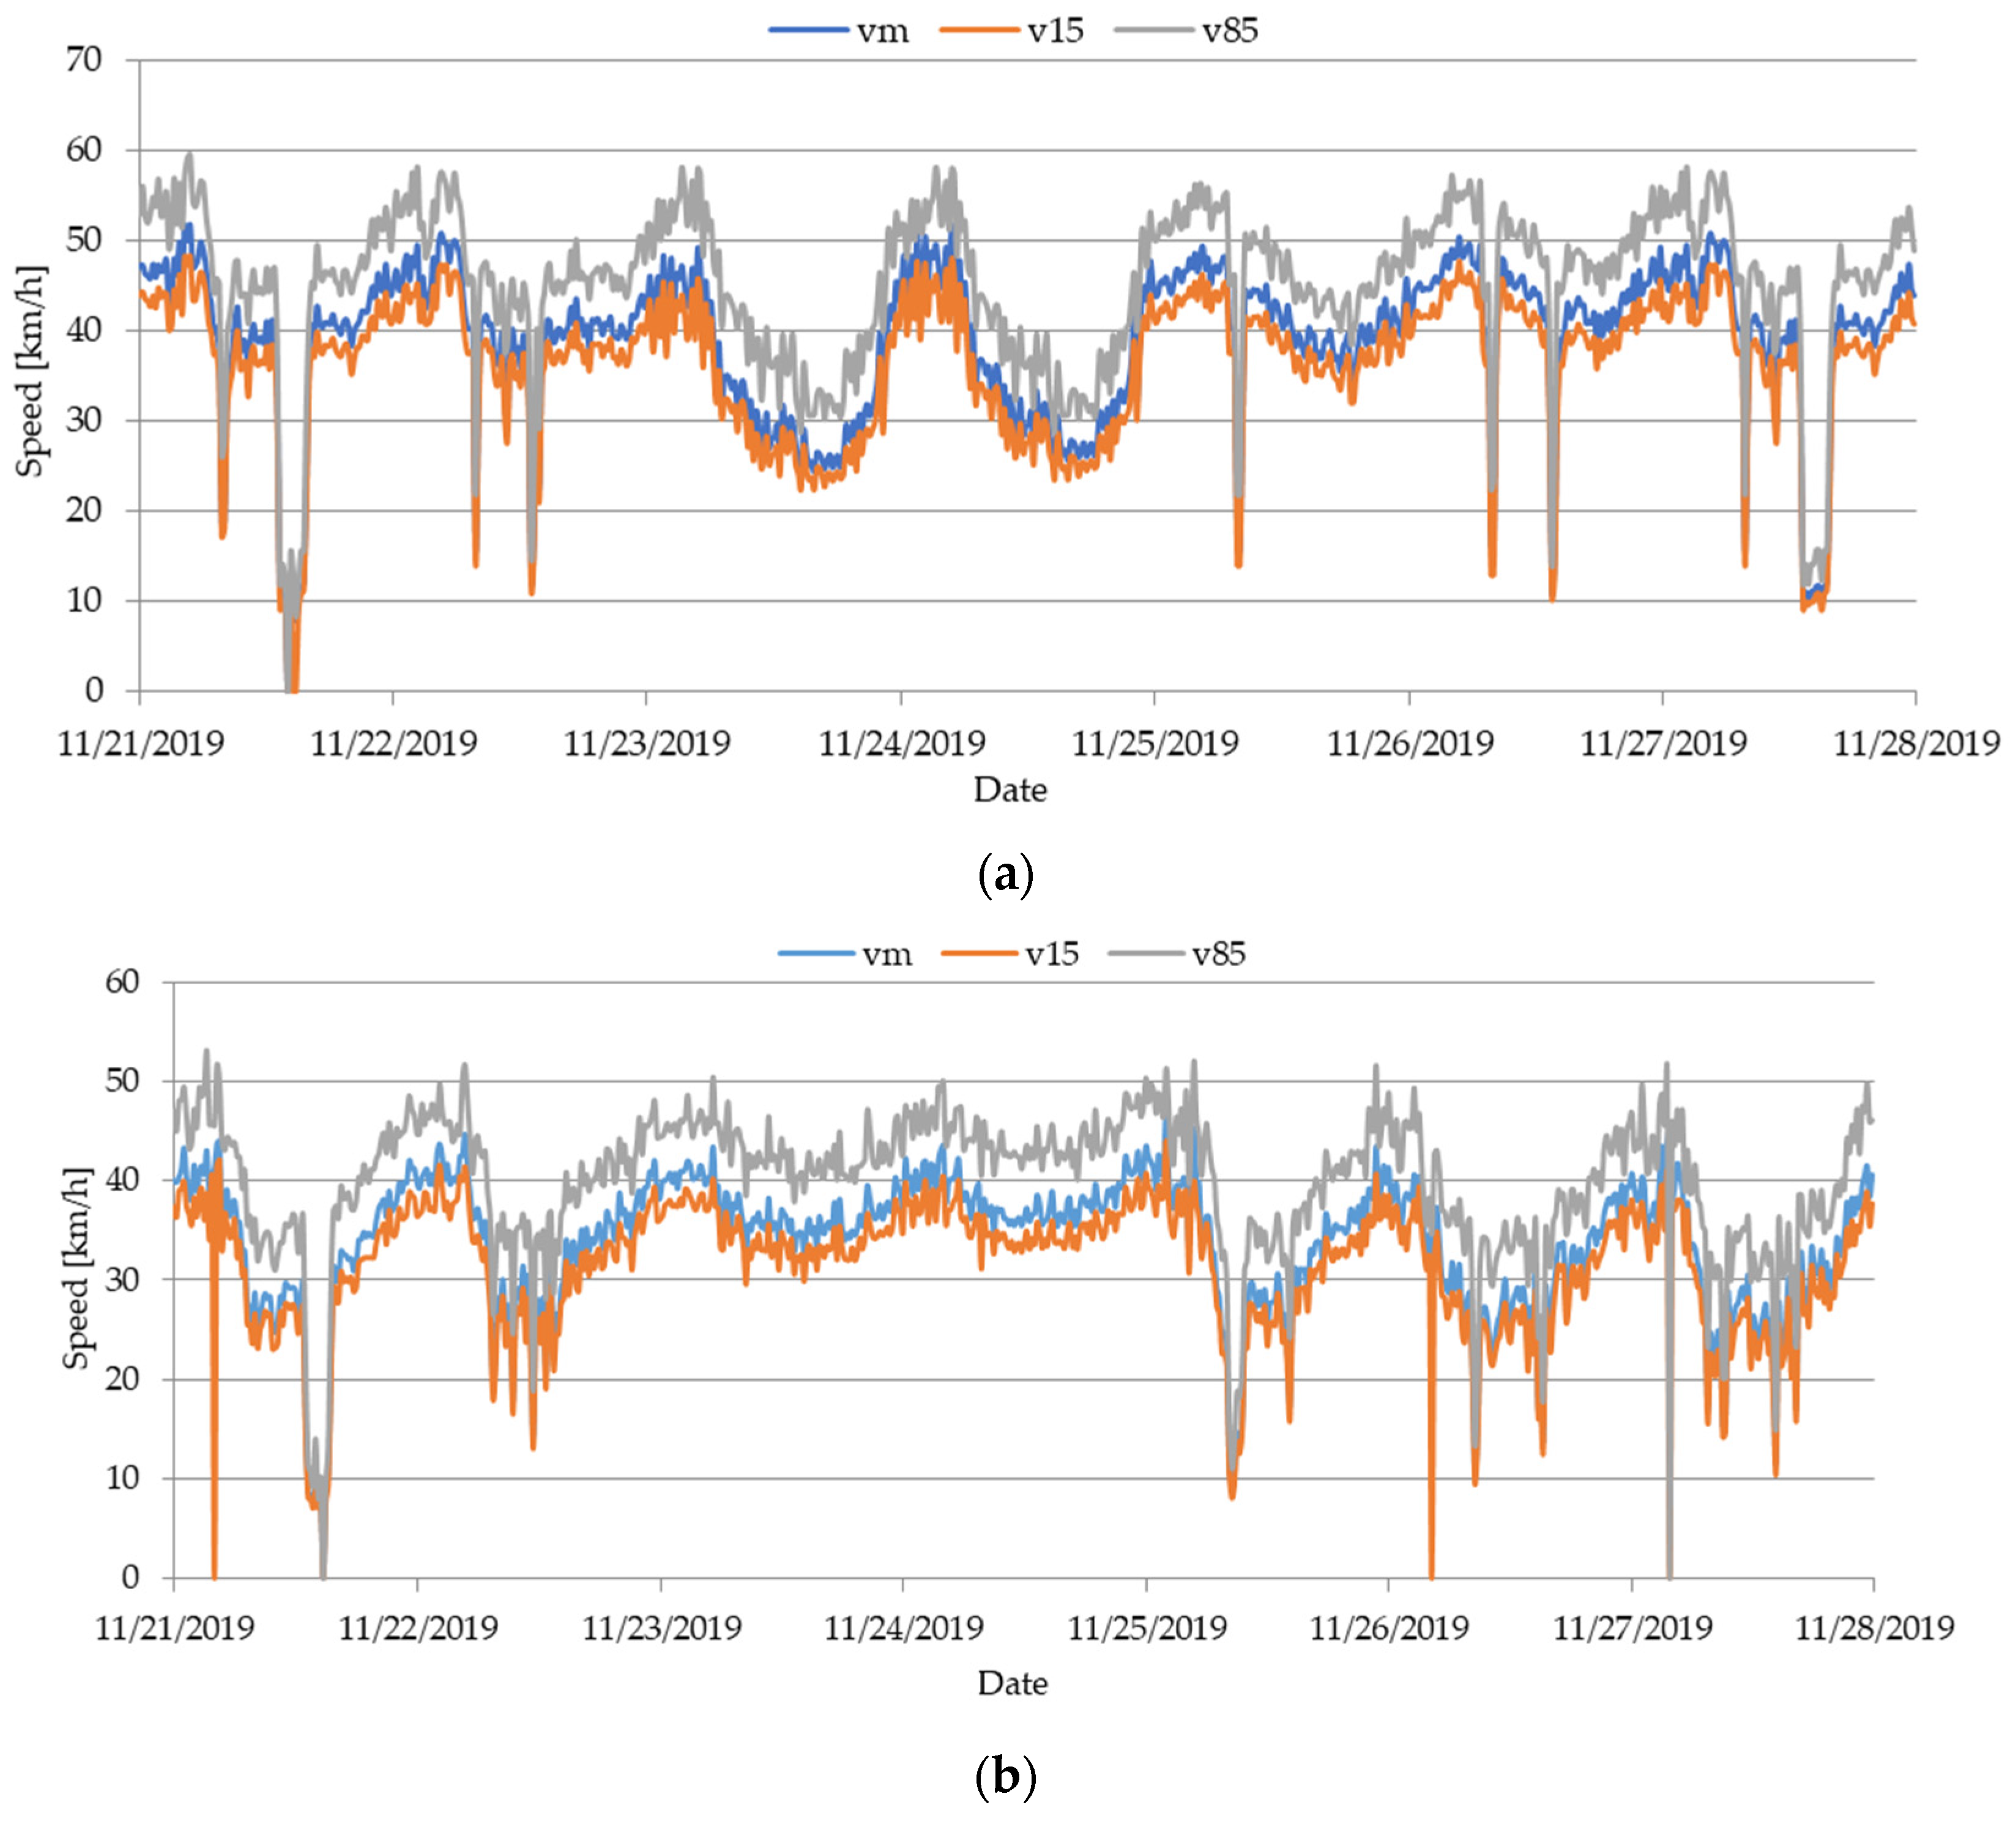
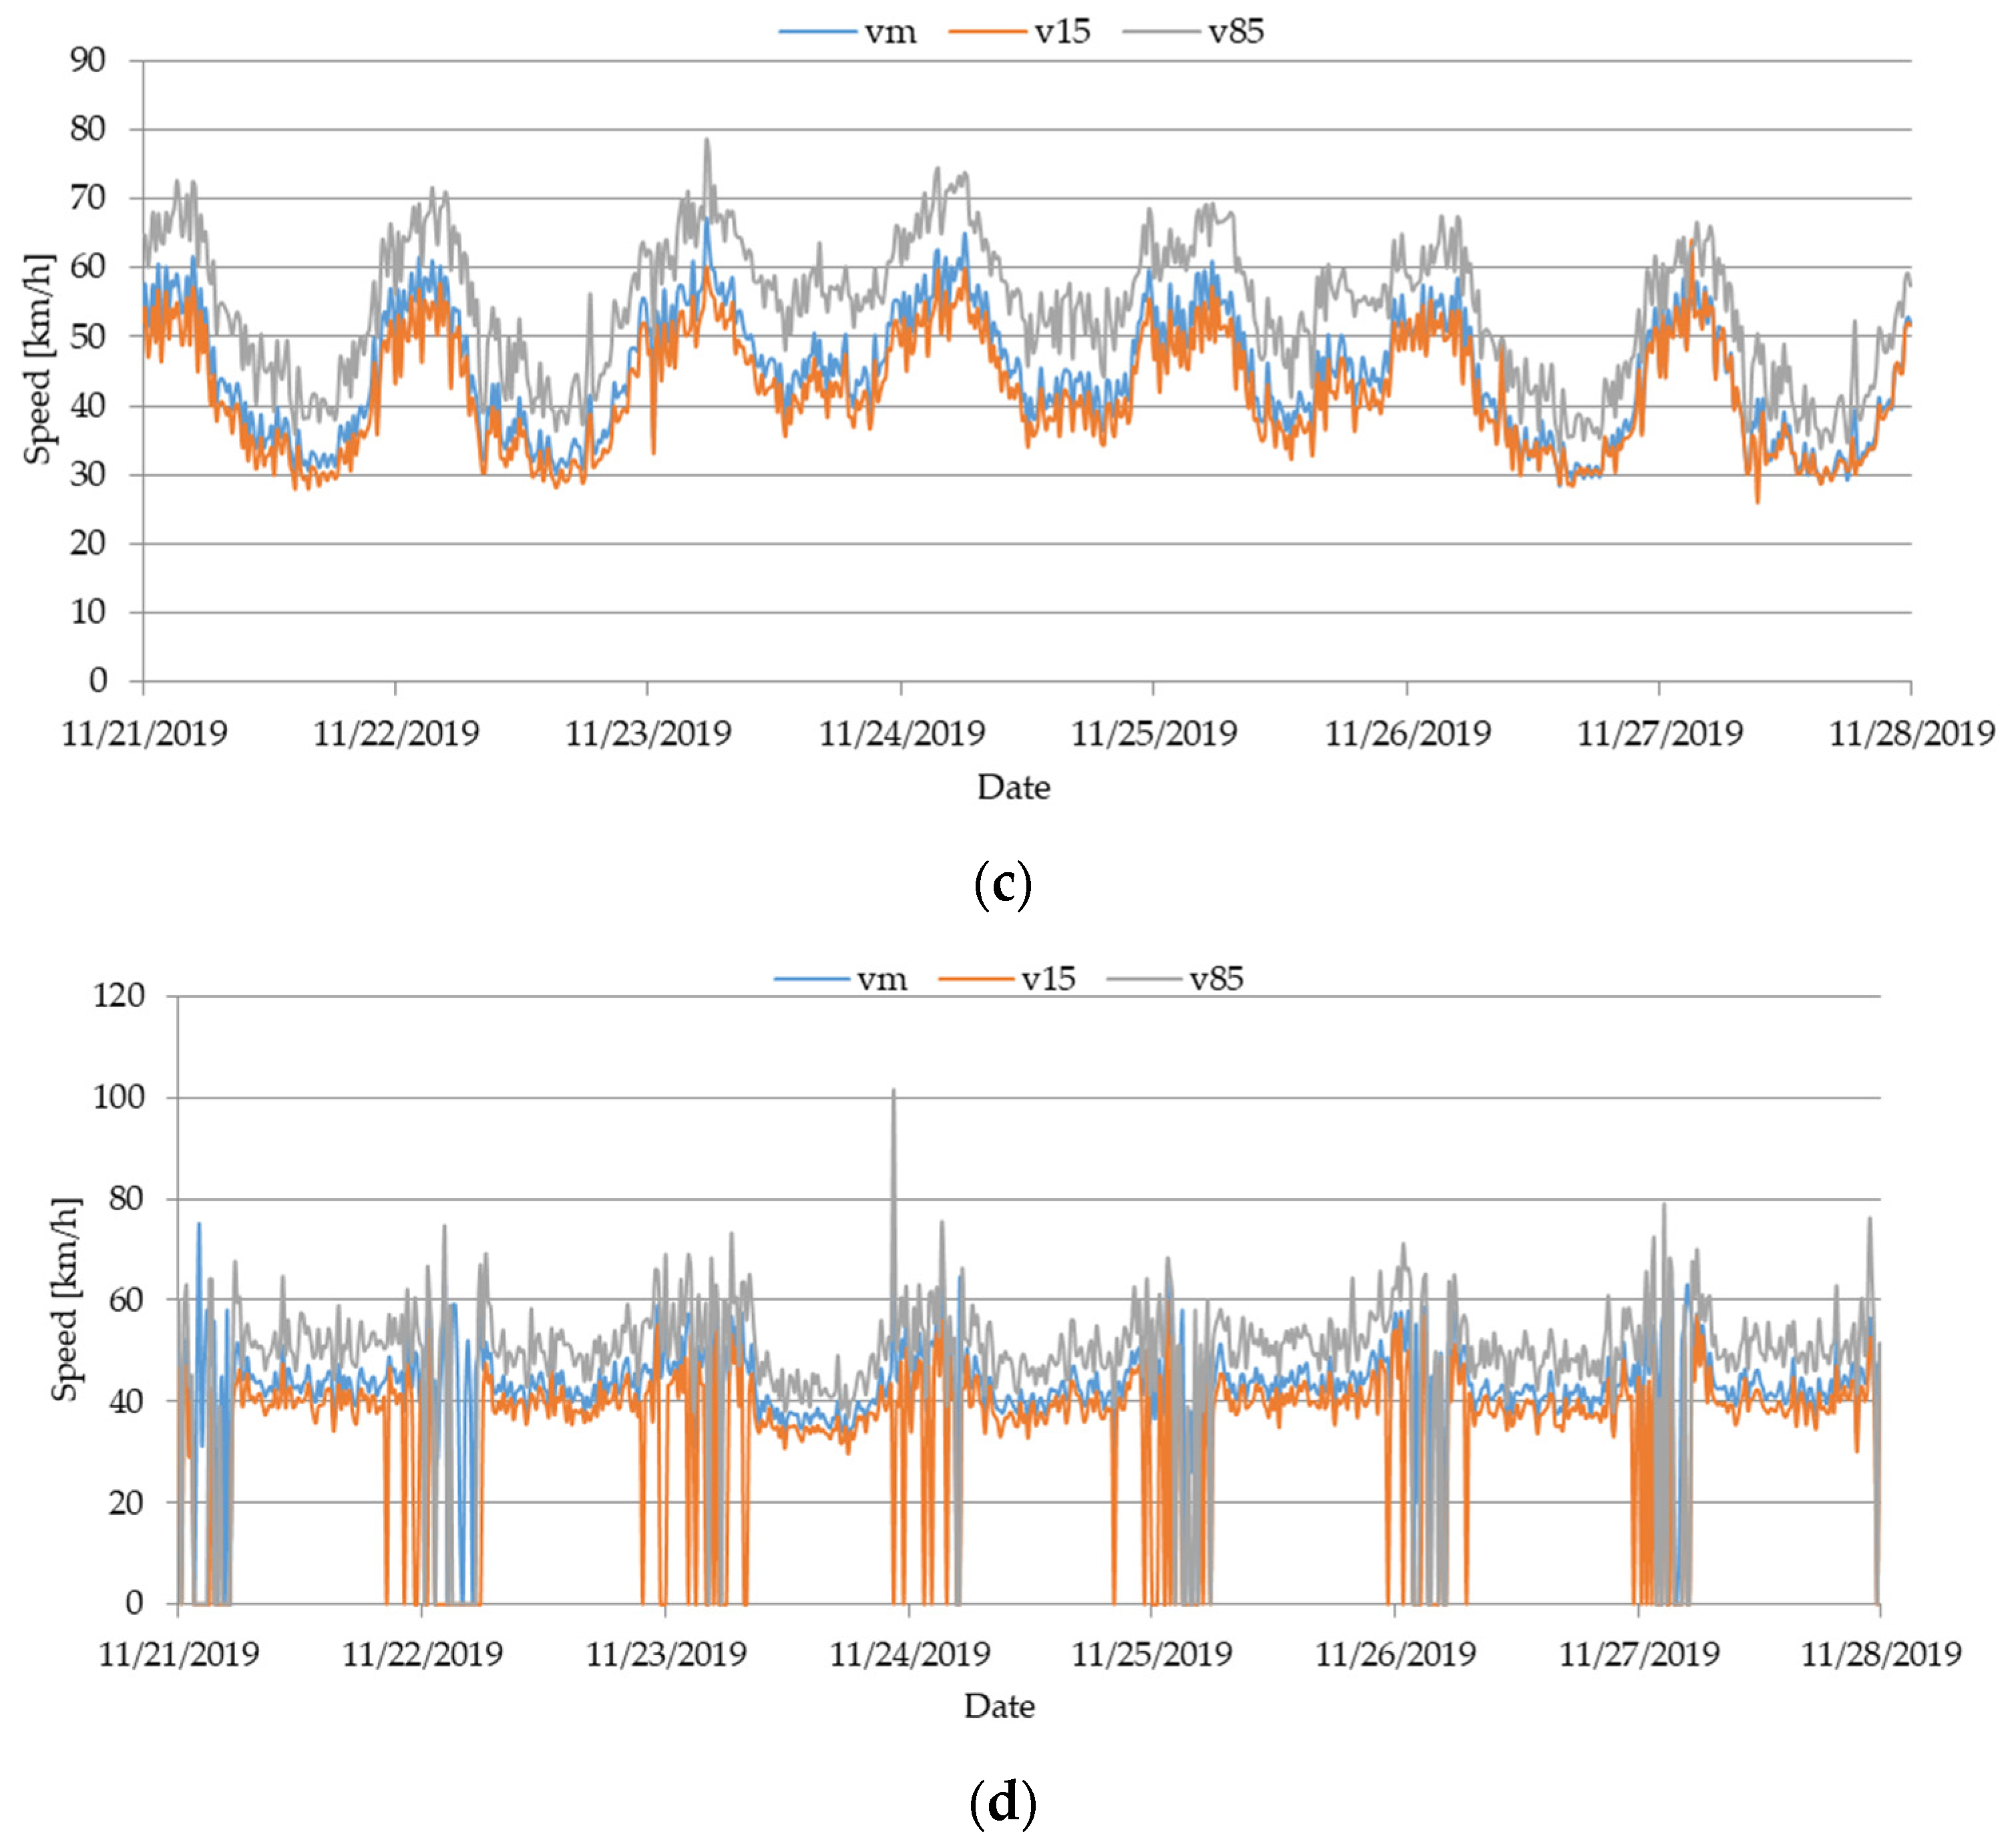
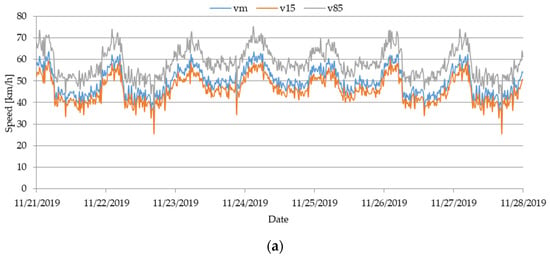
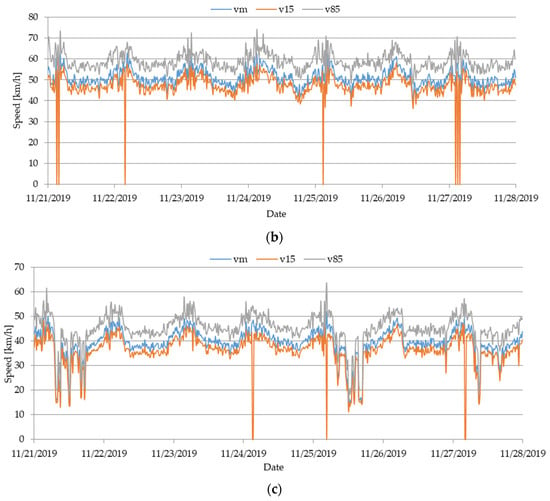
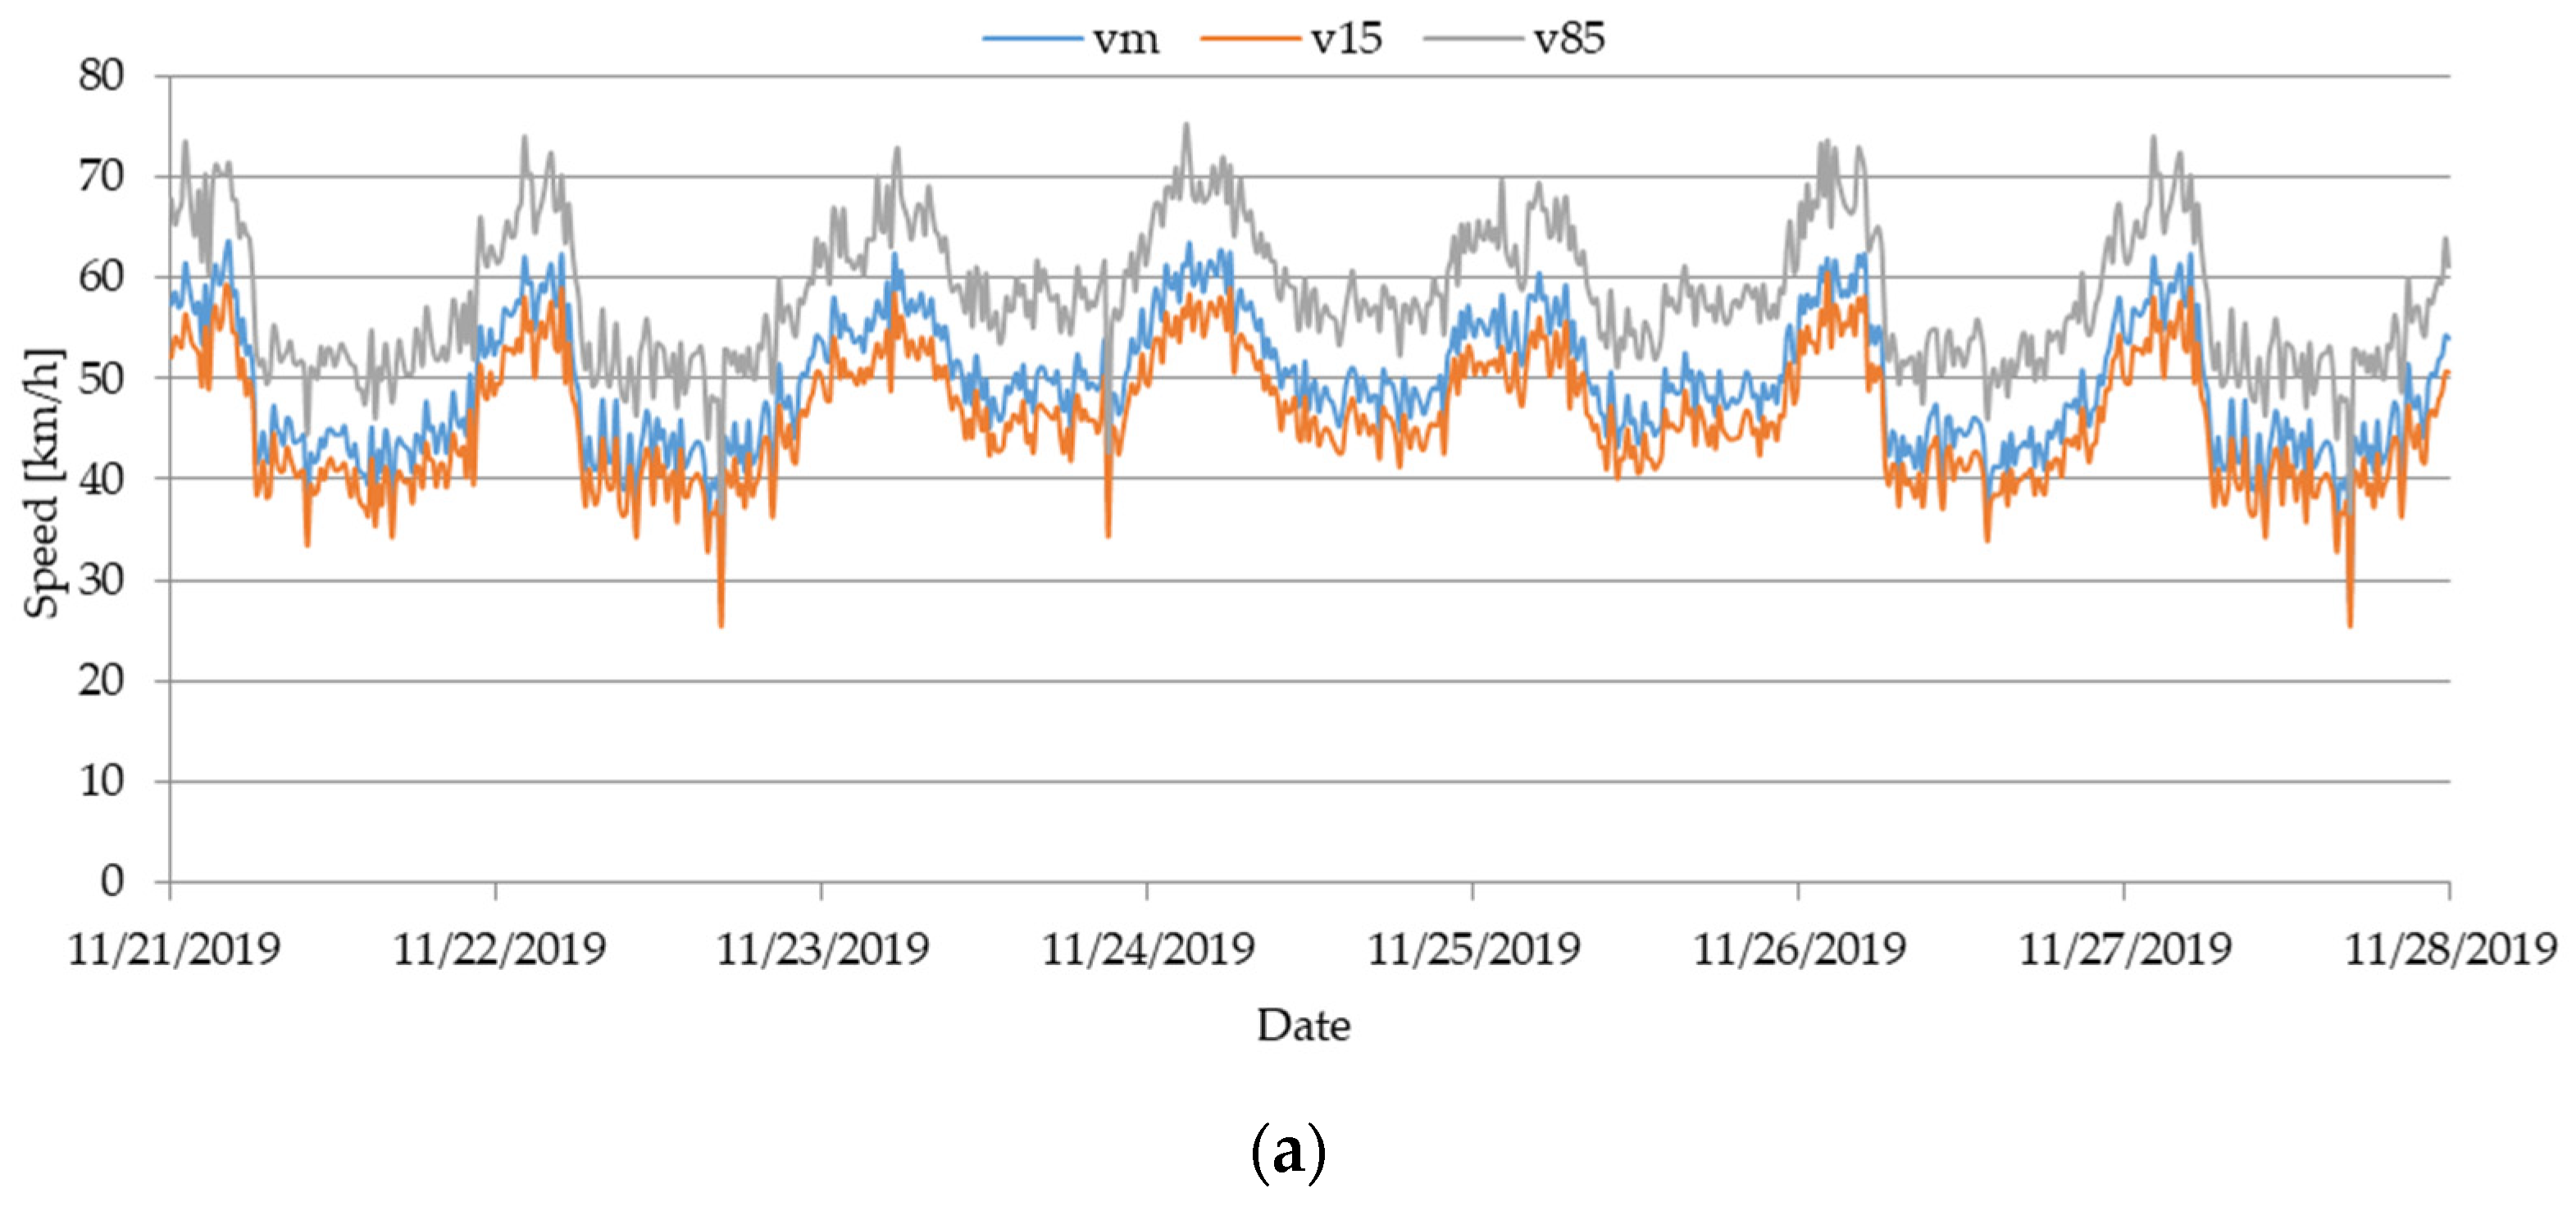
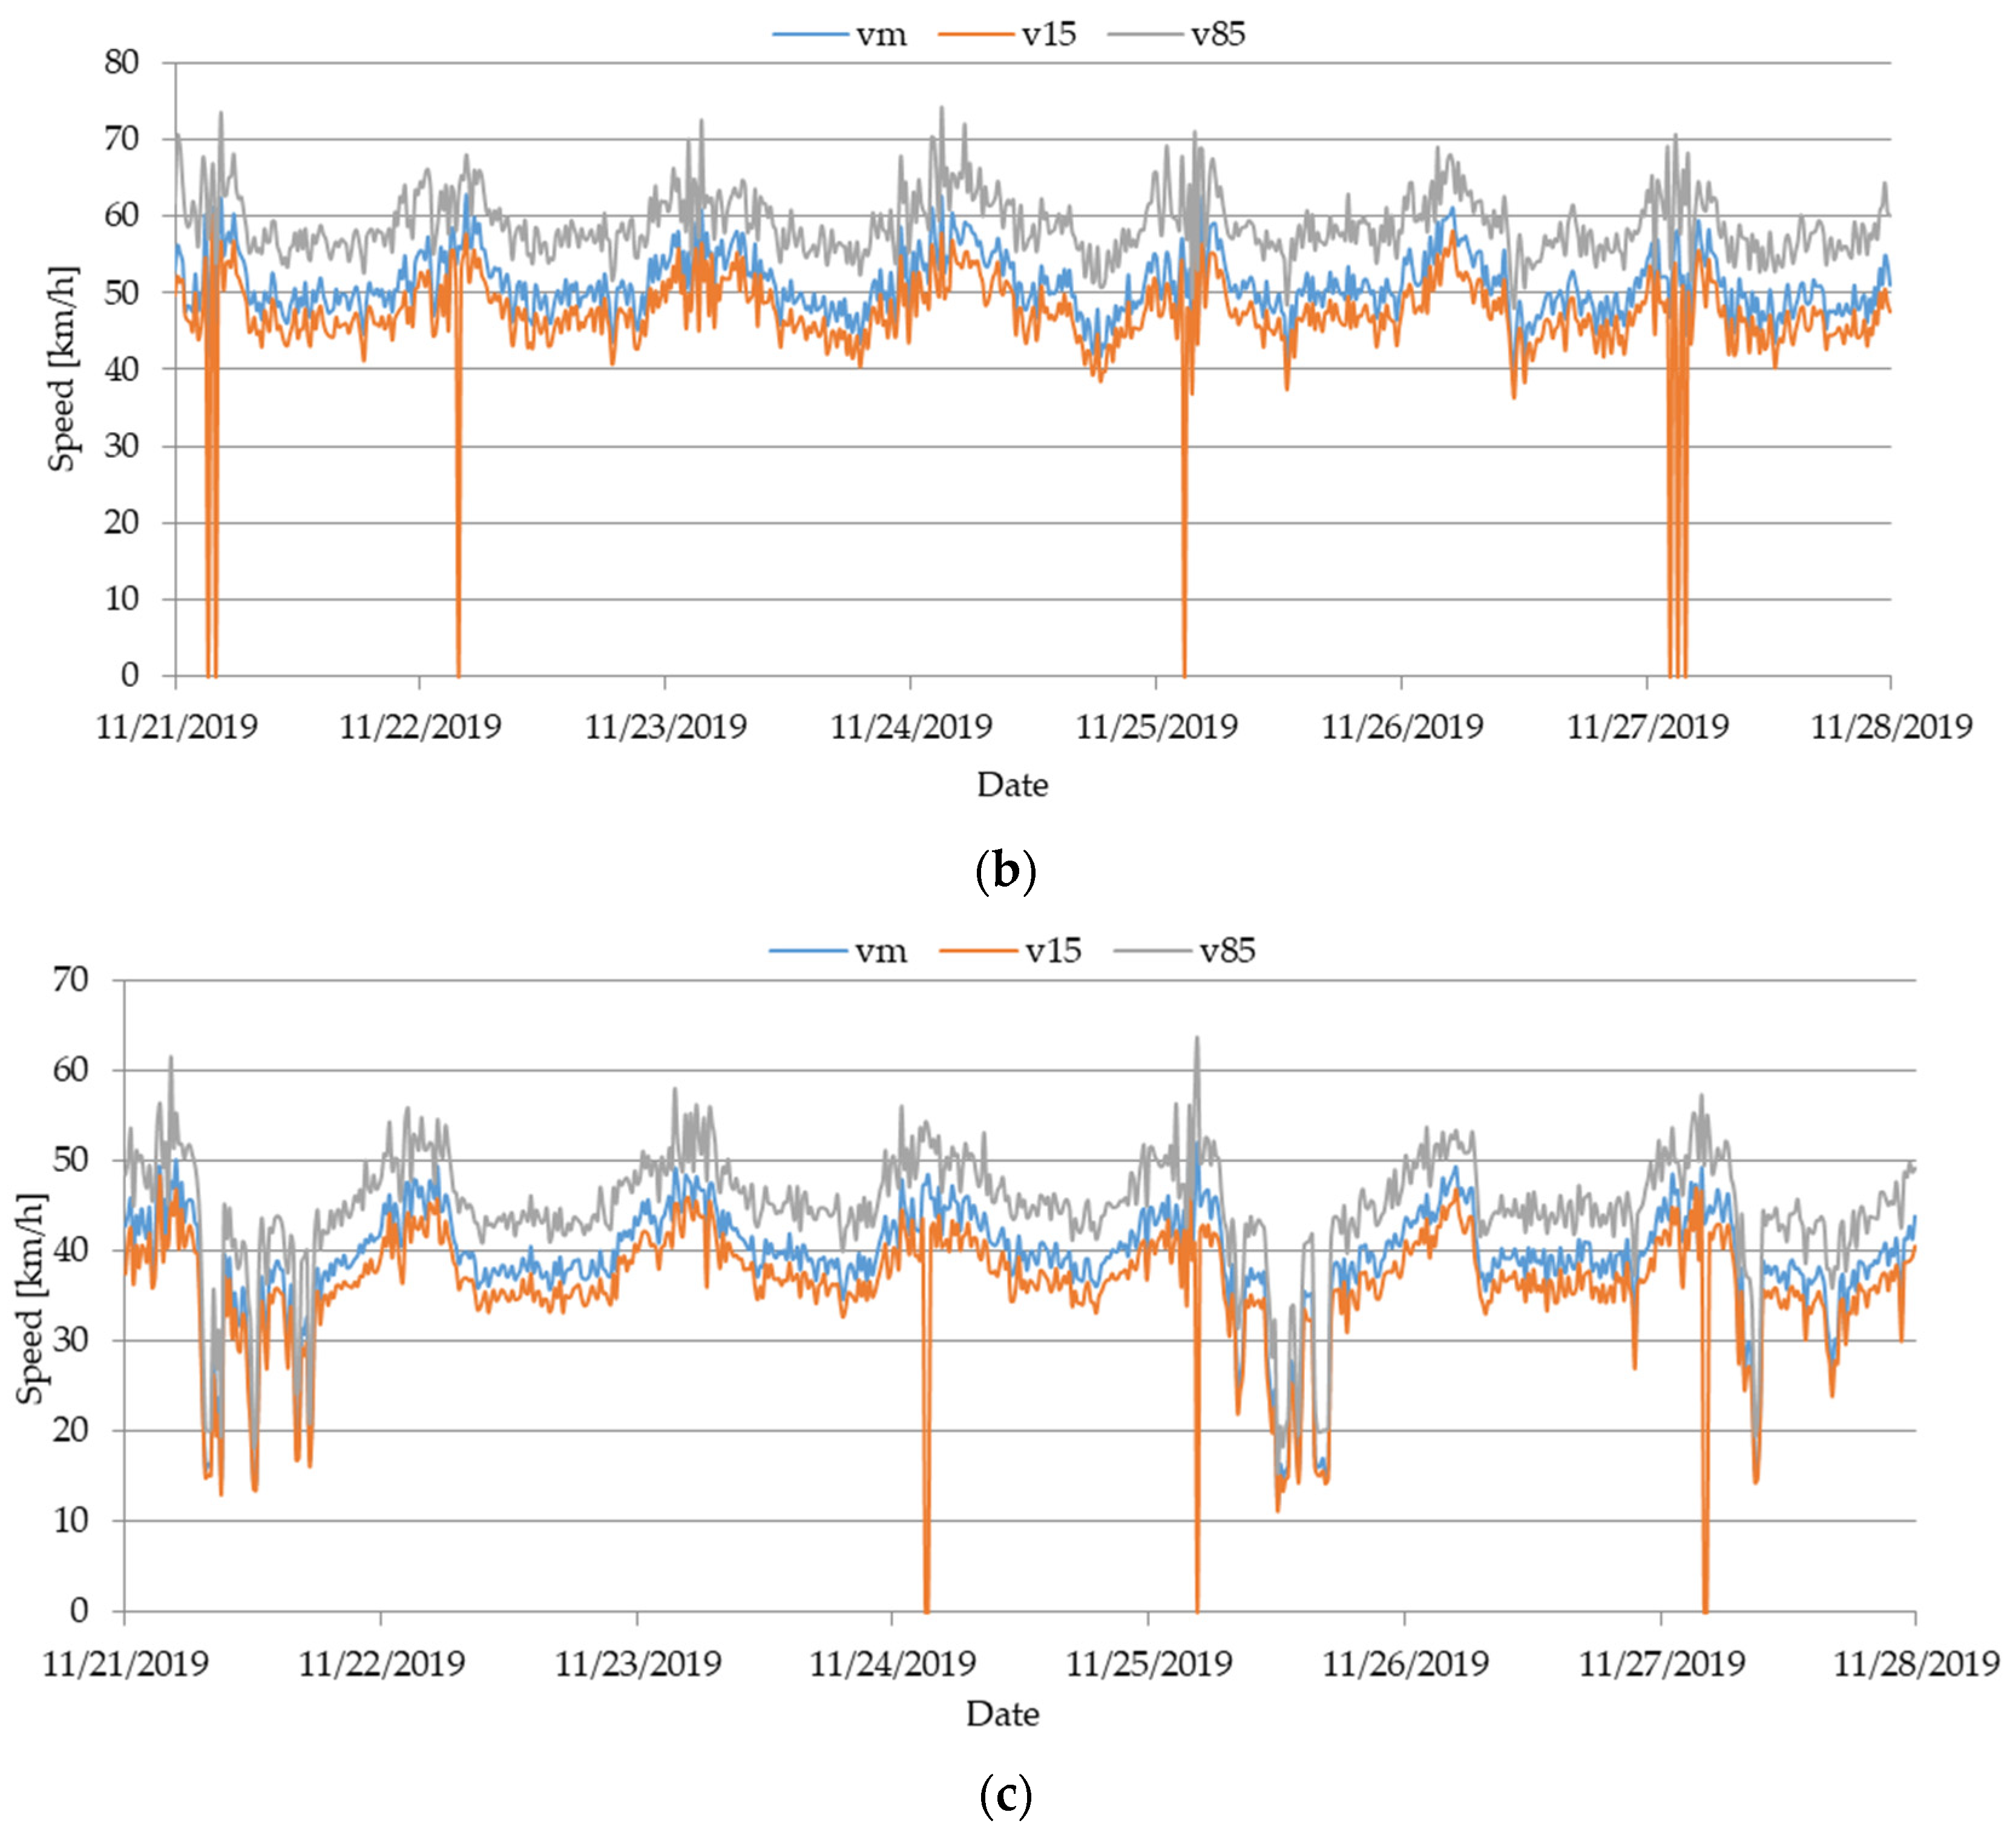
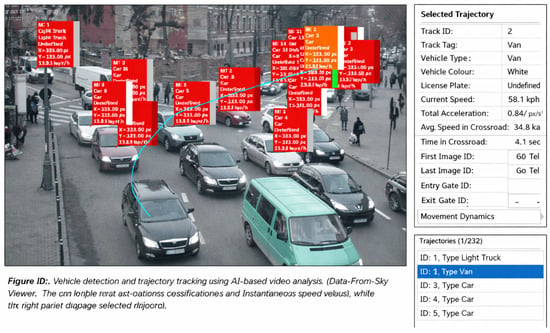
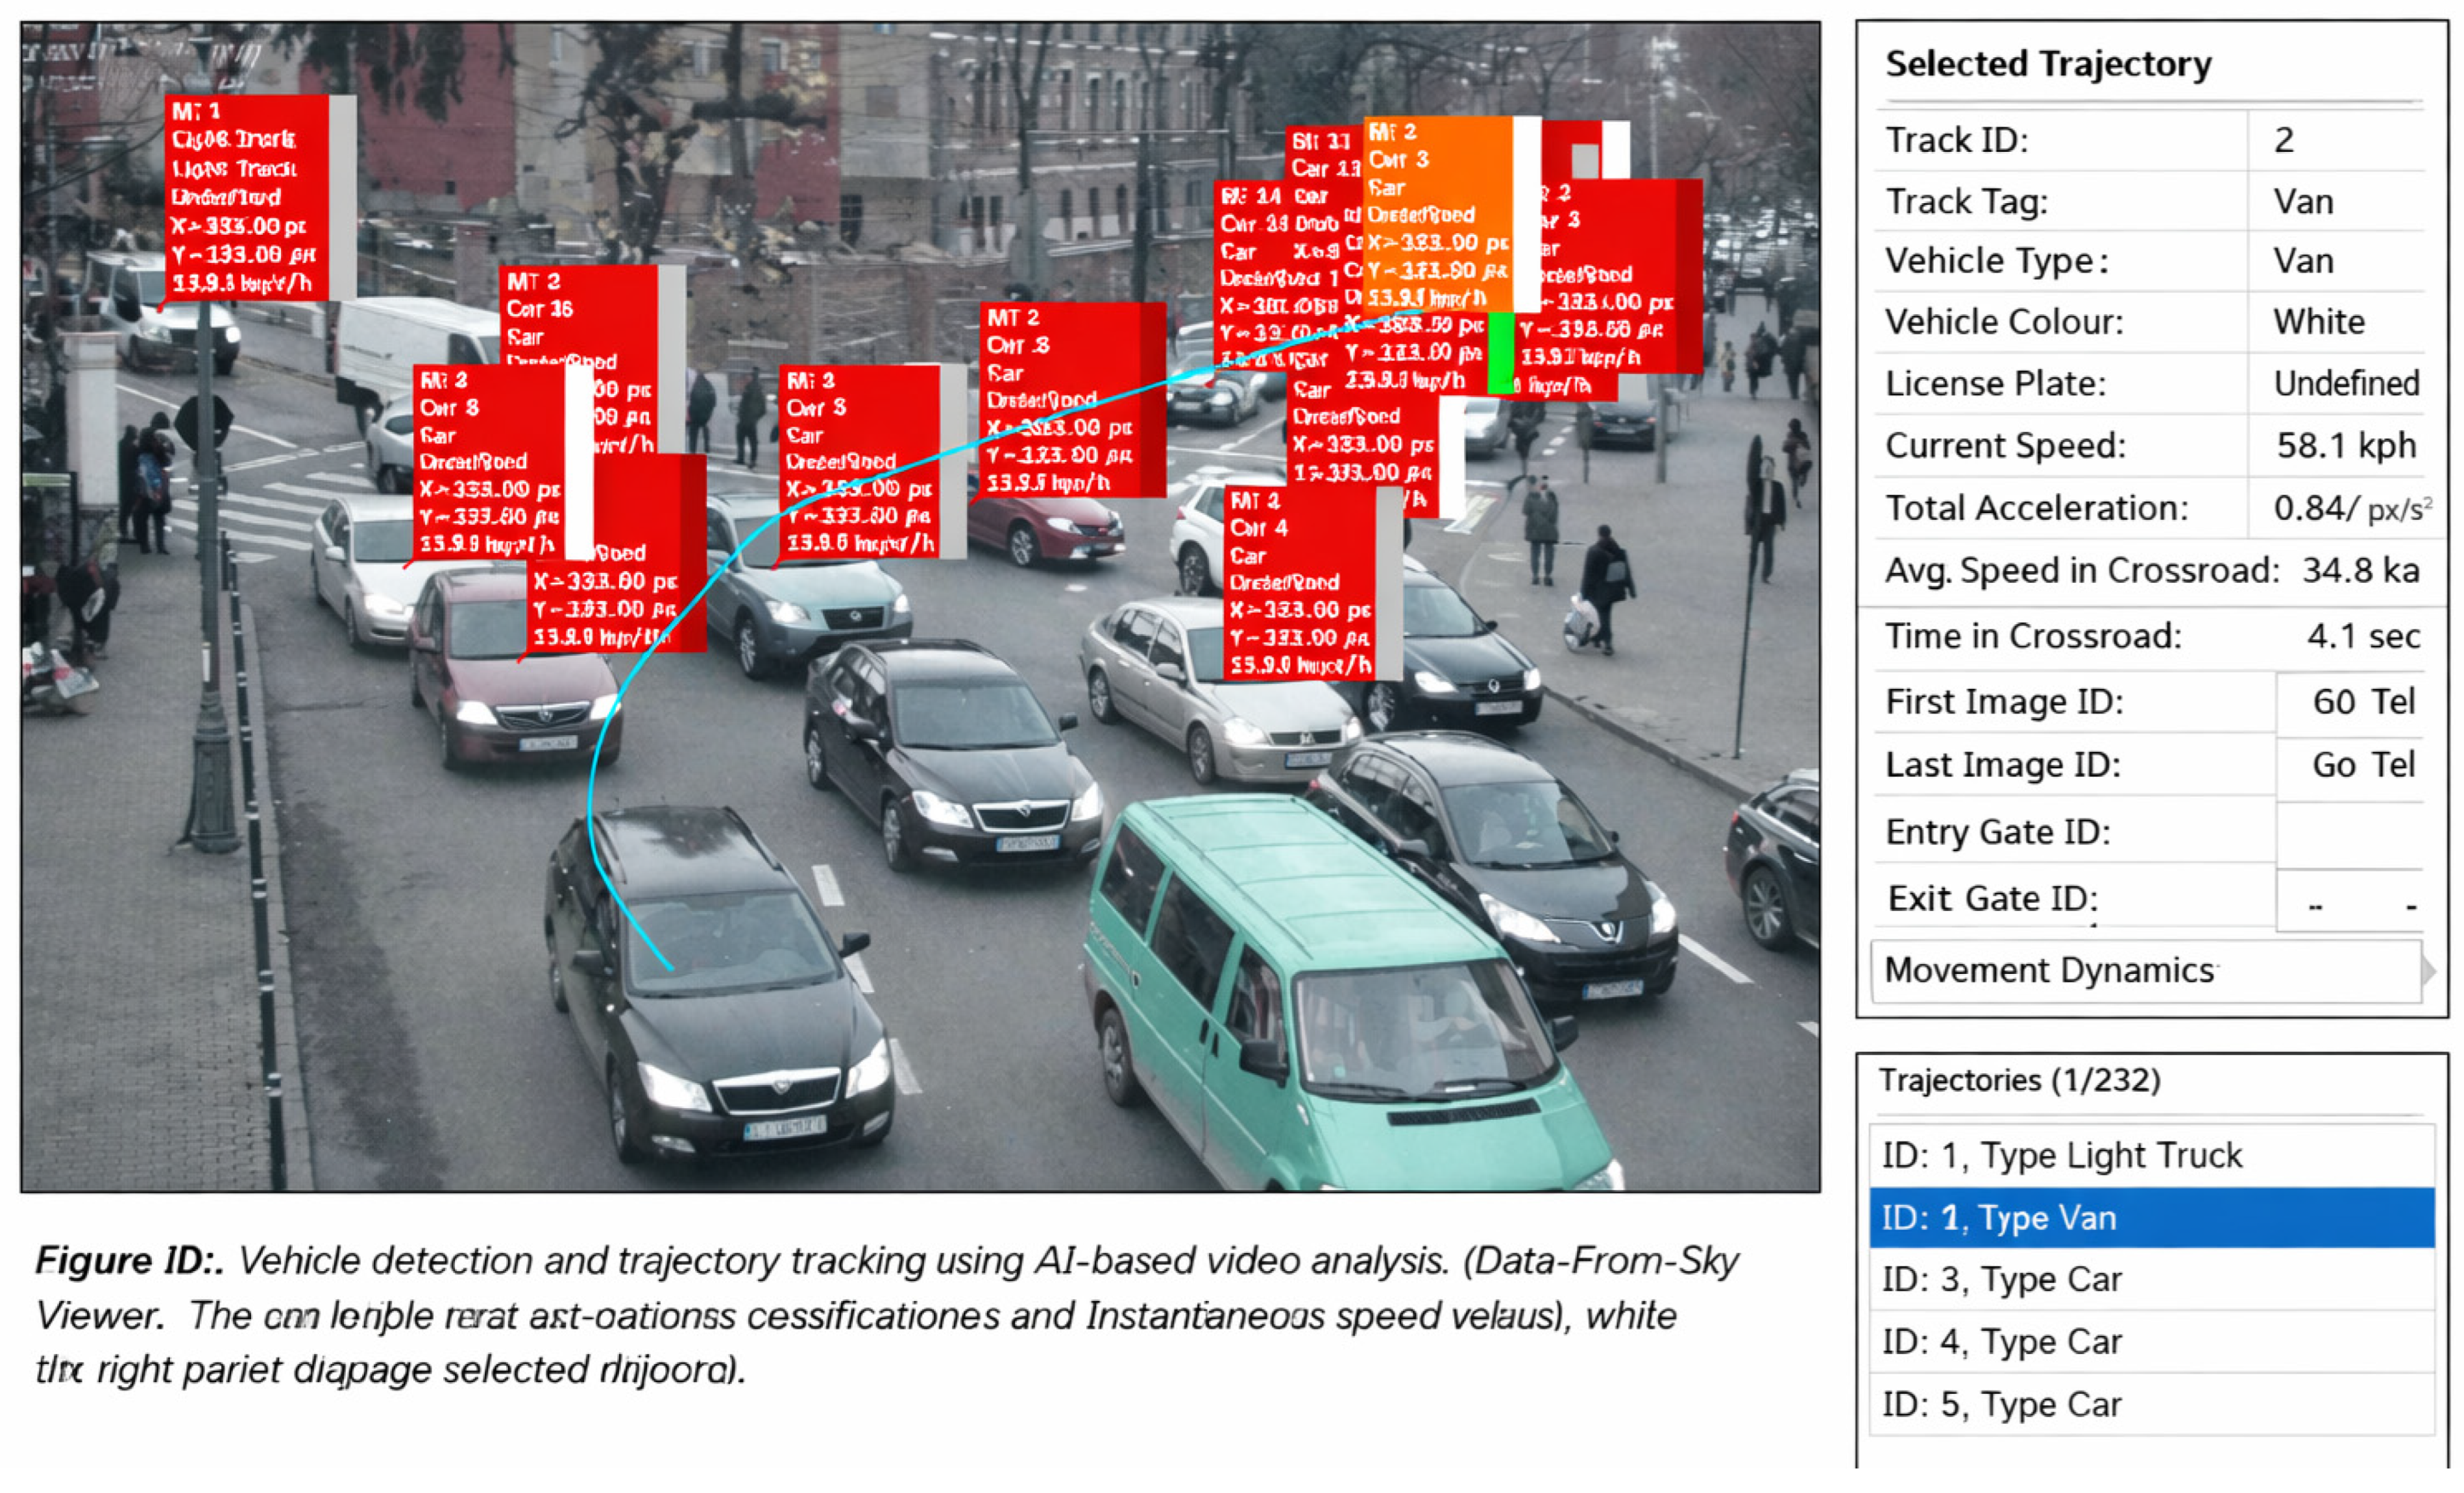
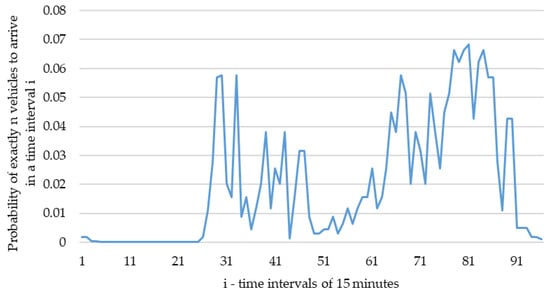
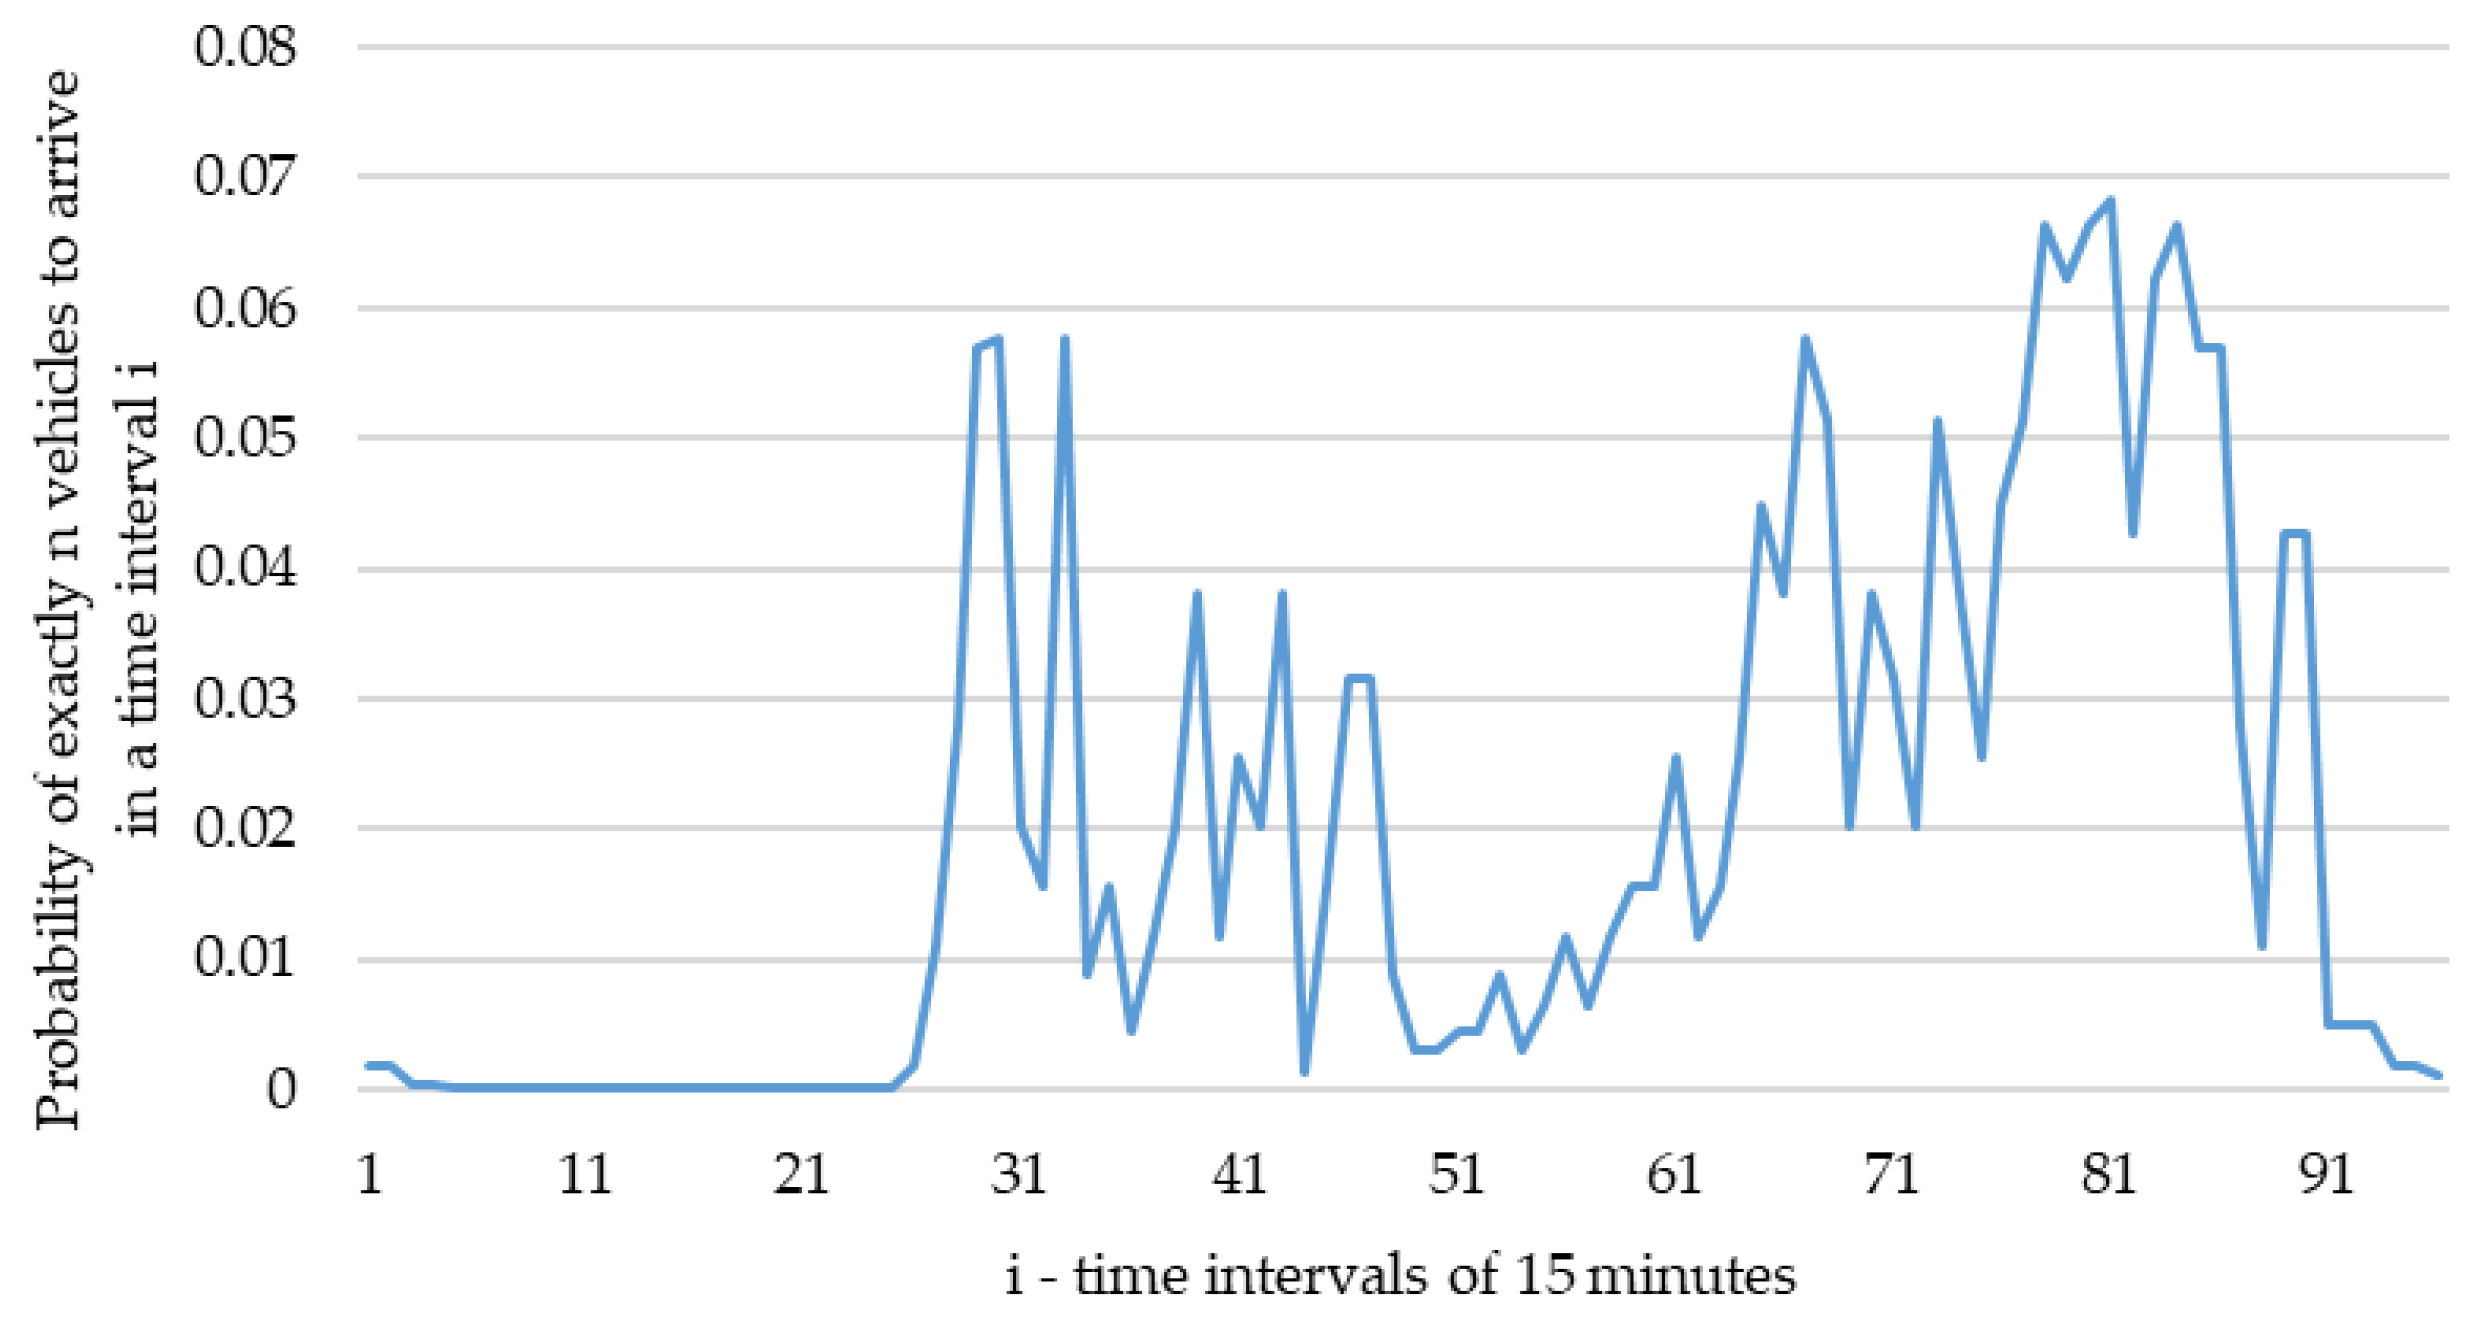
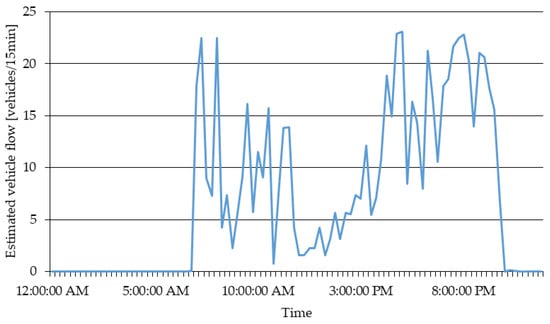
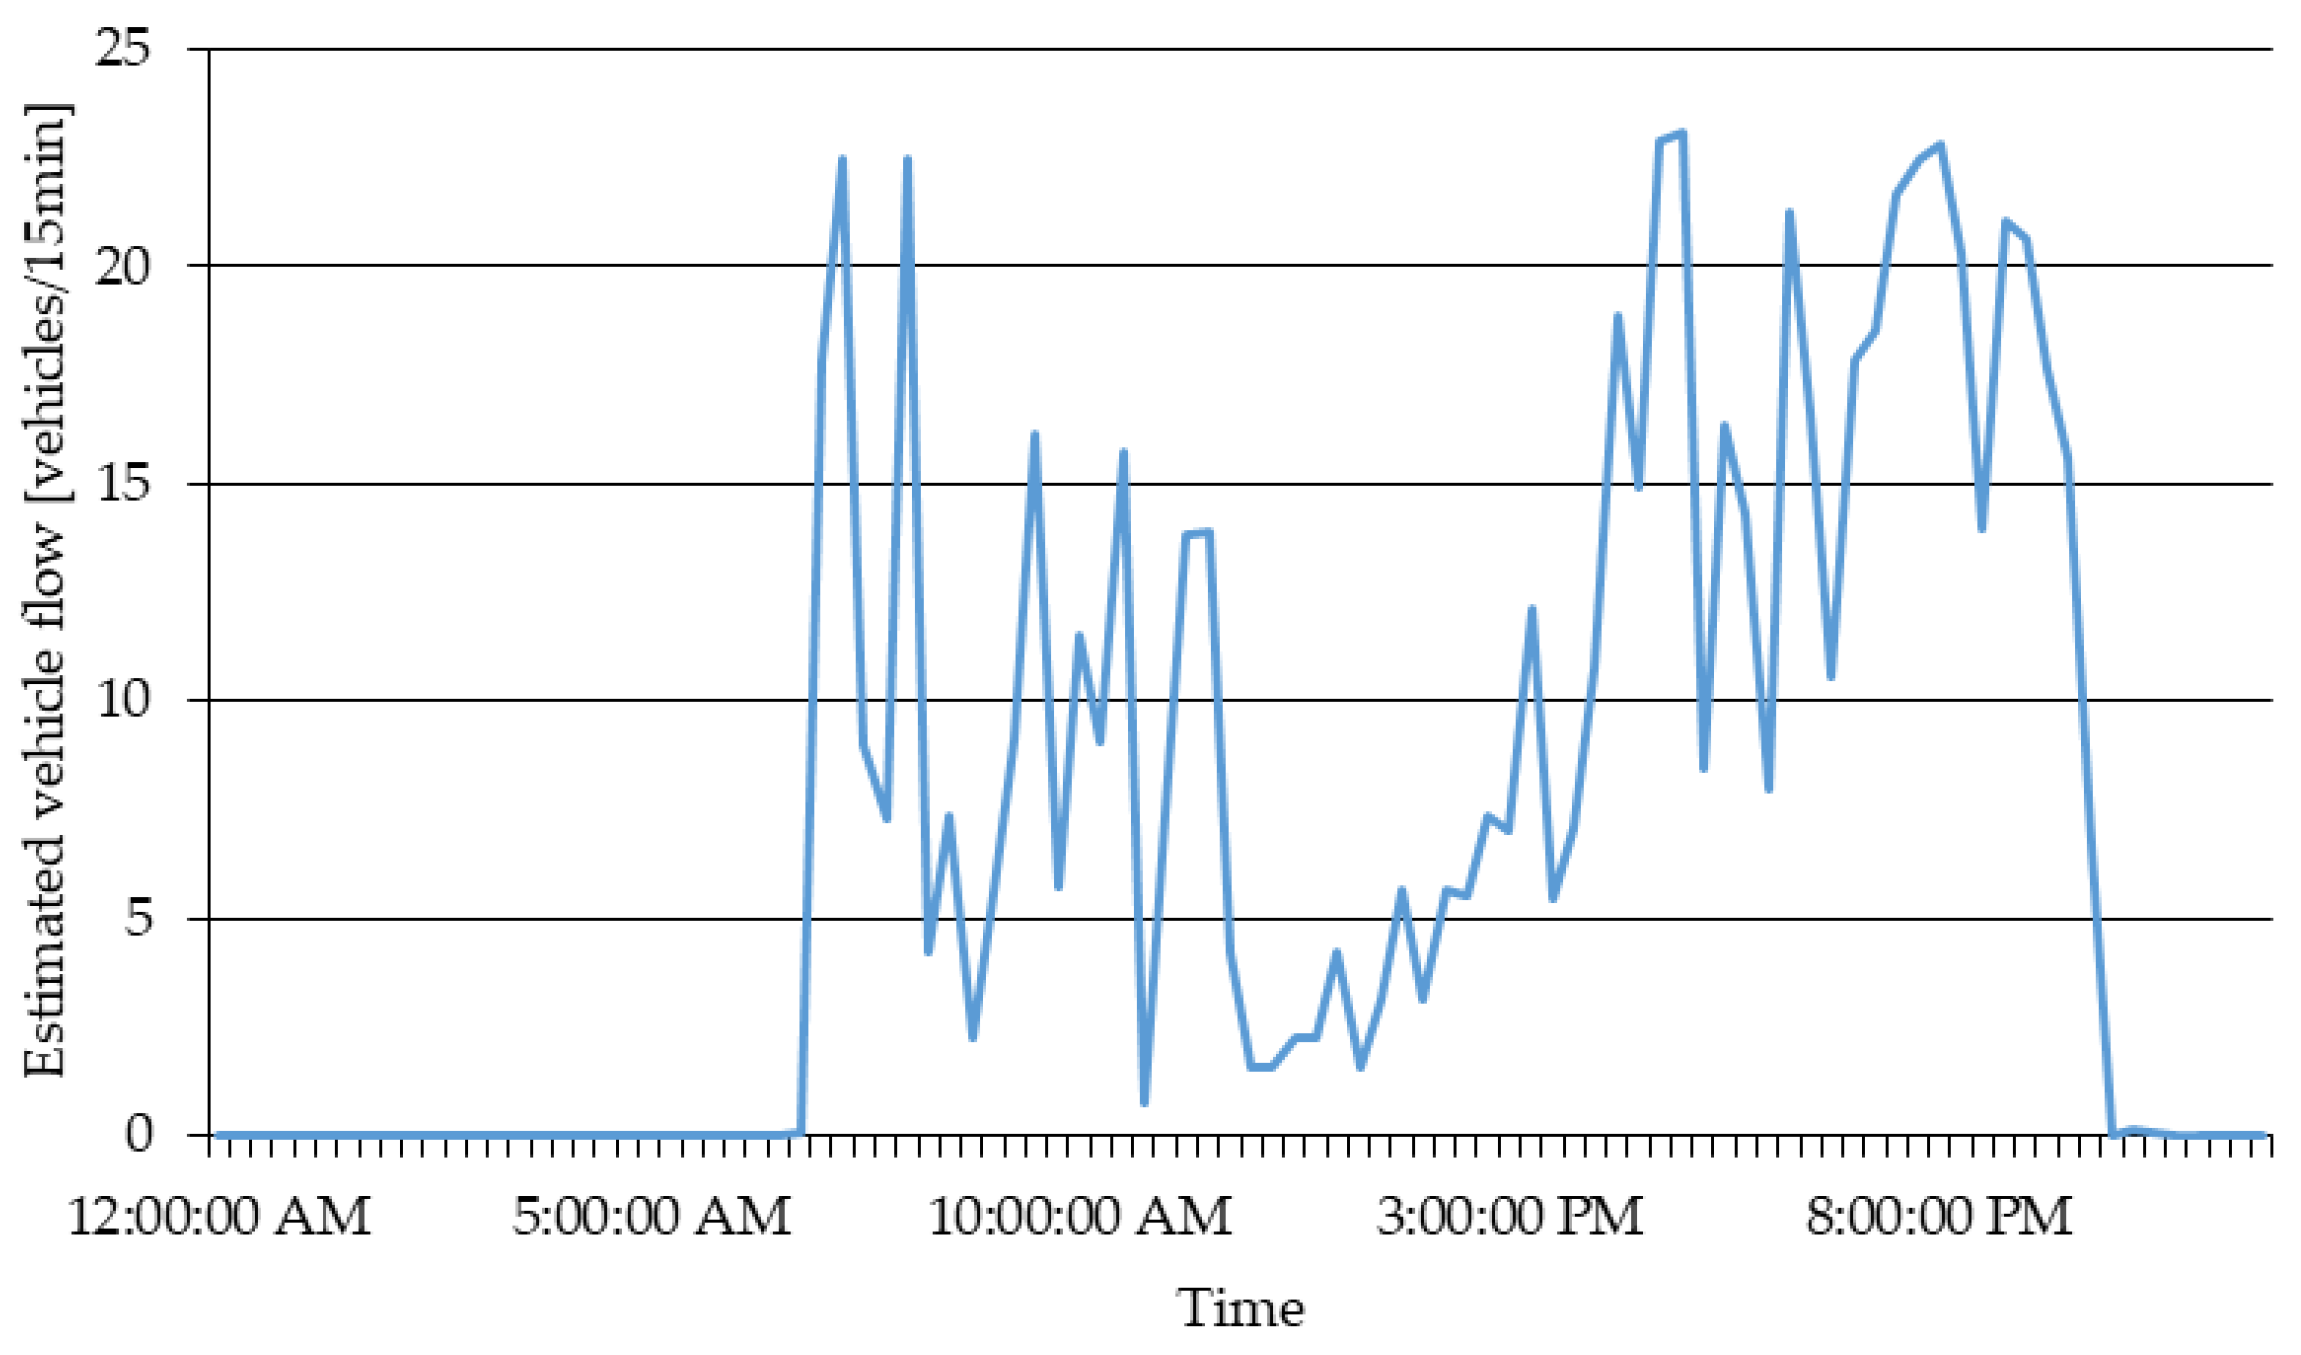
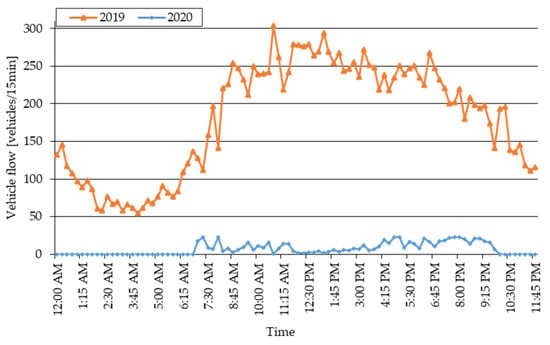
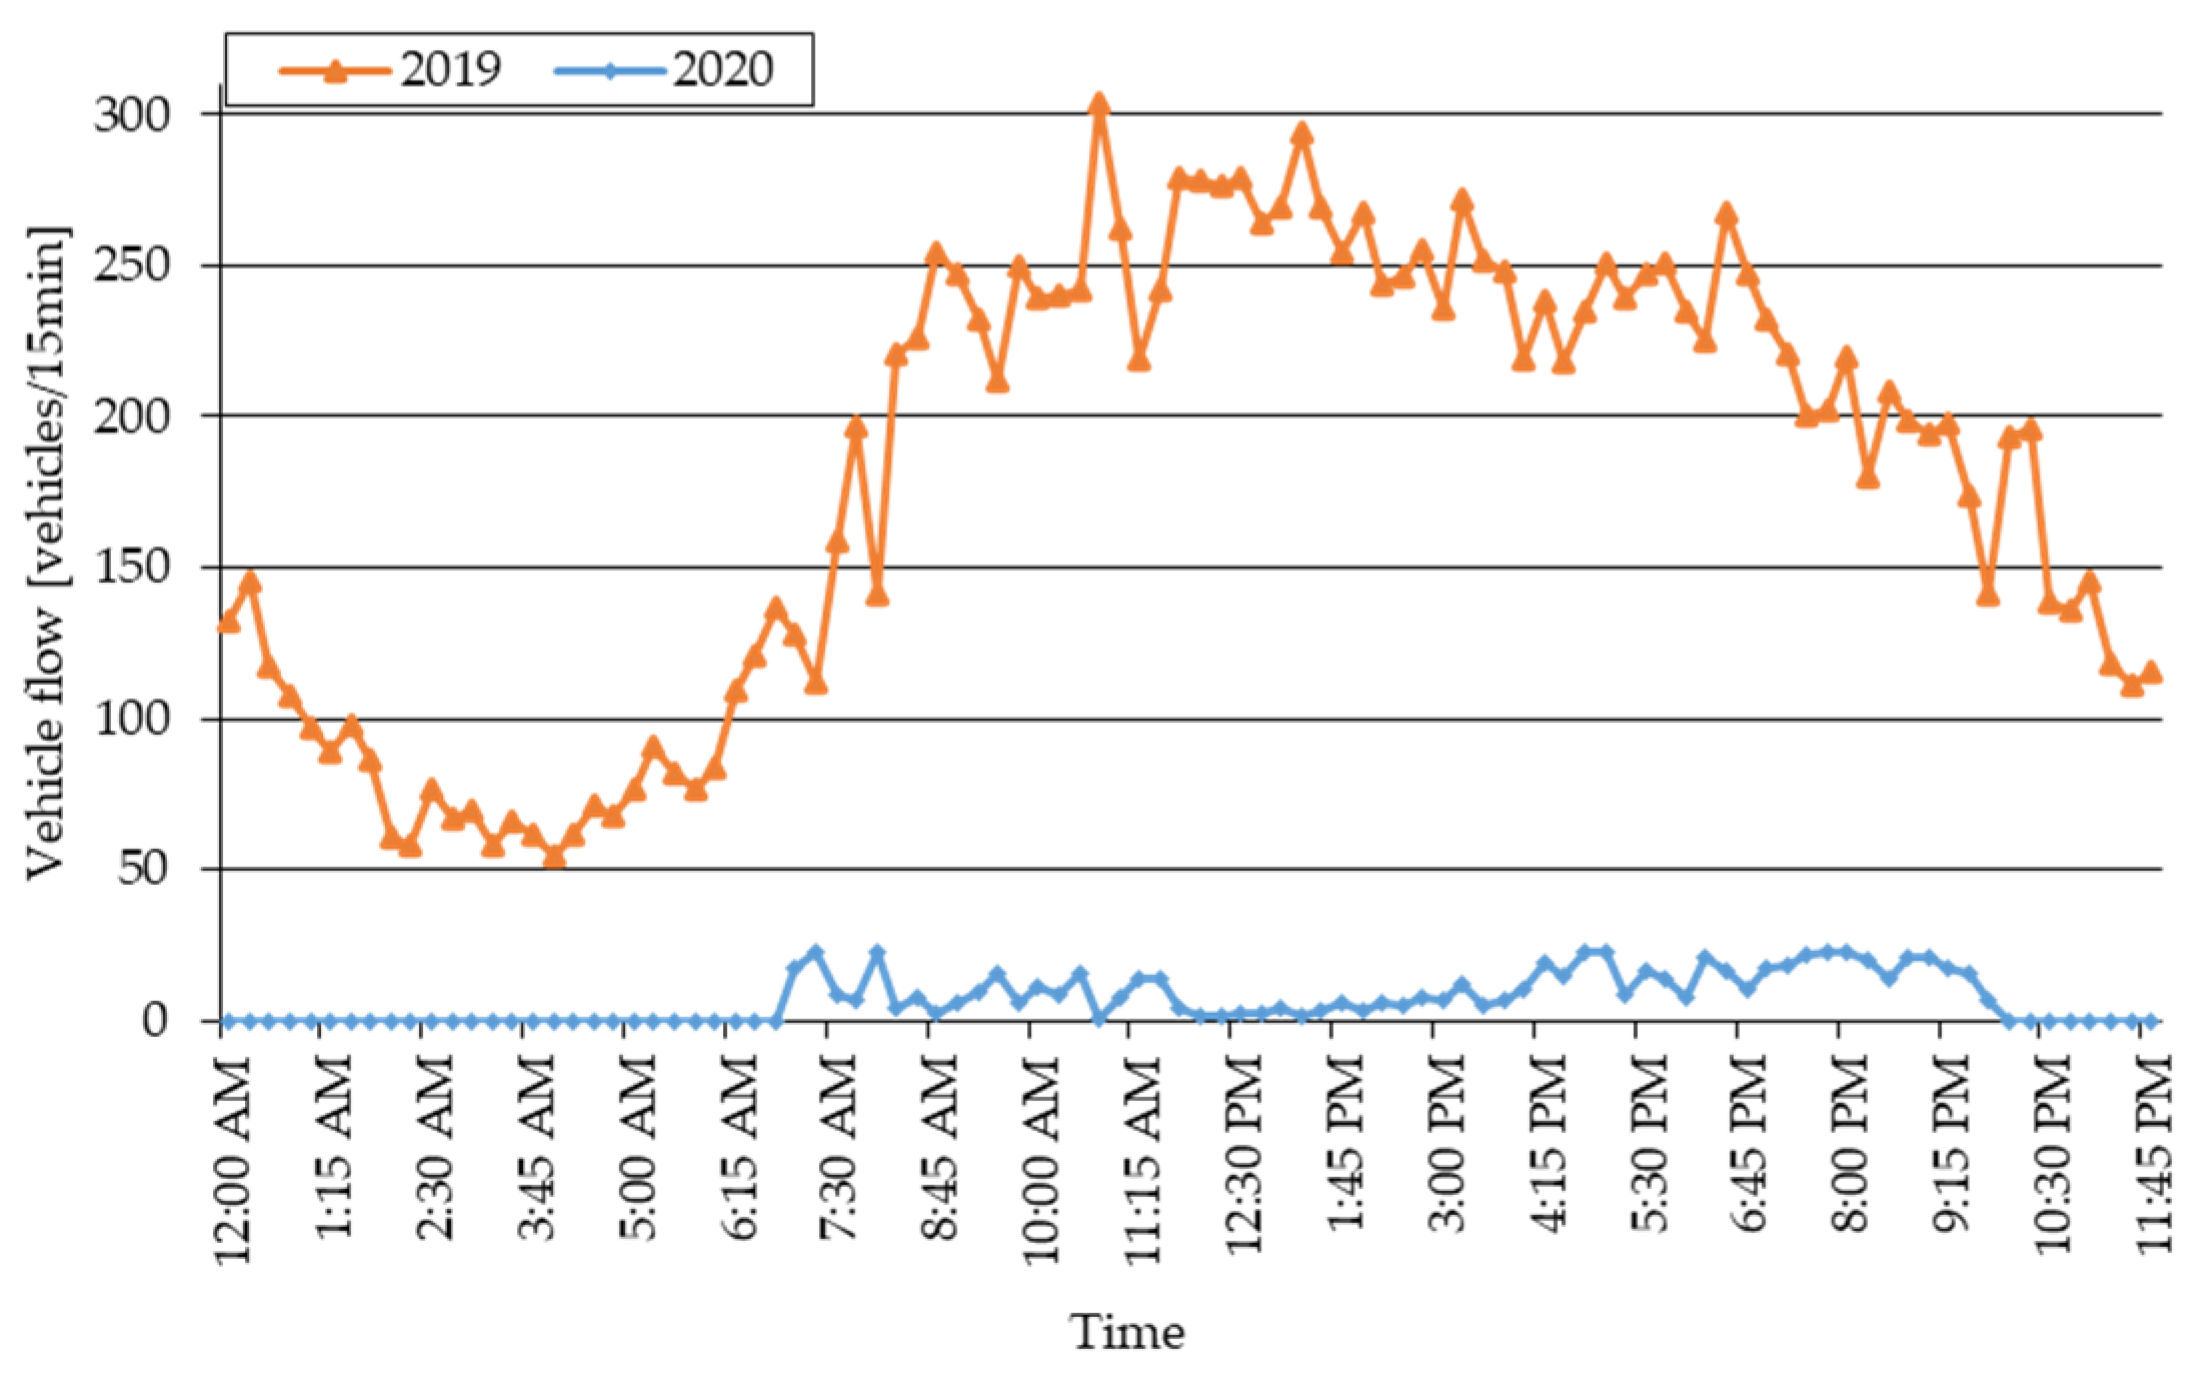

Disclaimer/Publisher’s Note: The statements, opinions and data contained in all publications are solely those of the individual author(s) and contributor(s) and not of MDPI and/or the editor(s). MDPI and/or the editor(s) disclaim responsibility for any injury to people or property resulting from any ideas, methods, instructions or products referred to in the content. |
© 2026 by the authors. Licensee MDPI, Basel, Switzerland. This article is an open access article distributed under the terms and conditions of the Creative Commons Attribution (CC BY) license.