Abstract
This paper presents an experimental study of the Automatic Emergency Braking (AEB) system, focusing on three essential testing phases: verifying the match between calculated and actual brake actuator operation time, validating the forecasted vs. real-time stabilized deceleration onset duration, and comparing the theoretically computed braking distance derived from mathematical models with its actual measurement. Standard instrumentation coupled with an original test procedure was utilized during the experiments. A full-scale experimental campaign was conducted on a specialized proving ground, thus substantiating the validity and robustness of the computational models used for assessing the AEB system parameters. The empirical outcomes confirmed that current-generation AEB systems offer dependable predictions regarding braking dynamics and exhibit prompt responsiveness to imminent collisions. However, it should be noted that variations in road conditions, driver behavior, and sensor precision may affect their performance. Consequently, additional efforts aimed at optimizing existing AEB solutions are required to minimize potential errors and enhance overall reliability. Finally, the significance of complying with design specifications and continuously upgrading AEB systems to meet evolving road safety standards is emphasized.
1. Introduction
The automatic emergency braking system is one of the most promising ways to improve traffic safety. Bosch data shows that in Germany, up to 72% of rear-end collisions involving people could have been prevented if all cars had been equipped with AEB [1]. Studies conducted within the framework of the European New Car Assessment Program (Euro NCAP) have shown that the introduction of AEB will reduce the total number of accidents by 38% [2]. The economic effect of the introduction of these systems is also important—with a decrease in the number of accidents, the total amount of insurance payments will decrease.
Automatic emergency braking and lane-keeping systems are evaluated in the ratings of the European New Car safety assessment program Euro NCAP. Since 2014, new vehicles must be equipped with AEB if the producer seeks to be ranked as the highest 5-star. And since 2016, the maximum ranking also requires that the AEB has a function preventing collisions with a pedestrian.
In the United States, according to the agreements of 20 major manufacturers, almost all cars weighing up to 4.25 tons must be equipped with an automatic emergency braking system. At the same time, companies will have more time to adapt the technology for heavier machines of 4 to 5 tons—they must be equipped with a similar system by 1 September 2025 [3].
The significant potential and advantages of AEB systems in reducing accidents, as cited above, are fundamentally dependent on the operational reliability and accuracy of their underlying control models and algorithms [4,5]. These core components are responsible for critical estimations, such as the braking system response time, the time to achieve steady deceleration, and the braking distance. Incorrect estimation of these parameters can lead to fatal consequences in real road situations. Therefore, the undoubted benefits of AEB are contingent upon their robust performance, creating an urgent need for thorough experimental studies to confirm that the calculated parameters of AEB systems correspond to actual data obtained in real-world operating conditions.
While significant research efforts have been dedicated to modeling and analyzing braking dynamics in other transport domains, such as railway systems [6,7], the operational environment for automotive AEB presents distinct challenges. Studies in railway engineering often benefit from more controlled track conditions and longer braking distances, allowing for highly detailed longitudinal-vertical coupled dynamics models [6] and systematic investigations of brake system components [7]. In contrast, automotive AEB systems must operate in highly dynamic and unpredictable traffic environments, where factors like rapidly changing road adhesion, driver behavior, and the need for split-second decision-making are paramount. Consequently, while sophisticated models exist, their experimental validation under a wide range of real-world driving scenarios remains a critical and less-explored area. This study bridges this gap by focusing not on the development of a new theoretical model, but on the comprehensive experimental evaluation of an existing AEB system’s robustness and accuracy, comparing calculated parameters with empirical data across diverse road surfaces.
The central hypothesis of this study is that the key parameters governing AEB performance—namely the brake actuator response time, the time to achieve steady deceleration, and the resulting stopping distance—can be predicted with sufficient accuracy by offline mathematical models when compared to real-world measurements under a variety of road conditions.
The main purpose of this research is to conduct a set of experimental studies of the automatic emergency braking system and compare the calculated and experimentally obtained values of the following key parameters:
- −
- Operating time of the brake actuator;
- −
- Time to achieve steady deceleration;
- −
- Braking distance values.
While numerous mathematical models for AEB performance exist, their validation often relies on idealized testing conditions. The main purpose of this research is, therefore, to conduct a comprehensive experimental evaluation of an AEB system, focusing on the robustness and accuracy of its underlying models under a range of real-world driving scenarios. This study aims to bridge the gap between theoretical predictions and practical performance by comparing the calculated and experimentally obtained values of the following key parameters across different road surfaces.
Thus, this article is aimed at improving the accuracy and reliability of AEB systems, which will significantly reduce the number of accidents and improve road safety.
2. Materials and Methods
2.1. Overview of Current AEB Test Methods
2.1.1. Road Tests
The main type of AEB research is conducting road tests according to certain test scenarios. One of the most popular programs for testing and evaluating these systems is the European New Car Assessment Program (EuroNCAP). In this study, the Euro NCAP protocol was used as a foundational reference for designing the test scenarios due to its global recognition, comprehensive nature, and its role as a de facto industry standard, which facilitates the comparison of our findings with a wide range of published data and vehicle safety ratings.
The tests in the EuroNCAP assessment program are conducted according to the protocols of the provided test scenarios, which are designed to simulate the most common traffic collision situations. The collisions simulated include those with a car, an adult pedestrian, a child, and a cyclist. Car tests, when one car approaches another from behind, consider three scenarios:
- −
- The target car is stationary;
- −
- The target car is moving slower than the one being tested;
- −
- The target vehicle slows down smoothly and abruptly at various distances ahead of the test vehicle [8].
For the first two scenarios (stationary and slow-moving target vehicle), the tests are repeated for the left and right offset where the centerline of the target vehicle does not match the centerline of the vehicle under test.
Since 2020, testing automatic emergency braking systems has included another mandatory scenario. In this case, the tested car takes a turn (for example, to a secondary road), crossing the path of an oncoming car. During the test, the speeds of the vehicle under test and the approaching target change, with points awarded based on how effectively the AEB system detects an oncoming threat and stops the vehicle in a timely manner. Since during these tests, the sensors of the vehicle being tested can recognize various parts of the leading target vehicle, AEB testing and certification is carried out using a special Global Vehicle Target (GVT) remote-controlled layout shown in Figure 1.
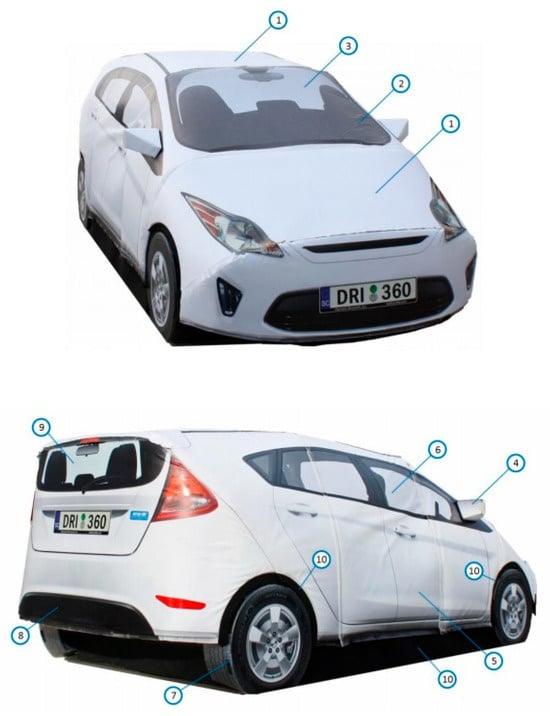
Figure 1.
Target car-targets for AEB tests.
This target is a prefabricated structure in the form of a passenger car. The IR reflectivity of the surfaces of which is indicated in Table 1 and should be in the wavelength range from 850 to 910 nm.

Table 1.
Reciprocating reflectivity.
In the described tests, the highest score is awarded to those car models whose automatic emergency braking systems can avoid a collision under test conditions or significantly reduce the consequences of an accident. At the same time, it should be borne in mind that the AEB is auxiliary, and the driver bears full responsibility for traffic safety. In more complex situations, the AEB may not be effective enough, or it may be triggered lately and will not completely avoid an accident, but the impact velocity can be significantly reduced. Effective protection of passengers remains critical to prevent serious accident consequences. At low speeds, when testing with a stationary target vehicle, only the operation of the automatic braking function is evaluated. This is because the test scenario simulates a common urban situation where a driver may be inattentive and fail to notice a stationary vehicle ahead until it is too late. In such cases, the system prioritizes immediate automatic braking over a driver warning, as any delay in deceleration could result in a collision that could otherwise be avoided [9].
When testing scenarios involve high speeds, a different type of target is used. In this case, the target vehicle is a kind of inflatable trailer towed by an auxiliary vehicle. The type of this target is shown in Figure 2.
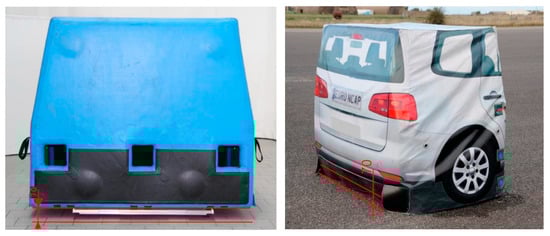
Figure 2.
Target for testing at high speeds.
There are 3 types of test scenarios for a moving target car: CCRs, CCRm, and CCRb. Scenarios according to EuroNCAP protocols check the AEB (automatic braking system) function and the FCW (collision warning system) function separately [10].
Table 2 below presents a gradation of speeds, distances, and decelerations according to these scenarios. The step of the tested function response speeds is 10 km/h. CCRs scenarios involve simulating a collision with a stationary target vehicle. CCRm scenarios involve simulating a collision with a uniformly moving target car. CCRb scenarios involve simulating a collision with a moving target vehicle that decelerates.
Table 2.
A gradation of speeds, distances, and decelerations according to scenarios.
For the experimental validation of the braking distance and timing parameters in this study, the fundamental “vehicle–stationary target” scenario (CCRs) was selected as the primary test condition. This scenario represents a critical and standardized use case for evaluating the core performance of an AEB system in a controlled yet representative environment.
Figure 3 shows a diagram for the gradation depending on the level of collision velocity compensation. For each color of the chart, the following coefficients are applied based on the test results:
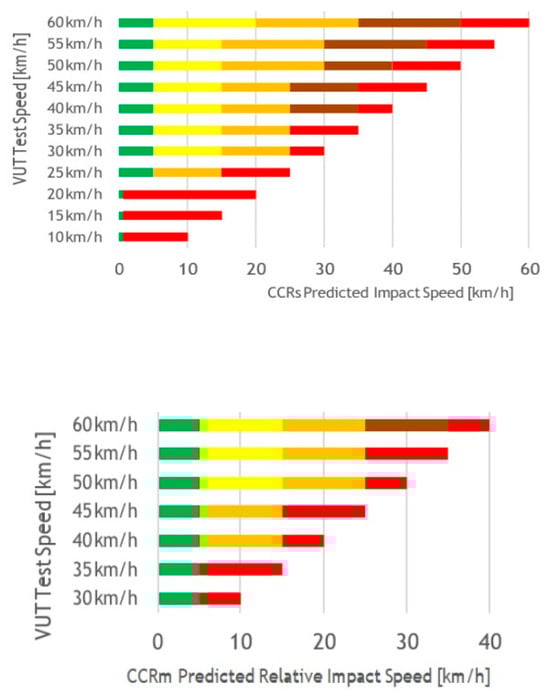
Figure 3.
EuroNCAP points distribution table.
Green zone 1.00
The yellow zone is 0.75
The orange zone is 0.50
Brown zone 0.25
Red zone 0.00
2.1.2. Tests with Pedestrians
To detect pedestrians, EuroNCAP checks three traffic accident scenarios in which a pedestrian crosses the path directly in front of the vehicle being tested. The pedestrian is walking in the same direction as the vehicle. Pedestrian speed is 5 km/h. The speed of the test vehicle is from 20 km/h to 60 km/h (Figure 4).
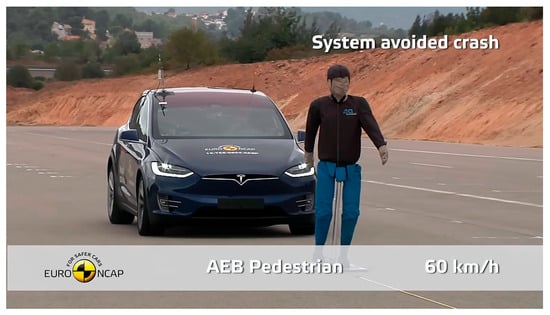
Figure 4.
AEB test with pedestrian.
There are 3 main scenarios in the Pedestrian Crossing the Road test:
A pedestrian crosses the road from right to left at a speed of 5 km/h;
A pedestrian runs across the road from left to right at a speed of 8 km/h;
A pedestrian or child crosses the road from right to left due to a parked car at a speed of 5 km/h [11].
The above tests are carried out at night with no street lighting on.
A new type of AEB testing using the EuroNCAP method is to test the system’s operation when performing a turn maneuver at an intersection. The system should detect and prevent a collision with an oncoming car when turning left, as well as avoid hitting a pedestrian when turning right (Figure 5) [12].
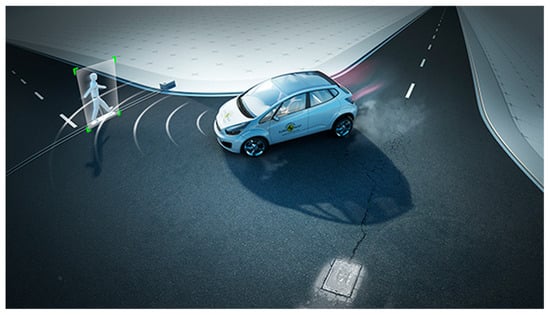
Figure 5.
Visualization of the AEB test when performing a turn maneuver at an intersection.
Car manufacturers participating in the AEB assessment tests according to EuroNCAP protocols finance 20 verification tests, and also have the opportunity to finance additional tests: 10 for AEB and 10 for FCW. The result is determined by the ratio of the test results to the results expected by the automaker initially. This ratio is a correction factor:
Correction factor = (real test score)/(the estimated score of the automaker).
The requirements for the external conditions of the EuroNCAP tests are almost ideal for the efficient operation of the system. The tests are carried out on a dry paved surface with a uniform slope of no more than 1% and a high coefficient of adhesion. The ambient temperature should be from 5 °C or above, no precipitation, visibility at least 1000 m [13].
Undoubtedly, under such external conditions, AEB can have high performance, but in real conditions, and especially in difficult road and climatic conditions in Russian regions, such a testing system cannot measure the real efficiency of the system. Even small changes in weather conditions such as rain can increase the braking distance of a car by several meters, which renders preventing a collision impossible.
Based on the climatic and road conditions of vehicle operation in Russia, a national system for testing automotive safety systems called RuNCAP is being created. A four-party agreement was signed on 9 November 2018 by Rosstandart, NAMI, Autoreview and MADI.
The RuN CAP tests will be conducted voluntarily and according to standards that take into account the specifics of transport operation in the Russian Federation. RuNCAP will form a national rating of vehicles that have passed confirmation of compliance with increased safety requirements [14,15,16].
Tests conducted under the RuNCAP protocols should have sophisticated system tests that are as close as possible to the actual operating conditions of vehicles and account for the specifics of the Russian climate zone.
2.2. The Methodology of Conducting Tests in the Framework of the Current Study
Four stages were included in the tests to evaluate the effectiveness of the AEB algorithm.
At the first stage, we determine the correspondence of coefficients depending on the design features of the brake system under study.
The second stage is testing if the predicted coefficient of adhesion to the bearing surface corresponds to the actual one. The external experimental conditions for testing were chosen so they were as close to everyday operating conditions as possible and included:
- −
- A section of road with dry asphalt;
- −
- A section of road with wet asphalt;
- −
- A section of road with packed snow.
The third stage tested the operation of the AEB, taking into account all the correction factors in soft target collision tests.
The fourth stage tested the operation of the AEB on public roads in various conditions, including in difficult road and climatic conditions of the Far north, to assess the effectiveness and reliability of operation in daily use.
The formula for calculating the stopping distance has the form
In this context, the term “calculated” values refers to the results obtained from this offline mathematical model. These pre-defined calculations are then validated against experimental data, as opposed to being derived from a real-time simulation running concurrently with the test.
This formula contains variables and parameters that depend on the design features.
Where
—the calculated stopping distance.
—the predicted tire–road adhesion coefficient.
—the acceleration due to gravity.
—the brake actuator operation time.
—the vehicle speed at the moment of braking initiation.
—a correction factor for the brake actuator operation.
—the time to achieve steady deceleration.
—a correction factor for the deceleration build-up time.
—the total system response time.
Modeling Assumptions and Rationale.
The mathematical model presented in Equation (1) is a core, real-time capable model representative of the logic used in production AEB electronic control units (ECUs) for immediate risk assessment and braking decision-making. We acknowledge that more elaborate high-fidelity simulations, which incorporate tire characteristics (e.g., Pacejka model), dynamic load shift, and suspension dynamics, are possible and are powerful tools for vehicle design and offline analysis. However, such models are computationally intensive and are not typically deployed for the millisecond-level, online calculations required by a safety-critical system like AEB. The model in Equation (1) was therefore selected for validation because it captures the dominant dynamics—brake system response and tire–road adhesion—that are fundamental to AEB performance prediction. This level of simplification, which also omits secondary factors like air resistance and rolling resistance, is a deliberate and established practice for this application domain, as it balances sufficient accuracy with the computational efficiency and robustness required for real-time operation. The primary goal of this study is not to propose a new complex model, but to validate the practical accuracy of this class of embedded models against real-world data.
The objectives of the experimental study are as follows:
- −
- To verify that the estimated operating time of the brake actuator corresponds to the actual one ();
- −
- To verify that the actual coefficient of adhesion to the roadway corresponds to the predicted value of ;
- −
- Checking whether the predicted time to achieve steady-state deceleration corresponds to the actual time ();
- −
- Verification of the correspondence of the calculated stopping distance to the mathematical model and the stopping distance obtained experimentally.
The following indicators were selected as indicators characterizing the effectiveness of the coupling coefficient prediction algorithm, allowing for an objective comparative assessment:
—speed at which braking was activated;
—measured steady-state deceleration value;
—predicted steady-state deceleration value;
—predicted coefficient of tire adhesion to the bearing surface (calculated using a forecasting algorithm).
—actual coefficient of adhesion of the tire to the bearing surface.
The relationship between deceleration and the adhesion coefficient is fundamental to this assessment. The predicted steady-state deceleration is given by
Conversely, the actual coefficient of adhesion is derived from the measured steady-state deceleration:
It is important to note that this physical model, which equates deceleration to the product of the adhesion coefficient and gravity, is applicable under the key assumption that the braking force is sufficient to operate the tire at or near its adhesion limit, thereby maximizing deceleration. This is the intended operational state for an effective AEB intervention.
The proposed parameters should fully reflect the main performance indicators of the system.
The correspondence of the predicted stopping distance to the actual one under various external conditions, taking into account dynamically changing external factors, was taken as an indicator of the effectiveness of the synthesized AEB functioning algorithm.
The variables and constant parameters used in the braking distance calculation (Equation (1)) and the subsequent analysis are summarized in Table 3.
Table 3.
Model parameters and variables.
2.2.1. Tire–Road Adhesion Coefficient Forecasting Algorithm
The predicted coefficient of tire adhesion to the bearing surface () is a critical input for the AEB system’s stopping distance calculation. The forecasting algorithm used in this study is based on a rule-based logic that synthesizes data from multiple vehicle sensors in real-time. The algorithm does not rely on a single direct measurement but infers the most likely adhesion level from a set of available signals.
The primary inputs to the forecasting algorithm are the following:
- −
- ESP/ABS activity: the frequency and intensity of interventions from the Electronic Stability Program and Anti-lock Braking System. High activity, especially during normal driving, is a strong indicator of a low-adhesion surface (e.g., snow, ice).
- −
- Wheel speed sensors: differences in rotational speed between driven and non-driven wheels, indicating wheel slip.
- −
- Longitudinal acceleration sensor: the actual deceleration of the vehicle during gentle braking maneuvers, compared to the commanded brake pressure.
- −
- Ambient temperature and precipitation data: signals from the rain/light sensor and the external temperature sensor. The presence of precipitation (rain/snow) coupled with low temperatures (near or below 0 °C) directly lowers the initial adhesion estimate.
- −
- Wiper status: the intensity of the windshield wiper operation serves as a proxy for rain intensity.
- −
- Historical data: the recent history of the aforementioned parameters over the last few seconds of driving.
The algorithm operates by assigning a base value of (typically ~0.8–0.9 for dry asphalt) which is then progressively scaled down by correction factors based on the inputs. For instance, if the ambient temperature is below 2 °C and the rain sensor is active, the base value is significantly reduced. This preliminary estimate is then further refined and validated against the vehicle’s dynamic response (e.g., if the measured deceleration during a minor brake application is lower than expected for the current base value, is adjusted downwards). The final output is a filtered and validated estimate of that is updated continuously and supplied to the AEB control logic.
2.2.2. The Object of Research
The object of the research was one of the working prototypes created within the framework of the Experimental Manufacturing Plant (EMP) of the Russian State Scientific Centre Federal State Unitary Enterprise «NAMI» (Figure 6). It is important to note that the term “working prototype” here refers to the vehicle platform itself. The AEB system installed on this prototype, however, constitutes a current-generation system. It is implemented using series-production, state-of-the-art hardware components (front radar, front camera, intelligent control unit) and employs algorithms and performance targets that are representative of, and comparable to, those used in modern mass-produced vehicles (Figure 7). Therefore, the findings of this study are directly relevant to the performance assessment of contemporary AEB technology. The prototype is equipped with a hydraulic brake drive featuring a pre-installed hardware set for Automatic Emergency Braking (AEB).

Figure 6.
Appearance of the test object.
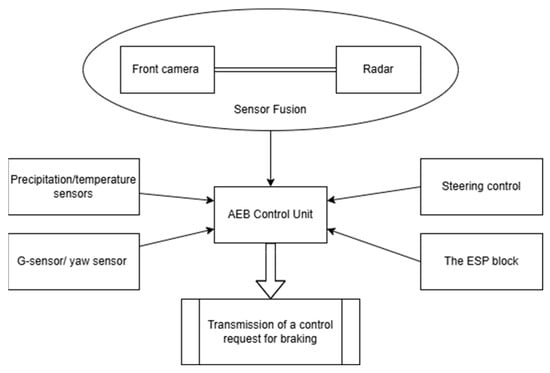
Figure 7.
Schematic representation of the composition of AEB: front camera (object recognition), front radar, intelligent driver assistance control unit, and standard vehicle sensors including precipitation/temperature sensors (rain and temperature monitoring), G-sensor/yaw sensor (skid detection), and ESP block (anti-lock braking system functionality). Data acquisition through the ESP block enables recording of braking parameters.
The characteristics of the test sample are shown in Table 4.
Table 4.
Characteristics of the test sample.
The test vehicle was equipped with a complete set of automatic emergency braking systems: a front object recognition camera, a front radar, an intelligent driver assistance control unit, and the operation of the vehicle’s standard sensors (rain sensor, wiper intensity, temperature, skid detection sensor, and anti-lock braking system) was checked.
2.2.3. Measuring and Recording Equipment
Since the main parameters required for analysis are the speed and acceleration of the car, one of the most commonly used devices for recording data in this format is the racelogic VBOX. This device has the ability to connect to the CAN bus and has a GPS connection with a refresh rate of up to 100 Hz.
The ESP system is installed on the test vehicle, which has a wide range of parameters: the rotation speed of each wheel, longitudinal and lateral accelerations, vehicle speed, etc. Since the test vehicle has the ability to connect to control units, as well as access to ESP parameters, it is possible to simplify data recording and trial tests were performed to select the recording option. the investigated parameters.
A Vector VN 1630 adapter and a laptop were used to connect to the vehicle CAN bus.
To compare the accuracy of the recorded data and the choice of recording device, braking was performed on dry, flat asphalt at 80 km/h. The deceleration value was chosen as the main criterion for evaluation. Figure 8 and Figure 9 show graphs of the recorded data. As you can see in the upper graph of Figure 8, the deceleration value from the racelogic VBOX has a noise value of about 0.2 m/s2. Figure 9 shows the deceleration graph recorded from the ESP unit using Vector VN 1630. The noise of the deceleration value is also at the level of 0.2 m/s2.
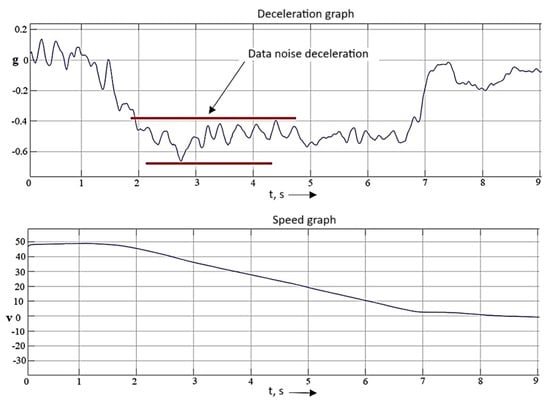
Figure 8.
Fragment of recorded data using Racelogic.
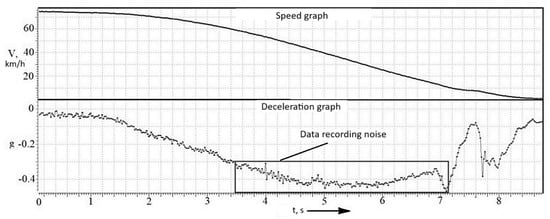
Figure 9.
Fragment of recorded data using VN 1630.
Based on the tests of the recording equipment, it was found that the recording of values from the ESP unit has sufficient accuracy to carry out the necessary tests. Based on this, the following equipment was used:
- −
- Recording equipment—Vector VN 1630, laptop.
- −
- Program for processing recorded data—Canalyzer v 9.0
Registered parameters:
- −
- Vehicle speed;
- −
- Speeding up the car;
- −
- Brake circuit pressure;
- −
- Request for braking.
2.2.4. Determination of the Minimum Number of Repeated Experiments
To determine the minimum number of races, a preliminary experiment, consisting of 7 measurements of the recorded values was conducted. Based on the results of preliminary measurements, the minimum number of races was determined so that repetition would allow measurements to be carried out with a confidence probability of at least
Calculation of the standard deviation:
where is the arithmetic mean of the parameter at a given time:
where is the value of the parameter in the i-th measurement; n is the number of trial runs.
The number of repeated experiments is determined by the formula
where —Coefficient of Student’s t-distribution at confidence probability. = 0.97, n = 3, = 2.57.
To provide the specified accuracy of the experiment, we assume = 3.
3. Results
3.1. Tests to Verify the Compliance of AEB Performance Forecasting Depending on the Installed Active Safety Configuration
Depending on the design features of vehicles, various braking mechanisms are used [17].
The most common type of a braking mechanism is a hydraulic system with a disk friction surface located on the vehicle wheel.
The response time of a hydraulically operated brake system with disk brakes can range from 0.2 to 0.4 s, depending on the condition of the hydraulic line, the condition of the brake fluid in the system, and the performance of the installed hydraulic unit. On average, this value is assumed for 0.2 … 0.3 s on a serviceable braking system [18].
The formulas given earlier for determining the braking time and braking distance of a car do not take into account a number of design and operational factors that significantly affect braking performance. Therefore, in reality, the values of the braking time and path can be 20–30% higher than those calculated using these formulas.
The braking efficiency coefficient is used to coordinate the results of theoretical calculations with the operational data [19]. It accounts for the disproportionality of the braking forces on the wheels to the loads on the wheels, as well as wear, adjustment, oiling and contamination of the braking mechanisms. This coefficient shows how many times the actual deceleration of a car is less than the theoretical maximum possible on a given road.
Since the parameter depends on the design features of a particular braking system, the dependence represented by the formula will be valid for calculating the delay time of the brake actuator:
—efficiency coefficient of the braking system.
= 1 … 1.2—for passenger cars with hydraulic braking system.
= 1.3 … 1.5—for trucks and buses with pneumatic braking system.
Brake systems with hydraulic drive and disk brakes may also differ in their configuration [20]. Brake system manufacturers use so-called “pre-filling” in the braking system to increase the efficiency of emergency braking systems and reduce the delay of . It is the installation of a small pressure in the brake line when it is likely that the AEB braking system will need to be activated, which allows the pads to be brought to the brake disk, but there is still no deceleration [21]. Due to the preliminary increase in pressure in the braking system, several positive points are achieved at once:
- −
- The pressure value corresponding to the beginning of deceleration of the vehicle is reached in a short time;
- −
- The pads are connected to the brake disk;
- −
- The water layer is removed from the surface of the brake disk, if it was present.
As an experimental study, the AEB system was tested on a passenger car with a hydraulic braking system and disk brakes. The braking system of the tested vehicle provides for the possibility of operating an automatic emergency braking system with both a preliminary increase in pressure in the braking system and a standard algorithm without a preliminary increase in pressure.
During the experiment, 3 test decelerations of the standard operation of the system and the pre-filled algorithm were carried out. The data is recorded by connecting to the vehicle’s CAN bus via a Vector VN 1630 adapter and a laptop.
The following parameters were recorded:
- −
- Submitting a deceleration request to the vehicle’s braking system;
- −
- The pressure value in the hydraulic brake system;
- −
- The value of vehicle deceleration.
The result of the experiment is shown in Figure 10.
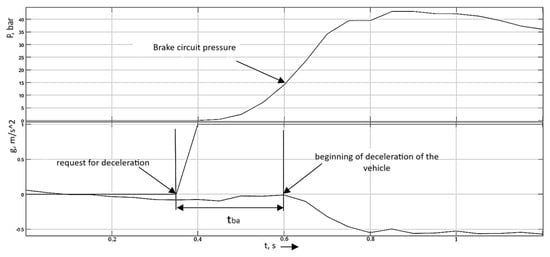
Figure 10.
Test without prior pressure increase in the braking system.
From the results of this experiment, the values of were obtained as shown in Table 3.
The next stage of the experiment was to conduct a test with a preliminary increase in pressure in the hydraulic circuit of the braking system. The schedules for this test are shown in Figure 11. The figure shows the start time of the pressure increase for the purpose of pre-filling, as well as the start time of deceleration at the request of the automatic emergency braking system.
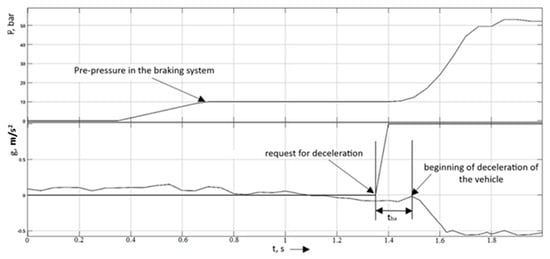
Figure 11.
Test with a preliminary increase in pressure in the brake circuit.
The results of the tests performed with a preliminary increase in pressure in the vehicle brake circuit are shown in Table 5.
Table 5.
Results of experimental studies to verify the compliance of AEB performance forecasting depending on the installed active safety configuration.
As a result of the tests, the results of reducing the operating time of the brake actuator were obtained. The values are shown in Table 6.
Table 6.
The result of reducing the time before the start of vehicle deceleration.
The results of the experiment evidentiate that depends on the efficiency coefficient of the braking system , which increases with lower efficiency of the braking system (increasing ), and increases. Therefore, the dependence is valid when used in calculations of predicting the braking distance of an automatic emergency braking system.
Based on the values of for trucks and buses with pneumatic braking systems [22], an even greater increase in time is predicted by 20–40%, relative to the hydraulic systems of passenger cars [23]. Such parameters can seriously affect the prediction of braking distance in the mode of operation of the automatic emergency braking system. For example, at a vehicle speed of 90 km/h, an increase in the parameter by 0.2 s corresponds to an increase in the braking distance of the vehicle by 5 m. If the variable in the calculations of the AEB algorithm is used as an average value that does not account for the design features of the braking mechanism, then if the brake actuator is not applied in time, there may be too much error in the calculations of the braking distance, which may lead to a collision.
3.2. An Experimental Study on the Correspondence of the Predicted Time to Achieve Steady Deceleration to the Actual One
In this experiment, braking tests were performed and the characteristic of the time to achieve steady-state deceleration was considered [24]. The experimental value obtained was checked for compliance with the calculated characteristic of the mathematical model of deceleration .
3.2.1. A Test of the Experimental Verification of the Dependence at a Value of φ Corresponding to Movement on a Rolled Snow Surface
Weather conditions: Ambient temperature −5.0 °C, high-intensity precipitation, ABS activation in the current driving cycle.
Road surface: Packed snow, no slope.
Speed: 60 km/h.
When testing on a packed snow surface, the predicted time to achieve steady deceleration and the actual time has a maximum discrepancy of 0.04 s. Results are presented in Table 7 and Figure 12.
Table 7.
Simulation results of the value and the experimental value on a snow surface.
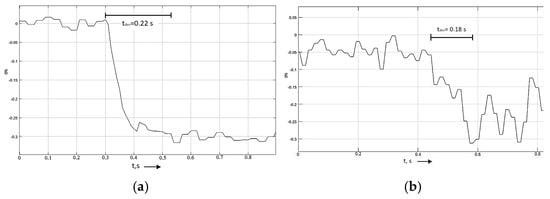
Figure 12.
(a) The dependence of the time to achieve steady deceleration when simulating deceleration on a rolled snow surface. (b) Dependence of the time to achieve steady deceleration during experimental braking on a snow surface.
3.2.2. A Test of the Experimental Verification of the Dependence at a Value of φ Corresponding to Movement on a Wet Asphalt Surface
Weather conditions: Ambient temperature +15 °C, high-intensity precipitation.
Road surface: Wet asphalt concrete, no slope.
Speed: 60 km/h.
When testing on wet asphalt surfaces, the predicted time to achieve steady deceleration and the actual time has a maximum discrepancy of 0.03 s. Results are presented in Table 8 and Figure 13.
Table 8.
Simulation results of the value and the experimental value on wet asphalt.
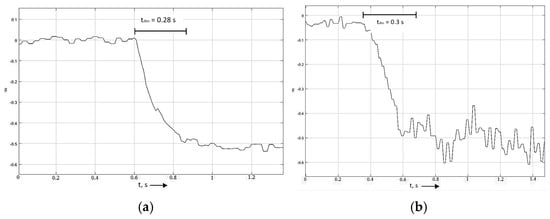
Figure 13.
(a) The dependence of the time to achieve steady deceleration when simulating braking on wet asphalt. (b) Dependence of the time to achieve steady deceleration during experimental braking on wet asphalt.
3.2.3. A Test of Experimental Verification of the Dependence at a Value of φ Corresponding to Movement on a Dry Asphalt Surface
Weather conditions: Ambient temperature +15 °C, no precipitation
Road surface: Dry asphalt concrete, without slope.
Speed: 60 km/h.
When testing on a dry asphalt surface, the predicted time to achieve steady deceleration and the actual time have a maximum discrepancy of 0.01 s. Results are presented in Table 9 and Figure 14.
Table 9.
Simulation results of the value and the experimental value on dry asphalt.
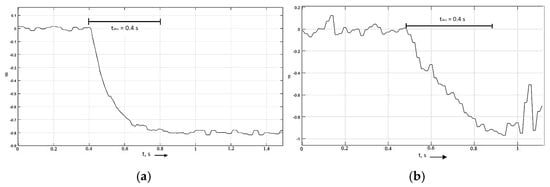
Figure 14.
(a) Dependence of the time to achieve steady deceleration when modeling braking on dry asphalt. (b) Dependence of the time to achieve steady deceleration during experimental braking on dry asphalt.
According to the test results, the dependence of the time to achieve steady deceleration on the current coefficient of adhesion was proven. The pattern of the steady-state deceleration curve is identical for all types of coating, but with a low coefficient of adhesion, the maximum value is achieved faster. Accordingly, it is fair to assume that in order to correctly calculate the braking distance, it is necessary to make correction factors corresponding to the predicted coefficient of adhesion.
Based on the results of the study in this paragraph, it is established that the standard formula for calculating the stopping distance, where the variable time to achieve steady deceleration is taken as a constant value, cannot be applied in all cases and depends on external conditions, particularly on the current coefficient of adhesion to the bearing surface φ. The nature of this dependence is shown in Figure 15.
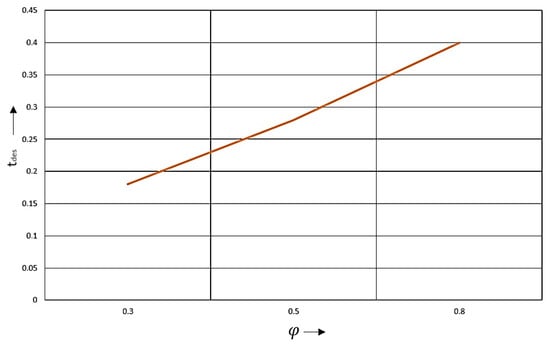
Figure 15.
The nature of the dependence of on φ.
The standard formula for calculating the stopping distance is as follows:
The difference in values, depending on the coupling coefficient, varies from a maximum to a minimum of 0.22 s. For example, at a speed of 90 km/h, a car travels 5.5 m in 0.22 s. If the variable is used as a constant average value in the calculations of the algorithm, then if the brake actuator is not applied in time, the error in the calculations of the braking distance may increase, which may lead to a collision.
As a result of the tests, the dependence = f(φ) was proven to be true for the predicted time to achieve steady deceleration.
Tests for the correspondence of the calculated braking distance to the mathematical model and the braking distance obtained experimentally were conducted.
During the experiment, car braking tests were carried out in front of a stationary target simulating a vehicle in the automatic mode of AEB operation. The purpose of this experiment was to conduct the comparative analysis of the calculated stopping distance and the real stopping distance .
To test the compliance of the predicted and actual braking distances, 3 test braking operations were carried out on 3 pavement types:
- −
- Dry asphalt;
- −
- Wet asphalt;
- −
- Rolled snow.
Figure 16 shows the condition of the road surface on which the test braking was carried out and the appearance of the target relative to which the braking distance is calculated by the radar sensor.
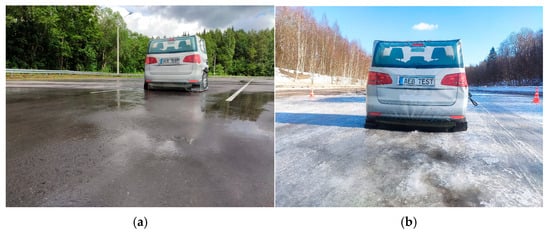
Figure 16.
(a) The appearance of the target and the condition of the coating during tests on wet asphalt. (b) Appearance of the target and coating conditions during icy coating tests.
Figure 17 shows graphs of a comparative analysis of the calculated stopping distance and the real stopping distance , using the example of braking from 25 km/h (7 m/s) on wet asphalt.
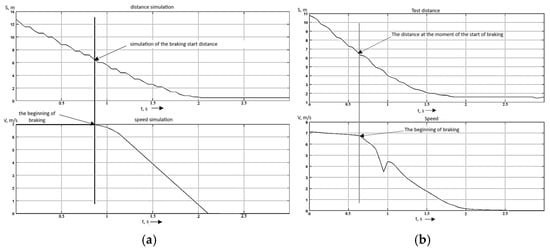
Figure 17.
(a) Example of recording AEB braking simulation data in Simulink on wet asphalt. (b) Example of recording experimental AEB test data on wet asphalt.
The graphs show the change in distance during braking and the moment when braking begins. The values of the distances at the time of the start of braking are compared. The results of the experiment are presented in Table 10.
Table 10.
The results of the experiment comparing and .
4. Conclusions
This study presented a comprehensive experimental framework for validating the performance of an Automatic Emergency Braking (AEB) system under diverse and challenging road conditions. While not introducing a new theoretical algorithm, the work provides critical insights into the practical accuracy and limitations of the core mathematical models used in real-time AEB operation.
The experimental results confirm the reliability of the methods for calculating the brake actuator response time and the time to achieve steady deceleration. A key finding was the proven dependence between the time to reach steady deceleration and the predicted tire–road adhesion coefficient, with the deceleration buildup time varying significantly depending on road surface conditions. This relationship is crucial for accurate braking distance prediction but is often oversimplified in standard assessments.
The research quantified the substantial influence of specific active safety configurations on overall braking dynamics. Tests demonstrated that implementing brake pre-fill—a preliminary pressure increase in the braking circuit—can reduce the brake actuator response time by up to 36% compared to the system’s standard operation without pre-fill. This improvement proves the direct correlation between refinement in stopping distance calculation and the vehicle’s specific active safety configuration, representing an important factor for optimizing real-world AEB performance.
The validation of stopping distance calculation accuracy revealed that differences between calculated and experimentally measured braking distances were less than 3.5% across all tested surfaces: dry asphalt, wet asphalt, and packed snow. This strong correlation confirms the validity of the mathematical model employed in this study, which maintains a balance between computational efficiency for real-time application and sufficient accuracy for safety-critical operations.
Despite the strong correlation, several potential sources of error and variability were identified. The primary source of dispersion stems from the inherent uncertainty in predicting the tire–road adhesion coefficient, as local variations in surface micro-texture, moisture, or temperature can cause significant deviations from predicted values. Additional factors include sensor noise in the radar and camera systems, which affects initial target detection accuracy, and the intervention logic of stability control systems that modulates brake pressure to maintain vehicle stability, resulting in a deceleration profile that may differ from the theoretical maximum.
It is important to note that the experimental validation was conducted at low speeds using a stationary target scenario, effectively validating the model’s accuracy for urban driving conditions where AEB is critically important for collision prevention. The testing results indicate that incorporating pre-loading and pressure optimization strategies in the braking system can significantly enhance system responsiveness when active safety systems are configured to compensate for any insufficiency in driver braking input.
Building upon these findings, this study opens several avenues for future work. The logical next steps include extending the validation methodology to more complex scenarios: evaluating AEB performance against moving targets, at higher highway-relevant speeds, and investigating integrated control systems where automatic steering interventions complement emergency braking. Pursuing these directions will be essential for developing AEB systems that are robust across the entire spectrum of real-world driving conditions and for enhancing the capabilities of next-generation driver assistance systems.
Author Contributions
Formal analysis, investigation, resources—V.V.P. and Y.M.F.; writing—original draft preparation, writing—review and editing—D.A.M.; supervision, project administration—S.S.S.; funding acquisition—A.V.K. All authors have read and agreed to the published version of the manuscript.
Funding
The research was carried out with the financial support of the Ministry of Science and Higher Education of the Russian Federation within the framework of the project “Development of a mathematical model of chassis operation (transmission, chassis and control mechanisms) in static and dynamic states and creation of a digital twin of a passenger car platform on its basis” (code: FZRR-2023-0007).
Data Availability Statement
The data that support the findings of this study are available from the authors upon reasonable request.
Conflicts of Interest
The authors declare no conflict of interest. The funders had no role in the design of the study; in the collection, analyses, or interpretation of data; in the writing of the manuscript; or in the decision to publish the results.
References
- Euro NCAP. Autonomous Emergency Braking. Available online: https://www.euroncap.com/en/vehicle-safety/the-rewards-explained/autonomous-emergency-braking/ (accessed on 25 January 2025).
- Ivanov, A.M.; Kristalny, S.R.; Popov, N.V.; Shadrin, S.S. Intelligent Driver Assistance Systems. Technical Requirements and Test Methods; Moscow Automobile and Road Construction State Technical University (MADI): Moscow, Russia, 2019; 100p, ISBN 978-5-7962-0260-9. [Google Scholar]
- ZF Friedrichshafen AG. General Safety Regulation (GSR) and Commercial Vehicles. Available online: https://www.zf.com/products/en/cv/campaigns/gsr.html (accessed on 25 September 2024).
- Yang, L.; Yang, Y.; Wu, G.; Zhao, X.; Fang, S.; Liao, X.; Wang, R.; Zhang, M. A Systematic Review of Autonomous Emergency Braking System: Impact Factor, Technology, and Performance Evaluation. J. Adv. Transp. 2022, 2022, 1188089. [Google Scholar] [CrossRef]
- Wang, D.; Tahmasebi, K.N.; Chen, D. Integrated Control of Steering and Braking for Effective Collision Avoidance with Autonomous Emergency Braking in Automated Driving. In Proceedings of the 2022 30th Mediterranean Conference on Control and Automation (MED), Vouliagmeni, Greece, 28 June–1 July 2022; pp. 945–950. [Google Scholar] [CrossRef]
- Liu, K.; Wang, Z.; Liu, P.; Liu, G.; Wang, Y.; Zhang, W. A Heavy-Haul Train Longitudinal-Vertical Coupled Dynamics Model and Its Dynamic Behaviour under Emergency Braking. Veh. Syst. Dyn. 2025, 63, 748–771. [Google Scholar] [CrossRef]
- Günay, M.; Korkmaz, M.E.; Ozmen, R. An Investigation on Braking Systems Used in Railway Vehicles. Eng. Sci. Technol. Int. J. 2020, 23, 421–431. [Google Scholar] [CrossRef]
- Euro NCAP. Safety Campaigns. Available online: https://www.euroncap.com/en/vehicle-safety/the-ratings-explained (accessed on 21 May 2025).
- Euro NCAP. Global Vehicle Target Test. Available online: https://www.euroncap.com/en/vehicle-safety/the-ratings-explained/safety-assist/aeb-car-to-car/ (accessed on 15 August 2024).
- Euro NCAP. Test Protocol—AEB Car-to-Car Systems. Version 2.0. 2017. Available online: https://cdn.euroncap.com/media/26996/euro-ncap-aeb-c2c-test-protocol-v20.pdf (accessed on 18 April 2025).
- Euro NCAP. Vulnerable Road User (VRU) Protection. Available online: https://www.euroncap.com/en/vehicle-safety/the-ratings-explained/vulnerable-road-user-vru-protection/aeb-pedestrian/ (accessed on 18 April 2025).
- Euro NCAP. AEB Vulnerable Road User Test Protocol. Version 2.0.4. 2024. Available online: https://cdn.euroncap.com/media/43381/euro-ncap-aeb-vru-test-protocol-v204.pdf (accessed on 16 September 2024).
- ISO 22733-1:2021; Road Vehicles—Test Method to Evaluate the Performance of Autonomous Emergency Braking Systems—Part 1: Car-to-Car Systems. ISO: Geneva, Switzerland, 2021. Available online: https://www.iso.org/ru/standard/73761.html (accessed on 18 April 2025).
- Autoengineer.ru. Automatic Emergency Braking Systems (AEBS). Available online: http://autoengineer.org/assets/files/runcap/runcap_automatic-braking_eng.pdf (accessed on 19 April 2025).
- Autoengineer.ru. RuNCAP Methodology. Available online: http://www.autoengineer.org/runcap1/metodika.html (accessed on 29 April 2025).
- Prikhodko, V.M.; Ivanov, A.M.; Borisevich, V.B.; Shadrin, S.S.; Methods of Testing Automated Car Control Systems. Bulletin of Moscow Automobile and Road Construction State Technical University (MADI)-2017-No. 4 (51)-P. 10-15-EDN YKYPRV. Available online: https://elibrary.ru/download/elibrary_32239468_24901254.pdf (accessed on 19 April 2025).
- Rahman, M.H.; Habib, M.H.; Rony, M.A.I. Fuzzy Logic Controller; LAP Lambert Academic Publishing: Saarbrücken, Germany, 2013; ISBN 978-3-659-38932-5. [Google Scholar]
- Tarasik, V. Theory of Car Movement; BHV Publishing House: St. Petersburg, Russia, 2021; ISBN 978-5-9775-6633-9. (In Russian) [Google Scholar]
- Komzalov, A.M.; Shilov, N.G. Application of Modern Technologies in Car Driver Assistance Systems. Izv. Vuzov. Priborostr. 2017, 60, 1077–1082. [Google Scholar] [CrossRef]
- Kuzmin, N.A.; Peskov, V.I. Theory of Vehicle Performance Properties; Forum: Moscow, Russia, 2013; 256p, ISBN 978-5-91134-759-2. [Google Scholar]
- Bosch Mobility Solutions. Electronic Stability Program (ESP®). Available online: https://www.bosch-mobility-solutions.com/en/solutions/assistance-systems/automatic-emergency-braking-on-vulnerable-road-users/ (accessed on 19 March 2025).
- Hart, P.M. Review of Heavy Vehicle Braking Systems Requirements (PBS Requirements); National Transport Commission: Melbourne, Australia, 2003.
- Novikov, I.A.; Lazarev, D.A.; Kudinov, D.V. The Estimation of Friction Coefficient of Vehicle’s Blocked Wheel Given with Contact Patch of the Tread with the Road Surface. Int. J. Appl. Eng. Res. 2015, 21, 42721–42724. [Google Scholar]
- Chudakova, N.V.; Evtyukov, S.S. Application of Steady-State Vehicle Deceleration in Expert Practice. In Innovations in Transport in Mechanical Engineering; National Mineral Resources University “Gorny”: St. Petersburg, Russia, 2016; pp. 41–45. [Google Scholar]


Disclaimer/Publisher’s Note: The statements, opinions and data contained in all publications are solely those of the individual author(s) and contributor(s) and not of MDPI and/or the editor(s). MDPI and/or the editor(s) disclaim responsibility for any injury to people or property resulting from any ideas, methods, instructions or products referred to in the content. |
© 2025 by the authors. Licensee MDPI, Basel, Switzerland. This article is an open access article distributed under the terms and conditions of the Creative Commons Attribution (CC BY) license (https://creativecommons.org/licenses/by/4.0/).