Abstract
This study investigates drivers’ visual attention strategies during naturalistic urban driving using mobile eye-tracking (Pupil Labs Neon). A sample of experienced drivers participated in a realistic traffic scenario to examine fixation behaviour under varying traffic conditions. Non-parametric analyses revealed substantial variability in fixation behaviour attributable to driver identity (H(9) = 286.06, p = 2.35 × 10−56), stimulus relevance (H(7) = 182.64, p = 5.40 × 10−36), and traffic density (H(4) = 76.49, p = 9.64 × 10⁻¹⁶). Vehicles and pedestrians elicited significantly longer fixations than lower-salience categories, reflecting adaptive allocation of visual attention to behaviourally critical elements of the scene. Compared with the fixed-rule method, which produced inflated anomaly rates of 7.23–14.84% (mean 12.06 ± 2.71%), the DSGP algorithm yielded substantially lower and more stable rates of 1.62–3.33% (mean 2.48 ± 0.53%). The fixed-rule approach over-classified anomalies by approximately 4–6×, whereas DSGP more accurately distinguished contextually appropriate fixations from genuine attentional deviations. These findings demonstrate that fixation behaviour in driving is strongly shaped by individual traits and environmental context, and that driver-specific modelling substantially improves the reliability of attention monitoring. Therefore DSGP framework offers a robust, personalised alternative evaluated at the proof-of-concept level to fixed thresholds and represents a promising direction for enhancing driver-state assessment in future ADAS.
1. Introduction
The development of effective strategies to mitigate traffic accidents necessitates a comprehensive understanding of the cognitive and perceptual processes that underlie young driver behaviours [1]. Mobile eye-tracking technology offers a potent means of elucidating these processes, providing a granular view of drivers’ visual attention patterns in real-world driving scenarios [2]. These wearable devices record drivers’ gaze direction and focus points in real time, thereby providing invaluable data on how young drivers allocate their attention across various elements of the driving environment, including other vehicles, pedestrians, traffic signals, and signage [3]. By analysing these patterns, researchers can pinpoint potential areas of concern, such as delayed hazard detection, inefficient visual scanning strategies, and attentional biases that may elevate accident risk. Furthermore, integrating eye-tracking data with other measures of driving performance, such as vehicle speed, steering input, and reaction time, enables a more holistic assessment of driver behaviours and cognitive workload. Such integrated analyses can reveal how visual attention is modulated by factors such as driver experience, cognitive load, and environmental conditions, ultimately paving the way for more targeted interventions and driver training programmes. While the high cost of certain eye-tracking systems may impede their widespread adoption for private use, they are promising and more efficient than other methods [4].
Young drivers are responsible for a disproportionately large number of traffic accidents, making it necessary to develop appropriate countermeasures based on scientific evidence [5]. On the other hand, the Advanced Driver Assistance Systems (ADAS) represent a key technological pathway toward improving road safety, reducing driver workload, and facilitating the transition to semi-autonomous driving. Reducing driver-related accidents is a crucial step that can be achieved through technologies that analyse the driver’s state and provide alerts via dedicated sensors [6]. Human error accounts for a substantial percentage of traffic accidents, with factors such as speeding, drunk driving, and distracted driving playing prominent roles [7]. Statistics from the EU provide more relevant data on accidents involving young drivers [8]. Eye-tracking studies can provide valuable insights into the cognitive and behavioural factors that contribute to these errors. For example, eye-tracking can be used to assess the impact of fatigue, distraction, and emotional state on visual attention and driving performance. By identifying the specific visual attention patterns associated with impaired driving, researchers can develop targeted interventions to mitigate these risks [9]. Furthermore, the technology can be used to evaluate the effectiveness of different driver training programmes and identify areas where young drivers need additional support.
The development and implementation of robust, reliable driver monitoring systems are essential steps toward achieving higher levels of vehicle autonomy and ensuring road safety [10]. The lack of rule obedience, the increasing number of vehicles on roads, and improper road culture have therefore motivated officials, manufacturers, and legislators to make substantial improvements in transportation systems [11]. Despite the growing interest in driver monitoring, there is a lack of comprehensive studies that offer detailed comparisons of the existing literature [12]. Future research should focus on developing more sophisticated algorithms to detect and predict driver drowsiness, distraction, and cognitive impairment. Furthermore, integrating eye-tracking data with other physiological measures, such as heart rate and electroencephalography, may provide a more comprehensive assessment of driver state [13]. For our research purposes, we propose the following hypotheses:
- H1: Fixation durations differ significantly between drivers, indicating that visual attention behaviour is not uniform across individuals;
- H2: Fixation durations differ significantly across stimulus categories, reflecting varying perceptual and cognitive demands of different visual elements in the driving environment;
- H3: Fixation durations differ significantly between traffic density levels, indicating that environmental complexity influences visual attention allocation.
The paper is organised into six chapters, each addressing a specific component of the research process. Section 1 (Introduction) outlines the motivation for studying young drivers’ visual attention using eye-tracking technology and highlights the relevance of this topic to traffic safety research. Section 2 (Literature Review) summarises previous studies on driver monitoring and eye-tracking applications, identifies methodological approaches, and emphasises the existing research gap concerning real-world testing with young drivers. Section 3 (Methods) details the experimental design, including participant selection, test route, equipment used (Pupil Labs Neon glasses), data collection procedures, and the statistical methods used for analysis. In Section 4 (Results), the findings of the fixation analysis across stimulus types and traffic conditions are presented, comparing inter-driver differences and identifying key patterns in gaze allocation. Section 5 (Discussion) interprets the results in the context of cognitive load, individual variability, and adaptive attention strategies, relating them to existing theories of visual perception and hazard detection. Finally, Section 6 (Conclusions) summarises the primary outcomes, discusses practical implications for driver training and assistance systems, and suggests directions for future research.
2. Literature Review
The road safety issue is analysed with various methods using advanced technologies. The need to enhance road safety by monitoring human factors, including stress, mental load, sleepiness, and fatigue in vehicle drivers, has been emphasised in numerous studies [14].
The current review identified diverse methodologies for assessing driver behaviour and highlighted the potential of eye-tracking technology as a valuable tool for understanding young driver fixations [10]. These efforts encompass a range of strategies, including image processing, computer vision, and analysis of physiological signals [15]. There are various approaches to analysing traffic accidents using ICT. The review underscores the need for further research to refine and validate eye-tracking-based assessments, ultimately paving the way for enhanced road safety and more effective driver education programmes.
Eye-tracking technology is highly effective for examining young drivers’ visual attention patterns and how they respond to different traffic situations. By tracking where drivers look, how long they look, and how frequently they shift their gaze, eye-tracking provides a window into the cognitive processes underlying driving behaviour. This technology allows us to analyse the driver’s behaviour and road quality [16]. This is possible even in labs as a part of virtual reality [17] or in real-world conditions [18]. Some studies analysed drivers’ behaviour related to road markings and traffic signs in a simulator [19]. Another study uses the Eye Tracking Glasses to track decision-making during street crossings [20]. A study [21] conducted an interesting review of research on night driving.
In recent years, the availability of various devices allowing eye-tracking measurement has increased significantly. Mobile eye-tracking systems offer several advantages over traditional laboratory-based methods, enabling researchers to collect data in real-world driving environments and capture the complexity and variability of everyday driving conditions [22]. Using eye-tracking in driving research may reveal solutions to enhance driver safety and minimise the risk of collisions by precisely analysing visual attention patterns. Eye-tracking is tested in labs using various simulators to analyse driver behaviour.
2.1. Eye-Tracking Tools in Research
Mobile eye-tracking technology, exemplified by devices like Pupil Labs glasses, offers a non-intrusive and ecologically valid approach to studying driver behaviour in real-world settings. Compared with expensive laboratory equipment, it provides an interesting, low-cost tool for the study of visual stimuli [23].
Pupil Labs’ eye-tracking glasses feature high-resolution cameras that capture detailed information about the driver’s gaze direction and pupil size, enabling researchers to quantify visual attention and cognitive workload. These systems can be worn comfortably by drivers during normal driving activities, providing a more naturalistic assessment of behaviour compared to laboratory-based simulations. The glasses can be combined with other sensors, such as GPS and accelerometers, to provide a comprehensive picture of the driving environment and the driver’s interactions with it. There are several types of sensors available for driver monitoring; researchers often employ multimodal sensing approaches to enhance accuracy and reliability [24]. By analysing eye movement patterns alongside driving performance metrics, researchers can gain insights into the cognitive processes underlying safe and unsafe driving behaviours. Eye-tracking technology provides numerous metrics related to emotional and cognitive processes, such as visual attention and cognitive workload [25,26]. Various smart glasses tools allow eye-tracking technologies in traffic. Evidence from studies showed that cognitive load can be measured using Tobii Pro 2 eye-tracking glasses, which measure pupil diameter in real time [27]. There are many measurements that can be utilized: electroencephalography and event-related potentials, optical imaging, heart rate and heart rate variability, blood pressure, skin conductance, electromyography, thermal imaging, and pupillometry [13]. In research, various tools have been used to analyse bus driving [28], the effect of street ads on drivers [29], and the environment for infants [30].
2.2. Visual Attention and Scanning Behaviour
Visual analysis tools such as eye-tracking help researchers analyse where drivers direct their gaze while driving—toward mirrors, intersections, pedestrians, or signs—and how these behaviours differ across driver age and experience [31]. Eye-tracking technology is critical for understanding attention habits, providing real-time biological data via a wireless connection to mobile devices without compromising digital identity by excluding cameras, microphones, and recording devices that capture personally identifiable information. Researchers use gaze tracking to examine if and when drivers notice traffic signs, street advertisements or developing hazards [32]. Young drivers often detect hazards later than experienced drivers [33].
Understanding how young drivers visually scan their environment is essential for designing targeted interventions to improve road safety [34]. Eye-tracking technology provides a quantifiable measure of driver attention, allowing researchers to determine which information drivers attend to, for how long, and in what sequence [35]. By analysing gaze patterns, researchers can identify common errors in visual scanning, such as a failure to check mirrors or a tendency to fixate on irrelevant stimuli.
2.3. Advanced Driver-Assistance Systems Algorithms
Advanced Driver Assistance Systems (ADAS) have evolved into a cornerstone of modern vehicle safety and automation, combining sensing, perception, and decision-making modules to reduce human error and collision risk. Early comprehensive reviews, such as [36], classified ADAS technologies into functional domains—collision avoidance, lane-keeping, and adaptive cruise control—and highlighted the role of sensor fusion between radar, LiDAR, and camera systems in achieving reliable environmental perception. Subsequent studies emphasised that the integration of artificial intelligence and connected-vehicle infrastructure is reshaping ADAS architectures toward predictive and cooperative driving frameworks [37]. In particular, machine learning and deep learning techniques have demonstrated strong potential for object recognition, lane detection, and behavioural prediction, as summarised by [38].
Parallel to these technological advances, attention has shifted toward driver state monitoring, a critical component for safe human–automation interaction. Khan and Lee [39] reviewed gaze- and eye-tracking approaches, demonstrating that fixation and saccade metrics can infer cognitive load, distraction, and fatigue—parameters essential for adaptive driver assistance. Earlier empirical work by [40,41] developed real-time models using support vector machines and gaze–head pose fusion to detect cognitive distraction, laying the foundation for intelligent driver-monitoring systems.
Large-scale naturalistic driving data have further contributed to understanding real-world driver behaviour and interaction with automated features. The MIT Advanced Vehicle Technology Study [42] analysed thousands of driving hours to examine gaze allocation, automation reliance, and situational awareness, illustrating the variability of attention patterns across individuals and contexts. Beyond technological development, recent human factors research has underscored the importance of user trust, comprehension, and demographic factors in shaping ADAS acceptance. The study [43] reported significant differences in ADAS knowledge and reliance across age groups. At the same time, ref [44] highlighted that trust, perceived usefulness, and ease of use shape adoption among elderly drivers.
Particular focus has also been directed toward novice and young drivers, who remain disproportionately represented in crash statistics. Reference [45] concluded that ADAS could compensate for deficiencies related to inexperience, yet their effectiveness depends on user understanding and adaptive system feedback. Collectively, these studies reveal a research trend moving from hardware- and algorithm-centric ADAS toward human-adaptive, behaviour-aware assistance, integrating gaze-based monitoring and personalised attention modelling. However, few existing approaches provide formalised methods for learning individual gaze baselines or for dynamically adjusting attention thresholds. This study addresses that gap by developing and validating a Driver-Specific Gaze Profiling (DSGP) algorithm, offering a context-aware, personalised framework for attention monitoring within ADAS.
Although recent research has expanded the technological and cognitive scope of Advanced Driver Assistance Systems (ADAS), most existing driver-monitoring models still rely on generic, rule-based thresholds that fail to capture the diversity of human visual behaviour. Studies on gaze and attention [34] have shown that fixation duration, saccadic rhythm, and gaze dispersion vary widely among drivers, even under identical conditions. Yet, these insights have rarely been operationalised into adaptive ADAS frameworks. The emerging trend toward human-centred automation [2,7,8,9,10] highlights the necessity for context-aware and personalised driver-assistance mechanisms capable of interpreting visual attention in relation to both environmental complexity and individual behavioural baselines. However, few empirical approaches have systematically modelled driver-specific gaze dynamics using real-world, on-road data.
Motivated by these limitations, the present study proposes a novel Driver-Specific Gaze Profiling (DSGP) algorithm that integrates personalised fixation baselines, traffic-dependent normalisation, and adaptive thresholding to detect attention anomalies in naturalistic driving. By combining mobile eye-tracking data with statistical and theoretical modelling, the study advances current ADAS research toward adaptive, behaviourally intelligent monitoring systems that can enhance both safety and driver trust—particularly among young and novice drivers who are most susceptible to attention-related errors.
3. Methods
This study employed a two-stage methodological framework combining empirical eye-tracking experimentation and algorithmic modelling. In the first stage, visual attention data were collected from ten licenced young drivers (aged 20–25) during a standardised urban route in Žilina, Slovakia. The small sample size reflects the pilot nature of this experiment, which aimed to validate the feasibility of the proposed DSGP algorithm rather than to provide generalisable statistical conclusions. An additional limiting factor was the requirement for voluntary participation in real urban traffic, which necessitated recruiting experienced, safety-conscious drivers to ensure ethical compliance and minimise operational risk during data collection.
Consequently, participant availability and safety considerations constrained the sample size, while maintaining high data quality and ecological validity.
Future studies will extend this research with larger and more diverse driver populations. Participants wore Pupil Labs Neon mobile eye-tracking glasses to record natural gaze behaviour under varying traffic conditions. Driving scenes were segmented into predefined areas of interest (AOIs)—including road, vehicles, pedestrians, traffic signs, surroundings, onboard dashboard, and in-vehicle persons. Raw gaze data were processed in Pupil Player, and fixation metrics, including duration, frequency, and gaze distribution, were extracted. Followed by statistical analyses (Kruskal–Wallis, Dunn’s tests) that were conducted to evaluate the effects of traffic density and stimulus category on fixation behaviour.
The fixation duration and attention-index comparisons across drivers and traffic levels were analysed using the non-parametric Kruskal–Wallis test. When significant group differences were identified, Dunn’s post hoc test with Bonferroni correction was applied. Parametric ANOVA models were not used in the final analysis due to insufficient sample size to reliably satisfy normality assumptions.
In the second stage, the processed fixation data were used to implement the Driver-Specific Gaze Profiling (DSGP) algorithm. For each driver and AOI, baseline fixation parameters (mean and standard deviation) were derived from the calibration portion of the drive. Real-time fixation samples were context-normalised by traffic level and converted into z-scores relative to individual baselines. Deviation scores exceeding adaptive thresholds indicated potential attention anomalies. The algorithm’s performance was compared with a fixed-rule detector using within-driver validation. This dual-stage approach enabled both behavioural analysis and algorithmic validation, establishing a robust foundation for personalised, context-aware ADAS enhancement.
3.1. Selection of the Test Route
A specific urban route was carefully selected to represent typical driving conditions encountered by young drivers. The route included a mix of road types, such as main roads, intersections (two roundabouts, six signalised and various non-signalised) and areas with variable traffic density; see Figure 1. The selection ensured the inclusion of elements requiring frequent attention shifts, such as signage, traffic lights, and vulnerable road users. The route designed for the research drive was carefully planned to include a variety of relevant traffic features and to provide a realistic picture of a driver’s regular daily route. It measured approximately 10 km in Žilina.
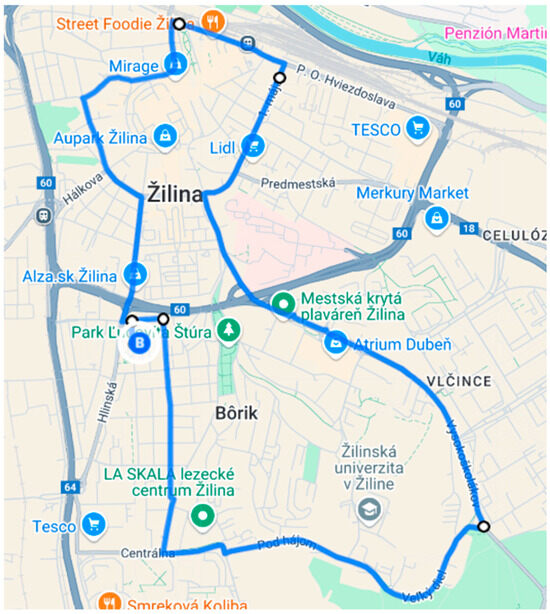
Figure 1.
The testing route. Source: Google maps.
The entire ride took place on city streets, covering different types of roads—from residential streets to busy intersections with traffic lights. Speed limits, therefore, ranged from 30 to 50 km/h depending on the nature of the individual sections.
3.2. Participant Briefing and Familiarisation
Before testing, each participant was briefed on the study’s objectives, the purpose of the eye-tracking equipment, and the structure of the test route. Participants were informed about how the data would be used and signed informed consent forms in accordance with ethical research standards. A short familiarisation drive was provided to reduce anxiety and help participants adjust to the equipment.
The volunteers for the practical part of the research were selected from students at the University of Žilina. All participants held a valid driving licence and were experienced drivers. The sample chosen focused on students aged 20 to 25 to ensure a balance between experience and student background. Once enrolled, the candidates who met the criteria were informed of the drive’s date and time, and all agreed to participate in the research.
The research participants were advised in advance of the nature of the test, the equipment to be used, and that the research team would monitor them during the ride. The candidates were also assured that they would be driving a vehicle without the instructor’s direct involvement, so there would be no interference with their actions.
Each driver had to drive through specific urban areas under real traffic conditions, areas they were familiar with. During the ride, the glasses record the drivers’ visual behaviour, including gaze points, fixations, saccades, and pupil diameter, which are crucial for assessing attention and cognitive load [36].
Participants were informed in advance of the date and exact time of their ride. Before each ride, they were given a summary of what eye-trackers are and how they are used as gaze-tracking devices. However, they were not given a detailed explanation of the research’s aim so that their behaviour would be affected as little as possible. Upon completion of the drive, the exact purpose of the study was explained to them, and they were asked for permission to use their recordings in the research. All participants agreed and were included in the study.
During the drive, a researcher was in the vehicle to monitor the device’s proper functioning and provide navigation instructions to drivers who were not informed in advance of the driving route. Apart from giving instructions, the researcher did not interfere or communicate with the participants in any way. The mere fact that the volunteers were aware that their driving was being monitored by the device and by the researcher present represents a limitation of this study, as they may have adapted their behaviour to this situation to some extent.
Eye-Tracking Glasses
Pupil Labs eye-tracking glasses (Germany, Berlin) are lightweight, wearable devices designed to record and analyse a person’s visual attention in real-world environments. We have used the type Neon with the following specifications: sampling rate: 200 Hz (eye cameras), latency < 10 ms (photon to output), scene-camera frame rate: 120 FPS, Scene Camera: 1600 × 1200 @30 Hz, Eye Cameras: 2 × IR eye cameras, 192 × 192 @200 Hz. The device is calibration-free. The Pupil Labs uses its own default detection algorithm, which serves to collect various parameters, such as fixations, gazes, etc.
These glasses are commonly used in psychological research, human–computer interaction, usability testing, and increasingly in traffic and driving studies, due to their mobility, accuracy, and open software ecosystem. Pupil Labs’ eye-tracking glasses use a binocular eye-tracking system, coupled with a scene camera that captures the environment from the wearer’s perspective. The eye-tracking system uses infrared cameras and LEDs to track pupil movement. Specialised algorithms analyse infrared reflections from the cornea and pupil to determine the wearer’s precise gaze direction [37]. This gaze data is then overlaid onto the video recorded by the scene camera, providing a real-time view of exactly where the person is looking. The glasses are equipped with sensors that measure eye position and movement, which are then processed to determine gaze direction and focus points [38]. These glasses provide an objective assessment of a driver’s visual attention, which can be used to identify patterns of distraction, inattention, or cognitive overload [39]. The data is then visualised using heatmaps and gaze plots that depict the distribution of visual attention and the sequence of eye movements. Furthermore, they can provide quantitative metrics such as fixation durations, saccade amplitudes, and gaze transition rates. This quantitative data provides insights into the cognitive processes underlying driving behaviour.
The video that is recorded from the scene camera is synchronised with eye-tracking data. The recorded video provides a first-person perspective of the environment that the driver is looking at. This allows researchers to analyse visual behaviour in the context of the driving scene. The ability to record real-time gaze data and synchronise it with the visual scene is essential for understanding how drivers interact with their environment.
There is also Open-Source Software Pupil Core v3.5 for Data Analysis, consisting of Pupil Player and Pupil Labs’ software ecosystem, which offers a range of tools for visualising, analysing, and exporting eye-tracking data. Pupil Care software v3.5 is utilised during data collection, offering real-time feedback, calibration capabilities, and recording functionalities. Pupil Player is utilised for post hoc analysis, providing features for visualising gaze data, annotating recordings, and extracting relevant metrics.
3.3. Execution of the Eye-Tracking Test
During the test, participants wore Pupil Labs eye-tracking glasses, which recorded real-time data on gaze fixations, saccades, and visual attention patterns. The driving task was performed under natural traffic conditions with an instructor present for safety. The scene camera captured the driver’s visual environment, synchronised with gaze data for later analysis; see Figure 2.
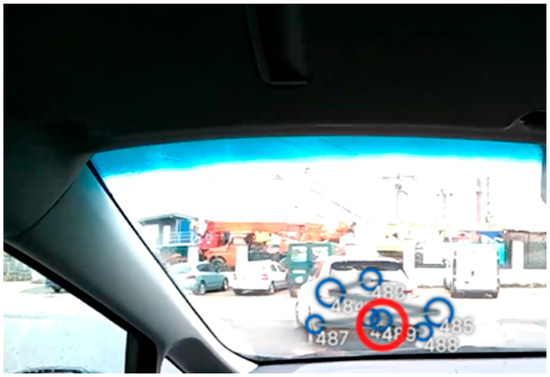
Figure 2.
Fixations in eye-tracking view.
3.4. Data Processing, Analysis, Evaluation and Interpretation
After the driving session, the recorded data were post-processed using software in the Pupil Labs cloud, which processed the recording and prepared the raw data for further analysis.
The visual stimulus of the participants were personally and manually analysed and coded into the categories such as road signs (S), road (R), vehicle (V), pedestrian (W), cyclists (C), on board vehicle stimulus (ON) (dashboard, gear lever, rear view mirrors, etc.), visual engagement with person in vehicle (IP), checking surroundings (CH). This categorisation allowed a more detailed analysis of the driver’s behaviour and reactions to different objects and situations while driving. In addition, traffic frequency is measured on a scale from 1 (completely smooth) to 5, with 5 representing congestion.
The results were then interpreted to assess typical attention patterns and detect potential deficiencies in visual scanning behaviour. Moreover, the traffic density was coded on the scale from 1 (smooth) to 5 (congested). Subsequently, a statistical analysis was performed using Python, including a non-parametric Kruskal–Wallis test, which was conducted together with Dunn’s test and outlier handling.
3.5. Development of DSGP Algorithm
The processed dataset was used to develop and validate the Driver-Specific Gaze Profiling (DSGP) algorithm. For each driver and stimulus category, baseline fixation parameters (mean and standard deviation) were calculated from the calibration phase (first 30% of the drive). This initial segment was used because fixation behaviour during the early portion of the task may be influenced by drivers’ adaptation to the eye-tracking device; thus, the calibration phase provides a stabilised, participant-specific reference for subsequent anomaly detection.
Real-time fixations were then context-normalised according to traffic density and transformed into z-scores relative to each driver’s baseline. Fixations exceeding a threshold for deviation (|z| > 2.5) were flagged as potential attention anomalies. The DSGP model was compared against a fixed-rule baseline to evaluate the benefits of personalised thresholds. This validation confirmed that driver-specific adaptation significantly improved sensitivity to genuine attention deviations while maintaining low false-alarm rates, supporting the feasibility of personalised gaze-based monitoring in ADAS applications.
The proposed Driver-Specific Gaze Profiling (DSGP) algorithm models visual attention as a function of fixation behaviour, contextual conditions, and individual visual baselines.
It aims to detect deviations in gaze behaviour that indicate potential inattention, cognitive overload, or visual tunnelling, while adapting to each driver’s unique gaze dynamics.
Let each fixation event be defined by the function (1):
where
—driver identifier,
—stimulus category (),
—traffic density level (),
—fixation duration in milliseconds.
A total of fixations are recorded per driver during the experiment.
3.5.1. Context-Normalised Fixation Duration
Since external driving conditions influence fixation duration, the raw duration is adjusted to compensate for traffic density. A traffic-modulated normalisation (2) is applied as:
where is a normalisation coefficient.
This ensures that shorter fixations in congested traffic are not misclassified as inattentive behaviour. A data-driven sensitivity analysis was performed to determine an appropriate value of β across a range of candidate values (β ∈ {0.00, 0.05, 0.10, 0.15, 0.20}), Appendix A. For each value, fixation durations were traffic-normalised and compared against the unadjusted durations using a mean-squared-error criterion, revealing a monotonic increase in distortion as β increased, with minimum error observed for β between 0.00 and 0.10. The full DSGP pipeline (baseline estimation, adaptive updating, and anomaly detection) was then recomputed for every β, with anomaly rate stability assessed using sample bootstrap confidence intervals. Consistent with the distortion analysis, anomaly rates remained nearly identical across all tested values, with the most stable behaviour obtained at β = 0.00. As traffic normalisation did not meaningfully improve model performance on this dataset, β = 0.00 was adopted in the final implementation.
For each driver and stimulus category , a visual baseline profile is established during the calibration phase (stated as of the dataset), see Equation (3).
The baseline parameters are given by:
3.5.2. Attention Index (AI)
For each incoming fixation, the deviation from the driver’s baseline is quantified using a standardised z-score, termed the Attention Index (AI) (4):
The absolute value expresses the magnitude of deviation from the driver’s normal fixation pattern.
3.5.3. Deviation Scoring Function
The overall Deviation Score may incorporate secondary gaze metrics such as saccade rate () and gaze entropy () to reflect spatial dispersion of gaze (5):
3.5.4. Attention State Classification
Each fixation is classified into one of four attention states according to the deviation magnitude (6):
3.5.5. Adaptive Baseline Update
To accommodate gradual changes in driver behaviour, the baseline parameters are continuously updated using an exponential moving average (7):
where determines the adaptation rate. The adaptive smoothing factor α, which governs exponential updating of each driver’s baseline fixation profile, was evaluated across α ∈ [0.60, 0.95]. For each α, we computed DSGP anomaly rates and bootstrapped 95% confidence intervals to assess stability and responsiveness. Very low α values (<0.70) caused excessive reactivity and unstable baselines, while very high values (>0.90) hindered adaptation to gradual behavioural drift, Appendix B. The most favourable balance between stability and adaptability was observed at α = 0.85, which provided consistent anomaly rate behaviour and stable baseline convergence. This value was therefore adopted in the final implementation of the model.
3.6. Testing and Verification of the Algorithm
In this step, we tested and verified the proposed algorithm on the available dataset.
4. Results
We analysed the data received from the participants and the classification of the areas to which the driver’s attention was drawn into different categories, such as road signs, road, vehicle, dashboard, pedestrian, cyclists, persons in the vehicle and checking surroundings, focusing mainly on the fixations. First, we analysed the overall distribution of attention to reveal the most and least observed elements on the road. The data were cleaned of fixations of sections at the beginning and end of the test runs.
4.1. Comparison of Driver’s Fixations
Across drivers, fixation durations exhibit considerable variability, as shown in Table 1. Mean fixation times range from approximately 323 ms (Driver 9) to 398 ms (Driver 6), reflecting moderate inter-individual differences in gaze allocation strategies. The median fixation durations fall within a narrower interval (270–295 ms for most drivers), suggesting that typical fixation behaviour is relatively consistent, with divergence mainly driven by longer, less frequent fixations. This interpretation is supported by the asymmetry between means and medians, indicating right-skewed distributions with occasional long-duration fixations that elevate the mean.

Table 1.
Descriptive fixation statistics of drivers.
Short fixations show remarkable uniformity across all drivers, with the minimum duration consistently around 69–70 ms, representing the lower perceptual threshold of recorded fixations. The interquartile ranges (IQRs) are also stable, with q1 values between 165 and 210 ms and q3 values between 360 and 456 ms, demonstrating comparable dispersion in the central portion of the distribution across participants.
In contrast, the maximum fixation durations differ substantially between drivers, ranging from 2467 ms (Driver 2) to 10,433 ms (Driver 1). These extended fixations likely reflect situational perceptual demands, momentary lapses in scanning behaviour, or specific environmental stimuli that require prolonged visual attention. Drivers 1, 4, 6, 7, and 8 exhibit particularly high upper extremes (>4000 ms), indicating episodes of markedly sustained gaze.
The standard deviations further highlight inter-individual variability, spanning from 234 ms (Driver 9) to 413 ms (Driver 6). Drivers with larger standard deviations also tend to have higher maximum fixation durations, consistent with distributions characterised by extreme upper-tail values.
Overall, the fixation statistics demonstrate both common underlying gaze patterns (reflected in similar medians and quartiles across drivers) and individual differences in the frequency of exceptionally long fixations. This combination suggests that while drivers share fundamental visual scanning mechanisms, personal driving style, cognitive processing, and responsiveness to environmental stimuli influence the upper range of fixation durations.
Across the dataset, each driver contributed between 2560 and 2728 fixation samples, indicating a relatively balanced distribution of observations. Mean fixation durations ranged from 323.6 ms to 398.3 ms, with substantial variation between drivers. Several drivers (e.g., Driver 1, Driver 4, Driver 6, Driver 7) exhibited extremely high maximum fixation values (3500–10,400 ms), resulting in markedly inflated standard deviations (up to 412.7 ms). These findings clearly suggest the presence of long, atypical fixations—likely artefacts arising from periods of waiting, blinks misclassified as fixations, or rare prolonged glances toward non-driving-relevant stimuli.
Drivers also differed markedly in their spread of fixation durations (Figure 3). For example, Driver 1 exhibited the widest distribution (std = 398 ms), driven by exceptionally long fixations, while Driver 9 demonstrated the smallest spread (std = 234 ms), indicating more stable visual sampling behaviour. The consistently low minimum fixation values (≈70 ms for all drivers) reflect the lower physiological threshold of saccadic fixation. These results indicate that the raw data contain considerable inter-driver variability arising largely from extreme fixation events.
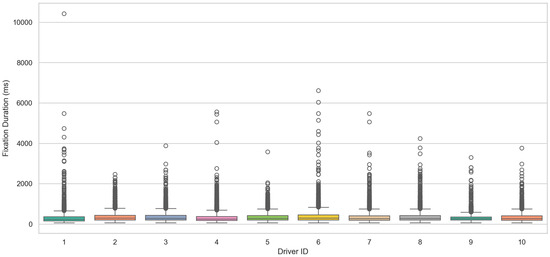
Figure 3.
Boxplot of driver’s fixations with outliers.
To address this issue, outliers were removed using the IQR criterion separately for each driver. The results after filtering (Figure 4) reveal a substantially more homogeneous distribution of fixation durations. The number of retained fixations per driver remained high (2381–2511 samples), indicating that outlier removal did not compromise dataset reliability. The mean fixation durations decreased across all drivers, now falling within a narrower range of 259.4–318.6 ms, with corresponding decreases in standard deviation to approximately 107–165 ms. Importantly, the maximum fixation durations after cleaning were reduced to values between 591 and 836 ms, which are consistent with fixation behaviour reported in prior eye-tracking literature for dynamic driving environments. This confirms that the long fixation durations observed in the raw data were statistical anomalies rather than meaningful behavioural events.
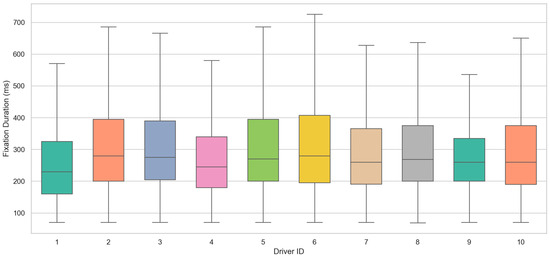
Figure 4.
Boxplot of driver’s fixations without outliers.
The number of outliers detected per driver ranged between 163 and 224, corresponding to 6–9% of the observations. Higher counts of eliminated fixations (e.g., Drivers 1, 7, and 8) likely reflect individual differences in prolonged gaze patterns or short periods of inactivity during the test. This aligns with typical variability among novice or developing drivers, where differences in scanning strategies, attention allocation, and episodic fixation lapses can occur.
Overall, the comparison of fixation statistics with and without outliers demonstrates that the applied cleaning procedure effectively corrected for extreme values while preserving the internal structure and between-driver variability of the dataset. The resulting cleaned dataset provides a more reliable basis for subsequent inferential analyses—such as Kruskal–Wallis testing, Dunn’s post hoc comparisons, or mixed-effects modelling—without the distortion caused by rare, excessively prolonged fixations.
The analysis of median fixation durations across 10 drivers and multiple visual stimulus categories revealed substantial inter-individual variability and clear stimulus-dependent patterns. Figure 5 presents the median fixation durations (in ms) for each driver–stimulus pair. Across all drivers, road-centred fixations (R) exhibited relatively stable medians (typically between 250 and 285 ms), indicating consistent attention allocation to the roadway itself. This stability aligns with the expected task demand, as road monitoring is a primary visual requirement for safe driving. In contrast, vehicle-related stimuli (V) produced markedly higher fixation medians for several drivers. Drivers 2, 3, 4, 5, and 6 exhibited particularly elevated values (551 ms, 671 ms, 881 ms, 741 ms, and 1031 ms, respectively), indicating that dynamic or potentially threatening vehicle interactions demanded prolonged visual engagement.
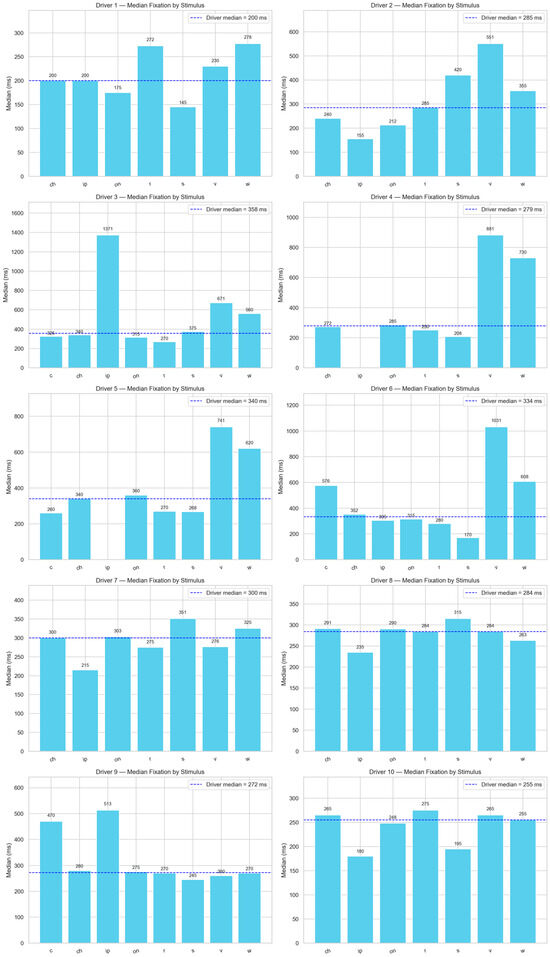
Figure 5.
Drivers’ median fixations by stimulus.
This pattern suggests heightened cognitive load or hazard anticipation when observing moving or approaching vehicles. Fixations directed at pedestrians (W) followed a similar but less pronounced trend. Drivers 3, 4, 5, and 6 again demonstrated elevated medians (560 ms, 730.5 ms, 620.5 ms, and 608 ms), further indicating that vulnerable road users were processed with extended visual scrutiny. This is consistent with prior findings showing that objects associated with high collision risk elicit prolonged gaze durations.
Stimulus categories linked to brief situational checks—such as checking surroundings (CH) and inside-vehicle persons (IP)—showed substantial variability. Most drivers demonstrated mid-range fixation medians between 200 and 350 ms for CH stimuli; however, notable exceptions emerged. Driver 3’s median fixation for IP was exceptionally high (1371 ms), and driver 9 also showed prolonged fixations for IP (513 ms). These isolated long durations suggest sporadic complex social or cognitive processing within the cabin environment. Fixations on traffic signs (S) displayed moderate medians for most drivers (typically 170–375 ms), with one exception: Driver 2 demonstrated a much higher median fixation of 420 ms, which may indicate slower symbol recognition or increased reliance on sign information.
The C category (where present) also showed strong inter-individual differences. For example, Drivers 6 and 9 exhibited extremely high medians (576 ms and 470 ms), while Driver 5 showed much shorter fixations (260 ms), suggesting differing strategies or perceptual demands for this stimulus type. We can see that drivers 3, 4, 5, and 6 consistently produced higher fixation medians on visually demanding stimuli such as V and W. Drivers 7, 8, 9, and 10 exhibited relatively lower fixation medians across stimuli, suggesting more uniform or efficient scanning patterns. The largest individual deviations occurred in the IP and V categories, pointing to stimulus types where cognitive and perceptual processing diverge most strongly between drivers.
Taken together, these results highlight pronounced differences in visual strategies among drivers and emphasise that certain stimulus categories—particularly vehicles, pedestrians, and interior persons—provoke significantly prolonged fixation behaviour. These patterns imply that task complexity, hazard relevance, and individual driver characteristics jointly shape visual attention allocation during real-world driving. The median fixation by stimulus is depicted in Figure 5.
4.2. Non-Parametric Analysis of Fixation Behaviour
In this study, we employed a combined analytical strategy to compare fixation behaviour across drivers for each stimulus category. The Kruskal–Wallis test was applied to account for deviations from normality and heteroscedasticity.
The dataset was overwhelmingly dominated by road fixations (R, n = 20,918), which demonstrated a stable central tendency with a median of 275 ms, confirming that road-centred visual processing is the core component of driver attention.
Categories associated with high behavioural relevance—particularly vehicles (V) and pedestrians (W)—elicited notably longer fixations. Vehicles produced a median of 300 ms, with a broad upper tail reaching 6616 ms, indicating heightened visual engagement with dynamic traffic actors. Pedestrian-related fixations showed similar behaviour (median 345 ms, max 2313 ms).
Stimuli such as checking surroundings (CH) and interior persons (IP) showed much greater variability. IP fixations ranged up to 1371 ms, suggesting occasional deep cognitive or social processing. The CH category again demonstrated the most significant extreme value in the entire dataset (10,433 ms), consistent with extended scanning episodes. Traffic signs (S) produced moderately long fixations (median = 272.5 ms, max = 1975 ms), suggesting intermittent periods of prolonged symbol recognition.
Traffic density also influenced fixation patterns. Under the lowest traffic load (Level 1), fixations had a median of 265 ms but were more variable, reaching the dataset’s maximum of 10,433 ms. Under high to moderate traffic (Levels 2 and 3), the medians remained consistent (281–265 ms), but distributions were narrower.
Interestingly, fixation durations did not increase monotonically with traffic complexity. The highest traffic levels (Levels 4 and 5) showed medians of 260–265 ms, indicating that in more demanding environments, drivers may rely on shorter but more frequent glances, consistent with rapid information sampling.
A highly significant effect of driver identity was observed (Kruskal–Wallis: H(9) = 286.06, p = 2.35 × 10−56), indicating substantial inter-individual variability in fixation duration. This confirms that drivers differ markedly in their natural visual exploration strategies, with some exhibiting consistently shorter, more frequent fixations, while others display longer, more sustained gaze patterns. Such differences reinforce the need for personalised modelling approaches, as global detection thresholds are unlikely to accommodate the diversity in baseline fixation behaviour.
The stimulus category also exerted a strong, statistically significant influence on fixation patterns (Kruskal–Wallis: H(7) = 182.64, p = 5.40 × 10−36). Fixations directed toward vehicles, pedestrians, and scanning-related visual elements were considerably longer than those associated with static or road infrastructure stimuli. These findings reflect the functional relevance and perceptual priority of dynamic or safety-critical objects within the driving scene. In contrast, static categories such as signs, surface markings, or background structures elicited shorter, more uniform fixations, consistent with their reduced cognitive and situational demands.
Finally, traffic density significantly modulated fixation durations (Kruskal–Wallis: H(4) = 76.49, p = 9.64 × 10⁻¹⁶). The relationship between traffic levels and gaze behaviour suggests that increasing environmental complexity requires drivers to adjust their scanning patterns, either by prolonging fixations to process critical information or by increasing scanning frequency to monitor more relevant objects. The observed differences across traffic levels confirm the sensitivity of fixation behaviour to external driving demands and highlight the need for context-aware interpretation in attention-monitoring systems.
Taken together, these results demonstrate that fixation behaviour in driving is jointly shaped by who is driving, what the driver looks at, and the level of environmental contextual complexity. This multidimensional variability underscores the importance of adaptive, personalised approaches such as Driver-Specific Gaze Profiling (DSGP), which can better account for these influences than traditional fixed-rule methods. The updated analysis confirms that a combination of driver-specific factors, stimulus category, and traffic complexity shapes fixation duration during naturalistic driving. Road-centred fixations were short and consistent, whereas safety-critical stimuli, such as vehicles and pedestrians, elicited prolonged glances. Significant inter-driver differences and skewed distributions further highlight the need to consider individual visual strategies in driver behaviour research.
A substantial effect of driver identity on fixation duration was observed, as confirmed by the Kruskal–Wallis test (H(9) = 286.06, p = 2.35 × 10−56). This indicates that fixation length distributions varied significantly across the ten participants, demonstrating that gaze behaviour is not homogeneous even under comparable visual and driving conditions. Such substantial inter-individual variability underscores the presence of distinct visual scanning strategies and attentional tendencies among drivers.
Dunn’s post hoc pairwise comparisons further revealed a structured pattern of differences. Several drivers showed statistically pronounced deviations relative to Driver 1, with extremely low adjusted p-values (e.g., Driver 2 vs. Driver 1: p = 6.2 × 10⁻³³; Driver 3 vs. Driver 1: p = 3.06 × 10⁻³⁰; Driver 6 vs. Driver 1: p = 3.11 × 10⁻²⁹), indicating substantially longer or shorter fixation durations. These results identify Driver 1 as a distinct behavioural reference point within the sample, with multiple participants demonstrating markedly different visual engagement patterns. Beyond contrasts with Driver 1, significant differences were also observed across other driver pairs—for instance, between Drivers 4 and 6 or Drivers 4 and 7—suggesting considerable heterogeneity even among mid-range performers. At the same time, several comparisons (e.g., Drivers 2–3, 2–5, 3–5) yielded non-significant results, indicating clusters of individuals with fixation profiles that were statistically similar. The clustered driver heatmap of Dunn’s p-values is shown in Figure 6.
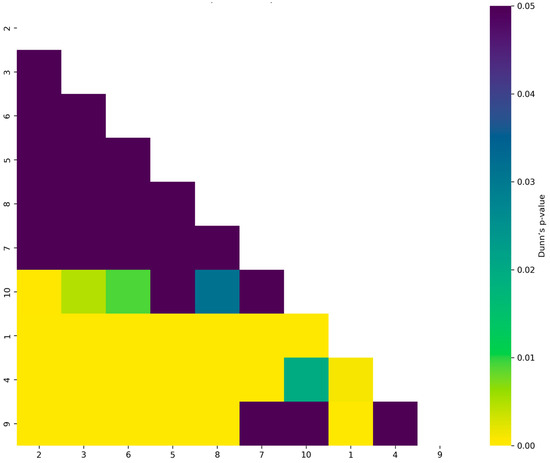
Figure 6.
Clustered drivers heatmap of Dunn’s p-values.
While Dunn’s test assesses whether differences are statistically significant, pairwise effect sizes (ε2) quantify their magnitude. Across all driver pairs, ε2 values ranged from 0.00 to approximately 0.026, reflecting small-to-moderate effects, which is typical for behavioural measures with large datasets.
The largest effect (Figure 7) sizes (ε2 ≈ 0.02–0.026) occurred between Driver 1 vs. Drivers 2, 3, 6, and 8, indicating meaningful behavioural divergence. Drivers 2, 3, 5, and 6 showed very small or near-zero effect sizes relative to one another, consistent with their non-significant p-values. Driver 9 consistently displayed small ε2 values (≤0.008), suggesting that although some comparisons reached significance due to the large sample size, the actual magnitude of the differences was limited. Taken together, the effect size matrix clarifies that while many differences are statistically significant, their practical magnitude varies considerably, with some contrasts representing meaningful behavioural distinctions and others reflecting minimal real-world differences.
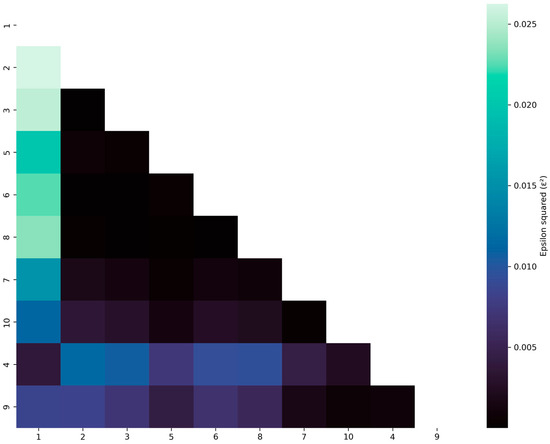
Figure 7.
Clustered heatmap of effect sizes (ε2) of drivers.
Conducted analyses demonstrate that driver identity has a substantial and statistically significant impact on fixation duration. Post hoc comparisons reveal numerous significant differences among individual drivers. Effect size estimates indicate that the magnitude of these differences ranges from negligible to modest, with a subset of driver pairs exhibiting consistently larger divergences. Overall, the findings highlight substantial individual variability in visual attention patterns during driving. Such differences may reflect variations in experience, cognitive strategies, risk perception, or attentional control, and underscore the importance of considering driver-specific behaviour in the analysis of eye-tracking data.
To complement the omnibus statistical tests and heatmap visualisations, we extracted explicit driver clusters based on the Dunn’s post hoc comparisons and the corresponding pairwise effect-size matrix (ε2). This analysis aimed to identify groups of drivers with fixation-duration distributions that were statistically similar and to highlight individuals whose gaze behaviour deviated markedly from the rest of the sample; see Table 2.
Table 2.
The clustering of drivers.
Cluster identification was performed by examining (1) non-significant adjusted p-values (p_adj > 0.05), (2) small pairwise effect sizes (ε2 ≤ 0.01), and (3) structural similarity patterns observed in the clustered heatmaps. Together, these criteria revealed three distinct groups of drivers with consistent internal coherence and clear between-cluster separation.
Cluster A—Moderate, homogeneous fixation strategy (Drivers 2, 3, 5, 6).
These drivers exhibited highly similar fixation-duration profiles, characterised by stable median values and narrow dispersion. Dunn’s post hoc results indicated no significant pairwise differences among the drivers in this group, and effect sizes were uniformly low. This cluster likely reflects drivers with balanced scanning behaviour and consistent gaze allocation across different driving contexts.
Cluster B—Short, efficient fixations with low variability (Drivers 7, 8, 9, 10).
The second group was defined by notably shorter and more uniform fixation durations. Their proximity in the heatmap dendrogram and their small effect sizes indicate a shared pattern of efficient visual sampling, possibly reflecting strong procedural familiarity or rapid scene-processing strategies. These drivers showed distinct separation from Cluster A but highly consistent behaviour within the cluster.
Cluster C—Distinctive fixation profile (Driver 1).
Driver 1 formed a single-member cluster due to consistently significant contrasts with nearly all other participants, as indicated by extremely low p-values (e.g., p < 10−30) and comparatively larger effect sizes. This driver demonstrated longer, more variable fixation durations, suggesting a unique gaze strategy or higher sensitivity to environmental context. The isolation of this driver in the clustering structure highlights substantial divergence from both Clusters A and B.
Together, these clusters underscore the strong inter-individual heterogeneity captured by the DSGP framework. The presence of well-defined driver groups further supports the need for personalised attention-monitoring systems, as aggregating across drivers would mask meaningful differences in visual behaviour.
The analysis of fixation behaviour across stimulus categories revealed clear and meaningful differences in how drivers visually engage with distinct elements of the driving environment. The omnibus Kruskal–Wallis test demonstrated a robust effect of stimulus type on fixation duration, H(7) = 182.64, p = 5.40 × 10−36, highlighting that not all visual stimuli elicit the same level of attentional allocation. This finding aligns with theoretical predictions from visual attention and hazard perception literature, which posit that the salience and behavioural relevance of environmental objects modulate fixation duration.
Post hoc analyses using Dunn’s test revealed transparent, interpretable patterns in how different stimulus categories influenced fixation duration. Although several categories showed broadly comparable distributions—suggesting similar perceptual salience or cognitive processing demands—multiple stimulus comparisons exhibited statistically robust differences, highlighting the differentiated attentional priorities that drivers maintain in dynamic traffic environments.
Across all stimulus types, vehicle-related stimuli (“V”) consistently elicited the longest fixation durations. This was supported by extremely low adjusted p-values across multiple pairwise comparisons:
- CH vs. V: p = 2.46 × 10⁻¹²;
- ON vs. V: p = 3.84 × 10⁻⁸;
- R vs. V: p = 3.11 × 10⁻³¹.
These findings indicate that drivers allocate disproportionately high levels of visual attention to other vehicles in the environment. From a behavioural standpoint, this is highly consistent with the demands of driving: surrounding vehicles are dynamic and potentially hazardous entities that require continuous monitoring for speed changes, lateral movement, braking behaviour, and collision risk. Longer fixations on vehicles, therefore, align with established models of situational awareness, in which dynamic, high-risk objects dominate attentional allocation.
Pedestrian-related stimuli (“W”) similarly elicited significantly longer fixations than many other stimulus types, including CH, IP, and ON. These results reflect the high perceptual and cognitive priority of pedestrians in road environments. Pedestrians are inherently unpredictable—capable of sudden movement, erratic behaviour, or entering the roadway—and thus require frequent or sustained visual monitoring to maintain safe control of the vehicle. The elevated fixation durations observed for pedestrians, therefore, mirror the risk-sensitive nature of driver attention.
In contrast to the pronounced differences involving vehicles and pedestrians, several stimulus categories exhibited broadly comparable fixation behaviours. Categories such as road elements (“R”), checking-surroundings (“CH”), and onboard information (“ON”) showed no statistically significant contrasts in many of their mutual comparisons:
- C vs. CH: non-significant;
- C vs. R: non-significant;
- CH vs. ON: non-significant.
These results indicate that these lower-salience stimuli share similar levels of perceptual relevance. Their moderate and relatively uniform fixation durations suggest that drivers treat them as part of a stable baseline for general guidance and monitoring, rather than high-risk or dynamically evolving elements requiring extended visual inspection.
The analysis of fixation behaviour across stimulus categories reveals a structured and functionally meaningful hierarchy of attentional priorities during driving. Both the omnibus Kruskal–Wallis test and subsequent Dunn’s post hoc comparisons demonstrate that fixation durations are not uniformly distributed across visual stimuli; instead, they systematically vary according to the behavioural relevance, risk level, and dynamic properties of the elements being observed in the traffic environment.
Dunn’s post hoc test with Bonferroni correction revealed that most stimulus pairs did not significantly differ in fixation duration. This suggests that, for many categories (e.g., C, CH, IP, ON, R, S), fixation demands were relatively similar (Figure 8).
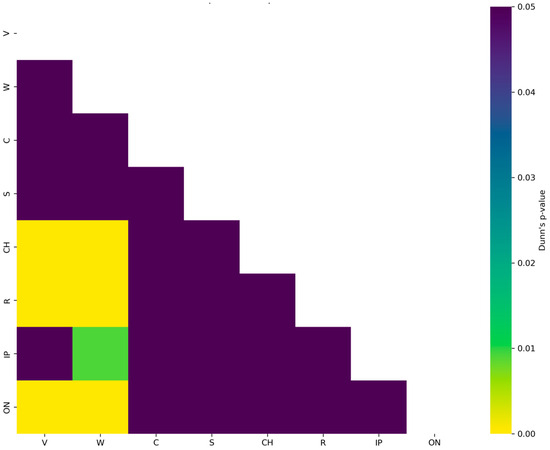
Figure 8.
Clustered stimulus heatmap of Dunn’s p-values.
To complement the significance tests, we computed pairwise effect sizes (ε2) that quantify the strength of differences in fixation durations between stimuli. Effect sizes ranged between 0.00003 and 0.0558, indicating small to moderate effects, typical for complex cognitive–perceptual tasks; see Figure 9.
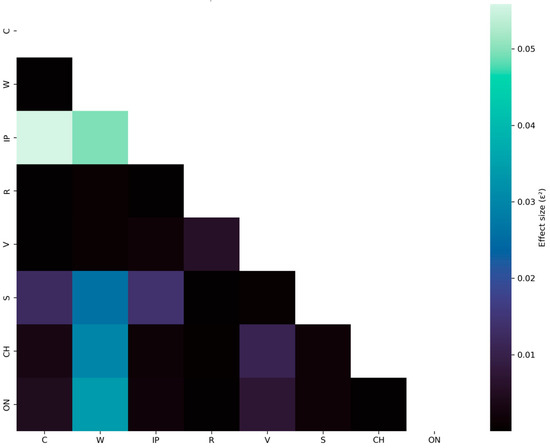
Figure 9.
Clustered heatmap of effect sizes (ε2) of stimulus.
Contrasts within road-related or sign-related categories (e.g., C–R, R–S, ON–CH) produced ε2 values near zero, confirming that many stimulus types share similar visual load characteristics. Drivers consistently devoted longer fixations to vehicles than to any other stimulus, indicating a strong attentional bias toward moving or potentially hazardous road users.
Although less frequent, pedestrian stimuli elicited substantial increases in fixation, reflecting their high safety relevance. Stimulus types such as CH, IP, ON, R, and S showed no meaningful differences in fixation behaviour, suggesting comparable cognitive processing requirements. While most pairwise effects are minor, the most significant ε2 values correspond to comparisons involving vehicles and pedestrians, reinforcing their central role in attentional allocation during driving.
The most substantial effects were observed for vehicle-related (“V”) and pedestrian-related (“W”) stimuli, which elicited markedly longer fixation durations than most other categories. These categories also produced the most extreme post hoc contrasts, marked by exceptionally low adjusted p-values (e.g., CH–V: 2.46 × 10⁻¹²; ON–V: 3.84 × 10⁻⁸; R–V: 3.11 × 10⁻³¹), reflecting their high perceptual salience and safety relevance. Vehicles represent dynamic, unpredictable, and potentially hazardous traffic entities whose movement must be continuously tracked for speed changes, lateral drift, and braking events. Similarly, pedestrians introduce substantial uncertainty due to their variable motion and vulnerability, necessitating sustained visual monitoring. The consistently elongated fixations observed for these categories, therefore, reflect an adaptive allocation of cognitive resources, allowing drivers to maintain up-to-date situational awareness of high-risk elements.
Stimulus categories associated with moderate relevance—such as road features (“R”) and traffic signs (“S”)—elicited fixation durations that were shorter than those for vehicles and pedestrians, yet still indicative of meaningful processing demands. Traffic signs, in particular, require rapid interpretation and decision-making, which likely explains their slightly elevated fixation durations relative to other mid-level stimuli. These categories appear to support ongoing navigation and regulatory monitoring, tasks that engage visual attention but do not generally require sustained tracking.
In contrast, lower-attentional-demand categories—checking surroundings (“CH”), onboard displays (“ON”), internal persons (“IP”), and the rare “C” category—showed relatively homogeneous and shorter fixation durations. These stimuli are either static, low-risk, or infrequently encountered, and drivers appear to allocate only glances to them, consistent with routine scanning or incidental visual contact. Dunn’s post hoc comparisons further supported this interpretation, showing numerous non-significant contrasts among these lower-salience categories (e.g., C–CH, C–R, CH–ON), suggesting similar attentional profiles.
Collectively, the results underscore a systematic and context-sensitive structure in how drivers allocate gaze during naturalistic driving. Fixation durations increase proportionally with the behavioural importance and volatility of the stimulus, illustrating an adaptive strategy in which visual attention is preferentially directed toward elements with potential safety implications. These findings provide robust empirical support for theoretical models of gaze behaviour that emphasise risk-oriented attentional modulation, and they offer essential validation for stimulus-weighted approaches in driver-monitoring algorithms such as the Driver-Specific Gaze Profiling (DSGP) framework.
Analysis of fixation behaviour across varying traffic density levels revealed clear and statistically robust differences in drivers’ visual attention patterns. The Kruskal–Wallis test indicated a strong overall effect of traffic level on fixation duration, H(4) = 76.49, p = 9.64 × 10⁻¹⁶, demonstrating that fixation distributions were not homogeneous across the five traffic categories. This confirms that environmental complexity and traffic dynamics significantly modulate how drivers allocate visual attention.
Subsequent Dunn’s post hoc comparisons pointed to the fact that the most pronounced differences consistently involved Traffic Level 2; see Figure 10. Fixation durations at this level differed significantly from all other conditions, with extremely low adjusted p-values observed for Level 1 vs. 2 (p = 1.26 × 10⁻⁸), Level 2 vs. 3 (p = 2.11 × 10⁻⁷), Level 2 vs. 4 (p = 1.86 × 10⁻⁴), and Level 2 vs. 5 (p = 2.42 × 10⁻⁴). By contrast, fixation durations across Levels 1, 3, 4, and 5 did not differ significantly, suggesting that these traffic conditions share a similar cognitive and perceptual demand profile.
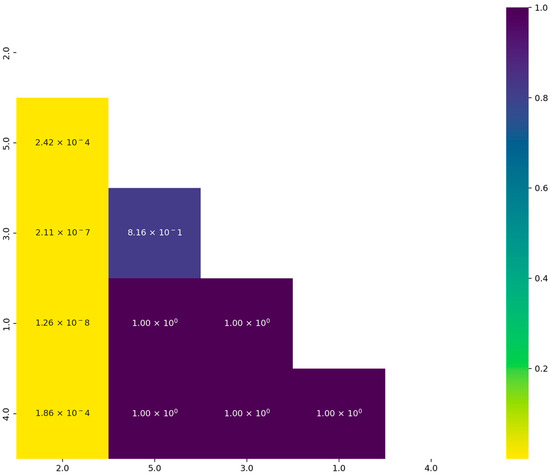
Figure 10.
Clustered traffic level heatmap of Dunn’s p-values.
Effect size estimates (ε2) further characterise the magnitude of these differences. Although ε2 values are generally small—consistent with the high sensitivity of large-sample nonparametric tests—they confirm the asymmetry centred on Level 2.
Positive and negative signs reflect the direction of group rank differences rather than their practical meaning; thus, the magnitudes of the absolute values are more informative. These effect sizes reinforce that Level 2 exhibited fixation patterns meaningfully different from those at other traffic densities; see Figure 11.
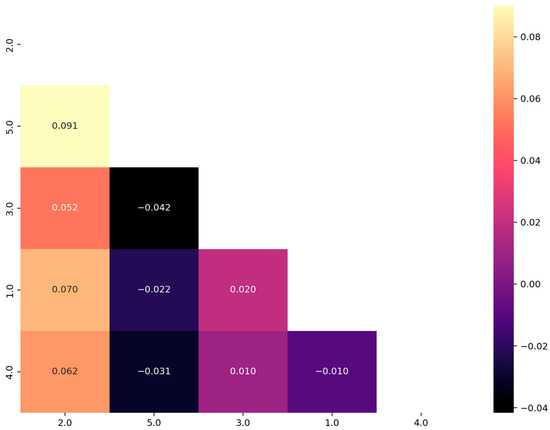
Figure 11.
Clustered heatmap of effect sizes (ε2) of traffic levels.
The distinctiveness of Traffic Level 2 suggests that this condition induces a unique behavioural response in drivers. A plausible interpretation is that moderate traffic density introduces a level of dynamic complexity that necessitates more active scanning, anticipatory monitoring, and continuous evaluation of potential hazards. Unlike very low traffic (Level 1), where situational demands are minimal, or highly congested conditions (Levels 4–5), where movement is more predictable and constrained, moderate traffic may represent a transitional state characterised by an increased number of interacting road users, variable speeds, and more frequent decision-making moments. These factors collectively elevate visual workload and likely lead to longer or more frequent fixations.
These findings demonstrate that drivers adjust their gaze behaviour systematically in response to traffic density, with moderate traffic levels eliciting the most pronounced deviations in fixation duration. It underscores the sensitivity of gaze-based metrics to environmental complexity and highlights the importance of incorporating contextual information when interpreting driver attention patterns in naturalistic settings. We can conclude that these findings collectively suggest that prolonged fixations serve as markers of cognitive salience, typically preceded by gaze sequences directed at dynamic traffic objects, primarily other vehicles. This pattern supports the assumption that long fixations represent critical moments of situational evaluation and decision-making, when the driver processes relevant information and prepares an appropriate behavioural response in complex driving scenarios.
4.3. Testing the Driver-Specific Gaze Profiling (DSGP) Algorithm
After developing the DSGP algorithm, we first examined the resulting Attention Index (AI), defined as the standardised deviation of each fixation from the driver-specific baseline and normalised for traffic context. The AI represents the standardised deviation of each fixation from the driver-specific baseline, normalised for traffic context. Figure 12 presents kernel density distributions of the Attention Index (AI) for all participants.
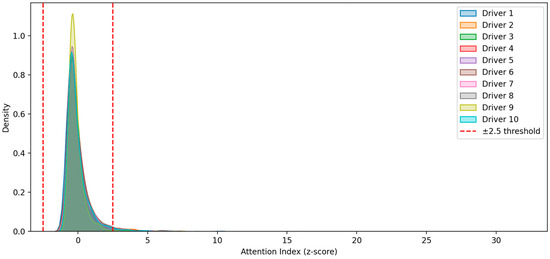
Figure 12.
Distribution of the Attention Index (AI) per driver.
Figure 13 presents the anomaly detection analysis, based on standardised fixation duration (AI; anomaly threshold |AI| > 2.5), revealed meaningful inter-individual variability in irregular attentional behaviour across drivers. The results demonstrate a consistent yet heterogeneous distribution of anomalies across drivers, with anomaly rates ranging from 1.35% to 3.33%.

Figure 13.
Anomaly rate per driver.
This variation indicates that although all drivers were exposed to the same set of stimuli and driving conditions, they responded differently in terms of fixation stability and attentional regulation.
Two groups can be clearly distinguished:
Higher-anomaly drivers with value ≥3%; namely, drivers 6 (3.33%), 8 (3.21%), 2 (3.13%), and 7 (3.12%). This subgroup exhibited the highest frequency of extreme fixation durations. These elevated anomaly rates may reflect:
- greater visual tension or risk sensitivity;
- difficulty regulating gaze behaviour under complex driving demands;
- or individual differences in perceptual strategies and cognitive workload thresholds.
Lower-anomaly drivers with value ≤2% represented by drivers 9 (1.35%), 5 (1.77%), and 1/3/10 (~2.1–2.2%).
These drivers showed relatively stable fixation patterns, suggesting more consistent visual scanning strategies and fewer deviations into extreme attentional states.
The presence of anomalies reflects unusual or atypical fixation behaviour—fixations that are significantly longer or shorter than expected given the global distribution. Drivers with higher anomaly rates may have been more sensitive to dynamic hazards, more cautious, or more overloaded during the tasks. Drivers with fewer anomalies demonstrate more stable gaze regulation, potentially indicating efficient processing of the visual scene or more uniform scanning behaviour. The spread of values suggests that driver-specific traits—such as experience, risk perception, visual strategy, or cognitive load tolerance—play an important role in determining attentional irregularity during driving stimulus exposure.
The anomaly analysis across stimulus categories (Figure 14) revealed clear differences in how various visual elements influenced fixation irregularities during driving. The “v” (vehicles) category displayed the highest anomaly rate at 7.14%, closely followed by “w” (pedestrians) at 6.71%. These elevated rates suggest that visual stimuli involving dynamic or potentially hazardous entities—such as cars and pedestrians—are more likely to provoke atypical fixation behaviour. This pattern aligns with established models of situational awareness, where drivers allocate increased cognitive resources to moving or unpredictable road users.
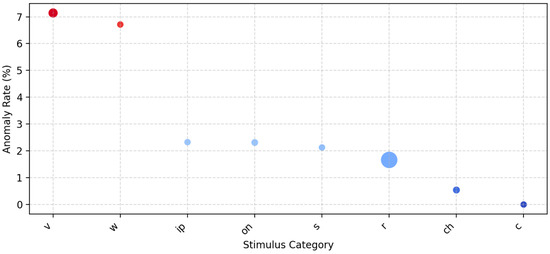
Figure 14.
Anomaly rate by stimulus category.
Stimulus categories related to information processing, such as ip (2.33%), on (2.31%), and s (2.13%), showed moderate anomaly rates. Although these stimuli are visually important, they tend to be static and predictable, allowing drivers to process them with less abrupt shifts in attention.
Despite representing the largest share of fixations, the “r” category (road) showed only a 1.66% anomaly rate, indicating that most fixations on general driving scenery fall within normal attentional patterns. Even more notably, the “ch” (checking) category exhibited a very low anomaly rate of 0.54%, suggesting highly consistent, deliberate fixations.
These differences confirm that fixation variability and adaptive scanning patterns are highly individual, supporting the use of driver-specific thresholds rather than fixed global criteria.
Figure 15 summarises the anomalies among the drivers. A modest but meaningful inter-individual variability in fixation behaviour is depicted. Across all ten drivers, anomaly rates ranged from 1.35% to 3.33%, indicating generally stable gaze patterns during real-world driving. Driver 9 is characterised by the lowest anomaly rate (1.35%), reflecting highly consistent fixation behaviour, while Driver 6 showed the highest rate (3.33%), suggesting greater fluctuation in attentional engagement. Drivers 1, 5, and 3 demonstrated similarly low anomaly levels, whereas Drivers 2, 7, 8, and 10 formed a higher-variability group (≈3%). Overall, the results confirm discernible individual differences in gaze stability, supporting the use of driver-specific modelling approaches such as DSGP.
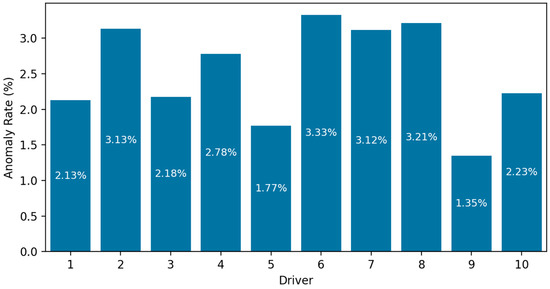
Figure 15.
Anomaly rate by driver.
Conversely, static or peripheral stimuli such as the dashboard or signage exhibit lower anomaly frequencies. This pattern supports the hypothesis that fixation irregularities are influenced by both environmental salience and task relevance.
This line plot illustrates how mean fixation duration changes with traffic congestion, rated on a 1–5 scale (from smooth to congested); see Figure 16. The dashed represents the fitted linear regression describing the relationship between traffic density and mean fixation duration. The surrounding shaded region denotes the 95% confidence interval of this estimate, reflecting the uncertainty of the regression fit and the precision with which the trend can be inferred from the data.
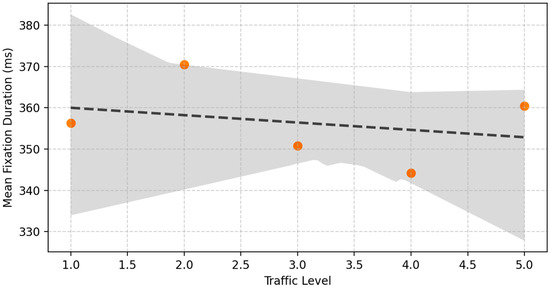
Figure 16.
Mean fixation duration as a function of traffic level.
The fixation duration pattern across traffic levels suggests that the relationship between traffic density and attentional demand is not strictly linear. Low–Moderate Traffic (Levels 1–2): More time is spent fixating on specific objects due to structured but engaging visual scenes. The Medium Traffic (Levels 3–4) increased environmental complexity requires shorter, distributed fixations. High Congestion (Level 5) causes fixation durations to increase again as dynamic elements decrease, and attention becomes narrowly focused. This dynamic fluctuation implies that different traffic densities impose distinct cognitive demands, altering how drivers visually sample the environment.
The scatter plot in Figure 17 shows the relationship between traffic level and Attention Index values for all fixations, with anomalies highlighted in red. The red dashed lines indicate the anomaly thresholds of the Attention Index (AI) at ±2.5 standard deviations, which correspond to the bounds used by the DSGP model to classify fixations as atypical or attentionally deviant.
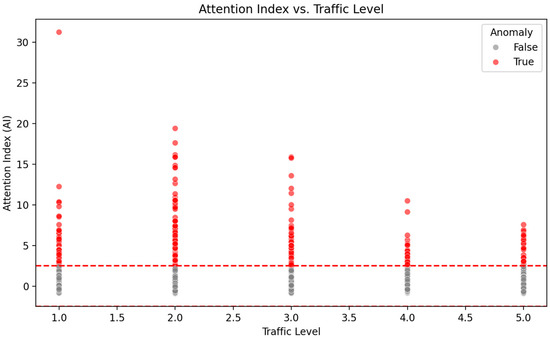
Figure 17.
Attention Index versus traffic level.
The analysis of the Attention Index (AI), computed as the standardised z-score of fixation duration, provides insight into how drivers’ moment-to-moment visual attention varies with traffic conditions. The dataset segment examined here contains fixation samples exclusively from Traffic Level 1, representing smooth, low-density driving. Across these observations, AI values predominantly fall within the range of −0.86 to +0.35, indicating that fixation durations remain well within the expected variability of the overall population. Significantly, none of the fixation samples exceeded the anomaly threshold of |AI| > 2.5, and therefore, no anomalies were detected.
The distribution of AI values within Traffic Level 1 demonstrates that most fixations are slightly shorter than the global mean, as evidenced by consistently negative AI values (e.g., –0.83, –0.80, –0.72). A smaller number of fixations approach the mean or slightly exceed it (e.g., AI ≈ +0.35), suggesting episodic increases in attention allocation even under low traffic load. This pattern is typical of driving environments characterised by predictable, low-complexity scenes where drivers can maintain brief, more uniform fixations without requiring abrupt shifts in attention.
The absence of detected anomalies at Traffic Level 1 suggests that smooth traffic conditions produce highly stable attentional behaviour. Drivers exhibit consistent fixation patterns with low cognitive pressure, minimal visual overload, and predictable stimulus flow. In contrast to higher traffic levels—where increased environmental complexity often leads to heightened attentional demands—Traffic Level 1 appears to facilitate homogeneous and low-variance attentional engagement, reflected in the narrow dispersion of AI values.
Collectively, these findings indicate that Traffic Level 1 imposes minimal cognitive or perceptual load, allowing drivers to maintain steady fixation durations with no evidence of excessive or insufficient visual attention. This baseline provides an important reference point for comparing attentional fluctuations at higher traffic densities, where anomalies and extreme fixation behaviours are expected to emerge more frequently due to increased task demands.
We also focused on testing the Driver-Specific Gaze Profiling (DSGP) algorithm compared with the conventional fixed-rule approach; see Table 3.
Table 3.
Comparison of Drivers DSGP algorithm versus conventional fixed-rule.
To quantify the difference between the Driver-Specific Gaze Profiling (DSGP) algorithm and a conventional fixed-rule anomaly detection approach, we computed anomaly rates for each driver and stimulus category. Unlike the earlier theoretical scenario where both methods yielded similar average rates, the empirical results demonstrate substantial divergence between the two approaches.
Across all ten drivers, DSGP produced consistently low anomaly rates, ranging from 1.62% to 3.33%, with a mean of 2.48 ± 0.53%. In contrast, the fixed-rule method yielded markedly inflated anomaly rates between 7.23% and 14.84%, with a mean of 12.06 ± 2.71%. The average difference between methods was therefore Δ = 9.58 ± 2.36 percentage points, indicating that the fixed-rule approach over-classifies anomalies by a factor of approximately 4–6×; see Table 4.
Table 4.
Comparison of Stimulus DSGP algorithm versus conventional fixed-rule.
Driver-specific patterns further highlight this discrepancy. For example, Driver 1 exhibited a DSGP anomaly rate of 1.69%, compared with 10.67% under the fixed-rule classifier, while Driver 6 showed 2.37% versus 14.84%, respectively. Even drivers with the lowest fixed-rule anomaly burdens (e.g., Driver 9 at 7.23%) still exhibited more than three times the anomaly rate compared with DSGP. These findings suggest that much of what the fixed-rule method labels as anomalous behaviour is actually normal inter-individual variability in gaze patterns or context-driven fixation adaptation.
A similar inflation effect was observed across stimulus categories. DSGP anomaly rates remained low and stable (0–3.47%), whereas fixed-rule anomaly rates were substantially higher (9–27%). For instance, stimuli associated with dynamic roadway elements—vehicles (“v”) and pedestrians (“w”)—showed DSGP rates of 2.17% and 2.68%, respectively. However, the fixed-rule method classified 24.13% and 26.85% of these fixations as anomalous. This discrepancy reflects the fixed-rule method’s inability to accommodate the naturally longer fixations elicited by mobile hazards. DSGP, by modelling driver-specific baselines and accounting for contextual influences, avoids this misclassification bias.
The difference was especially pronounced for categories with intrinsically variable fixation demands. For example, “ip” stimuli had a DSGP anomaly rate of 2.33%, but the fixed-rule method flagged 20.93% of fixations as anomalous. Such patterns indicate that fixed thresholds are poorly suited to heterogeneous visual contexts, whereas DSGP adaptively normalises behaviour across stimulus types.
4.4. Hypothesis Confirmation
In line with the hypothesis statement, we can conclude the following. The analysis revealed a highly significant effect of driver identity on fixation duration. These results support H1, indicating substantial inter-individual variability in fixation behaviour. The Kruskal–Wallis test showed that fixation distributions differed strongly across the ten drivers, H(9) = 286.06, p = 2.35 × 10−56, confirming that visual attention patterns were not uniform across individuals. Pairwise Dunn’s post hoc comparisons further demonstrated extensive driver-specific differences, with many contrasts yielding extremely low adjusted p-values (e.g., Driver 2 vs. Driver 1: p = 6.21 × 10⁻³³; Driver 6 vs. Driver 1: p = 3.11 × 10⁻²⁹).
Considering stimulus types and fixation duration, we can see that fixation duration also varied significantly across stimulus categories. These outputs support H2, proving that stimulus category substantially shapes fixation behaviour. The omnibus Kruskal–Wallis test showed a strong effect of stimulus type, H(7) = 182.64, p = 5.40 × 10−36, indicating that visual elements in the driving scene exerted different levels of attentional demand. Also Dunn’s post hoc results confirmed that dynamic and safety-critical stimuli (e.g., vehicles and pedestrians) elicited significantly longer fixations than lower-relevance categories such as checking surroundings (CH) or internal persons (IP).
The last hypothesis, H3, focused on traffic density and found that environmental complexity modulates gaze allocation, with moderate traffic conditions producing a distinct fixation pattern. It was based on the result of the Kruskal–Wallis test, which indicated a robust effect of traffic level, H(4) = 76.49, p = 9.64 × 10⁻¹⁶, showing that fixation behaviour varied systematically across the five traffic categories.
Post hoc comparisons revealed that Traffic Level 2 differed significantly from nearly all other levels (e.g., Level 1 vs. Level 2: p = 1.26 × 10⁻⁸; Level 2 vs. Level 4: p = 1.86 × 10⁻⁴), whereas Levels 1, 3, 4, and 5 did not differ significantly from one another.
5. Discussion
The present study examined visual attention patterns in real driving and evaluated the performance of a Driver-Specific Gaze Profiling (DSGP) algorithm designed to detect attentional deviations more reliably than conventional fixed-rule approaches. Across all analyses, fixation behaviour was found to be shaped by a combination of driver-specific characteristics, environmental context, and stimulus relevance, confirming the need for adaptive, individualised gaze modelling.
A strong effect of driver identity on fixation duration was observed, indicating substantial inter-individual variability in visual strategies. The Kruskal–Wallis test revealed a highly significant divergence among drivers (H(9) = 286.06, p = 2.35 × 10−56), and Dunn’s post hoc comparisons showed clear clusters of statistically similar drivers alongside several outliers with distinct fixation patterns. These findings underline that gaze behaviour is not homogeneous across individuals, supporting the rationale for personalised modelling such as DSGP. Fixed rules, which assume a universal fixation duration threshold, cannot accommodate such variability and therefore risk misclassifying normal but idiosyncratic behaviour as anomalous.
Stimulus-related effects were particularly pronounced. Vehicles and pedestrians elicited the longest fixations, reflecting their higher situational relevance and increased perceptual load. Dunn’s post hoc tests confirmed that these categories differed significantly from most others (p < 10−8 to p < 10−31), while categories representing static or low-salience elements (e.g., signs, infrastructure) produced shorter and more uniform fixations. Traffic density also influenced fixation duration, with moderate traffic (level 2) showing significant contrasts relative to all other levels. This suggests that drivers may experience elevated cognitive demand or increased scanning activity in moderately complex environments.
Stimulus type exerted a similarly strong influence on fixation durations (H(7) = 182.64, p = 5.40 × 10−36), highlighting the functional nature of gaze allocation during driving. Vehicles (V) and pedestrians (W) elicited the longest fixations and showed highly significant differences relative to almost all other stimulus classes. These results are consistent with their elevated behavioural relevance: both categories represent dynamic, potentially hazardous elements requiring continuous monitoring and anticipation. In contrast, categories such as road markings (R), onboard stimuli (ON), and checking surroundings (CH) showed largely similar fixation patterns, reflecting their lower perceptual urgency. The structured hierarchy observed in fixation durations reinforces the understanding that drivers allocate attention adaptively based on risk, uncertainty, and task relevance. Traffic density significantly influenced fixation durations (H(4) = 76.49, p = 9.64 × 10⁻¹⁶). Post hoc comparisons revealed that Traffic Level 2 differed significantly from all other levels, whereas Levels 1, 3, 4, and 5 formed a homogeneous group. A plausible interpretation is that moderate traffic demands more active scanning and hazard anticipation than free-flowing or highly congested traffic. In very low traffic, visual demands are minimal, while in high congestion, drivers may adopt slower, more conservative monitoring patterns. The distinctiveness of Level 2 suggests that subtle changes in traffic dynamics can modulate cognitive load and attention requirements.
A core contribution of this study is the comparative evaluation of DSGP and a conventional fixed-duration rule. The results demonstrate a clear performance advantage for the DSGP framework. Across all ten drivers, DSGP produced stable anomaly rates ranging from 1.62% to 3.33% (mean 2.48 ± 0.53%). In contrast, the fixed-rule system yielded markedly inflated and inconsistent anomaly rates between 7.23% and 14.84% (mean 12.06 ± 2.71%). The average difference of Δ = 9.58 ± 2.36 percentage points indicates that fixed thresholds over-classify anomalies by a factor of approximately 4–6×. This over-detection arose because fixed rules interpret naturally long, task-driven fixations—such as those directed at vehicles or pedestrians—as indications of inattention, whereas DSGP correctly identifies them as context-appropriate.
Overall, the results confirm that gaze behaviour is context-dependent and driver-specific, and that anomaly detection must account for this variability to be reliable. DSGP achieves this by adapting thresholds to individual behavioural baselines, compensating for traffic density, and updating parameters over time.
The rapid proliferation of in-vehicle information systems has introduced a new layer of complexity to the driving task, potentially increasing cognitive distraction and negatively impacting road safety [42]. Particularly susceptible to the perils of distracted driving are young drivers, who often lack the experience and cognitive resources to effectively manage the demands of both vehicle operation and concurrent engagement with electronic devices [43]. The inexperience of younger drivers in controlling vehicles can also lead to a greater reliance on visual information from traffic signs [43]. Eye-tracking technology offers a unique opportunity to examine the interplay between in-vehicle technology use, visual attention, and driving performance in this vulnerable population. By tracking young drivers’ eye movements while they interact with in-vehicle systems, researchers can quantify the attentional costs associated with these activities and identify specific design features or interaction modalities that contribute to distraction. Notably, studies have shown that even glances away from the road can significantly increase the risk of accidents, highlighting the importance of minimising visual demand imposed by in-vehicle interfaces [44]. Advanced driver-assistance systems are meant to alleviate these challenges by automating certain driving tasks; however, drivers must remain vigilant and ready to assume control when necessary [45]. Based on that, the visual data collected from drivers can then be processed and used in various ADAS applications [46].
The research confirmed that the eye-tracking device can be used to compare measurements in a laboratory environment. For example, it allows researchers to investigate how visual attention and perception differ when a participant is sitting at a computer in a laboratory setting, compared to when they are engaged in driving in real traffic conditions. It can be used to test risk perception, driver concentration and other relevant factors, which is in line with the conclusions in [23].
From the perspective of road safety analysis, it is interesting to note that in a familiar environment, drivers often ignore traffic signs and only perceive them when necessary signals are used to control traffic, such as traffic lights or new traffic signs. The integration of eye-tracking data with conventional driving performance metrics offers a more nuanced understanding of the cognitive and behavioural factors influencing young driver safety, facilitating the development of targeted interventions and training programmes. By understanding these patterns, tailored training programmes can be developed to address specific deficits in visual attention and scanning strategies. Eye-tracking technology measures eye movements to pinpoint users’ visual attention, which, in turn, helps understand the relationship between visual stimuli and human responses [47,48].
Although the sample size in this study was relatively small (n = 10), the experiment was intentionally designed as a pilot validation of the proposed Driver-Specific Gaze Profiling (DSGP) algorithm under naturalistic driving conditions. The primary objective was not to achieve population-level generalisation, but rather to verify the feasibility and internal consistency of the methodological framework—particularly the integration of mobile eye-tracking with real-time fixation analysis and adaptive attention modelling. Small-scale pilot studies are a recognised and essential step in applied human factors research, especially when introducing novel experimental setups that require extensive instrumentation, ethical clearance, and on-road safety supervision. The present design, therefore, prioritised data quality, ecological validity, and algorithmic verification over statistical representativeness. Findings from this exploratory phase provide a validated foundation for subsequent large-scale studies that will include broader participant groups, varied age ranges, and different driving environments.
Expanding the research to include a more diverse range of participants, considering factors such as age, driving experience, and professional background, would enhance the generalisability of the findings [16]. We also cannot fully assess the effect of drivers perceiving that they were wearing an eye-tracking device and focusing mainly on traffic. It is also possible that, in an unfamiliar environment, fixations and individual visual stimuli would differ.
Parameter sensitivity analyses revealed important considerations for tuning the DSGP model. The traffic-normalisation coefficient β was initially set to 0.1 based on prior evidence suggesting that human fixation behaviour often scales proportionally with small context-modulation factors in the range 0.05–0.20. However, a data-driven sensitivity analysis performed across β ∈ {0.00, 0.05, 0.10, 0.15, 0.20} showed a monotonic increase in reconstruction distortion as β increased. Within the present dataset, traffic-level adjustments therefore did not enhance the stability of fixation modelling, and β = 0.0 yielded the most reliable performance. Nevertheless, several methodological constraints must be considered. First, the optimisation criterion prioritised statistical fidelity rather than behavioural interpretability; a β that minimally alters the data is not necessarily the β that best reflects cognitive modulation by traffic density. Second, the analysis was aggregated across drivers and stimulus categories, leaving potential inter-driver differences unexamined. Third, the MSE criterion may inherently favour under-correction, as any normalisation will introduce numerical deviation even if behaviourally meaningful. Lastly, the dataset primarily reflects stable traffic conditions, which may limit the detectability of genuine traffic-induced fixation modulation. This means that results may differ in a more heterogeneous or high-complexity dataset and parameter β should not be assumed universal and may require future re-estimation.
A corresponding sensitivity analysis of the adaptive smoothing factor α confirmed that its tuning is equally critical. Low values (α < 0.70) resulted in unstable baseline updates driven by short-term variability, whereas high values (α > 0.90) prevented the system from adapting to gradual behavioural drift. The most robust balance between stability and adaptability was obtained with α = 0.85, which ensured consistent baseline convergence and stable anomaly rate behaviour across drivers and stimulus categories. Overall, these findings highlight that both β and α must be carefully selected to preserve the behavioural structure of fixation data while enabling meaningful identification of attention deviations.
Taken together, the data-driven optimisation supports β for this pilot dataset, indicating that traffic-based normalisation is not required to improve the stability of driver-specific gaze profiles. Nonetheless, further research should re-evaluate β under broader traffic conditions, incorporate behavioural or performance metrics into the optimisation target, and consider hierarchical estimation that permits β to vary by driver, stimulus type, or traffic segment [49,50]. Such refinements may reveal more nuanced roles of traffic density in shaping fixation behaviour, especially in real-time ADAS scenarios where contextual modulation is expected to play a stronger role.
Future research should focus on larger, more diverse samples and explore the effectiveness of different interventions based on eye-tracking data [51], including while driving at night [21]. Further research should examine how these findings can be translated into practical training modules and driver assistance systems to improve the safety of young drivers and other vulnerable road users [51]. Another potential research area is the incorporation of additional wearable sensors, which can provide further valuable data to estimate stress, cognitive behaviour, etc., simultaneously with eye-tracking metrics [19,41]. Older drivers, for example, tend to exhibit lower rates of off-path glances compared to their younger counterparts, highlighting the importance of age as a factor in distraction engagement [52]. Eye-based metrics, such as gaze fixation, will likely remain important for assessing driver engagement across age groups, including comparisons between young and elderly drivers [53].
Building on current findings, future research will expand the Driver-Specific Gaze Profiling (DSGP) framework into a multimodal driver-state estimation model. While the present implementation relies exclusively on visual attention metrics derived from mobile eye-tracking, incorporating additional psychophysiological and behavioural parameters will enable a more comprehensive understanding of driver performance under varying cognitive and emotional states. A key direction is to integrate stress- and workload-related physiological indicators, such as heart rate variability (HRV), electrodermal activity (EDA), pupil dilation, and facial temperature changes, collected via unobtrusive wearable sensors or in-vehicle monitoring units. These signals could be synchronised with gaze-based fixation patterns to form a multichannel feature space, where temporal and contextual relationships are modelled using adaptive machine learning architectures such as Long Short-Term Memory (LSTM) networks, Bayesian fusion, or Kalman-based context filters.
Another potential enhancement is the introduction of a continuous learning mechanism that allows the DSGP system to dynamically recalibrate its driver-specific baseline as individual behavioural traits evolve with driving experience, stress exposure, or fatigue. By fusing these multimodal indicators with situational data—such as traffic density, road complexity, or time pressure—the system could offer adaptive warning thresholds that distinguish between visual distraction, cognitive overload, and emotional arousal.
Finally, future validation efforts should employ large-scale naturalistic driving datasets and simulation-based testing environments to benchmark the enhanced DSGP system against conventional driver monitoring solutions. Such an integrated, context-aware, and personalised framework has the potential to significantly advance real-time safety analytics, human–machine cooperation, and the overall resilience of next-generation Advanced Driver Assistance Systems (ADAS).
6. Conclusions
This pilot study demonstrates that fixation behaviour during driving is shaped by a complex interplay of individual, perceptual, and contextual factors, and that these dimensions must be accounted for when designing driver-monitoring systems. Statistical analyses confirmed that fixation behaviour varies strongly with driver identity, stimulus type, and traffic level, underscoring the need for adaptive rather than global detection criteria. Drivers monitor the environment to enhance safety and avoid potential traffic-related risks. Across all analyses, significant variability emerged between drivers, stimulus categories, and traffic density levels, confirming that gaze allocation is neither uniform nor adequately captured by global threshold rules. Vehicles and pedestrians elicited the longest and most consistent fixations, reflecting their high behavioural relevance. At the same time, moderate traffic conditions (Level 2) produced distinct attentional demands compared with both lighter and more congested environments.
Against this behavioural backdrop, the Driver-Specific Gaze Profiling (DSGP) algorithm demonstrated clear advantages over the conventional fixed-rule method. While the fixed-rule detector produced inflated anomaly rates of 7.23–14.84%, DSGP achieved substantially lower rates of 1.62–3.33%, with far less variance. On average, the fixed-rule approach over-classified anomalies by approximately 4–6 times, indicating a poor ability to distinguish between contextually appropriate long fixations and genuine attentional deviations. In contrast, the DSGP method—through its incorporation of contextual normalisation, driver-specific baselines, and adaptive updating—provided a stable and discriminative representation of driver attention state.
Overall, these findings indicate that personalised, context-aware modelling is essential for accurate assessment of driver visual behaviour. The DSGP framework offers a methodologically superior alternative as a proof of concept to fixed heuristics, strengthening reliability without sacrificing sensitivity, and thus holds strong potential for integration into next-generation Advanced Driver Assistance Systems (ADAS). Future research with larger and more diverse driving populations will be necessary to validate these findings and to extend the DSGP approach toward real-time implementation in operational driving environments. The findings carry implications for the development of advanced driver-assistance systems (ADAS) and driver monitoring technologies. The reason is that systems measuring fixation frequency or duration without accounting for context may misinterpret normal variability as risk. For instance, a short vehicle fixation in congested traffic may be adaptive rather than inattentive. Conversely, excessively long vehicle fixations may indicate potential safety hazards such as reduced situational scanning. Adaptive systems should therefore incorporate both traffic context and driver-specific baselines when assessing attentional sufficiency.
Author Contributions
Conceptualisation, M.G. and J.O.; methodology, M.G.; software, M.G.; validation, J.O.; formal analysis, J.O.; investigation, J.O.; resources, M.G.; data curation, M.G.; writing—original draft preparation, M.G.; writing—review and editing, J.O.; visualisation, M.G.; supervision, M.G.; All authors have read and agreed to the published version of the manuscript.
Funding
This research received no external funding.
Institutional Review Board Statement
The study was conducted in accordance with the Declaration of Helsinki, and Ethics codex of University of Zilina Nr. 207, approved by 31 May 2024.
Informed Consent Statement
Informed consent was obtained from all subjects involved in the study.
Data Availability Statement
The data presented in this study are openly available at https://doi.org/10.6084/m9.figshare.30293959.v1, accessed on 25 October 2025.
Acknowledgments
This paper was supported by the granted project of The Ministry of Education, Research, Development and Youth of the Slovak Republic; VEGA project: 1/0411/25 Shared mobility in Slovakia and its economic impacts on enhancing the competitiveness of public transportation in urban environments and the KEGA project Nr.: 055ŽU-4/2025 Sustainable Mobility Lab—a tool to promote sustainable mobility education.
Conflicts of Interest
The authors declare no conflicts of interest.
Abbreviations
The following abbreviations are used in this manuscript:
| ACC | Adaptive Cruise Control |
| ADAS | Advanced Driver Assistance Systems |
| AI | Attention Index |
| AOI/AOIs | Area(s) of Interest |
| ANOVA | Analysis of Variance |
| CH | Checking Surroundings |
| CNN | Convolutional Neural Network |
| C | Category C (rare fixation category) |
| DSGP | Driver-Specific Gaze Profiling |
| EDA | electrodermal activity |
| EEG | Electroencephalography |
| GPS | Global Positioning System |
| HSD | Honest Significant Difference (Tukey test) |
| HRV | heart rate variability |
| ICT | Information and Communication Technologies |
| IP | In-Vehicle Person(s) |
| IQR | The interquartile range |
| LiDAR | Light Detection and Ranging |
| LSTM | Long Short-Term Memory |
| MIT | Massachusetts Institute of Technology |
| ON | Onboard Stimulus |
| p | p-value (statistical significance indicator) |
| R | Road (fixation category) |
| S | Traffic Signs (fixation category) |
| σ | Standard Deviation |
| V | Vehicles (fixation category) |
| VR | Virtual Reality |
| W | Pedestrians (fixation category) |
Appendix A
To determine an appropriate value for the traffic-normalisation coefficient β, we performed a data-driven sensitivity analysis across five candidate values (β ∈ {0.00, 0.05, 0.10, 0.15, 0.20}). For each value, fixation durations were normalised according to (Equation (2)) and the full DSGP pipeline was executed to compute anomaly rates. A bootstrap procedure was applied to estimate 95% confidence intervals and to quantify model stability. The results showed that anomaly rates were extremely stable across all β values, differing by less than 0.0005, but model distortion increased monotonically with larger β; see Table A1. The lowest error and most stable confidence intervals occurred for β in the range 0.00–0.10, with β = 0.00 yielding the best overall performance. Based on this analysis, β = 0.00 was selected as the optimal and most parsimonious setting for the final DSGP implementation. The anomaly rate remained extremely stable across all β values, with a maximum absolute difference of only 0.00049. Importantly, the lowest reconstruction error and tightest confidence intervals were observed for β ∈ [0.00, 0.10], after which performance worsened slightly.
Table A1.
Parameter β estimation.
Table A1.
Parameter β estimation.
| β | Anomaly Rate | 95% CI (Low–High) |
|---|---|---|
| 0.00 | 0.04866 | 0.03067–0.03538 |
| 0.05 | 0.04851 | 0.03101–0.03542 |
| 0.10 | 0.04866 | 0.03104–0.03545 |
| 0.15 | 0.04825 | 0.03018–0.03523 |
| 0.20 | 0.04817 | 0.03079–0.03508 |
Appendix B
Parameter α
To justify the adaptive baseline smoothing parameter α (Equation (7)), we conducted a sensitivity analysis across α ∈ {0.60, 0.65, 0.70, 0.75, 0.80, 0.85, 0.90, 0.95}. For each α, the DSGP pipeline was run on the full dataset and the mean anomaly rate was estimated together with bootstrap 95% confidence intervals (CIs); see Table A2.
Table A2.
Sensitivity analysis for exponential moving average (EMA) adaptation factor α.
Table A2.
Sensitivity analysis for exponential moving average (EMA) adaptation factor α.
| α | Anomaly Rate | 95% CI (Low–High) | Effective Memory Window * | Half-Life (Fixations) ** |
|---|---|---|---|---|
| 0.60 | 0.0000 | 0.0000–0.0000 | 2.5 | 1.36 |
| 0.65 | 0.0047 | 0.0068–0.0091 | 2.9 | 1.61 |
| 0.70 | 0.0178 | 0.0152–0.0182 | 3.3 | 1.94 |
| 0.75 | 0.0299 | 0.0206–0.0242 | 4.0 | 2.41 |
| 0.80 | 0.0397 | 0.0234–0.0272 | 5.0 | 3.11 |
| 0.85 | 0.0487 | 0.0309–0.0348 | 6.7 | 4.27 |
| 0.90 | 0.0545 | 0.0406–0.0460 | 10.0 | 6.58 |
| 0.95 | 0.0581 | 0.0516–0.0568 | 20.0 | 13.51 |
References
- Manzanares, M.C.S.; Ramos-Pérez, I.; Arnaiz-Rodríguez, A.; Arribas, S.R.; Almeida, L.S.; Martin, C.F. Analysis of the Learning Process through Eye Tracking Technology and Feature Selection Techniques. Appl. Sci. 2021, 11, 6157. [Google Scholar] [CrossRef]
- Kircher, K.; Ahlström, C. Chapter 19 The Driver Distraction Detection Algorithm AttenD. In Driver Distraction and Inattention, 1st ed.; Regan, M.A., Ed.; CRC Press eBooks: Boca Raton, FL, USA, 2013; Volume 1, pp. 327–348. [Google Scholar]
- Jha, S.; Marzban, M.F.; Hu, T.; Mahmoud, M.H.; Al-Dhahir, N.; Busso, C. The Multimodal Driver Monitoring Database: A Naturalistic Corpus to Study Driver Attention. IEEE Trans. Intell. Transp. Syst. 2021, 23, 10736. [Google Scholar] [CrossRef]
- Maule, L.; Luchetti, A.; Zanetti, M.; Tomasin, P.; Pertile, M.; Tavernini, M.; Guandalini, G.; Cecco, M.D. RoboEye, an Efficient, Reliable and Safe Semi-Autonomous Gaze Driven Wheelchair for Domestic Use. Technologies 2021, 9, 16. [Google Scholar] [CrossRef]
- Akhtar, Z.U.A.; Wang, H. WiFi-Based Driver’s Activity Monitoring with Efficient Computation of Radio-Image Features. Sensors 2020, 20, 1381. [Google Scholar] [CrossRef]
- Köse, N.; Köpüklü, O.; Unnervik, A.; Rigoll, G. Real-Time Driver State Monitoring Using a CNN Based Spatio-Temporal Approach. arXiv 2019. [Google Scholar] [CrossRef]
- Darapaneni, N.; Arora, J.; Hazra, M.; Vig, N.; Gandhi, S.S.; Gupta, S.; Paduri, A.R. Detection of Distracted Driver Using Convolution Neural Network. arXiv 2022. [Google Scholar] [CrossRef]
- Kalasova, A.; Culik, K.; Hajnik, A. Young Drivers and Their Risky Behaviour on the Roads. In Proceedings of the 2020 XII International Science-Technical Conference Automotive Safety, Kielce, Poland, 21–23 October 2020. [Google Scholar] [CrossRef]
- Halin, A.; Verly, J.; Droogenbroeck, M.V. Survey and Synthesis of State of the Art in Driver Monitoring. Sensors 2021, 21, 5558. [Google Scholar] [CrossRef]
- Guettas, A.; Ayad, S.; Kazar, O. Driver State Monitoring System. In Proceedings of the BDIoT’19: Proceedings of the 4th International Conference on Big Data and Internet of Things, Rabat, Morocco, 23–24 October 2019. [Google Scholar] [CrossRef]
- Atakishiyev, S.; Salameh, M.; Yao, H.; Goebel, R. Explainable Artificial Intelligence for Autonomous Driving: A Comprehensive Overview and Field Guide for Future Research Directions. arXiv 2021. [Google Scholar] [CrossRef]
- Abbas, Q.; Alsheddy, A. Driver Fatigue Detection Systems Using Multi-Sensors, Smartphone, and Cloud-Based Computing Platforms: A Comparative Analysis. Sensors 2020, 21, 56. [Google Scholar]
- Lohani, M.; Payne, B.R.; Strayer, D.L. A Review of Psychophysiological Measures to Assess Cognitive States in Real-World Driving. Front. Hum. Neurosci. 2019, 13, 57. [Google Scholar] [CrossRef]
- Begum, S.; Barua, S.; Ahmed, M.U. In-Vehicle Stress Monitoring Based on EEG Signal. Int. J. Eng. Res. Appl. 2017, 7, 55. [Google Scholar] [CrossRef]
- Keyvanara, M.; Salehi, N.; Monadjemi, A. Robust Real-Time Driver Drowsiness Detection Based on Image Processing and Feature Extraction Methods. Int. J. Veh. Saf. 2018, 10, 24. [Google Scholar] [CrossRef]
- Vetturi, D.; Tiboni, M.; Maternini, G.; Bonera, M. Use of Eye Tracking Device to Evaluate the Driver’s Behaviour and the Infrastructures Quality in Relation to Road Safety. Transp. Res. Procedia 2020, 45, 587. [Google Scholar] [CrossRef]
- Anderson, L.; Bates, L.; Schaefer, L. Design and Development of a Digital Intervention for Crime Prevention: A Road Safety Intervention Targeting Young Driver Non-Compliance. Safer Communities 2023, 22, 56. [Google Scholar] [CrossRef]
- Le, A.S.; Suzuki, T.; Aoki, H. Evaluating Driver Cognitive Distraction by Eye Tracking: From Simulator to Driving. Transp. Res. Interdiscip. Perspect. 2019, 4, 100087. [Google Scholar] [CrossRef]
- Babić, D.; Babić, D.; Cajner, H.; Sruk, A.; Fiolić, M. Effect of Road Markings and Traffic Signs Presence on Young Driver Stress Level, Eye Movement and Behaviour in Night-Time Conditions: A Driving Simulator Study. Safety 2020, 6, 24. [Google Scholar] [CrossRef]
- Zito, G.A.; Cazzoli, D.; Scheffler, L.; Jäger, M.; Müri, R.M.; Mosimann, U.P.; Nyffeler, T.; Mast, F.W.; Nef, T. Street Crossing Behaviour in Younger and Older Pedestrians: An Eye- and Head-Tracking Study. BMC Geriatr. 2015, 15, 176. [Google Scholar] [CrossRef]
- Grüner, M.; Ansorge, U. Mobile Eye Tracking during Real-World Night Driving: A Selective Review of Findings and Recommendations for Future Research. J. Eye Mov. Res. 2017, 10, 1–18. [Google Scholar] [CrossRef]
- Stein, N.; Niehorster, D.C.; Watson, T.; Steinicke, F.; Rifai, K.; Wahl, S.; Lappe, M. A Comparison of Eye Tracking Latencies Among Several Commercial Head-Mounted Displays. i-Perception 2021, 12, 2041669520983338. [Google Scholar] [CrossRef]
- Picanço, C.R.F.; Tonneau, F. A Low-cost Platform for Eye-tracking Research: Using Pupil© in Behaviour Analysis. J. Exp. Anal. Behav. 2018, 110, 157. [Google Scholar] [CrossRef]
- Hu, X.; Lodewijks, G. Detecting Fatigue in Car Drivers and Aircraft Pilots by Using Non-Invasive Measures: The Value of Differentiation of Sleepiness and Mental Fatigue. J. Saf. Res. 2020, 72, 173. [Google Scholar] [CrossRef]
- Babu, M.D.; Jeevithashree, D.V.; Prabhakar, G.; Saluja, K.P.S.; Pashilkar, A.A.; Biswas, P. Estimating Pilots’ Cognitive Load from Ocular Parameters through Simulation and in-Flight Studies. J. Eye Mov. Res. 2019, 12, 1–16. [Google Scholar] [CrossRef] [PubMed]
- Skaramagkas, V.; Giannakakis, G.; Ktistakis, E.; Manousos, D.; Karatzanis, I.; Tachos, N.S.; Tripoliti, E.E.; Marias, K.; Fotiadis, D.I.; Tsiknakis, M. Review of Eye Tracking Metrics Involved in Emotional and Cognitive Processes. IEEE Rev. Biomed. Eng. 2021, 16, 260. [Google Scholar] [CrossRef] [PubMed]
- Minadakis, G.; Lohan, K.S. Using Pupil Diameter to Measure Cognitive Load. arXiv 2018. [Google Scholar] [CrossRef]
- Nagy, V.; Bézi, P.; Kovács, G. Enhancing Bus Safety: A Modular Driver Monitoring System. Sci. Secur. 2024, 4, 274. [Google Scholar]
- AlKheder, S. Experimental Road Safety Study of the Actual Driver Reaction to the Street Ads Using Eye Tracking, Multiple Linear Regression and Decision Trees Methods. Expert Syst. Appl. 2024, 252, 124222. [Google Scholar] [CrossRef]
- Candy, T.R.; Biehn, S.; Freeman, S.; D’Alessandro, A.; Tellez, V.; Marella, B.L.; Singh, K.; Petroff, Z.; Bonnen, K.; Smith, L.B. Infants’ Use of Eye Movements to Explore Their Natural Environment. J. Vis. 2024, 24, 974. [Google Scholar] [CrossRef]
- Zemblys, R.; Niehorster, D.C.; Komogortsev, O.V.; Holmqvist, K. Using Machine Learning to Detect Events in Eye-Tracking Data. Behav. Res. Methods 2017, 50, 160. [Google Scholar] [CrossRef]
- Topolšek, D.; Areh, I.; Cvahte, T. Examination of driver detection of roadside traffic signs and advertisements using eye tracking. Transp. Res. Part F Traffic Psychol. Behav. 2016, 43, 212–224. [Google Scholar]
- Ahlström, C.; Kircher, K.; Nyström, M.; Wolfe, B. Eye Tracking in Driver Attention Research—How Gaze Data Interpretations Influence What We Learn. Front. Neuroergonomics 2021, 2, 778043. [Google Scholar] [CrossRef]
- Cvahte, T.; Topolšek, D. Eye Tracking Use in Researching Driver Distraction: A Scientometric and Qualitative Literature Review Approach. J. Eye Mov. Res. 2019, 12, 1–30. [Google Scholar] [CrossRef] [PubMed]
- Martinikorena, I.; Cabeza, R.; Villanueva, A.; Urtasun, I.; Larumbe-Bergera, A. Fast and Robust Ellipse Detection Algorithm for Head-Mounted Eye Tracking Systems. Mach. Vis. Appl. 2018, 29, 845. [Google Scholar] [CrossRef]
- Ziebinski, A.; Cupek, R.; Grzechca, D.; Chruszczyk, L. Review of Advanced Driver Assistance Systems (ADAS). In Proceedings of the International Conference of Computational Methods in Sciences and Engineering 2017 (ICCMSE-2017), Thessaloniki, Greece, 21–25 April 2017. [Google Scholar] [CrossRef]
- Nidamanuri, J.; Nibhanupudi, C.; Assfalg, R.; Venkataraman, H. A Progressive Review: Emerging Technologies for ADAS Driven Solutions. IEEE Trans. Intell. Veh. 2021, 7, 326–341. [Google Scholar] [CrossRef]
- Moujahid, A.; Tantaoui, M.E.; Hina, M.D.; Soukane, A.; Ortalda, A.; ElKhadimi, A.; Ramdane-Cherif, A. Machine Learning Techniques in ADAS: A Review. In Proceedings of the 2018 International Conference on Advances in Computing and Communication Engineering (ICACCE), Paris, France, 22–23 June 2018; IEEE: New York, NY, USA; pp. 235–242. [Google Scholar] [CrossRef]
- Khan, M.Q.; Lee, S. Gaze and Eye Tracking: Techniques and Applications in ADAS. Sensors 2019, 19, 5540. [Google Scholar] [CrossRef]
- Liang, Y.; Reyes, M.L.; Lee, J.D. Real-Time Detection of Driver Cognitive Distraction Using Support Vector Machines. IEEE Trans. Intell. Transp. Syst. 2007, 8, 340–350. [Google Scholar] [CrossRef]
- Doshi, A.; Trivedi, M.M. On the Roles of Eye Gaze and Head Pose in Driver’s Visual Attention. IEEE Trans. Intell. Transp. Syst. 2009, 10, 453–462. [Google Scholar] [CrossRef]
- Fridman, L.; Brown, D.E.; Glazer, M.; Angell, W.; Dodd, S.; Jenik, B.; Terwilliger, J.; Patsekin, A.; Kindelsberger, J.; Ding, L.; et al. MIT Advanced Vehicle Technology Study: Large-Scale Naturalistic Driving Study of Driver Behaviour and Interaction with Automation. IEEE Access 2019, 7, 102021–102038. [Google Scholar] [CrossRef]
- Greenwood, P.M.; Lenneman, J.K.; Baldwin, C.L. Advanced Driver Assistance Systems (ADAS): Demographics, Preferred Sources of Information, and Accuracy of ADAS Knowledge. Transp. Res. Part F 2022, 86, 131–150. [Google Scholar] [CrossRef]
- Mansourifar, F.; Nadimi, N.; Golbabaei, F. Novice and Young Drivers and Advanced Driver Assistant Systems: A Review. Future Transp. 2025, 5, 32. [Google Scholar] [CrossRef]
- Biassoni, F.; Gnerre, M. Understanding Elderly Drivers’ Perception of Advanced Driver Assistance Systems: A Systematic Review of Perceived Risks, Trust, Ease of Use, and Usefulness. Geriatrics 2024, 9, 144. [Google Scholar] [CrossRef]
- Liu, X.; Chen, T.; Xie, G.; Liu, G. Contact-Free Cognitive Load Recognition Based on Eye Movement. J. Electr. Comput. Eng. 2016, 2016, 1. [Google Scholar] [CrossRef]
- Armenta, J.S.; Rodríguez, M.D.; Andrade, Á.G. A Sensing Architecture Based on Head-Worn Inertial Sensors to Study Drivers’ Visual Patterns. Proceedings 2019, 31, 34. [Google Scholar] [CrossRef]
- Stempin-Mika, B.; Galant, M.; Maciejewska, M. Pilots’ Gaze Behaviour in Simulation Research. J. Konbin 2022, 52, 1. [Google Scholar] [CrossRef]
- Lavie, N. Distracted and confused?: Selective attention under load. Trends Cogn. Sci. 2005, 9, 75–82. [Google Scholar] [CrossRef] [PubMed]
- Engström, J.; Aust, M.L.; Viström, M. Effects of Working Memory Load and Repeated Scenario Exposure on Emergency Braking Performance. Hum. Factors J. Hum. Factors Ergon. Soc. 2010, 52, 551–559. [Google Scholar] [CrossRef] [PubMed]
- Xie, H. Signs and Pedestrian Safety in Automated Transportation Systems. Autom. Control Intell. Syst. 2019, 7, 46. [Google Scholar] [CrossRef]
- He, D.; Wang, Z.; Khalil, E.B.; Donmez, B.; Qiao, G.; Kumar, S. Classification of Driver Cognitive Load: Exploring the Benefits of Fusing Eye-Tracking and Physiological Measures. Transp. Res. Rec. J. Transp. Res. Board 2022, 2676, 670. [Google Scholar] [CrossRef]
- Lee, J.D. Technology and Teen Drivers. J. Saf. Res. 2007, 38, 203. [Google Scholar] [CrossRef]


Disclaimer/Publisher’s Note: The statements, opinions and data contained in all publications are solely those of the individual author(s) and contributor(s) and not of MDPI and/or the editor(s). MDPI and/or the editor(s) disclaim responsibility for any injury to people or property resulting from any ideas, methods, instructions or products referred to in the content. |
© 2025 by the authors. Licensee MDPI, Basel, Switzerland. This article is an open access article distributed under the terms and conditions of the Creative Commons Attribution (CC BY) license (https://creativecommons.org/licenses/by/4.0/).