Abstract
In organic solids, the heterogeneous distribution of organic molecules in the solid state gives rise to novel structure–property relationships. Here, we use transmission electron microscopy to investigate the aggregated structure of organic solid of a typical phosphorescent molecule Ir(ppy)3 at the atomic scale. Through the identification of heavy Ir atoms in the molecular structure, we reveal the existence of organic crystals, clusters and single molecules in the solids. Through electron energy loss spectroscopy, we explore the vibration modes of molecules and lattices in the solids and possible perturbations by excitons induced by electron beam, which could affect the electroluminescent property of the molecules.
1. Introduction
Although organic molecules are predominantly synthesized and transformed in solution phase, they are increasingly utilized in aggregated solid forms in emerging applications such as organic semiconductor materials [1,2]. The loss of molecular homogeneity in the solid state gives rise to new structure–property relationships, necessitating a fundamental understanding of structural forms at various scales—from single molecules and clusters to nanocrystals and large single crystals [3]. This necessitates an in-depth understanding of the packing structure, aggregation state, and critical properties of molecules in organic solids—a area that thus remains largely unexplored. For instance, while many conventional luminescent molecules face the challenge of Aggregation-Caused Quenching (ACQ) of their emission [4,5], the discovery of Aggregation-Induced Emission (AIE) [6,7] has provided a revolutionary strategy for developing highly efficient solid-state luminescent materials. This highlights the central importance of a structural perspective on organic solids for elucidating their properties. The structural characterization of organic solids is routinely performed using X-ray diffraction (XRD), which provides critical information on crystal structure, phase purity, molecular packing, and preferred orientation. While XRD is powerful for determining long-range order, its spatially averaged information is thus inadequate for resolving local structural variations at interfaces within multi-component organic blends. When the dimensions of the active layers in organic solid-state devices are reduced to a few hundred nanometers, subtle variations in molecular packing and spatial distribution become a critical factor, playing a decisive role in determining device performance [8]. Scanning tunneling microscopy (STM) achieves the highest spatial resolution for probing molecular structure and packing on surfaces [9], and is uniquely capable of investigating on-surface chemistry [10] at the molecular scale. Nonetheless, the broad application of this technique is largely hampered by its stringent demands for molecule dispersion on atomically flat and pure surfaces. Transmission electron microscopy (TEM) has become increasingly popular in chemical sciences, notably for characterizing inorganic nanoparticles, single-atom catalysts [11], metal–organic frameworks (MOFs) [12], and zeolites [13], achieving resolutions down to the atomic scale. Historically, the application of transmission electron microscopy (TEM) to organic materials has been largely hindered by their susceptibility to electron beam damage. However, the advent of low-dose imaging and cryogenic sample preparation techniques has now enabled the successful characterization of crystalline organic solids. In this context, micro-crystal electron diffraction (MicroED) [14,15,16,17,18,19] has emerged as a powerful technique complementary to XRD for molecular structure determination. Herein, we employ transmission electron microscopy (TEM)-based imaging and spectroscopy to investigate fac-Ir(ppy)3, short for fac-tris(2-phenylpyridine)iridium(III), a benchmark phosphorescent emitter for OLEDs. We characterize its solid-state structures across various forms and correlate their distinct structural states with the low-loss features in electron energy loss spectroscopy (EELS), which arise from exciton–lattice vibration interactions.
2. Results
2.1. Solid Crystals of Fac-Ir(ppy)3
The powders of fac-Ir(ppy)3 were purchased from a commercial vendor, and then ground to make the crystalline samples. The powder was also dispersed in water or ethanol to achieve dispersed sample. As shown in Figure 1a, the structure of fac-Ir(ppy)3 is defined by its central iridium(III) (Ir3+) ion, where Ir3+ has a d6 electron configuration transition metal. Its empty d-orbitals coordinate with the ppy− ligands, forming strong metal–ligand bonds that stabilize the complex. The three ppy− ligands are arranged such that their donor atoms (N and C) occupy three adjacent positions on an octahedral coordination sphere around Ir3+ (like the “face” of a cube). It typically crystallizes in the centrosymmetric space group P3 ̅1, and an alternative with the space group P21/c has been obtained by sublimating the compound at 385 °C [20,21]. This reflects the dominance of typical weak intermolecular forces—such as π-π interactions—in driving intermolecular packing. However, this relatively simple packing behavior also gives rise to variations in the spacing between packed molecules. Figure 1b–d show the scanning transmission electron microscopy (STEM) image in the high-angle annular dark-field (HAADF) mode of typical fac-Ir(ppy)3 crystals with a size around 1~5 μm. They show no strict preferred but irregular morphological shape, and the uniform intensity through the particles indicates their good crystallinity. Figure 1e–g show corresponding TEM images of the three particles, and we can see that several broken parts of the crystals are attached to the main particles with a seen crack on the particle (Figure 1g). Corresponding selected-area electron diffraction (SAED) patterns in Figure 1h–j are obtained from the circled areas of Figure 1e,g, respectively. We select the orientations with higher geometry (low-indexed) to highlight the packing distance at local regions. Comparing with the crystalline structure models from three axes (Figure S1), we do see several lattice spaces in Figure 1h–j, i.e., 4.42 and 7.9 Å, 5.82 and 6.93 Å, and 4.23 and 6.23 Å, which show deviation with the distances derived from powder XRD data. The XRD result in Figure S2 shows that the sample is a mixture composed of two phases (pa-3 vs. p41212). Through detailed statistical analysis we show the small variation in these plane distances in Tables S1 and S2, which highlight the relaxation of the molecular packing at the edge of the particles.

Figure 1.
(a) Molecular structure of fac-Ir(ppy)3. (b–d) STEM images of fac-Ir(ppy)3 single-crystal particles. (e–g) TEM images of the same three fac-Ir(ppy)3 single-crystal particles. (h–j) Corresponding SAED patterns of three fac-Ir(ppy)3 single-crystal particles from circled areas in (e–g).
Besides the large micro-sized crystals, we do see many nanoparticles as shown in the STEM-HAADF image of Figure 2a. These aggregated nanoparticles are formed by smaller primary particles with a size of tens of nanometers as shown in the enlarged STEM image of Figure 2b. It is noted that the vague interface among the primary particles indicate this structure may stem from the incomplete crystallization process of the molecular crystals. Further investigation of the molecular packing through high-resolution (HR)TEM in Figure 2c reveals that long-range crystallinity has not been established in these nanoparticles, but local regions of the primary nanoparticles have good packing order of the fac-Ir(ppy)3 molecules. The lattice fringes (white lines) can be clearly differentiated in the image of Figure 2d (enlarged from Figure 2c) and corresponding fast Fourier transformation (FFT) patterns reveal the lattice space of 3.53 to 3.55 Å from two packing directions. This indicates that an initial stage of crystallization through the ordered packing of molecules is the major status in these sub 100 nm sized nanocrystals.

Figure 2.
(a,b) STEM images of a large fac-Ir(ppy)3 single-crystal particle and aggregated small nanoparticles. (c,d) TEM images of the small particles. (e) Corresponding FFT pattern of (d).
2.2. Molecular Clusters of Fac-Ir(ppy)3
Since the preparation of the active layers in the device requires the dispersion of the molecules in the matrix materials, we dissolve the powder of fac-Ir(ppy)3 and prepared the dispersed sample for imaging the molecular structure of the aggregated status of fac-Ir(ppy)3 molecules. Overall, the fac-Ir(ppy)3 molecules can be well-dispersed down to the single-molecule level, as shown in the STEM image corresponding with the energy-dispersive spectroscopy (EDS) map in Figure S3, where uniform contrast of Ir elemental mapping is seen. Figure 3a and the colored image of Figure 3b show high-resolution STEM images that are able to differentiate single atoms. The bright contrast in the HAADF mode is mainly from Ir atoms in the molecules, thus enabling us to identify the location, density and interaction of fac-Ir(ppy)3 molecules. As we can see, the major phase can be identified as molecular clusters with an average size around 2~3 nm, which contain a limited number of molecules given the size of the fac-Ir(ppy)3 molecules as shown in the structure model (Figure 3c). As the TEM image is a projection of a 3D object in an 2D area, we choose this model from the direction with high symmetry to provide an estimation.
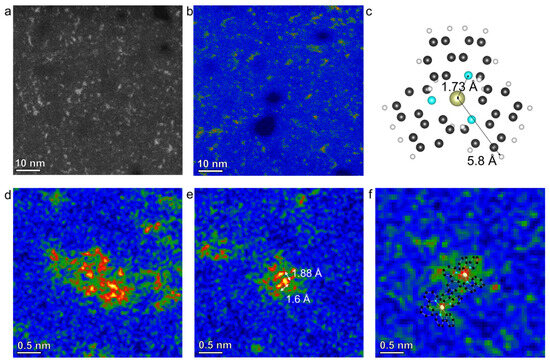
Figure 3.
(a,b) STEM images of fac-Ir(ppy)3 molecular clusters. (c) A projected structure model of the fac-Ir(ppy)3 molecule. (d,e) Typical atomically resolved STEM images show different aggregation status of the fac-Ir(ppy)3 molecules. (f) STEM image shows the single molecule of the fac-Ir(ppy)3 with superimposed molecular structure.
Figure 3d–f show atomically resolved STEM-HAADF images of molecular clusters of fac-Ir(ppy)3 with the most frequently observed three representative size ranges, i.e., 20 Å (Figure 3d), 5 Å (Figure 3e), and single molecules (Figure 3e). In Figure 3d, based on the intensity of a single Ir atom in the HAADF image mode, we could identify 28 Ir centers, thus 28 fac-Ir(ppy)3 molecules. For a 5 Å cluster, this number decreases to four molecules, as shown in Figure 3e. Note that the distances between adjacent Ir atoms (1.6 and 1.88 Å) are much smaller than the molecular radius (5.8 Å) of fac-Ir(ppy)3, as illustrated in the structural model. Even when accounting for the overlapping regions of the molecules, this distance is nearly equivalent to the projected distance between Ir and N atoms in a tetrahedral configuration. These observations indicate that fac-Ir(ppy)3 molecules can achieve a much higher packing density than that in their crystalline state when subjected to local confinement. In this case, the geometric confinement is provided by the amorphous carbon support for these molecules; however, under the actual application conditions, local confinement may vary—for instance, in thin films of blended molecules dispersed in a matrix of polymers or other small organic molecules. The image in Figure 3f depicts a single fac-Ir(ppy)3 molecule, where the red region at the center denotes the position of the Ir atom. The benzene rings exhibit a distinct green contrast relative to the support—this contrast helps to delineate the entire molecular structure within a circular region with a radius of 5 Å, a size comparable to that in the structural model. In addition, while most of the distribution of molecules is random, we did see a few ordered arrangements of the fac-Ir(ppy)3 molecules as shown in Figure S4. In a rectangular-shaped area, twelve metal centers form a 3 × 4 array leading to the diffused spots on the corresponding FFT pattern. This indicates the possibility of ordered packing of fac-Ir(ppy)3 molecules, which may serve as the elemental building blocks for organic solids. It also demonstrates the intermolecular weak force governs the packing or distribution of the molecules in organic solids.
The distance between Ir atoms illustrates how fac-Ir(ppy)3 molecules are aggregated at the single-molecular level. As shown in Figure S5, the statistical analysis of the distance between Ir atoms shows a strong peak at ~1.8 Å and another smaller peak at 4.8 Å. It is noted that the molecules can pack in the z-direction (along the viewing direction of STEM imaging), and thus the real distance can be larger than the measured value. However, the first value is still much smaller than the distance between Ir atoms in its crystalline phase, which indicates the enhanced overlapping of the molecules at the single-molecular level. This also implies other interactions than the Van der Waals force could take place at this distance. The second value indicates the normal intermolecular distance of the fac-Ir(ppy)3.
2.3. EELS Measurement of fac-Ir(ppy)3 Molecular Clusters
EELS has been used to tackle the phonon and vibrational modes of inorganic materials with the unprecedented high-spatial resolution benefiting from the small probe size of TEM. Here, we use low-loss EELS to investigate the possible molecular vibrations and the coupling with the electron-induced excitons in this electroluminescent molecule. The energy related to these physical processes is often below one electron-volt, and can be affected by the spin-orbital coupling effect. As shown in Figure 4a, we obtained two peaks for two regions with aggregated multiple molecular clusters (green) and dispersed single molecules (black). Two peaks show different characteristic values of 120 and 40 meV as shown in Figure 4b. STEM-HAADF image in Figure 4c illustrates two regions with yellow-colored regions for high intensity and a blue-colored region for low intensity. For the single-molecule region, the molecular vibration coupled with exciton energy can be the major contributor of the energy observed. This is in agreement with the similar single-molecular vibration energy as shown in Figure S6, derived from our previously reported calculation method of phonon energy in EELS [22]. For the cluster region, the aggregated multiple molecules introduce intermolecular interaction, which possibly exert confinement on the vibration in each molecule. In addition, the charge transfer between these molecules could induce pseudo “intraband” energy for excited electrons. These factors potentially lead to the shift of the characteristic energy to 120 meV. It is noted that the energy resolution in our mono-chromated EELS is ~100 meV, where multiple modes could not be reflected on the energy loss of the electrons. Meanwhile, it hinders the detection of peaks with closer energies (<100 meV) in the same spectrum rather than peaks for different spectra as shown in Figure 4. As shown in Figure 4c, the EEL spectroscopic image can achieve a point resolution ~1 Å, which is even smaller than the scattering correctional area of the Ir atom in the molecule. This enables the mapping of selected energy bands within the energy range of the spectra, as shown in Figure 4d, which uses the energy range from 100 to 140 meV. The blue color indicating this higher energy is more concentrated on the regions of aggregated clusters, which indicates an intensified vibration-related energy in molecular clusters compared with the single molecule of fac-Ir(ppy)3.
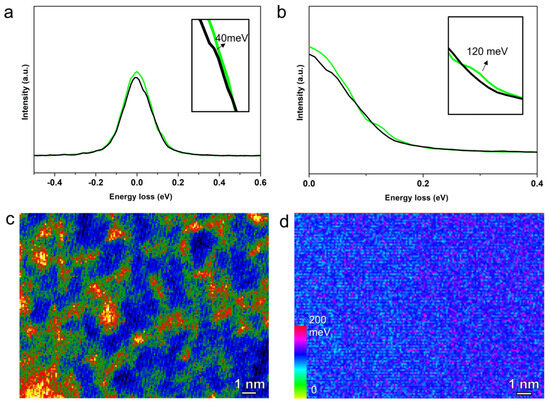
Figure 4.
(a,b) Electron energy loss spectroscopy (EELS) of the fac-Ir(ppy)3 at the single-molecula region (black) and molecular cluster region (green). (c) Colored STEM-HAADF image of fac-Ir(ppy)3 molecular clusters. (d) EELS mapping of the vibration-related energy of molecular clusters using the 100–140 meV peak region.
3. Discussion
The fac-Ir(ppy)3 forms diverse aggregation states in solids: single molecules, clusters, nanoparticles, and micro-crystals, with structural heterogeneity affecting molecular vibration. Advanced TEM (atom-resolved STEM) and EELS enable quantitative analysis of organic solid structures at the atomic scale, laying a foundation for understanding “real” aggregated structures in OLED devices, e.g., designing matrixes to control cluster size (avoiding excessive aggregation-induced quenching) and optimize charge transfer efficiency by adjusting intermolecular distances.
The aggregation status of organic molecules not only brings structural complexity to their corresponding solid organic materials, but also largely affects their critical physical and chemical properties in devices. The aggregation of small organic molecules in solids can be categorized as single-molecule, molecular clusters, nanoparticle (disordered) nanocrystals, and micro-crystals in our above study of fac-Ir(ppy)3 molecules. In the operation of an optoelectronic device, the diffusion of charge carriers to and in the aggregated molecules determines the efficiency of the optical–electronic conversion by changing the “intraband” of local structure. Moreover, the aggregation of molecules could affect the freedom of molecular vibration through neighboring molecules, and a possible “phonon” mode can be imposed if molecules are ordered in the crystalline phase. These factors collectively determine the non-radiative decay of the exciton in these local aggregated structures. And with the decreasing dimension of the organic solid layers in the device, these local variations in microstructure and property become more prominent. Our work successfully demonstrates the possible structural heterogeneity for the application of the fac-Ir(ppy)3 molecules, and their effect on the vibration mode of single molecules and molecular clusters, which lays the foundation for solving “real” structures of aggregated nanoparticles in devices.
4. Materials and Methods
Sample Preparation. The powder of fac-Ir(ppy)3 organic solids was purchased from a commercial vendor. TEM samples were prepared in two ways, i.e., 1. directly ground between glass slides and attached to TEM grids, or 2. dissolved in water or ethanol and dispersed on the TEM grids as liquid drops.
Characterizations. All TEM characterization was carried out on a double-corrected ThermoFisher® Themis Z electron microscope (ThermoFisher Scientific, Brno, Czech Republic). A Gatan® cryogenic holder was used to lower the damage to the organic sample. The EELS spectra were obtained by a Gatan Continuum® Model 1069HR (Gatan Inc., Pleasanton, CA, USA).
5. Conclusions
We investigated the structure of fac-Ir(ppy)3 organic solid by advanced TEM imaging and EELS techniques. TEM and SAED analysis of micro-sized crystals reveal the local packing variation, and HRTEM shows the initial molecular packing in nanosized solids featured with domains of ordered molecules. Atom-resolved STEM-HAADF shows the local structure of well-dispersed molecular clusters and even single molecules. Based on ultra-high spatial resolution, we use low-loss EELS measurements to obtain the peaks for vibration-coupled excitons in this electroluminescent molecule, and differentiate the molecular clusters and single molecules by their different energies.
Supplementary Materials
The following supporting information can be downloaded at: https://www.mdpi.com/article/10.3390/chemistry7060180/s1, Figure S1: Projected molecular structure from three basic axis with dimensions; Figure S2: Powder XRD of fac-Ir(ppy)3 shows the co-existence of two phases; Figure S3: a, STEM-HAADF image of dispersed clusters of fac-Ir(ppy)3 molecules. b, Corresponding EDS mapping of Ir elements; Figure S4: Atom-resolved STEM-HAADF image of dispersed clusters of fac-Ir(ppy)3 molecules and corresponding FFT pattern; Figure S5: a, STEM-HAADF image shows the measurement of the distance between Ir atom. b, statistical analysis of the distance between Ir atoms; Figure S6 Simulated EELS spectrum of a single molecule of fac-Ir(ppy)3; Table S1 Comparison between XRD and TEM data of Pa-3 phase shows the structure relaxation induced variation in lattice spaces; Table S2 Comparison between XRD and TEM data of P41212 phase shows the structure relaxation induced variation in lattice spaces.
Author Contributions
Conceptualization, L.L.; methodology, L.Z.; formal analysis, L.Z. and L.L.; investigation, data curation, L.Z., Y.Q., W.L., H.L. and Y.L.; writing—original draft preparation, L.L.; writing—review and editing, L.L.; supervision, project administration, funding acquisition, L.L. All authors have read and agreed to the published version of the manuscript.
Funding
The authors greatly appreciate the financial support from the National Key R&D Program of China (2020YFA0714602).
Data Availability Statement
All data are available upon reasonable request.
Acknowledgments
We thank the Facility Center at the Institute of Molecular Plus at Tianjin University for allowing us to use their transmission electron microscopes.
Conflicts of Interest
The authors declare no conflicts of interest.
References
- Peng, Z.; Stingelin, N.; Ade, H.; Michels, J.J. A materials physics perspective on structure–processing–function relations in blends of organic semiconductors. Nat. Rev. Mater. 2023, 8, 439–455. [Google Scholar] [CrossRef]
- Seifrid, M.; Reddy, G.N.M.; Chmelka, B.F.; Bazan, G.C. Insight into the structures and dynamics of organic semiconductors through solid-state NMR spectroscopy. Nat. Rev. Mater. 2020, 5, 910–930. [Google Scholar] [CrossRef]
- Jiang, Y.; Liu, Y.-Y.; Liu, X.; Lin, H.; Gao, K.; Lai, W.-Y.; Huang, W. Organic solid-state lasers: A materials view and future development. Chem. Soc. Rev. 2020, 49, 5885–5944. [Google Scholar] [CrossRef]
- Zhao, Z.; Zhang, H.; Lam, J.W.Y.; Tang, B.Z. Aggregation-Induced Emission: New Vistas at the Aggregate Level. Angew. Chem. Int. Ed. 2020, 59, 9888–9907. [Google Scholar] [CrossRef]
- Chen, Y.; Lam, J.W.Y.; Kwok, R.T.K.; Liu, B.; Tang, B.Z. Aggregation-induced emission: Fundamental understanding and future developments. Mater. Horiz. 2019, 6, 428–433. [Google Scholar] [CrossRef]
- Wang, H.; Li, Q.; Alam, P.; Bai, H.; Bhalla, V.; Bryce, M.R.; Cao, M.; Chen, C.; Chen, S.; Chen, X.; et al. Aggregation-Induced Emission (AIE), Life and Health. ACS Nano 2023, 17, 14347–14405. [Google Scholar] [CrossRef]
- Guan, J.; Shen, C.; Peng, J.; Zheng, J. What Leads to Aggregation-Induced Emission? J. Phys. Chem. Lett. 2021, 12, 4218–4226. [Google Scholar] [CrossRef]
- Hong, G.; Gan, X.; Leonhardt, C.; Zhang, Z.; Seibert, J.; Busch, J.M.; Bräse, S. A Brief History of OLEDs—Emitter Development and Industry Milestones. Adv. Mater. 2021, 33, 2005630. [Google Scholar] [CrossRef] [PubMed]
- de Oteyza, D.G.; Gorman, P.; Chen, Y.-C.; Wickenburg, S.; Riss, A.; Mowbray, D.J.; Etkin, G.; Pedramrazi, Z.; Tsai, H.-Z.; Rubio, A.; et al. Direct Imaging of Covalent Bond Structure in Single-Molecule Chemical Reactions. Science 2013, 340, 1434–1437. [Google Scholar] [CrossRef] [PubMed]
- Schuler, B.; Fatayer, S.; Mohn, F.; Moll, N.; Pavliček, N.; Meyer, G.; Peña, D.; Gross, L. Reversible Bergman cyclization by atomic manipulation. Nat. Chem. 2016, 8, 220–224. [Google Scholar] [CrossRef]
- Mitchell, S.; Pérez-Ramírez, J. Single atom catalysis: A decade of stunning progress and the promise for a bright future. Nat. Commun. 2020, 11, 4302. [Google Scholar] [CrossRef] [PubMed]
- Liu, L.; Zhang, D.; Zhu, Y.; Han, Y. Bulk and local structures of metal–organic frameworks unravelled by high-resolution electron microscopy. Commun. Chem. 2020, 3, 99. [Google Scholar] [CrossRef]
- Xiong, H.; Liu, Z.; Chen, X.; Wang, H.; Qian, W.; Zhang, C.; Zheng, A.; Wei, F. In situ imaging of the sorption-induced subcell topological flexibility of a rigid zeolite framework. Science 2022, 376, 491–496. [Google Scholar] [CrossRef]
- McCusker, L.B. Electron diffraction and the hydrogen atom. Science 2017, 355, 136. [Google Scholar] [CrossRef]
- Shi, D.; Nannenga, B.L.; de la Cruz, M.J.; Liu, J.; Sawtelle, S.; Calero, G.; Reyes, F.E.; Hattne, J.; Gonen, T. The collection of MicroED data for macromolecular crystallography. Nat. Protoc. 2016, 11, 895. [Google Scholar] [CrossRef]
- Krogstad, M.J.; Rosenkranz, S.; Wozniak, J.M.; Jennings, G.; Ruff, J.P.C.; Vaughey, J.T.; Osborn, R. Reciprocal space imaging of ionic correlations in intercalation compounds. Nat. Mater. 2020, 19, 63–68. [Google Scholar] [CrossRef]
- Jones, C.G.; Martynowycz, M.W.; Hattne, J.; Fulton, T.J.; Stoltz, B.M.; Rodriguez, J.A.; Nelson, H.M.; Gonen, T. The CryoEM Method MicroED as a Powerful Tool for Small Molecule Structure Determination. ACS Cent. Sci. 2018, 4, 1587–1592. [Google Scholar] [CrossRef] [PubMed]
- Gruene, T.; Wennmacher, J.T.C.; Zaubitzer, C.; Holstein, J.J.; Heidler, J.; Fecteau-Lefebvre, A.; De Carlo, S.; Müller, E.; Goldie, K.N.; Regeni, I.; et al. Rapid Structure Determination of Microcrystalline Molecular Compounds Using Electron Diffraction. Angew. Chem. Int. Ed. 2018, 57, 16313–16317. [Google Scholar] [CrossRef] [PubMed]
- Palatinus, L.; Brázda, P.; Boullay, P.; Perez, O.; Klementová, M.; Petit, S.; Eigner, V.; Zaarour, M.; Mintova, S. Hydrogen positions in single nanocrystals revealed by electron diffraction. Science 2017, 355, 166–169. [Google Scholar] [CrossRef]
- Berger, R.J.F.; Stammler, H.-G.; Neumann, B.; Mitzel, N.W. fac-Ir(ppy)3: Structures in the Gas-Phase and of a New Solid Modification. Eur. J. Inorg. Chem. 2010, 2010, 1613–1617. [Google Scholar] [CrossRef]
- Breu, J.; Stössel, P.; Schrader, S.; Starukhin, A.; Finkenzeller, W.J.; Yersin, H. Crystal Structure of fac−Ir(ppy)3 and Emission Properties under Ambient Conditions and at High Pressure. Chem. Mater. 2005, 17, 1745–1752. [Google Scholar] [CrossRef]
- Li, S.; Zhang, L.; Luo, L.; Chen, X. A theoretical study on synergistic tuning of graphene phonons via heteroatom modifications. Phys. Chem. Chem. Phys. 2025, 27, 10540–10547. [Google Scholar] [CrossRef] [PubMed]
Disclaimer/Publisher’s Note: The statements, opinions and data contained in all publications are solely those of the individual author(s) and contributor(s) and not of MDPI and/or the editor(s). MDPI and/or the editor(s) disclaim responsibility for any injury to people or property resulting from any ideas, methods, instructions or products referred to in the content. |
© 2025 by the authors. Licensee MDPI, Basel, Switzerland. This article is an open access article distributed under the terms and conditions of the Creative Commons Attribution (CC BY) license (https://creativecommons.org/licenses/by/4.0/).