


Abstract
Thermal hazards in industrial environments often remain undetected until critical failure or injury occurs. Conventional handheld infrared cameras require manual operation and limit continuous situational awareness. This study presents the design and field validation of a wearable helmet-mounted real-time thermal system based on the MLX90640 infrared array sensor and a Raspberry Pi 5 edge computing platform. Experimental validation was performed across multiple scenarios of 400 measurements based on industrial distances of 100 cm and 150 cm. The performance of the system was tested against a pre-calibrated hotspot infrared thermometer using linear regression analysis and standard error metrics to determine proportional agreement. The results indicate a strong proportional relationship between the two systems at both industrial distances, with R2 values ranging from 0.9885 to 0.9973 at 100 cm and from 0.9586 to 0.9867 at 150 cm. A moderate increase in mean absolute error (MAE) was observed as the measurement distance increased. Statistically significant increases in error were identified in mechanically dynamic scenarios where statistically significant increases in measurement error were observed (p-value < 0.05), indicating distance-dependent sensitivity under moving mechanical conditions. The higher absolute errors at longer distances mainly result from field-of-view expansion, reduced target occupancy, and mixed-pixel hotspot effects rather than weakened proportional trend stability. An industrial distance-aware linear regression model was developed to describe behavior and support calibrations under different deployment conditions. Despite minor absolute deviations during dynamic operations, the system maintained strong trend-tracking performance, suggesting suitability for daily preliminary hazard monitoring in industrial safety maintenance.
1. Introduction
Thermal hazards are a common and often hidden danger to first-line workers across many safety-critical environments, including construction zones, electrical maintenance areas, and fire response situations [1,2]. While workers may be aware of hot machinery or live panels in the area where they are working, hot spots can be invisible due to smoke, dust, and other obstructions, delaying workers’ reactions and increasing their risk of injury [3]. Traditional thermal monitoring methods that use handheld IR thermometers and thermal cameras generally require manual observation and workflow interruptions, limiting hands-free awareness and increasing latency for workers inside dynamic work situations [4]. In addition, maintenance technicians who inspect electrical systems spend considerable time locating abnormal heat patterns caused by overburdened circuits, loose terminals, insulation degradation, and component aging [5].
Therefore, an acute need for compact wearable thermal sensing technology exists to provide real-time thermal awareness for personnel operating in high-temperature, low-visibility situations [6,7].
These wearable systems can integrate IoT (edge computing) hardware to autonomously monitor thermal areas, perform on-device analytics, and alert users without relying on network connectivity, thereby providing a basis for safety-related industrial applications [8,9,10].
Recent advances in low-cost thermal sensors and embedded edge computing platforms have made it possible to develop practical workable thermal monitoring solutions for occupancy detection and proximity detection applications [11,12,13]. Low-cost grid-based infrared thermal sensors have been widely adopted in IoT applications such as occupancy detection, proximity sensing, and basic environmental monitoring. Nevertheless, their limited spatial resolution and constrained thermal measurement range reduce their capability to reliably localize small or evolving hotspots in industrial environments. The motivation for exploring higher-resolution, edge-deployable thermal sensing platforms is to improve hotspot detectability while maintaining practical cost and power characteristics [14,15]. However, the IoT-based solution for thermal detection does not provide sufficient spatial resolution or an adequate thermal range for accurate hotspot localization in industrial environments [16,17,18,19,20]. On the other hand, MEMS array sensors such as the MLX90640 offer a balance between cost, resolution, and ease of integration, as well as the capability of detecting temperature changes [16,17,18]. The MLX90640 has up to 32 × 24-pixel resolution of thermal data and is able to detect temperature change over approximately 300 °C and is compatible with popular microcontrollers and single-board computer systems such as the Raspberry Pi family, making it a very attractive option for low-power embedded wearable IoT applications [16,19].
Despite growing interest in IoT-based wearable thermal systems, several critical gaps remain. First, the literature lacks robust performance evaluations of reliability in safety-centric wearable deployments. Many existing systems focus on image acquisition and visualization [9,16] or centralized processing pipelines [20,21] but do not quantify how measurement error and accuracy behave under realistic operational scenarios. Second, research on helmet-mounted or body-worn thermal sensing devices for real-time hotspot detection is sparse [9,15], particularly in studies that integrate logic and feedback for frontline users. Third, comparative reliability data, such as false-positive rates, response times, and detection accuracy relative to calibrated reference instruments, are often absent in safety-critical industrial environments [6,22,23].
A particularly overlooked aspect in current wearable thermal IoT research is the distance-dependent variation in thermal measurement behavior caused by field-of-view expansion and changes in target fill factor. In real-world deployments, as the target distance from the sensor increases, each MLX90640 pixel subtends a larger projected surface area, increasing the likelihood that localized hotspots, adjacent heated regions, and surrounding thermal gradients are integrated into a single sensing element. The effect can affect both the amount of measurement error and the sign of bias (i.e., bias), particularly when there are low-resolution infrared arrays utilized throughout dynamic industrial environments [17,24]. Such distance-dependent sensing behavior may degrade hotspot localization quality if not modeled, and it will likely also affect the reliability of field device deployment. Previous researchers have examined methods for correcting for distance-induced attenuation and compensating for emissivity in stationary infrared systems [24,25,26], but little prior work has addressed how distance-related effects present in wearable IoT thermal sensors during operation in real industrial environments. Therefore, it is necessary to develop and quantify a practical model to compensate for distance-related sensing effects and, as a result, advance measurement correctness and enable the safe use of wearable thermal systems in industrial safety.
To address these gaps, this study proposes a practical, helmet-mounted thermal hotspot detection system supporting low-cost thermal sensing, and further introduces a distance-aware attenuation modeling framework to quantify and predict the systematic error. Additionally, a new method to calculate the distance-based attenuation of thermal sensors has been developed. This study utilizes a Raspberry Pi 5 with a 3.5″ touch screen as the display unit, a Raspberry Pi 5 as the processing unit, and the MLX90640 thermal array sensor as the thermal sensor unit.
This study differs from all previous wearable thermal studies by including an evaluation of the system performance using a rigorous test procedure that includes real-world testing of the system in various industrial settings (electrical cabinets, rotating machinery, gear boxes, and low light conditions), and comparing the results of the system with calibrated reference devices (industrial handheld IR thermometers and commercial thermal cameras). Reliability of the system is evaluated statistically using the coefficient of determination (R2) [18,27] and two common methods for determining the amount of error associated with measured values of mean absolute error (MAE) and Root Mean Square Error (RMSE). A contribution of this study is the development of a distance-aware attenuation model based on linear regression that defines how the error associated with a measured value varies as a function of the physical distance between the sensor and the object being measured. This model will enable researchers and developers to create models that compensate for or calibrate the effects of physical distance in wearable thermal sensor systems.
Thus, the objectives of this study are fourfold:
- To design and implement a wearable edge thermal sensing system (i.e., an embedded platform performing local thermal data processing without cloud dependence) suitable for helmet integration.
- To develop and validate a threshold-based thermal detection with visual feedback;
- To evaluate system performance and reliability across realistic industrial scenarios using quantitative metrics;
- To formulate and analyze a distance-aware attenuation model using linear regression to quantify systematic measurement error.
To guide this investigation, the study addresses the following research questions:
- RQ1: How accurately can the helmet-mounted system detect and localize thermal hotspots using the MLX90640 sensor in industrial settings?
- RQ2: How does measurement error vary with target distance, and can a predictive model capture this attenuation effect?
- RQ3: How reliable is the system in issuing temperature-based information under operational conditions?
Accordingly, this study proposes the following hypotheses:
Hypothesis 1 (H1).
The wearable, helmet-mounted thermal sensing system can successfully measure and track all types of thermal anomalies on an industrial site as they occur instantaneously, providing the operator sufficient portability to be used in the field.
Hypothesis 2 (H2).
There is a predictable relationship between sensing distance and the corresponding measurement difference relative to the reference device, and within the operationally recommended industrial sensing range (<200 cm), this relationship can be effectively characterized by a linear regression model.
By proposing an innovative research contribution, this study represents the comprehensive investigations that combine a helmet-mounted wearable thermal sensing platform, embedded edge processing, and statistical reliability evaluation under realistic industrial operating conditions. In addition, the proposed distance-aware attenuation model characterizes the measurement limitations of low-resolution infrared array sensors as a function of sensing distance, thereby providing practical guidance for the design and deployment of real-time thermal hazard screening in safety-critical environments.
The remainder of the paper is structured as follows. Section 2 reviews related work on wearable IoT thermal sensing and attenuation modeling; Section 3 details the system design and implementation; Section 4 presents experimental results and statistical analysis; Section 5 discusses implications, limitations, and concludes the study.
2. Related Work
2.1. Overview of Thermal Sensors in IoT Systems
In the last few years, many new thermal-sensing technologies have been integrated into embedded and Internet of Things (IoT) systems. This is largely because very small, low-power infrared (IR) thermal sensors are now available and can be used for real-time temperature measurement across a wide range of applications, from energy-efficient building control and industrial automation to human presence detection. There are several different types of thermal sensors that may be used depending upon the specific use case, including thermopile arrays (such as the AMG8833), pyroelectric IR sensors, and micro-bolometer-based thermal sensors (such as the FLIR Lepton and MLX90640). Each of these sensors varies in terms of spatial resolution, thermal sensitivity, and integration complexity.
In the realm of thermal sensing via IoT (Internet of Things), particularly with respect to photothermal treatment (and similar applications) that requires the target to be located at a relatively close distance to the thermal sensor, there are many advantages in using camera-based thermal detectors for real-time thermal monitoring.
There are numerous options available in the market for thermal cameras, ranging from low-cost modules ($100–1000) to high-end systems (over $5000) based on factors such as resolution, focal length, and sensor array size. While low-end models like the AMG8833 thermopile array offer advantages in affordability and ease of integration, their limited 8 × 8 resolution and narrow temperature detection range constrain their applicability in scenarios requiring high spatial precision. Conversely, advanced solutions such as the FLIR Lepton series provide enhanced thermal resolution (up to 160 × 120) and sensitivity but at the expense of higher cost and greater system complexity. The MLX90640 sensor, offering a balanced specification with 32 × 24 resolution and a temperature range extending to 300 °C, presents an optimal compromise between performance and integration feasibility. The sensor is compatible with low-power embedded systems and standard communication protocols, making it suitable for thermal imaging tasks where moderate spatial resolution, low power consumption, and cost-effectiveness are important design requirements [28]. The comparison of thermal sensors is represented in Table 1.
Table 1.
Comparison of thermal sensors for IoT applications.
2.2. Thermal Imaging in Safety-Critical Systems
Thermal imaging has become a popular technology in safety-critical systems, especially when it is difficult to visually observe a particular situation. Thermal cameras are able to detect heat signatures through thick smoke or darkness by providing responders with the ability to locate humans, fire sources, and structural weaknesses. Thermal monitoring is also utilized in industrial environments as an early warning system for overheating machinery, electrical faults, and process anomalies, which can ultimately lead to catastrophic failure of equipment. Studies have demonstrated the usefulness of thermal imaging in non-contact diagnostics and early warning systems. However, many of these systems rely on handheld devices or stationary thermal cameras, which require manual interpretation and do not provide immediate feedback to the user. This gap in real-time, hands-free, and embedded thermal response systems limits the responsiveness and effectiveness of such technologies in dynamic or hazardous situations, as shown in Table 2.
Table 2.
Comparison of existing studies in the areas of thermal sensor domains.
2.3. Overview of IoT-Based Thermal Monitoring System and Gaps
Edge computing has become an increasingly important paradigm in IoT deployments, particularly for applications requiring real-time responsiveness and data privacy [30]. Performing computation directly on embedded devices such as Raspberry Pi [12], ESP32 [31,32], and ARM-based microcontrollers [33] allows systems to analyze and act upon data locally without the latency introduced by cloud-based processing. In thermal sensing, many edge computing researchers proposed real-time heat detection [34], temperature thresholding [35], and even lightweight AI inference [36] for classification, anomaly detection, and controlling temperatures under safe levels of operation. Raspberry Pi devices, in particular, have become a popular platform for thermal IoT systems due to their processing power, GPIO flexibility, and compatibility with a wide range of sensors and displays. Prior work has utilized Raspberry Pi in conjunction with AMG8833 and MLX90640 for tasks such as room occupancy estimation, thermal comfort analysis, and basic triggering [37,38]. However, most of these implementations focus on static environmental monitoring rather than dynamic, wearable systems.
Regarding the MLX90640 sensor, several studies have investigated it in embedded thermal vision systems. For example, some research has examined its application in mobile robots for person counting from heat [39], while others have implemented the sensor in smart HVAC systems to optimize energy usage [40]. A few works have attempted real-time thermal visualization using the MLX90640 on Raspberry Pi with overlays displayed on LCD or HDMI monitors [37,39]. However, these efforts rarely go beyond visualization, lacking proactive systems or integration with human-wearable platforms. Furthermore, systems that use thermal sensors are typically evaluated in implementation terms, without conducting a detailed statistical evaluation of their reliability, including measures such as precision, recall, false positives, and response time.
To date, there is limited research that combines wearable thermal sensing, real-time hotspot visualization, threshold-based awareness, and embedded system integration into a single platform. Even fewer studies systematically assess the reliability under controlled conditions using quantifiable performance metrics [22]. While edge computing has enabled greater independence and responsiveness in sensor platforms, its potential for helmet-mounted thermal hazard detection remains largely underexplored. This research seeks to fill that gap by proposing a compact, Raspberry Pi-based system using the MLX90640 sensor for thermal hotspot detection, visual feedback, and information generation.
2.4. Comparison of IoT Platforms for Thermal Camera Integration
The performance and responsiveness of the embedded thermal imaging system depend on the type of IoT platform used to support it. Platforms from the Raspberry Pi family of products have been very popular among users of thermal imaging systems because they provide an ideal combination of processing capability, memory, and GPIO options, along with access to open-source communities for development and modification. The Raspberry Pi board will work very well with higher-resolution thermal cameras, enabling real-time viewing, data processing, and threshold-based temperature detection. There are many other types of IoT platforms, including ESP32, Arduino, and Jetson Nano, that are commonly used in thermal IoT applications, each having its own strengths and weaknesses. For example, the ESP32 provides good support for low-power applications and basic temperature threshold detection; however, it lacks sufficient resources to perform real-time rendering of thermal images or to support complex user interfaces. Arduino boards can be used with smaller thermopile sensors, such as the AMG8833, for binary temperature readings; however, they do not support generating visual heat maps. On the other hand, Jetson Nano and other NVIDIA devices provide GPU-accelerated computing and are good choices for AI-enhanced thermal image processing; however, they are very power-hungry and costly. The Raspberry Pi 5 fills this void by providing a full Linux environment that supports HDMI and SPI displays, Python-based libraries (such as OpenCV, matplotlib, and NumPy) [41], and even lightweight edge AI inference. Due to its ability to run in real time, generate heat maps, monitor temperatures locally and integrate periphery (for example, buzzer, screen), the Raspberry Pi 5 and the PiSugar 3 Plus were chosen as the most appropriate for the wearable application described in this paper due to their balance of processing capability, flexibility, and deployment ability, as illustrated in Table 3.
Table 3.
Comparison of IoT platforms for thermal imaging applications.
3. System Design, Implementation, and Evaluation
This section will detail the overall design and technical execution of the proposed helmet-mounted thermal hotspot detection system. The system has been designed to incorporate low-cost, low-power components into a wearable format for real-time thermal imaging and probing. The system was specifically designed to provide autonomous thermal awareness in high-risk, safety-critical environments such as construction sites, industrial inspection areas, and fire-prone areas. The proposed system incorporates a Raspberry Pi 5 computing unit, a high-resolution thermal sensor (MLX90640), and a 3.5″ touch screen Raspberry Pi 5 display to provide real-time heat map visualization of the environment.
3.1. Hardware Architecture
The hardware setup of the proposed system was designed to balance computational power, sensing resolution, and energy efficiency while remaining compact and wearable. At the core is the Raspberry Pi 5 (8 GB), chosen for its quad-core performance, GPIO flexibility, and compatibility with Python-based thermal imaging libraries. It interfaces with the MLX90640 thermal infrared sensor, which is sufficient to identify abnormal heat zones in real time. The processed thermal data is rendered visually on a 3.5″ touch screen Raspberry Pi 5, which is lightweight and efficient for continuous output. All components are represented in Table 4.
Table 4.
Hardware components of the helmet-mounted thermal monitoring system.
The entire assembly has been enclosed in an ordinary industrial safety helmet that protects users’ heads. All the wires and electronic components are mounted inside the helmet so that they neither obstruct users’ view nor hinder their movement. Figure 1 shows that the portable battery pack powers the system, enabling continuous operation for many hours without being tethered. To maintain safety, protect against electrical shock, provide easy access for repair/maintenance, and make it easier to route the wires, all wires have been placed along the inside of the helmet.
Figure 1.
Hardware architecture of the IoT-based thermal monitoring system.
3.2. Software Architecture
The complete prototype is embedded in a standard industrial safety helmet and features a modular, flexible system architecture that prioritizes real-world deployability. By leveraging accessible commercial off-the-shelf hardware modules and reusable subsystem interfaces, the platform enables efficient component integration, simplified maintenance, and future extensibility for additional sensing and alert units, consistent with layered modular design and adaptive integration principles reported in prior studies [42,43]. The software architecture of the proposed system was designed to support real-time data acquisition, thermal image processing, visualization, and monitoring, all on board the Raspberry Pi 5, as illustrated in Figure 2.
Figure 2.
Wearable thermal detection software system design using a layering approach.
The system is implemented primarily in Python and runs on the Raspberry Pi OS, leveraging a combination of open-source libraries to manage sensor interfacing, data processing, and user interaction. Thermal data acquisition begins with the MLX90640 sensor, providing thermal frames at a selectable frame rate. These frames are captured and calibrated using sensor-specific libraries to yield an accurate 32 × 24 temperature matrix. Each matrix represents the real-time thermal profile of the user’s field of view. A thresholding module continuously scans each frame to determine the maximum temperature value. In parallel, the software identifies the pixel coordinates of the hottest region, which is crucial for localizing the thermal anomaly. Visualization is handled using a real-time rendering engine that converts each calibrated thermal frame into a color heatmap. This heatmap is resized for the 3.5″ touch screen Raspberry Pi 5 and includes a visual marker (typically a circle or crosshair) at the detected hotspot location. The color map is chosen to provide an intuitive interpretation of temperature gradients, improving situational awareness during operation.
The implemented Raspberry Pi 5 processing pipeline operated at approximately 8–9 frames per second, corresponding to an average end-to-end processing latency of approximately 111–125 milliseconds per frame. This latency includes MLX90640 frame acquisition, thermal interpolation, hotspot extraction, threshold evaluation, and wrist-display rendering, thereby providing sufficiently responsive thermal feedback for frontline industrial inspection tasks. The observed performance is consistent with prior MLX90640-based Raspberry Pi thermal imaging workflows reported in the literature. To improve thermal image stability and suppress frame-to-frame sensor fluctuation, a lightweight temporal smoothing strategy was applied across consecutive thermal frames, reducing visible sensor noise while preserving the rapid hotspot responsiveness required for real-time wearable hazard screening. The system architecture also includes an optional logging module that records timestamped maximum temperatures, enabling performance evaluation and post-deployment analysis. This software framework ensures the system can function autonomously, delivering accurate thermal visualization and responsive information in safety-critical environments. It also provides the flexibility to expand capabilities as user requirements and technology evolve.
3.3. Wearable Integration and Mechanical Design
The integration of system components into the helmet-mounted platform was designed with careful attention to ergonomics, operational safety, mobility, and functional accessibility. As shown in Figure 3, the safety helmet serves as the primary structural platform, enabling the system to remain wearable while minimizing interference with user mobility and visual acuity. The component layout was intentionally arranged to maintain a balanced weight distribution and provide convenient access during field operations.
Figure 3.
Wearable thermal detection system hardware setup.
The MLX90640 thermal sensor was mounted at the front edge of the helmet and aligned with the user’s line of sight, allowing real-time thermal capture of the immediate forward field of view and enabling prompt detection of hazardous heat zones in the direction of movement. The total weight of the integrated prototype, including the Raspberry Pi 5, PiSugar battery, display unit, and thermal sensing module, was approximately 690 g. To improve comfort during prolonged inspection tasks, the weight was distributed laterally across the helmet shell, reducing localized neck loading and minimizing fatigue during extended wear.
The 3.5-inch wrist-mounted display was intentionally selected to avoid forward visual obstruction and to preserve direct attention to the surrounding task environment, while still allowing workers to perform intermittent thermal checks as needed. This design choice supports situational awareness in safety-critical operations where continuous forward visibility is essential.
To enhance both safety and flexibility, all wiring was routed inside the helmet’s internal shell using heat-resistant, shielded cables. The internal routing was secured with Velcro straps, while all electrical joints were soldered and mechanically reinforced to protect against wire fatigue caused by repeated user motion. The Raspberry Pi 5 and battery pack were housed in a compact, weatherproof enclosure mounted on the side of the helmet, providing additional balance and enabling easy removal for maintenance or recharging.
The overall platform was developed as a modular wearable architecture, enabling adaptation to different helmet types and deployment scenarios. This modularity improves practical usability for on-site maintenance workers, field engineers, firefighters, and rescue personnel who require real-time thermal awareness without compromising comfort or safety [44]. The practical and ergonomic characteristics of this helmet-integrated design further support its potential for deployment in real-world safety-critical environments. An example of the proposed helmet-mounted thermal camera system is shown in Figure 4.
Figure 4.
Prototype of a helmet for thermal detection.
3.4. Operational Testing and Statistical Validation
To assess the reliability and practical applicability of the proposed helmet-mounted thermal detection system, a rigorous evaluation framework was implemented, consisting of operational field testing, statistical analysis, and post-improvement validation. The selected sensing distances of 100 cm and 150 cm were intentionally defined to reflect the practical and safe inspection distances commonly adopted by industrial maintenance personnel when assessing potentially hazardous equipment. In real-world thermal inspection workflows, hotspot screening is typically conducted within close-to-mid operational proximity and generally below 200 cm, allowing sufficient spatial resolution for accurate hotspot localization while maintaining safe operator positioning. At shorter distances, operator exposure to thermal or electrical hazards may increase, whereas at longer distances, the effective field of view of the low-resolution infrared array sensor expands substantially, reducing the thermal target fill factor and increasing spatial averaging effects. These factors can compromise hotspot localization fidelity and measurement reliability. Accordingly, the chosen distance range represents a practical balance between operational safety requirements and dependable thermal sensing performance and was therefore considered representative of the intended deployment envelope for the proposed wearable safety system. The operational testing phase involved four distinct field trials (Operational Testing (100 cm and 150 cm) × 4 times) conducted in collaboration with maintenance teams under real-world industrial conditions. During these sessions, temperature data collected by the proposed system was cross-referenced with standard reference devices to establish ground truth values. In this study, the Testo 830-T2 infrared thermometer was used to compare the temperature data. During validation, the laser red dot of the Testo 830-T2 was aligned with the center of the thermal camera target region to ensure consistent center-based hotspot acquisition and improve region correspondence between the reference measurement and the MLX90640 thermal array output.
To quantify measurement accuracy and determine the error margin, the R2 was utilized. This statistical metric indicates the proportion of variance in the dependent variable (system readings) that is predictable from the independent variable (reference readings). The R2 value is calculated using Equation (1):
where is the coefficient of determination (unitless);
is the residual sum of squares representing the unexplained variance between predicted and observed temperatures (°C) and is defined as Equation (2);
is the total sum of squares representing the total variance of the observed reference temperatures relative to their mean (°C).
where denotes the observed temperature measured by the calibrated reference thermometer (°C);
denotes the temperature predicted by the proposed wearable thermal system (°C);
n is the total number of observations.
Following the initial trials and subsequent prototype refinements based on user feedback, a post-improvement testing phase consisting of two additional trials was conducted. These final tests focused on verifying temperature accuracy and measuring the response time for hotspot localization.
The final data analysis was structured to explicitly address the study’s central research questions. To determine how accurately the system can detect hotspots and how reliable it is in issuing monitoring (addressing the first and second research questions), the system’s precision was evaluated by calculating the percentage accuracy relative to the reference tools, with a performance benchmark established at greater than 75%. Simultaneously, to assess whether the system is practical for real-world deployment (addressing the third research question), operational suitability was evaluated using usability questionnaires that gauged user satisfaction with device weight, portability, and ease of use.
4. Results and Discussion
4.1. Operational Performance Evaluation in Industrial Environments
To ensure methodological consistency, all measurements were performed under predefined test conditions. The measurement distance was standardized at 1.00 m for stationary targets and extended up to 1.50 m for moving machinery to ensure operator safety. Illuminance levels (lux) were set and recorded using a calibrated lux meter at the helmet position prior to each test session. The angle of incidence was maintained within 0–15° relative to the surface normal to minimize emissivity-related reflection errors.
The testing protocol was designed to cover five critical operational scenarios, each representing a unique thermal monitoring challenge:
- Low-Light Conditions: Testing the sensor’s independence from visible light sources in confined or poorly illuminated areas. The scenario was set with an illuminance of 30–50 lux and a distance of 100 cm. The objective was to verify that the infrared temperature measurement remains unaffected for low visible-light intensity.
- Continuous-Operation Machinery: Assessing stability under prolonged thermal exposure and enclosure heat accumulation. The scenario was set with an illuminance of 150–500 lux and a distance of 100 cm. The exposure duration was ≥ 30 min of continuous operation. The objective was to evaluate thermal drift and potential bias caused by internal helmet heat build-up during extended operation.
- Conveyor Belts and Gearboxes: Evaluating performance on moving targets subjected to frictional heat and mechanical vibration. The scenario was set with an illuminance of 200–800 lux and a distance of 100 cm. The motion condition was to activate belt rotation during measurement. The objective was to assess measurement stability under dynamic surface motion and variable emissivity conditions.
- Electrical Control Cabinets: Verifying precision in detecting localized overheating at electrical connection points and circuit breakers. The scenario was set with an illuminance of 300–1000 lux and a distance of 100 cm. The surface type was painted metal or insulated terminals. The objective was to detect small thermal anomalies associated with potential electrical faults while minimizing reflective artifacts.
- Motors and Bearings: Testing sensitivity to rotational friction and early-stage overheating in mechanical assemblies. The scenario was set with an illuminance of 150–700 lux and a distance of 100 cm. The target location was the bearing housing and motor casing near the drive-end. The objective was to evaluate the detection capability for friction-induced heat concentration during active rotation.
The dataset comprises 400 discrete measurements derived from 100 unique test patterns, each replicated four times to ensure statistical robustness and reduce random measurement variance. Each test configuration maintained consistent geometric alignment and environmental recording to enable reliable comparison across scenarios. The samples of thermal detection under different conditional testing at 100 cm were shown in Figure 5a–d.
Figure 5.
Demonstrates the system’s real-time rendering performance, operating at approximately 8–9 FPS under continuous thermal streaming.
Performance Analysis by Operational Scenario
To ensure the system’s versatility, performance was disaggregated by operational scenario.
- Effect of measurement distance under low-light conditions (N = 68): To evaluate the system’s performance and the influence of measurement distance under low-light conditions, a comparative analysis was conducted at 100 cm and 150 cm. A time series of temperature was used for the progressive tracking of temperature during the test sequence by use of linear regression and the coefficient of determination (R2). At a distance of 100 cm (one meter) from the test sample, the MLX90640 sensor showed excellent performance in temperature tracking. Using a linear regression model for the MLX90640, the data had a regression equation of y = 1.2328x + 37.794 (R2 = 0.9934), which was very close to the regression equation of the reference instrument at the same distance of y = 1.2155x + 38.478 (R2 = 0.9893). With the nearly equal slopes and the R2 values (greater than 0.99) showing good correlation, it indicates that the sensor is able to capture the true temperature changes with small errors at this distance. At a distance of 150 cm from the test sample, the system performed well in terms of linearity. The sensor’s regression equation changed to y = 1.1491x + 44.063 (R2 = 0.9804) while tracking the reference device at the same distance (y = 1.1364x + 45.041, R2 = 0.9873) very closely. However, when comparing the MLX90640 data directly between the two distances, the sensor experiences an attenuated effect of the spatial dimension. At 150 cm, the slope decreased from 1.2328 to 1.1491; therefore, the sensor is less responsive to the temperature increase in the test sample. This reduction occurs due to the fact that when the distance increases, the Field-of-View (FoV) of the sensor also increases, and therefore the thermal radiation emitted by the individual pixels averages the hotter hotspot with the cooler ambient environment. Although there exists a difference in distance and therefore FoV-induced offsets in the MLX90640 data between the two distances, the high R2 values (>0.98) throughout all conditions support the reliability of the system to identify thermal trends in low-light environments. Figure 6 is a comparison plot of temperature measurements taken by the MLX90640 sensor and the reference instrument at sequential test samples. The left panel illustrates the sensor’s performance at a measurement distance of 100 cm, the middle panel is a plot of the sensor’s performance at a measurement distance of 150 cm, and the right panel demonstrates the impact of spatial attenuation on measurement accuracy of the MLX90640 readings when compared at both distances.
- Effect of measurement distance under continuous-operation machinery (N = 108): To further evaluate the reliability of the thermal tracking system in continuous operation on industrial machinery, the test was expanded over a higher temperature range up to about 140 °C. An analysis comparing the linear regression of the MLX90640 sensor and the reference device at 100 cm and 150 cm is shown in Figure 7. As depicted in the left panel (distance of 100 cm), the MLX90640 demonstrated almost perfect proportional tracking. The slopes of the linear regression of the MLX90640 (y = 0.8666x + 48.181) and the calibrated reference device (y = 0.8671x + 47.332) are virtually indistinguishable as well. Additionally, the coefficients of determination for the MLX90640 (R2 = 0.9957) show excellent signal stability with very low variance due to noise. Therefore, it can be concluded that at 100 cm, the sensor accurately reproduces the rate of temperature increase in the object being measured. When the distance of the measurement was increased to 150 cm (Middle Panel), the system still showed an exceptional degree of linearity. The MLX90640 showed an R2 of 0.9981 with a linear regression equation of y = 0.8596x + 45.733. The regression line of the MLX90640 remained in close agreement with the regression line of the reference device (R2 = 0.987) at the same distance. In contrast to most thermally sensitive sensors that exhibit significant signal loss at longer distances than their recommended range, the MLX90640 retained its ability to provide proportional measurements. In addition to demonstrating that the MLX90640 is able to capture the spatial attenuation of temperature at different distances, the right panel (100 cm vs. 150 cm) illustrates a small downward shift in the regression lines for the slope (from 0.8666 to 0.8596) and the constant term (from 48.181 to 45.733) when moving from 100 cm to 150 cm. This limited downward shift is a physical phenomenon inherent to the increasing FoV of the sensor as it collects more ambient cooler air in addition to the primary heat source. However, the consistently high R2 values (>0.99) confirm that the sensor is capable of identifying critical thermal threshold levels and overheating trend lines, even at a distance of 1.5 m.
- Thermal tracking of conveyor belts and gearboxes (N = 76): The comparison between the results obtained using the MLX90640 sensor and those from the reference device when measuring conveyor belts and gearboxes at measurement distances of 100 cm and 150 cm are presented in Figure 8.
Figure 6.
Comparison of temperature measurement validation under low-light conditions between 100 cm and 150 cm.
Figure 7.
Comparison of temperature measurement validation for continuous-operation machinery between 100 cm and 150 cm.
Figure 8.
Comparison of temperature measurement validation for conveyor belts and gearboxes between 100 cm and 150 cm.
The purpose of the test is to assess the system’s ability to detect thermal signals generated by friction on moving mechanical parts. Tests have been performed at two distances (100 cm and 150 cm) and the comparative results illustrate the robustness of the MLX90640 sensor regarding the detection of thermal signatures generated by friction on moving mechanical parts. The regression line (y = 1.2359x + 41.247) obtained at a distance of 100 cm (left panel) illustrates the excellent proportionality of the response of the MLX90640 sensor to the measured temperatures. The excellent value of the coefficient of determination (R2 = 0.9927) confirms that the response of the MLX90640 sensor is very similar to that of the reference instrument (y = 1.2419x + 41.117; R2 = 0.9869). The similarity of the slopes of the regression lines and the constant terms (i.e., ~41.2 vs. ~41.1) demonstrate that at 100 cm proximity, the helmet-mounted system can detect rapidly increasing frictional temperatures due to the movement of the mechanical parts and does so without noticeable signal loss. When the measurement distance is increased to 150 cm (middle panel), the relationship between the output of the MLX90640 sensor and the measured temperatures continues to be highly linear (R2 = 0.9802). However, the MLX90640 sensor yields a lower slope (1.2274 vs. 1.2521) than the reference device, which reflects the influence of the ambient temperature integrated within the expanded FoV at 150 cm. The integration of cooler ambient air into the measurement zone appears to cause the MLX90640 sensor to record a lower rate of temperature increase. Nevertheless, the high R2 values for both measurement distances provide evidence that the MLX90640 is effective in the continuous monitoring of moving mechanical components and capable of detecting heat accumulation trends, thus providing a method for identifying potential overheating in mechanical systems, particularly gearboxes and conveyor rollers, before critical mechanical failures occur.
- Thermal tracking for electrical control cabinets and wiring connections (N = 68): At a near distance of 100 cm (left panel), the MLX90640 showed excellent performance and very good linearity when used to track the thermal activity associated with electrical control cabinets and wiring connections, from a safe distance. The system’s linear fit equation was y = 1.2359x + 34.195 (with a very low and stable coefficient of determination of R2 = 0.9922), which was very close to that provided by the calibrated reference instrument (y = 1.2191x + 34.454; R2 = 0.9866). The almost identical slope and intercept values indicate that the helmet-mounted system is capable of accurately mimicking thermal changes in electrical components, thus providing prompt detection of important abnormalities. A similar level of stability was demonstrated at a greater distance of 150 cm (middle panel), a realistic safe distance for high-voltage inspections, as shown in the right panel (100 cm vs. 150 cm). The MLX90640 produced a linear fit equation of y = 1.0999x + 41.252 (with an R2 of 0.9941), whereas the reference instrument produced y = 1.1212x + 39.786 (R2 = 0.9807). The increased distance resulted in the sensor capturing more of the lower temperature background within the cabinet, resulting in a slight decrease in sensitivity (the slope decreased from 1.2359 to 1.0999) and a small increase in baseline (positive offset). However, the R2 remained at or above 0.99 at both distances. This minimal degradation of the signal demonstrates that the system has the ability to provide reliable and ready non-contact electrical maintenance monitoring and provides maintenance personnel with early warning of overheating faults while keeping them physically safe, as shown in Figure 9.
- Thermal tracking for motors and bearings (N = 80): The heat generated by rotating equipment, which may include various types of motors and bearings, often takes on a non-linear pattern based upon the type of mechanical load being imposed upon the component and the amount of rotational friction experienced. A key element in evaluating the ability of a predictive maintenance system to monitor such components is the monitoring of the temperature that is produced during operation. In this study, thermal tracking of a rotating component was conducted using the MLX90640 sensor at two distances, 100 cm and 150 cm, as shown in Figure 10. As indicated in the left panel of Figure 10, the MLX90640 sensor provided extremely consistent thermal tracking when positioned 100 cm away from the rotating component. An equation was developed to determine the relationship between the temperature readings of the MLX90640 sensor and the calibration reference device. The equation for the MLX90640 sensor was y = 1.201x + 47.039, with a very high R2 value (0.9790). Of particular interest was that the MLX90640 sensor produced better results than the reference calibration device in regard to signal stability, while the reference calibration device showed a much larger variation in measurements (y = 1.1792x + 47.889, R2 = 0.9687). The close proximity of the data points collected by the MLX90640 sensor shows that it is capable of producing high-accuracy thermal data of the step-type thermal increases that occur during motor operation without the production of excessive noise. When the distance of the MLX90640 sensor was increased to 150 cm (middle panel of Figure 10) to simulate a safe operational distance for the operator performing the thermal imaging, the consistency of the thermal tracking data provided by the system was enhanced even further. Again, the MLX90640 sensor produced a high R2 value of 0.9871 (y = 1.1861x + 42.338), and once again the MLX90640 sensor outperformed the reference calibration device (R2 = 0.9805). Both devices exhibited nearly identical proportional responses, with slopes of 1.1861 and 1.1760, respectively. The spatial attenuation effect is clearly depicted in the right panel (100 cm vs. 150 cm). Consistent with previous operational scenarios, the increased distance led to a minor reduction in sensitivity (the slope decreased slightly from 1.2010 to 1.1861) and a drop in the baseline offset (from 47.039 to 42.338). This phenomenon occurs because the expanded FoV at 1.5 m integrates the localized heat of the bearing with the cooler ambient temperature of the surrounding motor casing. Nevertheless, the exceptionally high R2 values prove that the helmet-mounted system is highly adept at monitoring the critical thermal trends of high-speed rotating equipment from a safe distance, providing reliable early warnings prior to mechanical failure, as illustrated in Figure 10.
Figure 9.
Comparison of temperature measurement validation for electrical control cabinets and wiring connections between 100 cm and 150 cm.
Figure 10.
Comparison of temperature measurement validation for motors and bearings between 100 cm and 150 cm.
4.2. Accuracy Enhancement and Error Analysis Across Industrial Scenarios
To ensure the reliability of the proposed helmet-mounted thermal monitoring system, a comprehensive inter-device agreement analysis was conducted between the MLX90640 sensor and the calibrated reference instrument across five representative industrial operational scenarios at two safe standoff distances (100 cm and 150 cm). Measurement performance was quantified using MAE, RMSE, Bias, and inter-device R2, as summarized in Table 5. In addition, two-sample independent t-tests were performed to determine whether measurement errors differed significantly across sensing distances in each scenario. Statistical significance was evaluated using the p-value (α = 0.05), while Cohen’s d was calculated as a standardized effect size to quantify the practical magnitude of distance-induced performance differences. Reporting both statistical significance and effect size provides a more comprehensive interpretation of system reliability behavior under realistic industrial conditions.
Table 5.
Accuracy and error metrics of temperature measurements across different scenarios and distances.
At the baseline distance of 100 cm, the proposed wearable system demonstrated consistently high accuracy across all scenarios, with MAE values ranging from 0.636 °C to 1.051 °C and exceptionally high R2 values (0.9885–0.9973), confirming strong proportional agreement with the calibrated reference device. These results indicate that within the standard frontline inspection distance, the system provides stable and reliable thermal tracking under diverse industrial conditions.
When the sensing distance increased to 150 cm, MAE increased across all scenarios, ranging from 1.286 °C to 1.687 °C, while proportional tracking remained strong, with R2 values between 0.9586 and 0.9867. This pattern indicates that increasing distance introduces systematic measurement deviations without disrupting the underlying capability to detect linear thermal trends. The largest degradation was observed in conveyor belts and gearboxes (ΔMAE = +0.911 °C, Cohen’s d = 0.84), followed by control cabinets and wiring connections (+0.699 °C, d = 0.67) and motors and bearings (+0.645 °C, d = 0.69), suggesting stronger distance sensitivity in thermally heterogeneous and mechanically dynamic environments. To provide a more intuitive visualization of distance-induced error sensitivity, Figure 11a–e presents scenario-specific scatter plots of sensing distance versus temperature error with fitted first-order regression lines across all five representative industrial inspection scenarios.
Figure 11.
Scenario-specific scatter plots of sensing distance versus measurement error with fitted first-order regression lines for five industrial scenarios: (a) low-light conditions, (b) continuous-operation machinery, (c) conveyor belts and gearboxes, (d) control cabinets and wiring connections, and (e) motors and bearings. The broader error dispersion observed at 150 cm, particularly in mechanically dynamic scenarios, highlights increased sensitivity to pixel-footprint expansion, geometric complexity, and motion-related hotspot variability.
While the inter-device agreement metrics in Table 5 summarize the aggregated thermal tracking reliability, the scatter plots provide a more intuitive visualization of how error dispersion widens between 100 cm and 150 cm depending on operational complexity. In contrast to the consistently high inter-device R2 values reported in Table 5, the distance-versus-error regression plots in Figure 11 yielded low explanatory R2 values, ranging from 0.0003 to 0.0360. This indicates that sensing distance alone explains only a very small proportion of the observed error variance. Specifically, the continuous-operation machinery scenario exhibited the lowest explanatory power (R2 = 0.0003), suggesting virtually no linear dependency between distance and measurement error. Similarly weak relationships were observed in control cabinets and wiring connections (R2 = 0.0073), conveyor belts and gearboxes (R2 = 0.0135), and low-light conditions (R2 = 0.0175). Across all scenarios, motors and bearings showed the highest explanatory power (R2 = 0.0360); however, this still indicates that distance accounts for less than 4% of the total error variability. These findings confirm that the dominant sources of measurement uncertainty are more strongly associated with mechanical motion, geometric complexity, emissivity variation, and mixed-pixel hotspot blending than with linear distance change itself. The visibly broader error spread at 150 cm, particularly in conveyor systems, electrical interfaces, and rotating bearings, further indicates stronger sensitivity to geometric complexity and motion-related thermal behavior.
This interpretation is further supported by the broader error dispersion observed in Figure 11c–e. The increase in measurement error at 150 cm cannot be explained solely by conventional spatial averaging with cooler background regions. Although expanding the field of view increases the physical area subtended by each MLX90640 pixel, the proposed wearable system estimates the hotspot temperature using a maximum-pixel extraction strategy rather than scene-wide averaging. Consequently, as distance increases, each pixel covers a larger projected surface area, increasing the likelihood that localized hotspots, adjacent heated structures, and surrounding thermally elevated regions are integrated into a single dominant pixel. This mixed-pixel hotspot dominance effect can shift the measurement bias positively, as observed in Table 5, particularly in conveyor, gearbox, and motor-bearing scenarios where steep thermal gradients and localized friction-induced heating are common.
In addition, mechanical motion and vibration may induce transient thermal interface changes and hotspot migration across neighboring pixels, while the maximum-pixel strategy preferentially captures these short-duration thermal peaks. The enlarged pixel footprint at 150 cm further reduces the effective target fill factor and lowers the thermal contrast-to-noise ratio, amplifying both the absolute error and the positive bias. These findings indicate that geometric complexity, emissivity uncertainty, and mechanical motion exert a substantially greater influence on distance sensitivity than lighting conditions. Similar limitations have been widely reported in industrial infrared thermography studies of rotating machinery, where emissivity uncertainty, motion-induced thermal interface variations, and complex gearbox-bearing assemblies reduce the stability of thermal diagnostics and the reliability of temperature measurements under real operating conditions.
4.2.1. Impact of Measurement Distance on Accuracy
The reliability and overall performance of the baseline measurements taken at the closest proximity of 100 cm were very reliable and excellent, with all MAE values being contained within a very small range of 1.64 °C to 2.47 °C, and with R2 values being extremely high at or above 0.989. However, as the focal distance increased to 150 cm, the MAE was consistently larger and higher for each scenario tested than it had been at the 100 cm distance.
Further distance-induced degradation of thermal accuracy is also reflected in a systematic shift in measurement bias. At the 100 cm distance, which represents the optimal close-range operating condition, the thermal sensor exhibited only small, predictable positive biases (ranging from +0.18 °C to +0.38 °C). At 150 cm, although the mean absolute error increased consistently across all scenarios, the bias values remained slightly positive, indicating moderate overestimation rather than underestimation. This behavior is consistent with the maximum-pixel hotspot extraction strategy used in the proposed wearable system. As the field of view expands with increasing distance, each MLX90640 pixel subtends a larger projected surface area, increasing the probability that localized hotspots, adjacent heated structures, and transient friction-induced peaks are integrated into a single dominant pixel. This mixed-pixel hotspot dominance effect explains the observed positive bias shift and accounts for the increase in absolute measurement error.
4.2.2. Scenario-Specific Performance Variations
Baseline data taken at a distance of 100 cm were shown to be highly accurate as they had very low absolute error and no apparent bias (−0.10 °C to +0.82 °C) and baseline data taken at 150 cm showed an increase in mean absolute error but with a much smaller range of increases (ΔMAE ranged from +0.235 °C to +0.911 °C), with all bias values being slightly above zero or higher (positive overestimation) for all scenarios (+0.54 °C to +0.998 °C).
The present findings indicate that the initial assumption of a systematic decrease in measured temperature with increasing distance was not supported by the experimental data. Instead, the moderate overestimation observed at 150 cm is more consistently explained by the interaction between pixel-footprint expansion and the maximum-pixel hotspot extraction strategy used in the proposed wearable system. As the field of view expands with distance, each MLX90640 pixel subtends a larger projected surface area, increasing the likelihood that localized hotspots, adjacent heated structures, and short-duration friction-induced thermal peaks are merged into a single dominant sensing element. At the same time, the effective target fill factor decreases, and the thermal contrast-to-noise ratio is reduced, increasing sensitivity to local thermal heterogeneity, emissivity uncertainty, and motion-induced hotspot migration. These combined effects explain the observed positive bias shift and the increase in absolute measurement error. Most importantly, R2 remained high at both distances, indicating that although absolute accuracy decreased with increasing distance, the relative proportional thermal-tracking stability remained preserved.
4.2.3. Implications for Accuracy Enhancement Strategies
Distance-aware calibration should be used only where statistically significant degradation is observed in certain industrial situations. Proportional agreement (R2) remains high across all scenarios; therefore, a lightweight linear correction model is suitable for the tested operational range (100–150 cm). Calibration strategies must prioritize mechanically dynamic systems as spatial averaging effects result in larger deviations than other system types.
Using an adaptive correction approach based on scenarios ensures optimal computational efficiency while maintaining compliance with industrial safety monitoring standards.
4.3. Distance–Error Regression Modeling
4.3.1. Model Formulation
To quantify the relationship between standoff distance and measurement error, a first-order linear regression model was constructed using MAE as the dependent variable.
The linear regression model is defined as Equation (3):
where (D) is the mean absolute error at sensing distance (°C);
: is the regression intercept (°C);
: is the regression coefficient representing the rate of change in error with respect to distance (°C/cm);
D is distance in centimeters (cm).
is the residual error term accounting for unexplained variation. The residual term is assumed to have zero mean, constant variance, and independent observations.
The model assumes that measurement degradation follows a first-order linear trend within the tested operational range (100–150 cm), consistent with pixel-footprint expansion, reduced target fill factor, and mixed-pixel hotspot dominance effects in the low-resolution MLX90640 sensing system.
4.3.2. Aggregated Regression Across Industrial Scenarios
The regression model has been developed from two operationally safe standoff distances and is therefore a first-order approximation within a specific range of deployment rather than a generalized form of the radiative decay law. Using the MAE values for each of the five operational test cases reported in Table 5, the mean MAE value at 100 cm was
and at 150 cm was
Fitting Equation (3) to these aggregated values yields the estimated regression model:
This indicates that measurement error increases approximately 0.0118 °C per cm of additional distance within the evaluated range. The slope coefficient confirms a systematic but moderate distance-dependent error growth.
4.3.3. Scenario-Specific Distance Sensitivity
To analyze how distance affected operation in different scenarios, a series of regression slopes was calculated with the ΔMAE values from Table 6. Using Equation (5), the authors compute , which represents the sensitivity of attenuation by distance for each scenario:
with = 50 cm.
Table 6.
Summarizations of resulting slope estimates.
Dynamic mechanical environments exhibit higher distance sensitivity compared to thermally stable systems.
4.3.4. Practical Implications for Calibration
The linear distance–error model enables real-time compensation through software correction as in Equation (6):
where 100 cm is treated as the calibration reference distance.
This correction method will allow for an adaptive edge-based calibration approach without the need for physical changes to the equipment. Additionally, this type of modeling will increase the reliability of deployments in industrial settings where the measurement distance may vary due to safety restrictions.
5. Discussion and Conclusions
The experimental results indicate how the research findings can be understood in relation to the pre-established hypotheses and within the context of the existing literature. Results indicate that the designed smart helmet provides the wearer with real-time thermal maps through an integrated miniature display, thus supporting Hypothesis 1. The wearable design enables continuous hands-free operation, offering significant advantages over handheld thermal imaging devices, which require manual handling and disrupt workflow continuity. Uninterrupted situational awareness is critical in safety-critical industrial settings where hazards must be identified rapidly. Our findings are consistent with recent work showing that AI-enabled industrial wearable technologies and real-time monitoring systems improve worker safety and operational efficiency by supporting proactive hazard detection and continuous situational awareness beyond the capabilities of traditional inspection tools [45].
With regard to real-time performance, the system architecture uses exclusively on-device (edge) computing, eliminating the need for wireless data transfer. All processing of thermal data, heat map visualization, and detection information is performed locally on the Raspberry Pi 5. Using edge computing to perform all processing eliminates dependence on external communication infrastructure and the variability caused by latency in wireless data transmission. The architecture used in this project also limits contention for signal resources and bandwidth bottlenecks that are common in densely populated industrial areas due to continuous high-resolution data stream transmissions over wireless networks, as found in [46]. These design decisions also support the framework presented in [30], which states that edge computing is a critical paradigm for IoT applications that require immediate responses and operate autonomously without relying on cloud or network connections. Therefore, the helmet-mounted thermal sensing system can detect and analyze industrial thermal hotspots in real time with sufficient portability and responsiveness for practical field use.
The thermal performance of the wearable system has been validated through a series of experiments demonstrating that the system consistently provides accurate, trend-oriented measurements of temperature as hypothesized in Hypothesis 2. The high level of agreement between the wearable system’s measurements and those made by the reference instruments is indicated by the average R2 of 0.96 or higher for all test conditions, and in many cases, the average R2 exceeded 0.98. Additionally, the constant bias (offset) was determined to vary between −0.10 °C and +0.82 °C at 100 cm and between +0.54 °C and +0.998 °C at 150 cm. These results confirm a high degree of proportionality in the measurements obtained using the wearable system compared to the reference devices and therefore validate the use of the MLX90640 sensor for making reliable preliminary safety screening measurements provided that the sensor is properly calibrated. The results of these tests support the assertions made in [47] that in machine anomaly detection and predictive maintenance applications, detecting temperature trends is generally more important than obtaining precise absolute temperatures.
While there was a statistically significant relationship between the measured distance from the reference devices and thermal accuracy based upon measurement error analysis, baseline measurements taken at 100 cm demonstrated excellent reliability, with MAE values of 0.636 °C to 1.051 °C. However, when the measurement distance was extended to 150 cm, the MAE values ranged from 1.286 °C to 1.687 °C. Although this represents a measurable decrease in absolute precision, the decrease is moderate rather than extreme.
An important result of increasing the distance to 150 cm was the manifestation of a systematic positive bias effect. As previously noted, the system produced relatively small bias values at 100 cm (−0.10 °C to +0.82 °C) but developed consistent positive biases at 150 cm (+0.54 °C to +0.998 °C) under all operational conditions. The tendency toward slightly elevated estimates of temperature at longer distances can be primarily attributed to field-of-view expansion and spatial averaging effects, whereby localized hotspots are averaged together with surrounding thermal regions. These findings agree with the radiative principles presented in [17] describing how distance affects the distribution of infrared energy and the spatially integrating characteristics of infrared radiation.
MAE values were greater at 150 cm than at 100 cm for each of the tested scenarios; however, R2 values remained high, with several R2 values (e.g., motor and bearing) remaining greater than 0.98. This suggests that, although absolute deviation increased with distance, the proportionate relationship between the wearable system and the reference instrument remained strong. Hence, the wearable system retained its ability to track temperature trends reliably regardless of the moderate decreases in absolute precision.
As would be expected, static objects (i.e., electrical panels) displayed moderate distance sensitivity (Cohen’s d = 0.67); however, the dynamic and complex systems (i.e., conveyor belts and gearboxes—Cohen’s d = 0.84 and motors and bearings—Cohen’s d = 0.69) exhibited the greatest loss in accuracy as distance increased. Conversely, confined low-light areas (Cohen’s d = 0.45, p = 0.084) and continuously operating equipment (Cohen’s d = 0.20, p = 0.303) exhibited no statistically significant deterioration in accuracy within the test range. These findings indicate that geometric complexity, surface emissivity, and mechanical motion exert a significantly greater influence on distance sensitivity than lighting conditions. Similar limitations have been reported in industrial infrared thermography studies of rotating machinery, where surface emissivity variation, moving interfaces, and complex gearbox-bearing structures were shown to reduce thermal diagnostic stability and measurement reliability under real operating conditions [48].
Regardless of the measurable difference in absolute error between the two distances, the ability to consistently measure temperature variations (average R2 > 0.96 for all test conditions, and >0.98 for most conditions) demonstrates that the system will remain extremely reliable for anomaly detection and industrial safety screening, thereby meeting the main objectives of this research.
The summary of this research was to show the design, implementation, and operational testing of a wearable helmet-mounted real-time thermal detection system based upon an MLX90640 thermal camera and a Raspberry Pi 5 platform. A combination of real-time heatmap display and a programmable threshold-based hotspot detection function was integrated into a portable and deployable form factor that would be suitable for use in safety-critical industrial environments. Validations conducted over 400 data points showed consistently strong positive linear relationships between the proposed systems and calibrated reference systems. This relationship is further evidenced by the near unity of the regression slopes, showing that there is little to no gain, distortion or loss of proportionality from the proposed systems. The systematic error in temperature measurements was identified. However, the error is dependent upon characteristics of the operational environment and distance from the measurement point. Therefore, while the proposed systems demonstrate very high reliability, the field validations were restricted to only two safe standoff distances (100 cm and 150 cm), due to severe restrictions placed upon us by the industrial safety protocol. As such, the proposed linear regression model is being used as a baseline. While the model is successful in quantifying the degree of attenuation as a function of distance, a two-point regression model is unlikely to accurately quantify all of the non-linear behavior exhibited by the system at longer ranges.
A limitation of this study is that the distance-aware attenuation model was developed using measurements taken at only two practical operating distances, namely 100 cm and 150 cm. These distances were intentionally selected to reflect standard thermographic inspection practice for industrial electrical panels and rotating machinery, where maintenance personnel typically operate within an approximate 1–2 m working range to balance operator safety with sufficient thermal target visibility and spatial resolution, as recommended in [49]. Within this intended deployment envelope, the proposed linear regression model provides a reasonable first-order approximation of distance-dependent measurement error. However, as the sensing distance exceeds this practical range, the thermal target occupies an increasingly smaller portion of the MLX90640 sensor’s field of view, leading to stronger spatial averaging and reduced hotspot localization fidelity. Under such conditions, the error behavior may no longer be strictly linear, and non-linear attenuation or saturation effects cannot be ruled out. Therefore, the present model should be interpreted as an operational-range attenuation model rather than a universal long-distance decay formulation. In addition, the current system applies generalized emissivity assumptions, which may introduce minor deviations when monitoring industrial equipment composed of different surface materials or operating under mechanically dynamic conditions. Future work will focus on collecting finer-grained multi-distance measurements over a broader sensing range and incorporating higher-order compensation functions, along with dynamic, material-specific emissivity correction models, to further improve measurement robustness in real industrial deployments.
In addition, the present study did not attempt to independently disentangle the relative effects of pixel footprint expansion, motion-induced hotspot migration, emissivity uncertainty, and signal-to-noise degradation, particularly in dynamic industrial scenarios such as conveyor systems, gearboxes, and rotating bearings, where these factors naturally interact. The current implementation also relies on generalized emissivity assumptions, which may introduce additional deviations when monitoring heterogeneous industrial materials or thermal interfaces that change rapidly during mechanical motion. To address these limitations, future work will focus on collecting frame-level thermal sequence data across a wider range of sensing distances and motion conditions, enabling the development of higher-order physics-informed compensation models, along with dynamic, material-specific emissivity correction algorithms, for more robust real-time deployment in complex industrial environments.
Author Contributions
Conceptualization, M.R., P.N. and S.B.; methodology, M.R., P.N., S.B. and R.F.; evaluation and modeling, P.N., M.R., R.F. and S.B.; validation, M.R., P.N., R.F. and S.B.; formal analysis, M.R., P.N., R.F., M.B. and S.B.; investigation, M.R., P.N., R.F., M.B. and S.B.; resources, P.N. and M.R.; data curation, M.R., P.N. and S.B.; writing—original draft preparation, M.R., P.N., R.F., M.B. and S.B.; writing—review and editing, M.R., P.N., R.F., M.B. and S.B.; visualization, M.R., P.N. and S.B.; supervision, M.R., P.N., R.F., M.B. and S.B.; project administration M.R., P.N., R.F., M.B. and S.B.; funding acquisition, M.R. and S.B. All authors have read and agreed to the published version of the manuscript.
Funding
This research was supported by the Science, Research and Innovation Promotion Fund (TSRI) through the Fundamental Fund for the Fiscal year 2025, under the project “Development of a safety helmet with thermal imaging camera and embedded system for detection and analysis of parts and equipment in industrial factories” (Project Code: 203773). This study was sponsored by PiSugar Kitchen to support the PiSugar 3 Plus power management module. The equipment contribution enabled stable and portable operation of the developed Raspberry Pi–based system.
Institutional Review Board Statement
Not applicable. The study involved only engineering prototype testing and thermal measurement validation in operational industrial environments. No personal, medical, or identifiable human-subject data were collected, and no interventions involving human participants were performed.
Data Availability Statement
The raw data supporting the conclusions of this article will be made available by the authors on request.
Acknowledgments
During the preparation of this manuscript, the authors used Grammarly (https://app.grammarly.com/, web-based version) to accurately edit and refine the manuscript’s English sentences. The authors reviewed and edited the output and take full responsibility for the content of this publication.
Conflicts of Interest
The authors declare no conflicts of interest.
References
- Newaz, M.T.; Jefferies, M.; Ershadi, M. A Critical Analysis of Construction Incident Trends and Strategic Interventions for Enhancing Safety. Saf. Sci. 2025, 187, 106865. [Google Scholar] [CrossRef] [Scilit]
- Hamstead, Z.A. Thermal Insecurity: Violence of Heat and Cold in the Urban Climate Refuge. Urban Stud. 2024, 61, 531–548. [Google Scholar] [CrossRef] [Scilit]
- Liu, J.; Zhai, H.; Li, J.; Li, Y.; Liu, Z. Enhancing Wearable Electronics through Thermal Management Innovations. Wearable Electron. 2024, 1, 160–179. [Google Scholar] [CrossRef] [Scilit]
- Khan, S.; Ali, S.; Khan, A.; Bermak, A. Wearable Printed Temperature Sensors: Short Review on Latest Advances for Biomedical Applications. IEEE Rev. Biomed. Eng. 2023, 16, 152–170. [Google Scholar] [CrossRef] [Scilit]
- Lin, Y.; Li, Z.; Sun, Y.; Yang, Y.; Zheng, W. Voltage-Induced Heating Defect Detection for Electrical Equipment in Thermal Images. Energies 2023, 16, 8036. [Google Scholar] [CrossRef] [Scilit]
- Netinant, P.; Vasprasert, P.; Rukhiran, M. Evaluations of Effective on LWIR Micro Thermal Camera IoT and Digital Thermometer for Human Body Temperatures. In Proceedings of the 2021 The 5th International Conference on E-Commerce, E-Business and E-Government; ACM: New York, NY, USA, 2021. [Google Scholar]
- Khan, T. A Smart Fire Detector IoT System with Extinguisher Class Recommendation Using Deep Learning. IoT 2023, 4, 558–581. [Google Scholar] [CrossRef] [Scilit]
- Ficili, I.; Giacobbe, M.; Tricomi, G.; Puliafito, A. From Sensors to Data Intelligence: Leveraging IoT, Cloud, and Edge Computing with AI. Sensors 2025, 25, 1763. [Google Scholar] [CrossRef] [Scilit] [PubMed]
- Jia, S.; Gao, H.; Xue, Z.; Meng, X. Recent Advances in Multifunctional Wearable Sensors and Systems: Design, Fabrication, and Applications. Biosensors 2022, 12, 1057. [Google Scholar] [CrossRef] [Scilit]
- Bharathiraja, N.; Indhuja, R.B.; Krishnan, P.R.A.; Anandhan, S.; Hariprasad, S. Real-Time Fall Detection Using ESP32 and AMG8833 Thermal Sensor: A Non-Wearable Approach for Enhanced Safety. In Proceedings of the 2023 Second International Conference on Augmented Intelligence and Sustainable Systems (ICAISS); IEEE: New York, NY, USA, 2023; pp. 1732–1736. [Google Scholar]
- Haripriya, A.B.; Sunitha, K.A.; Mahima, B. Development of Low-Cost Thermal Imaging System as a Preliminary Screening Instrument. Procedia Comput. Sci. 2020, 172, 283–288. [Google Scholar] [CrossRef] [Scilit]
- Acorsi, M.G.; Gimenez, L.M.; Martello, M. Assessing the Performance of a Low-Cost Thermal Camera in Proximal and Aerial Conditions. Remote Sens. 2020, 12, 3591. [Google Scholar] [CrossRef] [Scilit]
- Chidurala, V.; Li, X. Detection of Moving Objects Using Thermal Imaging Sensors for Occupancy Estimation. Internet Things 2022, 17, 100487. [Google Scholar] [CrossRef] [Scilit]
- Qi Ng, M.; Teoh, S.S. Development of a Low-Cost Thermal Camera for Electrical Condition Monitoring. Univers. J. Electr. Electron. Eng. 2019, 6, 94–99. [Google Scholar] [CrossRef] [Scilit]
- Netinant, P.; Pattamasoot, K.; Pukdesree, S. Real-World Implementation of IoT-Based Temperature Detection Helmet Using Thermal Imaging Cameras in Manufacturing. In Proceedings of the 2023 13th International Conference on Software Technology and Engineering (ICSTE); IEEE: New York, NY, USA, 2023; pp. 44–50. [Google Scholar]
- Spasov, G.; Tsvetkov, V.; Petrova, G. Using IR Array MLX90640 to Build an IoT Solution for ALL and Security Smart Systems. In Proceedings of the 2019 IEEE XXVIII International Scientific Conference Electronics (ET); IEEE: New York, NY, USA, 2019. [Google Scholar]
- Nwakanma, C.I.; Anyanwu, G.O.; Ahakonye, L.A.C.; Lee, J.-M.; Kim, D.-S. A Review of Thermal Array Sensor-Based Activity Detection in Smart Spaces Using AI. ICT Express 2024, 10, 256–269. [Google Scholar] [CrossRef] [Scilit]
- Touaref, F.; Seres, I.; Farkas, I. IOT-Enabled Thermal and Surface Management System for PV Modules Coupled with a Cylindro-Parabolic Collector. Energy Rep. 2025, 14, 2075–2091. [Google Scholar] [CrossRef] [Scilit]
- Piechocki, M.; Kraft, M.; Pajchrowski, T.; Aszkowski, P.; Pieczynski, D. Efficient People Counting in Thermal Images: The Benchmark of Resource-Constrained Hardware. IEEE Access 2022, 10, 124835–124847. [Google Scholar] [CrossRef] [Scilit]
- Fraga-Lamas, P.; Barros, D.; Lopes, S.I.; Fernández-Caramés, T.M. Mist and Edge Computing Cyber-Physical Human-Centered Systems for Industry 5.0: A Cost-Effective IoT Thermal Imaging Safety System. Sensors 2022, 22, 8500. [Google Scholar] [CrossRef] [Scilit]
- Wu, J.-Y.; Wang, Y.; Ching, C.T.S.; Wang, H.-M.D.; Liao, L.-D. IoT-Based Wearable Health Monitoring Device and Its Validation for Potential Critical and Emergency Applications. Front. Public Health 2023, 11, 1188304. [Google Scholar] [CrossRef] [Scilit] [PubMed]
- Mabboux, J.; Steinwendner, J. Contactless Temperature Measuring with Low-Cost Embedded Device Using Deep Learning. Procedia Comput. Sci. 2021, 192, 3517–3533. [Google Scholar] [CrossRef] [Scilit]
- Shaik, A.K.; Mohammadi, A.; Malik, H. A Systematic Review of Sensor Vulnerabilities and Cyber-physical Threats in Industrial Robotic Systems. IET Cyber-Phys. Syst. Theory Appl. 2025, 10, e70023. [Google Scholar] [CrossRef] [Scilit]
- Modest, M.F. Inverse Radiative Heat Transfer. In Radiative Heat Transfer; Elsevier: Amsterdam, The Netherlands, 2013; pp. 779–802. ISBN 9780123869449. [Google Scholar]
- Li, Y.; Pan, D.; Jiang, Z.; Yu, H.; Gui, W. 45reAdaptive Compensation Method for the Infrared Temperature Measurement Error Based on 3-D Thermal Imaging. IEEE Sens. J. 2023, 23, 10525–10537. [Google Scholar] [CrossRef] [Scilit]
- Nan, F.; Zeng, C.; Shen, H.; Lin, L. Calibration of Integrated Low-Cost Environmental Sensors for Urban Air Temperature Based on Machine Learning. Sensors 2025, 25, 3398. [Google Scholar] [CrossRef] [Scilit]
- Sazzad, M.M.; Ahmed, T.; Kibria, G.; Khan, I. IoT Based Soil Moisture Measurement and Type Prediction Using Advanced Regression and Machine Learning Models. Sci. Rep. 2025, 15, 35730. [Google Scholar] [CrossRef] [Scilit] [PubMed]
- Lai, F.; Kandukuri, J.; Yuan, B.; Zhang, Z.; Jin, M. Thermal Image Enhancement through the Deconvolution Methods for Low-Cost Infrared Cameras. Quant. Infrared Thermogr. J. 2018, 15, 223–239. [Google Scholar] [CrossRef] [Scilit] [PubMed]
- Dong, Y.; Sloan, G.; Chappuies, J. Open-Source Time-Lapse Thermal Imaging Camera for Canopy Temperature Monitoring. Smart Agric. Technol. 2024, 7, 100430. [Google Scholar] [CrossRef] [Scilit]
- Andriulo, F.C.; Fiore, M.; Mongiello, M.; Traversa, E.; Zizzo, V. Edge Computing and Cloud Computing for Internet of Things: A Review. Informatics 2024, 11, 71. [Google Scholar] [CrossRef] [Scilit]
- Shahi, S.; Pedram, M.; Fernandes, G.; Alshurafa, N. SmartAct: Energy Efficient and Real-Time Hand-to-Mouth Gesture Detection Using Wearable RGB-T. Int. Conf. Wearable Implant. Body Sens. Netw. 2022, 2022, 1–4. [Google Scholar] [CrossRef] [Scilit]
- Kalamaras, S.D.; Tsitsimpikou, M.-A.; Tzenos, C.A.; Lithourgidis, A.A.; Pitsikoglou, D.S.; Kotsopoulos, T.A. A Low-Cost IoT System Based on the ESP32 Microcontroller for Efficient Monitoring of a Pilot Anaerobic Biogas Reactor. Appl. Sci. 2024, 15, 34. [Google Scholar] [CrossRef] [Scilit]
- Ghanem, M.C.; Almeida Palmieri, E.; Sowinski-Mydlarz, W.; Al-Sudani, S.; Dunsin, D. Weaponized IoT: A Comprehensive Comparative Forensic Analysis of Hacker Raspberry Pi and PC Kali Linux Machine. IoT 2025, 6, 18. [Google Scholar] [CrossRef] [Scilit]
- Ahn, C.-U.; Oh, S.; Kim, H.-S.; Park, D.I.; Kim, J.-G. Virtual Thermal Sensor for Real-Time Monitoring of Electronic Packages in a Totally Enclosed System. IEEE Access 2022, 10, 50589–50600. [Google Scholar] [CrossRef] [Scilit]
- Wang, T.; Wang, Y.; Zhao, F.; Feng, H.; Liu, J.; Zhang, L.; Zhang, N.; Yuan, G.; Wang, D. A Spatio-Temporal Temperature-Based Thresholding Algorithm for Underground Coal Fire Detection with Satellite Thermal Infrared and Radar Remote Sensing. Int. J. Appl. Earth Obs. Geoinf. 2022, 110, 102805. [Google Scholar] [CrossRef] [Scilit]
- Dinh, H.T.; Kim, E.-T. A Lightweight Network Based on YOLOv8 for Improving Detection Performance and the Speed of Thermal Image Processing. Electronics 2025, 14, 783. [Google Scholar] [CrossRef] [Scilit]
- Chidurala, V.; Li, X. Occupancy Estimation Using Thermal Imaging Sensors and Machine Learning Algorithms. IEEE Sens. J. 2021, 21, 8627–8638. [Google Scholar] [CrossRef] [Scilit]
- Shubha; Shastrimath, V.D. Study and Analysis of Thermal Imaging Sensors for Object Detection. Int. J. Electron. Commun. Eng. 2023, 10, 38–48. [Google Scholar] [CrossRef] [Scilit]
- Kraft, M.; Aszkowski, P.; Pieczyński, D.; Fularz, M. Low-Cost Thermal Camera-Based Counting Occupancy Meter Facilitating Energy Saving in Smart Buildings. Energies 2021, 14, 4542. [Google Scholar] [CrossRef] [Scilit]
- Peng, Y.; Shen, H.; Tang, X.; Zhang, S.; Zhao, J.; Liu, Y.; Nie, Y. Energy Consumption Optimization for Heating, Ventilation and Air Conditioning Systems Based on Deep Reinforcement Learning. IEEE Access 2023, 11, 88265–88277. [Google Scholar] [CrossRef] [Scilit]
- Pajankar, A. Raspberry Pi Image Processing Programming: With NumPy, SciPy, Matplotlib, and OpenCV; Apress: Berkeley, CA, USA, 2022; ISBN 9781484282694. [Google Scholar]
- Rukhiran, M.; Buaroong, S.; Netinant, P. Software development for educational information services using multilayering semantics adaptation. Int. J. Serv. Sci. Manag. Eng. Technol. 2022, 13, 1–27. [Google Scholar] [CrossRef] [Scilit]
- Al-Tamimi, A.-K.; Hewitt, L.; Cameron, D.; Salem, M.; Moemeni, A. Challenges of Integrating Assistive Technologies and Robots with Embodied Intelligence in the Homes of Older People Living with Frailty. Appl. Sci. 2025, 15, 8415. [Google Scholar] [CrossRef] [Scilit]
- Nasirzadeh, F.; Karmakar, C.; Habib, A.; Benny Neelangal, K.; Mir, M.; Lee, S.; Arnel, T. Continuous Monitoring of Body Temperature for Objective Detection of Health and Safety Risks in Construction Sites: An Analysis of the Accuracy and Comfort of off-the-Shelf Wearable Sensors. Heliyon 2024, 10, e26947. [Google Scholar] [CrossRef] [Scilit]
- Khurram, M.; Zhang, C.; Muhammad, S.; Kishnani, H.; An, K.; Abeywardena, K.; Chadha, U.; Behdinan, K. Artificial Intelligence in Manufacturing Industry Worker Safety: A New Paradigm for Hazard Prevention and Mitigation. Processes 2025, 13, 1312. [Google Scholar] [CrossRef] [Scilit]
- Qiu, T.; Chi, J.; Zhou, X.; Ning, Z.; Atiquzzaman, M.; Wu, D.O. Edge Computing in Industrial Internet of Things: Architecture, Advances and Challenges. IEEE Commun. Surv. Tutor. 2020, 22, 2462–2488. [Google Scholar] [CrossRef] [Scilit]
- Ehsan, I.; Mumtaz, A.; Khalid, M.I.; Iqbal, J.; Hussain, S.; Ullah, S.S.; Umar, F. Internet of Things-Based Fire Alarm Navigation System: A Fire-Rescue Department Perspective. Mob. Inf. Syst. 2022, 2022, 1–15. [Google Scholar] [CrossRef] [Scilit]
- Wang, R.; Zhan, X.; Bai, H.; Dong, E.; Cheng, Z.; Jia, X. A Review of Fault Diagnosis Methods for Rotating Machinery Using Infrared Thermography. Micromachines 2022, 13, 1644. [Google Scholar] [CrossRef] [Scilit]
- Edition, 2008 Standard for Infrared Inspection of Electrical Systems & Rotating Equipment. Available online: https://www.motordoc.org/wp-content/uploads/2019/01/ElectricalIRStd.pdf (accessed on 5 April 2026).
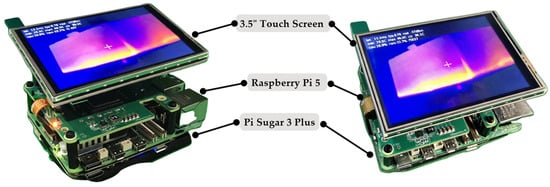
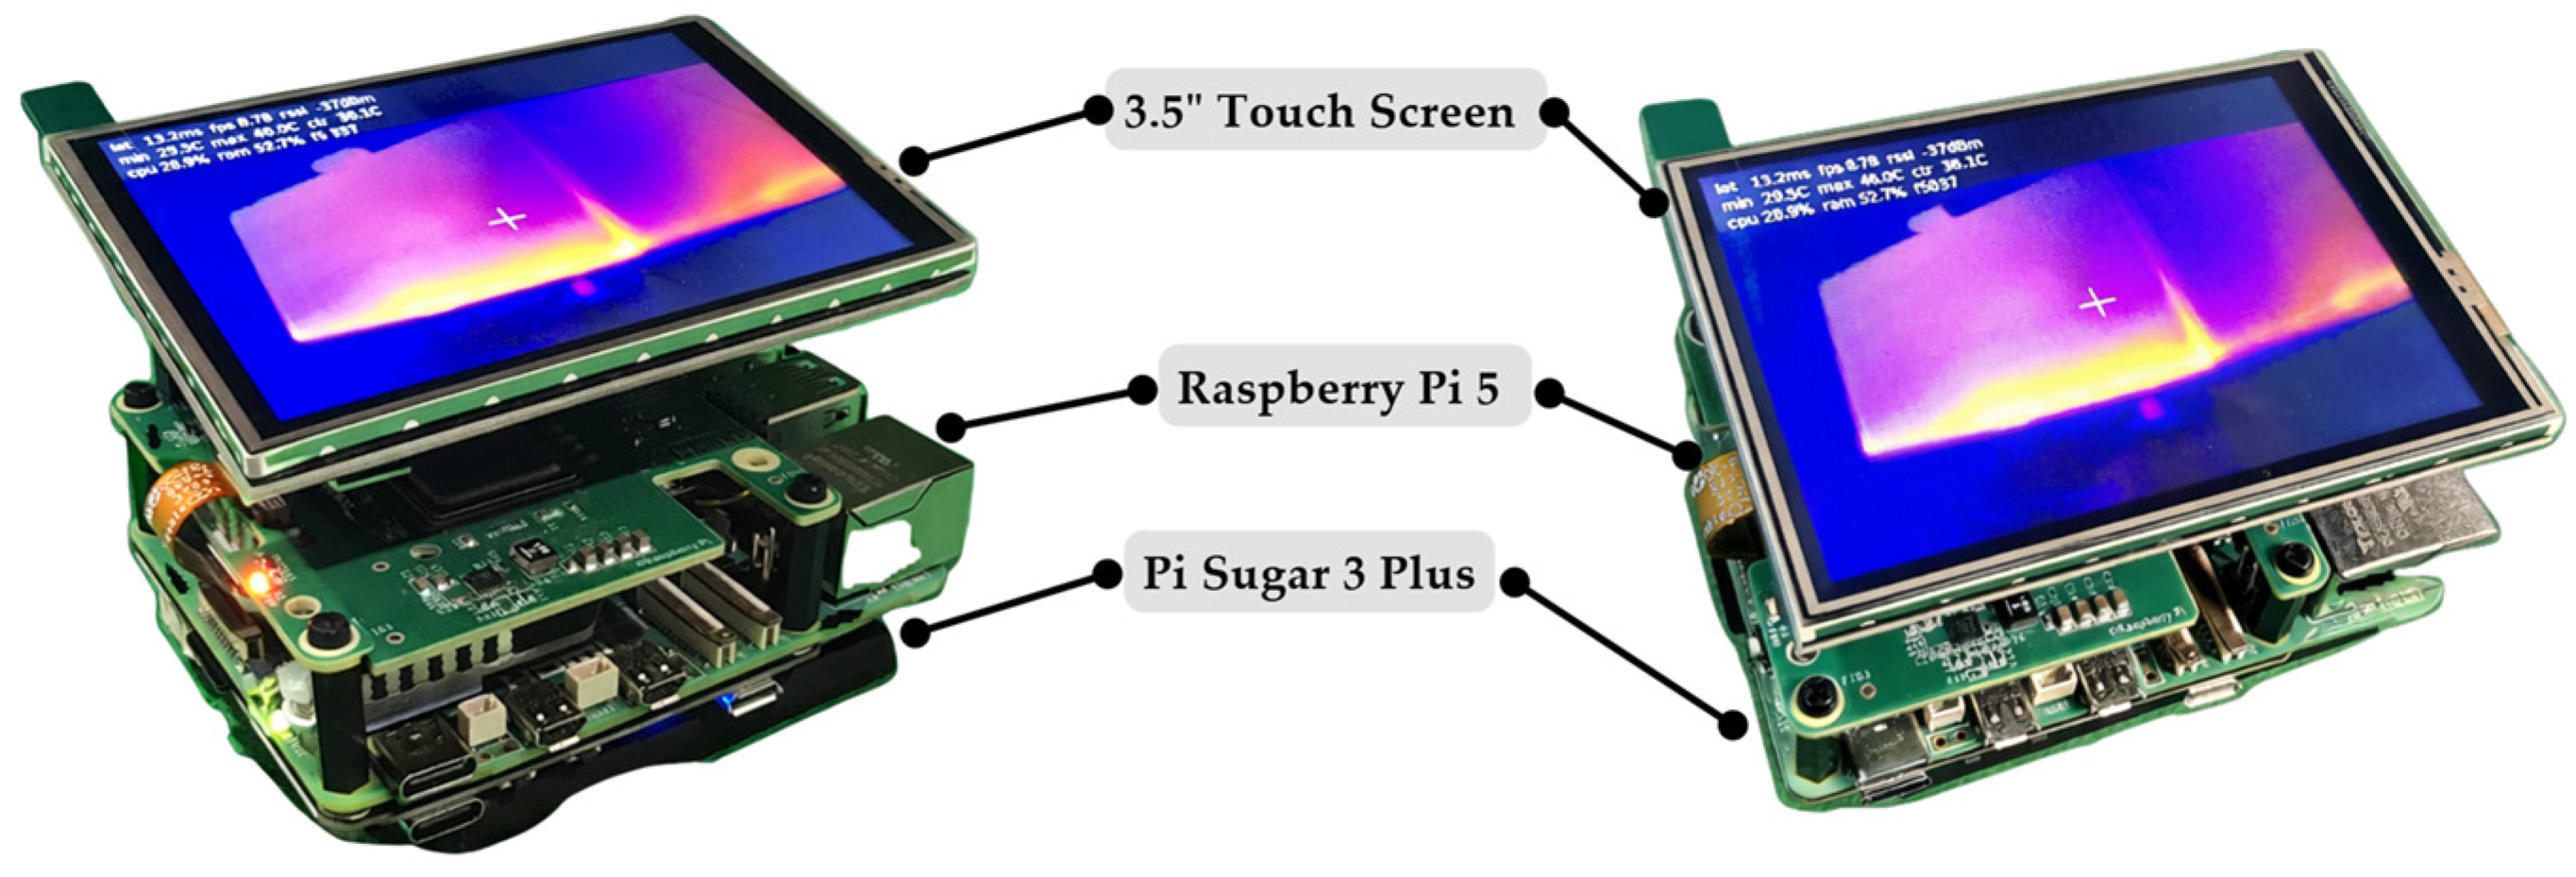
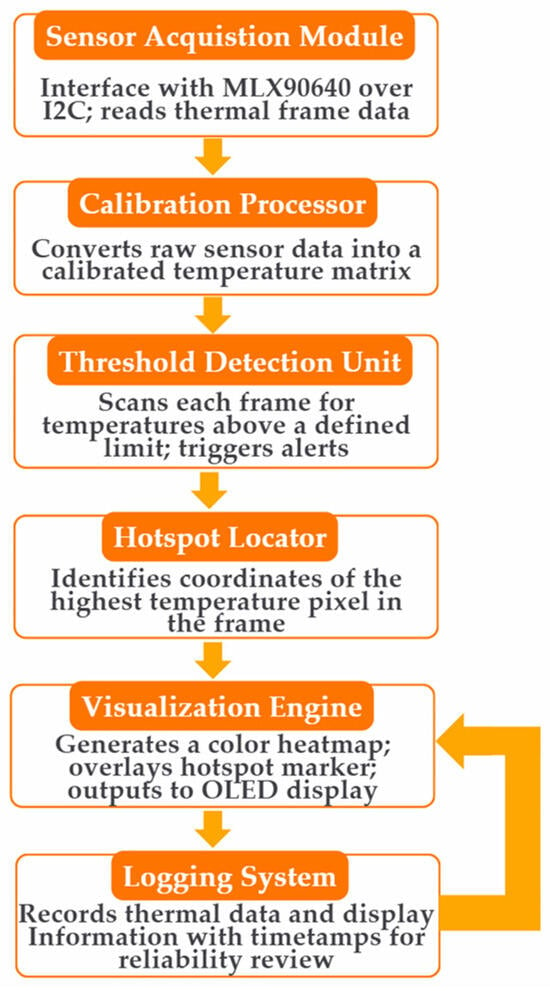
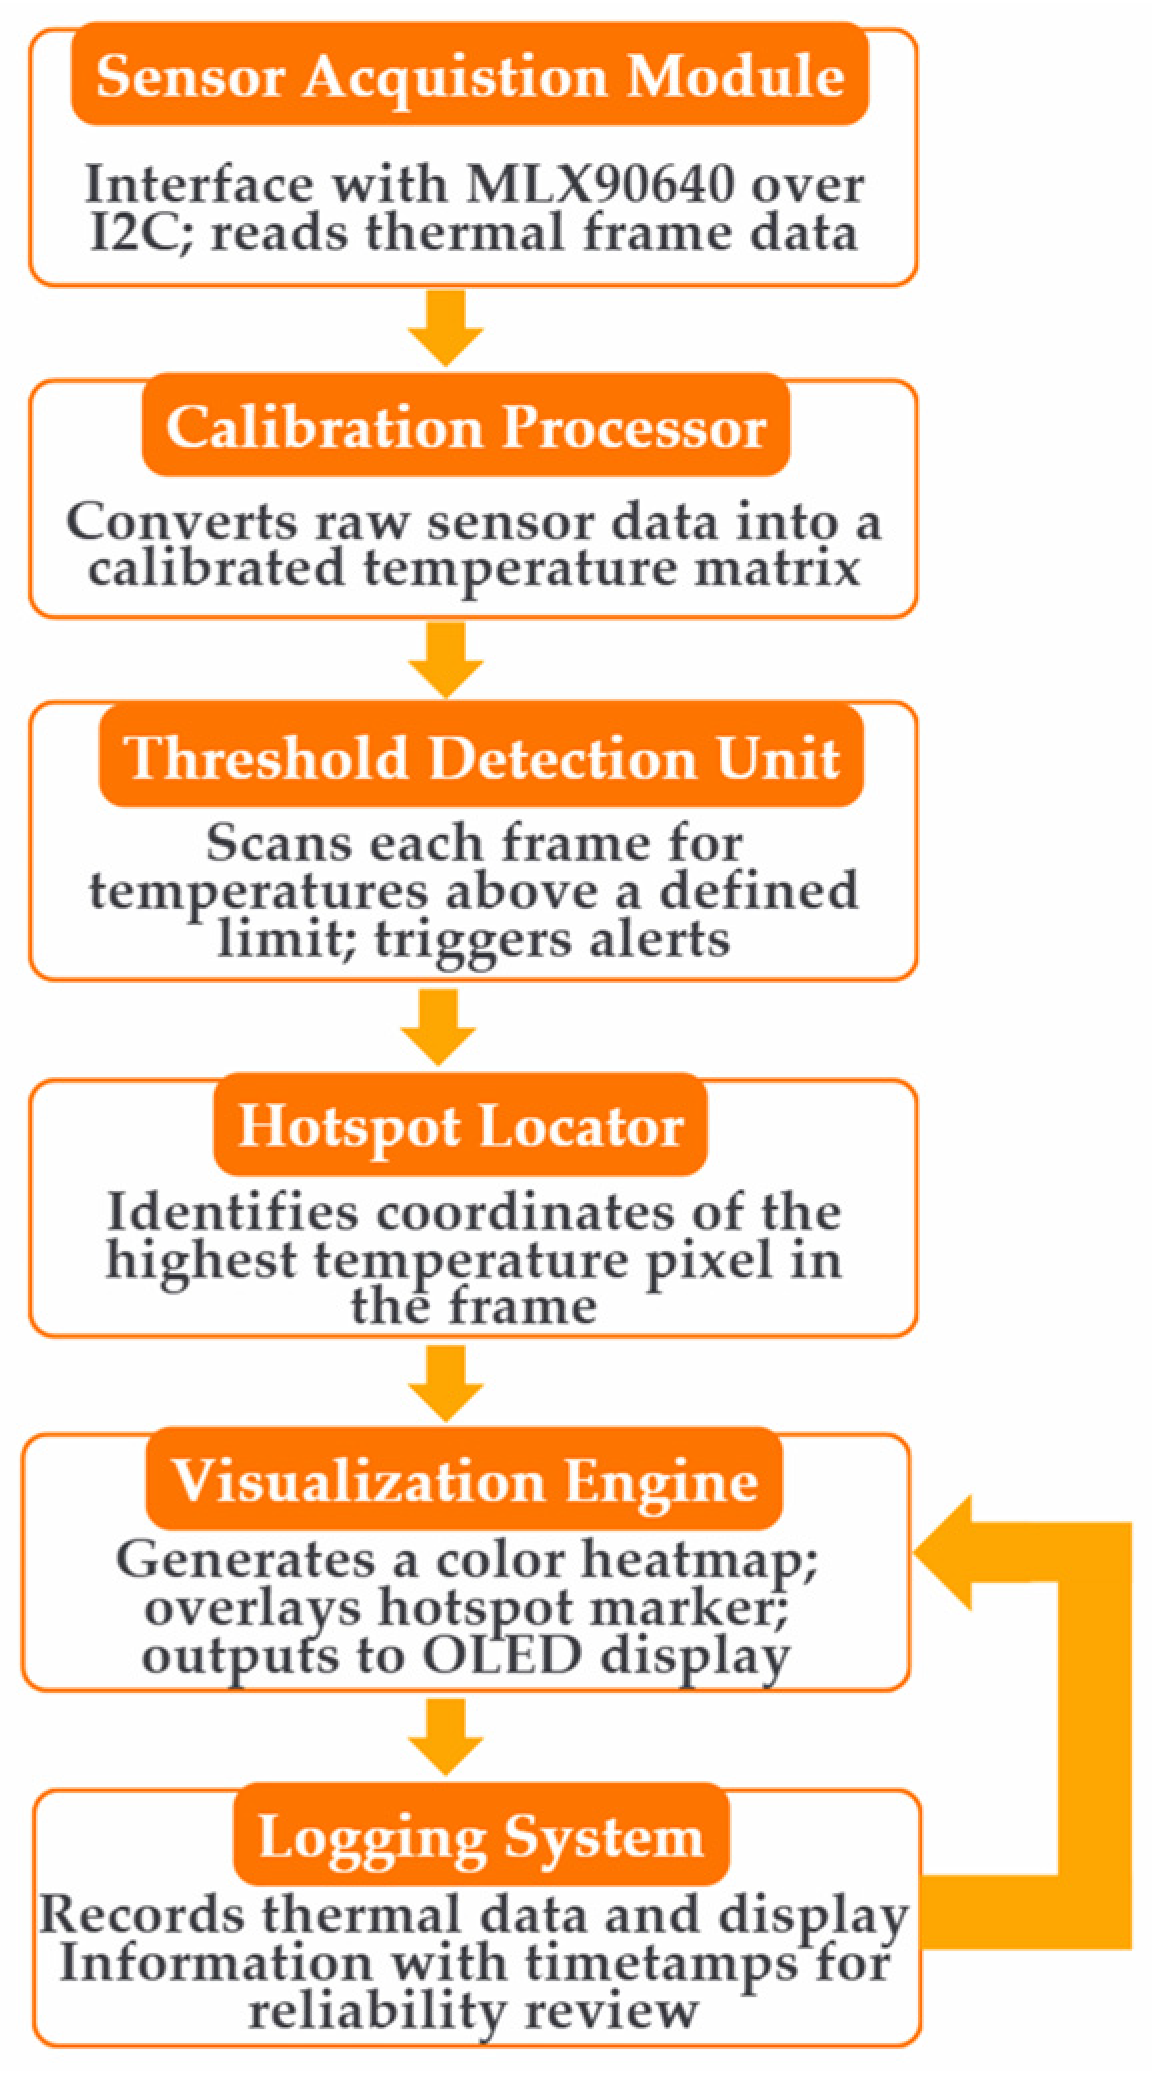
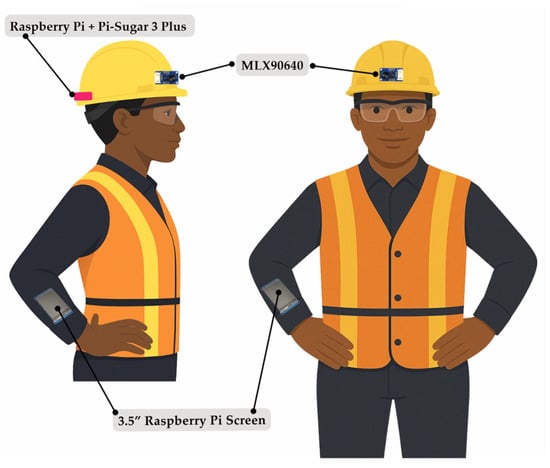
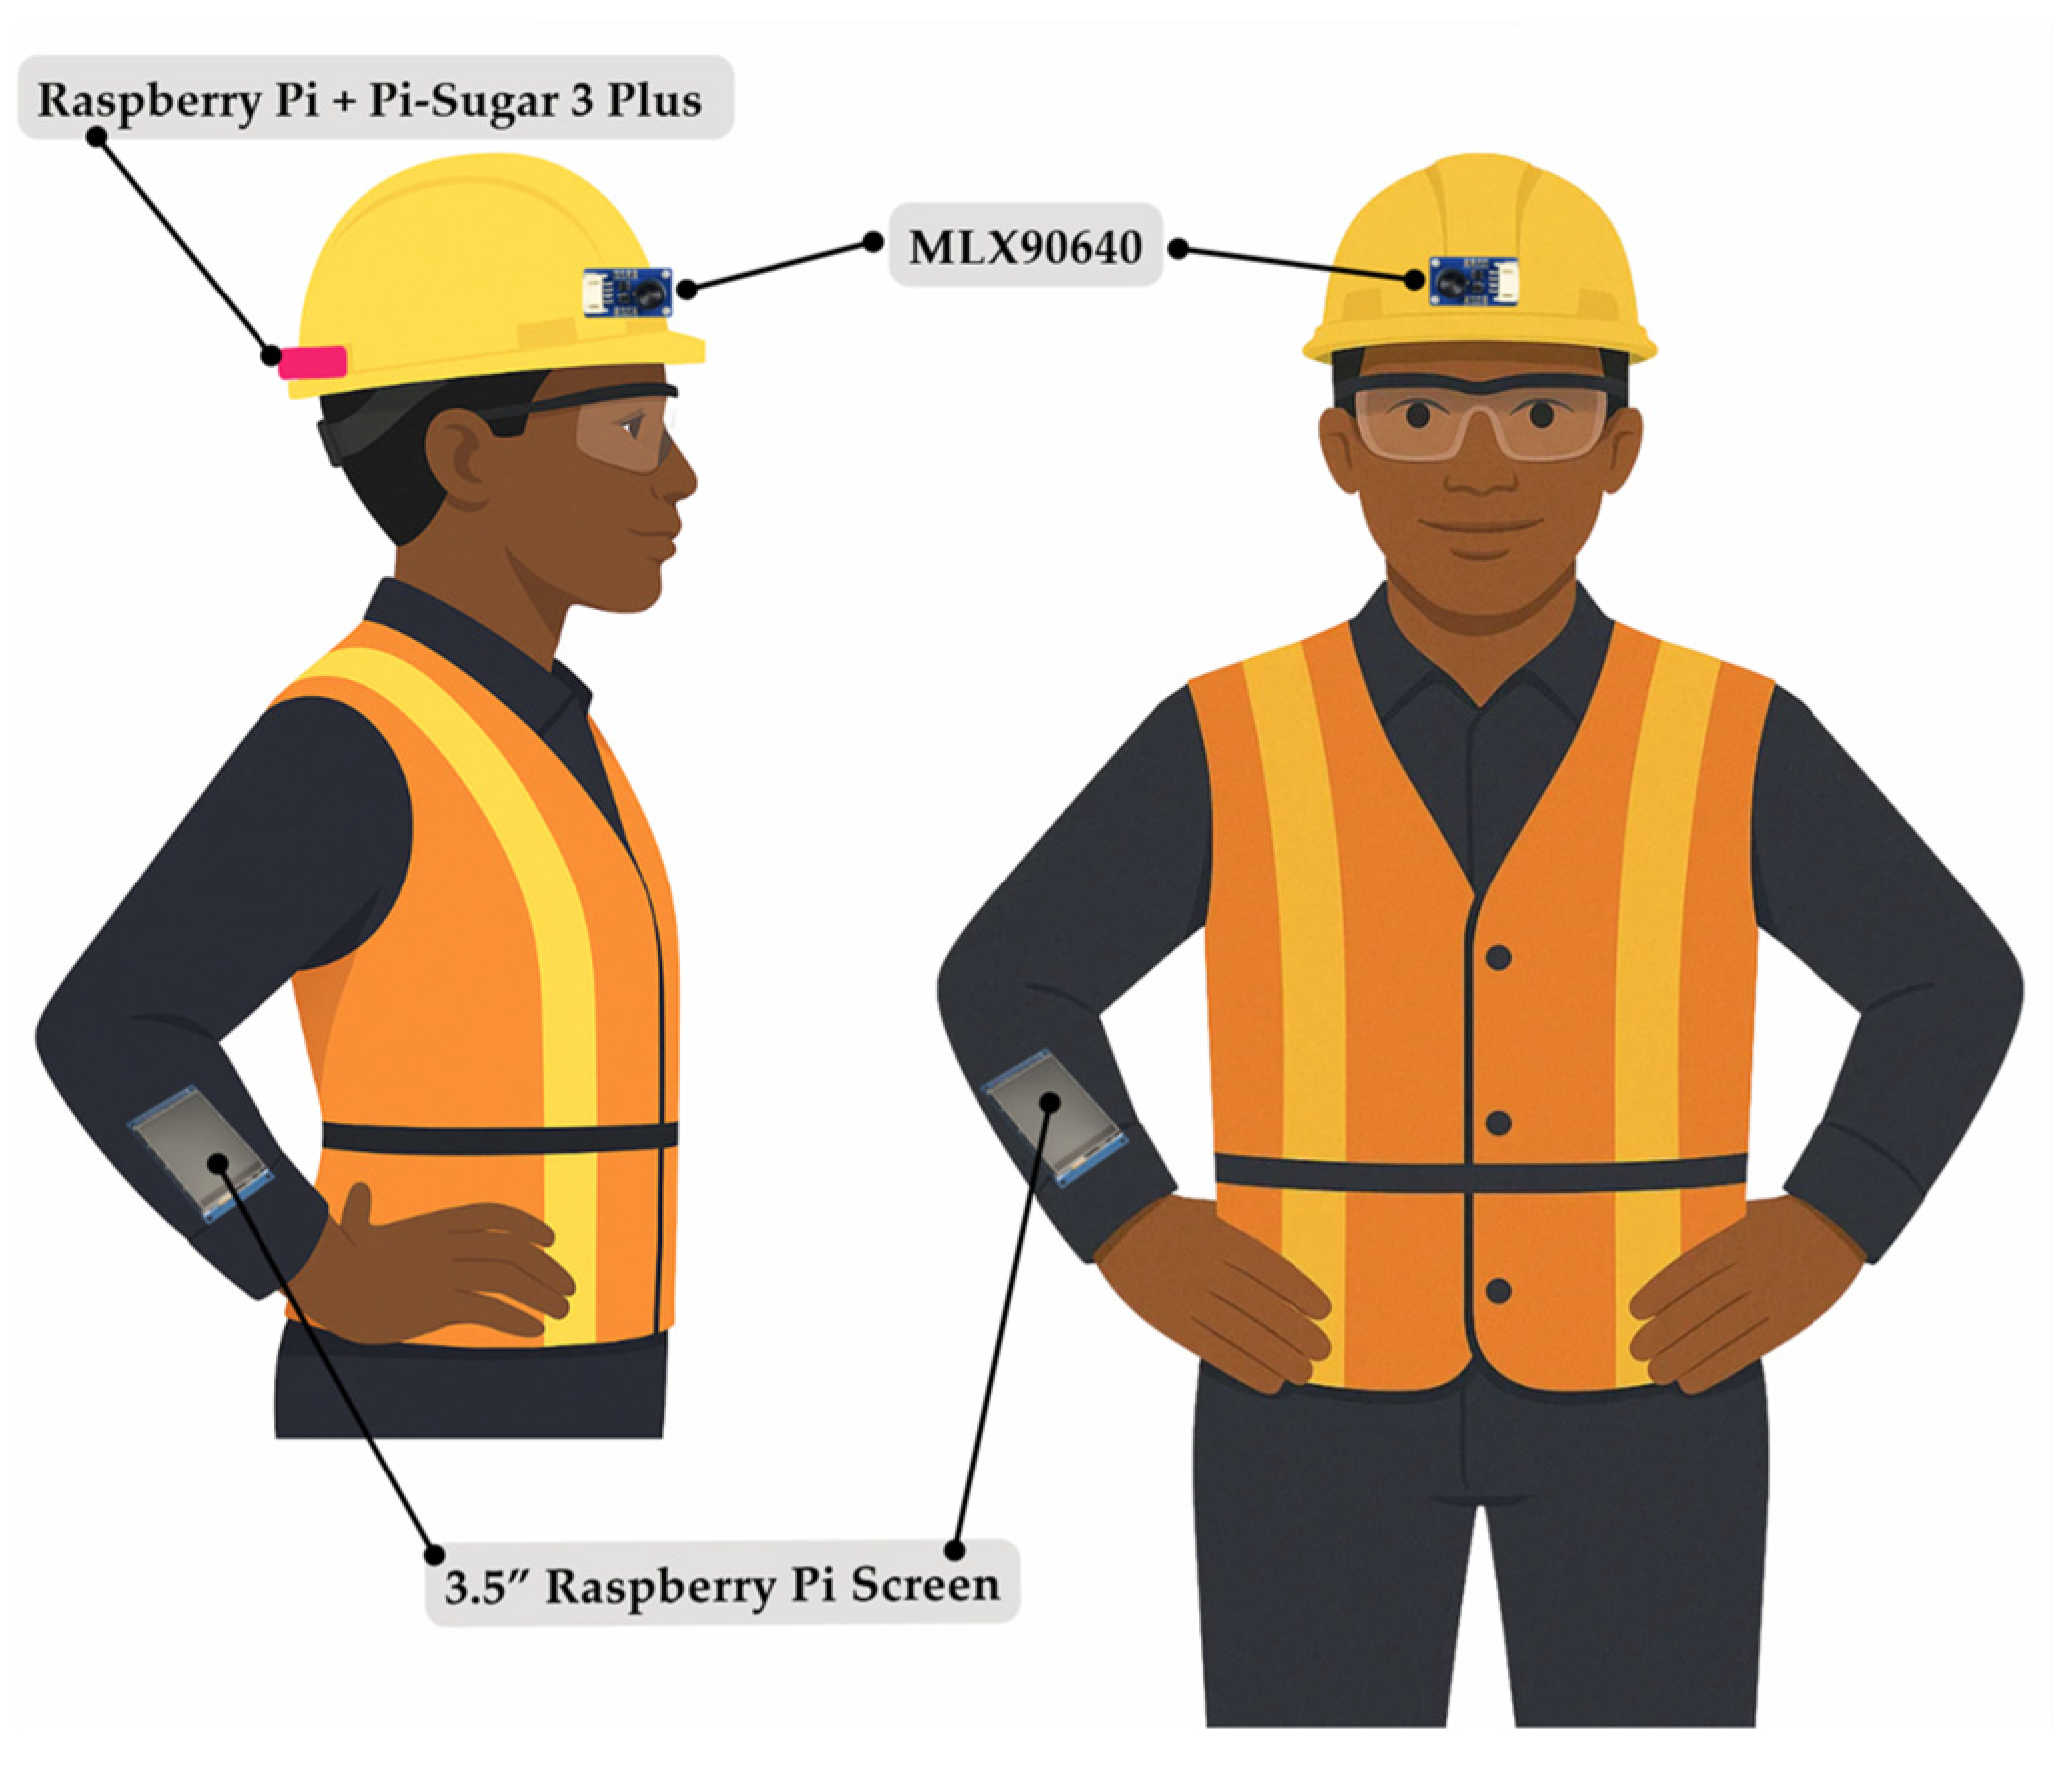
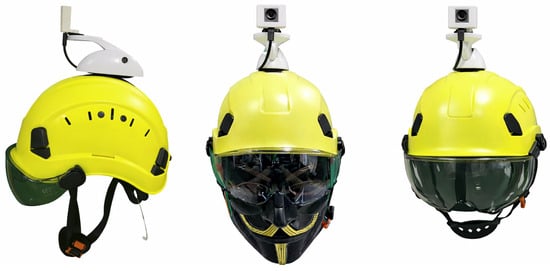
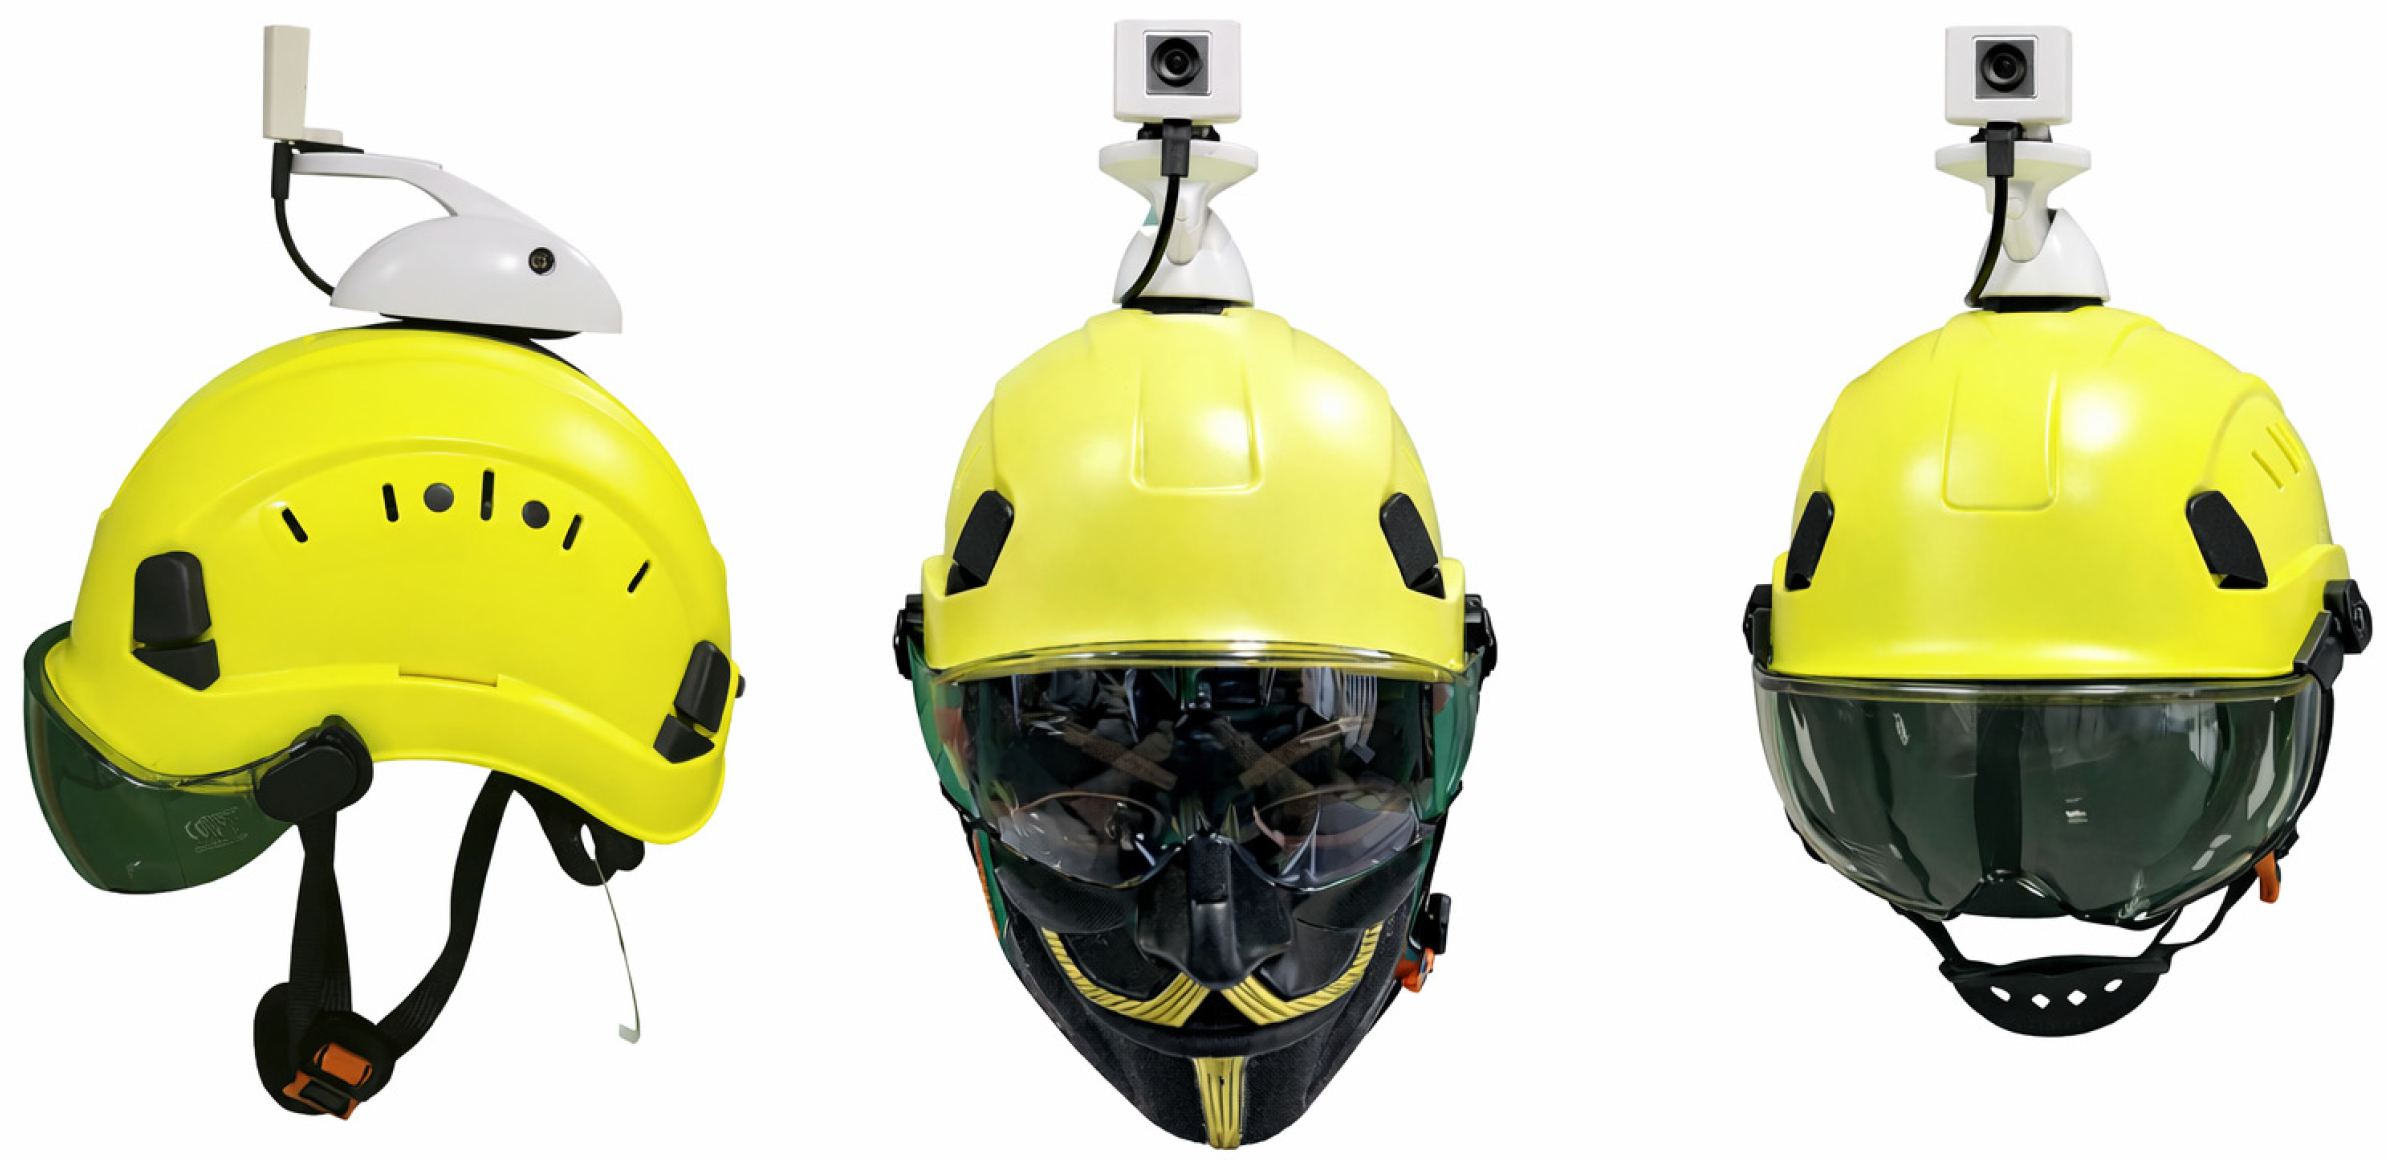
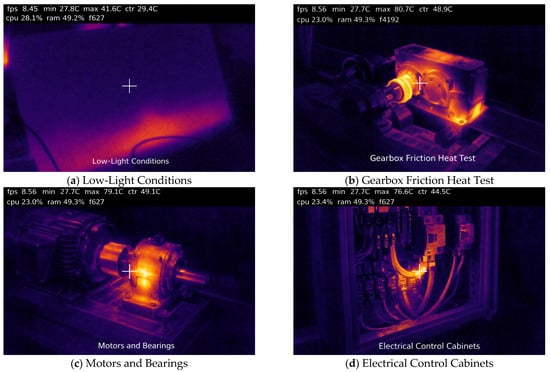
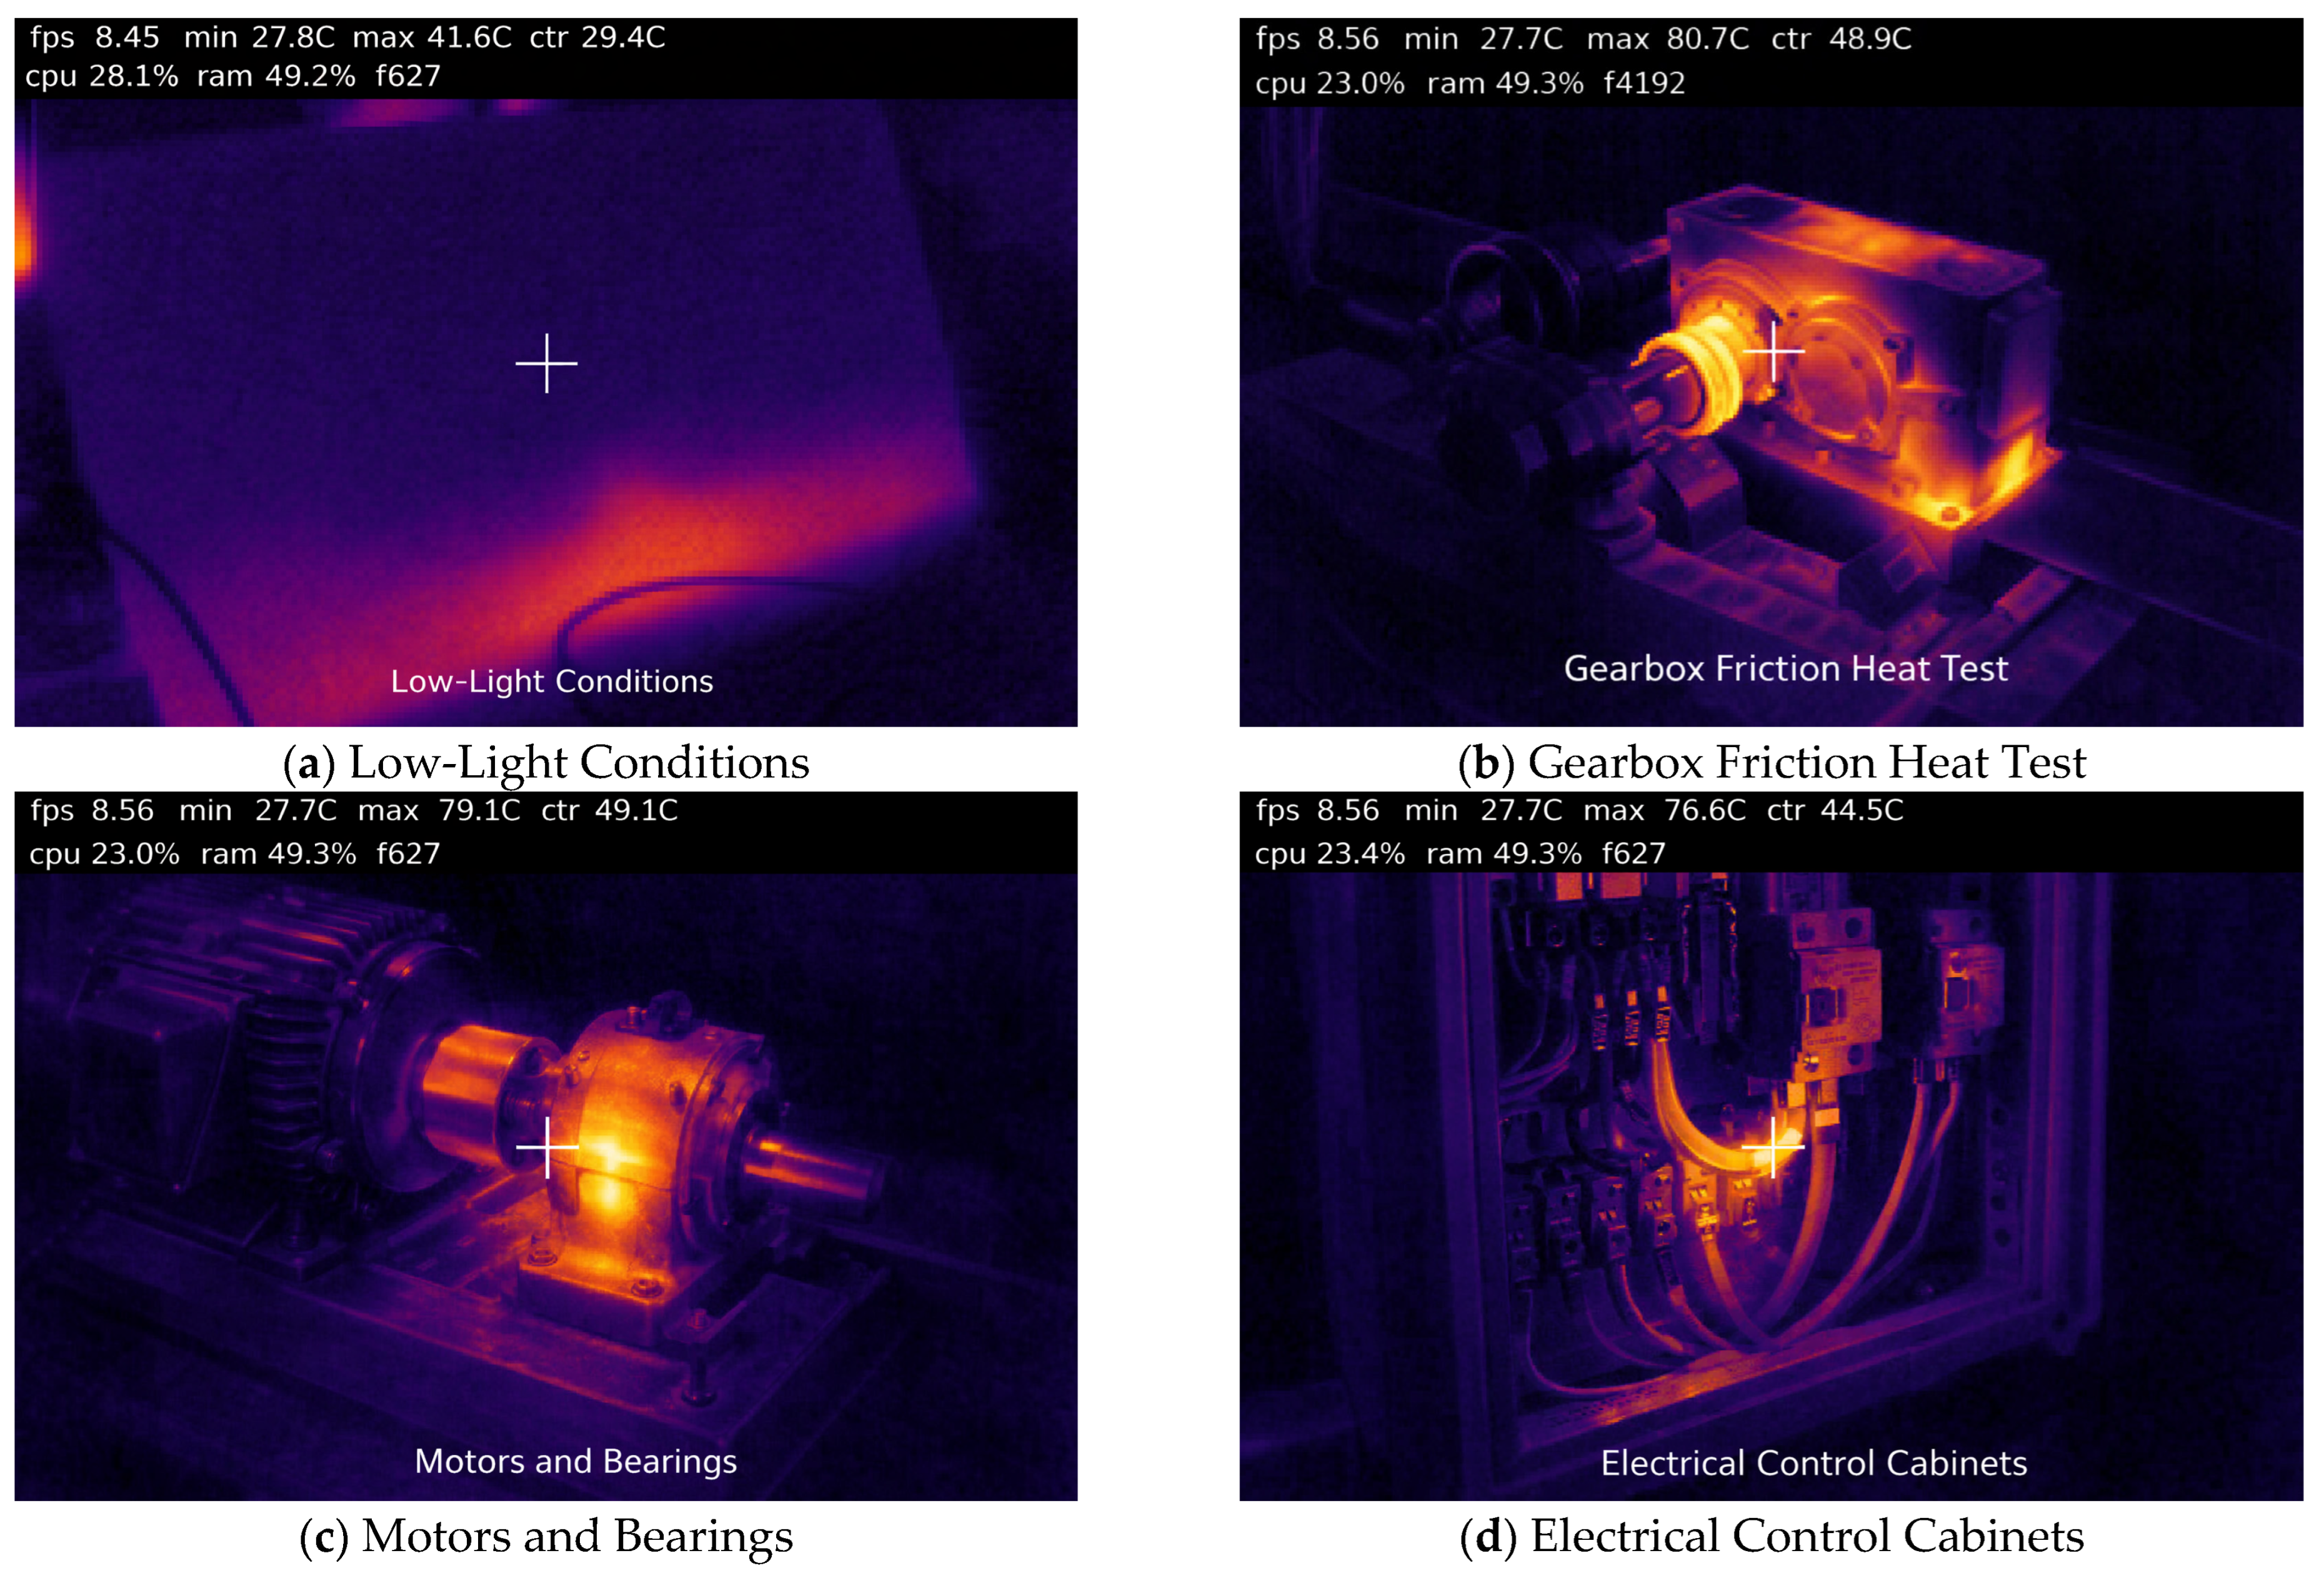
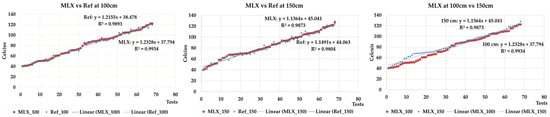
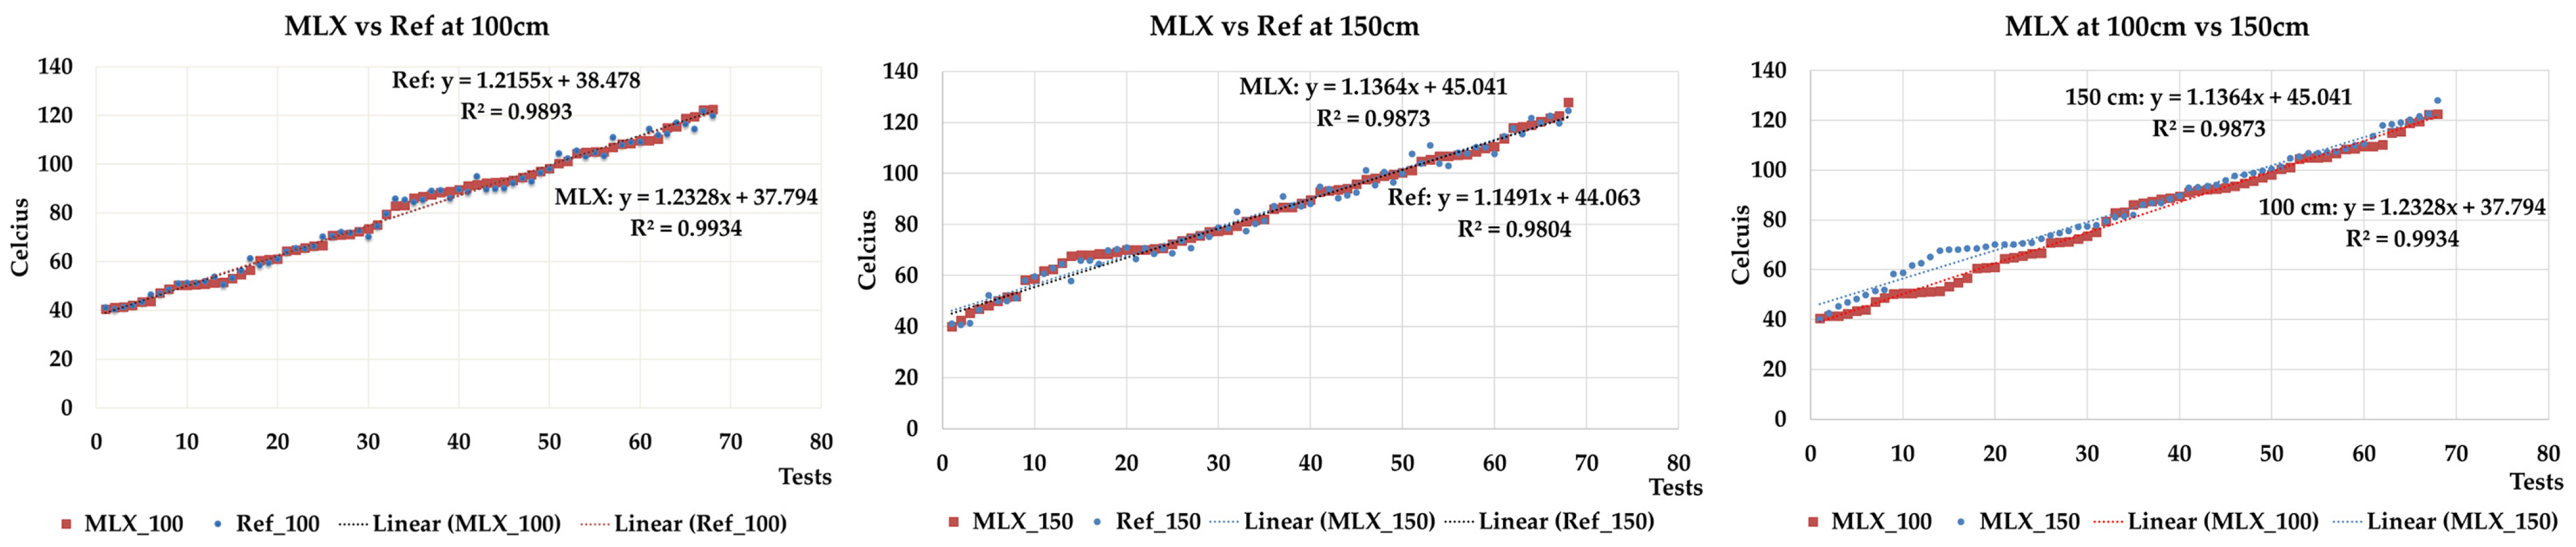
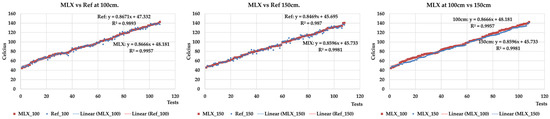
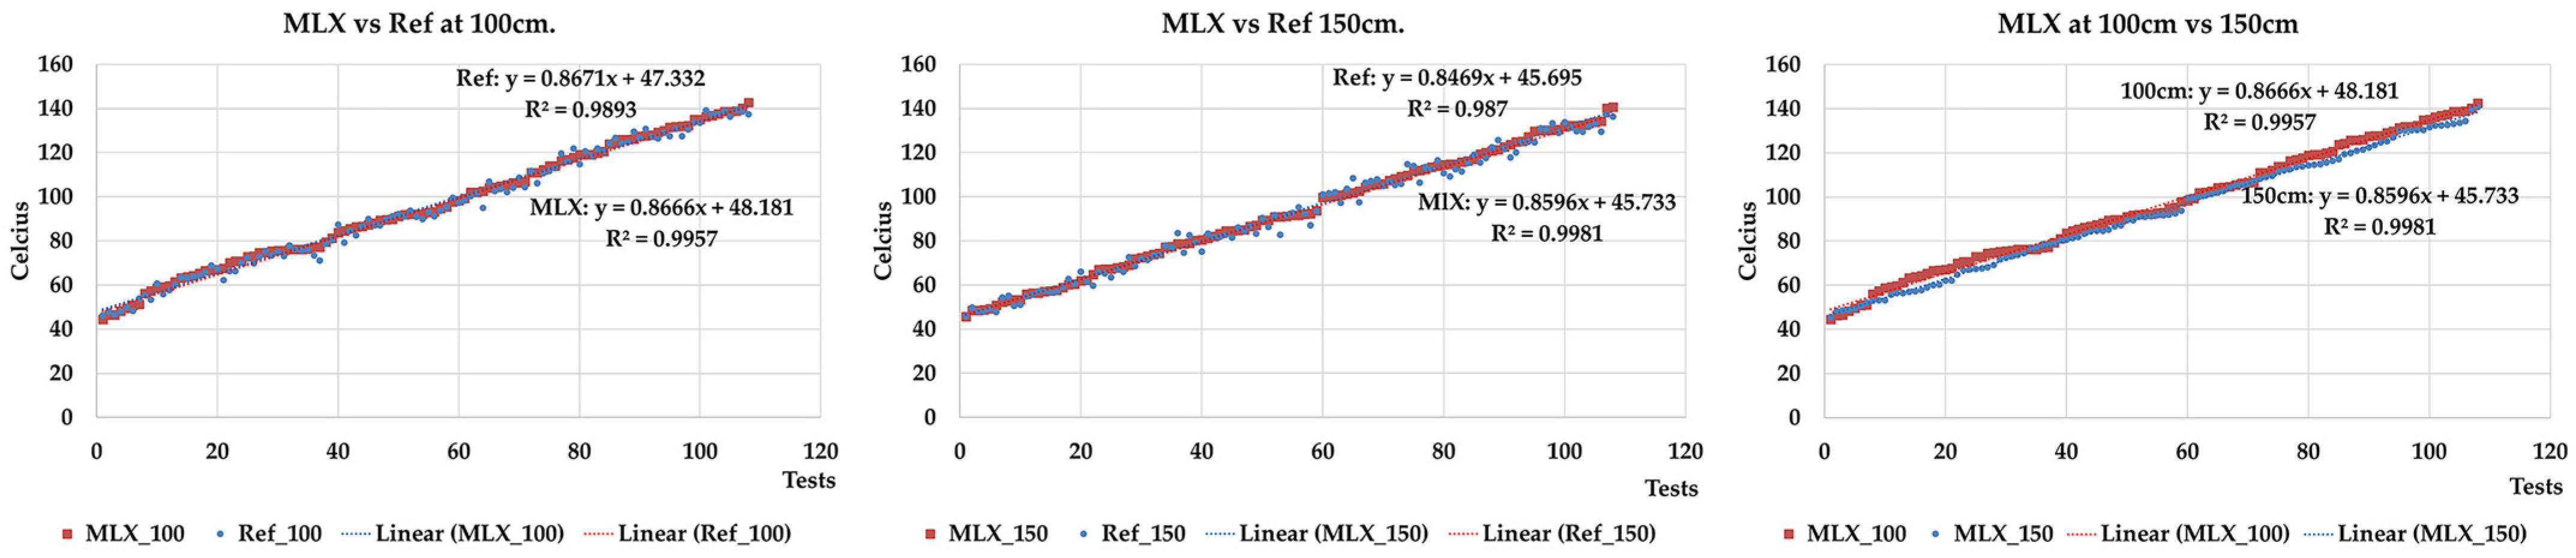
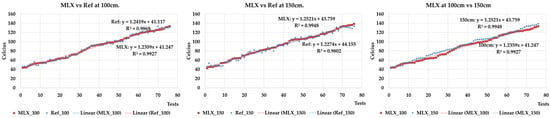
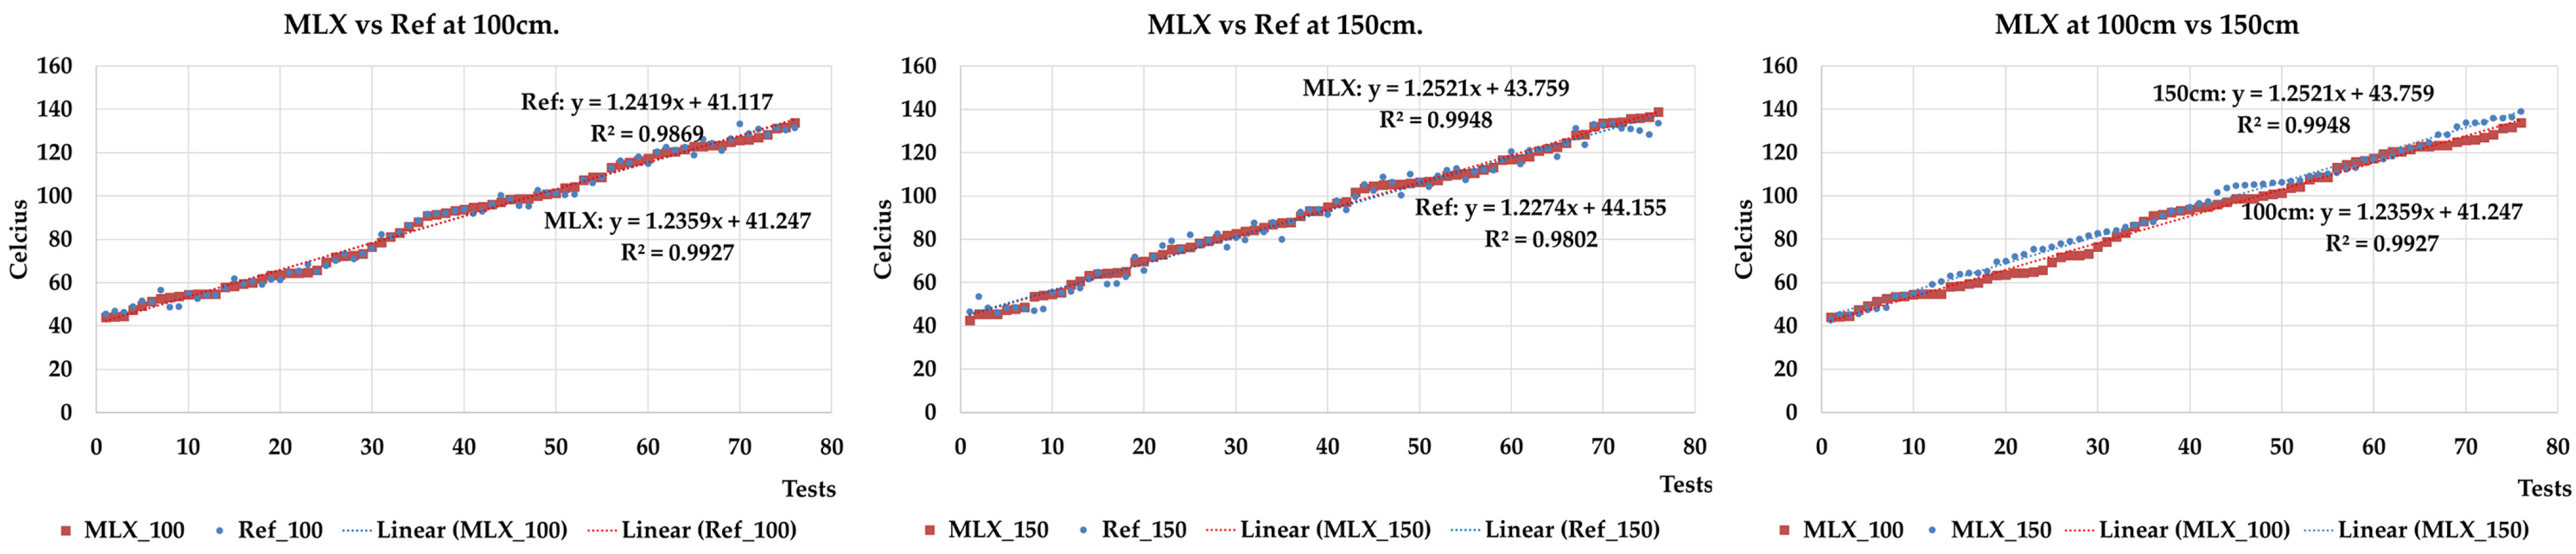
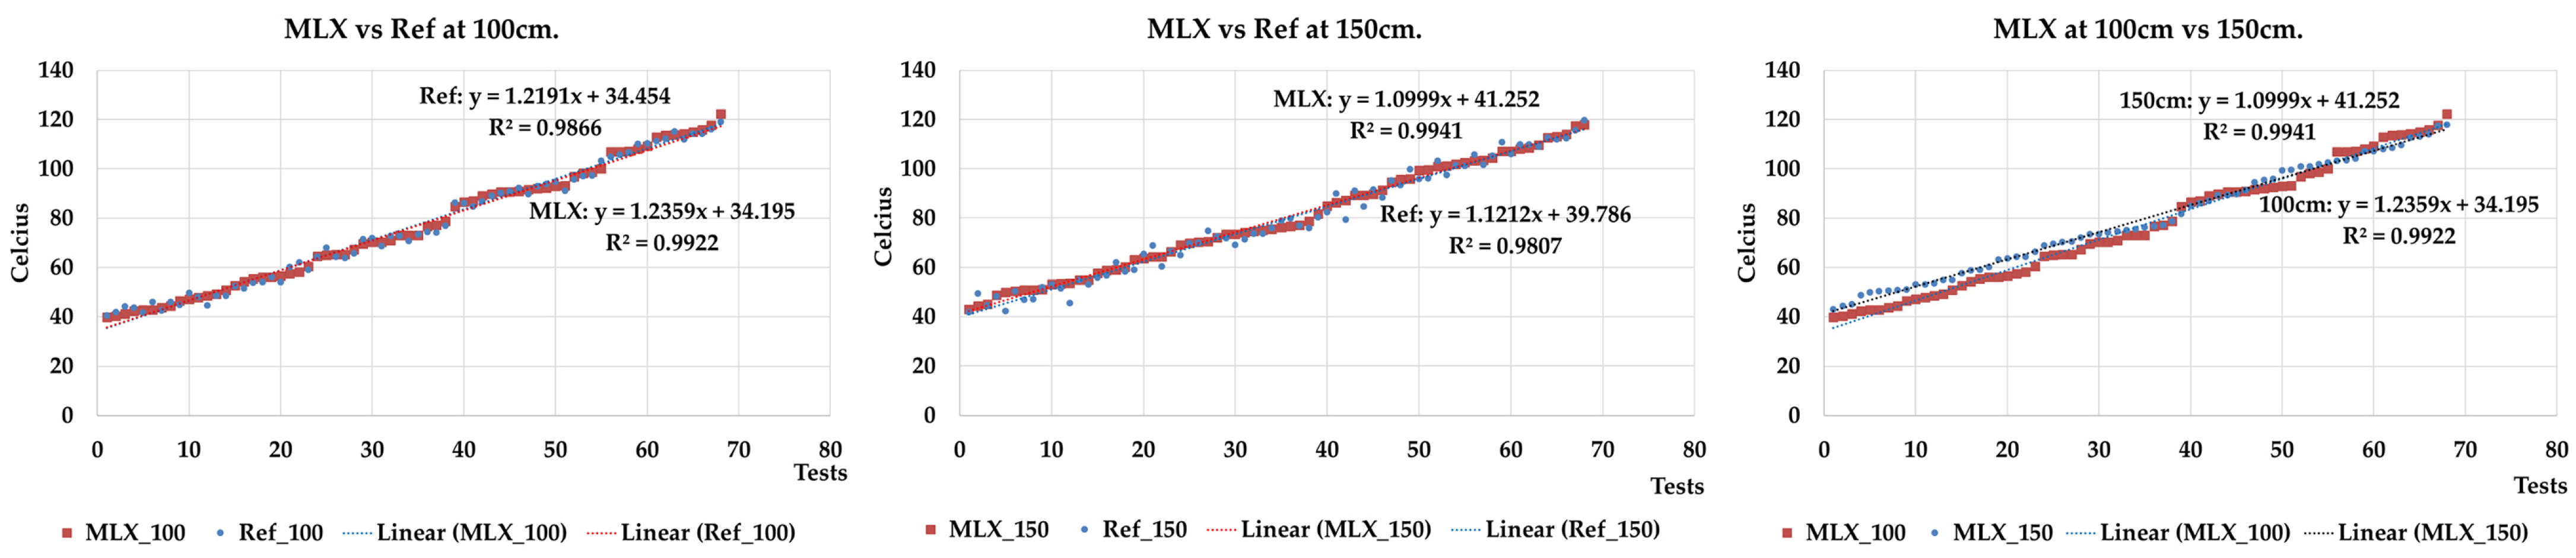
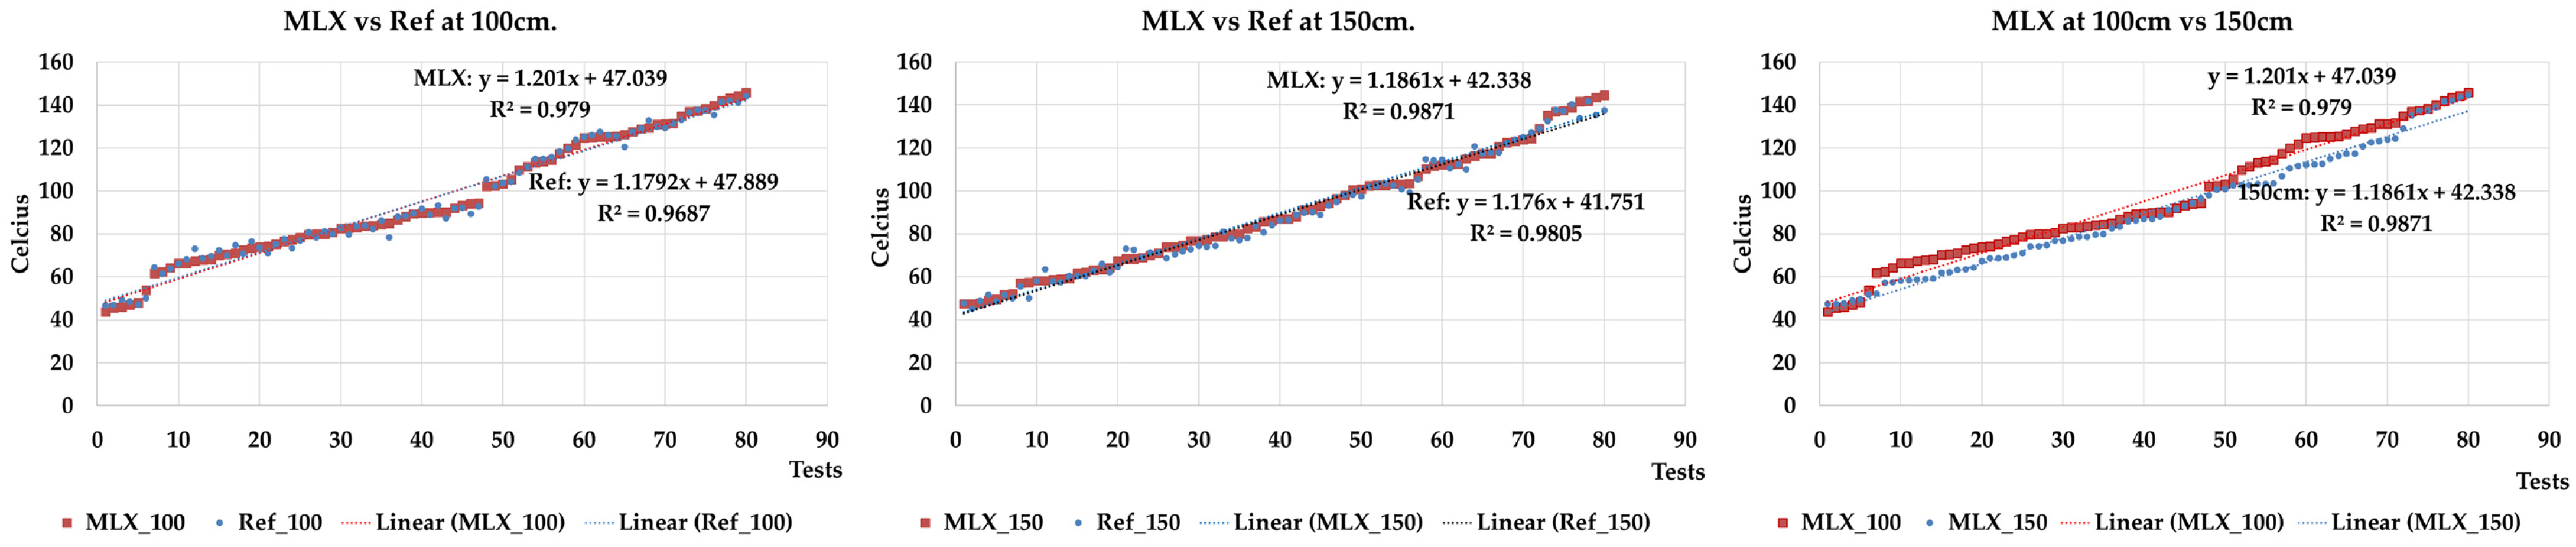
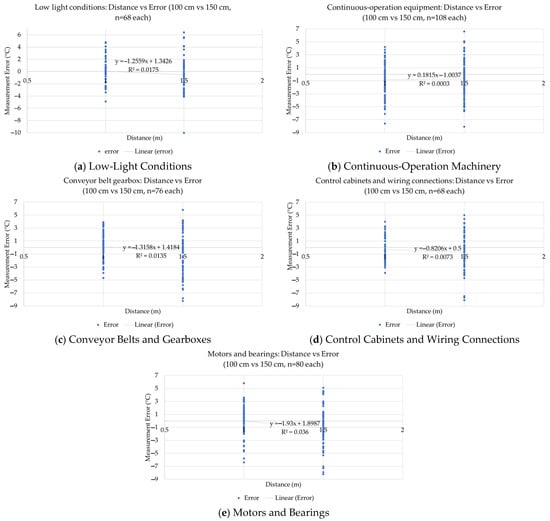
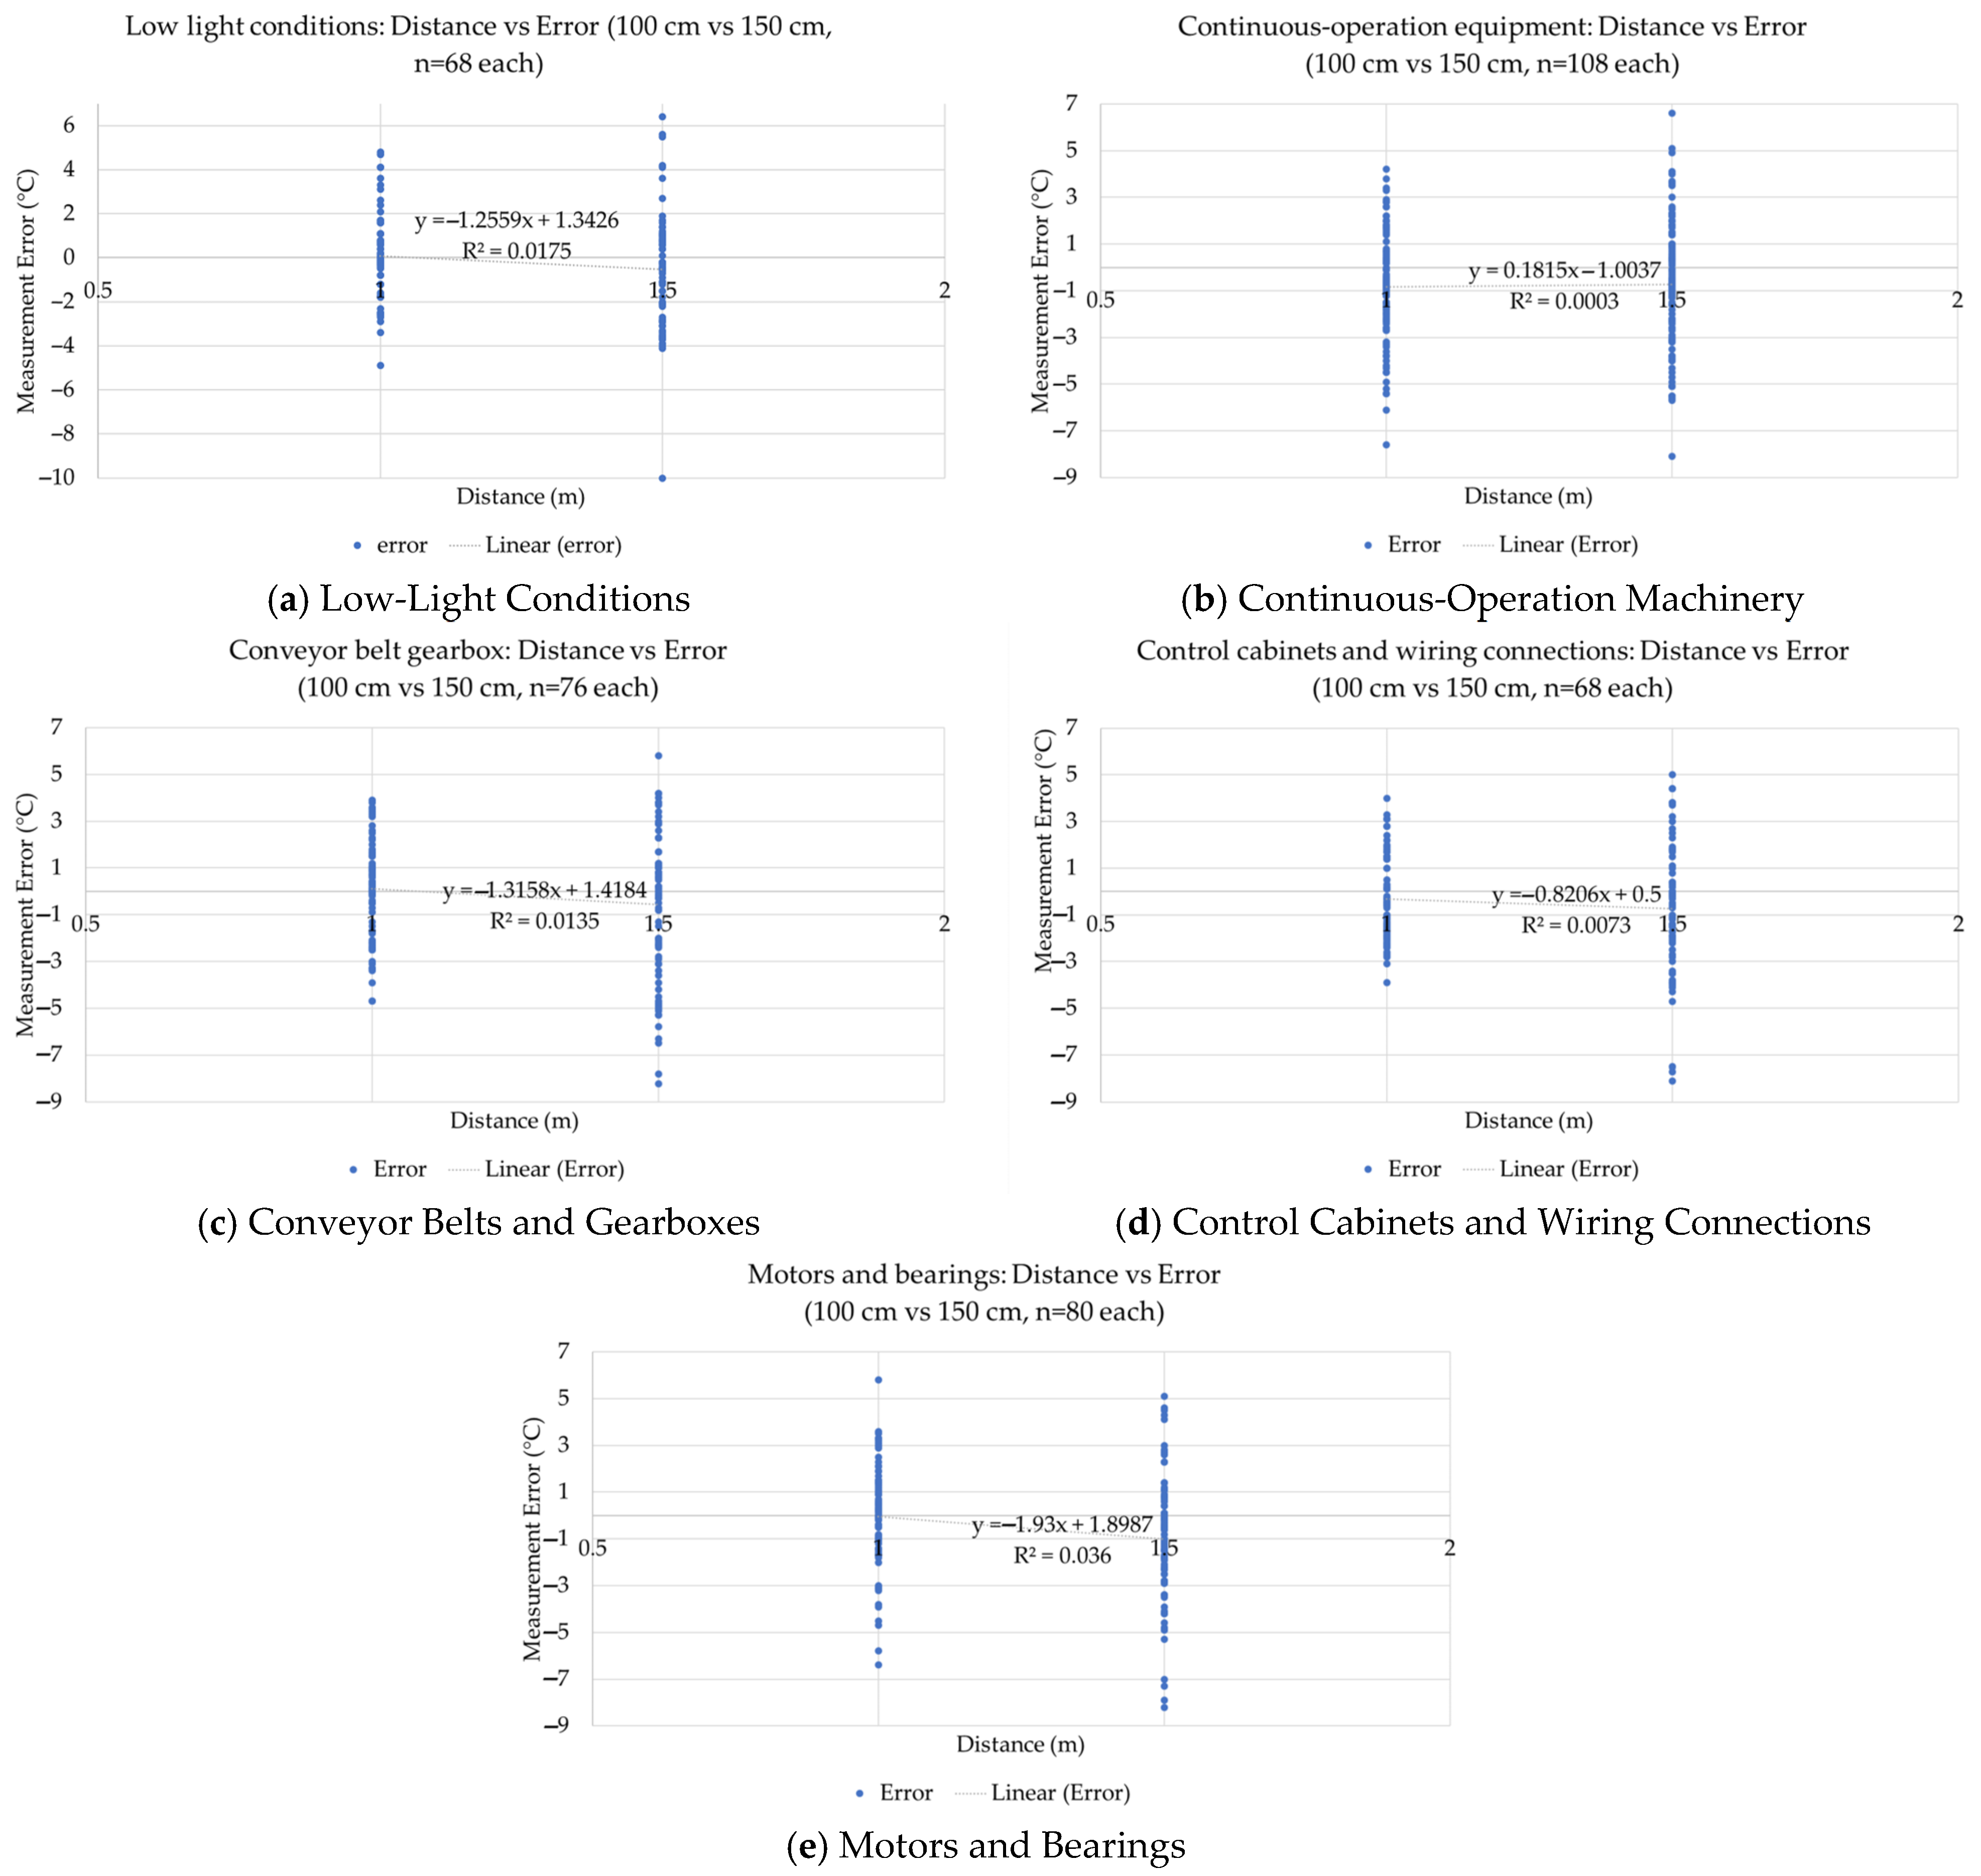


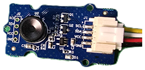
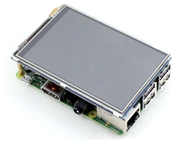
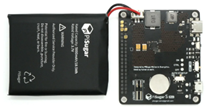
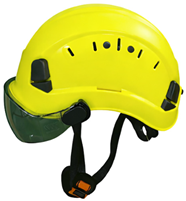
Disclaimer/Publisher’s Note: The statements, opinions and data contained in all publications are solely those of the individual author(s) and contributor(s) and not of MDPI and/or the editor(s). MDPI and/or the editor(s) disclaim responsibility for any injury to people or property resulting from any ideas, methods, instructions or products referred to in the content. |
© 2026 by the authors. Licensee MDPI, Basel, Switzerland. This article is an open access article distributed under the terms and conditions of the Creative Commons Attribution (CC BY) license.