


Abstract
Riverbank erosion threatens settlements, infrastructure, and river-dependent livelihoods along the Bassac River in the Vietnamese Mekong Delta. This study examines long-term bankline change from 2001 to 2025 and develops expert-informed priorities for assessing livelihood vulnerability within the Can Tho reach. Six Landsat images were analysed in QGIS using the Linear Regression Rate method, while present-day hydraulic conditions were investigated through Acoustic Doppler Current Profiler measurements at five representative locations. An Analytic Hierarchy Process based on interviews with 10 experts was used to derive relative weights for livelihood sensitivity and adaptive-capacity indicators and variables. Accretion was more spatially extensive than erosion along both banks; however, the left bank experienced a greater total extent and magnitude of erosion. Spatially extensive erosion was identified in Binh Thuy, whereas more intense but localised hotspots occurred near Cai Rang and Cai Von. The exploratory hydraulic observations varied among the five selected locations but showed no consistent correspondence with historical erosion magnitude and are therefore interpreted only as a snapshot of conditions on the survey date. Experts assigned weights of 0.547 to sensitivity and 0.453 to adaptive capacity. Savings capacity, decreased food production, extent of land loss, and the ability to shift livelihoods were among the highest-ranked variables. The physical and expert-derived findings support a differentiated and staged approach to riverbank-risk management, but they should be interpreted as complementary evidence rather than as a household-level vulnerability assessment. Future research should combine repeated seasonal hydraulic and bathymetric surveys, bank-material investigations, exposed-asset mapping, and household-based vulnerability assessments.
1. Introduction
The Vietnamese Mekong Delta (VMD) is a low-lying and rapidly transforming deltaic system exposed to interacting climatic, hydrological, and anthropogenic pressures [1]. Among the environmental hazards affecting the delta, riverbank erosion has become an increasingly important physical and socio-economic concern because it threatens settlements, infrastructure, agricultural land and river-dependent livelihoods [2]. Historically, the river channels of the VMD have been shaped by recurring erosion and deposition associated with seasonal flooding, sediment transport, and natural hydrodynamic variability. Recent studies, however, indicate that the extent and intensity of erosion have increased in several parts of the delta [3]. At the delta scale, Anthony et al. (2015) reported that coastal land loss along the South China Sea increased from approximately 1.2 km2 per year during 1885–1985 to 2.3 km2 per year during 2003–2012 [4]. Although these estimates relate primarily to coastal rather than riverbank erosion, they illustrate the broader sediment imbalance affecting the delta. More recently, Duy et al. (2025) estimated regional land losses of up to 500 ha per year [5].
Bank instability is driven by the interplay among factors such as bank material properties, seasonal water-level changes, flooding, wave action, channel geometry, and sediment transport processes [4,5,6,7]. These natural controls are increasingly modified by human activities. Upstream hydropower development has substantially reduced sediment delivery to the delta, contributing to riverbed incision and altered channel morphology [5,6,8,9]. Hydrological conditions within the delta have also been modified by extensive dike development. Long-term analyses at Chau Doc on the Bassac River indicate changes in discharge and water-level regimes associated with both deltaic dike systems and upstream alterations to river flow [10,11]. Sand extraction can further lower riverbeds and reduce lateral bank stability where extraction exceeds natural sediment replenishment [12,13]. Navigation, vessel-generated waves, river engineering, and urban expansion can also intensify local bank disturbance, while remote-sensing studies have documented considerable bankline change along the Mekong and Bassac rivers [5,6,8,9]. Land subsidence represents an additional pressure on the longer-term physical stability of the delta [2,3,4,5,14,15]. Recent field and modelling research has consequently emphasised that riverbank erosion cannot be attributed to a single driver but instead reflects interacting hydraulic, geomorphic and anthropogenic processes [16,17].
These processes are particularly consequential where urban development and infrastructure have expanded into erosion-prone river corridors. The Bassac, also known as the Hau River, extends approximately 225 km between An Giang and Soc Trang and forms one of the principal distributaries of the Mekong system [18]. Along this corridor, socio-economic development and urbanisation have contributed to the progressive occupation of designated riverbank protection zones [5,6,8,9]. Reported encroachment rates are approximately 48% in An Giang Province and 21% in Can Tho, indicating that substantial numbers of structures and activities are located within protected corridors. Such encroachment increases the exposure of settlements, infrastructure, agricultural land and livelihood activities to localised bank retreat. Although riverbank protection policies and safety corridors have been established, the observed patterns suggest continuing difficulties in translating hazard information into development control, corridor enforcement, and spatial planning [5,6,8,9]. Sustained bank retreat in exposed areas may consequently result in property and land loss, infrastructure disruption, livelihood impacts, and, in extreme cases, loss of life [5,15].
This study applies the risk framing of the Intergovernmental Panel on Climate Change Sixth Assessment Report, in which risk arises through interactions among hazards, exposure, and vulnerability [19]. Within this framing, riverbank instability represents the physical hazard, while settlements, infrastructure, agricultural land and livelihood activities located within erosion-prone areas constitute elements of exposure. Vulnerability describes the propensity of affected households or livelihood systems to experience harm and is influenced by their sensitivity and their capacity to cope and adapt. The distinction is important because a physical bank retreat does not automatically have equivalent consequences for all exposed communities. At the same time, the present study does not directly measure household vulnerability. Instead, it uses expert judgement to identify the sensitivity and adaptive capacity factors that should be prioritised in subsequent household assessments and river corridor planning.
Existing research leaves three specific gaps. First, remote-sensing studies identify bankline change and erosion hotspots [3,5,6,9,15], but these physical patterns are seldom used to structure assessments of the livelihood characteristics that determine how erosion affects exposed communities. Second, studies of sediment dynamics, channel morphology and hydrodynamic controls [4,7,8,14,16,17] generally remain analytically separate from livelihood-vulnerability research [2]; few reach-scale assessments clearly distinguish between long-term geomorphic evidence and the more limited interpretive role of short-duration hydraulic observations. Third, existing social-vulnerability studies demonstrate substantial variation among erosion-affected households [2], but they are rarely organised around mapped hotspot characteristics such as erosion rate, affected length and spatial configuration. Consequently, decision-makers lack a transparent basis for determining where detailed process investigation, exposure mapping and household-level vulnerability assessment should be prioritised.
This study addresses these gaps through a deliberately bounded integration of three complementary evidence streams. Long-term bankline-change analysis provides the principal evidence of the location, magnitude and spatial extent of physical instability. A one-day ADCP survey provides exploratory observations of contemporary flow conditions, while an expert-based AHP identifies the livelihood sensitivity and adaptive-capacity factors that should be examined in subsequent household assessments. The study’s contribution lies not in claiming a causal linkage or providing a completed spatial risk assessment, but in distinguishing contrasting physical hotspot types and developing a staged framework for process investigation, river-corridor planning, exposure mapping and household-level vulnerability assessment.
The study’s distinctive contribution is a staged, reach-scale decision-support framework that uses long-term bankline trends to distinguish spatially extensive erosion-prone sections from high-intensity local hotspots and then connects these physical hotspot characteristics with expert-prioritised dimensions for subsequent exposure and livelihood-vulnerability assessment. The framework does not treat the remote-sensing, ADCP and AHP evidence as causally or statistically equivalent; rather, it clarifies the different roles of each evidence stream in guiding monitoring, detailed process investigation and household-level assessment.
The central proposition is that riverbank erosion along the Bassac River is spatially heterogeneous rather than uniform or system-wide. The management significance of individual hotspots depends not only on their erosion rate and spatial extent but also on the settlements, infrastructure, agricultural activities, and livelihood systems that may be exposed. Therefore, the study examines three research questions.
- What are the spatial extent, magnitude, and longitudinal distribution of erosion and deposition along the Bassac River between 2001 and 2025?
- Which livelihood sensitivity and adaptive-capacity indicators do experts consider most important for the assessment and management of erosion-related vulnerability?
- How can the physical hotspot analysis and expert-derived priorities inform differentiated approaches to erosion mitigation, river-corridor planning, and future household-level vulnerability assessment?
2. Materials and Methods
2.1. Study Area
This study examines riverbank change along the Bassac River, also known in Vietnam as the Hau River, across the river corridor extending from An Giang to the former Soc Trang Province. The Bassac is one of the principal distributaries of the Mekong River and is characterised by substantial variations in channel width, channel curvature and bank morphology. Its course includes numerous mid-channel islands, bifurcated channel sections, and densely developed riverbanks. Previous remote-sensing studies have shown considerable longitudinal variation in Bassac River width, with the channel generally widening downstream but narrowing again near its seaward outlet [18,20]. These morphological characteristics influence the spatial redistribution of flow and sediment, contributing to local differences in riverbank stability.
The long-term bankline-change analysis was conducted along the wider Bassac River corridor to establish the regional distribution of erosion, deposition, and relatively stable riverbank sections. A more detailed assessment was undertaken within the Can Tho reach, which includes the urbanised riverfronts of Binh Thuy, Ninh Kieu and Cai Rang, as well as several mid-channel islands, including Con Son and Con Au. Analysing bankline change at both river-corridor and reach scales allows the erosion hotspots identified in Can Tho to be interpreted within the broader geomorphic context of the Bassac River.
Can Tho City is the principal urban and economic centre of the VMD. Urban development, port activities, navigation, riverbank infrastructure, and agricultural and residential land uses occur in close proximity to the river, creating considerable potential exposure to bank instability. To maintain consistency with the spatial data and administrative boundaries used during the study period, the detailed study area corresponds to the boundaries of Can Tho City prior to the administrative reorganisation of July 2025. The city comprised nine district-level administrative units, four of which bordered the Bassac River directly or through associated channels (Figure 1). The use of the historical boundary should therefore be understood as a spatial definition of the study reach rather than a representation of the current administrative structure.
Figure 1.
Location of the Bassac River corridor and detailed study reach within Can Tho City. The map shows the nine district-level administrative units and city boundaries in use before the July 2025 administrative reorganisation.
2.2. Research Design
This study adopted a multi-method research design comprising two principal analytical components and one supplementary field-observation component. Long-term bankline-change analysis was used to characterise the spatial distribution, magnitude and extent of riverbank instability, while expert-based AHP was used to prioritise livelihood sensitivity and adaptive-capacity factors for subsequent assessment. A Teledyne Sentinel V20 Acoustic Doppler Current Profiler (ADCP; Teledyne RD Instruments, Poway, CA, USA) was used to measure flow velocities. A one-day ADCP survey was retained only as an exploratory and supplementary description of contemporary flow-velocity conditions at five selected locations within the Can Tho reach (Figure 2).
Figure 2.
Overall research framework. The ADCP survey is an exploratory and supplementary component and is not used to explain the historical bankline-change patterns.
First, multi-temporal Landsat imagery was processed, and the Linear Regression Rate method was implemented in QGIS to quantify bankline change along the Bassac River between 2001 and 2025. This analysis provides the principal physical evidence and identifies erosion, accretion and relatively stable sections, including hotspots differing in magnitude and spatial extent. Supplementary ADCP measurements collected at five selected locations within the Can Tho reach describe spatial variation in mean flow velocity during the survey conducted on 26 May 2026. Because these observations represent only a single field survey and post-date the bankline-analysis period, they are not used to explain or attribute the historical erosion patterns.
Second, an expert-based Analytic Hierarchy Process was used to prioritise indicators of livelihood sensitivity and adaptive capacity. Indicator-based vulnerability approaches have been widely used to organise heterogeneous social, economic, and environmental factors and to support comparative assessment [21,22]. They are particularly useful where vulnerability cannot be represented by a single directly observable variable. However, physical and indicator-based assessments alone may not fully capture household behaviour, lived experience, or locally specific adaptive responses [23]. The expert-derived weights were therefore interpreted as provisional assessment and planning priorities rather than as measurements of household-level vulnerability. The three components were integrated at the interpretation stage. The mapped erosion hotspots provided information on the location, magnitude, and spatial extent of physical bank instability, while the expert assessment identified the livelihood factors to consider when evaluating potentially exposed communities. The study does not produce a spatially explicit household-vulnerability index or test statistical relationships between erosion rates and household characteristics. Instead, it develops an initial decision-support framework to differentiate among physical mitigation, river-corridor planning, and future household-level vulnerability assessment based on the characteristics of identified erosion hotspots.
The research design is situated within a hazard–exposure–vulnerability framework, in which vulnerability comprises sensitivity and adaptive capacity. The Landsat analysis characterises the physical erosion hazard through the rate, magnitude and spatial extent of historical bankline change. The ADCP survey provides limited contextual information about contemporary flow conditions at five selected locations and is not treated as evidence of hydraulic control over the mapped historical erosion. Exposure was not quantified because spatial inventories of people, structures, infrastructure and livelihood assets were unavailable. Similarly, the AHP identifies expert-prioritised sensitivity and adaptive-capacity factors but does not measure these characteristics among affected households. The study therefore provides a staged framework for subsequent risk assessment rather than calculating an integrated risk or vulnerability index.
2.3. Remote Sensing and Bankline-Change Analysis
A multi-temporal remote-sensing analysis was conducted using Landsat satellite imagery acquired between 2001 and 2025. Six images were selected at approximately five-year intervals to characterise long-term bankline change and identify erosion-, accretion- and stability-prone sections along the Bassac River (Table 1). Images were selected to provide comparable spatial coverage and maximise the visibility of the water–land boundary while reducing potential interference from cloud cover and seasonal variations in river stage. Scenes acquired during the regional dry season, generally between November and April, were preferred because lower cloud cover and more stable hydrological conditions facilitate bankline delineation. Suitable cloud-free imagery was not available for every target year; consequently, the 18 May 2010 image was retained to maintain the temporal resolution of the bankline record. With all six scenes, consecutive acquisition intervals range from approximately 4.21 to 5.15 years, whereas exclusion of the 2010 scene would produce an 8.89-year gap between 2006 and 2015. All selected scenes had less than 30% total scene cloud cover, and cloud- and shadow-affected areas within the study corridor were excluded from the bankline analysis. Images from Landsat 5 Thematic Mapper, Landsat 8 Operational Land Imager, and Landsat 9 Operational Land Imager-2 were obtained from the United States Geological Survey EarthExplorer archive. All scenes had a spatial resolution of 30 m and were processed in a common projected coordinate system prior to water classification and bankline extraction.
Table 1.
Landsat imagery used for the multi-temporal bankline-change analysis along the Bassac River.
Because the extracted water–land boundary represents the instantaneous shoreline at the time of satellite acquisition, differences in river stage may introduce apparent lateral displacement unrelated to permanent geomorphic bank retreat. In particular, higher river stage during the 18 May 2010 acquisition may have shifted the extracted boundary landward, especially along gently sloping banks, thereby introducing an apparent erosional displacement. A complete water-level normalisation could not be applied because consistent river-stage observations corresponding to all six Landsat acquisition times were unavailable. The resulting LRR values are therefore interpreted as long-term rates of observed bankline displacement rather than exact rates of geomorphic bank erosion.
Image processing was conducted in QGIS version 4.2.2 to distinguish water bodies from the land surface and extract shoreline positions. This involved calculating the Normalised Difference Water Index (NDWI) using near-infrared (NIR) and GREEN bands to enhance the delineation of water boundaries [5]. NDWI was calculated for each image using the following formula proposed by McFeeters (1996) [24]:
The appropriate spectral bands were selected for each Landsat sensor: Band 2 (GREEN) and Band 4 (NIR) for Landsat 5 TM, and Band 3 (GREEN) and Band 5 (NIR) for Landsat 8 OLI and Landsat 9 OLI-2. The resulting NDWI values range from −1 to +1. A fixed threshold of NDWI = 0 was applied to all scenes; pixels with NDWI > 0 were classified as water and pixels with NDWI ≤ 0 as land. The resulting water–land boundaries were extracted in vector format as dated banklines [5]. The LRR method was implemented in QGIS using analysis transects generated along both riverbanks. At each transect, we recorded the positions of the six dated banklines in metres. LRR was calculated as the slope of an unweighted ordinary least-squares regression of bankline position against image acquisition date. Each transect intersected the six dated banklines, and bankline position was measured consistently along the transect.
where y is the bankline position (m), t is time (year), a is the LRR value (m/year), and b is the regression intercept. Negative LRR values indicate landward bank retreat, whereas positive values indicate riverward bank advance.
To quantify how displacement of the seasonally different 2010 bankline would propagate into the estimated LRR, an analytical sensitivity calculation was conducted using the six acquisition dates and the unweighted least-squares regression applied in this study. Because the 2010 observation lies close to the temporal centre of the 2001–2025 record, a lateral displacement affecting only this bankline changes the fitted LRR by approximately 0.0066 m/year for every metre of displacement. As an illustrative scenario, a displacement equal to one 30 m Landsat pixel would therefore change the fitted LRR by approximately 0.20 m/year. The 30 m value represents the spatial resolution of the imagery and is used only as a transparent sensitivity scenario; it is not an estimate of positional accuracy or an upper bound on water-level-induced displacement.
2.4. ADCP Flow Velocity Survey
To provide supplementary observations of contemporary flow-velocity conditions, a boat-based field survey was conducted on 26 May 2026 along the Can Tho reach. The survey covered the urban districts of Binh Thuy, Ninh Kieu, and Cai Rang, where remote sensing analysis identified several erosion hotspots. Flow velocity measurements were collected using a Teledyne Sentinel-V20 ADCP. The ADCP was deployed from a survey vessel at five cross-sectional locations distributed along the study reach. At each of the five surveyed cross-sections, we obtained ADCP measurements at multiple verticals distributed between the left and right banks. Measurement locations were coded using a two-number system: the first number identifies the cross-section and the second identifies the measurement vertical within that cross-section. For example, location “2–3” refers to the third measurement vertical at cross-section 2, while “5–2” refers to the second measurement vertical at cross-section 5.
For the exploratory comparison presented here, one measurement vertical was selected from each cross-section, yielding locations 1–3, 2–3, 3–3, 4–4 and 5–2. This provided one longitudinally distributed observation from each of the five surveyed cross-sections across the Can Tho reach. No formal statistical sampling procedure was used to identify representative sites; consequently, these locations are described as selected rather than representative. They provide spatially distributed snapshots of contemporary flow conditions and should not be interpreted as representing the complete cross-sectional or reach-scale velocity field. Because the measurements were collected during a single survey, they represent only the hydraulic conditions observed on 26 May 2026 and post-date the 2001–2025 bankline record. They were used solely for exploratory spatial comparison with mapped erosion hotspots and cannot establish a statistical or causal relationship between contemporary flow velocity and historical bankline change.
2.5. Expert-Based Prioritisation of Livelihood-Vulnerability Indicators Using AHP
The study adopts the vulnerability framework based on that of the IPCC, in which vulnerability is expressed as a mathematical function of two core components [19]:
where V denotes the conceptual vulnerability construct, S is sensitivity, and AC is adaptive capacity. In this study, the AHP was used to derive expert-based relative weights for these components and their associated indicators and variables. It was not used to calculate household-level vulnerability scores. Accordingly, the resulting weights represent planning priorities rather than direct measures of vulnerability among individual households.
The proposed framework is structured hierarchically into four levels: (1) the Livelihood Vulnerability Index, (2) main components, (3) indicators, and (4) variables. The two core components, sensitivity and adaptive capacity, are each represented by four indicators comprising multiple proxy variables derived from the literature [25,26]. To determine the numerical weights of the framework elements, expert interviews were conducted using the AHP. AHP has also been applied in geohazard assessments to structure complex multi-criteria problems, derive comparable weights for heterogeneous factors, and support the spatial identification of priority areas. For example, Krassakis et al. used AHP within a GIS-based coastal multi-hazard framework to integrate soil erosion, flooding, landslide, and tsunami susceptibility [27]. Recent research in Vietnam has similarly combined AHP-derived weights with socioeconomic data to map social vulnerability across sensitivity and adaptive capacity dimensions at the commune level [28,29]. Ten experts were selected purposively based on their academic or professional expertise in river hydraulics, sediment transport, riverbank erosion, water and environmental management, agricultural economics, and climate-related risk. The panel was intended to provide informed multidisciplinary judgement concerning the proposed hierarchy; it was not designed to constitute a statistically representative sample of all stakeholders or erosion-affected communities. Table 2 summarises the disciplinary composition of the panel.
Table 2.
Characteristics of the experts participating in the AHP assessment, including their highest academic qualification, area of expertise, and interview date.
Experts compared elements in pairs and assigned relative importance scores using the Saaty scale, ranging from 1 (equal importance) to 9 (extreme importance of one factor over another). The collected responses were transformed into pairwise comparison matrices representing the relative priority levels of components, indicators, and variables. To ensure logical consistency in expert judgements, the Consistency Index (CI) and Consistency Ratio (CR) were calculated for each matrix. Matrices were accepted if CR ≤ 0.10 [30]. All consistent matrices were aggregated into a single common matrix using the geometric mean method to combine experts’ opinions. The aggregated matrix was normalised to derive priority vectors representing the relative weights of each framework element.
Global weights were calculated hierarchically using the unrounded priority vectors obtained from the aggregated pairwise-comparison matrices. For variable k nested within indicator j and component i, the global weight was calculated as:
where is the component weight, is the local weight of the indicator within its component, and is the local weight of the variable within its indicator. All multiplications and ranking procedures used the unrounded weights; rounded values are presented only for readability.
To examine the influence of expert composition, a leave-one-expert-out sensitivity analysis was performed. Each expert was removed in turn from every hierarchy level at which that expert’s judgement had been retained, after which the aggregated matrices, local weights, global weights and rankings were recalculated. Ranking stability was evaluated from the minimum and maximum global weights and rank positions obtained across the leave-one-expert-out scenarios.
3. Results
3.1. Spatial Patterns of Bankline Change, 2001–2025
3.1.1. River-Corridor Patterns
The LRR analysis identified a heterogeneous distribution of landward and riverward bankline movement along the Bassac River between 2001 and 2025 (Figure 3A). Sections classified as relatively stable occurred along substantial portions of both banks, although these were interrupted by discontinuous zones of erosion and accretion. Positive LRR values, indicating riverward bankline movement or accretion, were spatially widespread and occurred in discontinuous clusters, including several sections associated with channel bends. Negative LRR values, indicating landward bank retreat, were less continuously distributed and were concentrated in localised erosion-prone reaches. The observed pattern therefore indicates that bank instability was not uniform along the Bassac River. Instead, relatively stable and accreting sections occurred alongside spatially confined erosion hotspots, which exhibited substantially higher rates of landward bankline movement. The differences between the left and right banks, including the total length and magnitude of erosion and accretion classes, are quantified in Section 3.1.3.
Figure 3.
Bankline change along the Bassac River between 2001 and 2025 based on LRR analysis. (A) Spatial distribution of erosion, relative stability, and accretion along the full river corridor. Negative LRR values indicate landward bank retreat, while positive values indicate riverward bank advance. (B) Detailed LRR distribution within the Can Tho reach. The red circle indicates the most spatially extensive erosion-prone section, while the blue and black circles indicate the highest-intensity right- and left-bank hotspots, respectively.
3.1.2. Bankline Change Within the Can Tho Reach
The Can Tho reach, located approximately 80–95 km downstream from the defined longitudinal origin, exhibited predominantly low-magnitude but spatially variable rates of bankline change (Figure 3B). Across much of the reach, LRR values were concentrated near 0 m/year, indicating relative stability according to the classification thresholds applied in this study. Nevertheless, several distinct erosion and accretion zones were identified along both banks.
The most spatially extensive erosion-prone section within the Can Tho reach occurred in Binh Thuy District, near and downstream of Con Son Island (Figure 3B, red circle). Although erosion rates within this section were generally lower than the maximum rates observed farther downstream, negative LRR values extended across a longer continuous section of the bank.
A more intense but spatially confined erosion hotspot was identified on the right bank at approximately 93 km along the longitudinal profile, downstream of the principal urban area of Can Tho (Figure 3B, blue circle). Maximum LRR values in this section reached approximately −12 m/year. An erosion hotspot was also identified on the opposite, left bank near Cai Von (Figure 3B, black circle). This section exhibited the highest negative LRR value recorded in the detailed Can Tho analysis, at approximately −20 m/year, and extended over a longer bank section than the corresponding right-bank hotspot. These results distinguish two relevant forms of bank instability within the Can Tho reach: a spatially extensive erosion-prone section near Binh Thuy and more intense but relatively localised hotspots farther downstream near Cai Rang and Cai Von.
3.1.3. Distribution of Erosion and Accretion Classes
The total length of riverbank classified as accreting exceeded the length classified as eroding on both sides of the Bassac River, although a clear asymmetry was evident between the banks (Figure 4A). Accretion was more spatially extensive along the right bank, where approximately 63 km exhibited positive LRR values, compared with approximately 50 km along the left bank. In contrast, erosion was almost twice as extensive along the left bank, affecting approximately 49 km, compared with 27 km along the right bank. These values exclude sections classified as relatively stable.
Figure 4.
Extent and magnitude of bankline change along the Bassac River between 2001 and 2025. (A) Total length of riverbank sections classified as erosion or accretion along the left and right banks. (B) Distribution of analysed riverbank length among predefined LRR classes for the right and left banks. Bar magnitude represents the total mapped riverbank length within each class. Bars associated with negative LRR classes are plotted below zero solely to denote landward bank retreat; riverbank length itself is non-negative. Positive LRR classes indicate riverward bankline advance. Because the bars represent spatial totals rather than sample means, sampling-based confidence intervals are not applicable to their heights.
Across both banks, approximately 113 km were classified as accreting and 76 km as eroding, giving a difference of about 37 km in classified bank length. This represents a balance of affected bank length and should not be interpreted as net planform-area change or sediment balance.
The distribution across LRR classes further illustrates this asymmetry (Figure 4B). The largest accretion class, defined by LRR values greater than 3.0 and up to 23.6 m/year, accounted for approximately 27 km of the right bank and 28 km of the left bank. On the right bank, lower-magnitude accretion was also spatially extensive, including approximately 18 km in the 0.5–1.0 m/year class and 12 km in the 1.0–2.0 m/year class.
Eroding sections were distributed across several magnitude classes. On both banks, the greatest length occurred within the moderate erosion class of −1.0 to −0.5 m/year, accounting for approximately 20 km along the left bank and 11 km along the right bank. More severe erosion was also markedly more extensive on the left bank. Approximately 17 km of the left bank fell within the high-magnitude erosion class of −21.1 to −3.0 m/year, compared with approximately 2 km of the right bank. The results therefore indicate that, although accretion was more extensive overall, the left bank experienced both a greater total length of erosion and a substantially greater extent of high-magnitude bank retreat.
3.1.4. Longitudinal Variation in Erosion and Accretion Rates
The longitudinal LRR profiles show recurring alternations between landward and riverward bankline movement along both sides of the Bassac River (Figure 5). However, the magnitude, spatial continuity, and location of these changes differ between the left and right banks.
Figure 5.
Longitudinal variation in bankline change along the (A) left and (B) right banks of the Bassac River between 2001 and 2025, based on LRR estimates. Negative LRR values indicate landward bank retreat interpreted as erosion, whereas positive values indicate riverward bank advance interpreted as accretion. The shaded area denotes the Can Tho study reach. The profiles show transect-level LRR estimates derived from six bankline positions. Transect-specific confidence intervals were unavailable; individual extreme values should therefore be interpreted cautiously.
Along the left bank (Figure 5A), the upstream section, approximately 0–50 km from the defined longitudinal origin, exhibits pronounced variations in LRR. Localised erosion peaks reach approximately −15 m/year, while the highest accretion peak occurs near 50 km and approaches +24 m/year. Across much of the central section (approximately 50–150 km), LRR values are more tightly clustered around 0 m/year. This generally lower background variability is interrupted near 90 km by the strongest left-bank erosion hotspot, where LRR values reach approximately −20 m/year. Downstream, from approximately 150 to 210 km, variability increases again, characterised by alternating areas of erosion and accretion.
The right-bank profile also exhibits substantial longitudinal variability (Figure 5B), although high-magnitude erosion is less spatially extensive than on the left bank. The upstream section contains several accretion peaks exceeding +15 m/year, while negative LRR values are lower in magnitude and more spatially confined. Across the central section, background LRR values are predominantly clustered near 0 m/year, including much of the Can Tho reach at approximately 80–95 km. This pattern is interrupted near 93 km by a localised erosion hotspot with an erosion rate of approximately −12 m/year. The downstream section, approximately 140–210 km, exhibits the widest fluctuations in right-bank LRR values, including accretion peaks exceeding +20 m/year and localised erosion approaching −10 m/year. Overall, both profiles indicate that the central Bassac River is comparatively stable in terms of background bankline-change rates but contains distinct localised erosion hotspots. Variability increases toward the upstream and downstream sections, while the left bank exhibits greater erosion extent and magnitude than the right bank.
In addition, the 90% confidence intervals () illustrated in Figure 5 provide a measure of temporal reliability for the estimated rates. Across the stable central sections where LRR values cluster near , values are narrow and generally remain below , confirming high consistency. Conversely, at localized hotspots—such as the severe left-bank erosion peak near () and the right-bank hotspot near ()—the bands widen significantly (exceeding ), reflecting greater inter-annual shoreline volatility and calculation uncertainty at these dynamic sites.
3.2. Exploratory Spatial Variation in Observed Flow Velocity Within the Can Tho Reach
Mean flow velocity varied among the five selected ADCP measurement locations, ranging from 0.25 to 1.10 m/s (Figure 6B). The highest mean velocity was recorded at location 2–3 (1.10 m/s), while the lowest was recorded at location 4–4 (0.25 m/s). Intermediate values were observed at locations 1–3 (0.45 m/s), 3–3 (0.50 m/s) and 5–2 (0.60 m/s).
Figure 6.
Location and measured flow velocity at the five selected ADCP measurement locations within the Can Tho reach. (A) Spatial distribution of the ADCP locations in relation to the Bassac River, Con Son and Con Au islands, and the mapped erosion-prone riverbank sections. (B) Mean flow velocity recorded at each survey location during the field survey conducted on 26 May 2026.
Differences were also evident between measurement locations situated near and farther downstream of the two mid-channel islands. Near Con Son Island, locations 1–3, situated close to the downstream end of the island, recorded a mean velocity of 0.45 m/s. Farther downstream, locations 2–3 recorded the highest mean velocity of the survey at 1.10 m/s. A comparable spatial contrast was observed near Con Au Island. Location 4–4 recorded a mean velocity of 0.25 m/s, whereas the farther downstream location 5–2 recorded 0.60 m/s.
The five ADCP observations showed no consistent correspondence between contemporary mean flow velocity and historical erosion magnitude. Location 2–3 recorded the highest mean velocity during the 26 May 2026 survey (1.10 m/s), whereas the largest negative LRR values for the 2001–2025 period occurred farther downstream near location 5–2, where the measured mean velocity was lower (0.60 m/s). Because the observations post-date the bankline-analysis period and represent only a single survey, they cannot be used to explain or attribute the historical erosion patterns. They are therefore reported solely as supplementary information on the spatial variation in flow velocity observed on the survey date.
3.3. Expert-Based AHP Weighting
3.3.1. Component Weights
The aggregated AHP assessment assigned a moderately higher weight to sensitivity than to adaptive capacity. Sensitivity received a normalised weight of 0.547, compared with 0.453 for adaptive capacity (Figure 7). These values represent the relative importance assigned by the participating experts within the proposed vulnerability framework and should not be interpreted as measured levels of household vulnerability.
Figure 7.
Normalised expert-derived weights assigned to the two principal components of the livelihood-vulnerability framework. Sensitivity received a weight of 0.547 and adaptive capacity a weight of 0.453; the component weights sum to 1.000.
3.3.2. Indicator Weights
Within the sensitivity component, food and agricultural sensitivity (S2) received the highest local weight (0.347), followed by past erosion experience (S4; 0.314). Health sensitivity (S3; 0.172) and demographic sensitivity (S1; 0.167) received lower and broadly comparable weights. Together, S2 and S4 accounted for approximately 66.1% of the total local weight within the sensitivity component (Figure 8). The complete local and global weights of the expert-based AHP hierarchy are presented in Appendix A, Table A1, with global weights calculated using the unrounded component, indicator, and variable weights.
Figure 8.
Normalised local weights assigned to the livelihood-vulnerability indicators within the (A) sensitivity and (B) adaptive-capacity components. Sensitivity indicators comprise demographic sensitivity (S1), food and agricultural sensitivity (S2), health sensitivity (S3), and past erosion experience (S4). Adaptive-capacity indicators comprise economic capacity (AC1), livelihood flexibility (AC2), knowledge and preparedness (AC3), and social networks and communication (AC4).
Within the adaptive-capacity component, economic capacity (AC1) received the highest local weight (0.435), followed by livelihood flexibility (AC2; 0.299). Knowledge and preparedness (AC3; 0.139) and social networks and communication (AC4; 0.127) received lower weights. These are local weights within the adaptive-capacity component and sum to 1.000 before rounding. The results indicate that the participating experts placed greater emphasis on financial resources and the ability to diversify or change livelihoods than on knowledge, preparedness, and social-support factors. These values represent local weights within their respective components rather than global weights across the complete vulnerability framework.
3.3.3. Variable Weights Within the Highest-Ranked Indicators
Within food and agricultural sensitivity (S2), decreased food production (S2.2) received the highest local weight (0.407), followed by dependence on a single crop (S2.3; 0.310) and food insufficiency (S2.1; 0.283). Within past erosion experience (S4), the extent of land loss (S4.1) received the highest local weight (0.413), followed by disruption to livelihoods and daily activities (S4.3; 0.333) and the level of physical or economic damage (S4.2; 0.254). These values are local weights within their respective indicators and should not be interpreted as global weights.
3.3.4. Adaptive Capacity Variable Weights
Within the economic-capacity indicator (AC1), savings capacity (AC1.1) received the highest local weight at 0.402 (Table 3). Dependence on river-based livelihoods (AC1.3) received the second-highest weight at 0.254, followed by access to financial services (AC1.4) at 0.189 and debt manageability (AC1.2) at 0.154.
Table 3.
Expert-derived local and global weights of variables within the four highest-weighted indicators. Global weights were calculated using the unrounded component, indicator and local-variable weights.
Within the livelihood-flexibility indicator (AC2), the ability to shift to an alternative livelihood (AC2.2) received a slightly higher local weight of 0.516 than income diversity (AC2.1), which received a weight of 0.484. These weights are normalised within their respective indicators and therefore should not be interpreted as global measures of household adaptive capacity.
3.3.5. Global Variable Weights
Global weights were calculated from the unrounded component, indicator and local-variable weights. Savings capacity (AC1.1) had the highest baseline global weight (0.079), followed closely by decreased food production (S2.2; 0.077), extent of land loss (S4.1; 0.071), ability to shift livelihoods (AC2.2; 0.070), income diversity (AC2.1; 0.065), and dependence on a single crop (S2.3; 0.059).
The small differences among the leading global weights do not support a strong interpretation of their exact ordering. These variables are therefore interpreted as a high-priority group identified by the participating experts rather than as a fixed sequence of independently distinct priorities. The robustness of this interpretation was examined using a leave-one-expert-out sensitivity analysis, as described below.
3.3.6. Sensitivity of the AHP Rankings
The leave-one-expert-out analysis showed that the global weights and ranks of the leading variables varied across expert-omission scenarios (Table 4). Savings capacity (AC1.1) ranged from 0.062 to 0.088 and from rank 1 to rank 6, while decreased food production (S2.2) ranged from 0.069 to 0.088 and from rank 1 to rank 4. The extent of land loss (S4.1) and ability to shift livelihoods (AC2.2) both varied between ranks 1 and 6. Income diversity (AC2.1) showed a wider rank range of 2–10, whereas single-crop dependence (S2.3) was comparatively more stable, remaining between ranks 5 and 8.
Table 4.
Leave-one-expert-out sensitivity of the global AHP weights and rankings. Weight ranges represent the minimum and maximum values obtained when each expert was sequentially omitted.
The overlapping weight intervals indicate that no individual variable remained uniquely dominant across all scenarios. Nevertheless, variables related to economic resources, agricultural production, previous land loss and livelihood flexibility consistently appeared among the higher-ranked priorities. The sensitivity analysis therefore supports interpreting the leading variables as a high-priority group rather than as a rigid or invariant ordering. The baseline weights shown in Figure 9 remain useful for summarising the aggregated expert judgements, but small differences between closely ranked variables should not be overinterpreted.
Figure 9.
Baseline global AHP weights of the six highest-ranked livelihood-vulnerability variables. Global weights were calculated using unrounded component, indicator, and local-variable weights and are presented to three decimal places. The close spacing among these weights indicates a high-priority group rather than a rigid or invariant ranking.
3.4. Integrated Hotspot Typology
When considered together, the physical analyses distinguish two broad forms of bank instability within the Can Tho reach. The Binh Thuy reach is characterised by spatially extensive erosion, particularly near and downstream of Con Son Island. In contrast, the Cai Rang–Cai Von reach contains more intense but spatially confined erosion hotspots on opposing banks.
The AHP analysis identified financial resources, livelihood flexibility, agricultural production, and previous erosion impacts as the highest-ranked livelihood-related considerations. These expert-derived weights were not spatially assigned to individual households or statistically related to the mapped erosion rates. The two evidence streams should therefore be interpreted as complementary: the physical analysis identifies the location, magnitude and extent of erosion hotspots, while the AHP identifies factors that may be prioritised in subsequent household assessment and adaptation planning.
3.5. Linking Physical Erosion Hotspots with Livelihood-Vulnerability Priorities
When interpreted together, the physical and AHP results provide a spatially differentiated decision-support framework for subsequent erosion-risk assessment. The remote-sensing analysis identifies where riverbank instability is most extensive or intense, while the AHP identifies the livelihood dimensions that experts consider important for subsequent assessment. The ADCP observations provide only a supplementary snapshot of contemporary flow conditions and are not used to identify or explain the historical erosion hotspots. The two sets of results should therefore be interpreted as complementary rather than as a direct statistical relationship: the physical analysis defines the characteristics and locations of erosion hotspots, while the AHP provides a framework for prioritising factors for subsequent household assessment.
Within the Can Tho reach, two contrasting hotspot types are evident. The Binh Thuy reach is characterised by spatially extensive erosion, suggesting a need for longer-term monitoring and adaptation planning. In this area, expert-prioritised variables such as income diversity, savings capacity, and resilience to declining food production may inform the design of livelihood-support programmes. In contrast, the more intense but spatially confined hotspots near Cai Rang and Cai Von warrant more immediate process investigation and exposure assessment before mitigation measures are selected. These interpretations represent planning priorities and should subsequently be validated through household-level surveys.
4. Discussion
4.1. Localised Bank Adjustment Within a Sediment-Deficit Delta
The principal physical finding of this study is that bankline change along the Bassac River is spatially heterogeneous rather than uniform or system-wide. Relatively stable and accreting sections remain extensive along both banks, whereas erosion is concentrated in discontinuous hotspots that differ in magnitude, affected length, and spatial configuration. This pattern is consistent with previous research identifying marked spatial variations in bankline change and erosion susceptibility along the Mekong and Bassac river corridors [3,5,6,9,15]. It also shows why corridor-wide averages can obscure locally severe instability: a river reach may appear comparatively stable overall while containing individual sections experiencing rapid and sustained bank retreat.
The greater total length of accreting than eroding bankline should not, however, be interpreted as evidence that the Bassac River retains an adequate or positive sediment budget. Positive LRR values represent local riverward bankline movement and may result from lateral sediment redistribution, bar attachment, island development, channel migration, or differences in river stage between image dates. Local accretion can therefore coexist with system-wide sediment starvation and riverbed incision. Previous studies have linked the destabilisation of the Mekong Delta to reductions in sediment delivery, channel engineering, hydropower development and riverbed extraction [4,7,8]. Binh et al. estimated that upstream dam development had reduced the sediment budget reaching the VMD by approximately 74%, while field and modelling research has identified continuing channel incision and the development of scour holes in both the Tien and Hau rivers [16].
Sand extraction intensifies this broader sediment imbalance. Historical bathymetric comparisons documented widespread deepening and substantial losses of bed material from both the Mekong and Bassac channels [31]. Hackney et al. [12] subsequently showed that sand extraction rates in the Lower Mekong greatly exceeded natural replenishment and that the resulting lowering of the riverbed could destabilise adjacent banks. More recent estimates indicate that sand extraction across the Vietnamese Mekong Delta increased considerably between 2015 and 2020 [32], while bathymetric surveys recorded an average incision of approximately 1.4 m in the upper Hau River between 2017 and 2022 [13].
The bankline patterns identified should therefore be interpreted as the local expression of a river system undergoing both natural redistribution and strong anthropogenic modification. The presence of accreting sections does not compensate for rapid retreat where settlements, infrastructure or productive land are exposed. Conversely, the occurrence of individual high-magnitude erosion peaks does not justify continuous hard protection along otherwise stable river sections. The appropriate unit for management is consequently the individual hotspot and its surrounding geomorphic, infrastructural and livelihood context, rather than the riverbank as a uniform linear feature.
4.2. Bank Asymmetry and Interacting Controls on Erosion
A second important finding is the marked asymmetry between the left and right banks. Although accretion occurred extensively on both sides of the river, erosion affected a substantially greater length of the left bank than the right bank. High-magnitude erosion was also considerably more extensive on the left bank. The difference is therefore evident not only in isolated maximum LRR values but also in the spatial persistence of negative bankline change.
This result is broadly consistent with the corridor-scale findings of Duy et al. [5], although the processes producing the asymmetry cannot be determined from remotely sensed bankline movement alone. Bank erosion reflects the balance between hydraulic forces acting on the bank and the ability of bank materials and vegetation to resist those forces. Relevant controls include channel curvature, secondary circulation, near-bank velocity, toe scour, bank height and slope, material cohesion, permeability, pore-water pressure, riparian vegetation and root reinforcement [6,33,34,35]. River engineering, vegetation removal, landing stages, riverside construction, and other modifications can further alter both hydraulic loading and bank resistance.
The opposing hotspots near Cai Rang and Cai Von are particularly significant because they occur within the same river section. This spatial correspondence suggests that instability may be influenced by reach-scale hydraulic or morphological controls rather than conditions affecting only one bank. Potential explanations include channel constriction, local bathymetric irregularities, flow redistribution, deep scour, differences in bank material, and intensive river use. Field and numerical research elsewhere in the VMD has shown that scour holes frequently coincide with reaches experiencing severe riverbank erosion and may deepen further under continued reductions in sediment supply [16].
Differences in bank resistance may nevertheless explain why opposing banks exposed to the same general hydraulic setting exhibit different rates or lengths of retreat. Kim et al. [6] identified considerable spatial variation in bank material, geometry, vegetation and anthropogenic disturbance across the Vietnamese Mekong River system. Analytical and empirical studies also show that bank geometry and toe conditions can influence failure mechanisms [33,35]. Although natural riverbanks differ from engineered levees, the experimental results of Ali and Tanaka [36] further demonstrate that permeability, saturation, and foundation properties can influence the initiation and progression of erosion-related failure.
The observed left–right asymmetry should consequently be treated as a priority for further process investigation rather than as evidence of a single controlling mechanism. Cross-sectional bathymetry, bank-material sampling, bank-height measurements, and observations of vegetation and engineering structures are required to determine whether the pattern is driven primarily by differences in hydraulic loading, bank resistance, or their interaction.
4.3. Longitudinal Variation, Mid-Channel Islands and Local Hydraulic Conditions
The longitudinal LRR profiles indicate that the central Bassac River, including much of the Can Tho reach, is comparatively stable in terms of background bankline-change rates. However, this lower overall variability is interrupted by distinct high-intensity hotspots. Greater fluctuations in both erosion and accretion occur in the upstream and downstream sections, showing that longitudinal position alone does not produce a simple gradient in bank stability.
The mapped bankline changes represent the combined outcome of multiple interacting controls and cannot be attributed to flow velocity alone. Relevant controls include bank height, slope, material cohesion and stratigraphy; channel curvature, cross-sectional geometry, bathymetry and thalweg position; riparian vegetation and root reinforcement; sediment load and grain-size characteristics; seasonal water levels, discharge, tides and near-bank shear stress; and anthropogenic activities such as sand extraction, navigation, vessel-generated waves, dredging, revetment construction and riverbank development.
Differences in bank materials may contribute to this pattern. Kim et al. [6] identified spatial variations in soil and bank characteristics along the Vietnamese Mekong River system, with more cohesive materials generally providing greater resistance to erosion than loose or weakly consolidated deposits. The findings of the present study are consistent with this interpretation, but no direct geotechnical data were collected. The apparent correspondence between downstream variability and less consolidated sediments should therefore remain a working hypothesis rather than a demonstrated explanation.
The wider delta is also affected by interacting processes, including land subsidence, reduced sediment delivery, riverbed incision, and hydrological modification [4,7,8,14]. These processes can alter relative elevations and channel morphology over time, but the current analysis cannot attribute individual bankline hotspots directly to subsidence or upstream development. In particular, the subsidence documented in the VMD [14] provides evidence of broader environmental instability but does not, by itself, directly explain lateral riverbank retreat at the mapped locations.
The ADCP survey documented substantial spatial variability in mean water-column velocity among the five measurement locations on 26 May 2026. However, the highest measured velocity at location 2–3 did not coincide with the strongest historical erosion near location 5–2, where the observed velocity was lower. This indicates that the observations do not show a simple spatial correspondence between contemporary mean velocity and the 2001–2025 bankline-change patterns. Because the measurements represent a single survey conducted after the bankline-analysis period, they are interpreted only as exploratory hydraulic context. Mean water-column velocity may also fail to capture near-bank turbulence, boundary shear stress, secondary currents or toe scour. Although islands and bars can modify flow direction, velocity gradients and channel morphology [34], repeated surveys under contrasting seasonal and tidal conditions, combined with bathymetric and geotechnical measurements, would be required to investigate these processes.
The occurrence of opposing high-intensity hotspots downstream of the principal urban area identifies urban river use as a hypothesis requiring further investigation. Vessel activity may generate repeated waves and rapid near-bank water-level fluctuations, while landing stages, embankments and riverside development may modify bank form and vegetation [6]. Research in navigable rivers shows that vessel-generated waves can contribute to long-term bank retreat, although their effects depend on bank material, terrace development, vegetation, and interaction with flood-driven failure [37]. Riverbed extraction or pre-existing incision may further increase relative bank height and weaken lateral stability [12,13,31,32]. These pressures were not measured directly and therefore remain testable explanations rather than confirmed causes.
4.4. Expert-Derived Livelihood-Vulnerability Priorities
The AHP assessment extends the physical analysis by identifying the livelihood factors that participating experts considered most relevant to erosion-related vulnerability. Sensitivity received a moderately higher component weight than adaptive capacity, with weights of 0.547 and 0.453, respectively. The difference is relatively small and should not be interpreted as evidence that sensitivity is universally more important. Instead, it indicates that the experts placed marginally greater emphasis on the potential consequences of erosion for livelihoods and productive activities than on the resources available for coping and adaptation. The sensitivity analysis indicates that the small differences among the leading global weights should not be interpreted as a fixed rank order. The more robust finding is the collective prioritisation of economic capacity, agricultural production, previous land loss and livelihood flexibility.
This interpretation is consistent with the IPCC risk framework, in which adverse consequences arise from interactions among hazard, exposure, and vulnerability [19]. Vulnerability includes sensitivity or susceptibility to harm and limitations in the capacity to cope and adapt. It may differ substantially between communities and among households within the same community and can change over time as resources, livelihoods, and previous hazard experiences evolve.
Food and agricultural sensitivity and past erosion experience received the highest weights within the sensitivity component. These rankings do not demonstrate that households beside the mapped hotspots are predominantly agricultural, food-insecure, or highly vulnerable, because the study did not collect household-level data. Instead, they identify issues to prioritise in subsequent community-level assessments. Relevant variables include dependence on agriculture or aquaculture, concentration in a single crop or income source, production losses, previous land loss, and disruption to daily activities. Household research among rice farmers elsewhere in Vietnam similarly found that livelihood vulnerability was shaped by hydrological, institutional, and socio-demographic conditions [38].
Previous research in Can Tho has similarly identified agricultural production and livelihood dependence as important dimensions of vulnerability [22]. More directly, Tri et al. surveyed erosion-affected households along the Mekong and Bassac rivers and found substantial variation in social vulnerability, demonstrating that physical exposure to erosion does not result in uniform household outcomes [2]. The need for direct community-level validation is further supported by research along the Bassac River showing that residents expressed concern about riverbank erosion but often had limited awareness of the relationship between sand extraction and bank instability. Awareness was greater among residents who had directly experienced bank collapse, indicating that knowledge and risk perceptions may vary according to previous exposure [39].
The high weight assigned to previous erosion experience also deserves careful interpretation. Previous exposure may improve awareness, preparedness, and knowledge of local hazards. At the same time, repeated erosion may progressively reduce savings, productive land, housing security, and livelihood options. Experience can therefore increase preparedness while simultaneously depleting the material resources needed for recovery. Riverbank erosion is particularly important in this respect because the loss of residential or productive land may be effectively permanent, unlike some forms of temporary inundation. Research among riparian households elsewhere has similarly linked riverbank erosion with losses of land and resources, food insecurity, health pressures and livelihood disruption [40,41,42].
Within adaptive capacity, economic capacity and livelihood flexibility received the highest indicator weights. Savings may enable households to absorb income losses, repair property, protect assets, or relocate, while access to manageable credit or other financial services may expand the range of feasible responses. However, the expert rankings do not demonstrate that households in Binh Thuy, Cai Rang or Cai Von currently possess or lack these resources. Measuring savings, debt, access to finance, and the affordability of adaptation measures requires direct household data.
Livelihood flexibility was also strongly prioritised, particularly the ability to move between livelihood activities and maintain multiple income sources. This may be important where households depend on farming, aquaculture, river transport, small-scale trade, or other activities tied to a specific riverbank location. Previous research has likewise identified livelihood diversification and occupational flexibility as important components of adaptive capacity among erosion-affected and riverine communities [40,41,42]. A systematic review of riverbank-erosion vulnerability indicators found that economic resources, agricultural capacity, social networks, education, institutional support, and migration capacity recur across existing assessments, although their relevance varies substantially by location and social context [43].
Social networks and communication received the lowest weight among the adaptive-capacity indicators. This should not be interpreted as showing that informal support, communication, or collective action are unimportant. AHP weights are relative and depend on the selected hierarchy and the perspectives represented within the expert sample. Social relationships and institutional coordination may become especially important during evacuation, relocation, and longer-term recovery. Existing research on social vulnerability and adaptive water management in the VMD emphasises the role of social, institutional, and governance relationships alongside household resources [2,44]. These factors should therefore remain within future household assessments despite their lower relative expert-derived weight. This caution is supported by a recent Mekong-wide review, which found that participatory and coordinated resilience measures were reported more frequently than exclusively top-down or bottom-up approaches [45].
4.5. Validity, Representativeness and Potential Bias in the Expert Assessment
The validity of the AHP assessment must be distinguished from the internal consistency of the pairwise comparisons. Applying a Consistency Ratio threshold of 0.10 and aggregating accepted judgements using the geometric mean supported procedural consistency and reduced the influence of any single comparison. However, a satisfactory Consistency Ratio indicates that an expert’s comparisons are logically coherent; it does not demonstrate that the selected hierarchy is complete, that the resulting weights are empirically correct, or that the expert panel is representative of affected populations.
The panel comprised ten experts and was predominantly oriented toward technical and water-related disciplines, including hydraulic engineering, hydrodynamics, sediment transport, water resources, environmental engineering, and remote sensing. Agricultural-economics and broader climate-risk perspectives were represented more narrowly, while erosion-affected households and community representatives did not participate in the weighting exercise. This composition may have influenced the relative emphasis placed on economic capacity, agricultural production, and other technically or quantitatively defined variables. Conversely, locally specific concerns such as informal support, tenure security, relocation preferences, institutional trust, and differentiated household constraints may be underrepresented. The predefined hierarchy also introduced framing effects because experts could assign weights only to the indicators and variables included in the assessment.
The resulting weights should therefore be interpreted as expert-derived priorities for subsequent investigation rather than as population parameters or validated measurements of household vulnerability. Their principal value is to guide household surveys, participatory assessment, and adaptation planning. Validation requires direct engagement with erosion-affected households and a broader range of local stakeholders. The leave-one-expert-out analysis showed that the precise ordering of closely weighted variables was sensitive to expert composition. However, this numerical assessment cannot eliminate limitations arising from panel composition or the initial selection of indicators.
4.6. Integrating Hazard, Exposure and Livelihood Vulnerability for River-Corridor Management
The physical and AHP components provide complementary but analytically distinct evidence. The remote-sensing analysis identifies the location, magnitude, and spatial extent of bank instability. The ADCP observations provide limited information on contemporary hydraulic conditions at selected sites. The AHP identifies livelihood sensitivity and adaptive-capacity factors that experts consider relevant. It does not demonstrate that those characteristics are present among households located adjacent to the mapped hotspots. Although examined in a flood context, Tu et al. (2024) similarly found that physical exposure and household vulnerability followed distinct spatial patterns, reinforcing the need to assess them separately before integration [46].
The combined findings nevertheless support a spatially differentiated framework for risk assessment and management. Two broad hotspot types are evident within the Can Tho reach. The first is the spatially extensive erosion-prone section in Binh Thuy, particularly near and downstream of Con Son Island. Because negative LRR values extend across a comparatively long bank section, this area requires corridor-scale monitoring rather than focusing on a single isolated failure point. Repeated bankline mapping should be combined with field inspections and an inventory of nearby housing, infrastructure, agricultural land, public facilities, and river-dependent activities.
Household-level assessment in Binh Thuy should examine the expert-prioritised dimensions, including savings and financial capacity, livelihood diversity, dependence on erosion-sensitive production, and the cumulative consequences of previous land or asset loss. These variables should guide data collection rather than predetermine the intervention. Financial support, agricultural diversification, livelihood assistance or relocation should be considered only where direct evidence confirms that the relevant constraints exist.
The second hotspot type comprises high-intensity but spatially confined erosion zones near Cai Rang and Cai Von. These locations warrant detailed hydraulic, bathymetric, and geotechnical investigations to determine whether rapid retreat is associated with local scour, channel geometry, unstable bank materials, vessel-generated waves, riverside modifications, or nearby sediment extraction. Where settlements or critical infrastructure are directly exposed, targeted stabilisation may be justified. However, the selection of structural, nature-based, or hybrid measures should follow a process of diagnosis and consideration of possible downstream effects, rather than relying solely on mapped LRR values [47].
Where nature-based or hybrid measures are considered, their design should also address ecological integrity, social inclusion, long-term maintenance requirements, potential trade-offs, and monitoring, rather than treating vegetation-based protection as a universally applicable engineering substitute [48]. Recent pilot studies in the VMD have explored locally available and hybrid materials, including water-hyacinth geotextiles and waste-tyre-based stabilisation systems [49,50]. However, their transfer to the high-energy Bassac River hotspots identified here would require site-specific hydraulic, geotechnical, ecological, and life-cycle assessments.
The distinction should not be simplified into physical protection for Cai Rang–Cai Von and livelihood intervention for Binh Thuy. Both forms of response may be needed in each area. Their relative emphasis should depend on:
- the rate, affected length and likely persistence of bank retreat;
- the types and density of exposed assets;
- bank materials, morphology, and hydraulic conditions;
- household sensitivity and adaptive capacity;
- the feasibility and distributional effects of protection or relocation;
- the potential for interventions to transfer erosion or risk elsewhere.
This reflects the wider risk-management principle that hazard, exposure, and vulnerability should be considered together [19]. It is also consistent with remote-sensing and exposure-based studies showing that erosion-hotspot mapping is more useful when combined with information on affected people and assets [15]. Interventions should therefore be sequenced rather than selected solely from the physical map. More broadly, this approach is consistent with the concept of providing “freedom space” for rivers, in which zones of channel mobility, flooding, and ecological function are incorporated into land-use regulation rather than relying predominantly on repeated bank stabilisation. Although developed in a different geographic context, the concept provides a useful basis for translating historical bankline movement into differentiated river-corridor planning [51].
A staged management framework can be derived from the study. First, long-term remote sensing identifies erosion-prone reaches and differentiates between spatially extensive and high-intensity hotspots. Second, targeted hydraulic, geomorphological, and geotechnical surveys investigate the processes that control instability. Third, exposed assets and households are mapped, and livelihood vulnerability is assessed directly. Fourth, physical mitigation, corridor planning, and livelihood-support measures are selected according to the combined evidence.
At the policy level, the findings reinforce the need to connect riverbank monitoring with land-use regulation and development control. The corridor encroachment identified by Duy et al. [5] indicates that scientific information alone will not reduce risk unless it influences construction, infrastructure planning, and enforcement within safety corridors. Broader strategies for resilient water management in the VMD similarly emphasise coordination among physical planning, livelihood adaptation, and institutional arrangements [44]. Evidence from Central Vietnam likewise shows that effective local risk management depends on accountability, information sharing, institutional capacity, and meaningful stakeholder participation [52].
Where household evidence confirms limited economic capacity or strong dependence on erosion-sensitive livelihoods, potential measures may include appropriately designed financial assistance, improved access to services, agricultural diversification and vocational support [1]. The World Bank’s wider recommendations concerning integrated and circular agricultural systems may be relevant in some locations, but they should not be applied automatically to all erosion-affected households. The suitability of any intervention depends on household preferences, land availability, market access, age, skills, and the feasibility of continuing production safely.
4.7. Limitations and Priorities for Further Research
Several limitations affect the interpretation of the findings. First, the bankline analysis was based on six Landsat images with a spatial resolution of 30 m. Although the 24-year period provides a valuable long-term perspective, differences in georeferencing, river stage, tidal conditions, cloud cover, vegetation, and spectral classification may influence extracted bankline positions. The use of a fixed NDWI threshold may also perform differently along engineered, vegetated and seasonally inundated banks [3]. Positive LRR values should consequently be interpreted as riverward bankline movement rather than direct measurements of sediment deposition.
The analytical sensitivity calculation isolates the potential effect of displacement of the May 2010 bankline and does not constitute a complete positional-uncertainty budget. It does not account for uncertainty associated with the other image dates, georeferencing, river stage, spectral classification, the fixed NDWI threshold, vegetation or differences in bank morphology. The absence of a complete uncertainty budget and LRR confidence intervals consequently limits the precision with which individual extreme rates can be interpreted. Although the calculation indicates that displacement of the 2010 bankline alone is unlikely to account for the full magnitude of the estimated −12 and −20 m/year values, these extreme estimates should nevertheless be interpreted cautiously. Future analysis should incorporate sensor and georeferencing uncertainty, image-specific water-level conditions and uncertainty associated with bankline extraction. Higher-resolution satellite or UAV imagery would also allow individual hotspots to be validated and help distinguish persistent bank retreat from movement of the instantaneous waterline.
Second, the ADCP observations represent a single survey date and five selected measurement locations. They cannot capture seasonal, tidal or event-scale variation or reconstruct the hydraulic conditions operating throughout the full bankline-analysis period. Mean flow velocity also does not directly quantify near-bank shear stress, turbulence, toe scour or vessel-wave loading. The survey therefore provides only contextual observations and cannot establish the causes of long-term erosion.
Future fieldwork should include repeated surveys during contrasting hydrological and tidal conditions, complete cross-sectional velocity profiles, bathymetric measurements, and observations close to the bank toe. These should be combined with bank-material sampling, bank-height and slope measurements, vegetation surveys, vessel-traffic monitoring, and information on sand-extraction locations. Such data would allow the alternative explanations developed in this Discussion to be tested explicitly.
Third, the AHP weights reflect the judgements of ten experts and are sensitive to the structure of the hierarchy, the composition of the expert group, and the pairwise comparisons. Comparative research has shown that changes in weighting and decision methods can alter resulting risk rankings [53].
The expert-derived weights should not be treated as observations of household conditions. Although the experts represented several relevant disciplines, their judgements may not reflect the lived experiences, priorities, and constraints of erosion-affected communities. Household surveys, participatory mapping, and interviews with community representatives and local authorities are required to validate the selected indicators and identify additional factors not captured by the AHP hierarchy.
Finally, integration between the physical and livelihood components remains conceptual rather than spatial or statistical. No geocoded household-vulnerability data were overlaid with the erosion hotspots, and no systematic exposure inventory was used to estimate the numbers of people, structures, or livelihood assets potentially affected. The study should therefore be presented as an initial decision-support framework rather than as a completed riverbank-risk assessment.
Future research should combine higher-resolution bankline mapping, repeated hydrodynamic and bathymetric surveys, geotechnical information, exposed-asset mapping, and household-level vulnerability assessments. Locally tailored socioeconomic scenarios could also be incorporated to examine how vulnerability and adaptive capacity may change over time [54]. Together, these approaches would enable the proposed hotspot typology to be tested and identify where high physical instability coincides with dense exposure and limited adaptive capacity. Such evidence is needed before specific mitigation, livelihood-assistance or relocation measures can be prioritised. This research agenda is consistent with wider calls for more action-oriented and spatially explicit climate-risk research in rapidly urbanising areas of the VMD [55]. Future research should also examine how documented declines in suspended-sediment concentrations and changes in environmental flow influence local patterns of bankline instability [56,57].
5. Conclusions
This study demonstrates that bankline change along the Bassac River is spatially heterogeneous rather than uniform. Although sections classified as accreting were more extensive overall, erosion affected a greater length and reached higher magnitudes along the left bank. Within the Can Tho reach, two contrasting patterns were identified: spatially extensive erosion near and downstream of Con Son Island in Binh Thuy and more intense but localised hotspots near Cai Rang and Cai Von. These differences show that riverbank instability should be assessed according to both its rate and affected length rather than through corridor-wide averages alone.
The exploratory ADCP survey did not reveal a consistent relationship between contemporary mean flow velocity and historical erosion magnitude, indicating that velocity alone cannot explain the mapped patterns. The expert-based AHP identified economic capacity, livelihood flexibility, food and agricultural sensitivity, and previous erosion impacts as important dimensions for subsequent livelihood assessment. These weights represent expert-defined priorities rather than measured household conditions. The study’s principal contribution is therefore a staged decision-support framework that combines long-term physical hotspot characteristics with priorities for further exposure and livelihood assessment without treating the different evidence streams as causally or statistically equivalent.
The findings support differentiated river-corridor management. Spatially extensive erosion-prone sections require repeated monitoring, exposed-asset inventories, development control within riverbank safety corridors, and household-level vulnerability assessment. High-intensity local hotspots require detailed hydraulic, bathymetric and geotechnical investigation before structural, nature-based or hybrid protection measures are selected. Across both settings, riverbank monitoring should be connected more directly with land-use regulation and livelihood planning. Protection, livelihood assistance or relocation should not be prioritised solely from mapped erosion rates or expert weights but should follow site-specific assessment of erosion processes, exposed assets and household needs.
Author Contributions
Conceptualization, T.B.-F. and T.V.T.; methodology, T.V.T., T.B.-F. and D.V.D.; software, D.V.D. and L.T.P.; validation, M.M. and N.K.D.; formal analysis, T.B.-F.; investigation, T.V.T.; resources, T.V.T.; data curation, D.V.D. and L.T.P.; writing—original draft preparation, T.B.-F.; writing—review and editing, T.V.T. and N.K.D.; visualization, L.T.P.; supervision, M.M. and N.K.D.; project administration, D.V.D.; funding acquisition, T.V.T. All authors have read and agreed to the published version of the manuscript.
Funding
This research was funded by the Ministry of Education and Training of Vietnam, grant number B2026-TCT-06.
Data Availability Statement
The original contributions presented in this study are included in the article. Further inquiries can be directed to the corresponding author.
Acknowledgments
The authors thank the experts who participated in the AHP interviews.
Conflicts of Interest
The authors declare no conflicts of interest.
Abbreviations
The following abbreviations are used in this manuscript:
| ADCP | Acoustic Doppler Current Profiler |
| AHP | Analytic Hierarchy Process |
| IPCC | Intergovernmental Panel on Climate Change |
| LRR | Linear Regression Rate |
| NBS | Nature-based solutions |
| NDWI | Normalised Difference Water Index |
| VMD | Vietnamese Mekong Delta |
Appendix A
Table A1.
Complete local and global weights of the expert-based AHP hierarchy. Global weights were calculated using the unrounded component, indicator and variable weights.
References
- World Bank. Viet Nam 2045—Growing Greener: Pathways to a Resilient and Sustainable Future; Report No. 201460; World Bank: Washington, DC, USA, 2025. [Google Scholar]
- Tri, V.P.D.; Trung, P.K.; Trong, T.M.; Parsons, D.R.; Darby, S.E. Assessing social vulnerability to riverbank erosion across the Vietnamese Mekong Delta. Int. J. River Basin Manag. 2023, 21, 501–512. [Google Scholar] [CrossRef] [Scilit]
- Binh, D.V.; Wietlisbach, B.; Kantoush, S.; Loc, H.H.; Park, E.; Cesare, G.d.; Cuong, D.H.; Tung, N.X.; Sumi, T. A novel method for river bank detection from landsat satellite data: A case study in the Vietnamese Mekong Delta. Remote Sens. 2020, 12, 3298. [Google Scholar] [CrossRef] [Scilit]
- Anthony, E.J.; Brunier, G.; Besset, M.; Goichot, M.; Dussouillez, P.; Nguyen, V.L. Linking rapid erosion of the Mekong River delta to human activities. Sci. Rep. 2015, 5, 14745. [Google Scholar] [CrossRef] [Scilit] [PubMed]
- Duy, D.V.; Ty, T.V.; Phat, L.T.; Minh, H.V.T.; Thanh, N.T.; Downes, N.K. Assessing river corridor stability and erosion dynamics in the Mekong Delta: Implications for sustainable management. Earth 2025, 6, 34. [Google Scholar] [CrossRef] [Scilit]
- Kim, T.T.; Ngoc, P.; Nga, T.N.Q.; Nguyet, N.T.T.; Truong, H.N.; Diem, P.T.M.; Phung, N.K.; Bay, N.T. Modifying BEHI (Bank Erosion Hazard Index) to map and assess the levels of potential riverbank erosion of highly human impacted rivers: A case study for Vietnamese Mekong river system. Environ. Earth Sci. 2023, 82, 554. [Google Scholar] [CrossRef] [Scilit]
- Marchesiello, P.; Nguyen, N.M.; Gratiot, N.; Loisel, H.; Anthony, E.J.; San Dinh, C.; Nguyen, T.; Almar, R.; Kestenare, E. Erosion of the coastal Mekong delta: Assessing natural against man induced processes. Cont. Shelf Res. 2019, 181, 72–89. [Google Scholar] [CrossRef] [Scilit]
- Kondolf, G.M.; Rubin, Z.K.; Minear, J. Dams on the Mekong: Cumulative sediment starvation. Water Resour. Res. 2014, 50, 5158–5169. [Google Scholar] [CrossRef] [Scilit]
- Nguyen, L.D.H.; Khoi, D.N. Using landsat satellite images for assessing riverbank changes in the Mekong and Bassac rivers in the An Giang province. VNUHCM J. Eng. Technol. 2019, 2, SI53–SI62. [Google Scholar] [CrossRef] [Scilit]
- Duy, D.V.; An, N.T.; Ty, T.V.; Phat, L.T.; Toan, N.T.; Minh, H.V.T.; Downes, N.K.; Tanaka, H. Evaluating water level variability under different sluice gate operation strategies: A case study of the Long Xuyen quadrangle, Vietnam. Hydrology 2025, 12, 102. [Google Scholar] [CrossRef] [Scilit]
- Xuan, N.V.; Giang, N.N.L.; Ty, T.V.; Kumar, P.; Downes, N.K.; Nam, N.D.G.; Ngan, N.V.C.; Thinh, L.V.; Duy, D.V.; Avtar, R. Impacts of dike systems on hydrological regime in Vietnamese Mekong Delta. Water Supply 2022, 22, 7945–7959. [Google Scholar] [CrossRef] [Scilit]
- Hackney, C.R.; Darby, S.E.; Parsons, D.R.; Leyland, J.; Best, J.L.; Aalto, R.; Nicholas, A.P.; Houseago, R.C. River bank instability from unsustainable sand mining in the lower Mekong River. Nat. Sustain. 2020, 3, 217–225. [Google Scholar] [CrossRef] [Scilit]
- San Lau, R.Y.; Park, E.; Tran, D.D.; Wang, J. Recent intensification of riverbed mining in the Mekong Delta revealed by extensive bathymetric surveying. J. Hydrol. 2023, 626, 130174. [Google Scholar] [CrossRef] [Scilit]
- Dörr, N.; Huu, L.V.; Schenk, A.; Hinz, S. Drought-induced land subsidence in the Mekong Delta, Vietnam: Insights from SAR Interferometry. Geophys. Res. Lett. 2025, 52, e2025GL117096. [Google Scholar] [CrossRef] [Scilit]
- Tha, T.; Piman, T.; Bhatpuria, D.; Ruangrassamee, P. Assessment of riverbank erosion hotspots along the mekong river in cambodia using remote sensing and hazard exposure mapping. Water 2022, 14, 1981. [Google Scholar] [CrossRef] [Scilit]
- Van Binh, D.; Kantoush, S.; Sumi, T. Changes to long-term discharge and sediment loads in the Vietnamese Mekong Delta caused by upstream dams. Geomorphology 2020, 353, 107011. [Google Scholar] [CrossRef] [Scilit]
- Van Binh, D.; Kantoush, S.A.; Ata, R.; Tassi, P.; Nguyen, T.V.; Lepesqueur, J.; Abderrezzak, K.E.K.; Bourban, S.E.; Nguyen, Q.H.; Phuong, D.N.L. Hydrodynamics, sediment transport, and morphodynamics in the Vietnamese Mekong Delta: Field study and numerical modelling. Geomorphology 2022, 413, 108368. [Google Scholar] [CrossRef] [Scilit]
- Mutea, F.G.; Nelson, H.K.; Au, H.V.; Huynh, T.G.; Vu, U.N. Assessment of water quality for aquaculture in Hau River, Mekong Delta, Vietnam using multivariate statistical analysis. Water 2021, 13, 3307. [Google Scholar] [CrossRef] [Scilit]
- Intergovernmental Panel on Climate Change (IPCC). Climate Change 2022: Impacts, Adaptation and Vulnerability. Contribution of Working Group II to the Sixth Assessment Report of the Intergovernmental Panel on Climate Change; Pörtner, H.-O., Roberts, D.C., Tignor, M., Poloczanska, E.S., Mintenbeck, K., Alegría, A., Craig, M., Langsdorf, S., Löschke, S., Möller, V., et al., Eds.; Cambridge University Press: Cambridge, UK; New York, NY, USA, 2022; 3056p. [Google Scholar]
- Vu, T.H.; Binh, D.V.; Tran, H.N.; Khan, M.A.; Bui, D.D.; Stamm, J. Quantifying spatio-temporal river morphological change and its consequences in the Vietnamese Mekong River Delta using remote sensing and geographical information system techniques. Remote Sens. 2024, 16, 707. [Google Scholar] [CrossRef] [Scilit]
- Gbetibouo, G.A.; Ringler, C. Mapping South African Farming Sector Vulnerability to Climate Change and Variability: A Subnational Assessment; International Food Policy Research Institute (IFPRI): Washington, DC, USA, 2009. [Google Scholar]
- Huynh, H.L.T.; Do, A.T.; Dao, T.M. Climate change vulnerability assessment for Can Tho city by a set of indicators. Int. J. Clim. Change Strateg. Manag. 2020, 12, 147–158. [Google Scholar] [CrossRef] [Scilit]
- United Nations Framework Convention on Climate Change (UNFCCC). Climate Change: Impacts, Vulnerabilities and Adaptation in Developing Countries; UNFCCC Secretariat: Bonn, Germany, 2007. [Google Scholar]
- McFeeters, S.K. The use of the Normalized Difference Water Index (NDWI) in the delineation of open water features. Int. J. Remote Sens. 1996, 17, 1425–1432. [Google Scholar] [CrossRef] [Scilit]
- Duyen, P.L.M.; Tan, T.T.; Takagi, H.; Le Hang, T.T. Vulnerability assessment in the coastal plain of the Vietnamese Mekong Delta. CTU J. Innov. Sustain. Dev. 2015, 1, 27–32. [Google Scholar] [CrossRef] [Scilit]
- Vo, T.A.N.; Hua, T.X.; Nguyen, N.D.; Pham, L.A. Livelihood Vulnerability Index to Climate Change in the Mekong River Delta in Vietnam: A Case Study in Three Provinces. Int. J. Relig. 2024, 5, 5620–5637. [Google Scholar] [CrossRef] [Scilit]
- Krassakis, P.; Karavias, A.; Nomikou, P.; Karantzalos, K.; Koukouzas, N.; Athinelis, I.; Kazana, S.; Parcharidis, I. Multi-Hazard Susceptibility Assessment Using the Analytical Hierarchy Process in Coastal Regions of South Aegean Volcanic Arc Islands. GeoHazards 2023, 4, 77–106. [Google Scholar] [CrossRef] [Scilit]
- Le Bui, V.; Vu, B.T.; Pham, K.D.; Nong, D.H.; Van Pham, D.; Le, N.M.T.; Pham, L.T.; Brychkova, G.; McKeown, P.C.; Murray, C. Analytical hierarchy process-based mapping of social vulnerability to climate change in mountainous communes across Northwestern Vietnam. GeoJournal 2026, 91, 28. [Google Scholar] [CrossRef] [Scilit]
- Van, C.T.; Thuy, H.T.T.; Viet, C.T.; Anh, L.N.; Van Anh, V.T.; Tran, D.D. Unveiling flood vulnerability in the Vietnamese Mekong Delta: A case study of an Giang province. Int. J. Disaster Risk Reduct. 2024, 106, 104429. [Google Scholar] [CrossRef] [Scilit]
- Saaty, R.W. The analytic hierarchy process—What it is and how it is used. Math. Model. 1987, 9, 161–176. [Google Scholar] [CrossRef] [Scilit]
- Brunier, G.; Anthony, E.J.; Goichot, M.; Provansal, M.; Dussouillez, P. Recent morphological changes in the Mekong and Bassac river channels, Mekong delta: The marked impact of river-bed mining and implications for delta destabilisation. Geomorphology 2014, 224, 177–191. [Google Scholar] [CrossRef] [Scilit]
- Gruel, C.-R.; Park, E.; Switzer, A.D.; Kumar, S.; Ho, H.L.; Kantoush, S.; Van Binh, D.; Feng, L. New systematically measured sand mining budget for the Mekong Delta reveals rising trends and significant volume underestimations. Int. J. Appl. Earth Obs. Geoinf. 2022, 108, 102736. [Google Scholar] [CrossRef] [Scilit]
- Duan, J.G. Analytical approach to calculate rate of bank erosion. J. Hydraul. Eng. 2005, 131, 980–990. [Google Scholar] [CrossRef] [Scilit]
- Heidari, N.; Yagci, O.; Aksel, M. Midchannel islands in lowland river corridors and their impacts on flow structure and morphology: A numerical based conceptual analysis. Ecol. Eng. 2021, 173, 106419. [Google Scholar] [CrossRef] [Scilit]
- Saadon, A.; Abdullah, J.; Muhammad, N.; Ariffin, J.; Julien, P. Predictive models for the estimation of riverbank erosion rates. Catena 2021, 196, 104917. [Google Scholar] [CrossRef] [Scilit]
- Ali, L.; Tanaka, N. Experimental Investigation of Levee Erosion During Overflow and Infiltration with Varied Hydraulic Conductivities of Levee and Foundation Properties in Saturated Conditions. GeoHazards 2023, 4, 286–301. [Google Scholar] [CrossRef] [Scilit]
- Duró, G.; Crosato, A.; Kleinhans, M.; Roelvink, D.; Uijttewaal, W. Bank erosion processes in regulated navigable rivers. J. Geophys. Res. Earth Surf. 2020, 125, e2019JF005441. [Google Scholar] [CrossRef] [Scilit]
- Tran, P.T.; Vu, B.T.; Ngo, S.T.; Tran, V.D.; Ho, T.D. Climate change and livelihood vulnerability of the rice farmers in the North Central Region of Vietnam: A case study in Nghe An province, Vietnam. Environ. Chall. 2022, 7, 100460. [Google Scholar] [CrossRef] [Scilit]
- Tran, D.D.; Thien, N.D.; Yuen, K.W.; Lau, R.Y.S.; Wang, J.; Park, E. Uncovering the lack of awareness of sand mining impacts on riverbank erosion among Mekong Delta residents: Insights from a comprehensive survey. Sci. Rep. 2023, 13, 15937. [Google Scholar] [CrossRef] [Scilit] [PubMed]
- Alam, G.M.; Alam, K.; Mushtaq, S.; Clarke, M.L. Vulnerability to climatic change in riparian char and river-bank households in Bangladesh: Implication for policy, livelihoods and social development. Ecol. Indic. 2017, 72, 23–32. [Google Scholar] [CrossRef] [Scilit]
- Majumdar, S.; Das, A.; Mandal, S. River bank erosion and livelihood vulnerability of the local population at Manikchak block in West Bengal, India. Environ. Dev. Sustain. 2023, 25, 138–175. [Google Scholar] [CrossRef] [Scilit]
- Sarker, M.N.I.; Wu, M.; Alam, G.M.; Shouse, R.C. Livelihood vulnerability of riverine-island dwellers in the face of natural disasters in Bangladesh. Sustainability 2019, 11, 1623. [Google Scholar] [CrossRef] [Scilit]
- Sultana, N.; Paul, S.R. Indicators of riverbank Erosion vulnerability assessment: A systematic literature review for future research. HydroResearch 2024, 7, 337–359. [Google Scholar] [CrossRef] [Scilit]
- Tri, V.P.D.; Yarina, L.; Nguyen, H.Q.; Downes, N.K. Progress toward resilient and sustainable water management in the Vietnamese Mekong Delta. Wiley Interdiscip. Rev. Water 2023, 10, e1670. [Google Scholar] [CrossRef] [Scilit]
- Ho, T.P.; Garschagen, M.; Yang, L.E. A systematic investigation of flood resilience measures in the Mekong River Basin. Environ. Sci. Policy 2025, 172, 104228. [Google Scholar] [CrossRef] [Scilit]
- Tu, J.; Reimuth, A.; Sairam, N.; Kreibich, H.; Katzschner, A.; Downes, N.K.; Garschagen, M. Profiling households through a combined vulnerability and flood exposure index in Ho Chi Minh City, Vietnam. Int. J. Disaster Risk Reduct. 2024, 115, 105016. [Google Scholar] [CrossRef] [Scilit]
- Ty, T.V.; Duy, D.V.; Phat, L.T.; Minh, H.V.T.; Thanh, N.T.; Uyen, N.T.N.; Downes, N.K. Coastal erosion dynamics and protective measures in the Vietnamese Mekong Delta. J. Mar. Sci. Eng. 2024, 12, 1094. [Google Scholar] [CrossRef] [Scilit]
- Ngoc, T.C.; Van, T.T.; Thanh, B.N.; Downes, N.K. Applying the IUCN Nature-based Standard at the local level: Riverbank protection in the Vietnamese Mekong Delta. Nat.-Based Solut. 2026, 9, 100301. [Google Scholar] [CrossRef] [Scilit]
- Bang, N.Q.; Duy, D.V.; Ty, T.V.; Thang, C.N.; Downes, N.K.; Tanaka, H. Water Hyacinth Geotextiles as a Nature-Based Solution for Riverbank Protection in the Vietnamese Mekong Delta. CivilEng 2025, 6, 55. [Google Scholar] [CrossRef] [Scilit]
- Thang, C.N.; Binh, N.T.; Ty, T.V.; Bay, N.T.; Quang, C.N.X.; Downes, N.K. Harnessing Waste Tyres for Sustainable Riverbank Revetment and Stabilization: A Hybrid Nature-Based Pilot in Vietnam’s Mekong Delta. Geosciences 2025, 15, 340. [Google Scholar] [CrossRef] [Scilit]
- Biron, P.M.; Buffin-Bélanger, T.; Larocque, M.; Choné, G.; Cloutier, C.-A.; Ouellet, M.-A.; Demers, S.; Olsen, T.; Desjarlais, C.; Eyquem, J. Freedom space for rivers: A sustainable management approach to enhance river resilience. Environ. Manag. 2014, 54, 1056–1073. [Google Scholar] [CrossRef] [Scilit] [PubMed]
- Vu, B.T.; Obaitor, O.S.; Grobusch, L.C.; Sett, D.; Hagenlocher, M.; Schinkel, U.; Nguyen, L.K.H.; Bachofer, F.; Ngo, S.T.; Garschagen, M. Enablers and barriers to implementing effective disaster risk management according to good governance principles: Lessons from Central Vietnam. Int. J. Disaster Risk Reduct. 2025, 120, 105344. [Google Scholar] [CrossRef] [Scilit]
- Singh, S.R.; Harirchian, E.; Monjardin, C.E.F.; Lahmer, T. GIS-Based Risk Assessment of Building Vulnerability in Flood Zones of Naic, Cavite, Philippines Using AHP and TOPSIS. GeoHazards 2024, 5, 1040–1073. [Google Scholar] [CrossRef] [Scilit]
- Vu, B.T.; Obaitor, O.S.; Katzschner, A.; Grobusch, L.C.; Sett, D.; Ortiz-Vargas, A.; Hagenlocher, M.; Schinkel, U.; Bachofer, F.; Nguyen, L.K.H. A novel approach to developing local flood vulnerability scenarios based on the Shared Socioeconomic Pathways framework: Sectoral risks and policy implications. Glob. Environ. Change 2025, 95, 103079. [Google Scholar] [CrossRef] [Scilit]
- Downes, N.K.; Nam, N.D.G.; Minh, N.A.; Chi, V.D.; Sang, L.T.; Da Huynh, V.; Tri, V.P.D.; Vu, P.T.; Thanh, B. Climate risks and resilience in urbanizing areas of the Vietnamese Mekong Delta: Future action-orientated research needs. In The Mekong Delta Environmental Research Guidebook; Park, E., Loc, H.H., Tran, D.D., Eds.; Elsevier: Amsterdam, The Netherlands, 2025; pp. 131–156. [Google Scholar]
- Minh, H.V.T.; Kumar, P.; Nhat, G.M.; Diep, N.T.H.; Ty, T.V.; Duy, D.V.; Avtar, R.; Downes, N.K. Losing Ground: Flow Fragmentation and Sediment Decline in the Vietnamese Mekong Delta (2000–2023). Earth Syst. Environ. 2026, 10, 4821–4841. [Google Scholar] [CrossRef] [Scilit]
- Minh, H.V.T.; Nam, N.D.G.; Nam, T.S.; Cong, N.V.; Kumar, P.; Downes, N.K. Transition of flooding patterns and environmental flow in the Mekong Delta, Vietnam over the last two decades. Nat. Hazards 2025, 121, 12665–12694. [Google Scholar] [CrossRef] [Scilit]
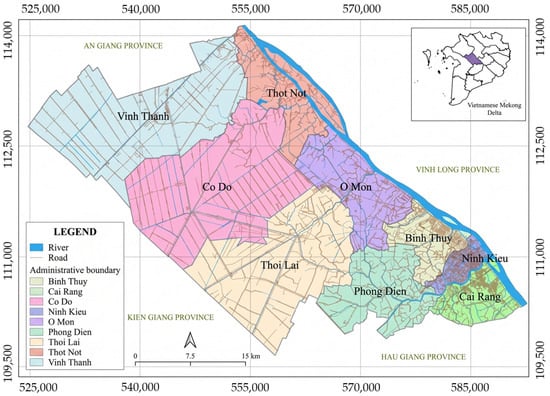
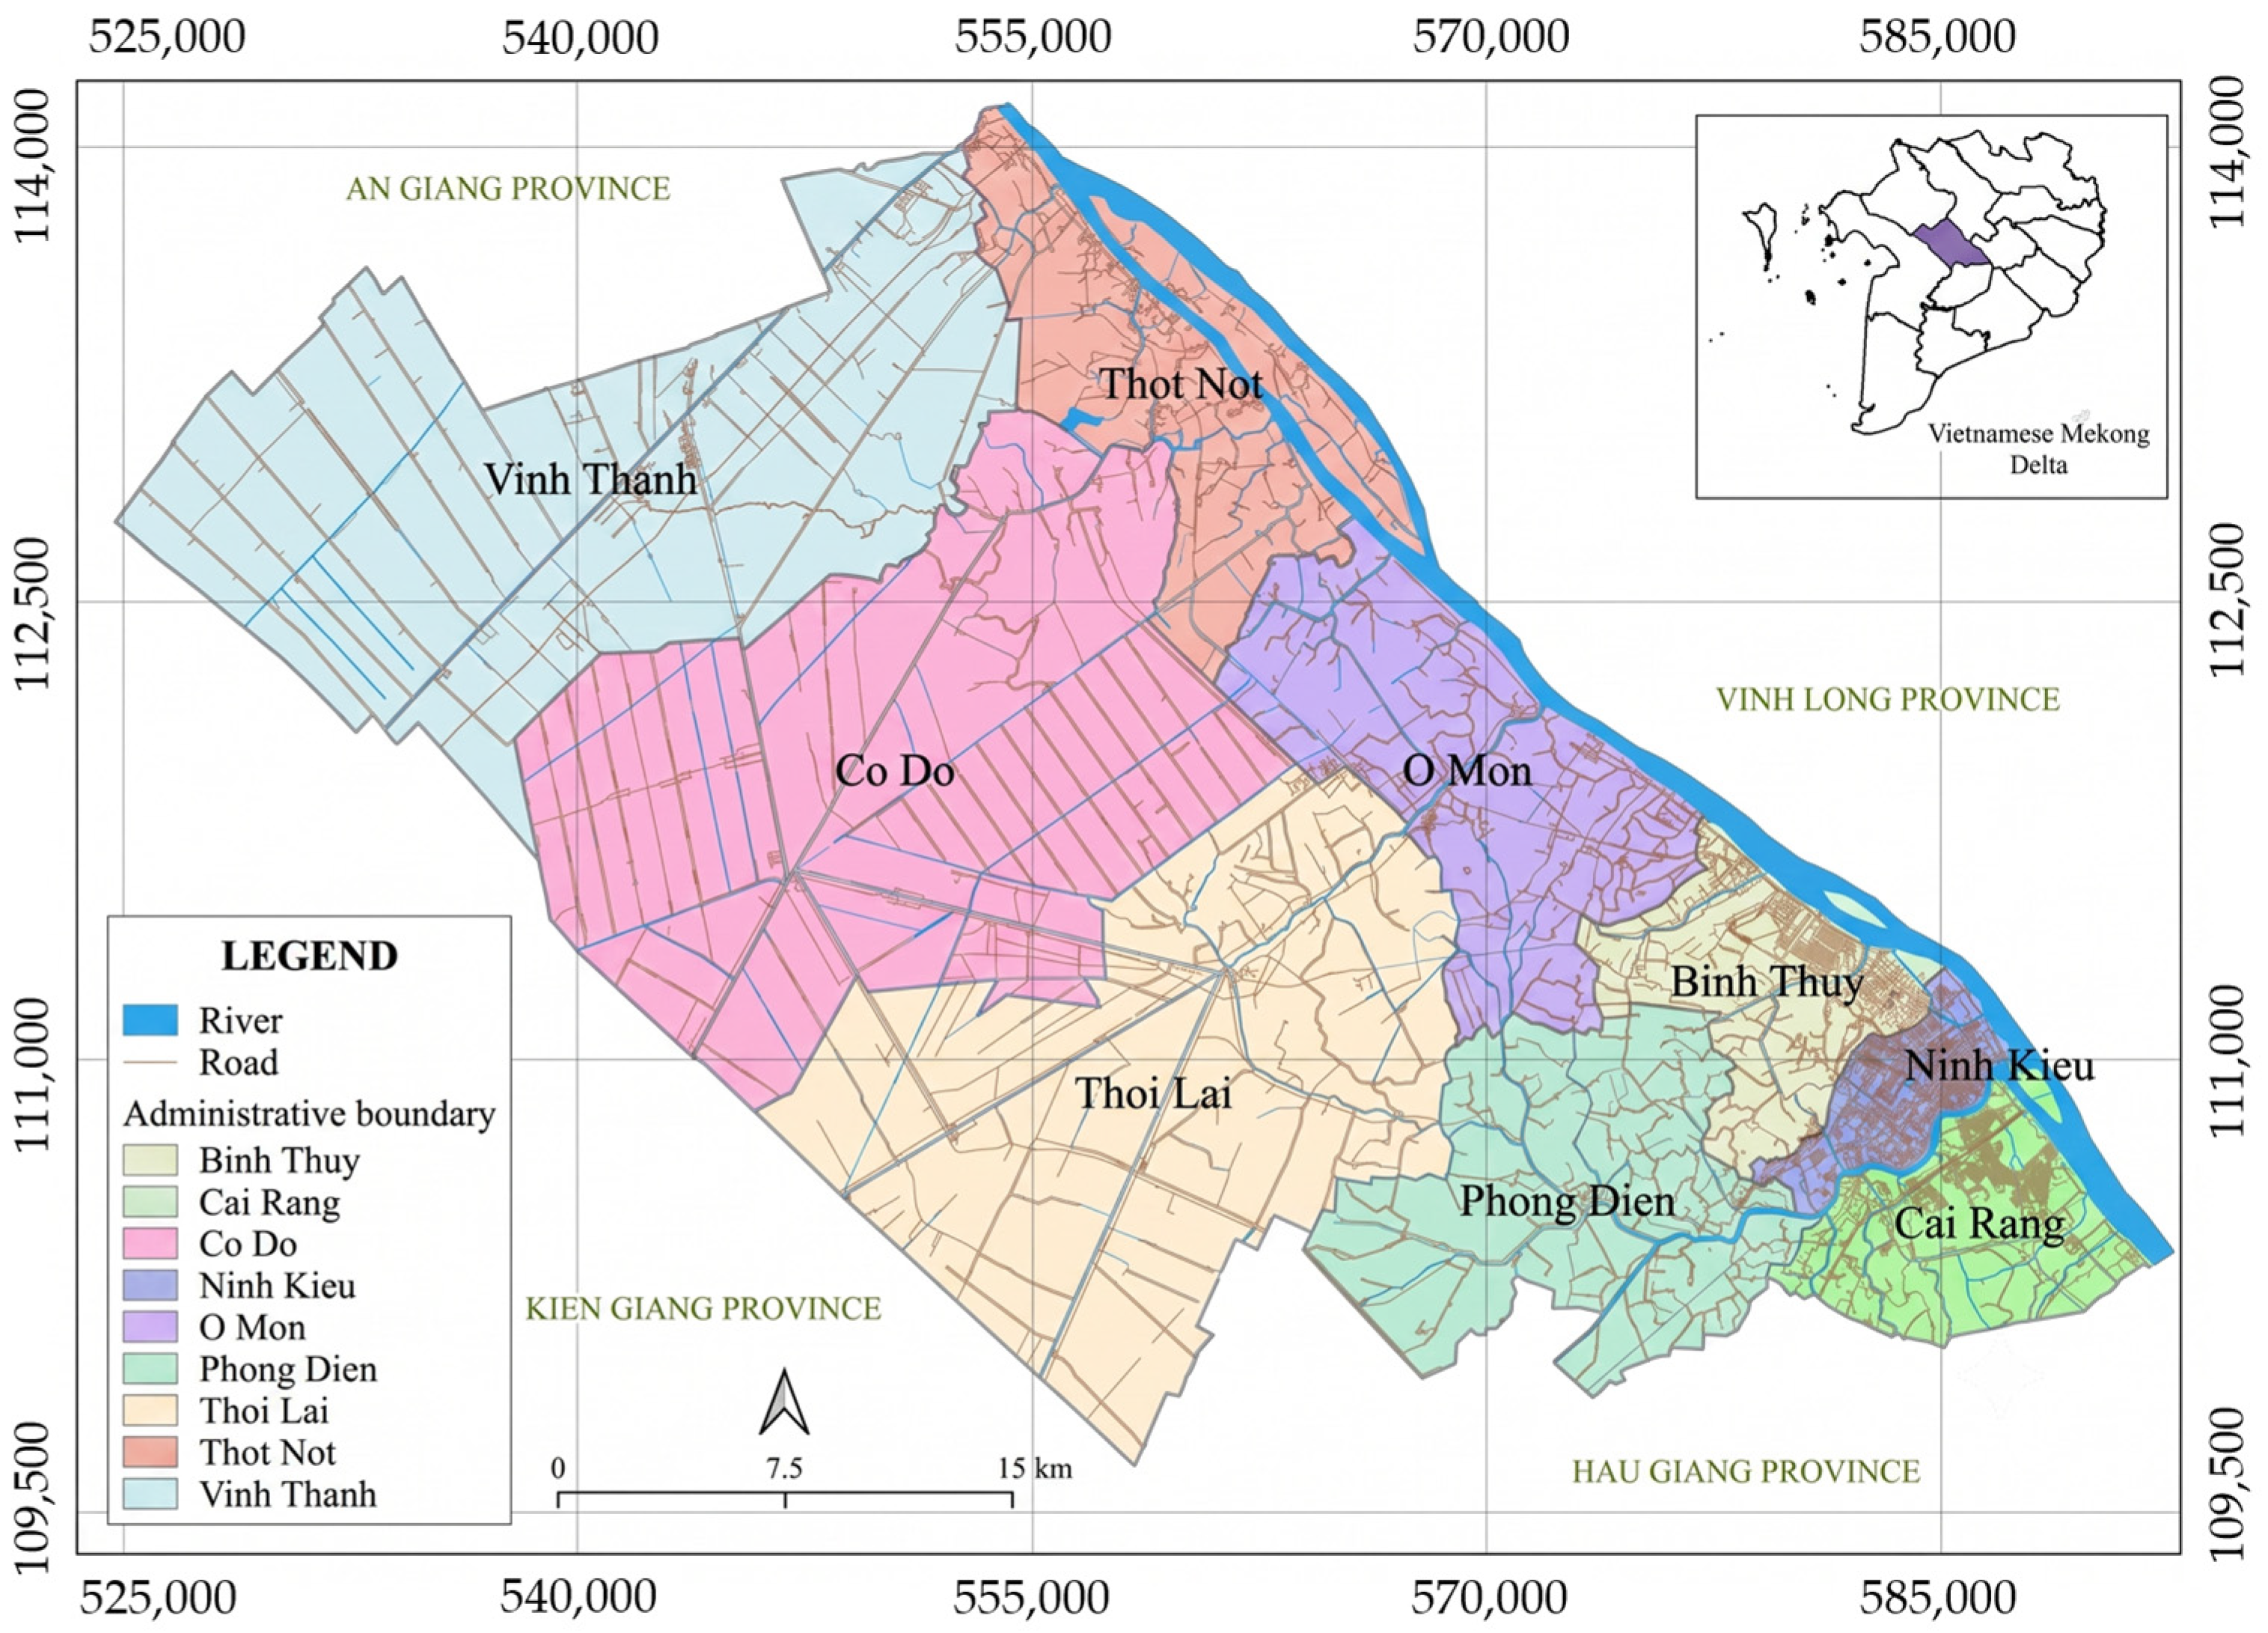
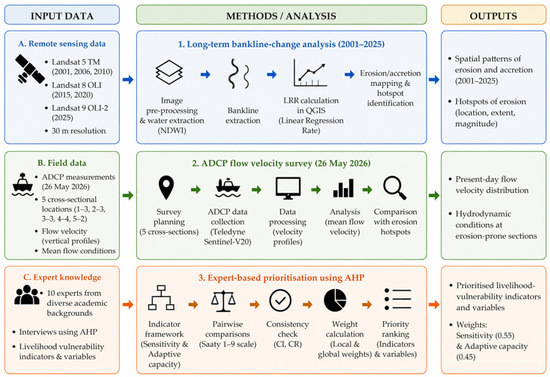
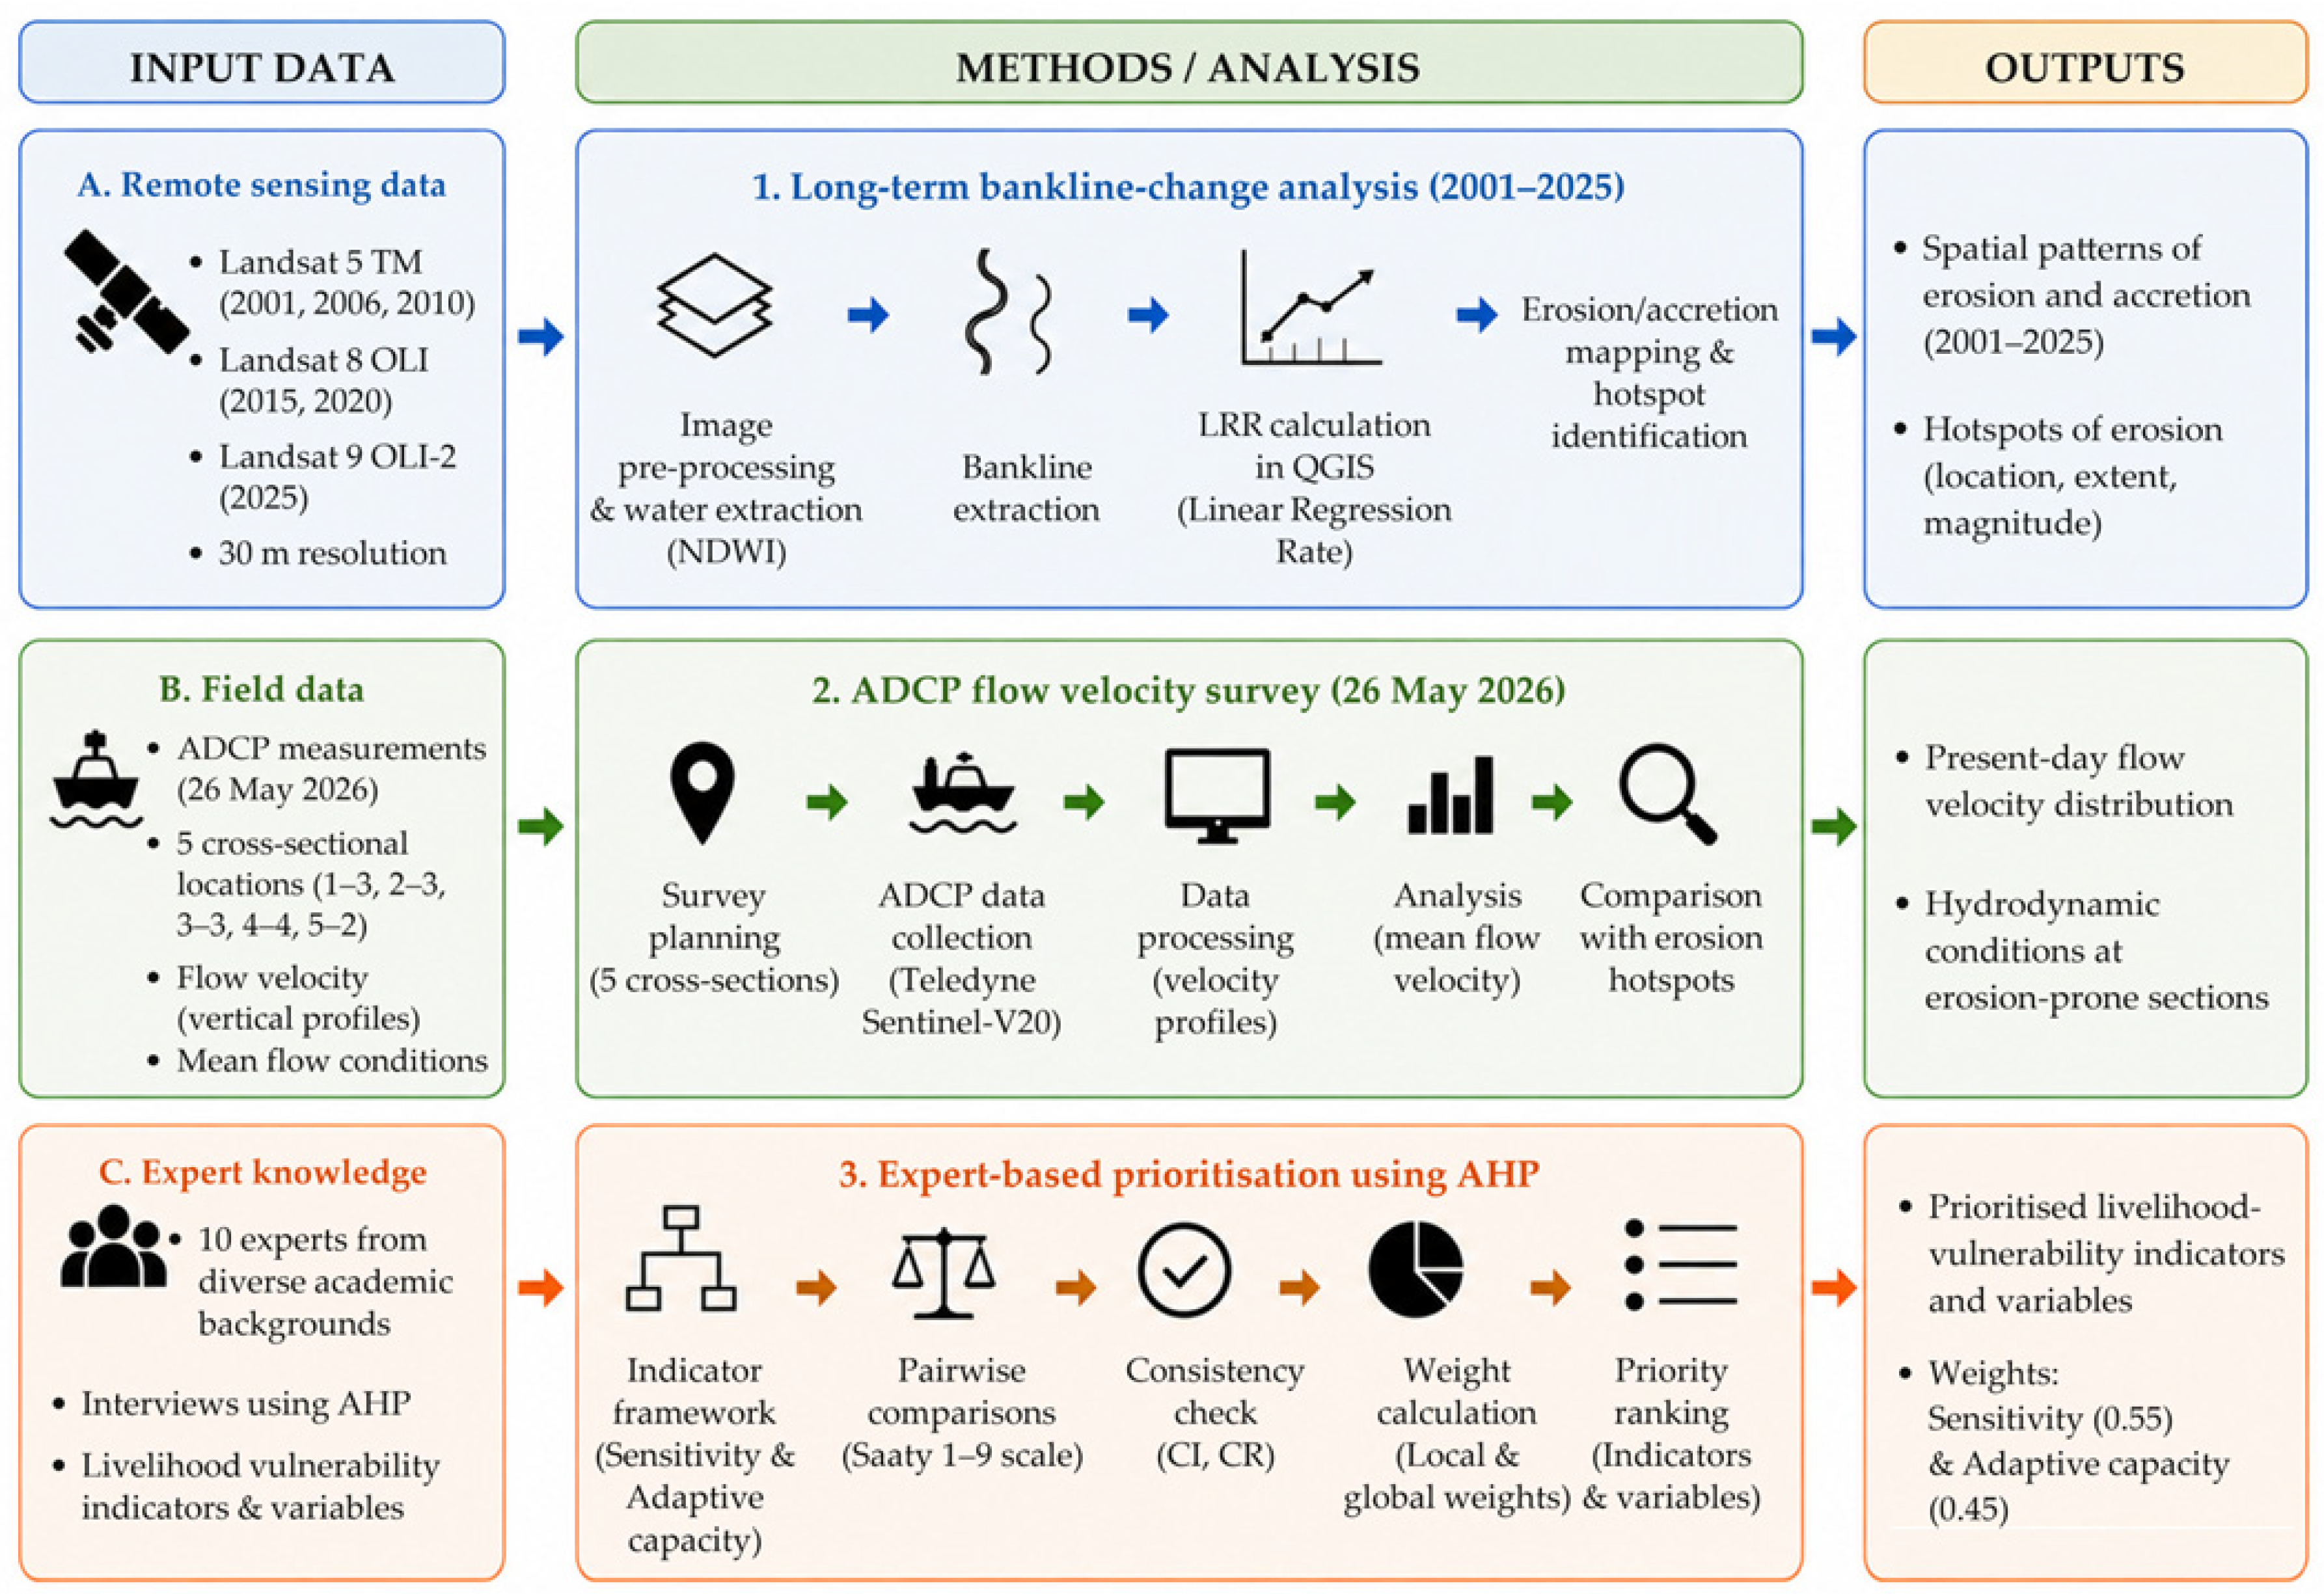
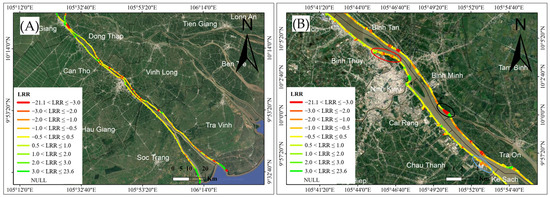
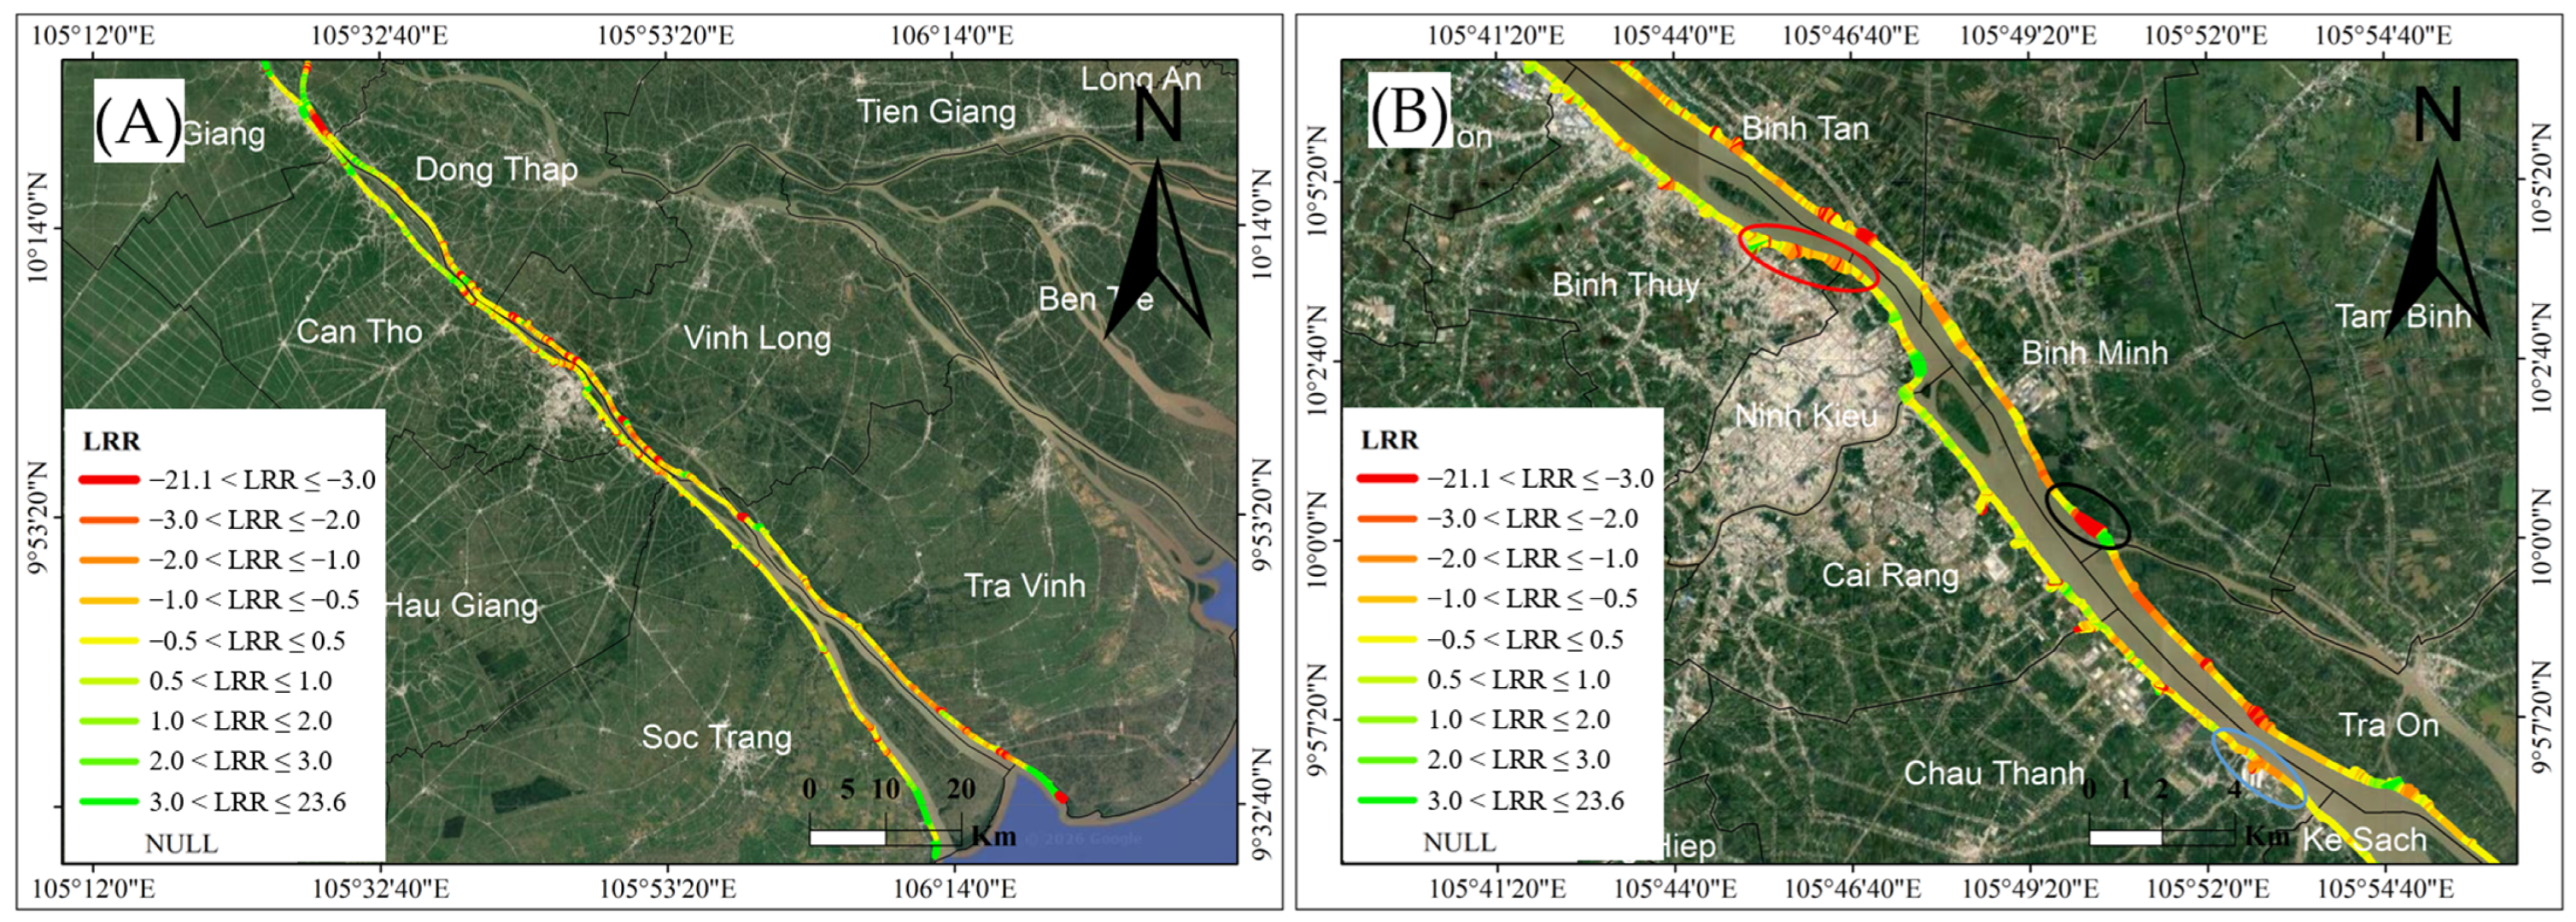
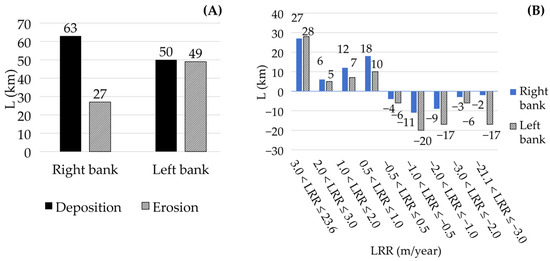
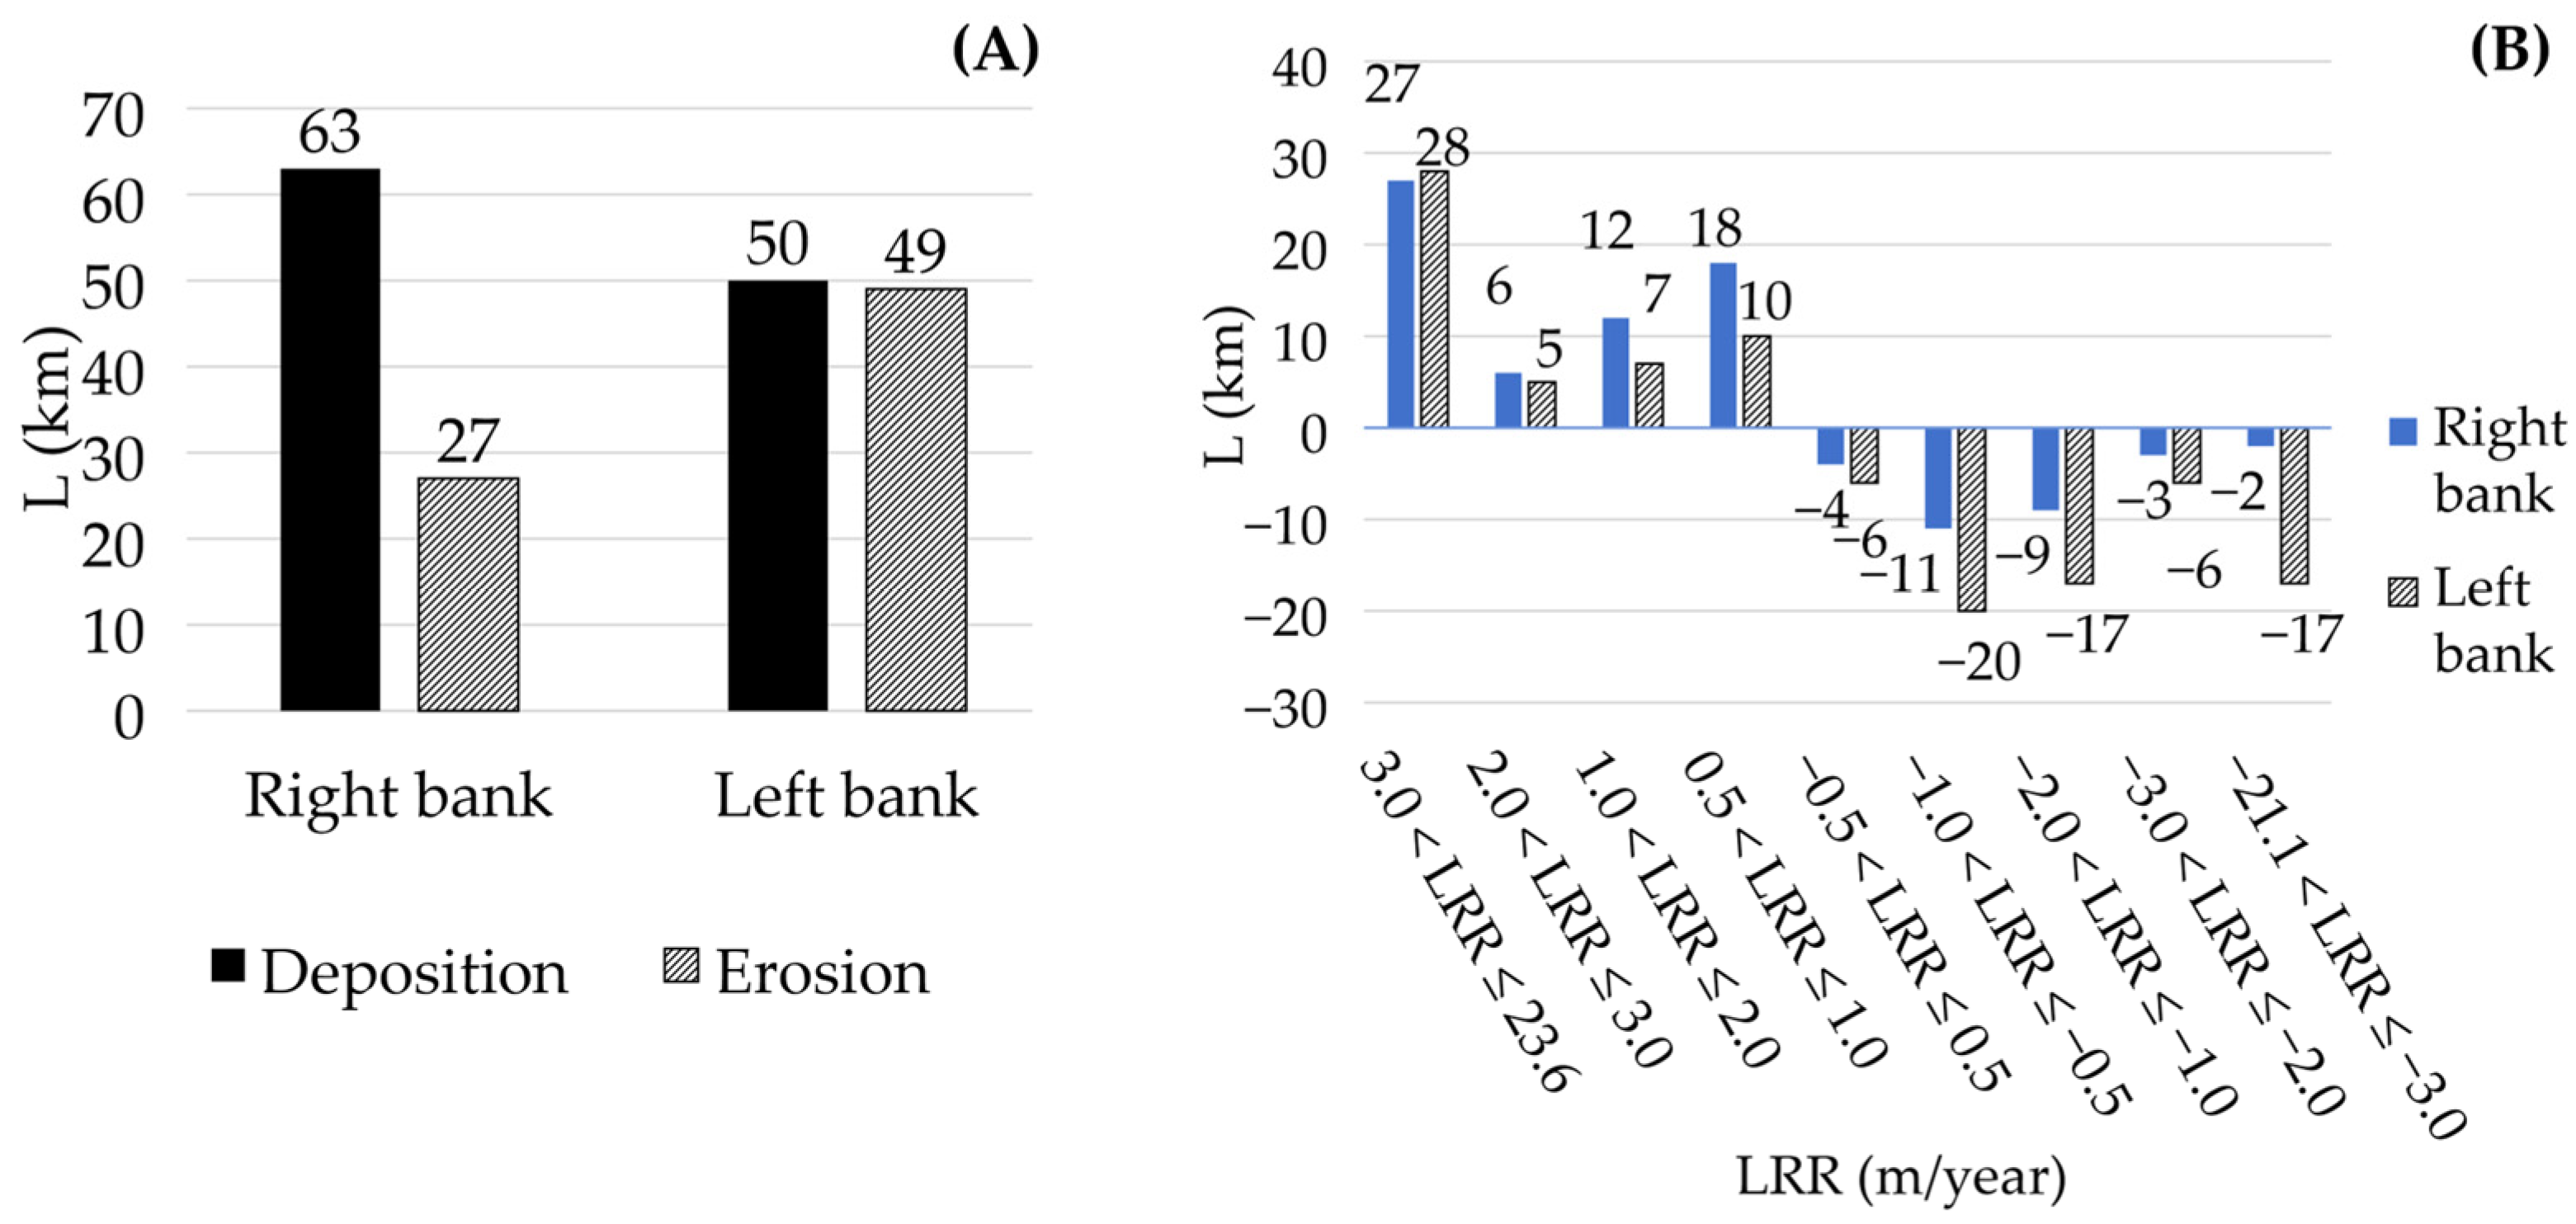
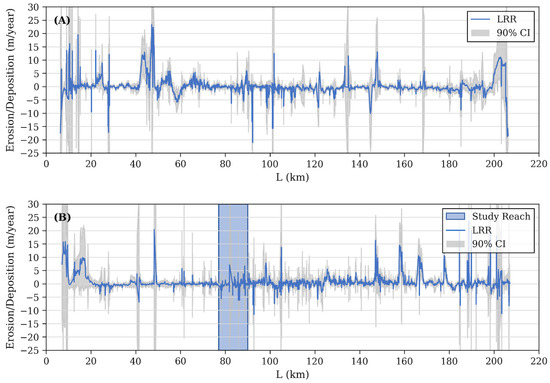
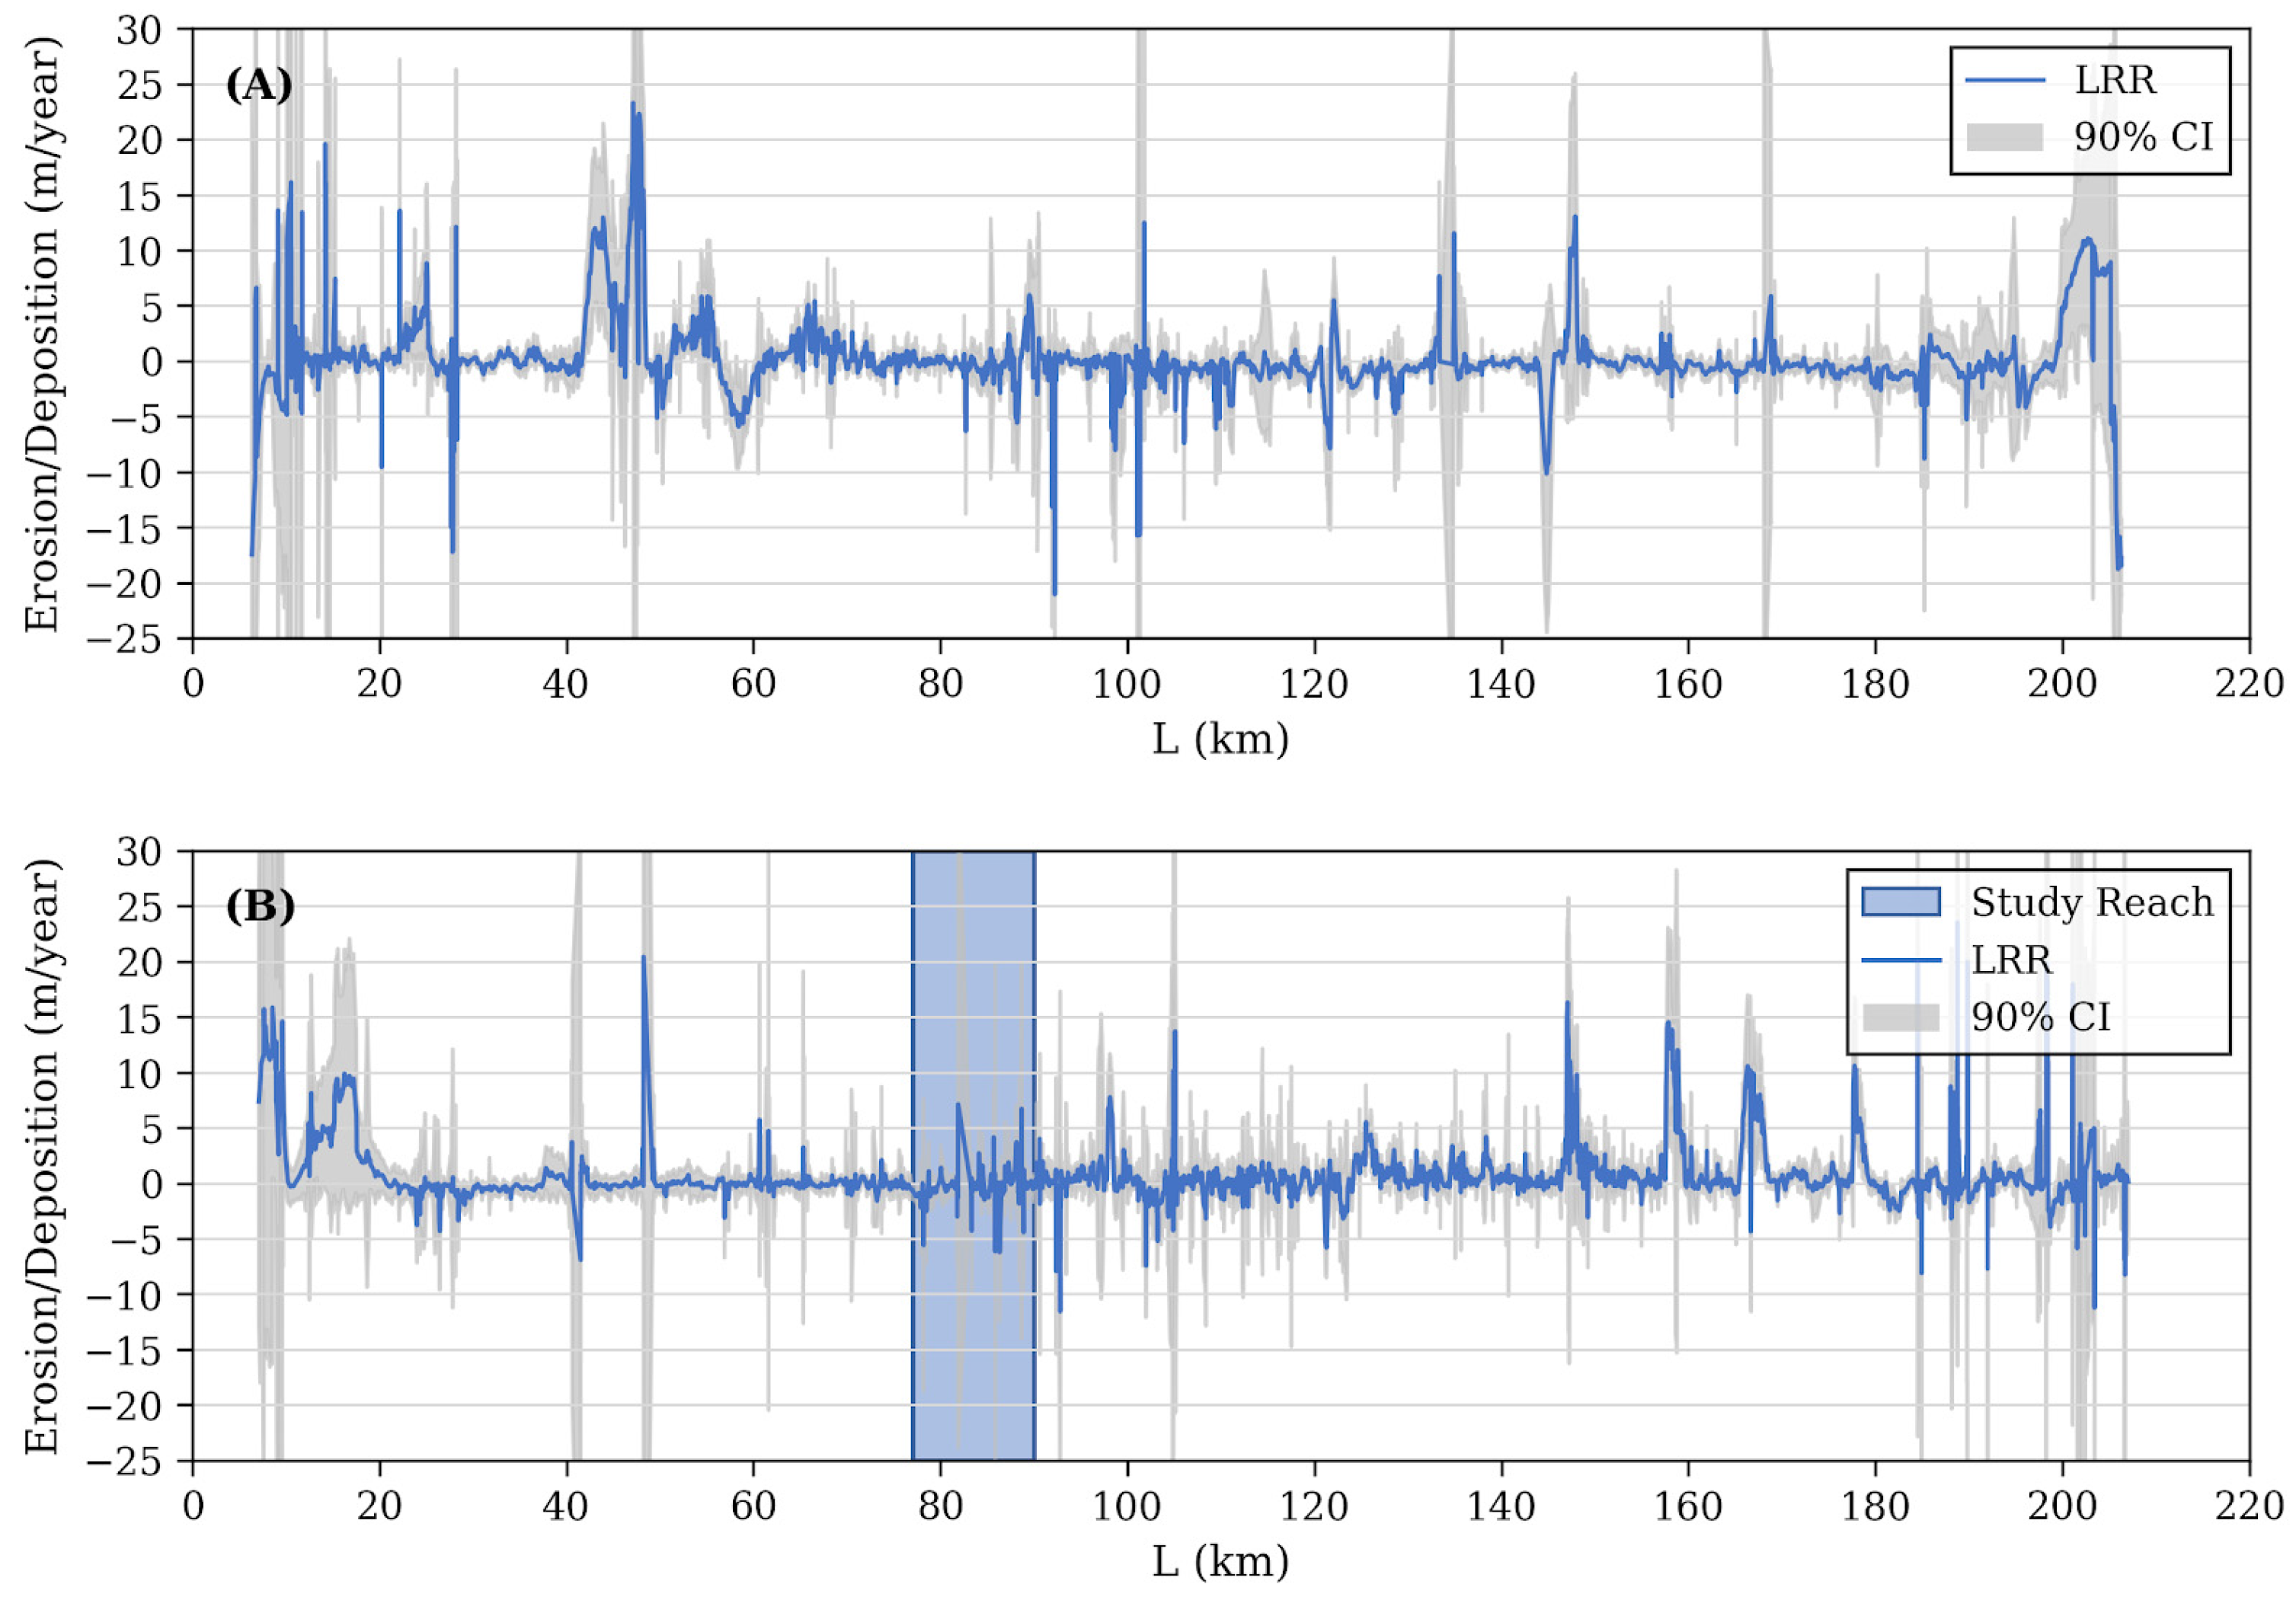
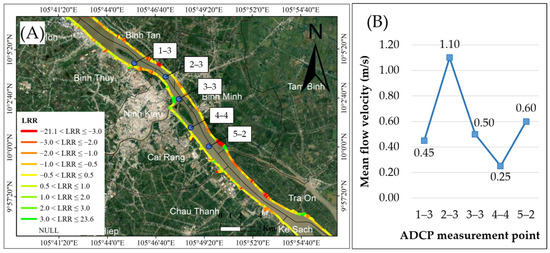
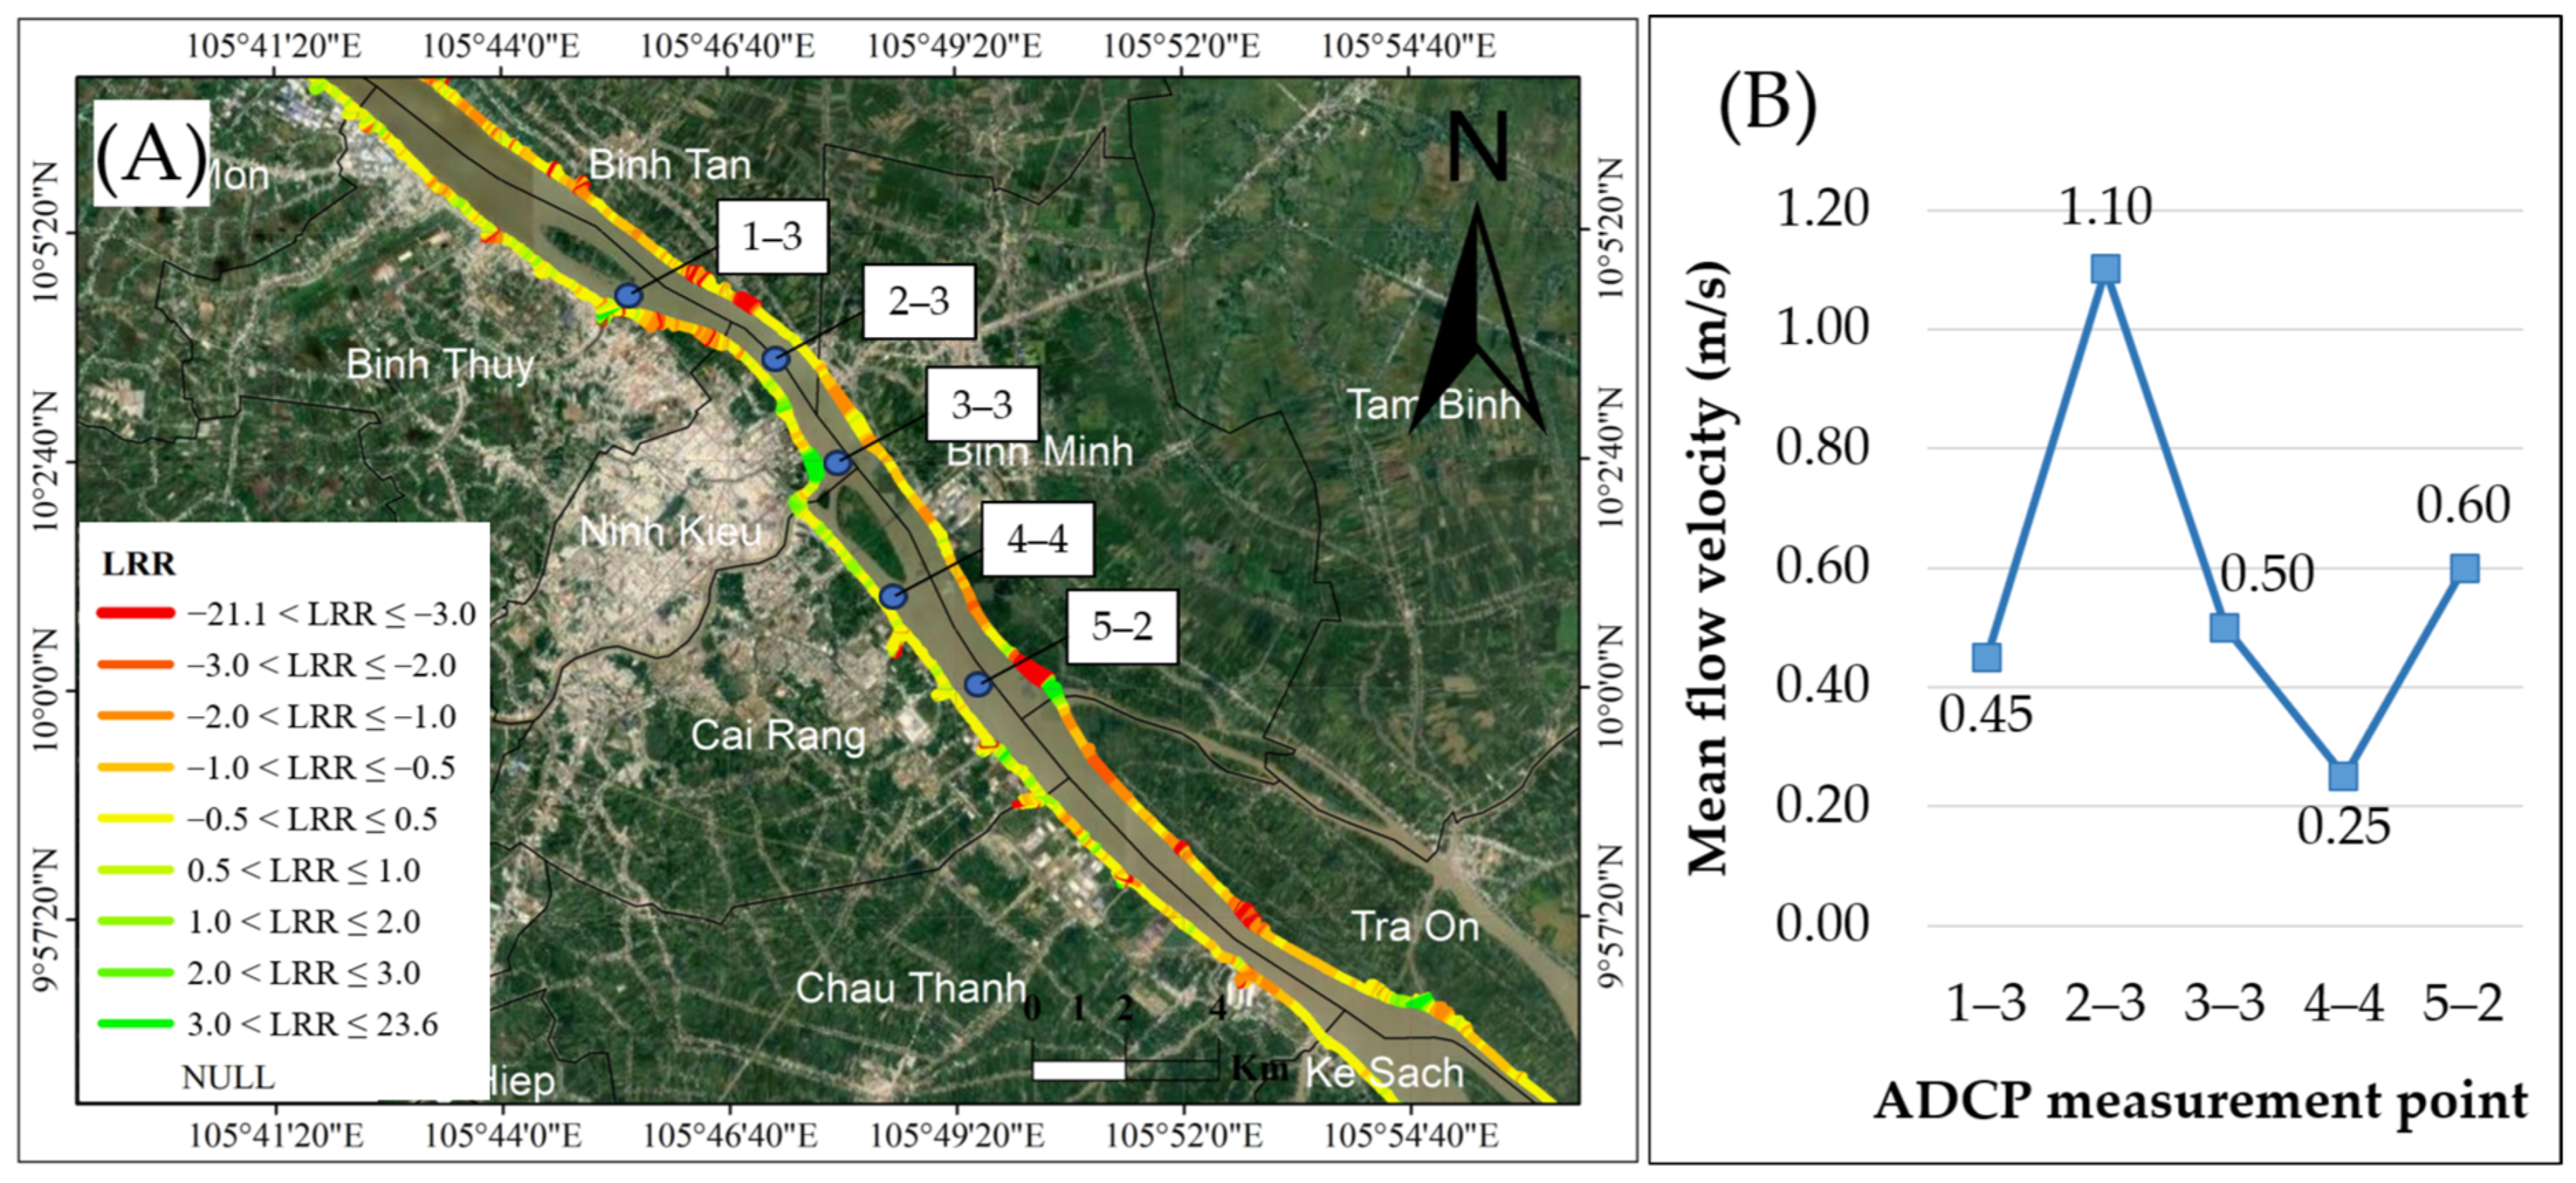
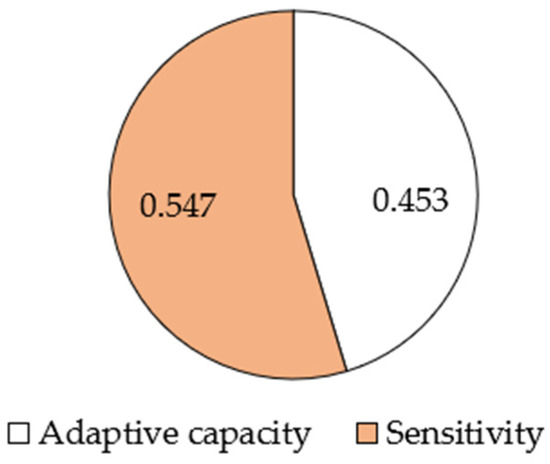
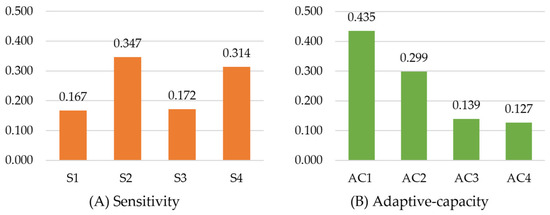
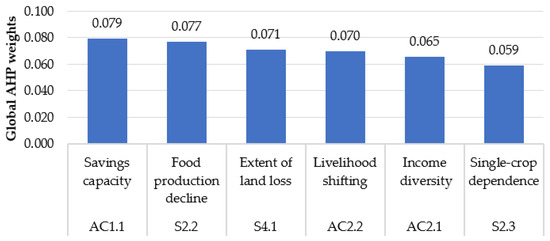
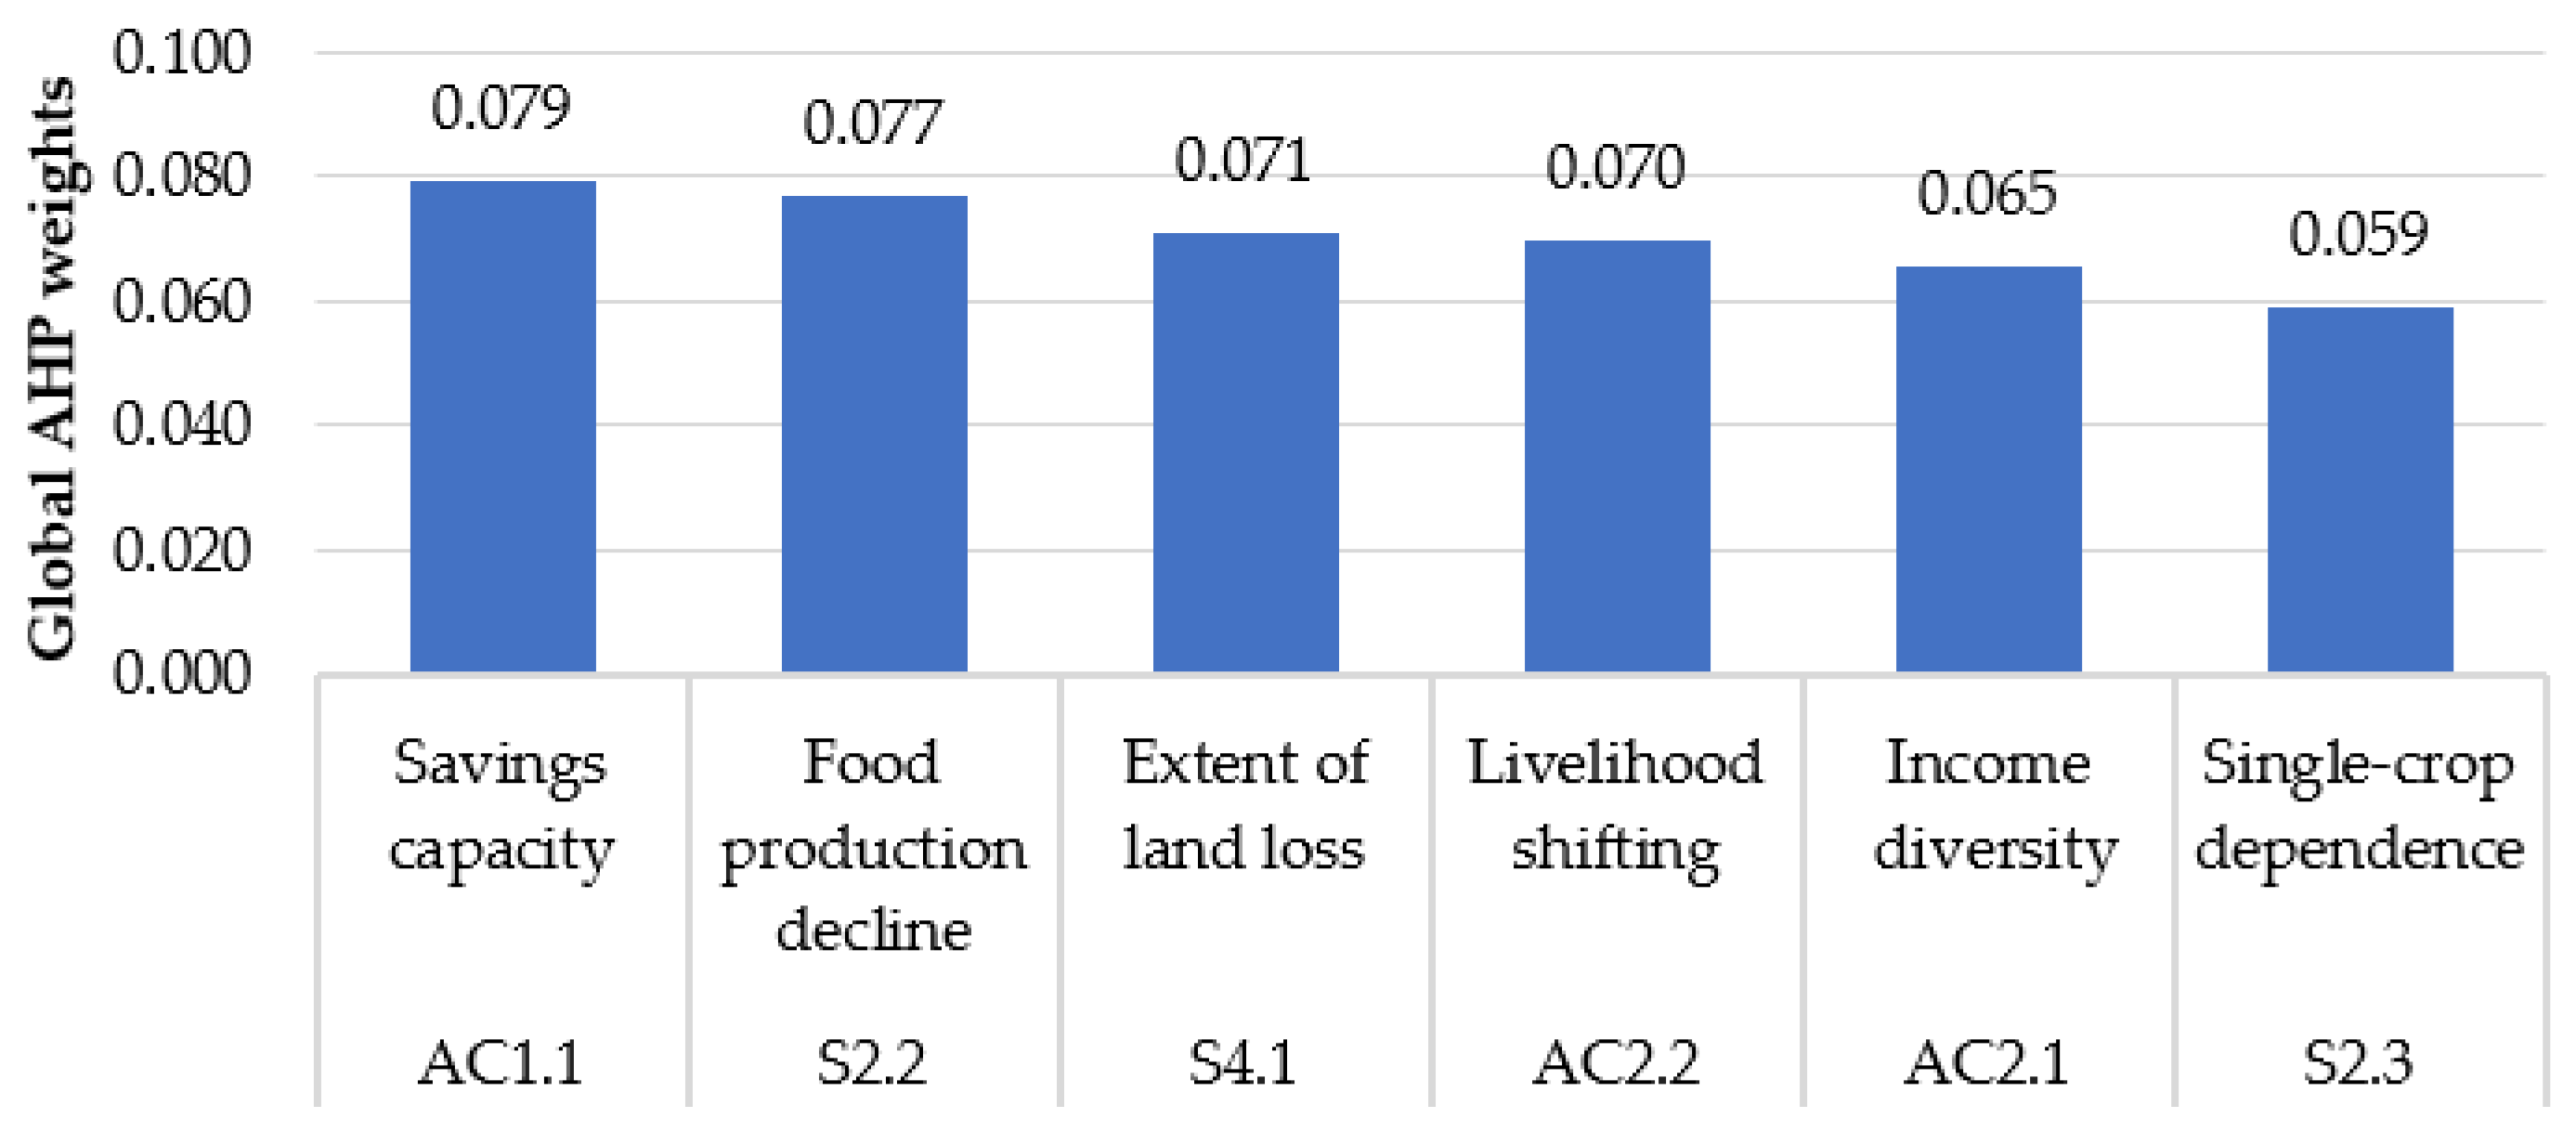

Disclaimer/Publisher’s Note: The statements, opinions and data contained in all publications are solely those of the individual author(s) and contributor(s) and not of MDPI and/or the editor(s). MDPI and/or the editor(s) disclaim responsibility for any injury to people or property resulting from any ideas, methods, instructions or products referred to in the content. |
© 2026 by the authors. Licensee MDPI, Basel, Switzerland. This article is an open access article distributed under the terms and conditions of the Creative Commons Attribution (CC BY) license.