Abstract
Sorghum (Sorghum bicolor L.) is a resilient crop with high relevance in tropical and semi-arid regions, where nutritional deficiencies, particularly of nitrogen (N) and potassium (K), limit yield. This study evaluated the potential of RGB imagery combined with machine learning to detect N and K deficiencies in sorghum at different phenological stages. The traditional models showed significant limitations in distinguishing nutritional status, especially at the early V4 stage, where accuracies remained below 40%. At the flowering stage, their performance improved for nitrogen detection, reaching up to 58% accuracy, but remained insufficient for potassium (below 30%). In stark contrast, the CNN demonstrated substantially superior performance, effectively identifying even subtle visual symptoms. For nitrogen deficiency, the CNN achieved high accuracies of 76% at the V4 stage and 87% at flowering. While potassium classification proved more challenging overall, the CNN still outperformed traditional models, reaching 55% accuracy at flowering. These results indicate that deep learning is a powerful and viable low-cost tool for the early and accurate diagnosis of nutrient deficiencies in sorghum, overcoming the limitations of conventional machine learning approaches.
1. Introduction
The growing demand for food, driven by global population expansion, imposes the need for sustainable and highly efficient agriculture. In this global context, precision agriculture emerges as a fundamental strategy, enabling more rational management of inputs. Proper management of macronutrients, especially nitrogen (N) and potassium (K), is a pillar of sustainable intensification, as it directly governs the physiological processes that determine crop productivity. The judicious application of these nutrients mitigates adverse environmental impacts, such as nitrate leaching and resource depletion [1].
At a regional scale, particularly in tropical and semiarid environments, agriculture faces additional challenges related to soil fertility limitations and recurrent water deficits. In these regions, the adoption of resilient crops and technologies that improve resource-use efficiency is essential for food security and the sustainability of production systems [2].
Within the national context of Brazil, grain sorghum (Sorghum bicolor L.) plays a strategic role due to its exceptional hardiness, drought tolerance, and adaptability to soils of limited fertility. These characteristics consolidate sorghum as an essential crop, both for animal feed and for the diversification of production systems, especially in regions where other cereals face higher risks of productivity reduction [2].
Optimizing sorghum nutritional management depends on the ability to diagnose deficiencies early and accurately. Nitrogen and potassium deficiencies trigger profound metabolic disorders that manifest phenotypically through visual symptoms in the leaves, such as chlorosis, necrosis, loss of turgor, marginal discoloration, and consequent plant dwarfism. The intensity and morphology of these symptoms are, however, complex and influenced by an interplay of factors, including the plant genotype, the severity and duration of the nutritional deficiency, and, crucially, the phenological stage at which the stress occurs [3,4].
For example, the high mobility of nitrogen in the phloem causes deficiency symptoms, such as progressive yellowing, to appear first in older leaves [5]. In contrast, potassium deficiency, a vital cation for osmotic regulation and enzyme activation, typically manifests itself through necrosis or “burns” on the margins and tips of older leaves [6].
Historically, crop nutritional status assessment has relied on conventional laboratory methods, such as chemical analysis of leaf tissue. Although they provide accurate measurements, these techniques are inherently destructive, require specialized labor, are relatively costly, and have a significant time lag between sampling and results, hindering real-time decision-making and the implementation of site-specific management practices. To overcome these limitations, a new paradigm based on proximal sensing and computer vision is emerging. The use of digital images in the visible spectrum (RGB), captured by low-cost cameras, enables non-invasive digital phenotyping and objective quantification of visual leaf symptoms, creating the necessary database for the development of computational models for automated diagnostics [7,8].
Machine Learning algorithms are used to translate these visual data into practical diagnoses. Among the various approaches, models such as K-Nearest Neighbors (KNN), Support Vector Machines (SVM), and Random Forest (RF) have been widely explored for plant stress classification. KNN, an instance-based classifier, stands out for its simplicity of implementation, but its performance is sensitive to noise and data dimensionality. SVM, in turn, is recognized for its ability to construct complex and robust decision boundaries in high-dimensional feature spaces, although its performance depends on the choice of an appropriate kernel and the optimization of its hyperparameters [9,10]. Random Forest, an ensemble technique that combines multiple decision trees, offers high accuracy and remarkable robustness to noise and overfitting, being particularly effective in modeling complex non-linear relationships between visual characteristics and nutritional status [11].
A critical factor that modulates the effectiveness of these models is symptom expressivity, which varies dynamically with plant development. In early vegetative stages, such as V4 (fourth fully expanded leaf), deficiency symptoms can be subtle, incipient, or visually ambiguous, posing a significant challenge for discrimination by classification algorithms [12,13]. As the cycle progresses, especially at flowering, accumulated nutritional stress tends to intensify symptoms, making them more evident, distinct, and distributed throughout the canopy, potentially facilitating differentiation between deficiency levels and increasing the accuracy of predictive models [4,7].
The challenge posed by subtle and visually ambiguous symptoms, particularly in early growth stages, often exposes the limitations of traditional machine learning models. While powerful, algorithms like KNN, SVM, and Random Forest can struggle when chromatic and textural distinctions are minimal. To address this specific gap, modern deep learning approaches have emerged as a superior alternative. Convolutional Neural Networks (CNNs), in particular, are designed to automatically learn hierarchical features directly from images, enabling them to identify complex patterns even from subtle symptoms that are difficult for other models to discriminate, making them a highly promising tool for plant stress detection [7,8].
Thus, the objective of this study was to investigate and compare the performance of RGB image-based machine learning models to classify nitrogen (N) and potassium (K) deficiencies in sorghum at two contrasting phenological stages (V4 and flowering). Specifically, we sought to: (i) develop and evaluate classification models using traditional algorithms (K-Nearest Neighbors, SVM, and Random Forest); and (ii) develop and assess a Convolutional Neural Network (CNN) as a more advanced approach, comparing its diagnostic accuracy against the traditional models, especially in addressing the challenge of early-stage symptom expressivity.
2. Materials and Methods
To evaluate the isolated effects of nitrogen (N) and potassium (K) deficiencies, two independent single-factor experiments were conducted under field conditions. The experiments were installed and monitored during the 2024 harvest in the experimental area of the School of Animal Science and Food Engineering of the University of São Paulo (Universidade de São Paulo—FZEA/USP), in Pirassununga, SP (Latitude 21°59′ S, Longitude 47°25′ W, altitude 627 m). The climate of the region, according to the Köppen–Geiger classification, is Cwa, characterized as humid subtropical with dry winters and hot summers. The soil of the experimental area was classified as a Typical Orthic Quartzipsamment, corresponding to a Typical Quartzipsamment according to the Soil Taxonomy (USDA). This soil class was intentionally selected for its low cation exchange capacity (CEC) and low natural nutrient reserve, a condition that allows minimizing soil interference in nutritional supply (background effect) and, consequently, maximizing the phenotypic expression of deficiencies induced by treatments.
The biological material used in both trials was the grain sorghum (Sorghum bicolor L.) hybrid BM 767, provided by Biomatrix. This commercial genotype is characterized by its early maturity, medium size (final height between 1.40 m and 1.60 m), and high yield potential. The seeds had a germination rate of 75%, a value that was used as a reference for calculating the seeding density to ensure the population stand planned for the experiment.
Sowing was carried out mechanically, with a row spacing of 0.50 m and a seed deposition depth of approximately 3 cm. The mechanized system consisted of a Massey Ferguson tractor, model MF4275, pulling a Jumil seeder-fertilizer spreader, model POP 2670, configured with four rows (Figure 1A). The seeding density was calibrated to achieve a planned final population of 140,000 plants ha−1, adjusting the seed distribution per linear meter to compensate for the 75% germination rate of the plot. To ensure maximum stand uniformity between plots, manual thinning was performed at 21 days after emergence (DAE), adjusting the plant population to the target value in all experimental units.

Figure 1.
Chronological sequence of the experimental field: (A) Sowing, (B) staking, and (C) flowering phase.
Each trial, one focused on nitrogen (N) and the other on potassium (K), was implemented independently, following a randomized block design to control soil spatial variability. Each design consisted of five treatments (nutrient rates) with four replicates (blocks), totaling 20 plots per trial.
The experimental unit (plot) was sized at 4.0 m wide by 4.0 m long, comprising eight seeding rows and a total area of 16 m2. To eliminate the border effect during the evaluations, the useful area was defined as the central 6 m2 of each plot, corresponding to the four central rows, disregarding 0.5 m at each end (Figure 1B). Considering the final population of 140,000 plants ha−1, the useful area of each plot contained approximately 110 plants, which were the focus of sampling and image acquisition. During the experiment period, the site had an average temperature of 24.9 °C and total precipitation of 543 mm.
Data collection occurred at two phenological stages: Vegetative (V4), at 28 days after emergence (DAE), and Reproductive (full flowering), at 65 DAE. At each stage, ten diagnostic leaves were sampled per plot (leaf + 3 at V4; leaf below the panicle at flowering) (Figure 1C). The sampling protocol, conducted between 10:00 a.m. and 12:00 p.m., consisted of first acquiring a digital image (RGB, 24 MP) of each leaf individually. For standardization, the capture was made at a perpendicular angle (nadir), at a distance of 30 cm, and using a white panel as a contrast background.
Nutritional management and treatment definition were meticulously planned to isolate the effects of Nitrogen and Potassium, using as a basis the low natural fertility of the Quartzarenic Neosol, confirmed by chemical and physical analysis (Table 1 and Table 2).

Table 1.
Chemical analysis of the soil used in the experiment.

Table 2.
Complementary analysis of the soil used in the experiment.
Aiming for a high productivity goal (>8 t ha−1), soil correction was initially carried out according to the guidelines of [14], which included the application of limestone to increase base saturation to 70% and the application of agricultural gypsum to supply 30 kg ha−1 of sulfur (S). From this, the reference “complete dose” (100%) was established at 150 kg ha−1 of N, 120 kg ha−1 of P2O5, and 120 kg ha−1 of K2O, using Urea, Simple Superphosphate, and Potassium Chloride as sources, respectively. The treatments for the single-factor trials consisted of variations of this dose (0%, 50%, 100%, 150%, and 200%). In the Nitrogen trial, rates of 0, 75, 150, 225, and 300 kg ha−1 of N were applied, keeping the basal fertilization of P2O5 and K2O constant at 120 kg ha−1 for all plots. Similarly, in the Potassium trial, rates of 0, 60, 120, 180, and 240 kg ha−1 of K2O were evaluated, with fixed basal fertilization of N (150 kg ha−1) and P2O5 (120 kg ha−1). All fertilizer quantities were calculated for 16 m2 plots, weighed individually, and applied fractionally, with a portion applied at planting and the remainder a s top dressing, the latter being carried out immediately after data and image collection at the V4 stage, to ensure that the initial assessment reflected only the effect of base fertilization. Doses calculated are showed at Table 3.

Table 3.
Distribution of the nutrients according to the doses and phases.
Crop nutritional status assessments were performed at two key phenological stages, selected for their physiological importance and relevance for fertilizer management. The first assessment occurred at the V4 vegetative stage, defined by the moment when the fourth leaf from the coleoptile was fully expanded with the ligule visible, observed at 28 days after emergence (DAE). The selection of this stage is critical because it precedes the period of greatest biomass accumulation and the recommended window for topdressing with nitrogen and potassium, which is generally between V5 and V6 [14]. This chronology allowed for an accurate diagnosis of the effect of planting fertilization on initial crop establishment, before the interference of the second fertilizer application. The second assessment was conducted at the full flowering stage, at 65 DAE, a crucial point that reflects the nutritional status accumulated by the plant throughout the vegetative cycle and directly influences the definition of production potential, especially in grain formation and subsequent filling. The joint analysis of these two critical moments, therefore, allows a comprehensive understanding of the nutritional dynamics of the crop and the expression of deficiency symptoms throughout its development.
The digital image acquisition procedure at the V4 and Flowering stages was standardized to ensure data quality and consistency. The rear-facing camera of an Apple iPhone 11 smartphone, with 12-megapixel resolution, was used to capture images in Jpeg format. For each sample, the diagnostic leaf was carefully fixed to a clipboard on a white bond paper background, using elastic bands to keep the leaf surface flat and free of wrinkles (Figure 2). The camera was positioned at a fixed distance of 23 cm from the sample, according to the methodology described by [15]. All captures were taken between 10:00 a.m. and 12:00 p.m. under natural light, in the growing environment itself, to minimize external variations and ensure that chromatic differences were attributed to nutritional effects. Fifteen samples were collected per plot, totaling 300 images per phenological stage for each nutrient.
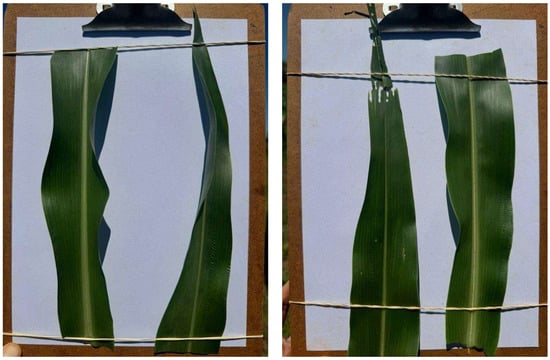
Figure 2.
Original images captured of sorghum leaves at the V4 stage.
The images were acquired using the camera’s default automatic white balance, without any subsequent adjustments or corrections. This approach ensures that field lighting conditions are realistically represented, preserving the spectral fidelity of the samples and avoiding the introduction of artificial chromatic biases. Furthermore, the camera’s native calibration provides consistency between images, a key factor for comparative analyses of different nutritional levels.
The processing of this image database was conducted at the Agricultural Machinery and Precision Agriculture Laboratory (LAMAP) at FZEA/USP, using a custom script developed in Python. This script automated the entire pipeline, including image normalization and, crucially, the implementation of the machine learning models.
The input data model consists of normalized RGB images (0–1), resized to 1024 × 1024 pixels and organized into high-dimensional 1D vectors, with their respective categorical labels. For the Convolutional Neural Network (CNN) model, images were provided directly as a 3D matrix (height × width × color channels), which is the appropriate input format for deep learning models.
For classifier training and validation, the dataset was partitioned into 75% for training and 25% for validation. This division was performed randomly and stratified by dose, a fundamental practice to prevent overfitting and enable a robust assessment of model generalization [16,17]. The performance of each algorithm was evaluated using confusion matrices, from which performance metrics, such as accuracy (1), precision (2), recall (3), and f1-score (4), were calculated based on true, false, and negative values, following the approach outlined by [9].
The traditional algorithms (KNN, SVM, and Random Forest) were implemented using the Scikit-learn library in a Python environment, while the Convolutional Neural Network (CNN) was built with TensorFlow/Keras [18]. To optimize the traditional models, a grid search with 5-fold cross-validation was conducted exclusively on the training set. The final hyperparameters selected were as follows: for KNN, the optimal number of neighbors was k = 5; for SVM, a Radial Basis Function (RBF) kernel was used with a regularization parameter C of 10 and a gamma of 0.1; and for Random Forest, the model was configured with 100 trees and a maximum depth of 20.
The CNN architecture was designed as a sequential model. The input layer was followed by three convolutional blocks. The first block contained a convolutional layer with 32 filters (3 × 3 kernel size) and a ReLU activation function, followed by a 2 × 2 MaxPooling layer. The second and third blocks repeated this structure but with 64 and 128 filters, respectively. After the convolutional blocks, the feature maps were flattened and passed through a dense layer of 256 neurons with ReLU activation. The final output layer consisted of 5 neurons with a Softmax activation function for multi-class classification. The network was trained for 20 epochs using the Adam optimizer, a learning rate of 0.001, and the categorical crossentropy loss function to ensure convergence. After identifying the best hyperparameters, the final model of each algorithm was trained with the entire training dataset and then evaluated independently on the validation set (25%), which did not participate in any training or calibration stage.
It is important to emphasize that, although chemical analyses of leaves were not performed to confirm nutritional status, the experimental design was structured to ensure the induction of deficits. The use of a soil with low natural fertility, confirmed by chemical analysis, and the application of widely contrasting N and K doses (from 0 to 300 kg·ha−1 of N and from 0 to 240 kg·ha−1 of K2O) allow us to confidently infer that the different treatments resulted in distinct nutritional statuses in the plants, which were manifested phenotypically through visual symptoms captured in the images.
3. Results and Discussion
3.1. Confusion Matrices
The performance evaluation of the classification models—K-Nearest Neighbors (KNN), Support Vector Machines (SVM), and Random Forest (RF)—as well as the Convolutional Neural Network (CNN) was systematically carried out through the construction of confusion matrices, whose visual representations are presented in Figure 3, Figure 4, Figure 5 and Figure 6. The interpretation of these matrices indicates that the positive values located on the main diagonal line represent the correct classifications (true positives and true negatives), that is, where the model correctly predicted the real class of the objective treatment of the study.
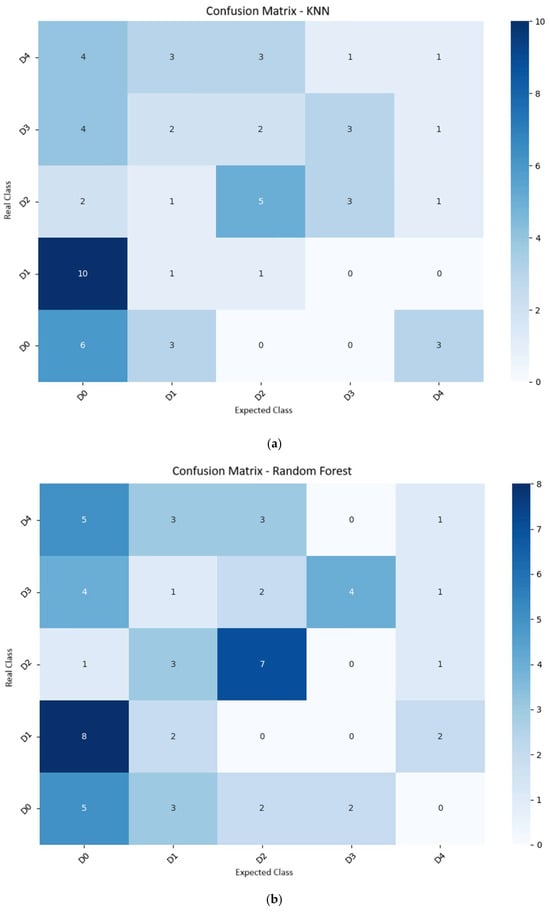
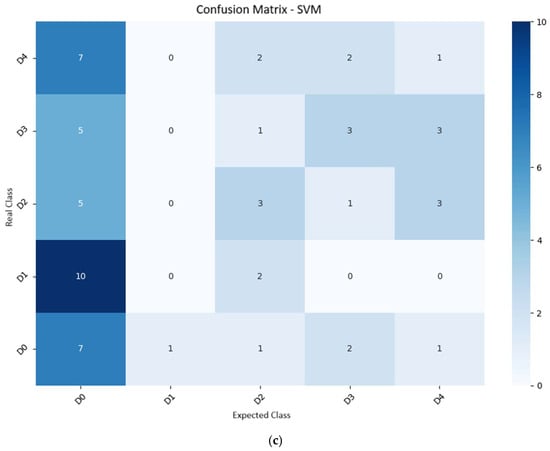
Figure 3.
Confusion matrices from the N experiment at the V4 stage, comparing the predictive performance of KNN (a), Random Forest (b), and SVM (c) models.
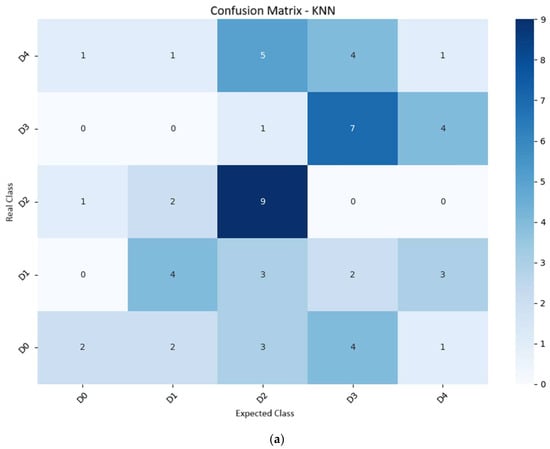
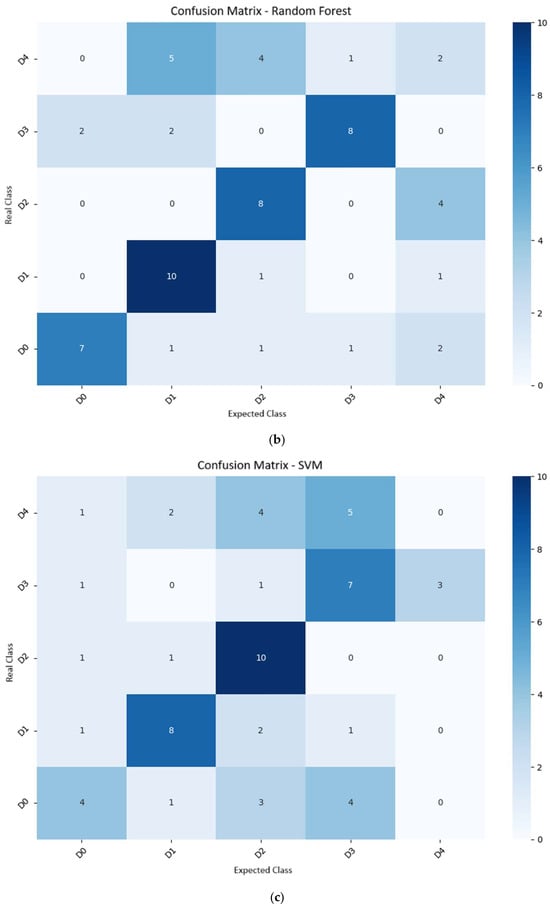
Figure 4.
Confusion matrices from the N experiment at the Flowering stage, comparing the predictive performance of KNN (a), Random Forest (b), and SVM (c) models.
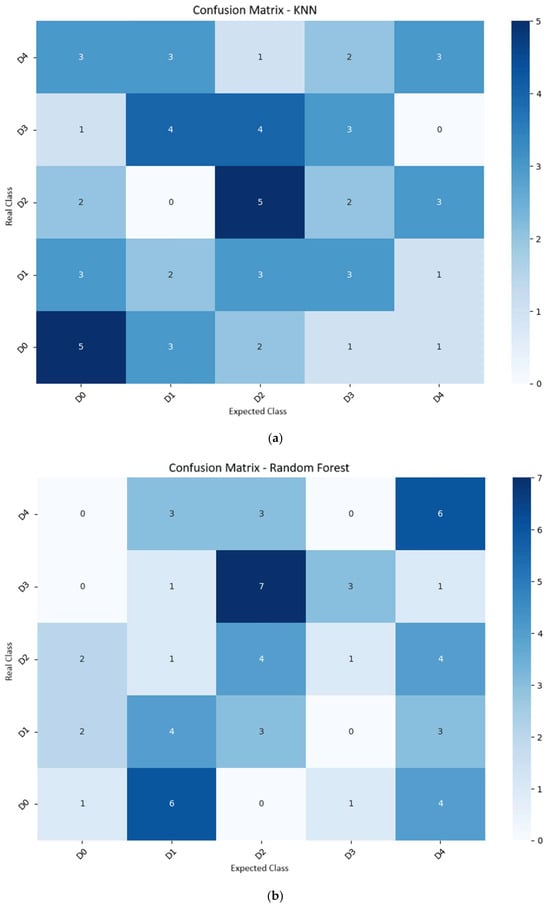
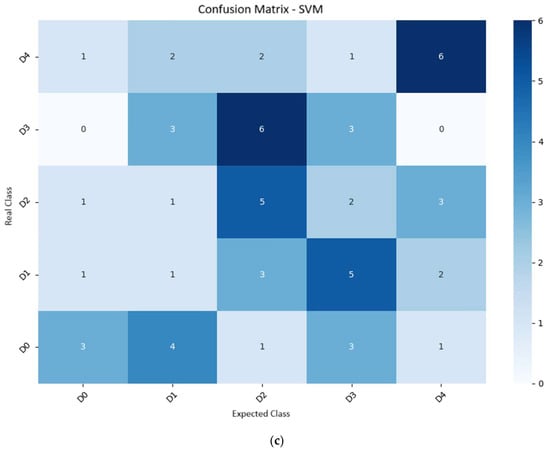
Figure 5.
Confusion matrices from the K experiment at the V4 stage, comparing the predictive performance of KNN (a), Random Forest (b), and SVM (c) models.
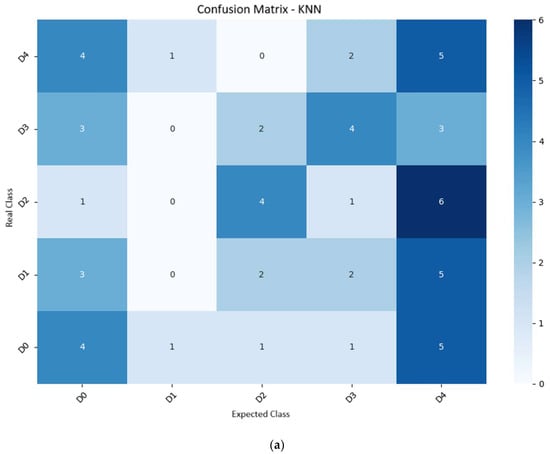
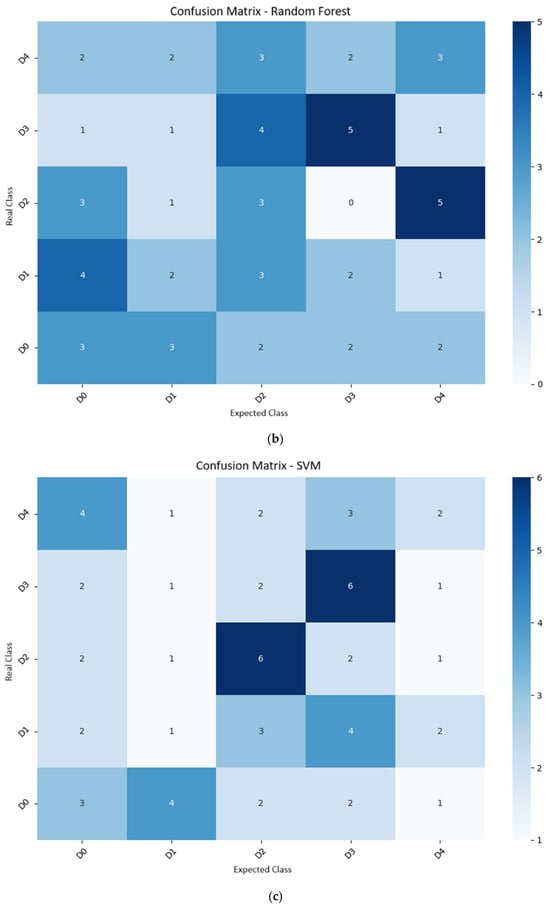
Figure 6.
Confusion matrices from the K experiment at the flowering stage, comparing the predictive performance of KNN (a), Random Forest (b), and SVM (c) models.
3.2. Performance of Classification Models for Nitrogen (N)
According to the detailed data in Table 4, the models’ performance in the V4 phase of crop development, although initial, revealed the algorithms’ discriminatory potential. The KNN model, for example, achieved an accuracy of 26.7% and an F1-score of 25.4%. Despite this being an initial phase where the phenotypic manifestation of nutritional deficiency symptoms is incipient or non-discriminatory, Random Forest demonstrated promising performance, presenting the best results among the three models, with an accuracy of 31.7% and an F1-score of 31.1%. This superior performance of Random Forest in the V4 phase suggests greater pattern extraction capacity and robustness to noise, indicating its potential for detecting subtle phenotypic manifestations, even in the early stages of nutritional deficiency. However, a deeper analysis reveals that the Convolutional Neural Network (CNN) achieved a significantly superior performance, with an accuracy of 76% and an F1-score of 74.33% at this stage, highlighting its superior ability to capture subtle visual patterns from the images. This superiority stems from the CNN’s ability to learn not just color and texture, but also spatial patterns, such as the characteristic yellowing gradient that begins in the older leaves, a classic symptom of N deficiency, even when it is too subtle for other models to detect [7].

Table 4.
Performance of Classification Models with Nitrogen (N).
The significant and encouraging improvement in the performance of all models in the Flowering stage compared to the V4 stage is noteworthy, as evidenced in Table 4. KNN achieved an accuracy of 38.3% and an F1-score of 35.1%, demonstrating an increasing ability to distinguish between classes as visual symptoms become more evident and pronounced. Similar results have been reported in other crops, such as in the study by [8], which evaluated the use of neural networks in predicting nitrogen nutritional status in strawberry plants. The authors observed that the CNN-based architecture was able to identify subtle visual patterns related to nitrogen nutrition, outperforming conventional approaches and demonstrating high predictive accuracy. This convergence of results across different species reinforces the robustness of CNNs as a tool for nutritional diagnosis based on RGB images, corroborating the superior performance observed in this study for sorghum.
SVM showed a considerably improved performance in the flowering stage, with an accuracy of 48.3% and an F1-score of 43.5%, corroborating the premise that the more pronounced visual symptoms at this stage facilitate class separation and model learning. This significant leap in performance also suggests that hyperparameter tuning, including kernel selection, is especially critical in early stages like V4, where high class overlap demands more complex decision boundaries to effectively discriminate between nutrient levels. However, the CNN model surpassed all traditional approaches, achieving an outstanding accuracy of 87% and an F1-score of 87.97% for nitrogen classification at the flowering stage. This significant leap in performance reinforces the ability of deep learning models to effectively capture complex discriminative patterns related to different nitrogen doses, indicating its suitability for practical applications and its feasibility in the development of automated diagnostic systems based on RGB images for nitrogen management in sorghum.
3.3. Performance of Classification Models for Potassium (K)
In phase V4 (Table 5), the KNN, SVM, and Random Forest models showed similar initial performance, with an accuracy of 30% for all models and similar F1 scores (29.7% for KNN, 29.9% for SVM, and 28.9% for Random Forest). Although SVM demonstrated a slight advantage in accuracy (32.0%), the overall performance indicates a uniform ability to begin capturing visual patterns of potassium doses at this early stage. The Convolutional Neural Network (CNN), however, showed a superior initial performance at this stage, achieving an accuracy of 45% and an F1-score of 43%.

Table 5.
Performance of Classification Models with Potassium (K).
The fact that Random Forest, a model recognized as robust and effective in modeling non-linear relationships, performed similarly to the others at this stage suggests that visual manifestations are incipient, but that there is significant potential to be explored with methodological improvements and the acquisition of more expressive datasets. Reference [19] highlights the superior performance of Random Forest in leaf classifications, even in RGB images with high overlap between classes.
At the flowering stage, although the results for potassium remained at levels that suggest the need for improvement, with accuracies of 28.3% (KNN), 30.0% (SVM), and 26.7% (Random Forest), it is important to note that each model contributed to understanding the complexity of visual detection of K deficiencies. The CNN model, in turn, demonstrated a more pronounced improvement, achieving a significant increase in accuracy to 55% and an F1-score of 52%. The SVM, for example, maintained a slightly superior performance, with an F1-score of 28.2%, indicating that, even with the challenges inherent in the variability of potassium symptoms and their inconsistency across samples, there is a latent discrimination capacity that can be improved through hyperparameter optimizations and more sophisticated model approaches.
The greater difficulty in classifying potassium deficiency may be directly linked to the visual nature of its symptoms. Unlike the more uniform chlorosis associated with N deficiency, K deficiency typically manifests as necrosis or ‘burns’ on the margins and tips of older leaves. These symptoms can exhibit greater variability in shape, size, and location across different samples, creating visually more complex and ‘noisy’ patterns that challenge even the CNN, particularly with a limited dataset.
According to [13], a recurring challenge in the assertiveness of image analysis models lies in the limitations of databases, which often do not cover all the environmental and phenotypic conditions required for robust training. This restriction on training data variability can compromise the models’ generalization ability. To mitigate this limitation, the application of data augmentation techniques emerges as an effective strategy, allowing the simulation of greater visual diversity and, consequently, the expansion of the training set. Actions such as rotations, brightness changes, and random cropping of images are examples of transformations that significantly contribute to expanding the variability of the dataset, which, in turn, can reduce the risk of overfitting and improve the models’ generalization ability.
Additionally, the image collection method is a critical factor to consider. Although the image acquisition procedures in this study were standardized, the outdoor field environment where the images were acquired is inherently susceptible to uncontrollable variables, such as fluctuations in natural lighting. These environmental factors can introduce unwanted variability into the images, directly interfering with processing performance and model accuracy.
Although this study was developed using an image database considered suitable for the evaluated models, the validation process revealed that the models struggled to achieve higher levels of accuracy in image classification. According to [9], the performance of image analysis models tends to improve proportionally to the increase in the number of images in the database, a particularly relevant aspect for early phenological stages, such as V4, where the visual distinction of symptoms is more subtle. The exclusive use of RGB images may have further limited the models’ discriminatory ability, highlighting the pressing need to incorporate more robust approaches in future studies for a more complete characterization of nutritional stresses. Additionally, the application of feature engineering techniques, such as texture analysis or the extraction of vegetation indices from RGB channels, could increase the distinction between subtle symptoms, improving classification performance in the early stages—an alternative that deserves further investigation.
Specifically, regarding the behavior of nutrients in plants, the displacement of nutrients during periods of deficiency can present a challenge to image analysis. Nitrogen deficiency stress reduces leaf area and photosynthetic rate, as it promotes the remobilization of N from leaves [20]. Behaviors like this can obscure the true classification of models. Therefore, variables related to other traits, such as relative leaf area, in addition to RGB vectors, should be considered in the analysis.
Considering technological advances in image classification, it is crucial to recognize that traditional supervised learning models, such as KNN, SVM, and Random Forest, can have limitations when attempting to capture the more subtle and complex visual patterns present in agricultural images, especially when symptom expressivity is a limiting factor. Contemporary studies have consistently demonstrated that Convolutional Neural Networks (CNNs) offer superior performance in image classification tasks, particularly in scenarios with less expressive visual symptoms, due to their intrinsic ability to learn hierarchical features directly from images.
It is noteworthy that this study was conducted using affordable and widely available tools, such as smartphone cameras and RGB images, which reinforces the practical applicability and potential for democratization of such technologies for field diagnostics. Even under challenging experimental conditions, the CNN model demonstrated a remarkable ability to identify useful patterns, achieving high levels of accuracy that surpass the traditional models and underscoring the potential for incorporating these tools into decision support systems for agricultural management. This can result in significant reductions in operational costs, streamlined field diagnostics, and, consequently, the implementation of faster and more efficient management interventions. Although challenges inherent in validation and symptom expressivity exist, the lessons learned and future directions for the use of more advanced techniques are extremely promising for the continued advancement of precision agriculture.
It is crucial to consider the practical ramifications of low model accuracy at the V4 stage. This assessment point was selected because it is crucial for decisions about topdressing. Consequently, a high rate of classification errors at this stage has direct economic significance. False negatives could lead to uncorrected deficiencies and subsequent loss of productivity, while false positives could result in unnecessary fertilizer expenditures and increased environmental risk. Therefore, while the traditional models demonstrate potential, their current accuracy level at the V4 stage is insufficient for implementation, a limitation that is addressed by the superior performance of the CNN model.
4. Conclusions
This study successfully demonstrated that a deep learning approach using a Convolutional Neural Network (CNN) is a highly effective tool for classifying nitrogen (N) deficiency in sorghum from RGB images, significantly outperforming traditional machine learning models (KNN, SVM, and Random Forest). The CNN achieved high accuracy for nitrogen classification at both the flowering stage (87%) and, crucially, at the early V4 stage (76%), where symptoms are subtle and visual diagnosis is most critical for management interventions.
In contrast, the traditional models proved insufficient for reliable early diagnosis, with accuracies below 40% at the V4 stage. While their performance improved at flowering, the best traditional model, Random Forest, reached only 58.3% accuracy for nitrogen—a result decisively surpassed by the CNN. This finding highlights the limitations of conventional machine learning in handling the complex patterns of early-stage nutrient deficiencies and confirms that deep learning is a superior strategy for this diagnostic challenge. Potassium (K) classification proved more challenging for all models, though the CNN again demonstrated a substantial advantage, achieving 55% accuracy.
These results validate the use of low-cost RGB images combined with deep learning as a powerful and practical pathway for developing accurate diagnostic tools. Future work should focus on expanding the training dataset and exploring the integration of multispectral data and data augmentation techniques to further increase the robustness and generalizability of the models, contributing to the advancement of precision agriculture for sorghum management.
Author Contributions
Conceptualization, G.A.M. and M.M.B.; methodology, G.A.M., F.d.F.d.S.D. and A.R.B.T.; software, G.A.M. and A.R.B.T.; validation, M.M.B., F.d.F.d.S.D. and A.R.B.T.; formal analysis, G.A.M. and M.M.B.; investigation, G.A.M., C.E.N.R. and M.d.L.L.; resources, G.A.M., F.d.F.d.S.D. and M.M.B.; data curation, J.R.R. and M.M.B.; writing—original draft preparation, G.A.M.; writing—review and editing, M.M.B. and J.R.R.; supervision, M.M.B.; project administration, G.A.M.; funding acquisition, M.M.B. All authors have read and agreed to the published version of the manuscript.
Funding
This research was funded by the Luiz de Queiroz Agricultural Studies Foundation (Fundação de Estudos Agrários Luiz de Queiroz—FEALQ).
Data Availability Statement
The raw data supporting the conclusions of this article will be made available by the authors on request.
Acknowledgments
The authors would like to thank the Fundação de Estudos Agrários Luiz de Queiroz—Fealq for the financial support for the publication of this article.
Conflicts of Interest
The authors declare no conflicts of interest.
Abbreviations
The following abbreviations are used in this manuscript:
| RGB | Red, Green, and Blue |
| KNN | K-Nearest Neighbors |
| SVM | Support Vector Machine |
| RF | Random Forest |
| N | Nitrogen |
| K | Potassium |
| DAE | Days after emergence |
| V4 | Fourth Fully Expanded Leaf |
| CNN | Convolutional Neural Networks |
| LAMAP | Agricultural Machinery and Precision Agriculture Laboratory |
| FZEA/USP | School of Animal Science and Food Engineering of the University of São Paulo |
| USDA | United States Department of Agriculture |
| CEC | Cation Exchange Capacity |
References
- Havlin, J.L.; Beaton, J.D.; Tisdale, S.L.; Nelson, W.L. Soil Fertility and Fertilizers: An Introduction to Nutrient Management, 7th ed.; Pearson Education: Upper Saddle River, NJ, USA, 2005; p. 515. [Google Scholar]
- Mwamahonje, A.; Mdindikasi, Z.; Mchau, D.; Mwenda, E.; Sanga, D.; Garcia-Oliveira, A.L.; Ojiewo, C.O. Advances in Sorghum Improvement for Climate Resilience in the Global Arid and Semi-Arid Tropics: A Review. Agronomy 2024, 14, 3025. [Google Scholar] [CrossRef]
- Marschner, H. Mineral Nutrition of Higher Plants, 3rd ed.; Academic Press: London, UK, 2012; p. 651. [Google Scholar]
- Stagnati, L.; Busconi, M.; Soffritti, G.; Martino, M.; Lanubile, A.; Marocco, A. Molecular And Phenotypic Characterization of A Collection of White Grain Sorghum [Sorghum bicolor (L.) Moench] For Temperate Climates. Genet. Resour. Crop Evol. 2021, 68, 2931–2942. [Google Scholar] [CrossRef]
- Madhavi, B.G.K.; Basak, J.K.; Paudel, B.; Kim, N.E.; Choi, G.M.; Kim, H.T. Prediction of Strawberry Leaf Color Using RGB MeanValues Based on Soil Physicochemical Parameters Using Machine Learning Models. Agronomy 2022, 12, 981. [Google Scholar] [CrossRef]
- Leigh, R.A.; Wyn Jones, R.G. A Hypothesis Relating Critical Potassium Concentrations for Growth to the Distribution and Functions of This Ion in the Plant Cell. New Phytol. 1984, 97, 1–13. [Google Scholar] [CrossRef]
- Liang, J.; Ren, W.; Liu, X.; Zha, H.; Wu, X.; He, C.; Sun, J.; Zhu, M.; Mi, G.; Chen, F.; et al. Improving Nitrogen Status Diagnosis and Recommendation of Maize Using UAV Remote Sensing Data. Agronomy 2023, 13, 1994. [Google Scholar] [CrossRef]
- Peng, Y.; He, M.; Zheng, Z.; He, Y. Enhanced Neural Network for Rapid Identification of Crop Water and Nitrogen Content Using Multispectral Imaging. Agronomy 2023, 13, 2464. [Google Scholar] [CrossRef]
- Barbedo, J.G.A. Detection of Nutrition Deficiencies in Plants Using Proximal Images and Machine Learning: A Review. Comput. Electron. Agric. 2019, 162, 482–492. [Google Scholar] [CrossRef]
- Sokolova, M.; Lapalme, G. A Systematic Analysis of Performance Measures for Classification Tasks. Inf. Process. Manag. 2009, 45, 427–437. [Google Scholar] [CrossRef]
- Kok, Z.H.; Shariff, A.R.M.; Alfatni, M.S.M.; Khairunniza-Bejo, S. Support Vector Machine in Precision Agriculture: A Review. Comput. Electron. Agric. 2021, 191, 106546. [Google Scholar] [CrossRef]
- Benos, L.; Tagarakis, A.C.; Dolias, G.; Berruto, R.; Kateris, D.; Bochtis, D. Machine Learning in Agriculture: A Comprehensive Updated Review. Sensors 2021, 21, 3758. [Google Scholar] [CrossRef] [PubMed]
- Bertolini, C.A. Desenvolvimento de Software para Extração de Índices de Vegetação e Implementação de Classificador de Status Nutricional em Nitrogênio em Pastos de Urochloa decumbens ‘Basilisk’ (Syn. Brachiaria decumbens ‘Basilisk’). Master’s Thesis, Universidade de São Paulo, São Paulo, Brazil, 2022. [Google Scholar]
- Golzarian, M.R.; Frick, R.A. Classification of images of wheat, ryegrass, and brome grass species at early growth stages using principal component analysis. Plant Methods 2011, 7, 28. [Google Scholar] [CrossRef] [PubMed]
- Cantarella, H.; Mattos, D., Jr.; Boaretto, R.M.; Quaggio, J.A.; Van Raij, B. (Eds.) Boletim 100: Recomendações de Adubação e Calagem Para o Estado de São Paulo; Instituto Agronômico de Campinas (IAC): Campinas, Brazil, 2022. [Google Scholar]
- Koyama, K. Leaf Area Estimation by Photographing Leaves Sandwiched between Transparent Clear File Folder Sheets. Horticulturae 2023, 9, 709. [Google Scholar] [CrossRef]
- Goodfellow, I.; Bengio, Y.; Courville, A. Deep Learning; MIT Press: Cambridge, MA, USA, 2016; p. 775. [Google Scholar]
- Géron, A. Hands-on Machine Learning with Scikit-Learn, Keras, and TensorFlow: Concepts, Tools, and Techniques to Build Intelligent Systems, 2nd ed.; O’Reilly Media: Sebastopol, CA, USA, 2019; p. 819. [Google Scholar]
- Pathak, H.; Igathinathane, C.; Howatt, K.; Zhang, Z. Machine Learning and Handcrafted Image Processing Methods for Classifying Common Weeds in Corn Fields. Smart Agric. Technol. 2023, 5, 100249. [Google Scholar] [CrossRef]
- Guo, S.; Arshad, A.; Yang, L.; Qin, Y.; Mu, X.; Mi, G. Comparative transcriptome analysis reveals common and developmental stage-specific genes that respond to low nitrogen in maize leaves. Plants 2022, 11, 1550. [Google Scholar] [CrossRef] [PubMed]
Disclaimer/Publisher’s Note: The statements, opinions and data contained in all publications are solely those of the individual author(s) and contributor(s) and not of MDPI and/or the editor(s). MDPI and/or the editor(s) disclaim responsibility for any injury to people or property resulting from any ideas, methods, instructions or products referred to in the content. |
© 2025 by the authors. Licensee MDPI, Basel, Switzerland. This article is an open access article distributed under the terms and conditions of the Creative Commons Attribution (CC BY) license (https://creativecommons.org/licenses/by/4.0/).