Article

Combining Artificial Intelligence and Remote Sensing to Enhance the Estimation of Peanut Pod Maturity

by
Thiago Caio Moura Oliveira
1,*,
Jarlyson Brunno Costa Souza
1,
Samira Luns Hatum de Almeida
1,*,
Armando Lopes de Brito Filho
1,
Rafael Henrique de Souza Silva
1,
Franciele Morlin Carneiro
2 and
Rouverson Pereira da Silva
1
1
Department of Engineering, São Paulo State University (UNESP), Jaboticabal 14884-900, São Paulo, Brazil
2
Department of Agriculture, Federal Technological University of Paraná (UTFPR), Santa Helena 85892-000, Paraná, Brazil
*
Authors to whom correspondence should be addressed.
AgriEngineering 2025, 7(11), 368; https://doi.org/10.3390/agriengineering7110368
Submission received: 7 September 2025 / Revised: 24 October 2025 / Accepted: 29 October 2025 / Published: 3 November 2025

Abstract

The mechanized harvesting of peanut crops results in both visible and invisible losses. Therefore, monitoring and accurately determining pod maturation are essential to minimizing such losses. The objectives of this study were to (i) identify the most relevant variables for estimating peanut pod maturation and (ii) estimate two maturation indices (brown and black classes; orange, brown, and black classes) using Remote Sensing (RS) and Artificial Neural Networks (ANN), while assessing the generalization potential of the models across different areas. The experiment was carried out in two commercial peanut fields in the state of São Paulo, Brazil, during the 2021/2022 and 2022/2023 growing seasons, using the IAC 503 cultivar. Data collection began one month before the expected harvest date, with weekly intervals. Spectral variables and vegetation indices were obtained from orbital remote sensing (PlanetScope), while climatic data were retrieved from NASA POWER. For analysis, two ANN architectures were employed: Multilayer Perceptron (MLP) and Radial Basis Function (RBF). The dataset from the Cândido Rodrigues site was split into 80% for training and 20% for testing. The model was then evaluated and generalized using data from the Guariba site. Variable selection involved filtering via Principal Component Analysis (PCA) followed by the Stepwise method. Both models demonstrated high accuracy (R2 ≥ 0.90; MAE between 0.06 and 0.07). Generalization tests yielded promising results (R2 between 0.59 and 0.64; MAE between 0.13 and 0.17), confirming the robustness of the approach under different conditions.

1. Introduction

Peanut (Arachis hypogaea L.) is cultivated in several countries, with China leading global production, accounting for one-third of the total and responsible for 37% of world output, followed by India with 13% and Nigeria with 9% [1]. Brazil contributes 2% of global production, ranking 11th worldwide [1]. The state of São Paulo stands out as the leading producer in the country, representing 81.27% of national output [1,2]. This prominence is primarily due to the intensive use of peanut cultivation in sugarcane field renovation areas through crop succession. The species enriches the soil with nitrogen via biological fixation and aids in soil decompaction through its taproot system [3,4,5].
Despite these advantages, peanut cultivation faces challenges in pod development due to adverse climatic conditions, extreme temperatures, heat stress, and pod moisture content, which directly affect the determination of the optimal harvest point and may lead to yield losses [6,7]. Moreover, the crop’s indeterminate growth habit results in high variability in pod maturity within the same plant, which is considered one of the main limiting factors in peanut production [8].
In peanut-growing areas, harvesting takes place in two stages: digging and windrowing, followed by threshing [9]. Digging begins when pods reach approximately 70–75% maturity [10]. Maturity assessment is based on mesocarp observation, which changes in color and texture over time [11]. Harvesting too early or too late can cause significant losses, reducing yield and quality. This is primarily due to the resistance of the gynophore, a factor strongly influencing losses during mechanized harvesting [12,13]. Gynophore resistance varies depending on soil moisture content, flowering period, and the time pods remain in the soil [13,14]. Given the crop’s indeterminate growth habit, accurately evaluating pod maturity is essential for determining the optimal harvest time [15].
To address the uncertainty in maturity assessment, various methods have been proposed. The most widely adopted approach, described by [16], relates pod maturity to mesocarp color, using a visual classification chart. This method categorizes pods into developmental stages based on mesocarp color white, yellow, orange, brown, and black. In this study, two maturity indices were used, following a method originally designed for U.S. cultivars, which generally have longer growth cycles than Brazilian cultivars. The first color represents the most immature pods, whereas the last indicates full maturity [17]. However, this procedure is labor-intensive and subjective, as it depends heavily on the evaluator’s experience [18].
To reduce subjectivity and improve efficiency, researchers have increasingly applied geotechnologies to determine the ideal peanut maturity stage. Among these, remote sensing (RS) whether orbital, aerial, or ground-based has emerged as a promising alternative for estimating pod maturity, offering greater objectivity and precision in defining harvest timing [8,19].
Integrating RS with artificial neural networks (ANNs) for peanut maturity estimation has gained widespread adoption. Due to the crop’s indeterminate growth habit, pinpointing the optimal harvest date remains challenging, requiring methods that reduce the subjectivity inherent in the [16] classification while enabling non-destructive assessments. Monitoring peanut maturity through orbital and Remotely Piloted Aircraft(RPA), combined with ANN models, has shown to be an effective approach for predicting maturity [20,21] further demonstrated the efficiency of ANNs in estimating maturity regardless of available water conditions. Although imagery from RPA offers a non-destructive alternative with high spatial resolution, in this study we elected to use satellite data (PlanetScope) for three reasons: (i) in peanut time series, satellite imagery exhibits lower temporal variability in spectral signals and reduced saturation of vegetation indices compared with RPA products [20]; (ii) PlanetScope provides daily revisit, facilitating alignment with field dates and ensuring multi-area/multi-date coverage without the logistics of flight operations; and (iii) the literature reports comparable accuracy between satellite-based and RPA-based models for estimating the PMI, such that satellites offer greater scalability and operational reproducibility without a meaningful loss of performance [19,20].
This technological advancement highlights the potential of ANNs as robust tools for assessing peanut maturity under varying agricultural environments. Additionally, it enables the application of trained and validated models to new production areas.
Therefore, we hypothesize that combining remote sensing and artificial neural networks will enable the estimation of two peanut maturity indices and the selection of the most promising variables for developing future predictive models of pod maturity. The specific objectives of this study were to (i) identify and select the most relevant variables for estimating peanut maturity and (ii) estimate two peanut maturity indices using RS and ANNs, assessing their potential for generalization to other areas, thereby demonstrating the applicability of the developed models in commercial production fields.

2. Materials and Methods

2.1. Experimental Area

The experiment was conducted in two commercial peanut fields located in the municipalities of Cândido Rodrigues (Area 1) and Guariba (Area 2) in the state of São Paulo, Brazil (Figure 1), during the 2022/2023 and 2021/2022 growing seasons, respectively. Sowing occurred on 25 October 2022, in Area 1 and on 12 October 2021, in Area 2. Each field covered approximately nine hectares and was planted with the IAC 503 cultivar, one of the most widely cultivated in São Paulo, with a growth cycle of 150 days. According to the Köppen climate classification, both areas are characterized by a tropical savanna climate (Aw), with a dry winter season and a wet summer season 0% cloud cover over the study area [22]. The soils in both sites are predominantly sandy, with good aeration, drainage, and depth [6].

2.2. Field Data Acquisition

In Area 1, forty sampling points were established, spaced 50 m apart. Data collection at each sampling point began 122 days after sowing (DAS) and continued at approximately seven-day intervals until 150 DAS, totaling five evaluations (122, 129, 136, 144, and 150 DAS). At each point, eight plants were sampled within a 16 m2 area. Between 150 and 250 pods were collected per sampling, excluding malformed pods. In Area 2, thirty sampling points were selected, following the same DAS schedule as Area 1. The pods were collected following the same protocol used in Area 1.
Peanut pod maturity was determined using the Peanut Maturity Index (PMI) as described by [17], which employs the hull-scrape method. This method involves removing the pod exocarp through high-pressure washing to expose the mesocarp, enabling visual classification of pods according to the peanut maturity scale proposed by [16] (Figure 2).
To calculate the Peanut Maturity Index (PMI), we followed the methodology proposed by [17], in which the sum of pods in the brown and black classes (PMI_BB) is divided by the total number of pods (Equation (1)). Additionally, due to the difficulty in achieving these PMI values for cultivars commonly grown in Brazil, the sum of pods in the orange, brown, and black classes (PMI_OB) was also considered, as proposed by [10] (Equation (2)). The PMI ranges from 0 to 1, with values between 0.70 and 0.75 indicating the optimal harvest time.
PMI _ BB = ( B + BL ) ( W + Y 1 + Y 2 + O + B + BL )
PMI _ OB = ( O + B + BL ) ( W + Y 1 + Y 2 + O + B + BL )
where
W = number of white pods;
Y1 = number of light yellow pods;
Y2 = number of dark yellow pods;
O = number of orange pods;
B = number of brown pods;
BL = number of black pods.

2.3. Acquisition of Orbital Images

To investigate the relationship between peanut maturity traits and the spectral reflectance of the plant canopy over time, we used orbital imagery from the PlanetScope CubeSat constellation [23]. This constellation, consisting of approximately 130 satellites, is capable of capturing daily images of the entire Earth’s surface, with a spatial resolution of 3 m and a radiometric resolution of 12 bits. The images contain eight spectral bands, of which seven were used in this study for the calculation of vegetation indices (Table 1).
The correction of orbital images was performed using the PlanetScope surface reflectance product, which provides an advanced solution ensuring greater consistency in spectral analyses under varying atmospheric conditions. This product applies corrections to remove top-of-atmosphere reflectance influences, using specific coefficients and lookup tables based on the 6SV2.1 radiative transfer code [23]. This procedure minimizes radiometric uncertainties and spatiotemporal variations that could affect the interpretation of spectrally derived data. The images were downloaded in 16-bit GeoTIFF format and scaled to represent reflectance values up to 10,000, allowing for direct comparison and subsequent analysis [23].
Spectral reflectance analysis, as well as vegetation and topographic index calculations, were performed using QGIS software (version 3.16), developed by the QGIS Development Team and maintained by the Open Source Geospatial Foundation, Chicago, Illinois, USA. This software enabled the extraction of reflectance data from multiple bands and the processing of the indices required for the study. We selected five cloud-free PlanetScope scenes (0% cloud cover over the study area) acquired within one day before or after each field date (Table 2). To link pixel information to the field plots, reflectance was extracted within a 3 m radius buffer around each sampling point, ensuring multiple pixels per point and reducing noise geolocation, thereby increasing spatial representativeness. Spectral reflectance was then extracted from this buffer using the zonal statistics tool in QGIS, and the mean reflectance value for each area was calculated. For each field data collection, the spectral variables were temporally aligned using a tolerance window of one day, plus or minus. When imagery was available for the same day, it was used; otherwise, we selected the temporally closest image within the window. In the present dataset, all imaging dates fell within the defined window, with no need for exclusions. All scenes used showed 0% cloud cover over the study area (Table 2).

2.4. Vegetation and Topographic Indices

Nine vegetation indices (VIs) were calculated from the reflectance values obtained from the orbital imagery (Table 3). These indices were selected based on the analyses presented in the studies by [8,20,24], which applied them to peanut crop research. The selection aimed to explore their potential for estimating variability in peanut maturity.
For the topographic indices, the Topographic Position Index (TPI) and the Topographic Wetness Index (TWI) were used. The TPI is a metric employed to identify the topographic setting of a specific point relative to its surroundings. It is calculated using a Digital Elevation Model (DEM) to compare the elevation of a point with the mean elevation of its surrounding area [34] (Equation (3)):
T P I = Z 0 Z ¯
where Z 0 is the central point, and Z ¯ is the mean elevation around that central point.
The TWI is widely applied in hydrological studies to model the spatial distribution of soil moisture and predict potential water accumulation areas. This index is calculated from the relationship between the upslope contributing area, the area from which water flows to a given point and the slope at that point. TWI computation involves taking the natural logarithm of the ratio between the specific catchment area (per unit contour length) and the tangent of the slope angle [35] (Equation (4)):
T W I = ln ( A s tan ( β ) )
where As is the specific catchment area, expressed in square meters per meter (m2/m); β is the slope angle in degrees; and ln denotes the natural logarithm.

2.5. Climatic Variables

Climatic variable data were obtained from the free-access NASA POWER platform [36], which provides daily meteorological information. Previous studies have successfully used this platform to estimate peanut maturity, adding reliability to the present research [20,21,37]. To calculate accumulated degree days (ADD), we used the maximum and minimum temperatures extracted from NASA POWER, along with the lower base temperature for peanut production, which is 13.3 °C (Equation (5)). For incident solar radiation (Qg), the cumulative sum was calculated from the sowing date up to each maturity sampling date. As temperature and radiation vary slowly in space at the field-block scale, we used NASA POWER daily time series (grid of approximately 55 km) to calculate accumulated degree-days (ADD) and accumulated radiation from sowing to each field date. As cumulative metrics, they reduce day-to-day noise and serve as regional-scale climatic indicators, complementing the plot-scale variability captured by satellite reflectance. For each area, the series were extracted at a representative latitude/longitude point near the center of the field block.
ADD = ( T m a x + T m i n ) 2     BT
where Tmax represents the maximum temperature (°C), Tmin the minimum temperature (°C), and BT the base temperature (°C).
We acknowledge the scale mismatch between climatic variables (regional) and field/satellite data (meters). To mitigate representativeness error: (i) series were extracted at a representative lat/long point near the center of the field; (ii) we used 3 m buffers for spectral extraction to ensure multiple pixels per point and reduce geolocation noise; and (iii) we enforced strict temporal pairing between field data and imagery (±1 day, with 0% cloud-cover scenes).

2.6. Data Analysis

We analyzed the variability of the PMI indices (orange, brown, and black classes—PMI_OB; and brown and black classes—PMI_BB) using boxplots to assess data behavior. To examine the relationship between PMI_OB and PMI_BB over time, a linear regression analysis was performed to identify the influence of variables on maturity estimation. In addition, the Shapiro–Wilk test was applied to assess data normality. When the p-value exceeded 5%, the data were considered normally distributed [38]. The dataset was filtered using Principal Component Analysis (PCA), followed by variable selection through the Stepwise method to determine the relative importance of each variable. Finally, two Artificial Neural Network (ANN) architectures were implemented: the Multilayer Perceptron (MLP) and the Radial Basis Function (RBF).

2.7. Input Variables

The input variables for the models included soil texture parameters (percentages of clay, silt, and total sand), seven spectraxl bands (Table 2), nine vegetation indices (Table 3), two topographic indices (TPI and TWI), and two climatic variables (ADD and incident solar radiation). The initial set of 23 variables included indices and bands with strong collinearity and differing scales. To reduce dimensionality and mitigate multicollinearity prior to selection, we adopted PCA as a filtering step. We then applied stepwise selection only to the filtered subset, aiming for a minimal and interpretable set of predictors for the PMIs. This pipeline reduces processing time and computational cost and avoids the instabilities typical of direct selection on collinear datasets, while keeping the model simple and with few variables.

2.7.1. Database Filtering

We standardized the variables, and PCA was applied according to the Kaiser criterion [39], retaining components with eigenvalues greater than one, reducing dimensionality, mitigating collinearity in the initial set, and summarizing the variance. Based on each variable’s contribution to the principal components (loading matrix) and their component plots (biplots), we selected the original variables with the highest and most stable contributions, prioritizing those with clear agronomic interpretation and support in the literature. When two variables conveyed equivalent information, we kept the most representative and discarded the other. The reduced, low-collinearity set was then submitted to stepwise selection to define the final predictors. During PCA screening, the topographic indices (TPI, TWI) and soil texture variables showed low and/or unstable contributions to the principal components and were highly redundant with spectral/climatic information; therefore, they were excluded before stepwise.

2.7.2. Variable Selection Analysis (Stepwise)

On the PCA-filtered set, we applied stepwise selection to obtain a minimal, informative set of inputs, guided by adjusted R2 and MSEP. Choosing stepwise after filtering balances simplicity, interpretability, and computational feasibility in a time-series context with multiple indices, avoiding the cost of exhaustive search over the full space and reducing sensitivity to collinearity.
The Area 1 dataset initially comprised a total of 23 input variables (spectral bands, vegetation indices, topographic indices, climatic data, and soil texture) for estimating both PMIs (PMI_OB and PMI_BB). After data filtering, variable selection was carried out using the Stepwise method, applying the best-subset regression function from the “olsrr” package in R (version 4.1.0) to identify the most relevant variables for PMI estimation.
Multiple linear regression best-subset analysis is a selection approach that evaluates all possible combinations of input variables and identifies those that produce the most accurate and precise maturity estimates. Variable selection was based on the adjusted coefficient of determination (R2) and the mean squared error of prediction (MSEP) (Equations (6) and (7)).
R a d j u s t e d 2 = 1 1 R 2 × n 1 n p 1
where n is the total number of observations, p is the number of predictors in the model, and R2 is the adjusted coefficient of determination.
M S E P = 1 n   | i 1 n ( y i y ¯ i ) 2 |
where y i is the observed value, y ¯ i is the value predicted by the model, and n is the total number of predicted observations.

2.8. Description of Artificial Neural Networks

The data were normalized according to Equation (8) and, subsequently, we employed two architectures commonly used in agriculture: Multilayer Perceptron (MLP) and Radial Basis Function (RBF) [40]. The objective was to estimate the maturity indices (PMI_BB and PMI_OB) from a minimal set of preselected input variables (spectral bands, vegetation indices, and accumulated degree-days-ADD).
y i = X i X min X max X min
where y i is the normalized value, Xi is the input value, and Xmin and Xmax are the minimum and maximum values of the dataset, respectively.
In Area 1, an 80/20 split was adopted for training and validation (n = 200) [41]. Training was performed in Statistica 7 (Intelligent Problem Solver-IPS), with automatic topology search and hyperparameter tuning; for each architecture and output, multiple configurations were evaluated, and model selection was based on adjusted R2 and MAE on the validation set [42]. The final topologies are summarized in Table 4. Generalization was assessed by applying the best validated model of each architecture to Area 2 (independent data), preserving the same input set and the same normalization procedure [43]. This strategy verifies whether the minimal combination of variables sustains performance across areas/years.
After training and validating the models with the Area 1 dataset, ten models of each ANN type were retained. The best validated model selected based on accuracy and precision metrics (R2: adjusted coefficient of determination; MAE: mean absolute error) was then used for testing with the Area 2 dataset.

2.8.1. Multilayer Perceptron (MLP)

The MLP architecture uses a connection structure known as synaptic weights to link its neurons. These weights are essential, as they store the strength of each connection between two neurons. In this study, the activation function from the input layer to the first hidden layer was linear, from the first hidden layer to the second hidden layer was hyperbolic, and from the second hidden layer to the output layer was linear. The output value for each neuron in layer k is determined by the function: zk = g(ak), where g represents the activation function and ak is the synaptic function, defined as a linear combination of the normalized input values and the synaptic weights, as shown in Equation (9).
a k = j y j w k j
where Wkj are the synaptic weights connecting the input values yj to each neuron k.
The activation function used in the neurons of each hidden layer was the hyperbolic function, where “e” is the Euler’s number (Equation (10)).
g ( a k ) = e a k     e a k e a k +   e a k
where e is Euler’s number, and a k are the synaptic functions.

2.8.2. Radial Basis Function (RBF)

The RBF architecture, like the MLP architectures, consists of multiple layers, including a hidden layer. However, unlike MLPs, which frequently use sigmoid activation functions, RBFs employ a specific activation function known as the radial basis function in each neuron of their hidden layer [44]. The most common radial basis function is the Gaussian function (Equation (11)), which adjusts its value based on distance or deviation, increasing or decreasing relative to the central point [45]. In this study, the activation function used in the RBF between the input layer and the hidden layer was the Gaussian function, while the activation function from the hidden layer to the output layer was linear.
        φ = e x p ( v 2 2 σ 2 )
where ν = ||x − µ|| is the Euclidean distance between the input vector and the center µ of the Gaussian function, and σ is its width. The Euclidean distance from the input vector to the center µ serves as the input to the Gaussian function, which outputs the activation value of the radial unit.

2.9. Model Performance

We evaluated performance using adjusted R2 and mean absolute error (MAE) (Equation (12)), visualizing predictions against the 1:1 line. Results are presented separately for validation in Area 1 and generalization in Area 2, highlighting the effect of variable combinations and the transfer across areas/years.
MAE   = 1 n   i   = 1 n ( Y i     Y i ¯   )
where n is the number of data points, Y i is the value of the variable estimated by the network, and Y i ¯   is the observed value of the variable.

2.10. Theoretical Flowchart

To provide a clearer understanding of the methods and steps employed in this research to estimate peanut maturity, a flowchart was developed illustrating each stage of the process (Figure 3).

3. Results

Analysis of the relationship between PMIs over time (Figure 4) revealed a progressive increase in the mean PMI values, indicating that the peanut plants advanced through their development cycle and approached harvest as expected. The PMI_OB showed greater variability at 129 and 136 DAS (Figure 4a), with larger interquartile ranges. This increase in interquartile range, along with the presence of outliers, highlights differences in maturity variability among samples. As time progressed to 136 DAS, both the median and variability increased, reflecting the continuation of the maturation process and the differences among samples over time. After 136 DAS, median values increased more gradually and variability decreased, suggesting that maturation was approaching stabilization. Similarly to PMI_OB, both the median and variability of PMI_BB showed a gradual upward trend. The outliers observed, particularly at 150 DAS (Figure 4a), indicate that although most samples showed maturity progression, some exceptions deviated from the general trend.
In Area 1, one day before harvest, PMI values were mostly between 0.70 and 0.90, indicating that harvest occurred within the optimal maturity period. The linear regression between PMI_OB and PMI_BB (Figure 4b) yielded a high coefficient of determination (0.94). This strong linear correlation suggests that both PMIs can be used independently for monitoring peanut maturation. Furthermore, the adjusted model indicates that increases in PMI_OB are almost proportional to increases in PMI_BB.
To better understand the dataset, PCA was applied for data filtering and dimensionality reduction to effectively estimate PMIs (Figure 5). From the initial 23 input variables, only ten were selected: spectral bands (green, red, NIR); vegetation indices (NDVI, GNDVI, MNLI, SAVI, NLI, NDRE); and the climatic variable ADD. The decision was based on Kaiser’s criterion, whereby only eigenvalues greater than 1 were retained, ensuring that the selected variables had the greatest representativeness in the models. The green, red, and NIR bands, together with indices such as NDVI and GNDVI, showed a strong influence on Principal Component 1 (PC2), being inversely related to maturity, while climatic variables exhibited a strong relationship with PMIs (PC1).
After data filtering, the input variables were reduced to ten: spectral bands (green, red, NIR); vegetation indices (NDVI, GNDVI, MNLI, SAVI, NLI, and NDRE); and the climatic variable ADD. Conversely, the topographic indices (TPI, TWI) and soil texture variables did not meet the PCA retention criteria (low/stable loadings and redundancy) and were thus dropped from subsequent selection. A variable importance analysis was then conducted using the Stepwise method to identify which of these variables were the most effective for estimating the PMIs. The results showed that model accuracy improved as the selected variables were incorporated (Figure 6).
For both PMIs, the adjusted coefficient of determination (R2) showed a notable increase as more variables were included, up to a certain point, optimizing model accuracy while minimizing the Mean Squared Error of Prediction (MSEP). The four best variables for each PMI were selected, as both achieved the highest R2 and lowest MSEP, providing superior accuracy and precision compared with all other combinations. These four variables were chosen to optimize maturity estimation using a reduced set of predictors, since adding more than four variables did not improve model performance. The aim in reducing the number of variables through the applied methods was to lower computational requirements and processing time, thereby increasing the practical applicability of the results. Using all variables would make the process considerably more time-consuming.
Table 5 presents the four best variables selected for maturity estimation, according to the Stepwise importance ranking method.
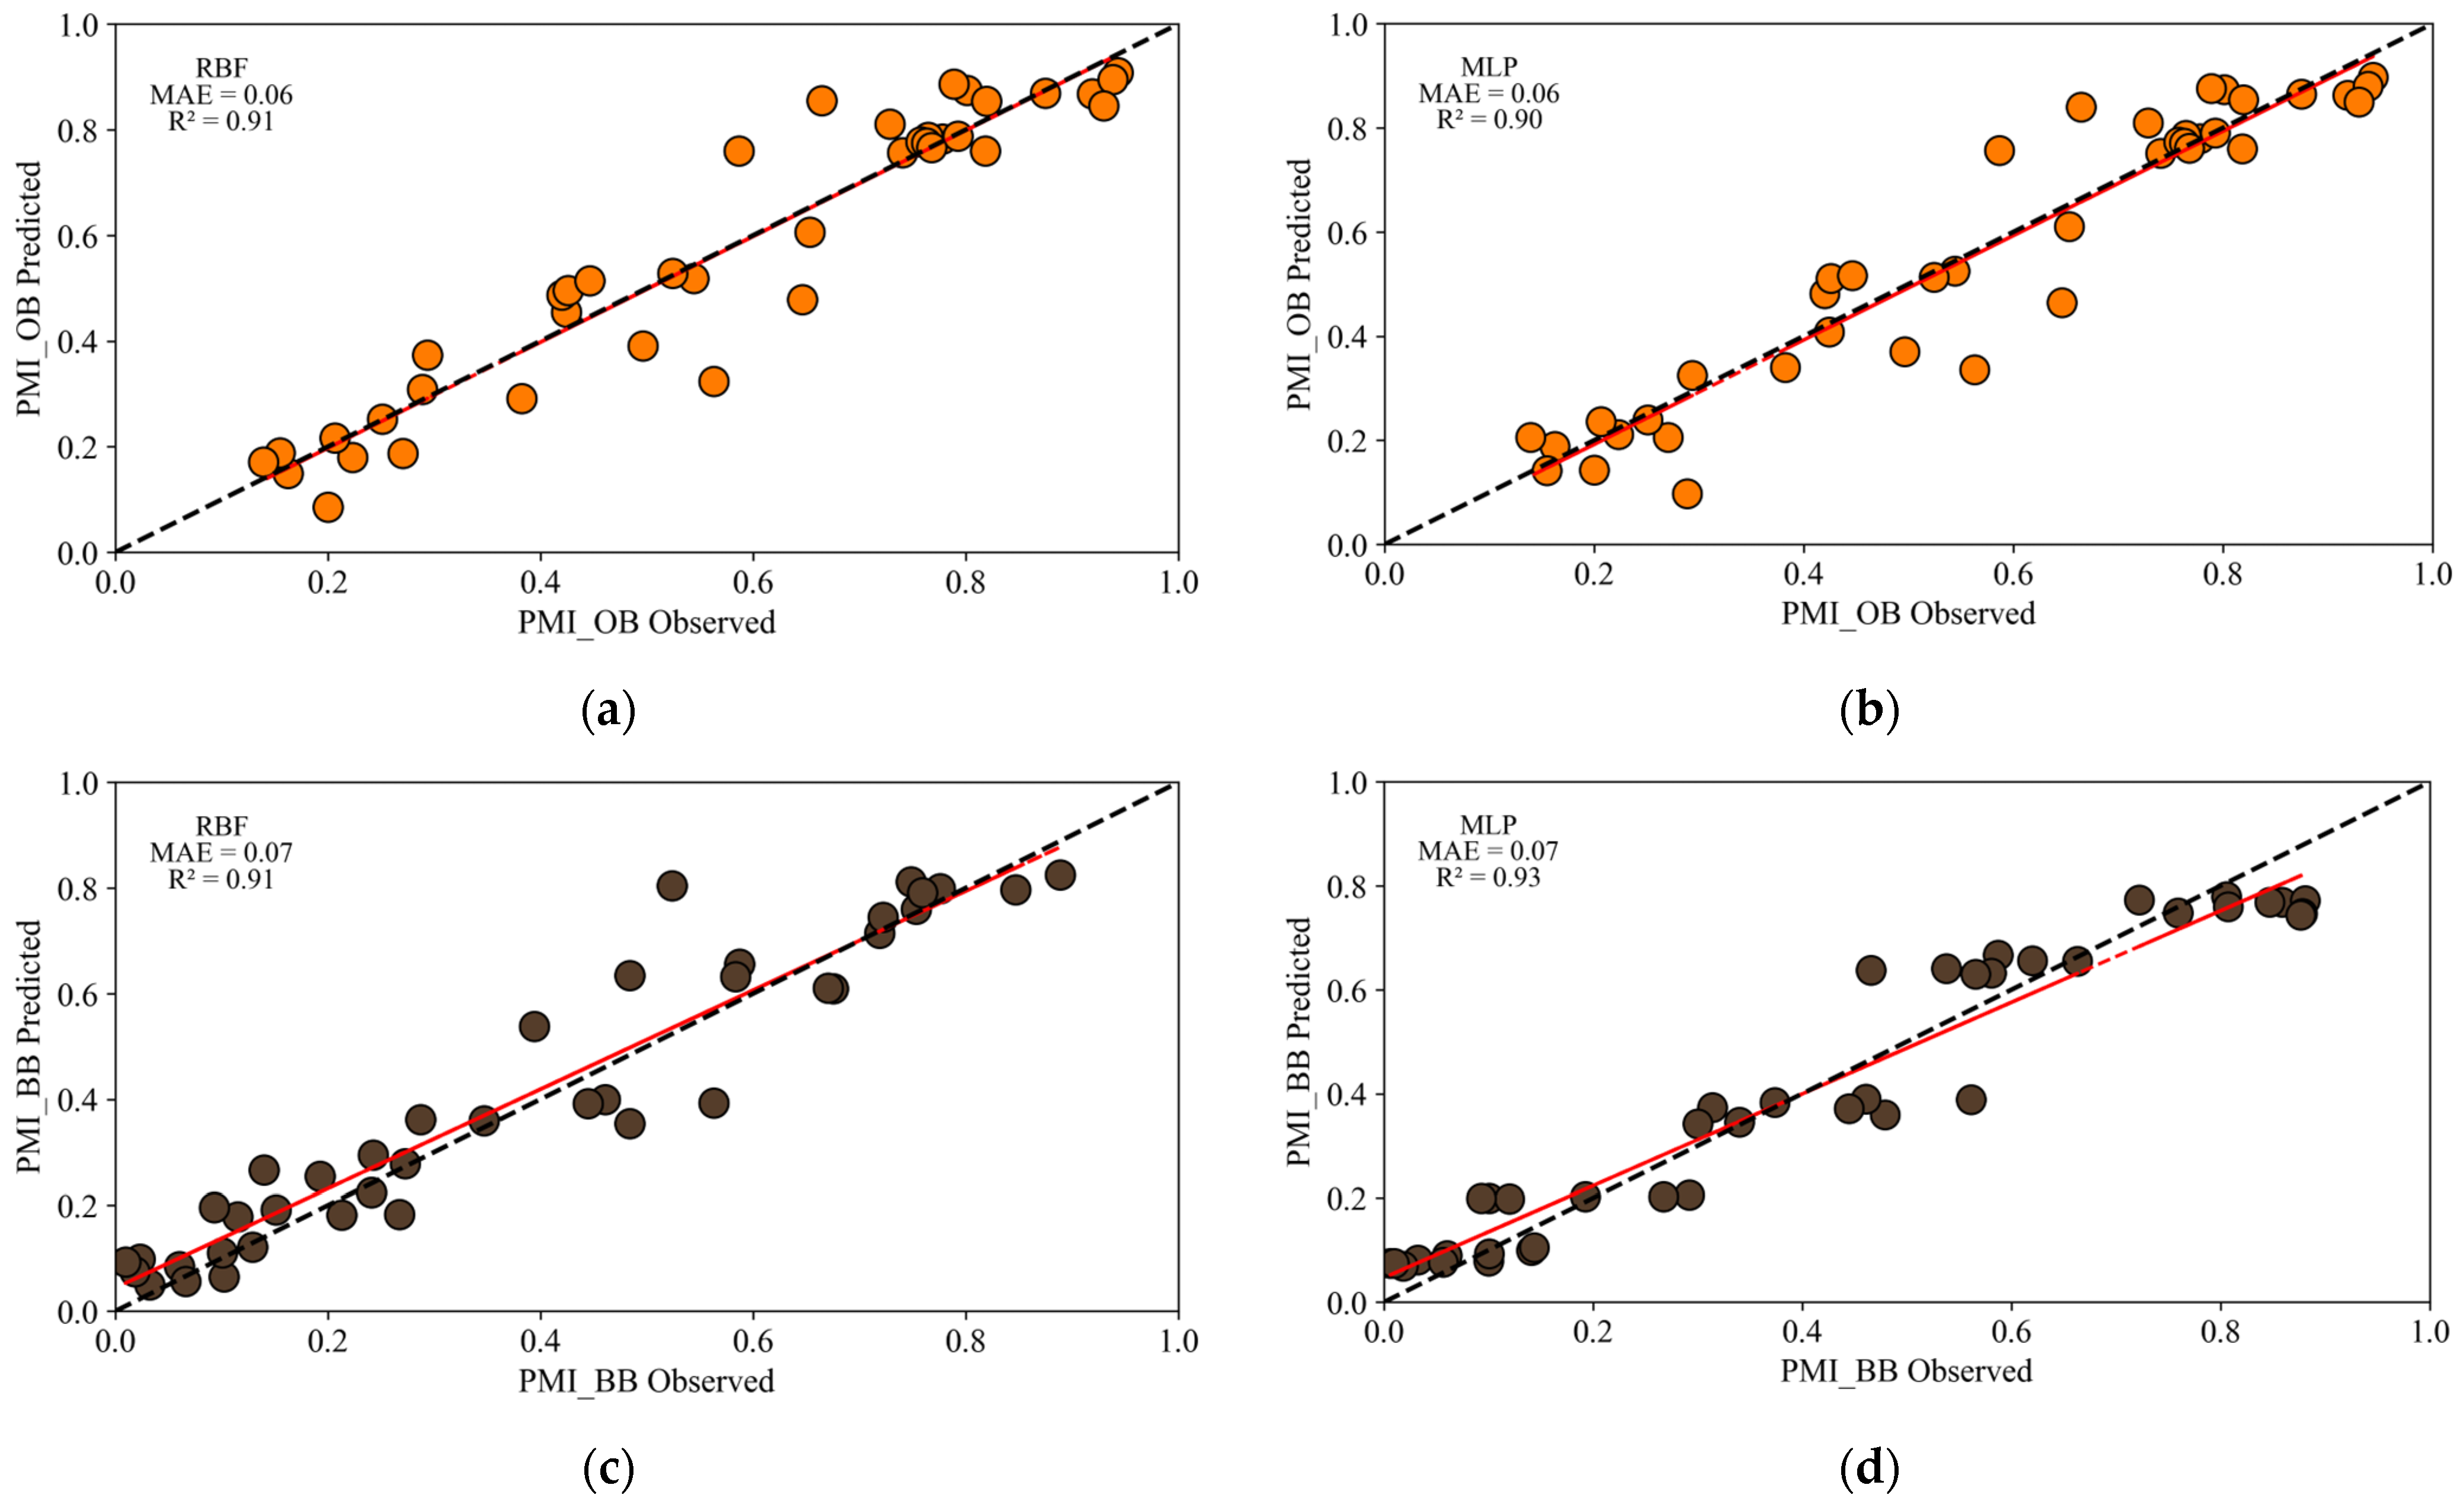
The performance of the models using RBF and MLP architectures demonstrated that both were effective in estimating the PMI_OB (Figure 7a,b) and PMI_BB (Figure 7c,d) maturity indices in Area 1. During the testing period, both precision (R2) and accuracy (MAE) values were within the thresholds considered optimal, with R2 equal to or greater than 0.90 and MAE equal to or less than 0.07, regardless of whether the validated model belonged to the MLP or RBF architecture (Figure 7).
For the PMI_OB class, the results showed that each architecture achieved similar outcomes, with only a 1% difference in precision, indicating outstanding performance for both architectures (Figure 7a,b). For PMI_BB, the results were also comparable in terms of accuracy; however, the MLP architecture demonstrated 2% higher precision compared to the RBF.
Among the architectures and peanut maturity indices, the MLP (Figure 7d) stood out the most for estimating PMI_BB, achieving an R2 of 0.93 and an MAE of 0.07. Nevertheless, the results revealed strong similarity between both architectures, indicating that any of the tested models can effectively predict the PMIs. In terms of the early estimation of peanut maturity, both the RBF and MLP demonstrated adequate precision and accuracy for the PMI_OB class.
The MLP, with its greater fitting capacity and ability to handle more complex data, may be more suitable for scenarios with abundant data availability and a demand for high precision. In contrast, the RBF, with its simpler structure and lower adjustment requirements, can be a more practical option for field use, especially when computational resources are limited. Both architectures provide robust solutions for predicting peanut maturity; however, the MLP may offer a slight advantage in terms of precision, while the RBF provides a more straightforward and easily implementable approach.
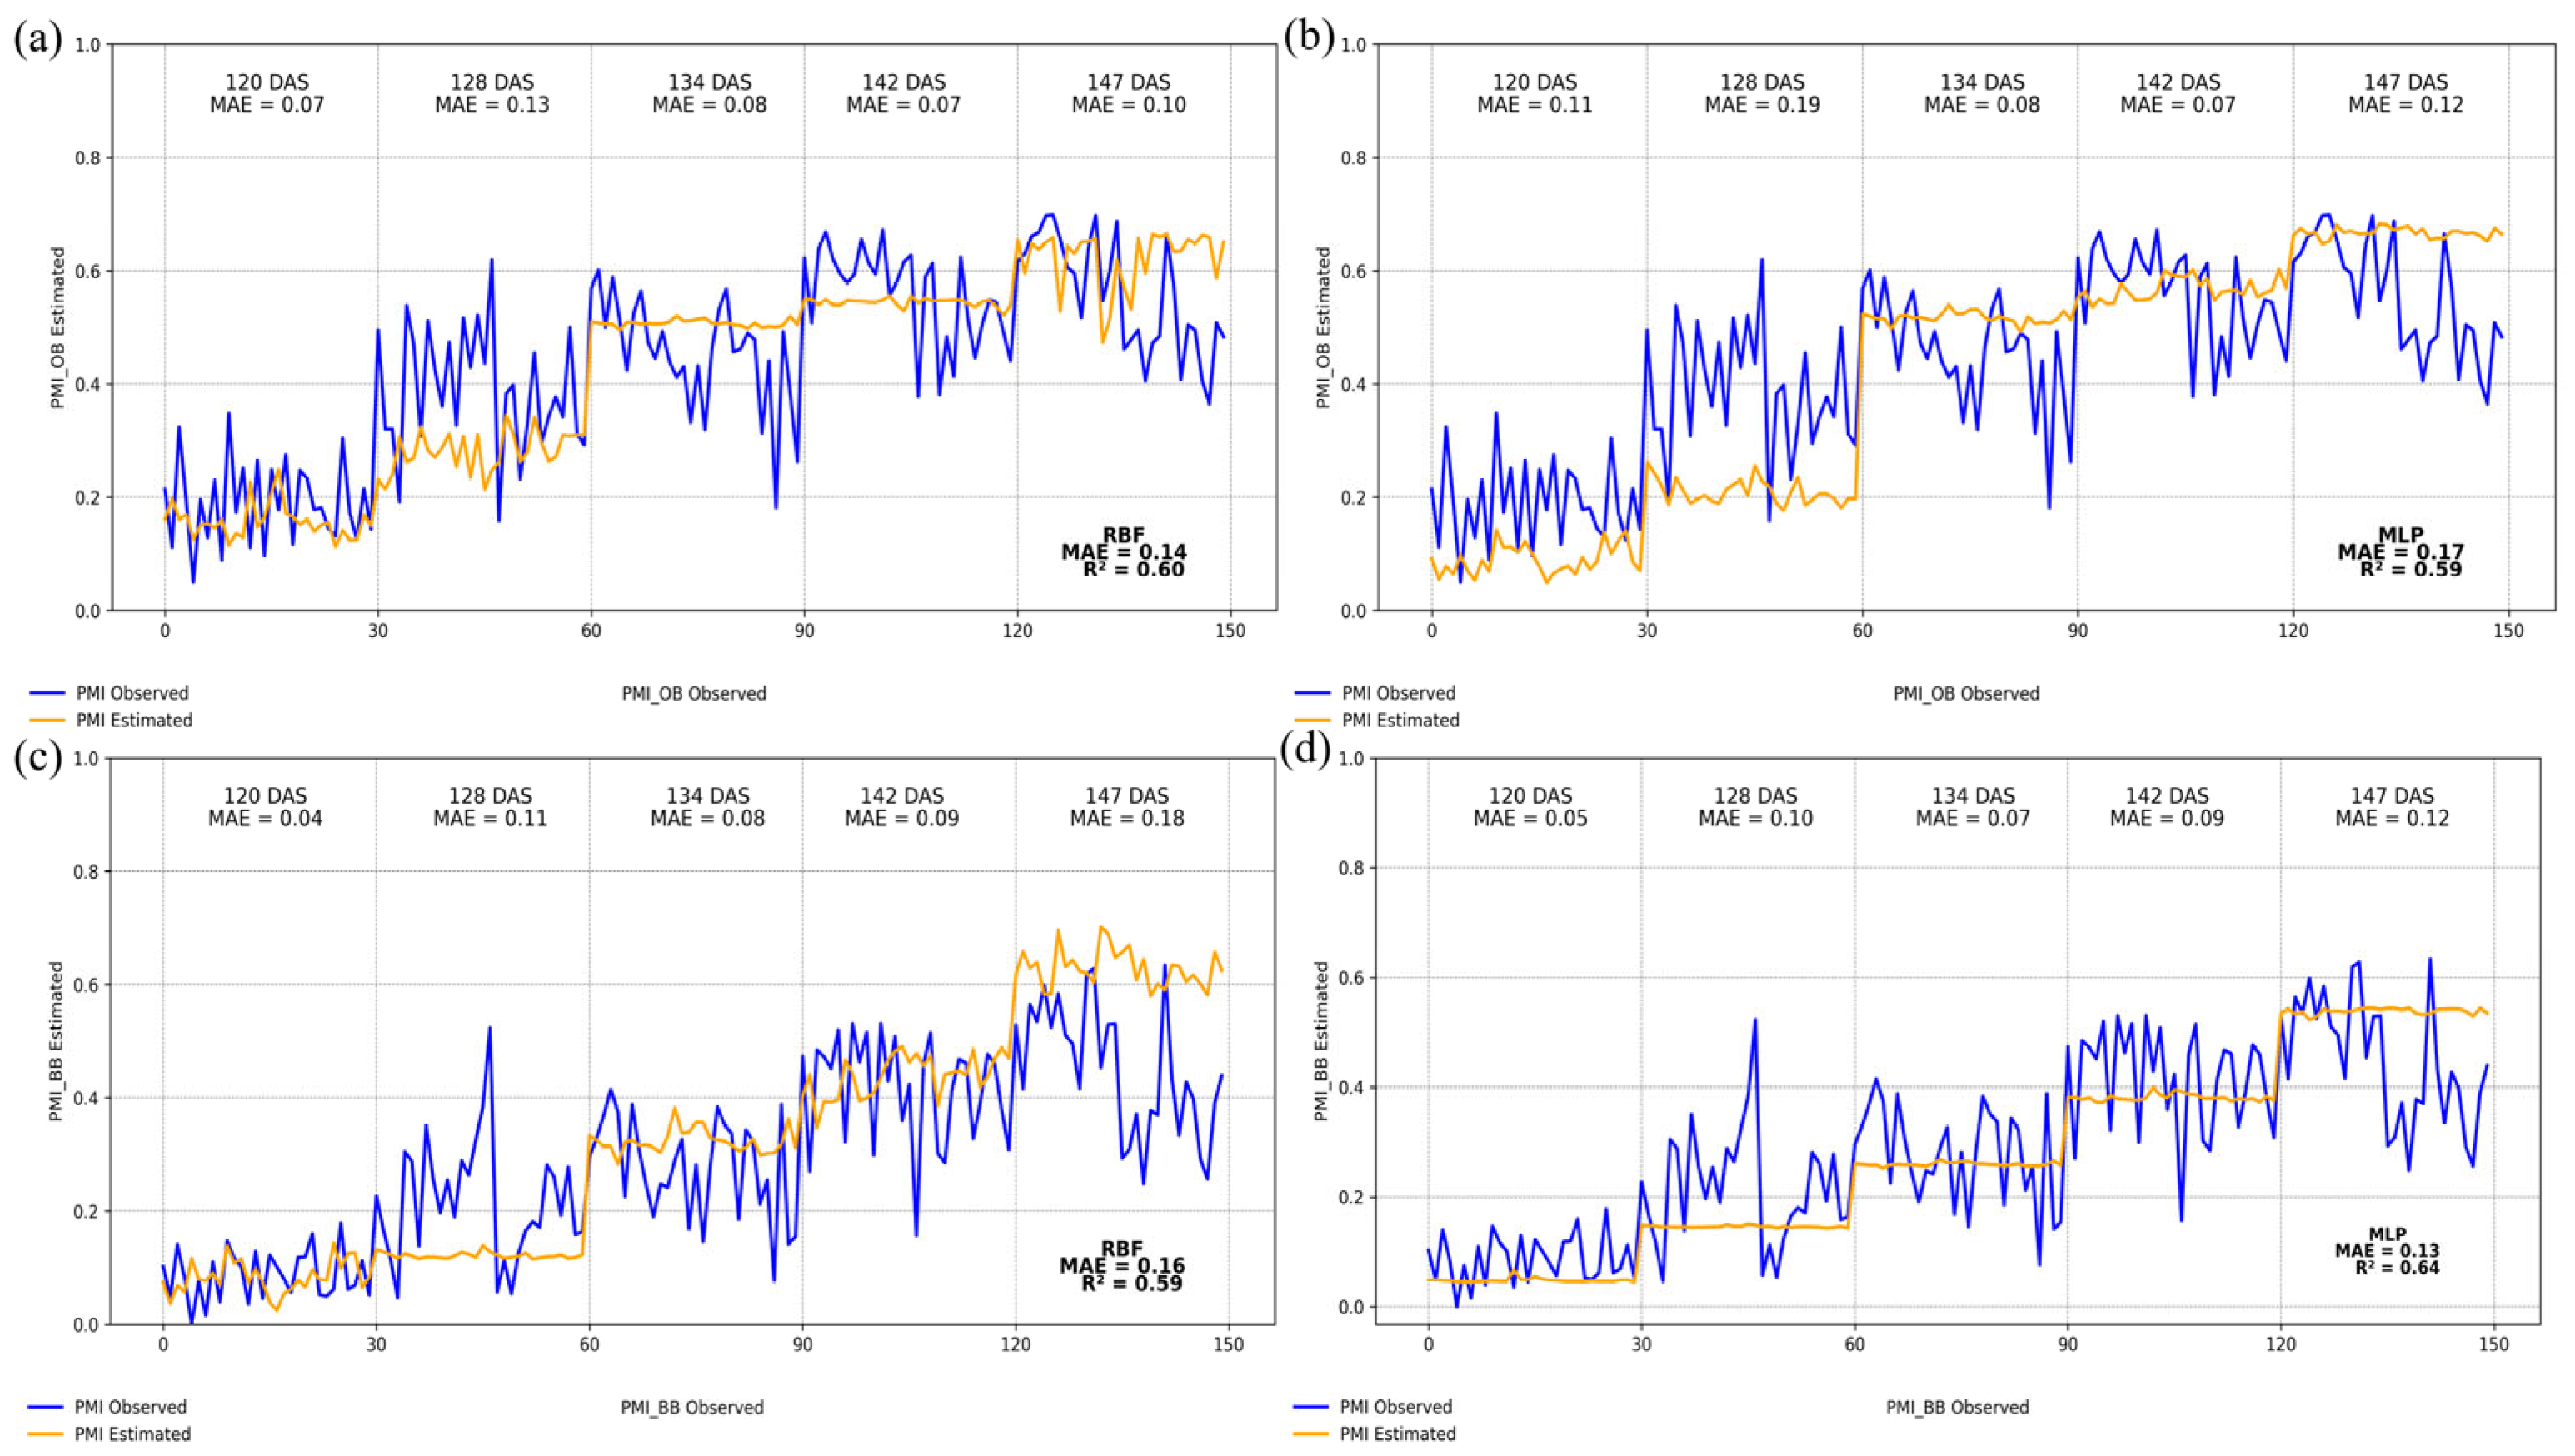
With the validated model developed, it was tested and generalized using the Area 2 dataset to assess result accuracy (Figure 8). For PMI_OB, both architectures showed minimal differences in precision; however, the RBF architecture (Figure 8d) exhibited 3% higher accuracy than the MLP. Both architectures achieved equal precision, indicating that despite the small difference in precision metrics, the PMI_OB model can be applied to another area for both ANN architectures. For PMI_BB, both RBF and MLP produced solid results, with RBF reaching an R2 of 0.59 and MAE of 0.16, while MLP achieved an R2 of 0.64 and MAE of 0.13. The MLP architecture delivered superior results for peanut maturity indices (Figure 8b,d). When analyzing each PMI by days after sowing, for PMI_OB, we observed that both architectures obtained the same results, with MAE of 0.07 at 142 DAS and 120 DAS for RBF, and MAE of 0.08 for both architectures at 134 DAS. For PMI_BB, at 120 DAS both architectures achieved the lowest errors during generalization, showing strong results at the beginning of maturity. At 134 and 142 DAS, both architectures yielded similar results with MAE ≤ 0.09. Notably, at 120 DAS, PMI_BB results for both architectures achieved MAE ≤ 0.05, indicating that despite the overall performance differences, the ANNs demonstrated an improvement in generalization performance when applied to another area.
When comparing the models tested and generalized in another area, we observed that, during periods of maximum variation, the models were not able to adequately track the observed values. For PMI_OB (Figure 8a,b), both architectures underestimated values at certain points, with MAE ≤ 0.17, indicating that the models did not capture some of the outlier PMI observations. For PMI_BB, the RBF architecture overestimated values at certain points (Figure 8c), while the MLP (Figure 8d), despite achieving the best overall results, still underestimated some observed PMI values. The presence of outliers in the dataset may have hindered the models’ accuracy. For future work, improving model robustness will require enriching the dataset by including more field sampling events, expanding to new areas, and incorporating different cultivars. Such enhancements would increase the dataset size and improve both accuracy and precision, which are essential to developing more reliable and widely applicable models for peanut maturity estimation under different agricultural conditions.

4. Discussion

Understanding the variability in peanut maturation over time required consideration of both physiological factors of the plant and environmental conditions (biotic and abiotic) that influence its development. The analysis of maturity indices (PMI) over the days after sowing (DAS) indicated a continuous pod development process, as evidenced by the progressive increase in PMI values. The results reflect the heterogeneity in peanut maturation, which can be influenced by both genetic and environmental factors. Differences in nutrient and water availability, as well as genetic variability, contribute to this phenotypic variation [46]. Another key aspect is the genotype x environment interaction, which influences pod development, yield, and oil and protein content in peanut varieties. This interaction has a significant impact, demonstrating that environmental factors can strongly affect such variability [47].
The presence of outliers at advanced maturity stages underscores the importance of rigorous monitoring of maturity indices to optimize harvest timing. Harvesting beyond the optimal point can compromise pod and seed quality, affecting flavor, texture, and nutritional value [48]. Therefore, adjusting harvest timing is essential to maximize both crop quality and yield.
The temporal variability analysis using linear regression (Figure 4) revealed a substantial relationship between the PMIs at different days after sowing, considering two maturity classes (PMI_OB and PMI_BB), with an R2 of 0.94 between the indices. This indicates that approximately 94% of the variability in PMI_BB can be explained by PMI_OB. This near-proportional relationship between the methods suggests that both indices are equally effective for monitoring peanut maturation. This relationship can be explained by the way maturity indices reflect the physiological stages of peanut development. According to [17], maturity indices based on the distribution of pods within the classes of the maturity chart were effective in predicting peanut yield and quality, as these color classes are directly related to the degree of pod maturation.
Nevertheless, as shown in Figure 4b, when PMI_OB reaches a value of 0.7, PMI_BB is approximately 0.6. Conversely, when PMI_BB reaches 0.7, PMI_OB is around 0.8. From this perspective, if PMI_OB were considered, harvest could have been carried out after 144 DAS. However, using PMI_BB as the reference, harvest would occur after 150 DAS. It is worth noting that in several published studies such as those by [10,19,21,24], the PMI_BB has been the chosen maturity index.
We applied PCA as a filtering method to reduce the dimensionality of the dataset. PCA was used to identify and select the most relevant and important variables for the PMI indices. Based on prior knowledge and previous studies in the field, ten relevant variables were selected from the original 23 input variables. For spectral bands, the green, red, and NIR bands were chosen due to their high relevance and consistent use in previous research related to peanut maturity [14,19,24,49].
The increase in PMI with DAS reflects the gradual shift in the proportion of pod classes, which is typical of an indeterminate growth habit. In the canopy, this evolution stems primarily from pigment transitions and subtle structural changes associated with soil-background effects, which reduce or saturate the contrast between the red and NIR bands and, in turn, affect NDVI/SAVI/MNLI. The green band remains informative because of its sensitivity to pigment transitions, even in the absence of uniform foliar senescence. The green band plays a crucial role due to its ability to detect variations in chlorophyll content in plants [50,51]. In peanuts, studies such as [14,49] emphasize that, despite its low variation in reflectance, the green band is essential for accurately predicting peanut maturity. The importance of the red and NIR bands in the model is attributed to their high sensitivity to changes in pod maturation [52]. This sensitivity makes these bands particularly suitable for capturing variations associated with ripening [24]. Reflectance in these spectral regions changes considerably during the maturation period, enabling precise detection of physiological changes in the pods [53]. Research by [14,49] has shown that these bands are critical for accurately predicting pod maturity, highlighting the importance of monitoring these spectral regions to optimize harvest timing and improve yield.
Machine learning models were then applied to predict maturity using the data from these bands. These results are consistent with those reported by [24], who used the green, red, red-edge, and near-infrared bands as input variables for their models, achieving an R2 of 0.91 and an RMSE of 0.07, thereby demonstrating high accuracy.
For the selection of vegetation indices, we identified six based on the theoretical foundation provided in previous studies. We chose the VIs that demonstrated a strong relationship with maturity and achieved excellent results in terms of precision and accuracy in ANN models and other machine learning approaches (NDVI, GNDVI, MNLI, SAVI, NLI, NDRE). We prioritized those that, despite showing high correlation with others, had greater importance such as GNDVI compared to SR, which was retained due to its relevance for the PMIs. Based on these criteria, the remaining VIs were selected by determining which were most important for peanut maturity, as supported by previous research [8,14,20,21,54].
Recent evidence indicates that the orbital platform is particularly suitable for the operational monitoring of peanut maturation in commercial fields [19,20,21]. Satellite imagery provides more stable time series (lower variance in bands and indices) and regularly covers the decision window. Drone (RPAs) flights, while useful for phenotyping and targeted analyses, are more prone to spectral saturation, depend on narrow weather and airspace windows, require heavier processing, and become costlier when used on a weekly routine. Since neural network models using satellite data already achieve low errors and maintain good performance when generalized to other areas/years, satellites offer the best balance of accuracy, scale, and operational reproducibility [20,21,55]. The use of RPAs remains advisable when sub-meter detail is indispensable.
The final variable selected was ADD, which showed a strong correlation with the maturity indices. Using ADD to estimate peanut maturity proved essential due to the strong relationship between accumulated temperature and crop development. Studies that have employed ADD for estimating peanut maturity have reported favorable results, demonstrating that ADD is a robust measure for capturing climatic variables that influence pod growth and maturation. The selection of ADD was supported by the results obtained in PMI estimation [20,21,37].
The results indicated that, after performing the variable importance analysis, the combination of green band, NDVI, SAVI, and ADD for PMI_BB, and green band, SAVI, MNLI, and ADD for PMI_OB, optimizes the estimation of peanut maturity. This variable selection process was critical for improving model precision and accuracy while reducing computational complexity and processing time. This approach is consistent with the findings of [56], who, in their aerial imaging analysis using RPA (Remotely Piloted Aircraft) and machine learning algorithms, optimized the prediction of qualitative yield in sugarcane.
The variable importance analysis (Figure 7) shows that including up to four variables for both PMIs significantly improves the adjusted coefficient of determination (R2) and reduces the Mean Squared Error of Prediction (MSEP). Beyond this point, adding more variables does not lead to substantial improvements. This finding aligns with the variable selection approach discussed by [57], in which optimizing the number of variables used enhances model robustness. In crops with more synchronized maturation, such as many soybean cultivars, the canopy tends to exhibit a more monotonic decline in the red/NIR bands near grain filling and foliar senescence, which simplifies the temporal interpretation of vegetation indices toward the end of the cycle. In sugarcane, by contrast, the harvest decision is strongly tied to technological quality (soluble solids/Brix), and canopy reflectance does not always correlate directly with the optimal cutting point, requiring combinations with meteorological information and crop-specific models. Peanut, due to its indeterminate growth habit and the mixture of pod classes within the same field, poses a distinct challenge: the spectral signature simultaneously reflects pigment transitions, subtle structural changes in the canopy, and soil-background effects. Our results show that the combination of the green band plus NDVI/SAVI/MNLI together with accumulated degree-days (ADD) is well suited to this scenario, as it balances sensitivity to pigment changes, robustness to soil background, and integration of thermal time, yielding a more stable signal to identify the operational harvest window in peanut.
PCA followed by stepwise selection proved operationally robust: with a small set of predictors, the models maintained high accuracy in validation (Area 1) and useful performance in cross-area generalization (Area 2). Using original variables rather than principal component scores preserved the agronomic interpretability of bands, vegetation indices, and accumulated degree-days (ADD). A known limitation is that stepwise procedures can be sensitive to sample composition and residual collinearity; PCA filtering mitigates, but does not entirely eliminate, this sensitivity. Alternative feature-selection strategies such as regularization (LASSO or elastic net), tree-based methods (e.g., Boruta), or SHAP-based importance could be assessed on larger datasets. In this study, we prioritized simplicity, interpretability, and computational efficiency within a reproducible workflow. In our selection sequence (PCA followed by Stepwise), topographic indices (TPI, TWI) and soil texture variables were excluded because they showed low or unstable contributions and redundancy relative to the spectral and climatic predictors, resulting in a more compact input set. We acknowledge this decision as a limitation: in areas where relief more strongly controls drainage or where there are sharper within-field texture gradients, these variables may become relevant. Future work should reassess them using higher-resolution DEMs, multi-scale TPI/TWI calculation windows, in-field soil moisture measurements (e.g., sensors or probes), and denser sampling in contrasting soil patches to verify whether they can improve generalization in more heterogeneous terrains.
For both PMIs, three vegetation indices (VIs) were used as input variables for both architectures. The influence of NDVI in the estimation models was critical due to its direct relationship with crop vigor and health [58]. As plants grow, increasing NDVI values reflect greater vigor and overall health. Conversely, NDVI decreases as the plant approaches maturity, reflecting physiological changes in the canopy such as chlorophyll degradation and reduced leaf area [8]. NDVI proved to be more sensitive to changes in canopy reflectance as peanut maturity approached compared with other vegetation indices, such as GNDVI. This sensitivity to reflectance changes during peanut maturation makes NDVI particularly valuable for monitoring this stage, as it can detect subtle variations that indicate plant health and maturity status [21]. This capability allows NDVI to be an effective tool for predicting peanut maturity, especially in crop rotation systems where peanuts are grown alongside sugarcane [20].
The SAVI played an important role in the structure of the ANNs, as it was included among the input variables for the PMI_BB in both architectures. Furthermore, this index has shown excellent results when used with PMI, enabling the prediction of the ideal time for plant inversion a crucial process in peanut harvesting while providing good accuracy in predicting maturity [8]. The MNLI had a strong influence on PMI_BB. According to [19], in their study, the MNLI showed signs of saturation, possibly due to the soil adjustment applied to this index. In this study, the soil correction in MNLI aimed to minimize soil brightness, with the value varying according to the crop canopy conditions. Accordingly, [13] demonstrated in their research the relationship between peanut maturity and MNLI, showing it to be a strong indicator for maturity estimation. The NDVI, SAVI, and MNLI were directly affected by the difference between the red and NIR bands, and inversely by the sum of these bands, highlighting the relevance of these spectral bands for estimating maturity. In summary, based on the literature and our results, NDVI measures the difference between the red and NIR bands; as chlorophyll and canopy structure change with advancing maturity, this contrast weakens. SAVI reduces soil-background effects, which is useful when canopy openings appear and the inter-row soil becomes more visible. MNLI emphasizes non-linear responses of the red/NIR bands, which are common near maturity. The green band captures pigment changes (chlorophyll/carotenoids) that often emerge early. In practice, this combination covers soil influence, maturity progression, and early pigment changes, while ADD summarizes the accumulated temperature that governs the pace of these changes.
The performance of the validated models showed strong potential for estimating peanut maturity, although some studies have reported equal or higher precision and accuracy [8,14,20,21,24,37,54,59]. Nevertheless, our study demonstrated that both ANNs exhibited satisfactory performance in estimating the PMIs. In a study using high-resolution orbital images, [8] reported significant results by employing the vegetation indices NLI, MNLI, and SAVI as input variables in the Gompertz model, achieving high R2 values. Similarly, [19] integrated orbital and aerial imagery and obtained comparable performance in MLP and RBF neural networks, with R2 values above 0.87 and MAE of 0.05. However, our results, using only orbital images, showed slightly higher precision, with R2 values equal to or above 0.90. These findings support the effectiveness of the method, offering a non-destructive and accurate alternative for estimating peanut maturity, reducing subjectivity and the need for intensive field sampling, in addition to introducing a novel application by generalizing the tested model to another area, which yielded promising results for future research. Therefore, this method facilitates decision-making and improves harvest management. The low MAE (0.06–0.07) and R2 ≥ 0.90 in Area 1 indicate that weekly spectral changes and accumulated thermal time are sufficient to determine maturity at the field decision scale. In management practice, this level of accuracy is compatible with the harvest window (PMI 0.70–0.75), supporting uprooting planning. Residual errors are expected near the transition points between pod classes, when small variations in class proportions can produce non-linear spectral responses within the weekly interval. The moderate drop in accuracy in Area 2 (R2 = 0.59–0.64; MAE = 0.13–0.17) is consistent with local differences in soil moisture, microrelief, and management schedules, which alter the soil background and the red/NIR contrast independently of thermal time. In wetter periods, darker soil reduces brightness and can mask part of the spectral changes; in drier periods, more exposed soil accentuates the background a condition for which SAVI offers greater robustness. These hydrological variations, together with cultivar and season effects, explain the overestimations and outliers in Figure 8d, yet the model still provides useful decision support at the field scale.
The RBF and MLP networks showed considerable accuracy values in this application method. In the studies by [19,24], these artificial neural networks demonstrated strong performance, with average R2 values ≥ 0.88, indicating their effectiveness in identifying key factors among spectral bands, vegetation indices, and ADD. Thus, the application of the tested model shows potential for future research, in addition to increasing data robustness, which could further enhance accuracy over time.
The proposed workflow can be implemented as a simple decision layer that converts model outputs into harvest directives. Each day, the system ingests satellite reflectance together with daily series from NASA POWER and runs the trained artificial neural network to generate field-level values of the peanut maturity index. A decision rule then flags fields that have entered the harvest window (peanut maturity index between 0.70 and 0.75) when at least a predefined percentage of pixels or sampling points remain within this interval for a predefined number of consecutive days, while explicitly accounting for the model’s error margin (that is, verifying whether the predicted maturity index plus or minus the mean absolute error remains within the target range; typical mean absolute errors observed were 0.06–0.07 in Area 1 and 0.13–0.17 in Area 2, when generalization was evaluated).
Flagged fields are ranked by how close they are to the center of the harvest window (more stable values near 0.70–0.75), by the number of days they have stayed within the window, and by operational constraints such as crew and equipment availability and soil trafficability. The ranked list becomes a harvest queue that guides uprooting schedules. Field supervisors need to trigger in-field checks only for borderline cases namely, fields very close to the window limits (for example, a peanut maturity index between 0.68 and 0.70 or 0.75 and 0.77) or with high variability across pixels or sampling points thereby reducing subjective sampling. The platform stores daily snapshots to track trends (for example, seven-day changes), logs decisions, and supports post-season retraining as new fields and years accumulate, enabling a continuous, improvable, data-driven harvest plan.

5. Conclusions

This study combined orbital imagery (PlanetScope), climatic information (accumulated degree-days, ADD), and neural networks (MLP and RBF) to estimate and generalize peanut pod maturity in commercial fields. The workflow comprised four main steps: (i) temporal synchronization between field data and satellite imagery with a one-day tolerance either side; (ii) computation and definition of candidate variables (bands, indices, texture, and climate); (iii) pre-selection via PCA followed by stepwise selection to define a minimal input set; and (iv) training/validation in Area 1 and generalization assessment in Area 2.
As final inputs, we used PMI_BB (Green, NDVI, SAVI, and ADD) and PMI_OB (Green, MNLI, SAVI, and ADD). With these inputs, the models achieved, in Area 1, R2 = 0.90–0.93 and MAE = 0.06–0.07; when applying the models, without retraining, to Area 2, they obtained R2 = 0.59–0.64 and MAE = 0.13–0.17. Performance was similar between MLP and RBF, with a slight edge for MLP on PMI_BB. Overall, a reduced and interpretable set of variables proved sufficient to estimate maturity and to maintain useful performance in a different field/season. Practically, integrating climatic and spectral variables, together with attribute selection, supports identifying the harvest point and developing models for improved peanut crop management.

Author Contributions

Conceptualization, A.L.d.B.F.; Methodology, T.C.M.O., J.B.C.S., S.L.H.d.A., F.M.C. and R.P.d.S.; Validation, T.C.M.O., J.B.C.S. and R.P.d.S.; Formal analysis, R.H.d.S.S.; Writing —original draft, T.C.M.O. and R.P.d.S.; Writing—review & editing, R.P.d.S.; Visualization, T.C.M.O., J.B.C.S. and S.L.H.d.A.; Supervision, T.C.M.O., F.M.C. and R.P.d.S. All authors have read and agreed to the published version of the manuscript.

Funding

This project received funding from the São Paulo Research Foundation (FAPESP—grant no. 2023/14041-2 and 2021/06029-7), the National Council for Scientific and Technological Development (CNPq), and the Coordination for the Improvement of Higher Education Personnel (CAPES).

Data Availability Statement

The original contributions presented in this study are included in the article. Further inquiries can be directed to the corresponding author(s).

Conflicts of Interest

The authors declare no conflicts of interest.

References

  1. USDA. United States Department of Agriculture. Available online: https://ipad.fas.usda.gov/cropexplorer/cropview/commodityView.aspx?cropid=2221000 (accessed on 6 June 2024).
  2. Companhia Nacional de Abastecimento (CONAB). Acompanhamento da Safra Brasileira: Grãos, Safra 2023/2024, Sétimo Levantamento: Abril/2024; CONAB: Brasília, Brazil, 2024. Available online: https://www.conab.gov.br/info-agro/safras/graos/boletim-da-safra-de-graos?limitstart=0 (accessed on 6 June 2024).
  3. Shoko, M.D.; Tagwira, F. Benefits of soyabeans as a break crop in sugarcane production systems in the South Eastern Lowveld of Zimbabwe. Sugar J. 2007, 70, 18–22. [Google Scholar]
  4. Park, S.E.; Webster, T.J.; Horan, H.L.; James, A.T.; Thorburn, P.J. A legume rotation crop lessens the need for nitrogen fertiliser throughout the sugarcane cropping cycle. Field Crops Res. 2010, 119, 331–341. [Google Scholar] [CrossRef]
  5. Paungfoo-Lonhienne, C.; Wang, W.; Yeoh, Y.K.; Halpin, N. Legume crop rotation suppressed nitrifying microbial community in a sugarcane cropping soil. Sci. Rep. 2017, 7, 16707. [Google Scholar] [CrossRef]
  6. Zerbato, C.; Furlani, C.E.; Silva, R.P.; Voltarelli, M.A.; Santos, A.F. Statistical control of processes applied for peanut mechanical digging in soil textural classes. Eng. Agríc. 2017, 37, 315–322. [Google Scholar] [CrossRef]
  7. Michelotto, M.D.; Bolonhezi, D.; Freitas, R.S.; Santos, J.F.; Godoy, I.J.; Schwertner, C.F. Population dynamics, vertical distribution and damage characterization of burrower bug in peanut. Sci. Agric. 2022, 80, e20210161. [Google Scholar] [CrossRef]
  8. Santos, A.F.; Corrêa, L.N.; Lacerda, L.N.; Tedesco-Oliveira, D.; Pilon, C.; Vellidis, G.; Silva, R.P. High-resolution satellite image to predict peanut maturity variability in commercial fields. Precis. Agric. 2021, 22, 1464–1478. [Google Scholar] [CrossRef]
  9. Chen, Y.; Wang, G.; Wang, J.; Zhang, P.; Wang, B.; Hu, Z. Adaptabilities of different harvesters to peanut plants after cutting stalks. Int. J. Agric. Biol. Eng. 2022, 15, 93–100. [Google Scholar] [CrossRef]
  10. Santos, E.P.; Silva, R.P.; Bertonha, R.S.; Noronha, R.H.; Zerbato, C. Produtividade e perdas de amendoim em cinco diferentes datas de arranquio. Rev. Ciênc. Agron. 2013, 44, 695–702. [Google Scholar] [CrossRef]
  11. Bindlish, E.; Abbott, A.L.; Balota, M. Assessment of peanut pod maturity. In Proceedings of the 2017 IEEE Winter Conference on Applications of Computer Vision (WACV), Santa Rosa, CA, USA, 24–31 March 2017; IEEE: Piscataway, NJ, USA, 2017; pp. 688–696. [Google Scholar] [CrossRef]
  12. Moctezuma, E. The peanut gynophore: A developmental and physiological perspective. Can. J. Bot. 2003, 81, 183–190. [Google Scholar] [CrossRef]
  13. Santos, A.F.; Lacerda, L.N.; Gobbo, S.; Tofannin, A.; Silva, R.P.; Vellidis, G. Using remote sensing to map in-field variability of peanut maturity. In Precision Agriculture’19; Wageningen Academic: Wageningen, The Netherlands, 2019; pp. 605–611. [Google Scholar] [CrossRef]
  14. Abd-El Monsef, H.; Smith, S.E.; Rowland, D.L.; Abd El Rasol, N. Using multispectral imagery to extract a pure spectral canopy signature for predicting peanut maturity. Comput. Electron. Agric. 2019, 162, 561–572. [Google Scholar] [CrossRef]
  15. Song, Y.; Rowland, D.L.; Tillman, B.L.; Wilson, C.H.; Sarnoski, P.J.; Zurweller, B.A. Impact of seed maturity on season-long physiological performance and offspring seed quality in peanut (Arachis hypogaea L.). Field Crops Res. 2022, 288, 108674. [Google Scholar] [CrossRef]
  16. Williams, E.J.; Drexler, J.S. A non-destructive method for determining peanut pod maturity. Peanut Sci. 1981, 8, 134–141. [Google Scholar] [CrossRef]
  17. Rowland, D.L.; Sorensen, R.B.; Butts, C.L.; Faircloth, W.H. Determination of maturity and degree day indices and their success in predicting peanut maturity. Peanut Sci. 2006, 33, 125–136. [Google Scholar] [CrossRef]
  18. Colvin, B.C.; Rowland, D.L.; Ferrell, J.A.; Faircloth, W.H. Development of a digital analysis system to evaluate peanut maturity. Peanut Sci. 2014, 41, 8–16. [Google Scholar] [CrossRef]
  19. Souza, J.B.C.; Almeida, S.L.H.; Filho Brito, A.L.; Carneiro, M.F.; Santos, A.F.; Silva, R.P. Unmanned aerial system and satellite: Which one is a better platform for monitoring of the peanut crops? Agron. J. 2023, 115, 1146–1160. [Google Scholar] [CrossRef]
  20. Souza, J.B.C.; Almeida, S.L.H.; Oliveira, M.F.; Santos, A.F.; Filho Brito, A.L.; Meneses, M.D.; Silva, R.P. Integrating satellite and UAV data to predict peanut maturity upon artificial neural networks. Agronomy 2022, 12, 1512. [Google Scholar] [CrossRef]
  21. Santos, A.F.; Lacerda, L.N.; Rossi, C.; Moreno, L.A.; Oliveira, M.F.; Pilon, C.; Vellidis, G. Using UAV and multispectral images to estimate peanut maturity variability on irrigated and rainfed fields applying linear models and artificial neural networks. Remote Sens. 2021, 14, 93. [Google Scholar] [CrossRef]
  22. Alvares, C.A.; Stape, J.L.; Sentelhas, P.C.; de Gonçalves, J.L.M.; Sparovek, G. Köppen’s climate classification map for Brazil. Meteorol. Z. 2014, 22, 711–728. [Google Scholar] [CrossRef]
  23. Planet. Understanding PlanetScope Instruments. Available online: https://developers.planet.com/docs/apis/data/sensors/ (accessed on 30 March 2023).
  24. Oliveira, M.F.; Souza, J.B.C.; Ortiz, B.V.; Bao, Y.; Sanz-Saez, A.; Silva, R.P. Integrating artificial neural networks and remote sensing for prediction of peanut maturity as a function of management zones. In Precision Agriculture’23; Wageningen Academic: Wageningen, The Netherlands, 2023; pp. 1083–1089. [Google Scholar] [CrossRef]
  25. Rouse, J.W.; Deering, D. Monitoring vegetation systems in the Great Plains with ERTS. NASA Spec. Publ. 1974, 351, 309. [Google Scholar]
  26. Gitelson, A.A.; Kaufman, Y.J.; Merzlyak, M.N. Use of a green channel in remote sensing of global vegetation from EOS-MODIS. Remote Sens. Environ. 1996, 58, 289–298. [Google Scholar] [CrossRef]
  27. Goel, N.S.; Qin, W. Influences of canopy architecture on relationships between various vegetation indices and LAI and FPAR: A computer simulation. Remote Sens. Rev. 1994, 10, 309–347. [Google Scholar] [CrossRef]
  28. Fitzgerald, G.; Rodriguez, D.; O’Leary, G. Measuring and predicting canopy nitrogen nutrition in wheat using a spectral index—The canopy chlorophyll content index (CCCI). Field Crops Res. 2010, 116, 318–324. [Google Scholar] [CrossRef]
  29. Justice, C.O.; Vermote, E.; Townshend, J.R.; DeFries, R.; Roy, D.P.; Hall, D.K.; Barnsley, M.J. The Moderate Resolution Imaging Spectroradiometer (MODIS): Land remote sensing for global change research. IEEE Trans. Geosci. Remote Sens. 1998, 36, 1228–1249. [Google Scholar] [CrossRef]
  30. Huete, A.R. A soil-adjusted vegetation index (SAVI). Remote Sens. Environ. 1988, 25, 295–309. [Google Scholar] [CrossRef]
  31. Gong, P.; Pu, R.; Biging, G.S.; Larrieu, M.R. Estimation of forest leaf area index using vegetation indices derived from Hyperion hyperspectral data. IEEE Trans. Geosci. Remote Sens. 2003, 41, 1355–1362. [Google Scholar] [CrossRef]
  32. Boegh, E.; Soegaard, H.; Broge, N.; Hasager, C.; Jensen, N.; Schelde, K.; Thomsen, A. Airborne multi-spectral data for quantifying leaf area index, nitrogen concentration and photosynthetic efficiency in agriculture. Remote Sens. Environ. 2002, 81, 179–193. [Google Scholar] [CrossRef]
  33. Jordan, C.F. Derivation of leaf-area index from quality of light on the forest floor. Ecology 1969, 50, 663–666. [Google Scholar] [CrossRef]
  34. Mieza, M.S.; Cravero, W.R.; Kovac, F.D.; Bargiano, P.G. Delineation of site-specific management units for operational applications using the topographic position index in La Pampa, Argentina. Comput. Electron. Agric. 2016, 127, 158–167. [Google Scholar] [CrossRef]
  35. Meles, M.B.; Younger, S.E.; Jackson, C.R.; Du, E.; Drover, D. Wetness index based on landscape position and topography (WILT): Modifying TWI to reflect landscape position. J. Environ. Manag. 2020, 255, 109863. [Google Scholar] [CrossRef] [PubMed]
  36. Prediction of Worldwide Energy Resources (POWER) Project. POWER Data Access Viewer. NASA Langley Research Center, NASA. Available online: https://power.larc.nasa.gov/data-access-viewer/ (accessed on 21 August 2024).
  37. Barboza, T.O.C.; Ferraz, M.A.J.; Pilon, C.; Vellidis, G.; Valeriano, T.T.B.; Santos, A.F. Advanced farming strategies using NASA POWER data in peanut-producing regions without surface meteorological stations. AgriEngineering 2024, 6, 438–454. [Google Scholar] [CrossRef]
  38. Royston, P. Remark AS R94: A remark on Algorithm AS 181: The W-test for normality. J. R. Stat. Soc. Ser. C Appl. Stat. 1995, 44, 547–551. [Google Scholar] [CrossRef]
  39. Kaiser, H.F. The varimax criterion for analytic rotation in factor analysis. Psychometrika 1958, 23, 187–200. [Google Scholar] [CrossRef]
  40. Kujawa, S.; Niedbała, G. Artificial neural networks in agriculture. Agriculture 2021, 11, 497. [Google Scholar] [CrossRef]
  41. Silva, I.N.; Spatti, D.H.; Flauzino, R.A. Redes Neurais Artificiais: Para Engenharias e Ciências Aplicadas; Artliber: São Paulo, Brazil, 2016. [Google Scholar]
  42. Miao, Y.; Mulla, D.J.; Robert, P.C. Identifying important factors influencing corn yield and grain quality variability using artificial neural networks. Precis. Agric. 2006, 7, 117–135. [Google Scholar] [CrossRef]
  43. Zhang, L.; Wu, K.; Zhong, Y.; Li, P. Um novo algoritmo de mapeamento de subpixel baseado em uma rede neural BP com um modelo de observação. Neurocomputing 2008, 71, 2046–2054. [Google Scholar] [CrossRef]
  44. Bishop, C.M. Neural Networks for Pattern Recognition; Oxford University Press: Oxford, UK, 1995. [Google Scholar]
  45. Haykin, S. Neural Networks: A Comprehensive Foundation, 2nd ed.; Prentice Hall PTR: Upper Saddle River, NJ, USA, 1998. [Google Scholar]
  46. Vishnuprabha, R.S.; Viswanathan, P.L.; Manonmani, S.; Rajendran, L.; Selvakumar, T. Genetic diversity in groundnut (Arachis hypogaea L.) genotypes varying in maturity duration. Vegetos 2023, 36, 1550–1556. [Google Scholar] [CrossRef]
  47. Janila, P.; Manohar, S.S.; Patne, N.; Variath, M.T.; Nigam, S.N. Genotype × environment interactions for oil content in peanut and stable high-oil-yielding sources. Crop Sci. 2016, 56, 2506–2515. [Google Scholar] [CrossRef]
  48. Arioglu, H.; Bakal, H.; Gulluoglu, L.; Onat, B.; Kurt, C. The effect of harvesting dates on some agronomic and quality characteristics of peanut (Arachis hypogaea L.) varieties grown as a main crop in Mediterranean region (Turkey). Turk. J. Field Crops 2018, 23, 27–37. [Google Scholar] [CrossRef]
  49. Rowland, D.L.; Sorensen, R.B.; Butts, C.L.; Faircloth, W.H.; Sullivan, D.G. Canopy characteristics and their ability to predict peanut maturity. Peanut Sci. 2008, 35, 43–54. [Google Scholar] [CrossRef]
  50. Mayranti, F.P.; Saputro, A.H.; Handayani, W. Chlorophyll A and B content measurement system of velvet apple leaf in hyperspectral imaging. In Proceedings of the 2019 3rd International Conference on Informatics and Computational Sciences (ICICoS), Semarang, Indonesia, 29–30 October 2019; IEEE: Piscataway, NJ, USA, 2019; pp. 1–5. [Google Scholar] [CrossRef]
  51. Clevers, J.G.; Kooistra, L.; van den Brande, M.M. Using Sentinel-2 data for retrieving LAI and leaf and canopy chlorophyll content of a potato crop. Remote Sens. 2017, 9, 405. [Google Scholar] [CrossRef]
  52. Zhao, D.; Huang, L.; Li, J.; Qi, J. A comparative analysis of broadband and narrowband derived vegetation indices in predicting LAI and CCD of a cotton canopy. ISPRS J. Photogramm. Remote Sens. 2007, 62, 25–33. [Google Scholar] [CrossRef]
  53. Robson, A.J.; Wright, G.; Phinn, S. Using field spectroscopy and QuickBird imagery for the assessment of peanut crop maturity and aflatoxin. J. Spat. Sci. 2006, 51, 151–162. [Google Scholar] [CrossRef]
  54. Oliveira, M.F.; Carneiro, F.M.; Ortiz, B.V.; Thurmond, M.; Oliveira, L.P.; Bao, Y.; Tedesco, D. Predicting below and above-ground peanut biomass and maturity using multi-target regression. Comput. Electron. Agric. 2024, 218, 108647. [Google Scholar] [CrossRef]
  55. Souza, J.B.C.; Almeida, S.L.H.; Oliveira, M.F.; Carreira, V.S.; Brito Filho, A.L.; Santos, A.F.; Silva, R.P. Generalization of peanut yield prediction models using artificial neural networks and vegetation indices. Smart Agric. Technol. 2025, 11, 100873. [Google Scholar] [CrossRef]
  56. Barbosa Júnior, M.R.; Moreira, B.R.A.; Oliveira, R.P.; Shiratsuchi, L.S.; Silva, R.P. UAV imagery data and machine learning: A driving merger for predictive analysis of qualitative yield in sugarcane. Front. Plant Sci. 2023, 14, 1114852. [Google Scholar] [CrossRef]
  57. Chea, C.; Saengpachatanarug, K.; Posom, J.; Saikaew, K.; Wongphati, M.; Taira, E. Optimal models under multiple resource types for Brix content prediction in sugarcane fields using machine learning. Remote Sens. Appl. Soc. Environ. 2022, 26, 100718. [Google Scholar] [CrossRef]
  58. Alface, A.B.; Pereira, S.B.; Filgueiras, R.; Cunha, F.F. Monitoramento espaço-temporal da cana-de-açúcar e estimativa do coeficiente de cultivo por meio do NDVI. Rev. Bras. Eng. Agríc. Ambient. 2019, 23, 330–335. [Google Scholar] [CrossRef]
  59. Almeida, S.L.H.; Souza, J.B.C.; Pilon, C.; Castro Teixeira, A.H.; Santos, A.F.; Sysskind, M.N.; Silva, R.P. Performance of the SAFER model in estimating peanut maturation. Eur. J. Agron. 2023, 147, 126844. [Google Scholar] [CrossRef]
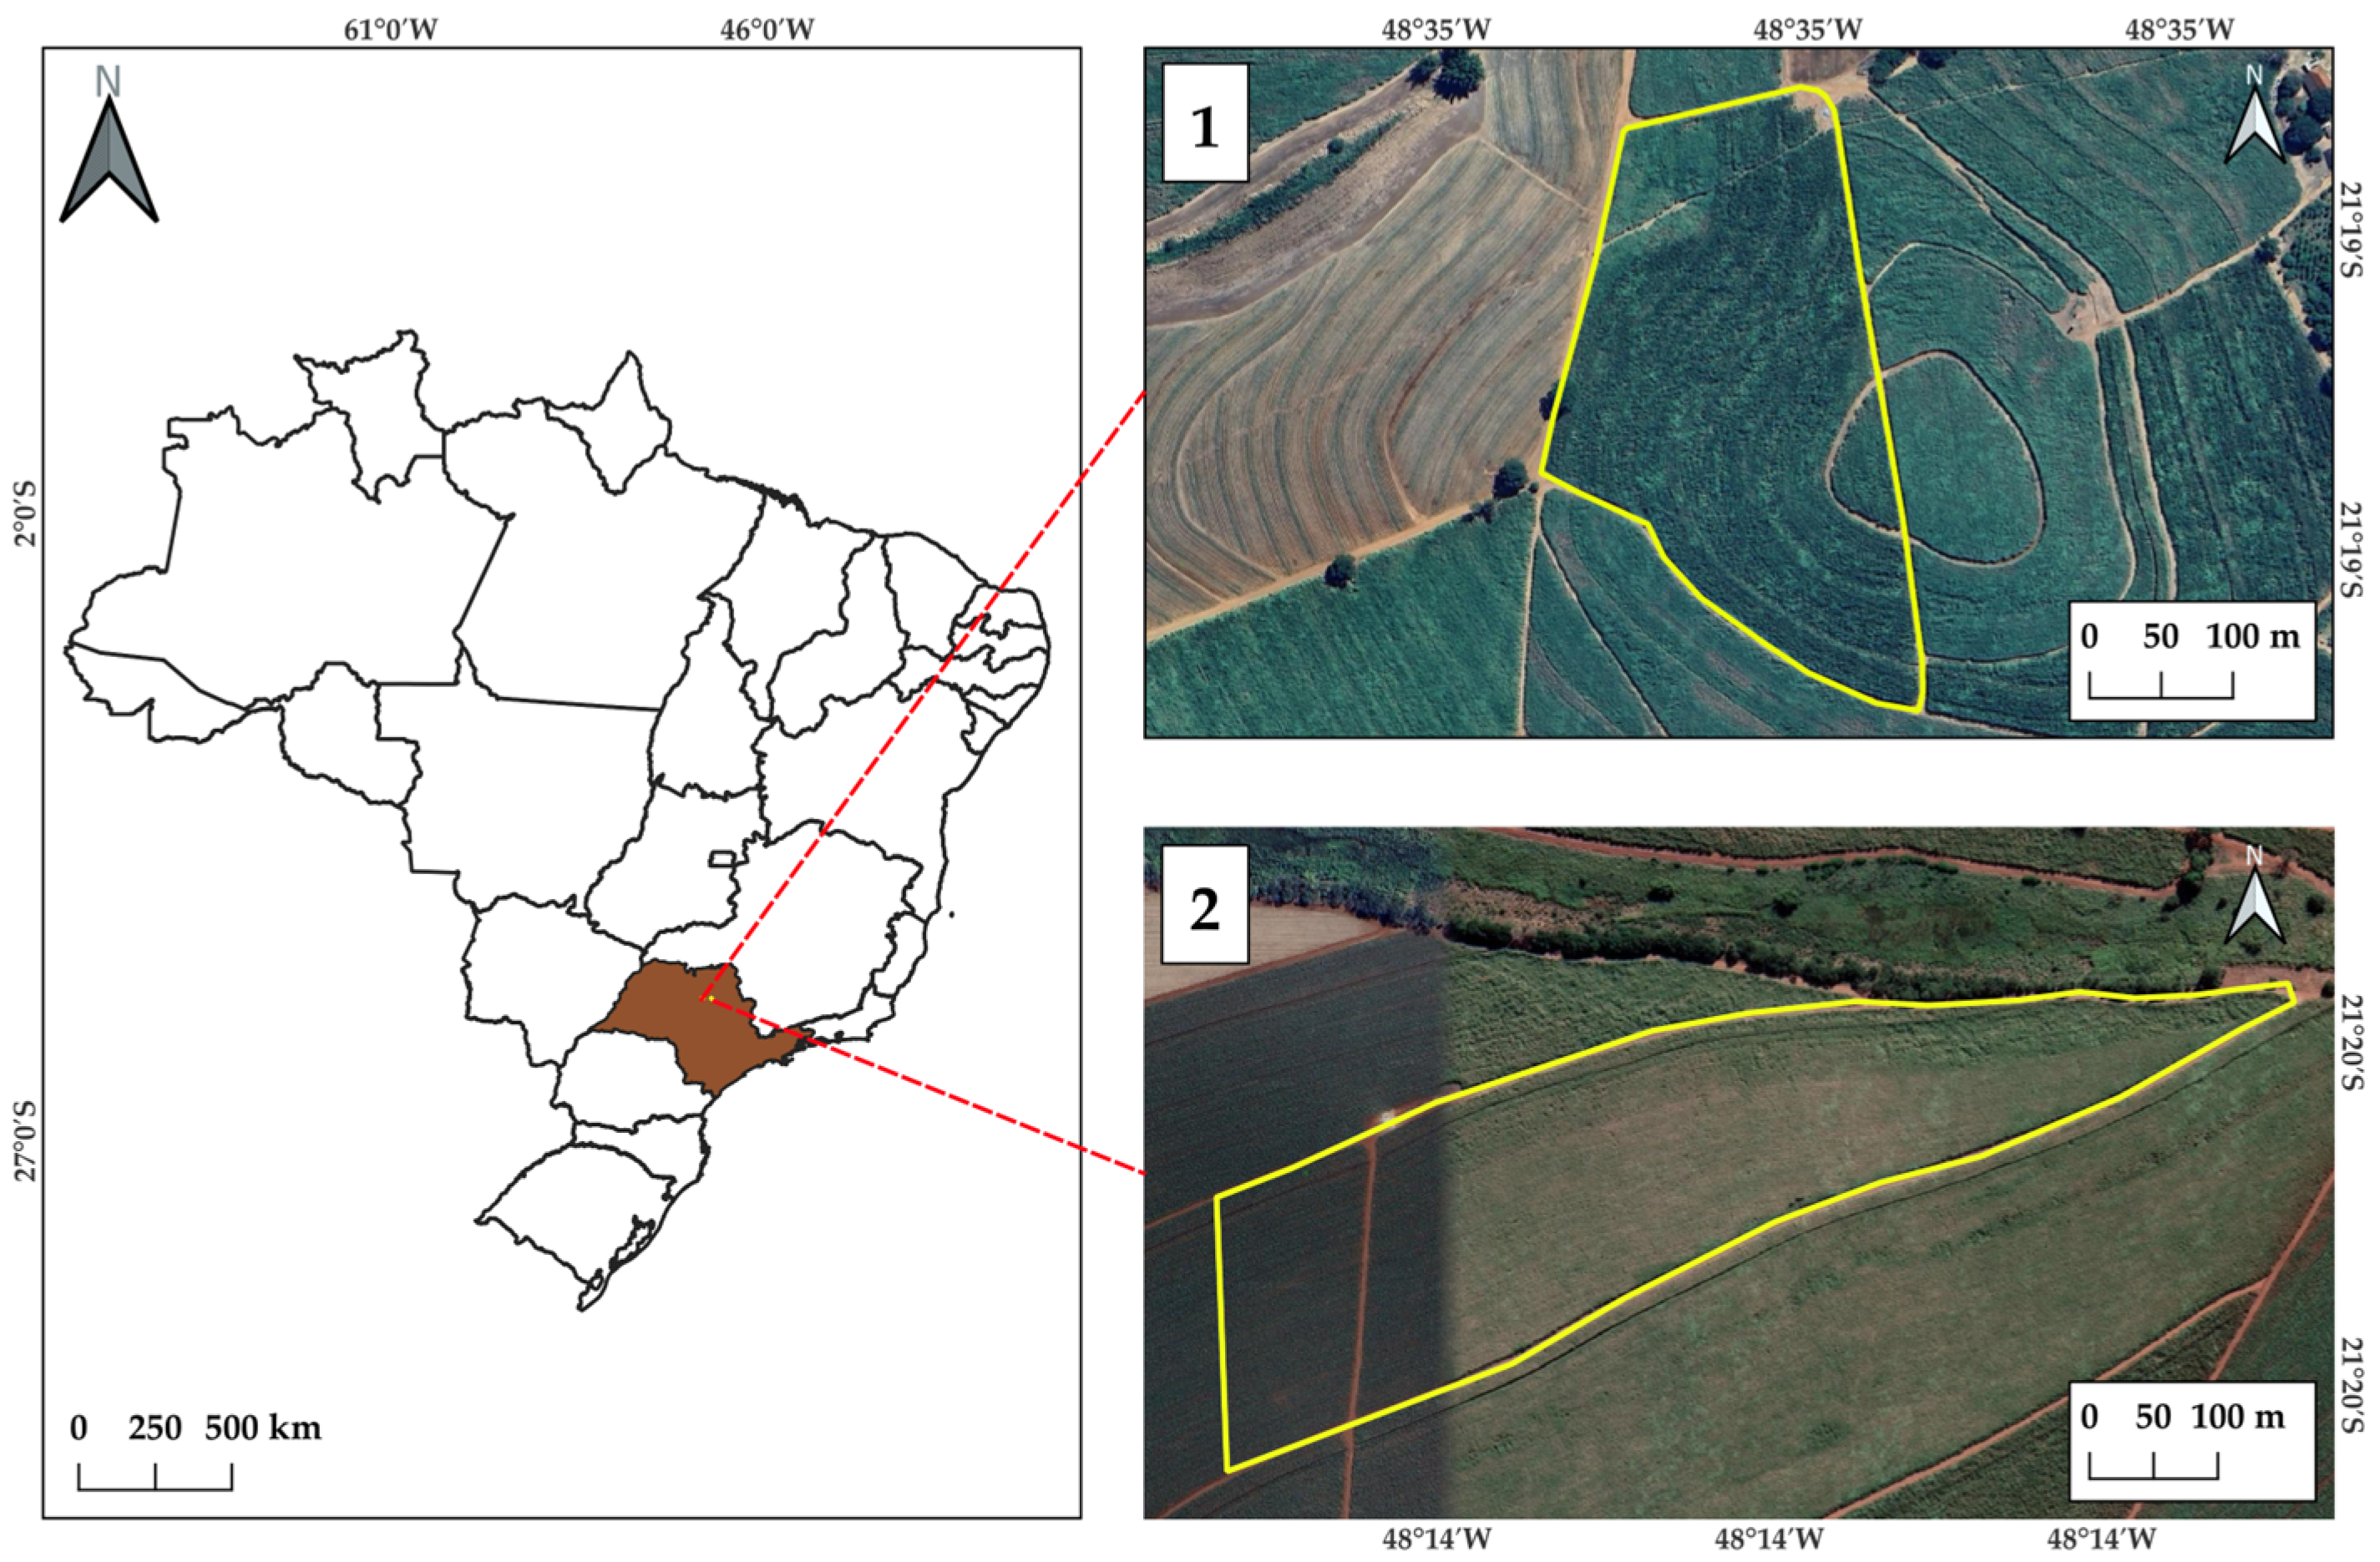
Figure 1. Location map of Areas 1 (Cândido Rodrigues) and 2 (Guariba) in the state of São Paulo, Brazil, where the study was conducted.
Agriengineering 07 00368 g001
Figure 2. Visual classification chart of peanut pods based on mesocarp color. Source: Author's original work (2023).
Agriengineering 07 00368 g002
Figure 3. Flowchart illustrating the steps and processes employed in the study. PMIs: Peanut Maturity Index; PCA: Principal Component Analysis.
Agriengineering 07 00368 g003
Figure 4. Boxplot of the temporal variability of PMIs (PMI_OB: maturation from orange to black; PMI_BB: maturation from brown to black) (a) and the relationship between PMIs (b) over time in days after sowing (DAS) for Area 1.
Agriengineering 07 00368 g004
Figure 5. Data filtering and dimensionality reduction in the dataset through Principal Component Analysis (PCA).
Agriengineering 07 00368 g005
Figure 6. Regression performance of the best variables for PMI_BB (a) and PMI_OB (b) maturation.
Agriengineering 07 00368 g006
Figure 7. Performance of the tested models using the RBF—Radial Basis Function (a,c)—and MLP—Multilayer Perceptron (b,d)—architectures for estimating peanut maturity indices (PMIs), for the orange–black class (PMI_OB) and the brown–black class (PMI_BB).
Agriengineering 07 00368 g007
Figure 8. Performance comparison of the models tested with new data (Area 2), using the RBF—Radial Basis Function (a,c)—and MLP—Multilayer Perceptron (b,d)—architectures to estimate peanut maturity indices (PMIs) for the orange–black class (PMI_OB) and the brown–black class (PMI_BB). (a) RBF-PMI_OB; (b) MLP-PMI_OB; (c) RBF-PMI_BB; (d) MLP-PMI_BB.
Agriengineering 07 00368 g008
Table 1. Spectral bands used to estimate peanut maturity.
BandNameCentral Wavelength (nm)
2Blue472
3Green 1531
4Green565
5Yellow680
6Red665
7Red Edge750
8NIR865
nm: nanometer; NIR: near-infrared.
Table 2. Field sampling dates and corresponding orbital imagery acquisition dates after sowing.
DASField Sampling DateOrbital Imagery Date
12224 February 202324 February 2023
1293 March 20234 March 2023
13610 March 202310 March 2023
14418 March 202318 March 2023
15024 March 202323 March 2023
DAS: days after sowing.
Table 3. Formulas used for calculating vegetation indices (VIs).
VIsEquationsReferences
NDVI ( NIR Red ) / ( NIR + Red ) [25]
GNDVI ( NIR Green ) / ( NIR + Green )[26]
NLI ( NIR 2 Red ) / ( NIR 2 + Red ) [27]
NDRE ( NIR RE ) / ( NIR + RE ) [28]
EVI 2.5 × ( NIR Red ) / ( L + NIR + C 1 × Red C 2 × Blue ) [29]
SAVI(1 + L) × (NIR − Red)/(L + NIR + Red)[30]
MNLI ( NIR 2 Red ) × ( 1 + L ) / ( NIR 2 + Red + L)[31]
LAI3618 × EVI − 0.118[32]
SR N I R / R e d [33]
NDVI: Normalized Difference Vegetation Index; GNDVI: Green Normalized Difference Vegetation Index; NLI: Non-Linear Index; NDRE: Normalized Difference Red Edge Index; EVI: Enhanced Vegetation Index; SAVI: Adjusted Vegetation Index; MNLI: Modified Non-Linear Index; LAI: Leaf Area Index; SR: Simple Ratio; NIR = near-infrared; RE = red edge; L = 0.5; C1 = 6; C2 = 7.5.
Table 4. Architectures of the artificial neural networks used: Radial Basis Function (RBF) and Multilayer Perceptron (MLP).
ClassArchitectureInput VariablesHidden LayersOutput
PMI_BBRBFGreen band, SAVI, ADD1 layer, 20 neuronsPMI_BB
PMI_BBMLPGreen band, MNLI, ADD2 layers (20, 14 neurons)PMI_BB
PMI_OBRBFGreen band, MNLI, ADD1 layer, 20 neuronsPMI_OB
PMI_OBMLPGreen band, MNLI, ADD2 layers (20, 6 neurons)PMI_OB
PMI_BB = brown and black classes; PMI_OB = orange, brown, and black classes; RBF = Radial Basis Function; MLP = Multilayer Perceptron; SAVI = Soil-Adjusted Vegetation Index; MNLI = Modified Non-Linear Index; ADD = Accumulated Degree Days.
Table 5. Best variables for estimating peanut maturity indices.
Output VariablesInput VariablesR2MSEP
PMI_BBGreen band; NDVI; SAVI; ADD0.872.61
PMI_OBGreen band; MNLI; SAVI; ADD0.862.50
PMI_BB = brown and black classes; PMI_OB = orange, brown, and black classes; RBF = Radial Basis Function; NDVI = Normalized Difference Vegetation Index; MLP = Multilayer Perceptron; SAVI = Soil-Adjusted Vegetation Index; MNLI = Modified Non-Linear Index; ADD = Accumulated Degree Days; R2 = adjusted coefficient of determination; MSEP = mean squared error of prediction.
Disclaimer/Publisher’s Note: The statements, opinions and data contained in all publications are solely those of the individual author(s) and contributor(s) and not of MDPI and/or the editor(s). MDPI and/or the editor(s) disclaim responsibility for any injury to people or property resulting from any ideas, methods, instructions or products referred to in the content.