


Abstract
Objective: The sub bandage pressure results from a complex interaction between the bandage types, applied tension, number of layers and surface hardness. In this paper, three parameters i.e. hardness of the limb, stretch (%) and number of bandage layers are changed at three levels and their individual and interactive effect on the sub bandage pressure for different types of high compression bandages is studied. Method: The study has been conducted on two types of high compression bandages (woven and knitted) using the Box-Behnken Design. The data obtained for sub bandage pressure of bandage samples on three plastic tubes with layer of foam of varying hardness is used to carry out response surface regression analysis and analysis of variance to find the contribution of each parameter on the sub bandage pressure for high compression bandages. Results: The effect of hardness is significant specifically in the case of woven bandages with some interactive effects with stretch (%) in knitted bandages. The sub bandage pressure increases with the increase in stretch% for all the samples but larger pressure differences were observed for increase in stretch % for limbs with higher hardness. The sub bandage pressure also increases with the number of bandage layers but a linear relationship was not observed between sub bandage pressure and the number of layers at low stretch %. The regression equations for various responses agree well with the experimental data as indicated by higher values of coefficient of determination. Conclusion: The number of layers and the stretch% contribute substantially towards the sub bandage pressure for both woven and knitted bandages. The contribution of hardness of the limb is found to be insignificant for knitted bandage sample which has the tightest structure and high initial modulus. The regression equations generated for various responses can be used to predict the sub bandage pressure of bandages during application of high stretch bandages.
1. Introduction
Compression therapy is the principal treatment for leg ulcers associated with venous diseases. Usually the general form of Laplace equation which predicts the relationship between pressure, bandage tension and leg radius, has been used to confirm whether or not a prescribed bandage is providing the compression and graduation required by the patient. The equation predicts the pressures that can be observed on solid objects or objects with curved surfaces. However, the human leg is neither solid nor has a constant curved structure. The direct relationship that occurs in solid objects, therefore, may not apply to bodies with deformable surfaces like human leg [1, 2]. Although the Laplace equation has been modified by several authors over time [3, 4, 5] opredict the sub bandage pressure under compression bandages on the human leg but it becomes evident when attempting to apply such formulae that they do not accurately predict sub bandage pressure. Actually sub bandage pressure results from a complex interaction between the bandage types, tension applied, number of layers and surface hardness [6]. Most of the previous studies [7, 8, 9] deal with the effect of individual parameters on sub bandage pressure. This study aims at investigating both individual and the interactive effect of all these parameters on the sub bandage pressure generated in high compression bandages of different types.
2. Experimental
2.1. Materials
Six bandage samples (woven and knitted) were used for the study. The physical properties of the samples have been shown in Table 1.
Table 1.
Physical property of the bandages.
2.2. Experimental Design
The individual and interactive effect of hardness of the limb, stretch (%) and number of bandage layers on sub bandage pressure was studied at three levels using Box-Behnken Design. The actual values of different parameters corresponding to coded levels are mentioned in Table 2.
Table 2.
Box-Behnken design.
The concept of Box-Behnken design makes logical use of the 2k factorial [10, 11]. To build a Box-Behnken design, factors are taken in pairs followed by building 22 factorials for all possible pairs while holding the other factors at the centre point. Box-Behnken design is considered to be very efficient when compared with the full factorial design. Through the use of this design, information on single linear effects, single quadratic effects along with the two factor linear interaction can be obtained. In a 3 factor Box-Behnken design at three levels, 12 treatment combinations are obtained. Three centre point observations are added for considering experimental error due to unaccounted factors (Table 3).
Table 3.
Sub bandage pressure values for bandage samples.
3. Methods
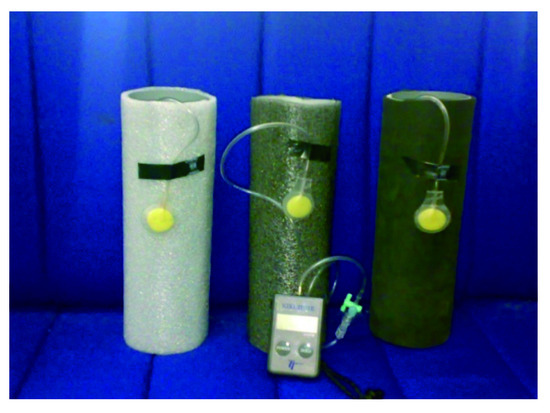
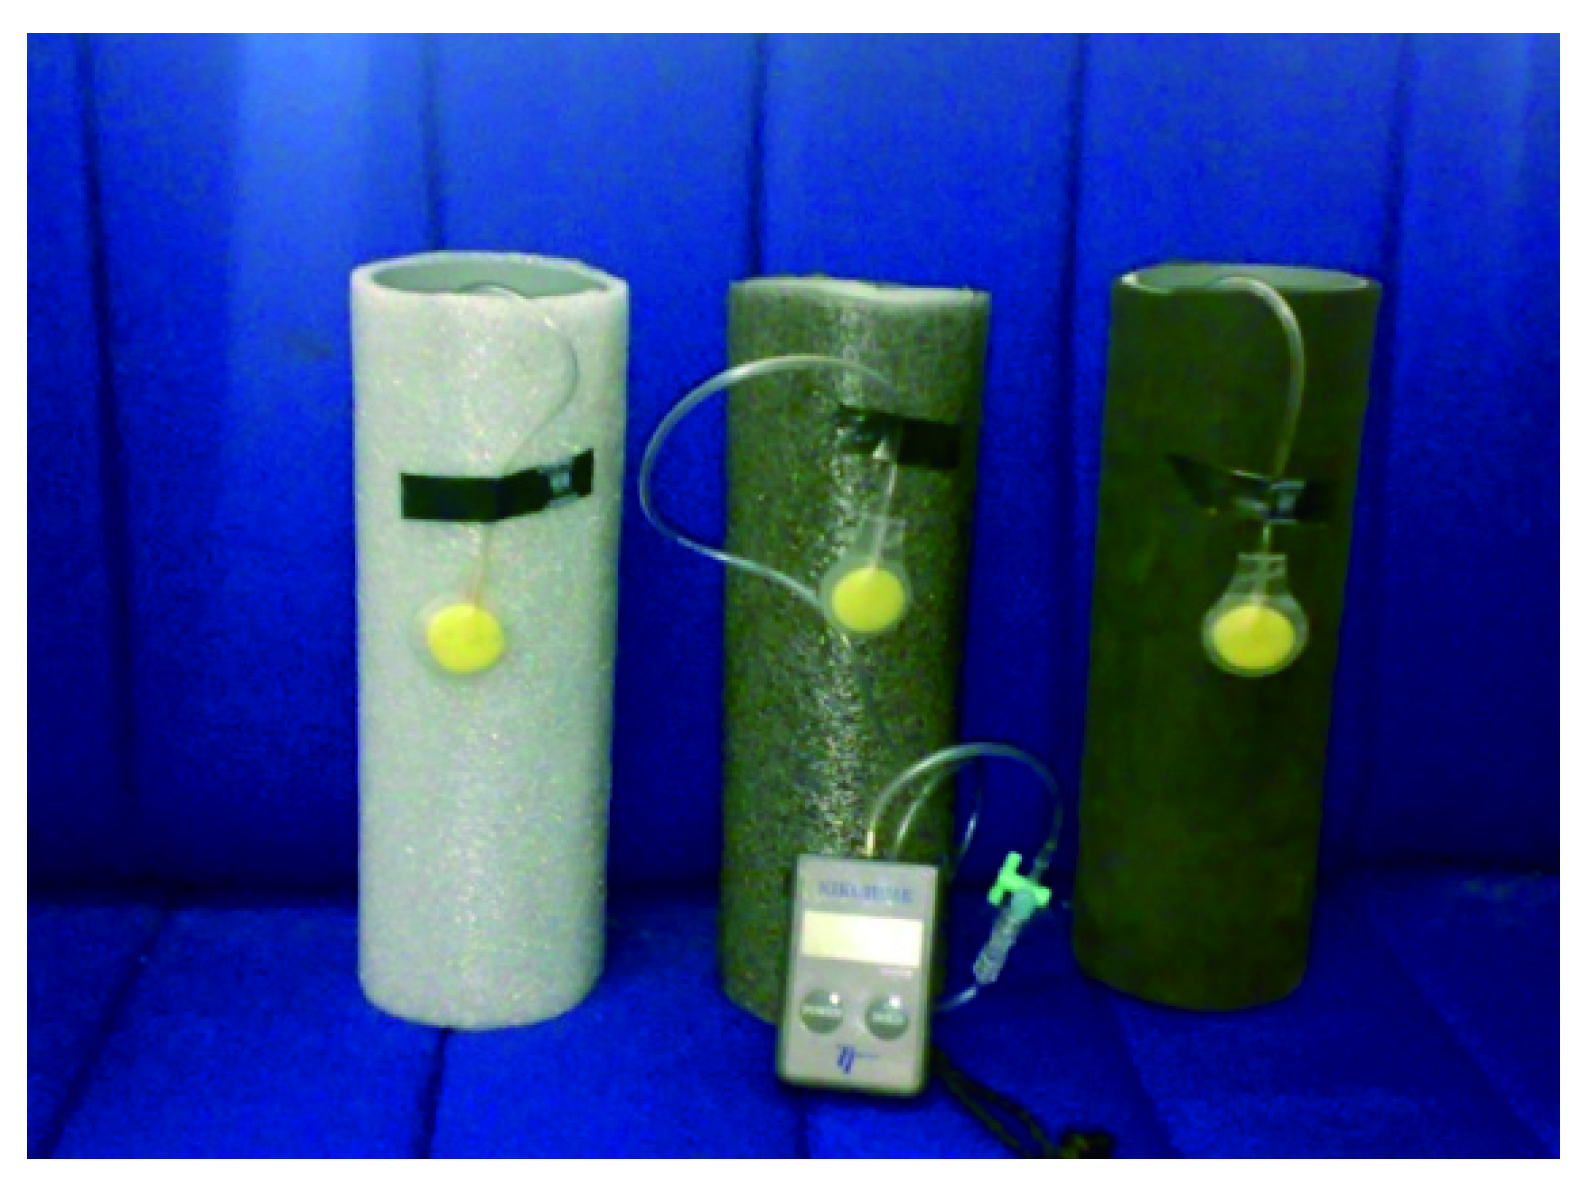
The samples were used to measure the sub bandage pressure by applying them on three rigid plastic tubes having 32.5 cm circumference covered with a layer of foam of different hardness (Figure 1). The pressure was assessed under two, three and four layers of bandages in accordance with 50% and 66% overlap spiral and 50% overlap figure of eight bandaging respectively. The stretch% was varied at 30%, 40% & 50% with the sensor mounted under the first layer on foams of increasing hardness (10-30 degrees). The sub bandage pressure was measured using the Kikuhime pressure measuring device after proper calibration. Ten measurements were taken for each sample for each combination and the error was found to be less than 2% at 95% confidence level.
Figure 1.
Plastic tube with a layer of foam.
In order to study the individual and interactive effect of each parameter on the sub bandage pressure, response surface regression equations were developed for sub bandage pressure and hardness of the limb, stretch (%) and number of bandage layers by backward elimination method.
Analysis of variance was carried out and the contribution (%) of each parameter on the sub bandage pressure was calculated from the following expression:

where, SSp = Sum of squares of the parameter, dfp = Degrees of freedom of the parameter, MSe = Mean square of pooled error, and SST = Total sum of squares.
In order to study the individual and interactive effect of each parameter on the sub bandage pressure, response surface regression equations were developed for sub bandage pressure and hard-ness of the limb, stretch (%) and number of bandage layers by backward elimination method. The general relationship between the response Y (sub bandage pressure) and the different parameters is given as:
where, C0 is constant and C1, C2, ⋯ , C9 are coefficients of the regression equation, X1, X2 and X3 are the parameters, i.e. hardness of the limb, stretch (%) and number of bandage layers.
Y = C0 + C1X1 + C2X2 + C3X3 + C4X2 + C5X2 + C6X2 + C7X1X2 + C8X2X3 + C9X3X1
4. Results and Discussion
The sub bandage pressure values of woven and knitted bandage samples are shown in Table 3. The data is used to carry out response surface regression analysis and analysis of variance. The average of 10 readings for each sample is used to develop regression equation by using statistical software (STASTICA 8). The linear and polynomial equations are tried along with the interaction of the parameters, at 95% confidence level. The best fit equations for sub bandage pressure were generated. The equations are given in Table 4.
Table 4.
Regression equations for sub bandage pressure (mmHg).
It was observed that the hardness of the limb (X1) has an interactive effect on the sub bandage pressure in case of knitted bandage samples whereas the woven samples are influenced by all the three parameters with some interaction between the parameters in the woven sample WS1.
4.1. Effect of Hardness of the Limb
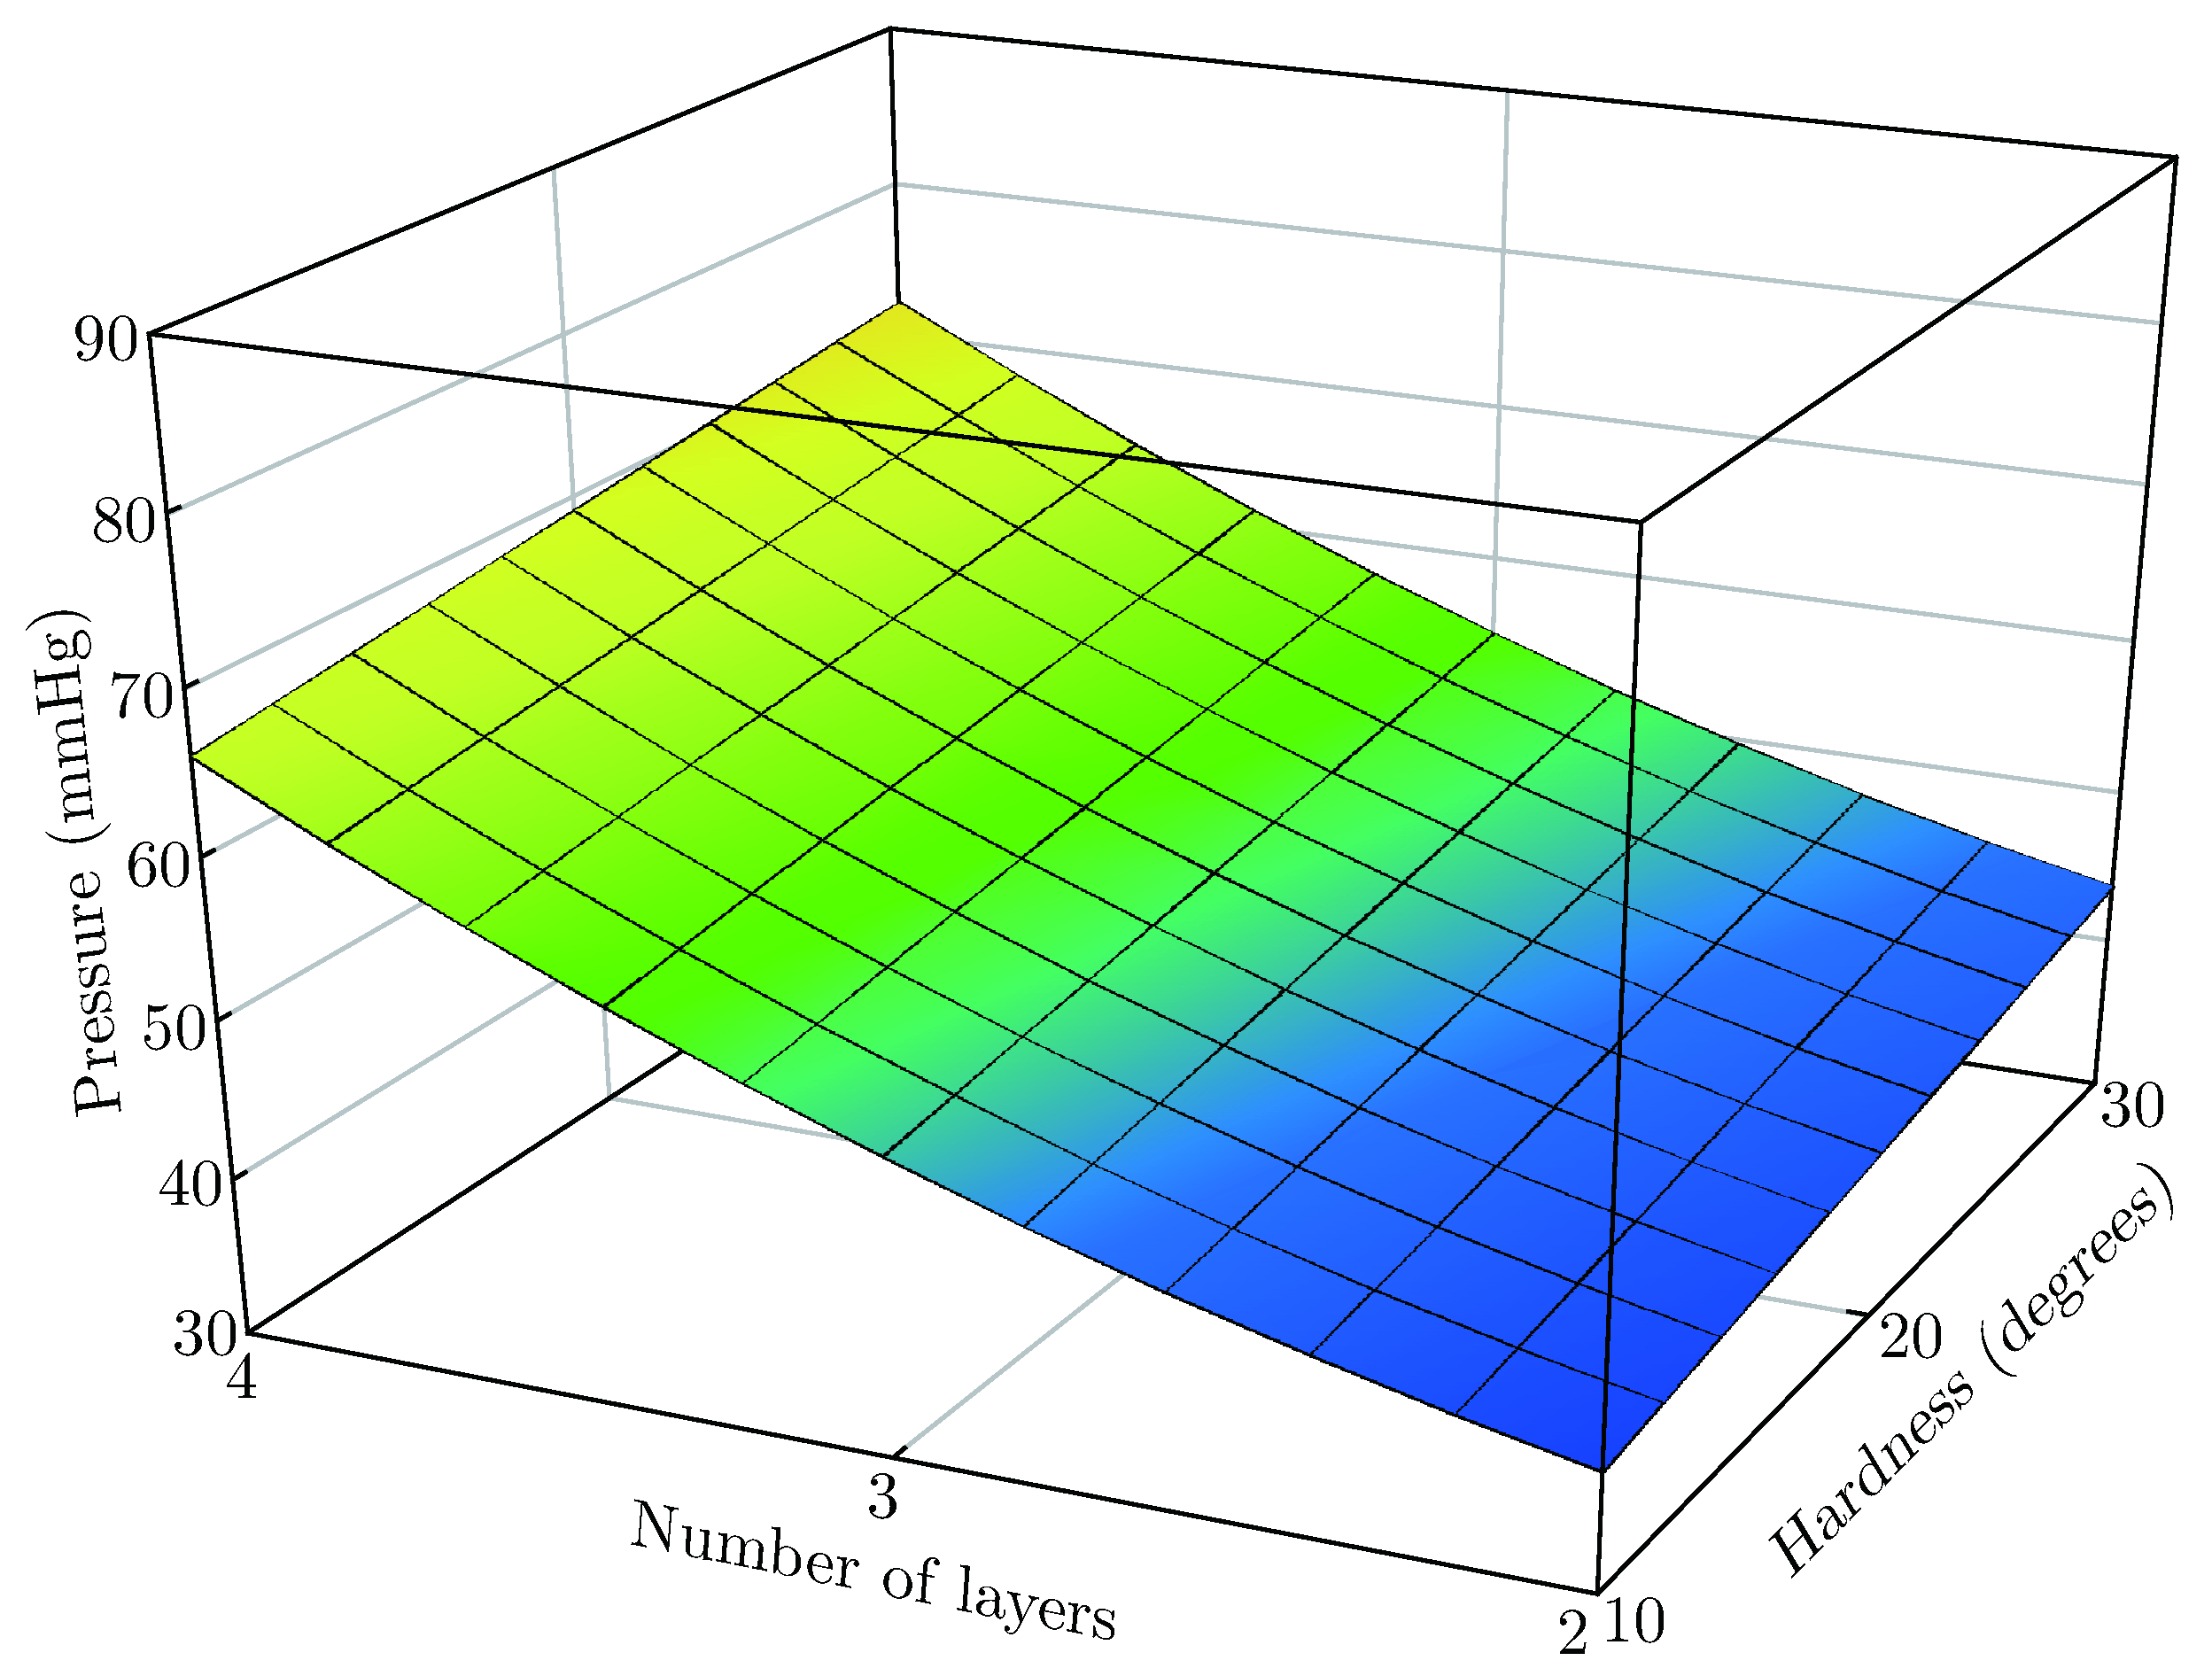
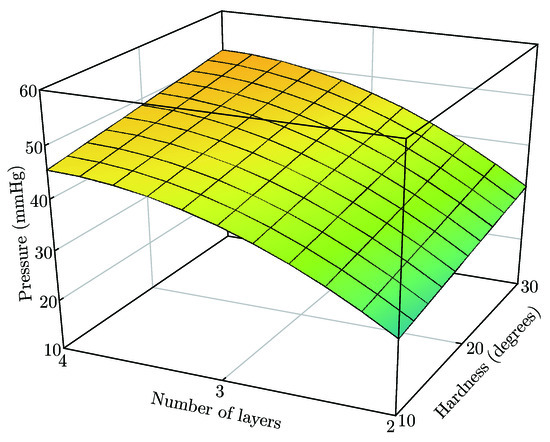
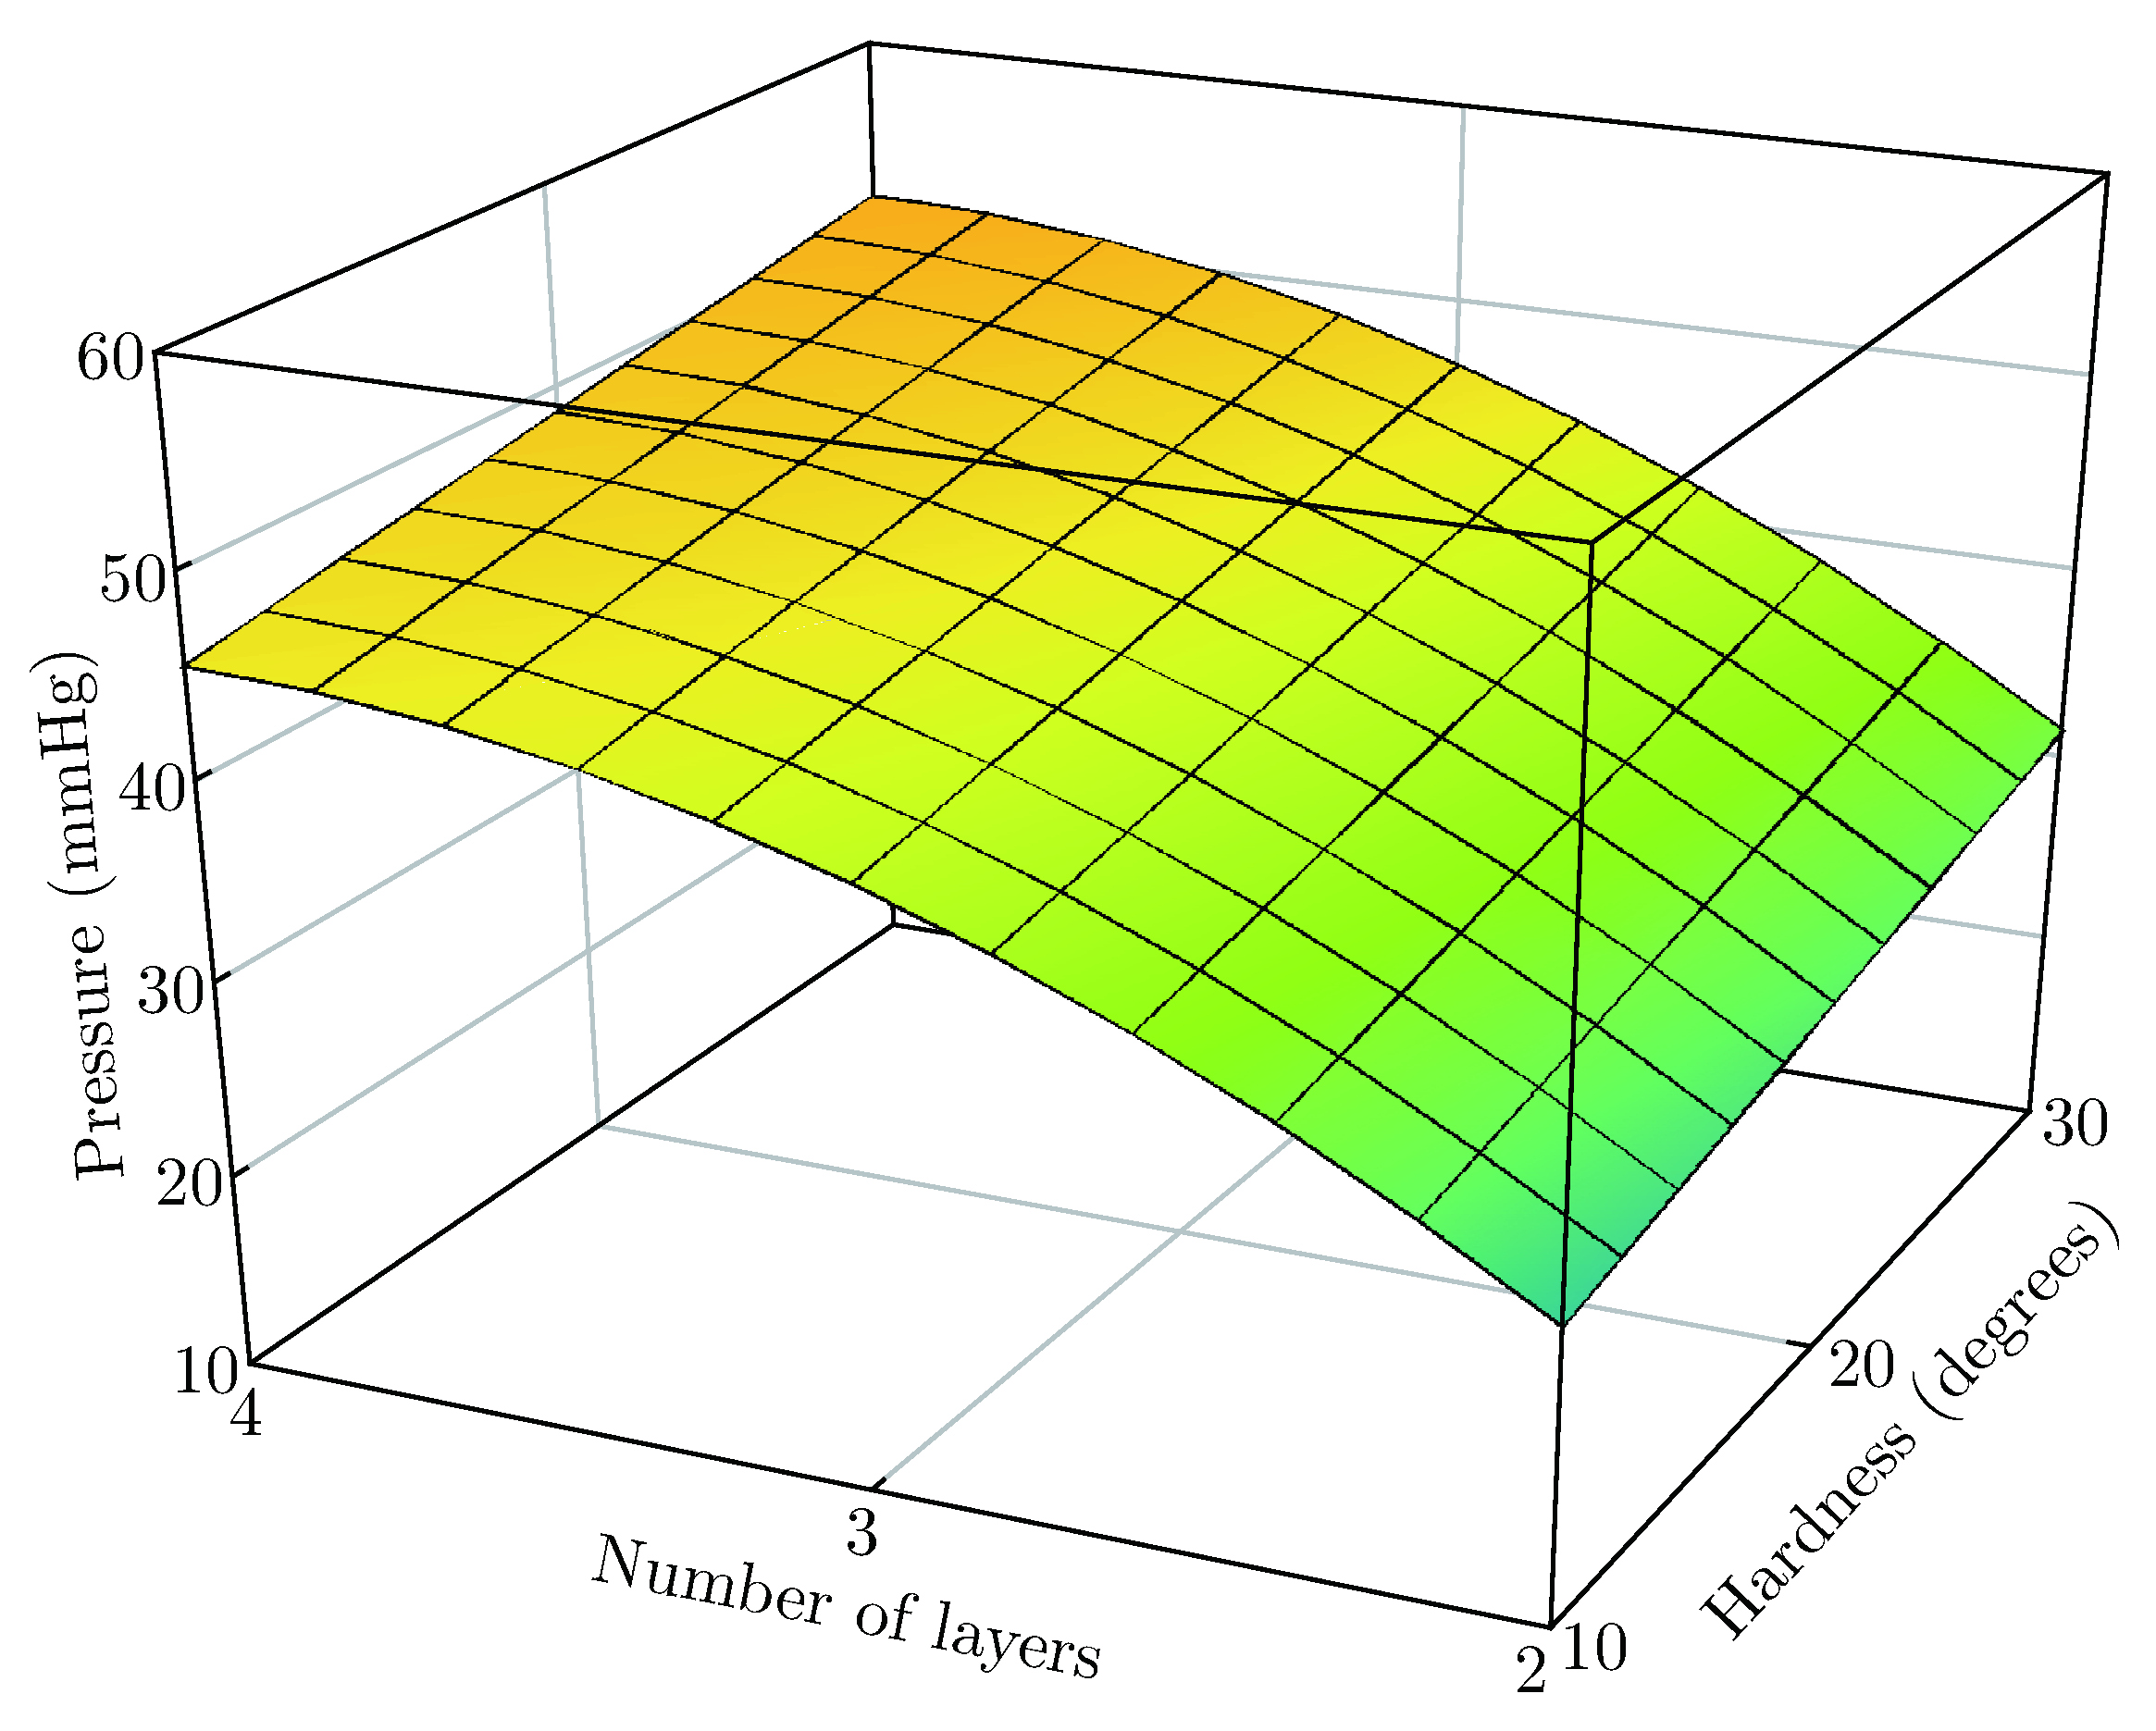
There was an observed increase in the sub bandage pressure (Figure 2 and Figure 4) when the sensor was mounted on foams of increasing hardness (10-30 degrees).The physical law of the Laplace equation is suitable for use when calculating pressure for materials applied to hard surfaces. However, when soft surfaces are involved, this relation is less direct, possibly due to changes in the hardness of the surface on which pressure is being measured. The results show that the recorded pressure changes when a bandage is applied to a given tube diameter at constant stretch (%) over foams of different hardness. This effect is significant specifically in the case of woven bandages with some interactive effects with stretch (%) in knitted bandages. It is also observed that the behaviour of bandage sample WS1 is quite similar to knitted sample KS4 in this regard, both showing an interactive effect of hardness with both stretch% and number of bandage layers. It is observed that both these samples have a close structure and highest number of elastic yarns in their structure. Also the tensile behaviour of all the samples indicates that the bandage samples that have low initial modulus and are easily stretchable show a significant effect of hardness on sub bandage pressure.
Figure 2.
Effect of number of bandage layers and hardness on sub bandage pressure of WS1.
Figure 3.
Effect of number of bandage layers and hardness on sub bandage pressure of WS2.
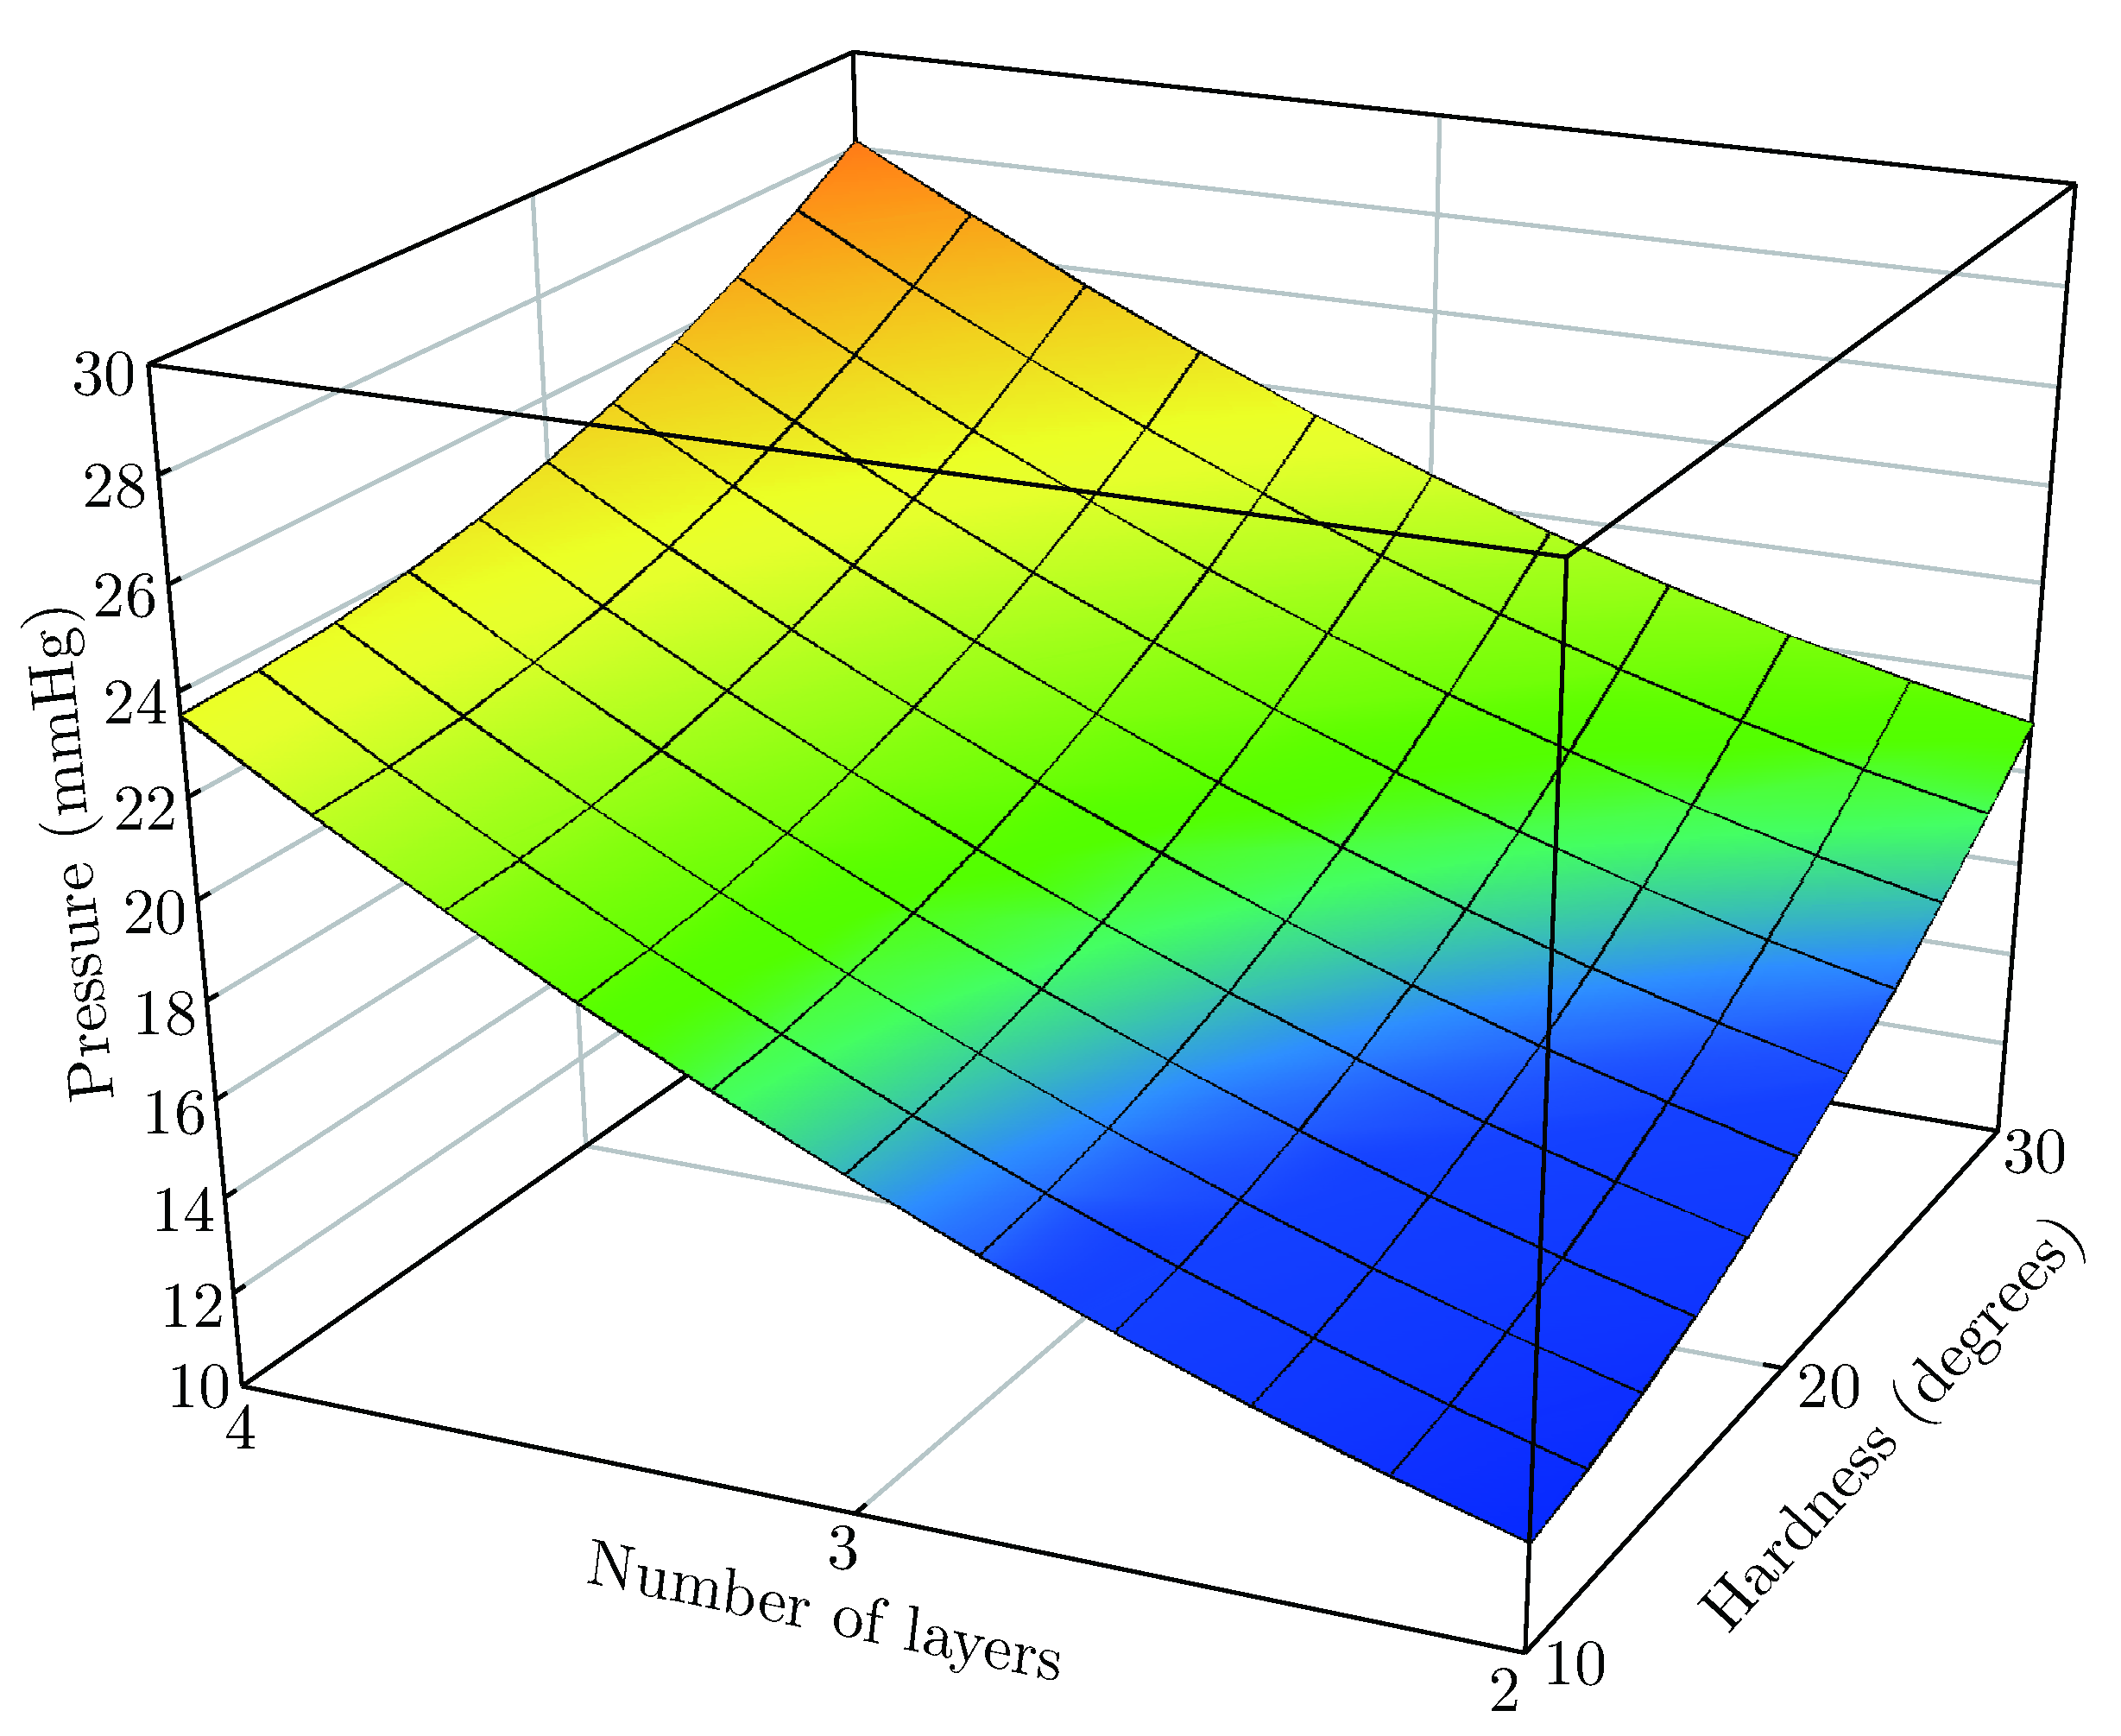
Figure 4.
Effect of number of bandage layers and hardness on sub bandage pressure of KS4.
4.2. Effect of Stretch (%)
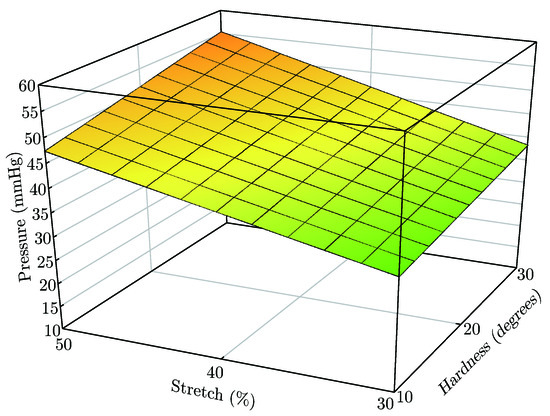
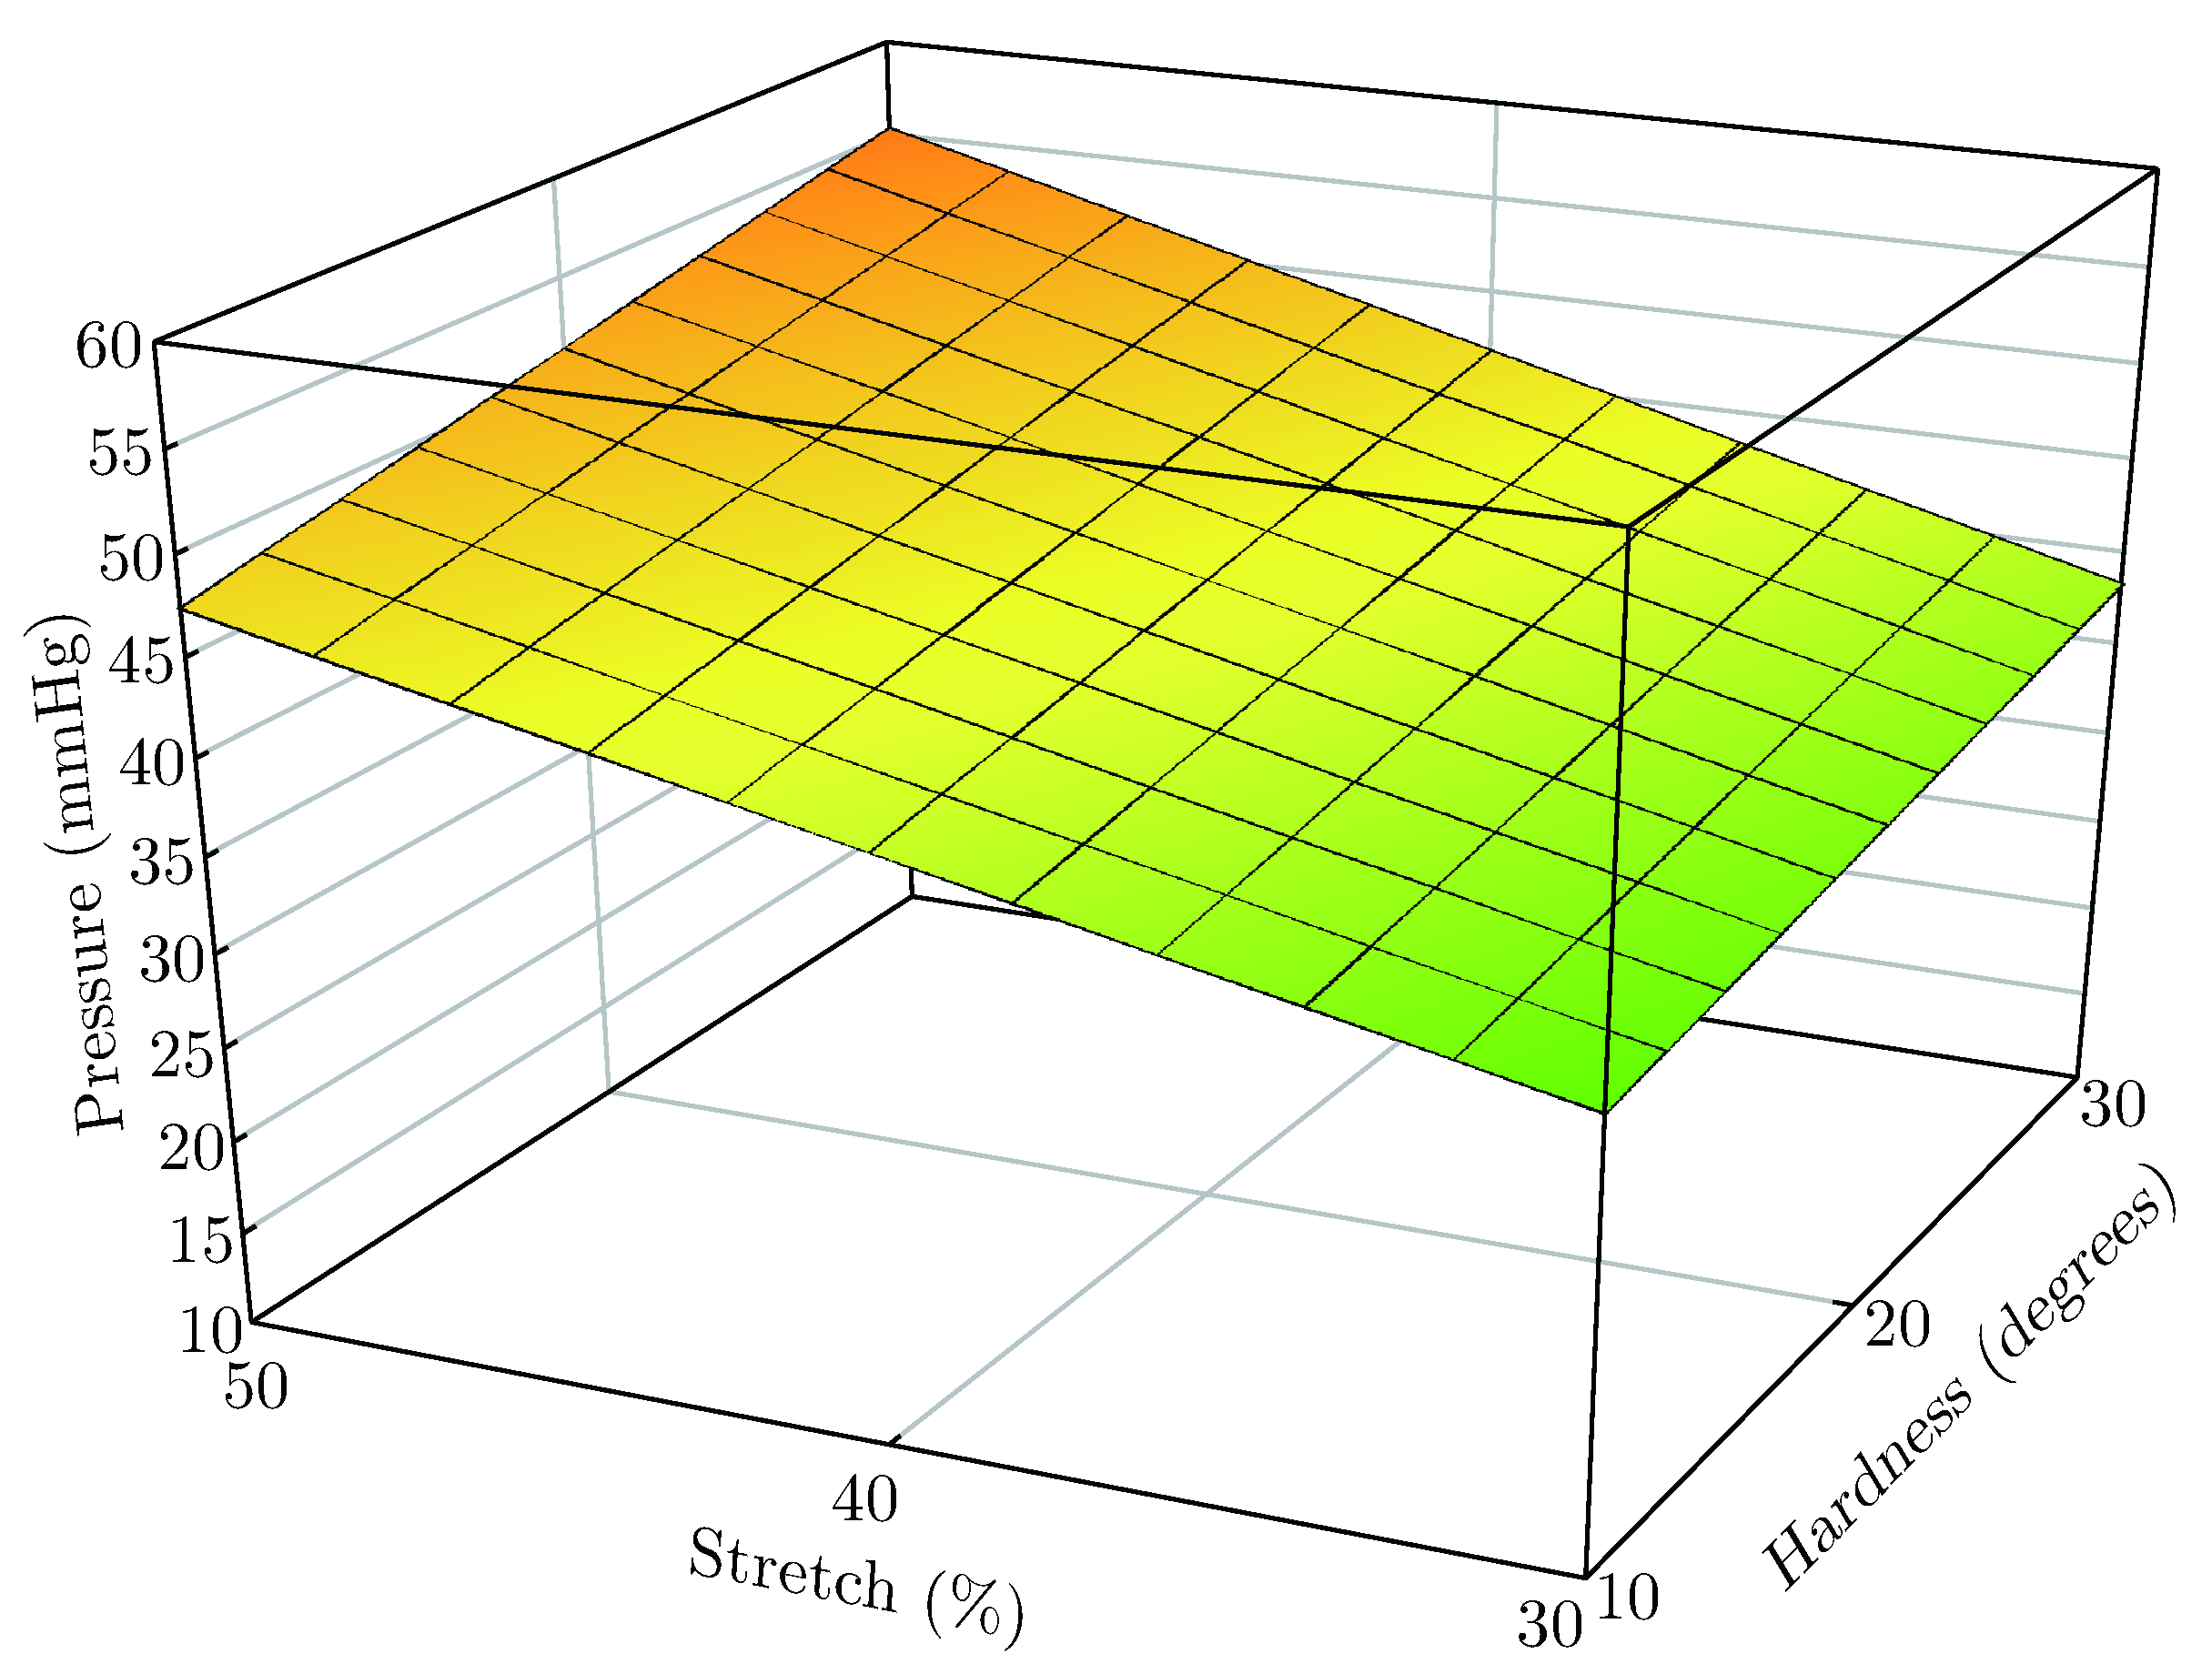
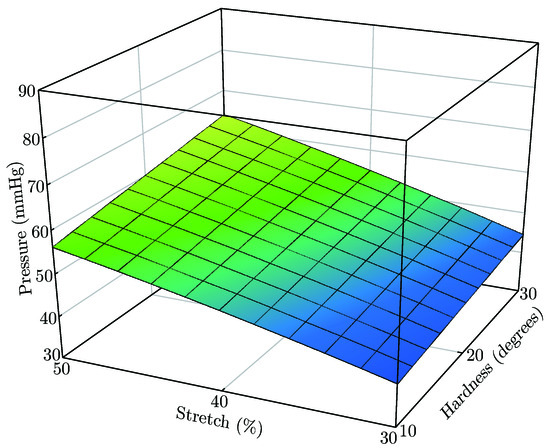
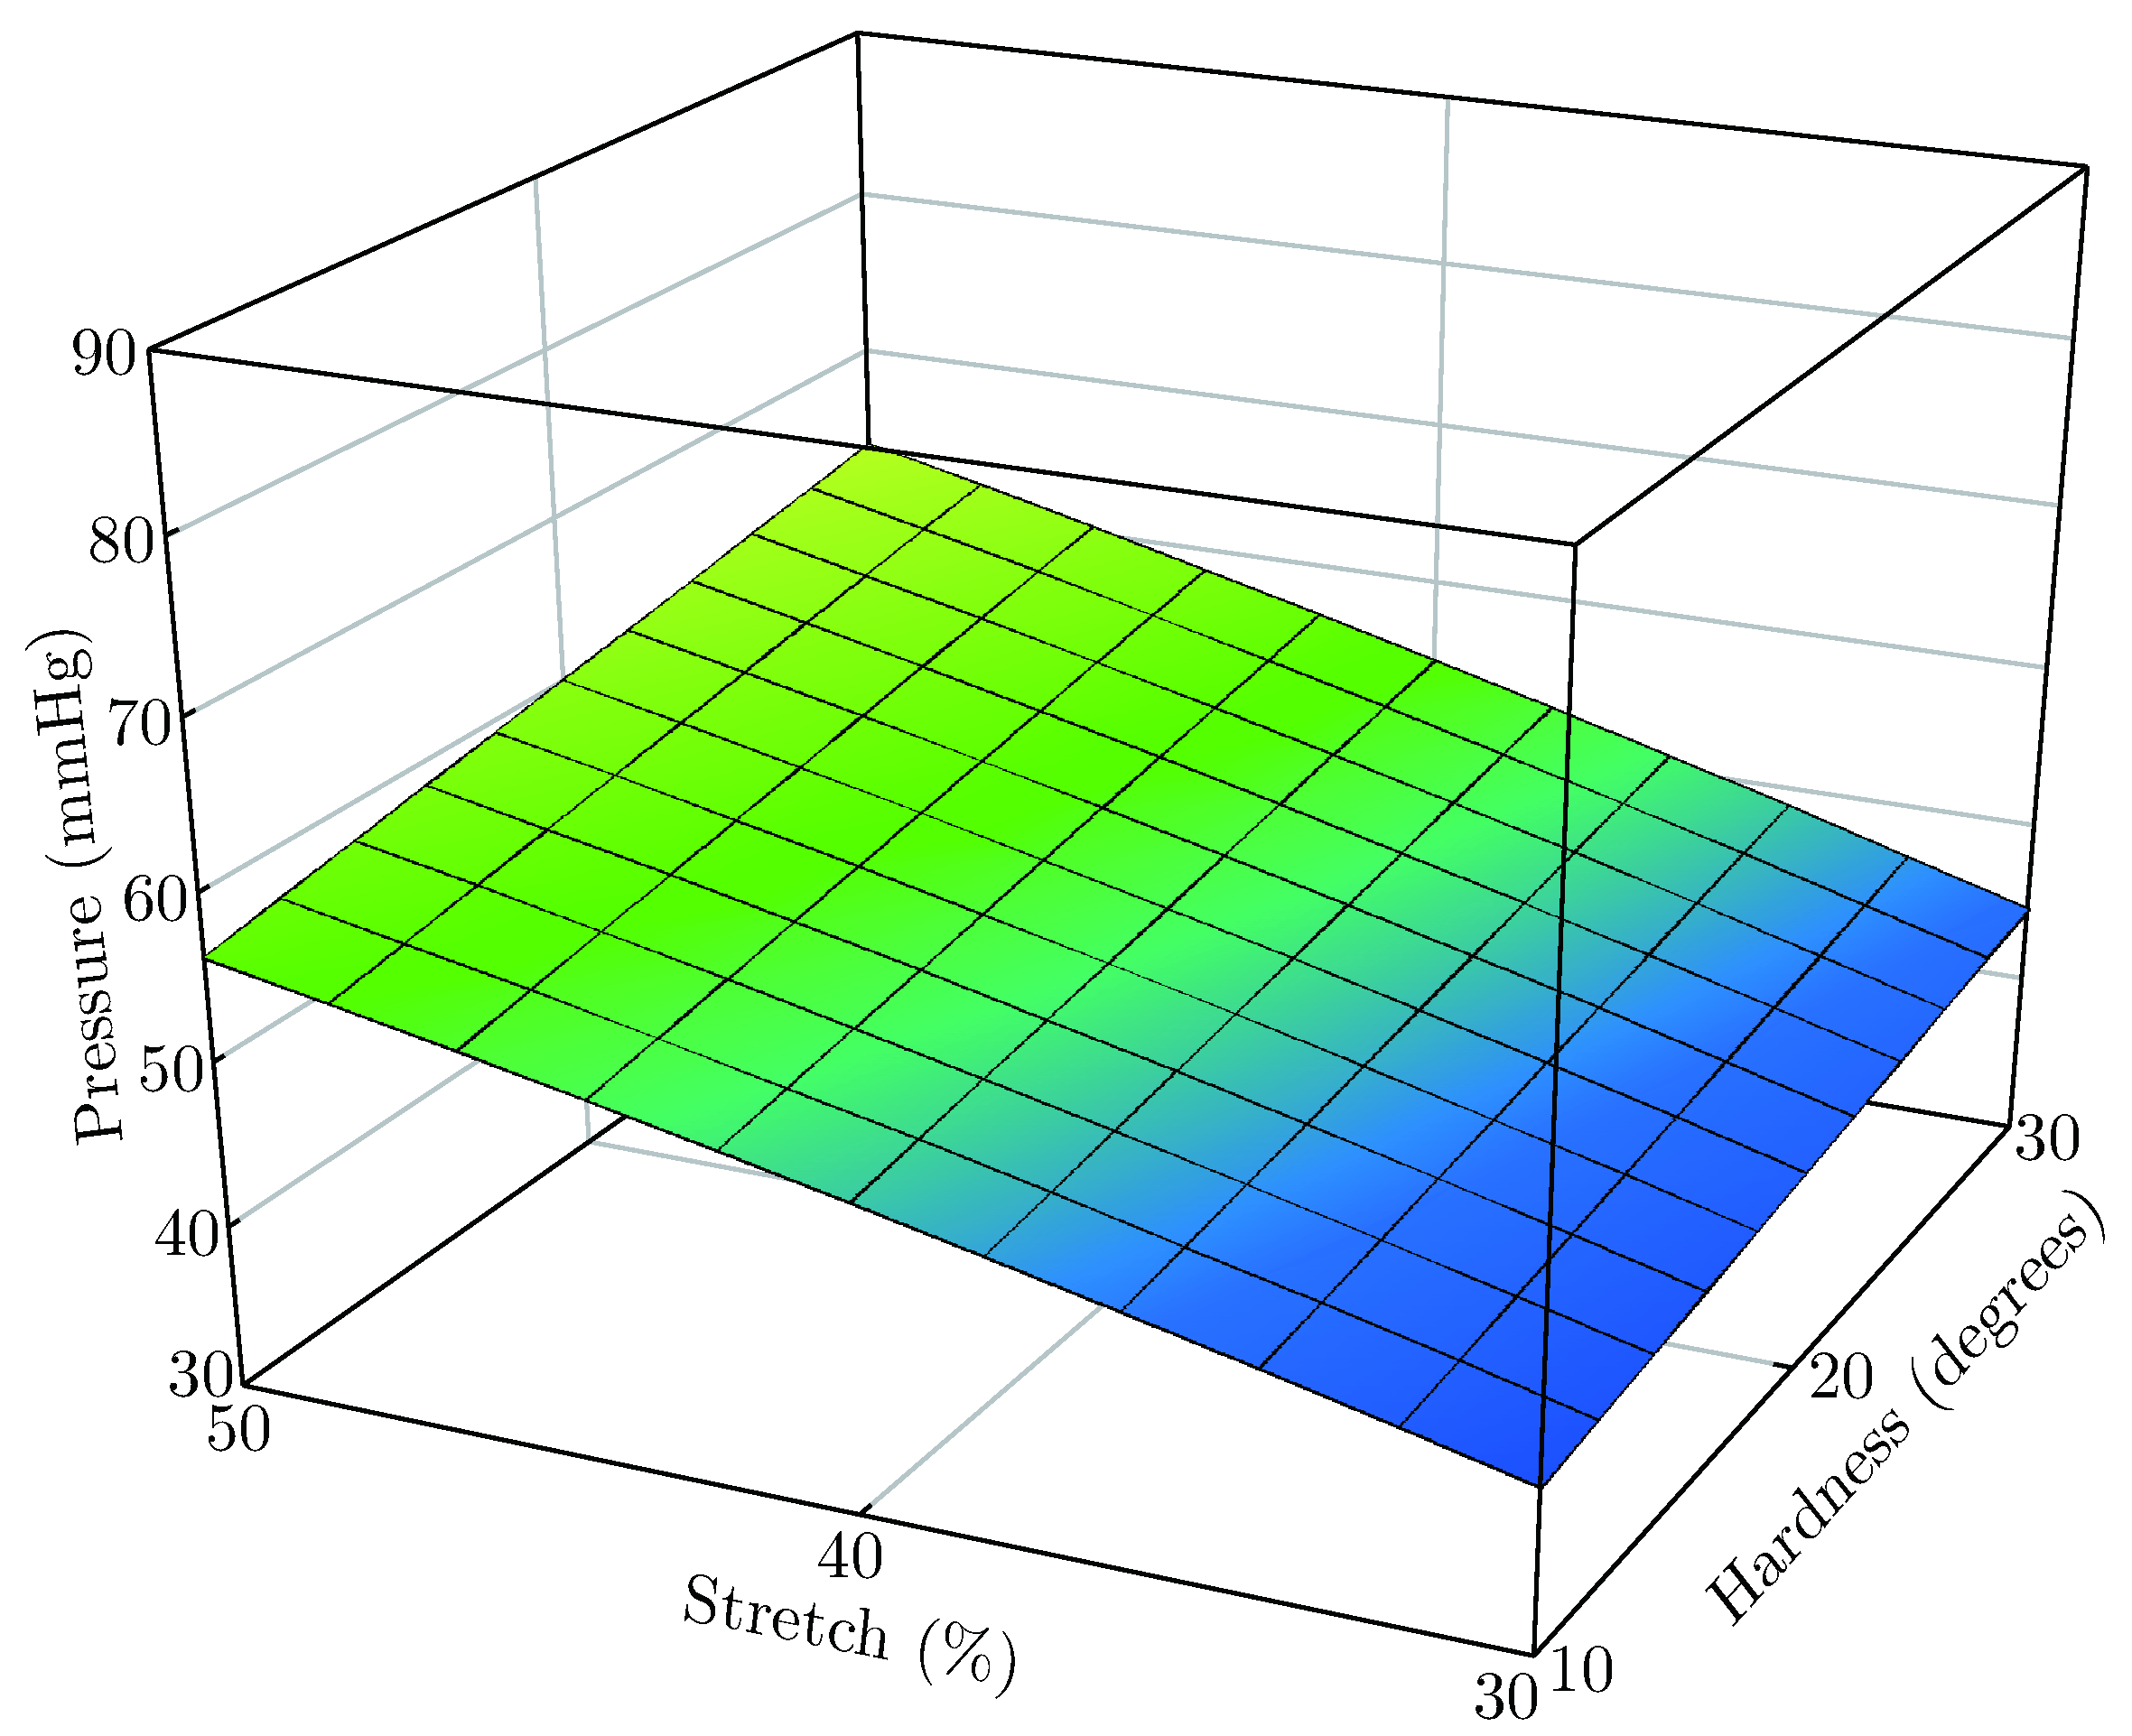
The sub bandage pressure increases with the increase in stretch (%) for all the samples but larger pressure differences were observed for increase in stretch (%) for limbs with higher hardness (Figure 5 and Figure 6). The harder the surface more is the reaction force to the applied tension for both the woven and the knitted bandage samples and more will be the pressure value in terms of mm of Hg.
Figure 5.
Effect of stretch % and hardness on sub bandage pressure of WS1.
Figure 6.
Effect of stretch % and hardness on sub bandage pressure of KS4.
4.3. Effect of Number of Bandage Layers
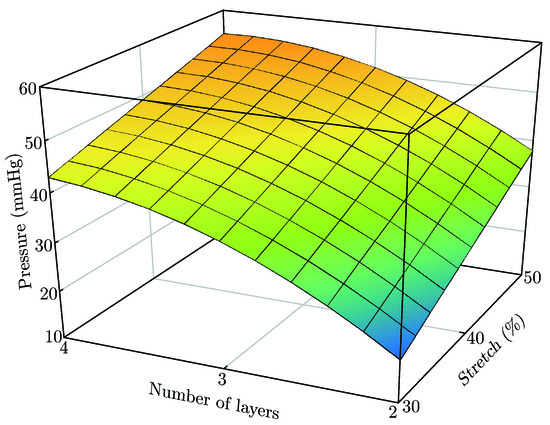
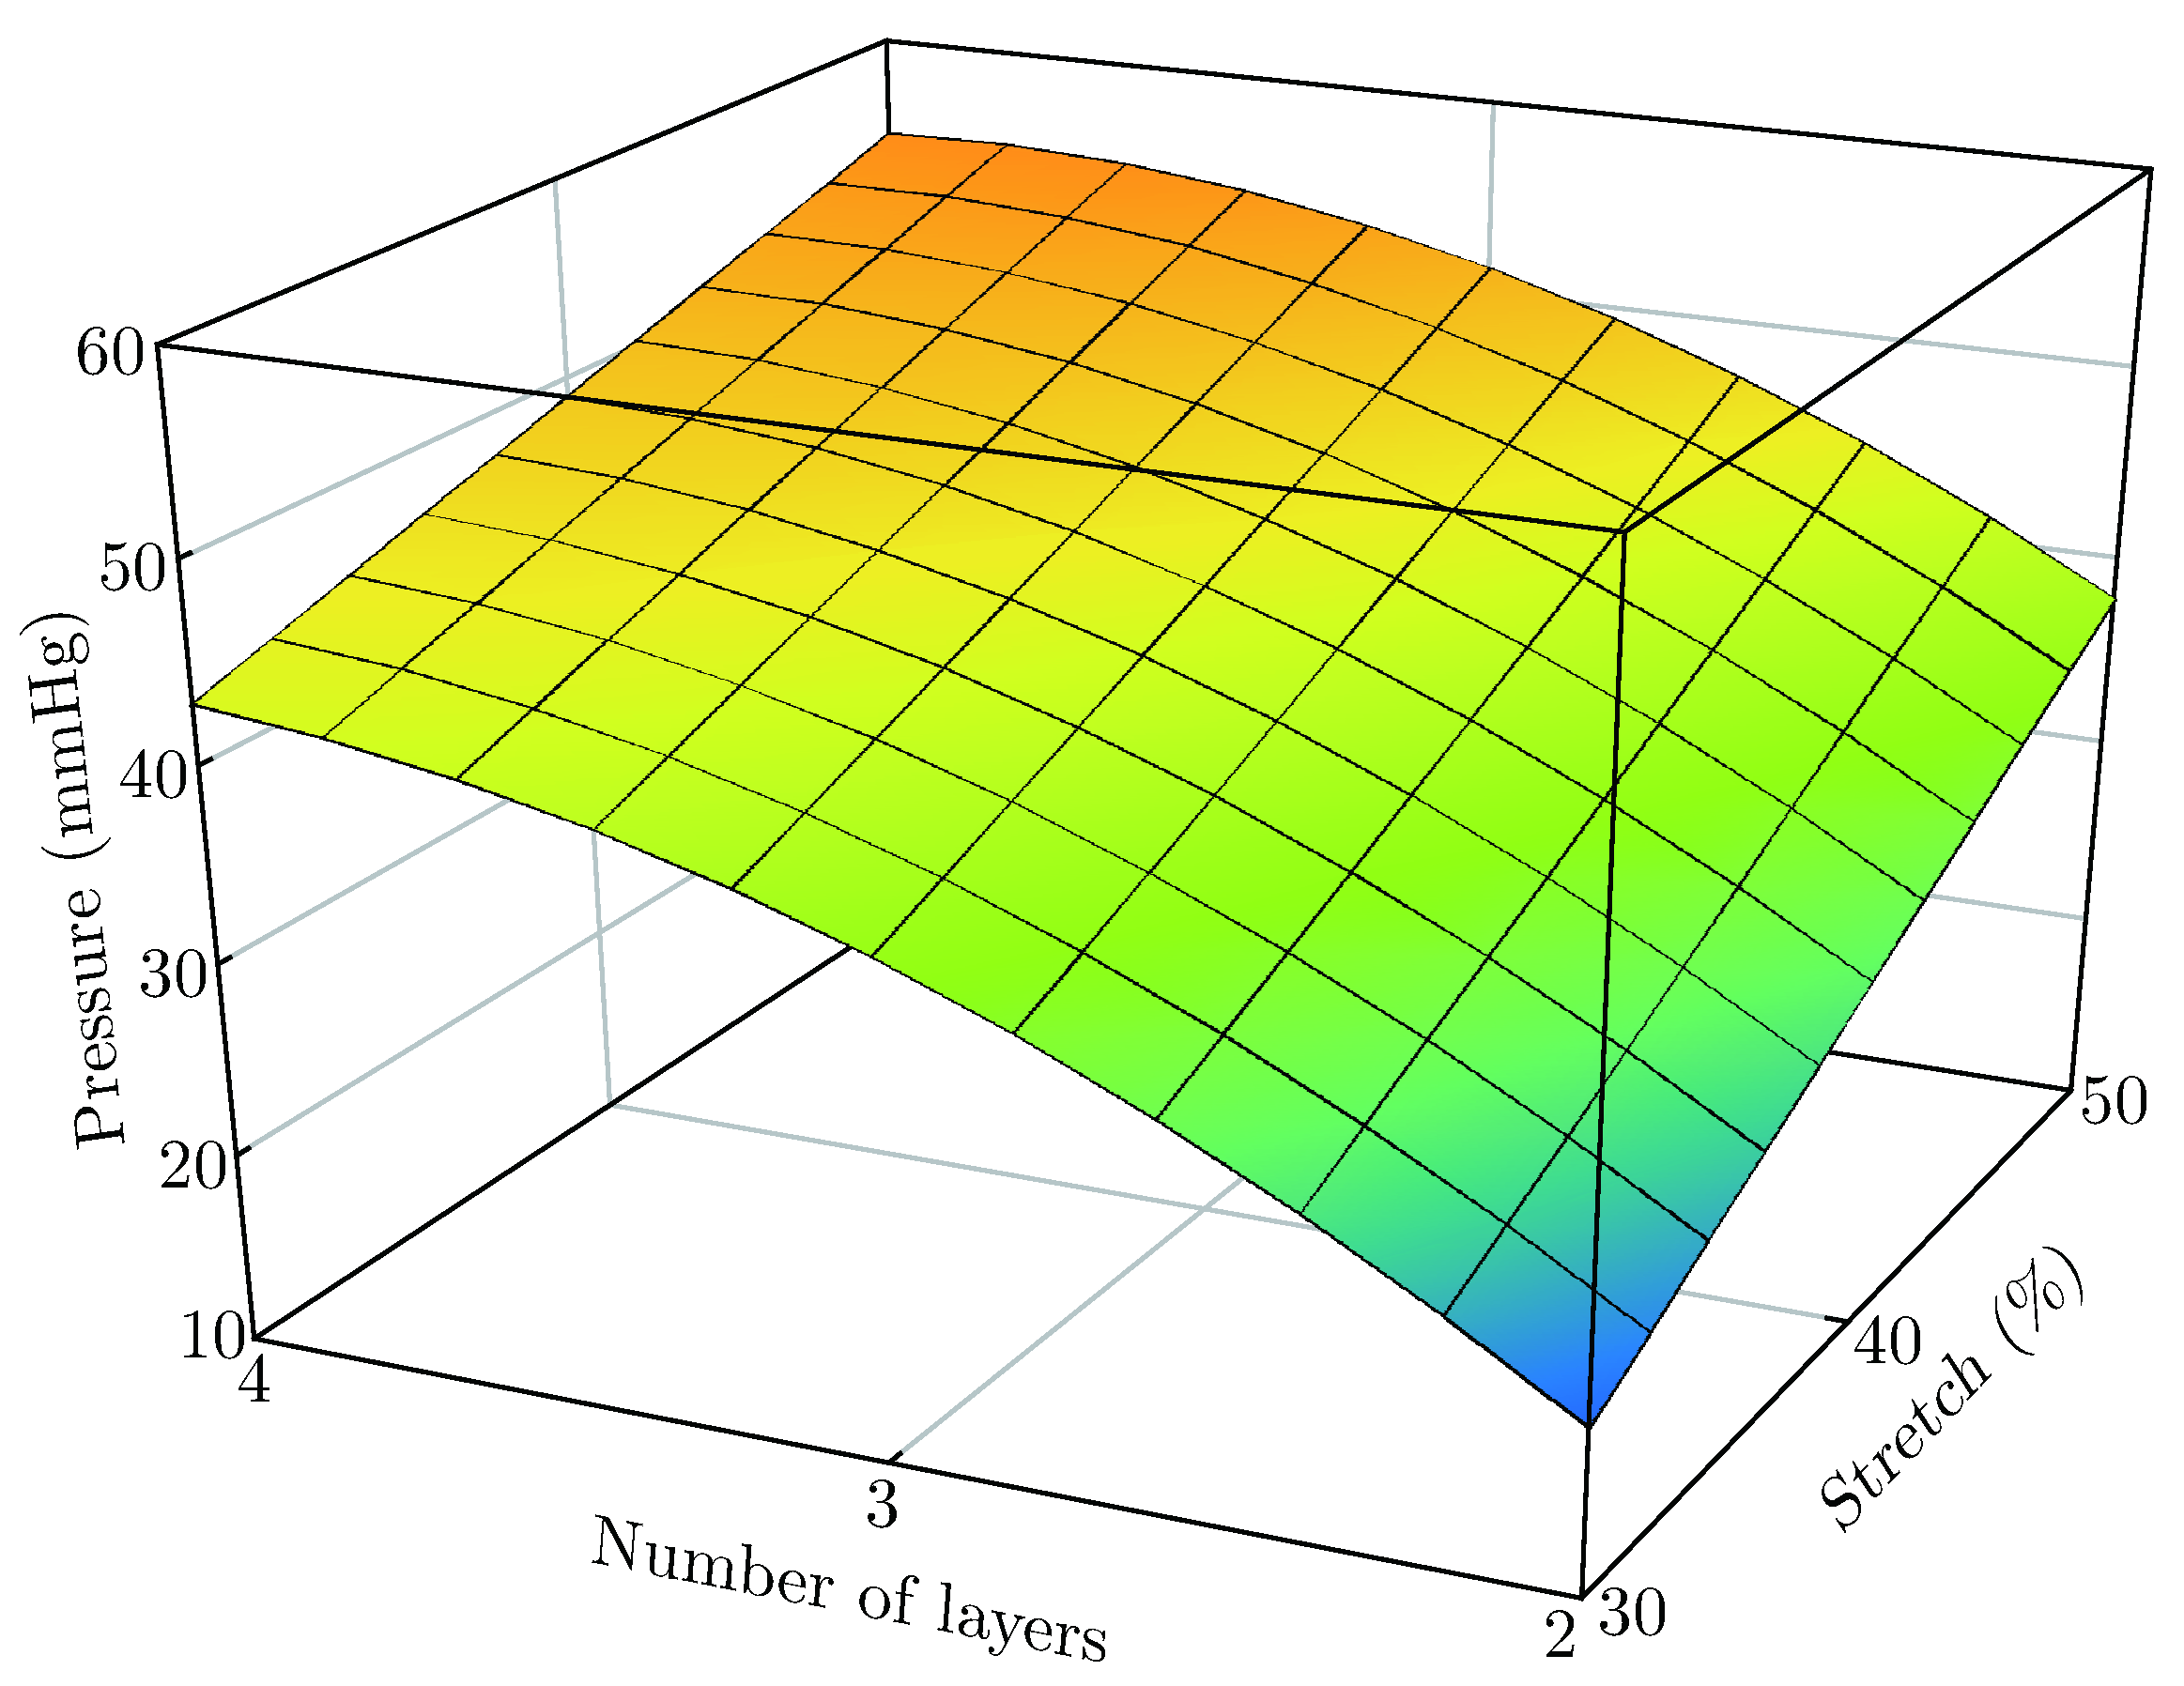
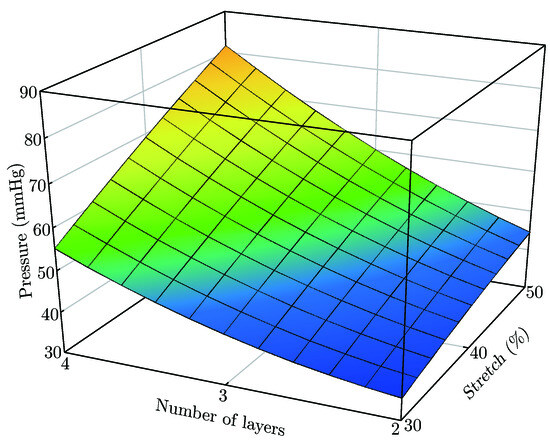
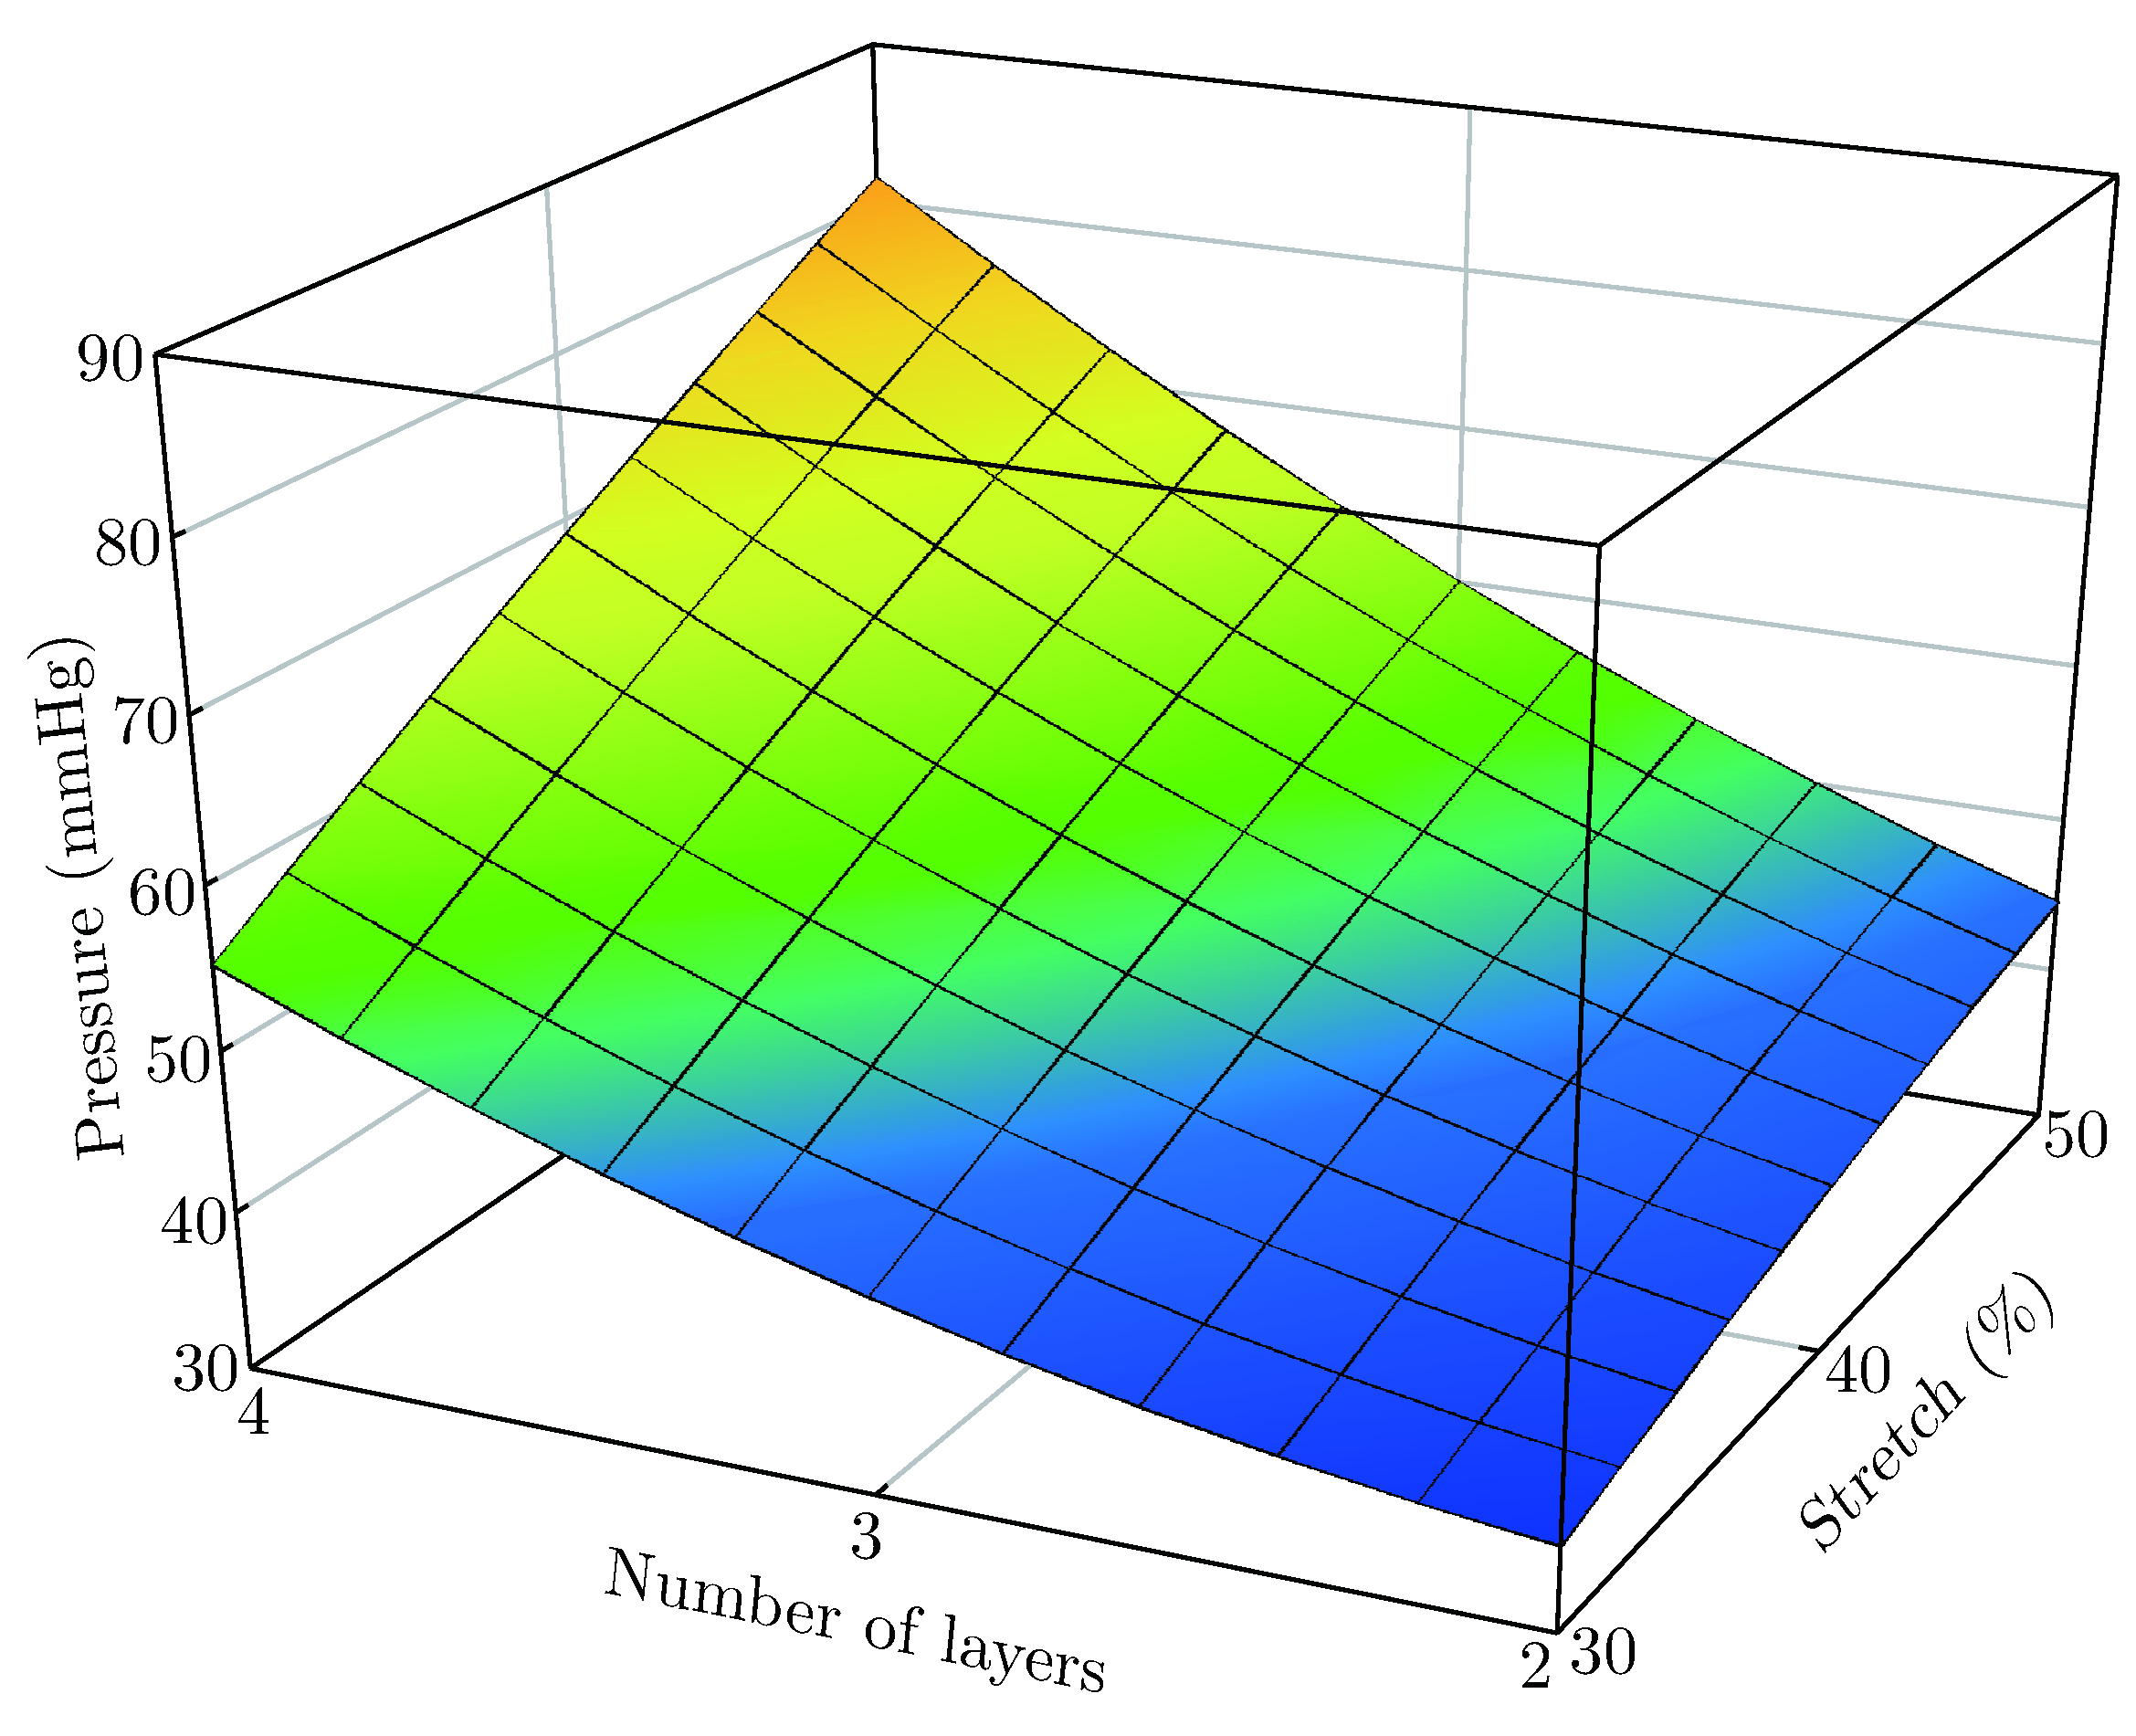
The sub bandage pressure increases with the number of bandage layers but the relationship between sub bandage pressure and the number of layers at low stretch (%) (Figure 7 and Figure 8) was not linear in nature. However, linearity was approached when stretch % was high. The results show that at lower stretch (%) associated with the compression bandages, the number of bandage layers does not produce a linear response in the measured pressure, which was also indicated through the Laplace equation.
Figure 7.
Effect of stretch % and number of bandage layers on sub bandage pressure of WS1.
Figure 8.
Effect of stretch % and number of bandage layers on sub bandage pressure of KS4.
4.4. Analysis of Variance
Analysis of variance was carried out to find the importance of each parameter on the sub bandage pressure of all bandages. The contribution of each parameter on the sub bandage pressure is shown in Table 5.
Table 5.
Contribution (%) of parameters on sub bandage pressure-ANOVA.
It is observed that the effect of these parameters on the sub bandage pressure is dependent on the bandage type. Number of bandage layers has highest contribution and stretch% also contributes substantially in the variation of sub bandage pressure in all the bandage samples.
The hardness of the limb contributes significantly in the case of woven but its contribution% in case of knitted bandages is quite low. Also for the knitted sample KS4 the contribution is not significant at 95% confidence level.
4.5. Prediction of Sub Bandage Pressure
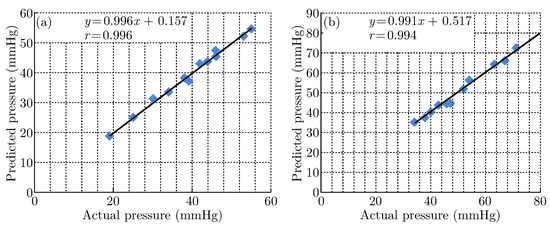
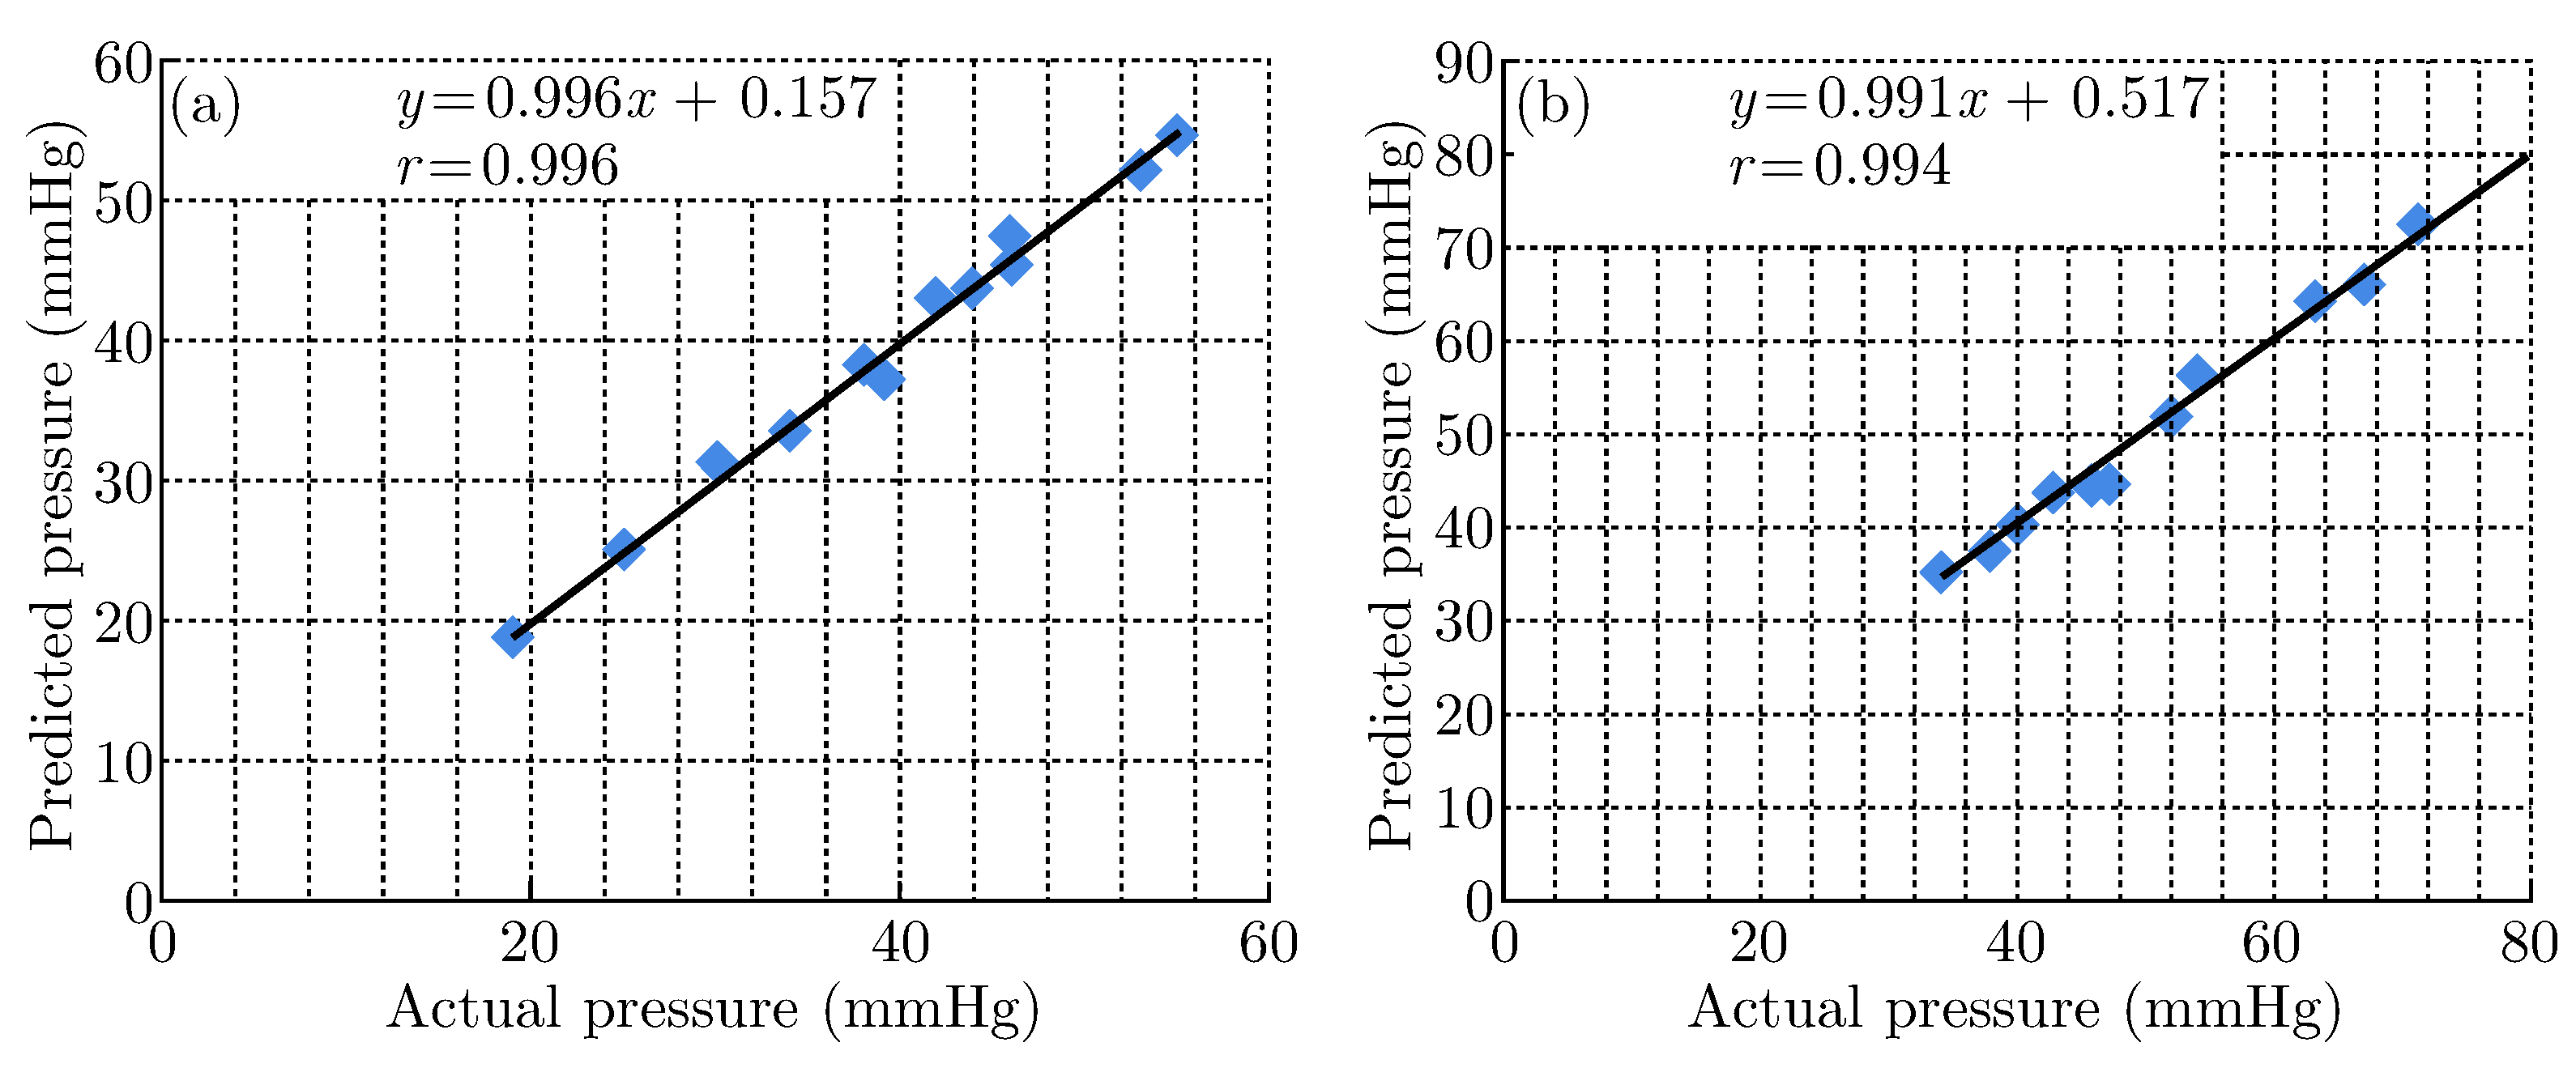
High value of coefficient of determination (R2) (Table 4) indicates that the said equations explain the variability in the sub bandage pressure to a very good level. Therefore, these equations can be used to predict the sub bandage pressure of bandage samples. The correlation between the actual and the predicted pressure values (mmHg) for all the bandage samples is shown in Figure 9. The correlation coefficient between actual and predicted sub bandage pressure is 0.99, 0.982, and 0.988 for the knitted samples and 0.99 for all the woven samples.
Figure 9.
Actual vs predicted pressure for woven samples: (a) WS1 (b) KS4.
5. Conclusions
In the present investigation, the effect of hardness of the limb, stretch% and number of bandage layers on the sub bandage pressure have been found to be significant. The sub bandage pressure values depend on the bandage structure type as well (knitted or woven construction). As the sensor was mounted on foams of increasing hardness (10-30degrees) there was an increase in the sub bandage pressure. This effect is significant specifically in the case of woven bandages with some interactive effects with stretch (%) in knitted bandages. Also the contribution of hardness of the limb is found to be insignificant for knitted sample which has the closest construction and high initial modulus. The samples that are easily stretchable show a significant effect of hardness of the limb on which the bandage is wrapped. The sub bandage pressure increases with the increase in stretch% for all the samples but larger pressure differences were observed for increase in stretch % for limbs with higher hardness. Moreover the stretch% contributes substantially towards the sub bandage pressure in both the woven and knitted samples (about 31%). The sub bandage pressure also increases with the number of bandage layers but a linear relationship was not observed between sub bandage pressure and the number of layers at low stretch %. However, linearity was approached when stretch % was high. The contribution of number of bandage layers in sub bandage pressure for both woven and knitted bandages is quite high (about 62% in woven and 69% in knitted). The regression equations for various responses agree well with the experimental data as indicated by higher values of coefficient of determination. Therefore, these equations can be used to predict the sub bandage pressure of bandages during application of high stretch bandages.
References
- Thomas, S.; Fram, P. Laboratory-based evaluation of a compression bandaging system. Nurs. Times J. Biomim. Biomater. Tissue Eng. 2003, 99, 24–28. [Google Scholar]
- Ferguson-Pell, M.W. Design criteria for the measurement of pressure at body/support interfaces. Eng. Med. 1980, 9, 209–214. [Google Scholar] [CrossRef] [Scilit]
- Nelson, E. Compression bandaging in the treatment of venous leg ulcers. Update. J. Wound Care 1996, 5(9), 415–418. [Google Scholar] [CrossRef] [Scilit] [PubMed]
- Thomas S Bandages and bandaging: the science behind the art. Care Sci. Prat. 1990, 8, 56–60.
- Thomas, S. High compression bandages. J. Wound Care 1996, 5: 1, 40–43. [Google Scholar] [CrossRef] [Scilit] [PubMed]
- EWMA Position Document Understanding compression therapy; MEP: London, 2003; Available online: http://www.proguide.net (accessed on December 2011).
- Melhuish, J.M.; Clark, M.; Williams, R.; Harding, K.G. The physics of sub bandage pressure measure-ment. J. Wound Care 2000, 9(7), 308–10. [Google Scholar] [CrossRef] [Scilit] [PubMed]
- Morlock, M.; Nassutt, R.; Bonin, V. The influence of bandage characteristics and inter individual ap-plication variations on underneath bandage pressure. Clin. Biomech. 1997, 12(3), S10. [Google Scholar] [CrossRef] [Scilit] [PubMed]
- Thomas, S. Measuring sub bandage pressure. J. Wound Care 2000, 9(10), 491–492. [Google Scholar] [PubMed]
- Cochran, W.G.; Cox, G.M. Experimental Designs; John Wiley & Sons: New York, 1957. [Google Scholar]
- Barker, T.B. Quality by Experimental Design; Marcel Dekker: New York, 1990. [Google Scholar]

© 2016 Textile Bioengineering and Informatics Society. This article is an open access article distributed under the terms and conditions of the Creative Commons Attribution (CC BY) license (https://creativecommons.org/licenses/by/4.0/).