


Abstract
Heart Rate Variability (HRV) analysis is based on variability between each heartbeat which is used as a diagnosis method for assessing the cardiovascular modulation of autonomic nerve system. Up to now, most HRV analysis has been done offline. However, in many relevant applications, HRV should be analyzed online such as the analysis of stress level and the detection of the drowsiness while driving. This paper proposes an online analysis method which can be used in platforms for human robot cooperation. This online analysis method based on a sliding Hurst window can be applied to estimate the heart status. By the sliding Hurst series, the two indices, cumulative mean of Hurst series (CMHurst) and cumulative standard deviation of Hurst series (CStdHurst) are introduced as indicators to distinguish heart health status. Using this method, the hardware requirement is significantly low, and the execution time is short. Some databases from the PhysioBank are used for test these indices. The results show this method can distinguish between the groups who have normal rhythm and abnormal rhythm.
1. Introduction
As technology is becoming more ubiquitous, there is an increasing amount of interaction between robots and people in various activities [1,2]. Diverse methods are applied in these interactions, such as vocal intonation, gestures and postures, facial expression and psychological states. With an ability to recognize psychological states, human-robot platforms help people perform tasks better, especially some tasks in risky environments. Psychological signals can be utilized to determine the underlying psychological and affective state of persons. Heart Rate Variability (HRV) is the physiological phenomenon of variation in the time interval between heart beats. HRV can be a reliable reflection of physiological status and can even be used for the diagnosis of coronary artery heart disease, hypertension, sudden cardiac death, stress detection [3], drowsiness estimation [4], and also for health status analysis [5]. RR time series is the series of heartbeat interval, where R is a peak point respect to each heartbeat of the electrocardiography (ECG) wave, and RR is the interval between successive R.
Three major classes of HRV analysis techniques are defined: time-domain analysis, frequencydomain analysis and non-linear dynamics analysis. The most popular tool for HRV in clinical practice is the time-domain analysis due to its intuitive interpretation. The most employed indices in time domain analysis are mean of RR time series and standard deviation of RR time series. In HRV frequency domain analysis, the power spectrum signal has been widely used. Commonly used methods in non-linear dynamics analysis of RR time series are Fractal Dimension (FD), Fractional Brownian Motion (FBM), and approximate entropy.
Many studies have shown physiological series are more likely to be “fractal”, or more accurately to be Long Range Dependent (LRD) and fractal statistics. The application of nonlinear dynamics and fractal statics to physiologic phenomena has enabled physicians to uncover and interpret a new richness in physiologic time series [6]. Previous papers have utilized fractal techniques in human respiration [7], brain activity [8], gait [9], and immune patterning [10] research. Similar to other physiologic signals, the nature of HRV time series or RR time series are fractal-like. RR time series display non-stationary characteristics and exhibit long-range dependence (memory) [11]. An LRD process can be characterized by the Hurst parameter or Hurst exponent. The Hurst exponent has close relationship with power law, long memory, fractal, fractional calculus and chaos theory. Therefore Hurst exponent estimation is crucial to fractional system identification and forecasting [12].
In this paper, we introduce a novel online method of analyzing RR time series utilizing a sliding window Hurst. This paper will focus on the Hurst series analysis which is computed from RR time series based on sliding window. Based on the Hurst series, the two indices cumulative mean of Hurst Series (CMHurst) and cumulative standard deviation of Hurst series (CStdHurst) are proposed. The two indices are tested by 43 healthy and unhealthy subjects from three different databases. The result shows the two indices can serve as the indicators of heart status.
2. HRV Analysis
2.1. Hurst Parameter
A stationary process is said to have Long-range Dependence (LRD) if its auto-correlation function (assuming that the process has finite second-order statistics) decays slowly as k → ∞. The Autocorrelation Function (ACF):
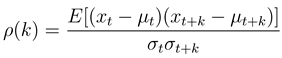 where µ is the mean and σ is the standard deviation. The ACF measures the correlation between xt and xt+k. The following functional form for the ACF is often assumed
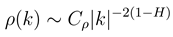 where Cρ is assumed asymptotically constant for slow varying at infinity, and H is the Hurst parameter.
2.2. Fractional Differintegrated RR Time Series (FDIRR)
To estimate Hurst parameter in this paper, the RR time series is fractional differentiated according to a certain order. In [13], the implementation of fractional differintegration is described as:
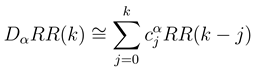 where α is the order of the operator and the coefficients are recursively computed as:

The set of possible time series obtained by different α order will be named as the Fractional Differintegrated RR time series set (FDIRR set). SDFDINN(α) is defined as the standard deviation of FDIRR for α-th order. SDFDINNmin is represented as the minimum standard deviation of the FDIRR set and αc as the order provides the minimum standard deviation. Then
H = αc + 0.5
2.3. An Online Analysis Method Using Sliding Window Hurst
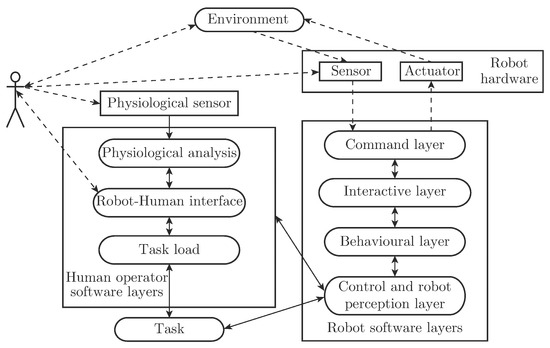
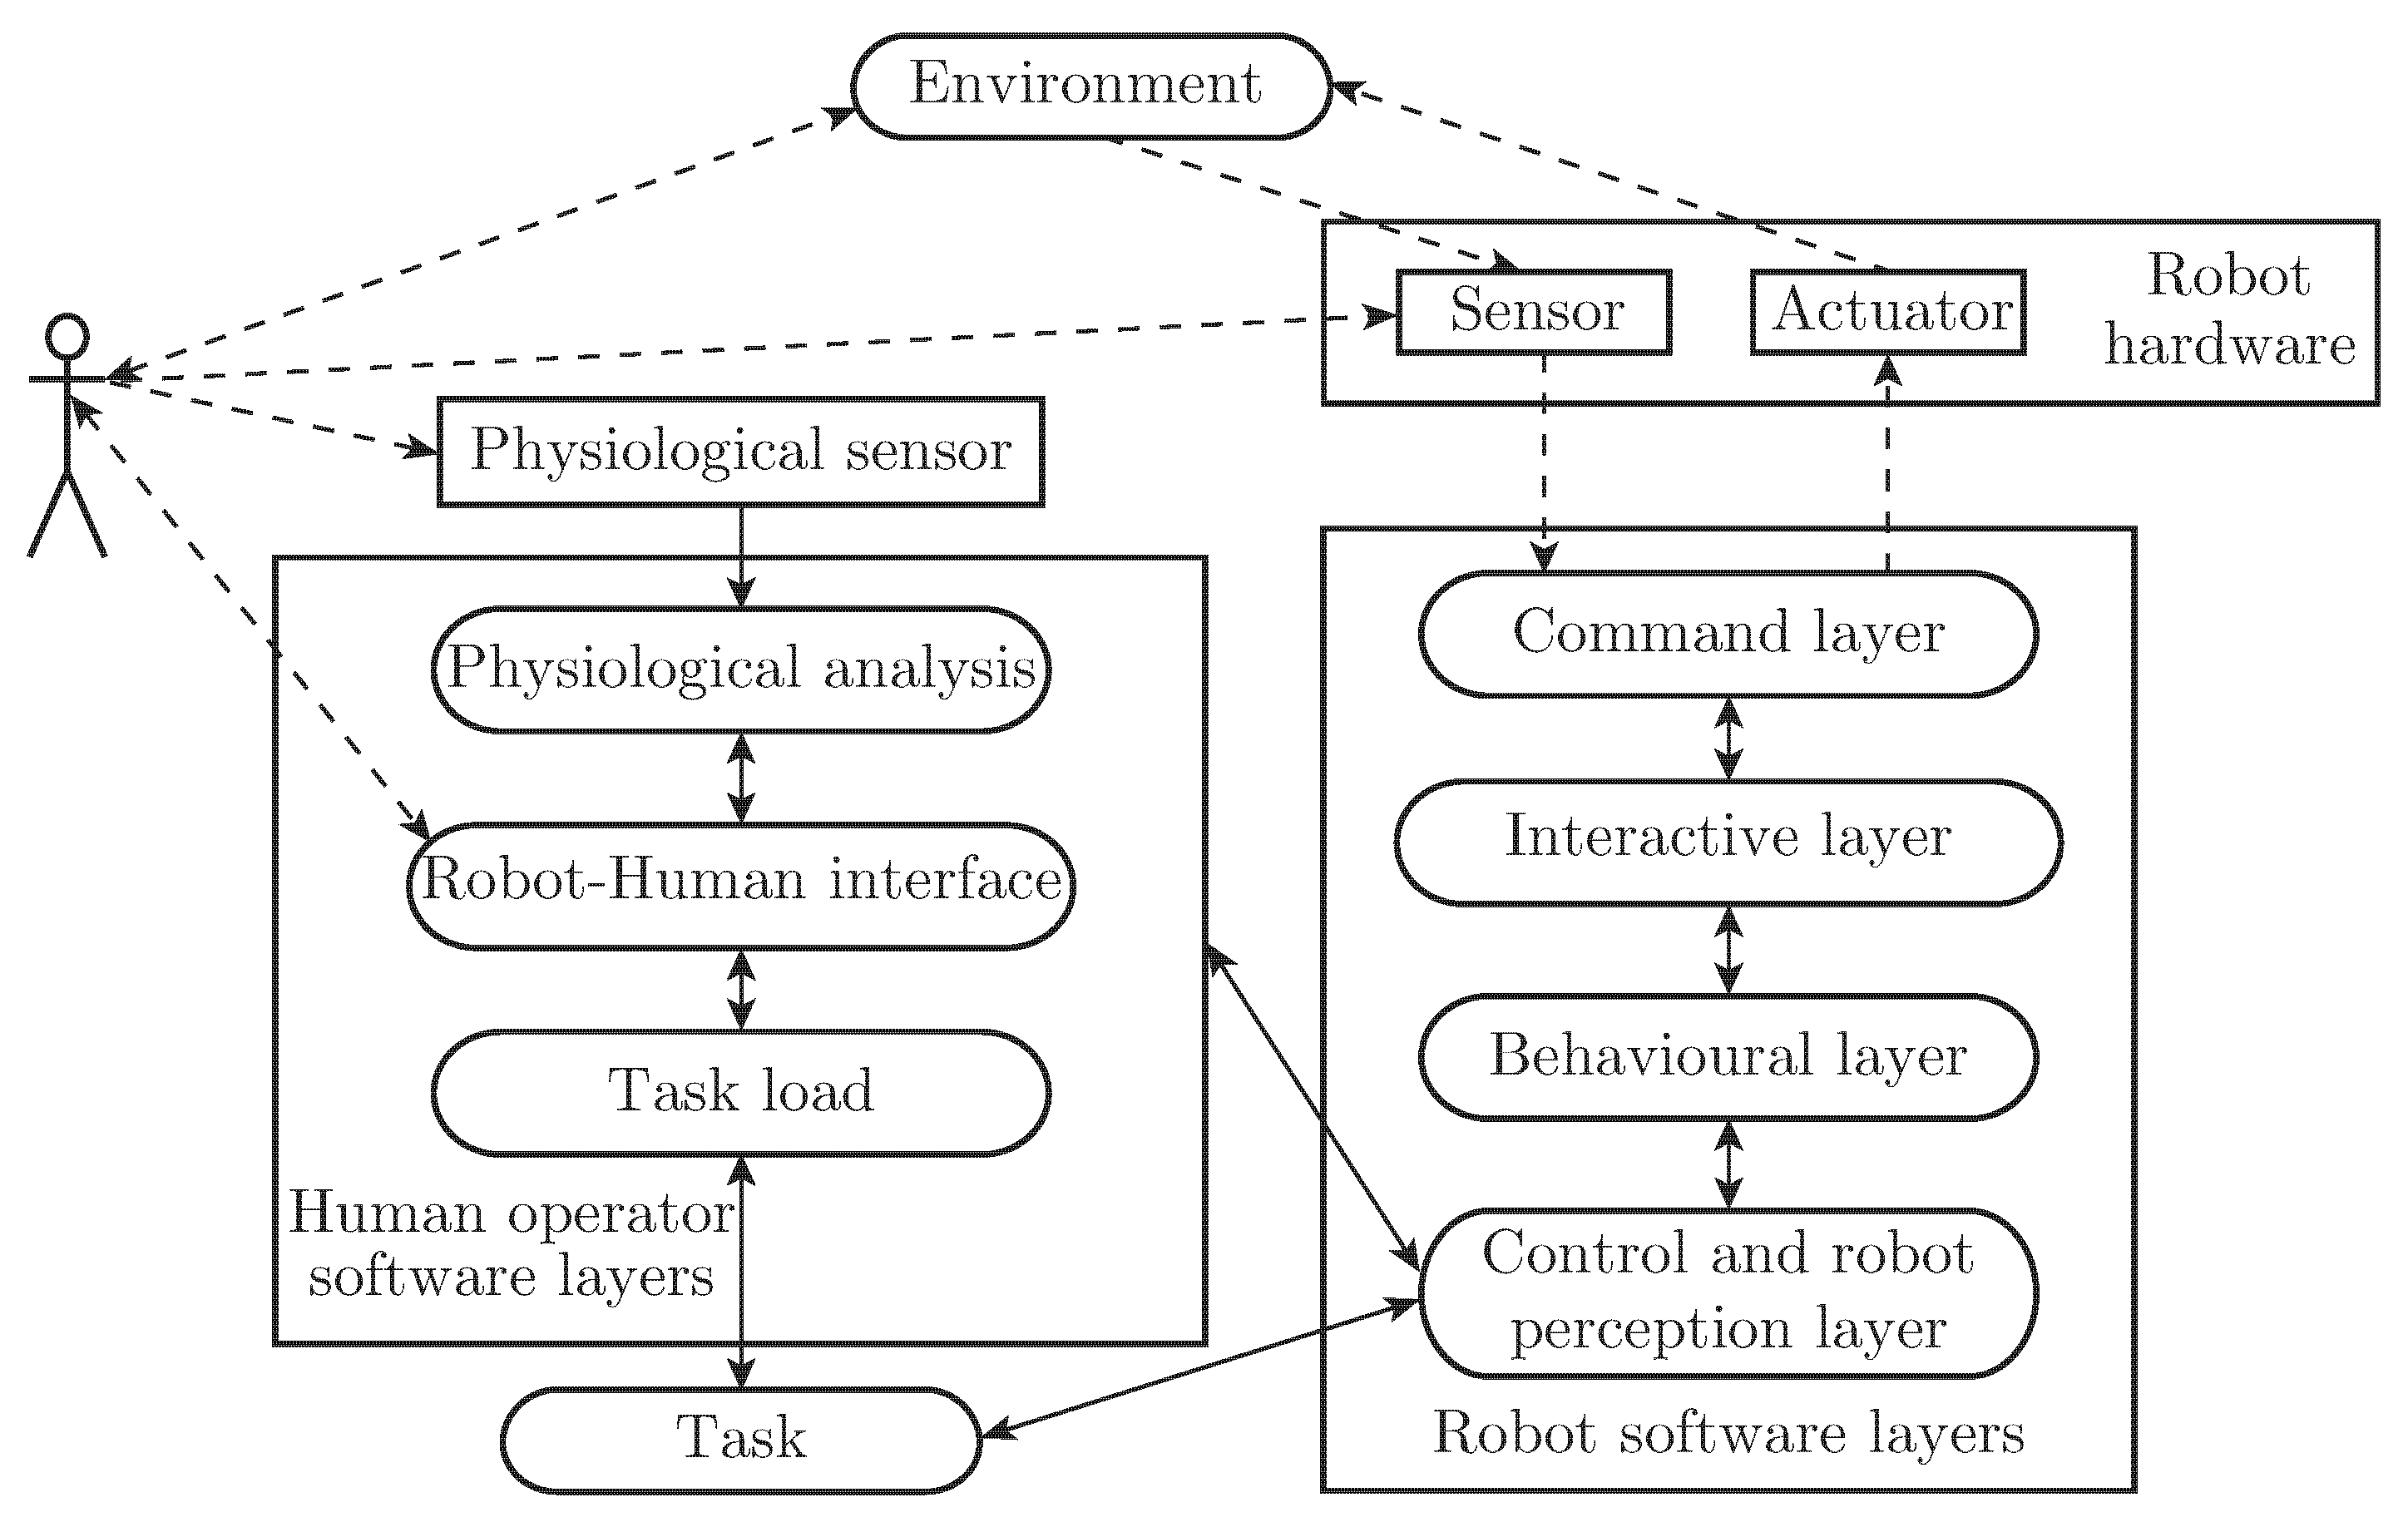
It is very important to know about humans’ physiological status in human-robot interaction environment. RR time series is a useful tool to know human physiological status. Intelligent robots will be able to cooperate with human to implement various kinds of tasks. In executing progress, robots should not only interact with the surrounding environment, but also with human. Figure 1 shows how intelligent robots cooperate with a human to execute a task. In this human-robot cooperation platform, a human dressing with physiological sensors can use a control device to cooperate with robots. The control device would be a tablet, a smart phone, a personal computer or an embedded device. As an interaction component, the control device should implement the following three main modules. Physiological analysis module implements the HRV signal acquisition and analysis (further research including other physiological signal). Robot-Human interface is an interface between the human and robot. Task load module receives the task and explains it.
Figure 1.
Human-robot cooperation platform
In the physiological analysis module, there are three sub-modules: data acquisition, storage and analysis. For supporting diverse sensors, an abstract layer is designed in this module. The control device can use different link methods (such as cable, bluetooth, Wi-Fi) to connect sensors, and use different data transfer protocols to receive data. After data receiving, RR data is saved in text or database modalities. The next and the most important work is the data analysis. The analysis module is executed synchronously with the data acquisition module.
The two indices are obtained by a Hurst series which is calculated from RR time series. Hurst series is defined as:
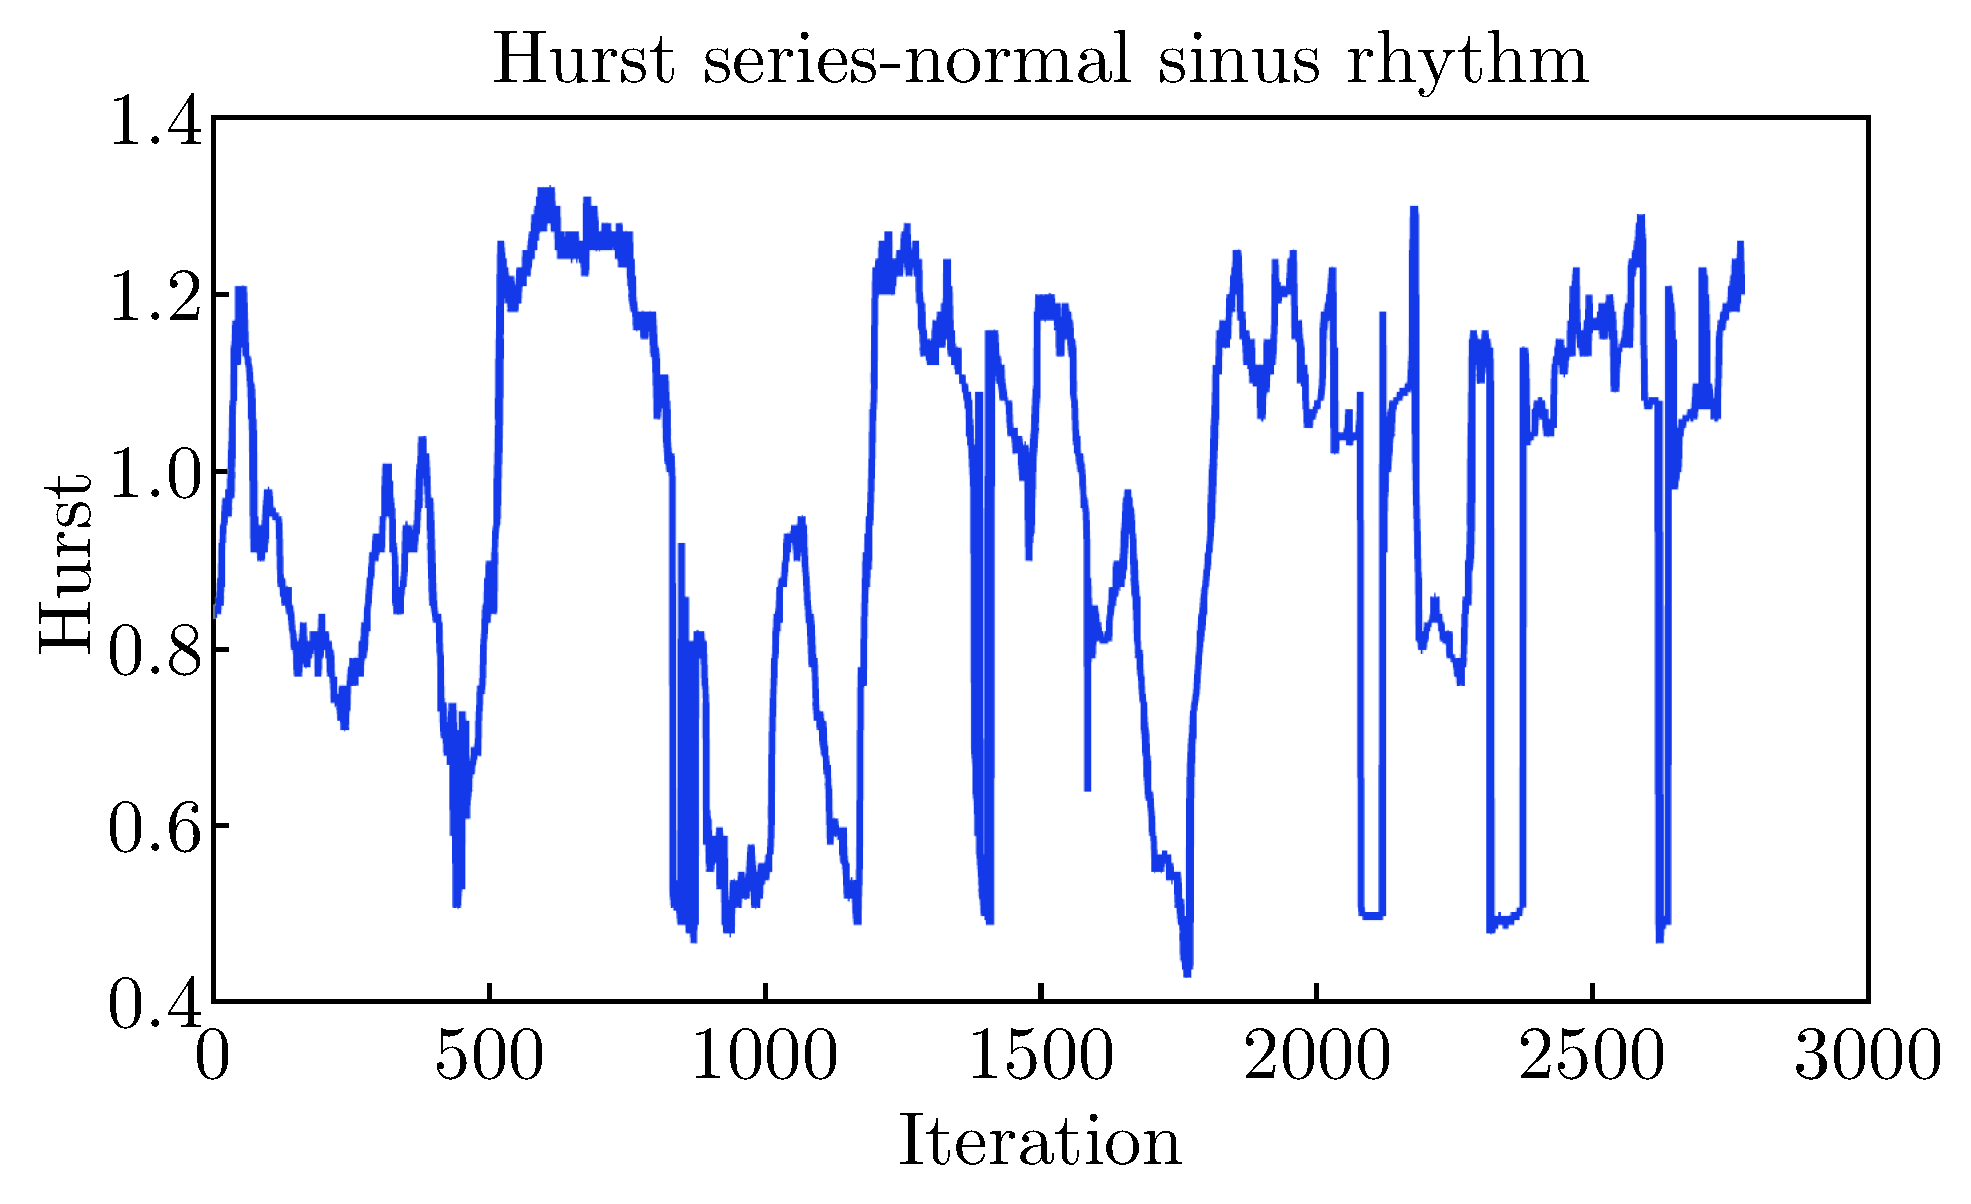
where Hs is Hurst series, and i is the index. Calculate Hurst is a method to calculate Hurst parameter using fractional differintegration. RRTS is the RR time series, and each Hurst parameter calculated by a sub-series of RRTS. The i-th sub-series is from i×Step size to i×Step Size + Window Size. Step Size is the interval between the adjacent sub-series. For accurately reflecting RR variability, Step Size is far less than Window Size, and these RR subseries overlap. The Hurst series are based on a sliding window. Firstly, after the length of RR time series reaches the Window size, Hs(0) is calculated. Then with another Step size length RR data are received, the next Hs value should be calculated. The two adjacent Hurst parameters are calculated by moved and overlapped RR sub-series. Figure 2 shows a Hurst series of a subject in Normal Sinus Rhythm Database of PhysioBank by calculating RR time series.
Hs(i) = Calculate_Hurst(RRTS(i × Step Size : i × Step size + Window Size))
Figure 2.
Hurst series calculated from RR time series of a subject
Hurst parameter is crucial estimator to a fractional system. Because HRV is a fractional signal, Hurst series is a good reflection of heart status. This series also can be analyzed by time-domain, frequency-domain, and non-linear dynamics method. In this paper, we use a time-domain method to analyze it, and the two indices CMHurst and CStdHurst are proposed.
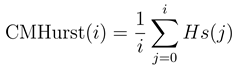
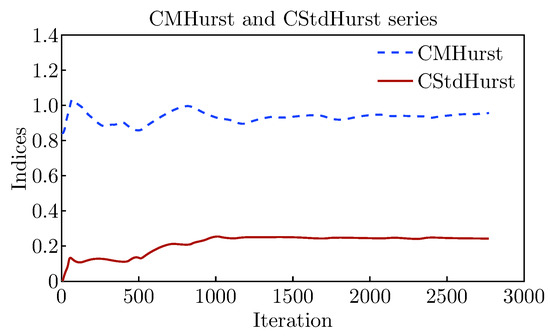
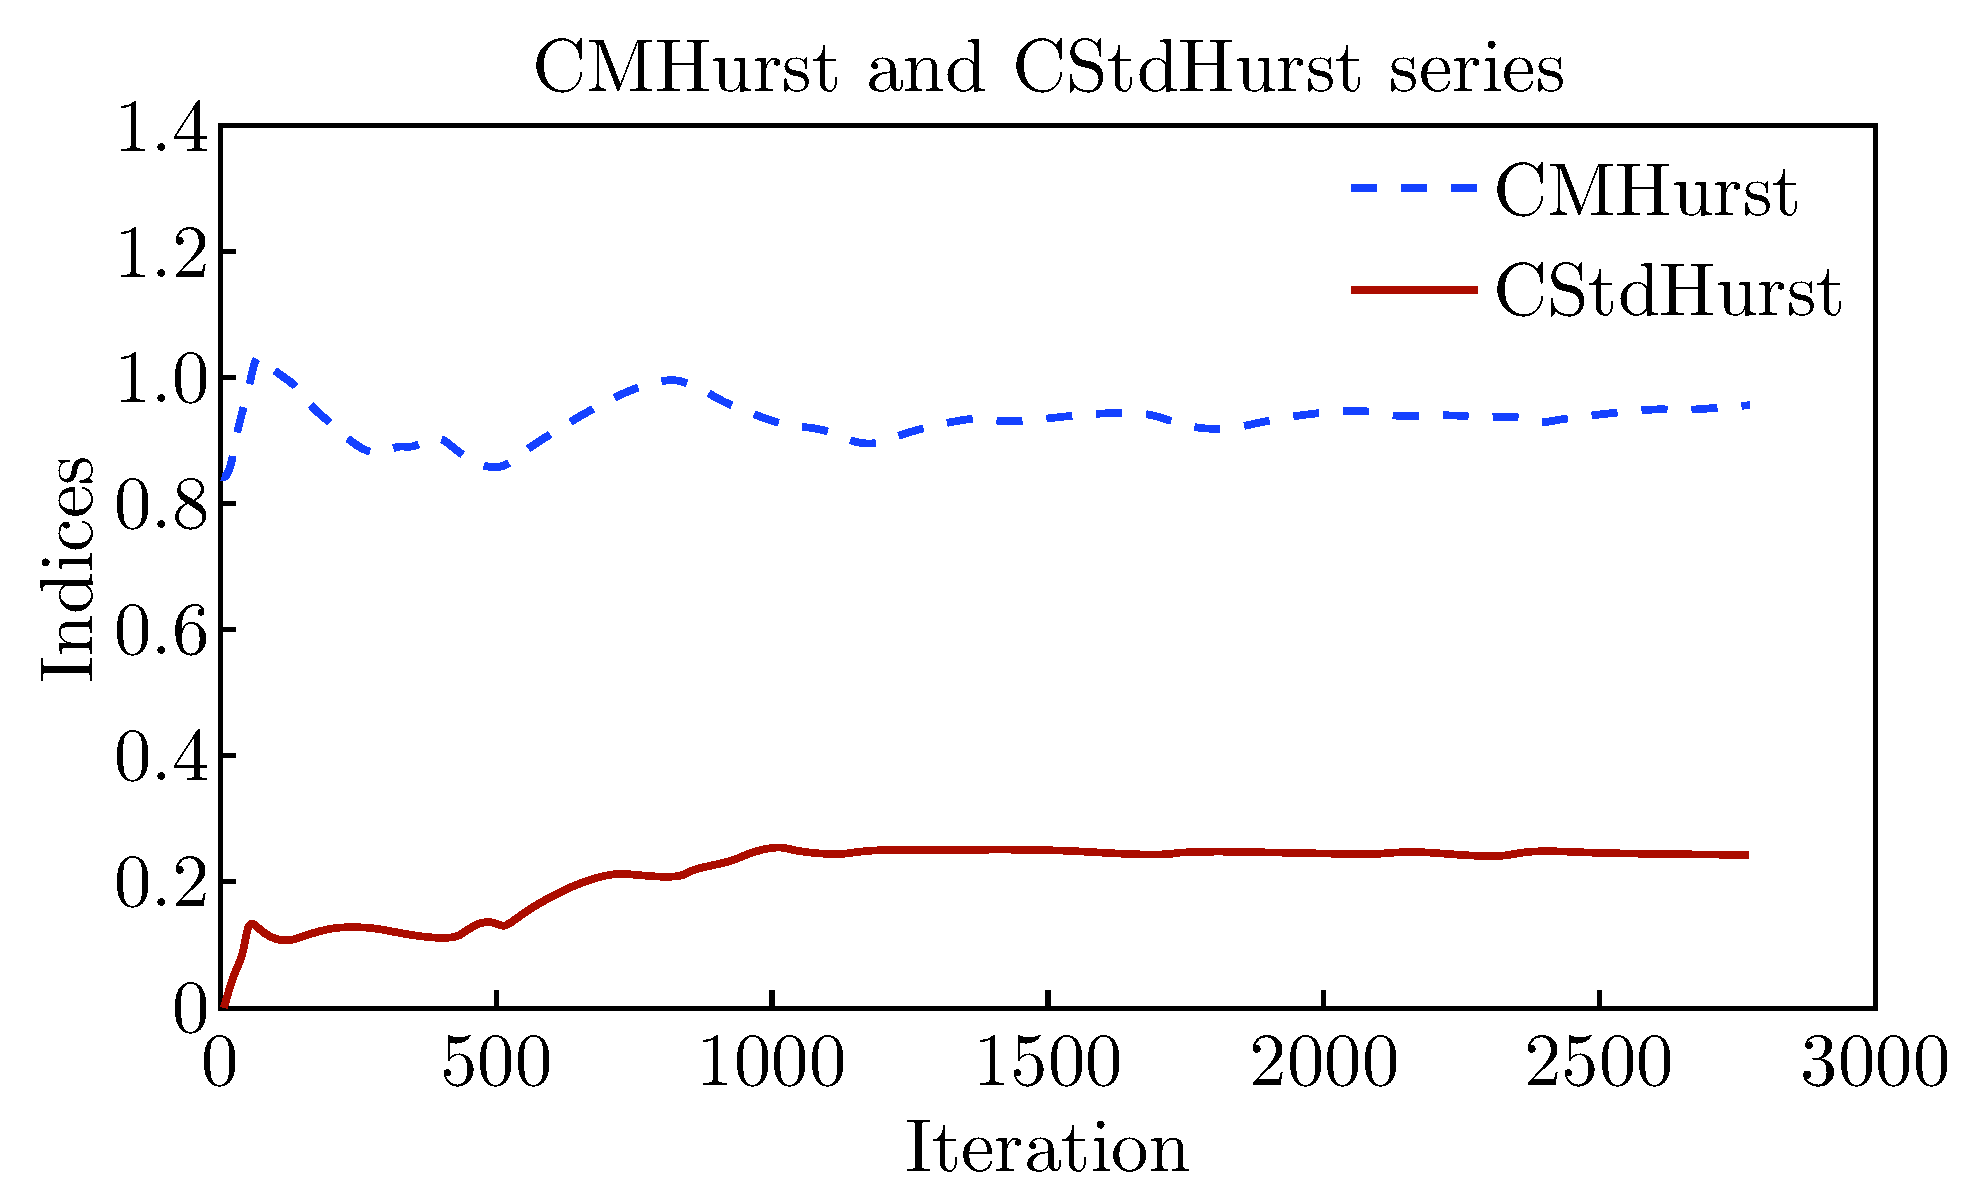
 CMHurst(i) and CStdHurst(i) stands for mean and standard deviation of Hurst series from iteration 0 to i respectively. Hs is the Hurst series. Figure 3 shows the CMHurst and CstdHurst Series calculated from the Hurst series of Figure 2.
Figure 3.
CMHurst and CStdHurst series calculated from Hurst series of Figure 2
3. Results and Discussion
3.1. Database
To certificate the effect of the two indices, 43 subjects in three databases representing different heart conditions are used to test. These databases downloaded from PhysioBank. These databases can be assumed as one kind of sensor for there is an abstract layer in data acquisition module. The drive for the “database” sensor samples RR data at a regular time like a real sensor, yet it doesn’t bring any changes to the platform. We use these databases to classify healthy and unhealthy heart status. First database is MIT-BIH Normal Sinus Rhythm Database. This database includes 18 long-term ECG recordings of subjects referred to the Arrhythmia Laboratory at Boston’s Beth Israel Hospital. Subjects included in this database were found to have had no significant arrhythmias. Another database is BIDMC Congestive Heart Failure database. This database includes long-term ECG recordings from 15 subjects (11 men, aged from 22 to 71, and 4 women, aged 54 to 63) with severe congestive heart failure (NYHA class 3-4). The final database is Sudden Cardiac Death Holter Database. The database was mainly obtained in the 1980s in Boston area hospitals, and were later compiled as part of a study of ventricular arrhythmias. Because of the retrospective nature of this collection, there are important limitations [14].
3.2. Health Status Classification
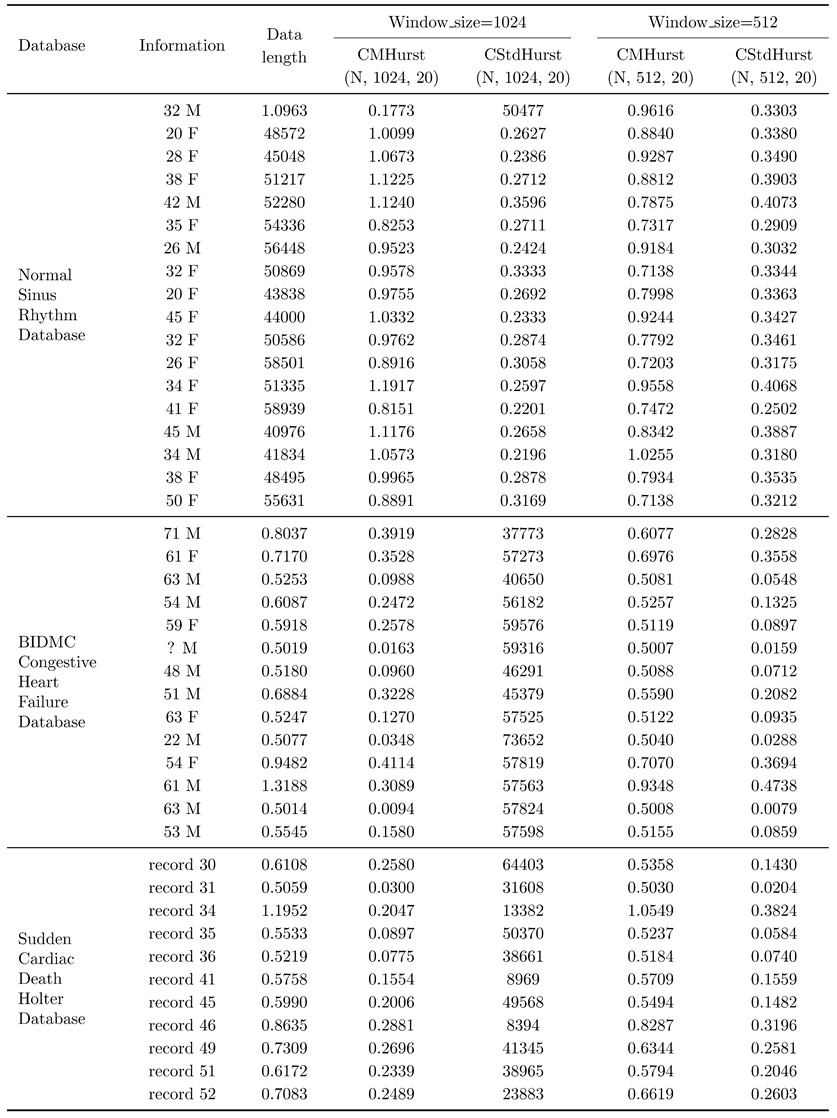
Let CMHurst(N, Window Size, Step Size) and CMHurst(N, Window Size, Step Size) represent the mean and standard deviation of Hurst series. N is the length of a RR time series. Table 1 shows CMHurst(N, Window Size, 20) and CstdHurst(N, Window Size, 20) of all records in the three databases. Window Size is assigned to 1024 and 512 respectively.
Table 1.
Sliding Window Hurst based Window size=1024, Step size=20
The values of CMHurst(N, 1024, 20) in Normal Sinus Rhythm Database are in [0.8151, 1.1917], and the values of CStdHurst(N, 1024, 20) are in [0.1773, 0.3596]. Most values of CMHurst(N, 1024, 20) in BIDMC Congestive Heart Failure Database are lower than 0.8151 or higher than 1.1917, except the record “54F” which value of CMHurst is 0.9482, but CStdHurst(N, 1024, 20) of this record is 0.4113 higher than 0.3596. In Sudden Cardiac Death from the Holter Database, the underlying cardiac rhythm of most people is sinus. Record 35 and 36 are atrial fibrillation, and record 49 and 51 are sinus with intermittent pacing. Hurst series of this database are also different from Normal Sinus Rhythm Database. Record 46 can not be distinguished from the first database for the values of CMHurst(N, 1024, 20) and CStdHurst(N, 1024, 20) are in normal regions. But by the following analysis, it also can be distinguished.
In Normal Sinus Rhythm Database, the values of CMHurst(N, 512, 20) are in [0.7138, 1.0255]. This region is lower than the region of CMHurst(N, 1024, 20), and all value of CMHurst(N, 512, 20) are lower than corresponding values of CMHurst(N, 1024, 20). The values of CStdHurst(N, 512, 20) in this database are in [0.2502, 0.4073]. This region is higher than CStdHurst(N, 1024, 20), and all values of CStdHurst(N, 512, 20) are higher than corresponding values of CStdHurst(N, 1024, 20). In BIDMC Congestive Heart Failure Database, it is as same as CMHurst(N, 1024, 20). Most CMHurst(N, 512, 20) are not in the region [0.7138, 1.0255] of Normal Sinus Rhythm Database. Only the record “61” is in the region, but CStdHurst(N, 512, 20) of this record is higher than 0.4073, not in the region of CStdHurst(N, 512, 20) in Normal Sinus Rhythm Database. In this database, all CMHurst(N, 512, 20) become lower than corresponding CMHurst(N, 1024, 20), as same as the first database. But the change between CStdHurst(N, 512, 20) and CStdHurst(N, 1024, 20) is not like the first database. All CStdHurst(N, 512, 20) are lower than corresponding CStdHurst(N, 1024, 20), except record “61” and “61M”. This different trend of CStdHurst can be an indicator to do classification. In Sudden Cardiac Death from the Holter Database, most CMHurst and CStdHurst are different from the first database, and they are very similar to the second database.
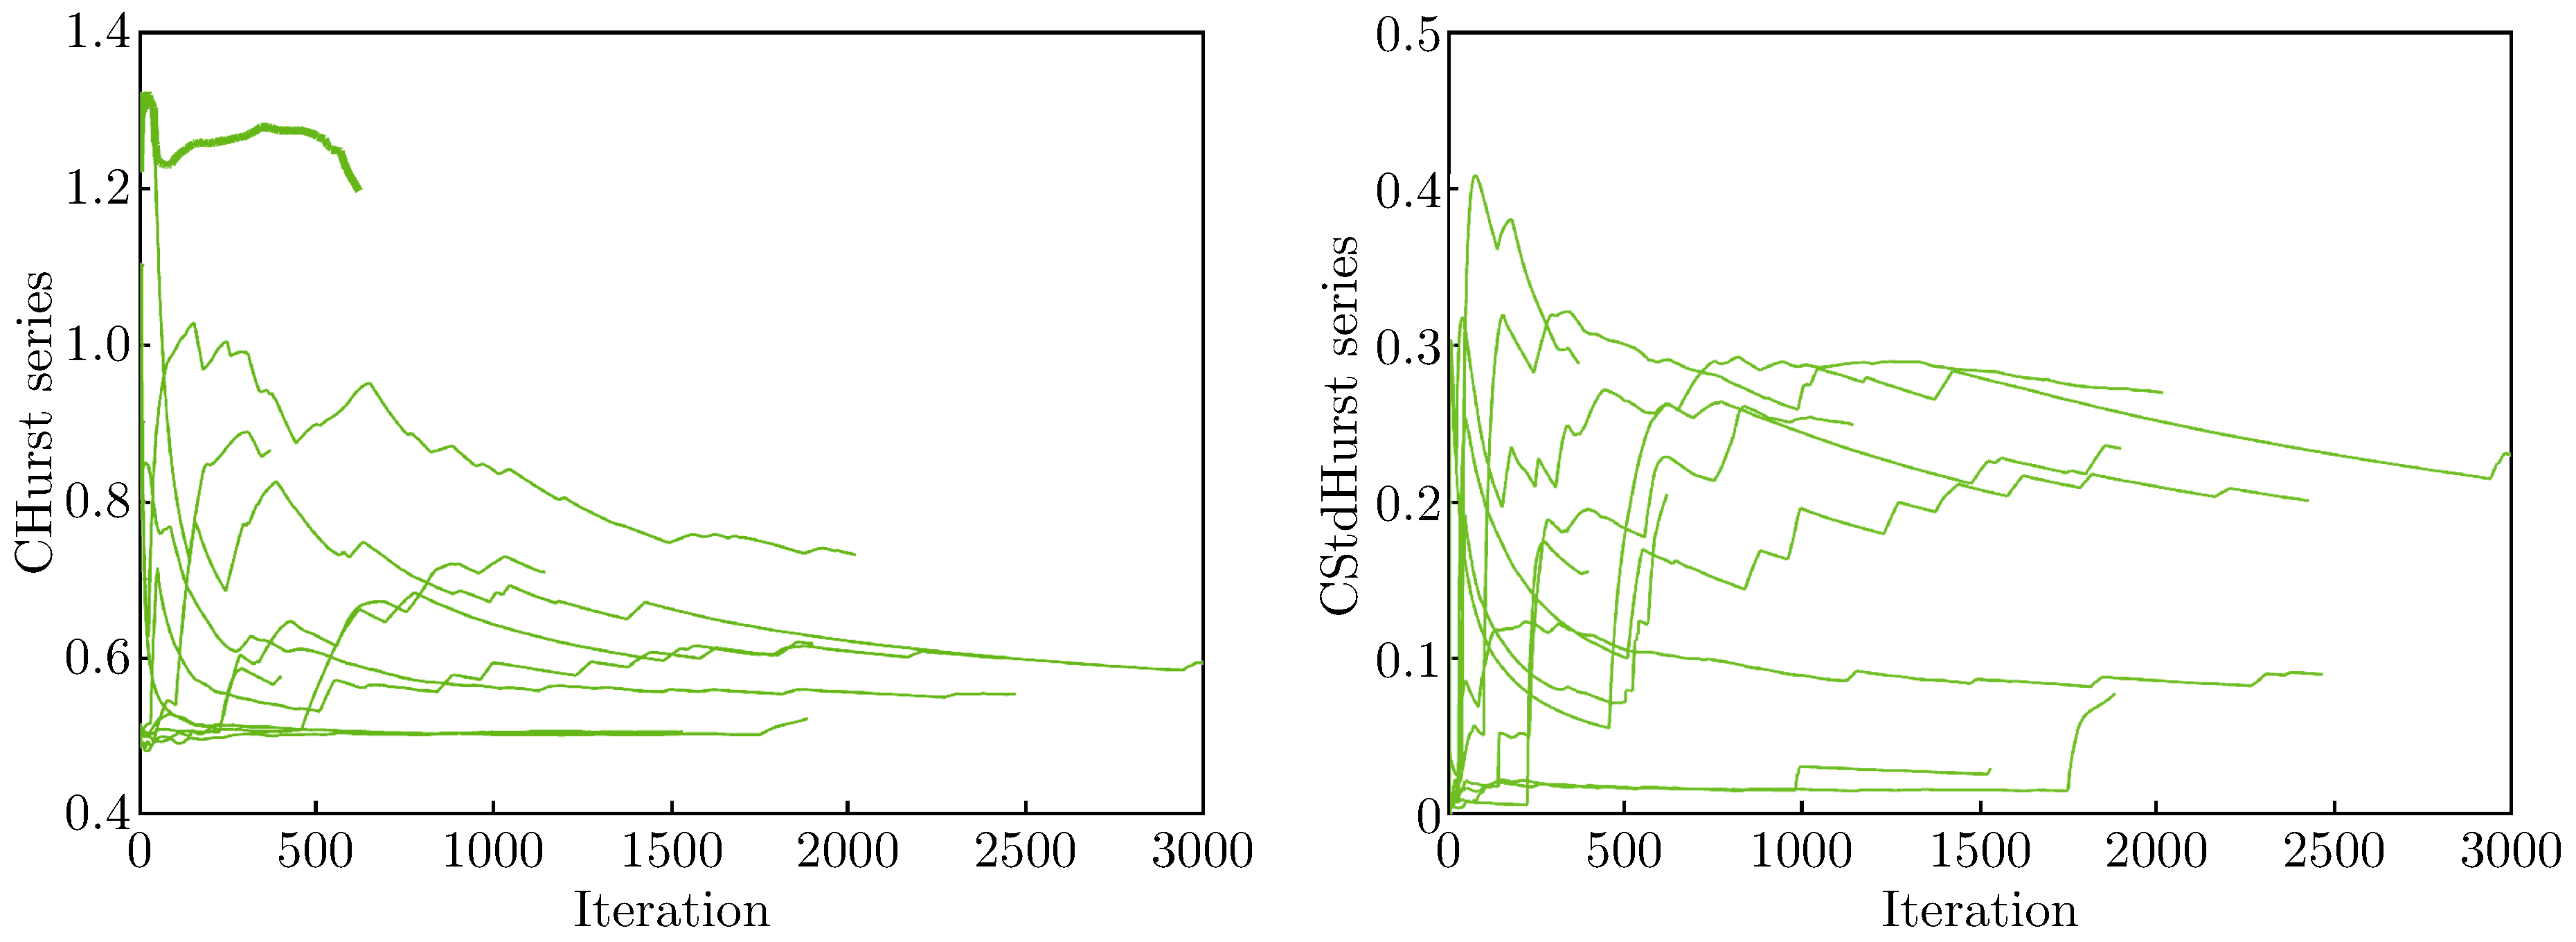
From Table 1, it can be concluded the CMHurst and CStdHurst are very useful indices which can determine heart health status. There are more useful information that should be extracted from CMHurst and CStdHurst series. Figure 4 shows CMHurst series and CStdHurst series in Normal Sinus Rhythm Database. These series in the first database are different from the other databases. The minimum value of CMHurst series is 0.5, and the maximum value is 1.29. After iteration 100, 250, 1000, and 2000, all values of CMHurst series exceed 0.60, 0.65, 0.69, and 0.8, respectively. The maximum value of CStdHurst series is 0.37. After iteration 100, 250, 1000, and 2000, all values of CStdHurst series exceed 0.035, 0.070, 0.125, and 0.155, respectively. This phenomenon only exists in the first database. Figure 5 shows CMHurst and CStdHurst series in BIDMC Congestive Heart Failure database. There are two different kinds of CMHurst series in this database. The values of CMHurst in the first kind are very low and change very little. Most of them are around 0.5 or even lower than 0.5. The curve nearly overlap the line y=0.5 and corresponding CStdHurst is nearly 0. The value of CMHurst in the second kind change relatively larger and corresponding CStdHurst is larger than the value in the first kind. It can be seen CMHurst series of the second database often exceed 1.29 or are lower than 0.5. The top dot curve change quickly and the value of corresponding CStdHurst exceeds 0.4. From iteration 0 to 20, the value decreases from 1.4 to 0.75. The value of the Hurst series is mainly in [1.3, 1.4] and [0.5, 0.6], the two different region. This curve is obviously the second kind. If we use [0.5, 1.29] for CMHurst and 0.37 for CStdHurst as criteria, all record of the second databases can be distinguished from the first database before iteration 20, except record “48M” and “63M”. After iteration 100, we use [0.60, 1.29] for CMHurst, the rest records of this database can be distinguished from the first database. The CMHurst and CStdHurst in Sudden Cardiac Death Holter Database are similar to those in the second database. There are 7 records which can be distinguished from the first database by [0.5, 1.29] for CMHurst and 0.37 for CStdHurst as criteria. After iteration 100, record 41 and 51 are distinguished by [0.6, 1.29] for CMHurst. After iteration 500, record 35 is distinguished by [0.65, 1.29] for CMHurst. After iteration 2000, record 49 is distinguished by [0.8,1.29] for CMHurst.
Figure 4.
The CMHurst and CStdHurst series were calculated from RR time series of all subjects in Normal Sinus Rhythm Database. These curves look similar, and they are converging
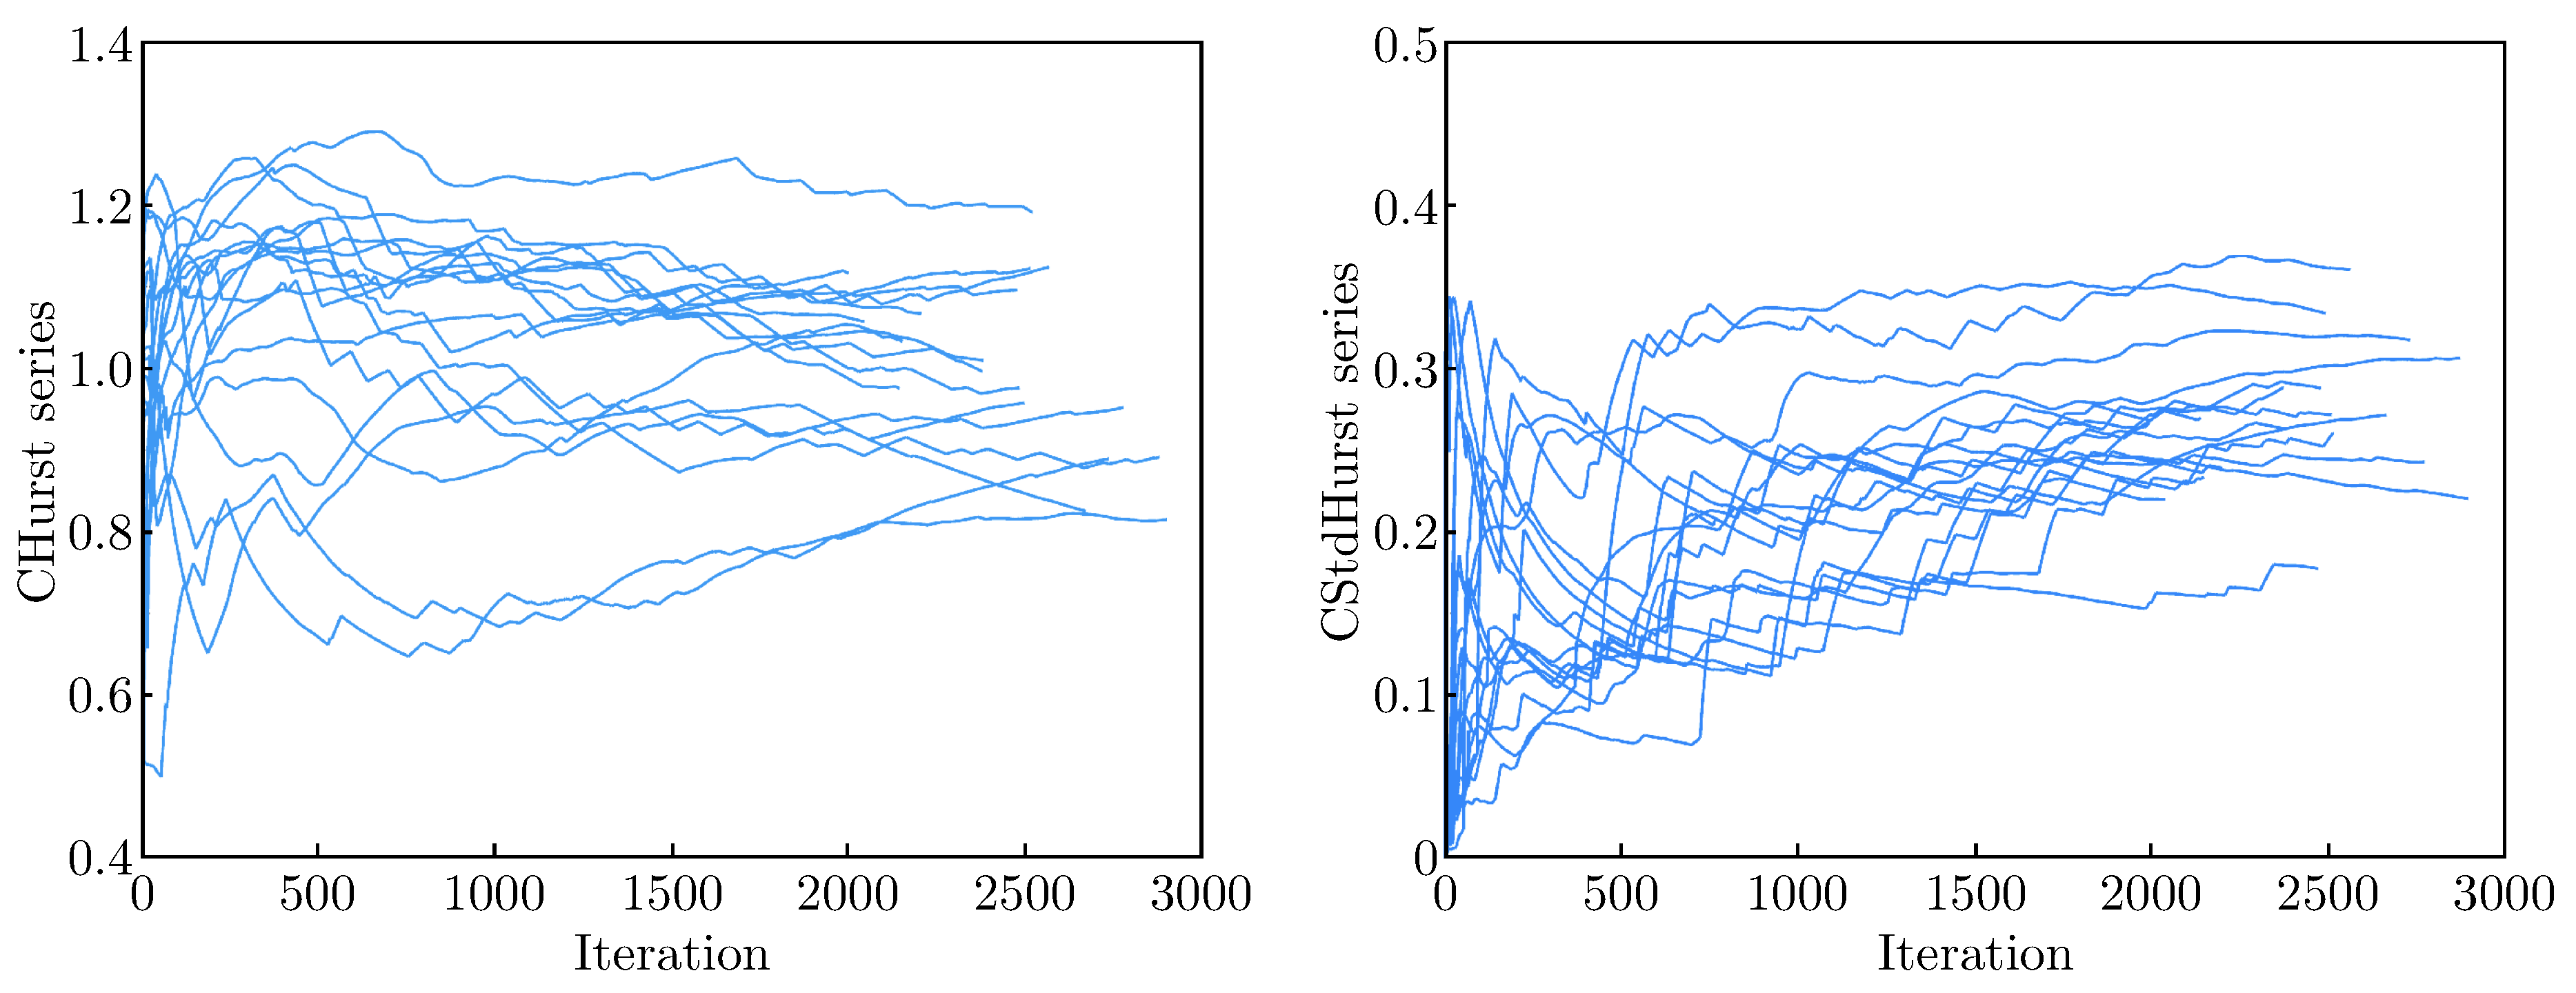
Figure 5.
The CMHurst and CStdHurst series were calculated from RR time series of all subjects in BIDMC Congestive Heart Failure Database
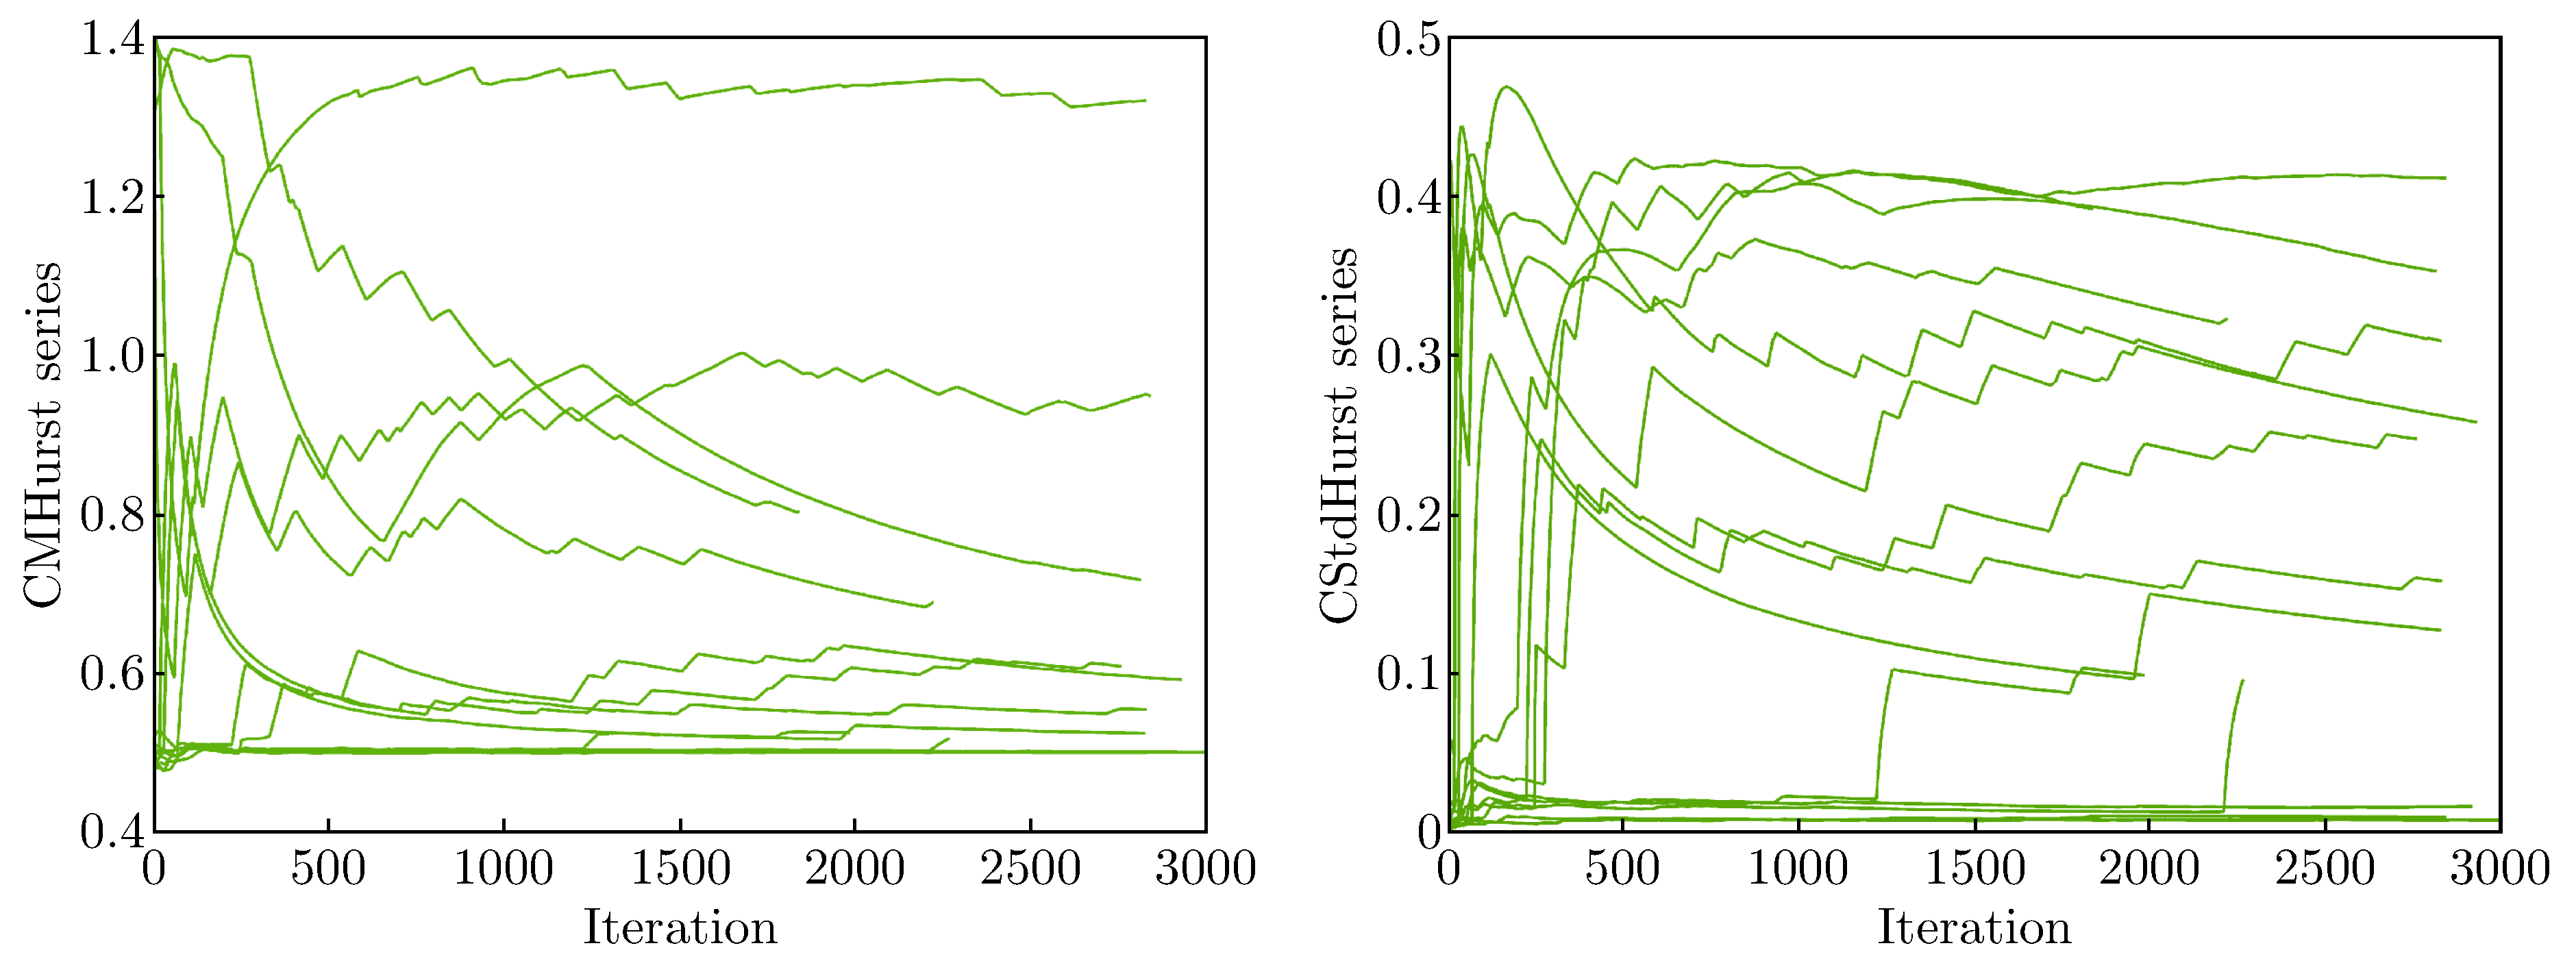
Figure 6.
The CMHurst and CStdHurst series were calculated from RR time series of all subjects in Sudden Cardiac Death Holter Database
4. Conclusion
For human-robot interaction in a collaborative task, it is very important that they know each other’s status, and human physical status should affect the task execution. HRV provides a window through which we can observe the heart ability to respond to disturbance that can affect its rhythm. The distribution of heartbeat interval has a fractal appearance, Hurst parameter is a good tool to analyze it. In this paper, we propose two indices CMHurst and CStdHurst based on slide window Hurst series which are calculated from RR time series by fractional differintegration. Healthy and unhealthy heart status display different CMHurst and CStdHurst series. The result shows the record of Normal Sinus Rhythm Database can be discriminated from other two databases by these two indices.
In this paper, the sample size is not large enough, and Hurst series calculated from RR time series is only used in heart health analysis. The continue work is to test more samples, and use Hurst series in analysis of stress, downiness and hydration.
Acknowledgments
Taizhi Lv would like to thank Jiangsu Overseas Research & Training Program for University Prominent Young & Middle-aged Teachers and Presidents for financial support.
References
- S. Brandon, C. Coopmans, Y. Chen, A framework for analyzing human factors in unmanned aerial systems, 2012 5th International Symposium on Resilient Control Systems (ISRCS), IEEE, 2012.
- N. Kirchner et al., Robotassist - A platform for human robot interaction research, Proc. of the 2010 Australasian Conference on Robotics and Automation (ACRA-10), 2010.
- Rani, P.; Sims, J.; Brackin, R.; Sarkar, N. Online stress detection using psychophysiological signals for implicit human-robot cooperation. Robotica 2002, 20(06), 673–685. [Google Scholar] [CrossRef] [Scilit]
- Lin, C.; et al. EEG-based drowsiness estimation for safety driving using independent component analysis. IEEE Trans. Circuits Syst. I Regul. Pap. 2005, 52(12), 2726–2738. [Google Scholar] [CrossRef] [Scilit]
- Thayer, J. F.; Ahs, F.; Fredikson, M.; Sollers, J. J., III; Wager, T. D. A meta-analysis of heart rate variability and neuroimaging studies: Implications for heart rate variability as a marker of stress and health. Neurosci. Biobehav. Rev. 2012, 36(2), 747–756. [Google Scholar] [CrossRef] [Scilit] [PubMed]
- B. J. West, Where Medicine Went Wrong: Rediscovering the Path to Complexity, World Scientific: New Jersey, 2006. [CrossRef] [Scilit]
- Fadel, P. J.; Barman, S. M.; Philips, S. W.; Gebber, G. L. Fractal fluctuations in human respiration. J. Appl. Physiol. 2004, 97(6), 2056–2064. [Google Scholar] [CrossRef] [Scilit]
- Gardiner, J.; Overall, R.; Marc, J. The fractal nature of the brain: EEG data suggests that the brain functions as a quantum computer in 5-8 dimensions. NeuroQuantology 2010, 8(2), 137–141. [Google Scholar]
- Delignires, D.; Torre, K. Fractal dynamics of human gait: A reassessment of the 1996 data of Hausdorff et al. J. Appl. Physiol. 2009, 106(4), 1272–1279. [Google Scholar] [CrossRef] [Scilit]
- Dietert, R. R. Fractal immunology and immune patterning: Potential tools for immune protection and optimization. J. Immunotoxicol. 2011, 8(2), 101–110. [Google Scholar]
- Leite, et al. Long-range dependence in heart rate variability data: ARFIMA modelling vs detrended fluctuation analysis. Comput. Cardiol. 2007, 98(34), 21–24. [Google Scholar] [CrossRef] [Scilit]
- Hu, S.; Chen, Y.; Qiu, T. On the robustness of Hurst estimators. IET Signal Process. 2011, 5(2), 209–225. [Google Scholar]
- Garca-gonzlez, M. A.; Fernndez-chimeno, M.; Capdevila, L.; Parrado, E.; Ramos-Castro, J. An application of fractional differintegration to heart rate variability time series. Comput. Methods Programs Biomed. 2013, 111(1), 33–40. [Google Scholar] [CrossRef] [Scilit]
- Goldberger, L.; et al. Physiobank, physiotoolkit, and physionet components of a new research resource for complex physiologic signals. Circulation 2000, 101(23), e215–e220. [Google Scholar] [PubMed]

© 2015 Textile Bioengineering and Informatics Society. This article is an open access article distributed under the terms and conditions of the Creative Commons Attribution (CC BY) license (https://creativecommons.org/licenses/by/4.0/).