


Abstract
Ultrasound image segmentation is an important task for clinical diagnosis. In this study, a multithreshhold segmentation approach was proposed to enhance ultrasound image segmentation accuracy. More specifically, the proposed multi-threshhold segmentation approach, combining an opening-closing morphological filter and potential function clustering theory, attempted to provide better ultrasound image segmentation visibility. This proposed approach was tested using computer-simulated images and in vivo images. Computer simulation results demonstrated that the method significantly improved the accuracy of image segmentation. From in vivo images investigation, we have found that, as compared with the original images, better segmentation visibility were obtained. Our initial results demonstrated that this method could be useful for improving the segmentation quality of ultrasound images as a post-processing tool.
1. Introduction
Ultrasound imaging is playing an increasingly important role in clinical diagnosis. Among the main imaging modalities in clinical diagnosis, ultrasound imaging is the most growth potential imaging modality due to its non-invasive nature, ability to image in real time and low cost. Ultrasound image segmentation is a very popular field in medical ultrasound image post-processing and the quality of segmentation can directly influence the accuracy and effectiveness of the image for clinical diagnosis.
Factors such as speckle characteristics [1], complex human tissue structures, and various pathological process that may lead to poor quality in the imaged tissues. They also increase the difficulty of medical ultrasound image segmentation. Although there are many image segmentation algorithms currently in use, it is becoming clear that none of the existing algorithms can meet all the requirements of medical ultrasound image segmentation. In order to achieve higher accuracy and speed, more users are adopting novel methodologies in medical ultrasound imaging as well as a variety of methods for specific applications [2,3,4].
Based on the characteristics of ultrasound images, this paper proposes a novel multi-threshhold segmentation algorithm, which combines a morphological reconstruction filter and the potential function clustering. First of all, the morphological reconstruction filter was applied for speckle reduction in the image. Then, the potential function clustering was used to process multi-threshhold segmentation according to inherent statistics features of the ultrasound image.
2. Method
2.1. Opening-closing Morphological Filter
The opening-closing morphological filter [5] is an important nonlinear filter used to extract and analyze target information. The main advantages of this filter include: no production of false edges and new noise, ability to maintain the basic shape and edge of the target, and small influence on the contours of the target. The opening-closing morphological filter can remove irrelevant details, maintain the feature information of the target image and simplify the image at the same time. So, we selected the opening-closing morphological filter for pre-processing in this paper.
The key part in designing the morphology of the opening-closing reconstruction filter are the selection of the structural elements and mark image. In this paper, the structural element we chose is a disk. This is because the disk will not lead to eigenvalue aberration when the image rotates, therefore it will prevent the geometrical shape from changing. In order to improve the algorithm’s de-nosing ability, our proposed method uses two different kinds of structural elements for the opening and closing reconstruction operation. For the selection of the mark image, we used the image produced by the erosion operation as our initial mask image, because the mask image should fully reflect the feature. The specific processes for the opening-closing morphological filter in this paper are as follows:
- 1)
- Select the structural element. In this paper, the specific sizes of the structural elements (SE1, SE2) are decided by the noise in the image and the requirements in practical clinical diagnosis. Generally, we use smaller structural elements when the noise is lower and more details need to be preserved. But if the noise is higher or we want to make the contour features more prominent, we must use a larger structural element.
- 2)
- Erosion operation. Perform the erosion operation for initial image according to the SE1.
- 3)
- Opening operation. Set the erosion operation-processed image as the mark image and the original image as a mask image, perform the opening reconstruction operation.
- 4)
- Dilation operation. Use the SE2 to perform the dilation operation for the processed image by opening operation.
- 5)
- Closing operation. Perform the closing reconstruction operation for the processed image by dilation operation.
2.2. The Potential Function Clustering
After image processing by opening-closing morphological filter, we can get more reliable histogram information for the medical ultrasound image. Combined with the fixed classification of ultrasonic echo intensity, the proposed multi-threshhold segmentation algorithm can be used according to the histogram potential function clustering.
Definition 1: If I = f(i,j) is the digital image array with size M×N, f(i,j) ∈ {0, 1, 2, ⋯ , G − 1} is the gray value in position (i,j), integer G > 0 is the gray level of image I. So the gray level statistical histogram function for image I is:
 where

H(k) represents the probability that the pixel value k will appear in the image I. Generally, the pixel values in the image have larger probabilities of occurring in the low gray level. So, the histogram has peaks and valleys. Usually, we consider that a certain target has a peak in the histogram and the transition region between two target areas is associated with a valley in the histogram. The histogram threshhold segmentation tries to segment the target area where peak appear as much as possible.
Definition 2: If H(k) is the histogram function for image I, the potential function for H(k) is:
 where

From Definition 2, we can find that the is the interpolation result for base potential function C(x).
 where α is attenuation factor. Because the base potential function is a smooth function, PH(k) is smoother than H(k). At the same time, the peak and valley features are similar to H(k) when we choose suitable α. Usually, the potential of histogram at the peak of potential function is bigger than other place. That means the closer the peaks are, the larger the potential function becomes, and vice versa. In order to eliminate the influence of one peak on the next peak, we need to attenuate the effect of the previous peak. So, we define the residual potential function of the histogram.
Definition 3: Assume the function P0(i) = PH(i) is potential function for the histogram; the residual potential function for K order histogram can be described as follows [6]:
 where

If the histogram has C peaks, fd represents the factor that was used to control the attenuation of the potential function. We can define the potential dividing function group according to residual potential function of the histogram.

Take Eq. (6) into Eq. (9), we can get:

From Eq. (10), the potential dividing function actually represents a 4 step base potential function with center xk and height

We also find that the potential dividing function is decided by three factors: fd, xk, . The values of xk and are ultimately decided by fd. So, fd is the key factor for the whole potential dividing function. From Eq. (11), we know that as the attenuation factor α is equal to 1, Cd(x) function drops faster than C(x). Based on the previous knowledge, if the gray level G in image I is bigger, the number of the peaks in histogram is fewer, and the radius of the attenuation is bigger, then we can represent these relationships as a function. The adaptive fuzzy attenuation factor f can be defined as follows:
 where

β is the experiment parameter, C represents the number of peaks. DH is the difference between the maximum gray value and minimum gray value in the image I. After calculating for DH, we can control the corresponding relation between the height of Cd(x) and the peak point directly by Eq. (9).
2.3. The Multi-threshhold Ultrasound Image Segmentation
Resulting from the characteristics of ultrasound images, the value of C can be determined directly based on strengths of the echo [7]. The echo comes through differently in normal organs or pathological tissues; they can be classified as cyst, hypo, hyper, edge and speckle. So it can make sure the category C is equal to 5 directly and do the multi-threshhold segmentation by the potential function. The specific steps of the algorithm are as follows:
- 1)
- Calculate the histogram H(k) by Eq. (1).
- 2)
- Calculate the potential histogram function PH(k) by Eq. (3).
- 3)
- Calculate the adaptive fuzzy segmentation factor fd by Eq. (12).
- 4)
- Calculate the k order residual potential Pk(i), k ∈ {1, 2, 3, 4, 5} and extremely point of potential xk by Eq. (7) and Eq. (8).
- 5)
- Calculate the divided potential function Fk by Eq. (9).
- 6)
- Sort the xk in ascending order.
- 7)
- Adjust the order of Fk according to step 6,
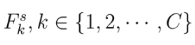 denotes the sequence after sorting.
- 8)
- Calculate the value of ik by
 so that C − 1 image segmentation threshholds can be determined.
- 9)
- Segment the image I by segmentation threshhold Tk, the represents the image I, g(x,y) represents the post-processing image.
The image classified function is as follows:
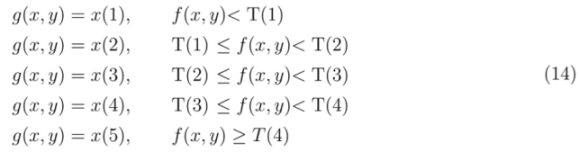
Our proposed approach uses the calculated threshhold as segmentation criteria, and uses the peak value of target area to represent the target area according to the maximum membership rule.
3. Experiments
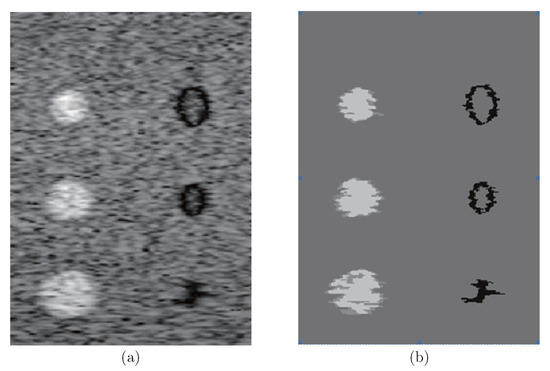
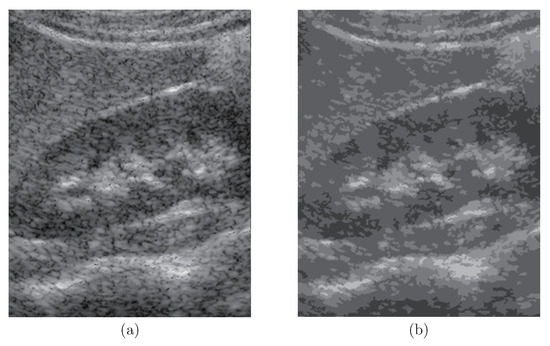
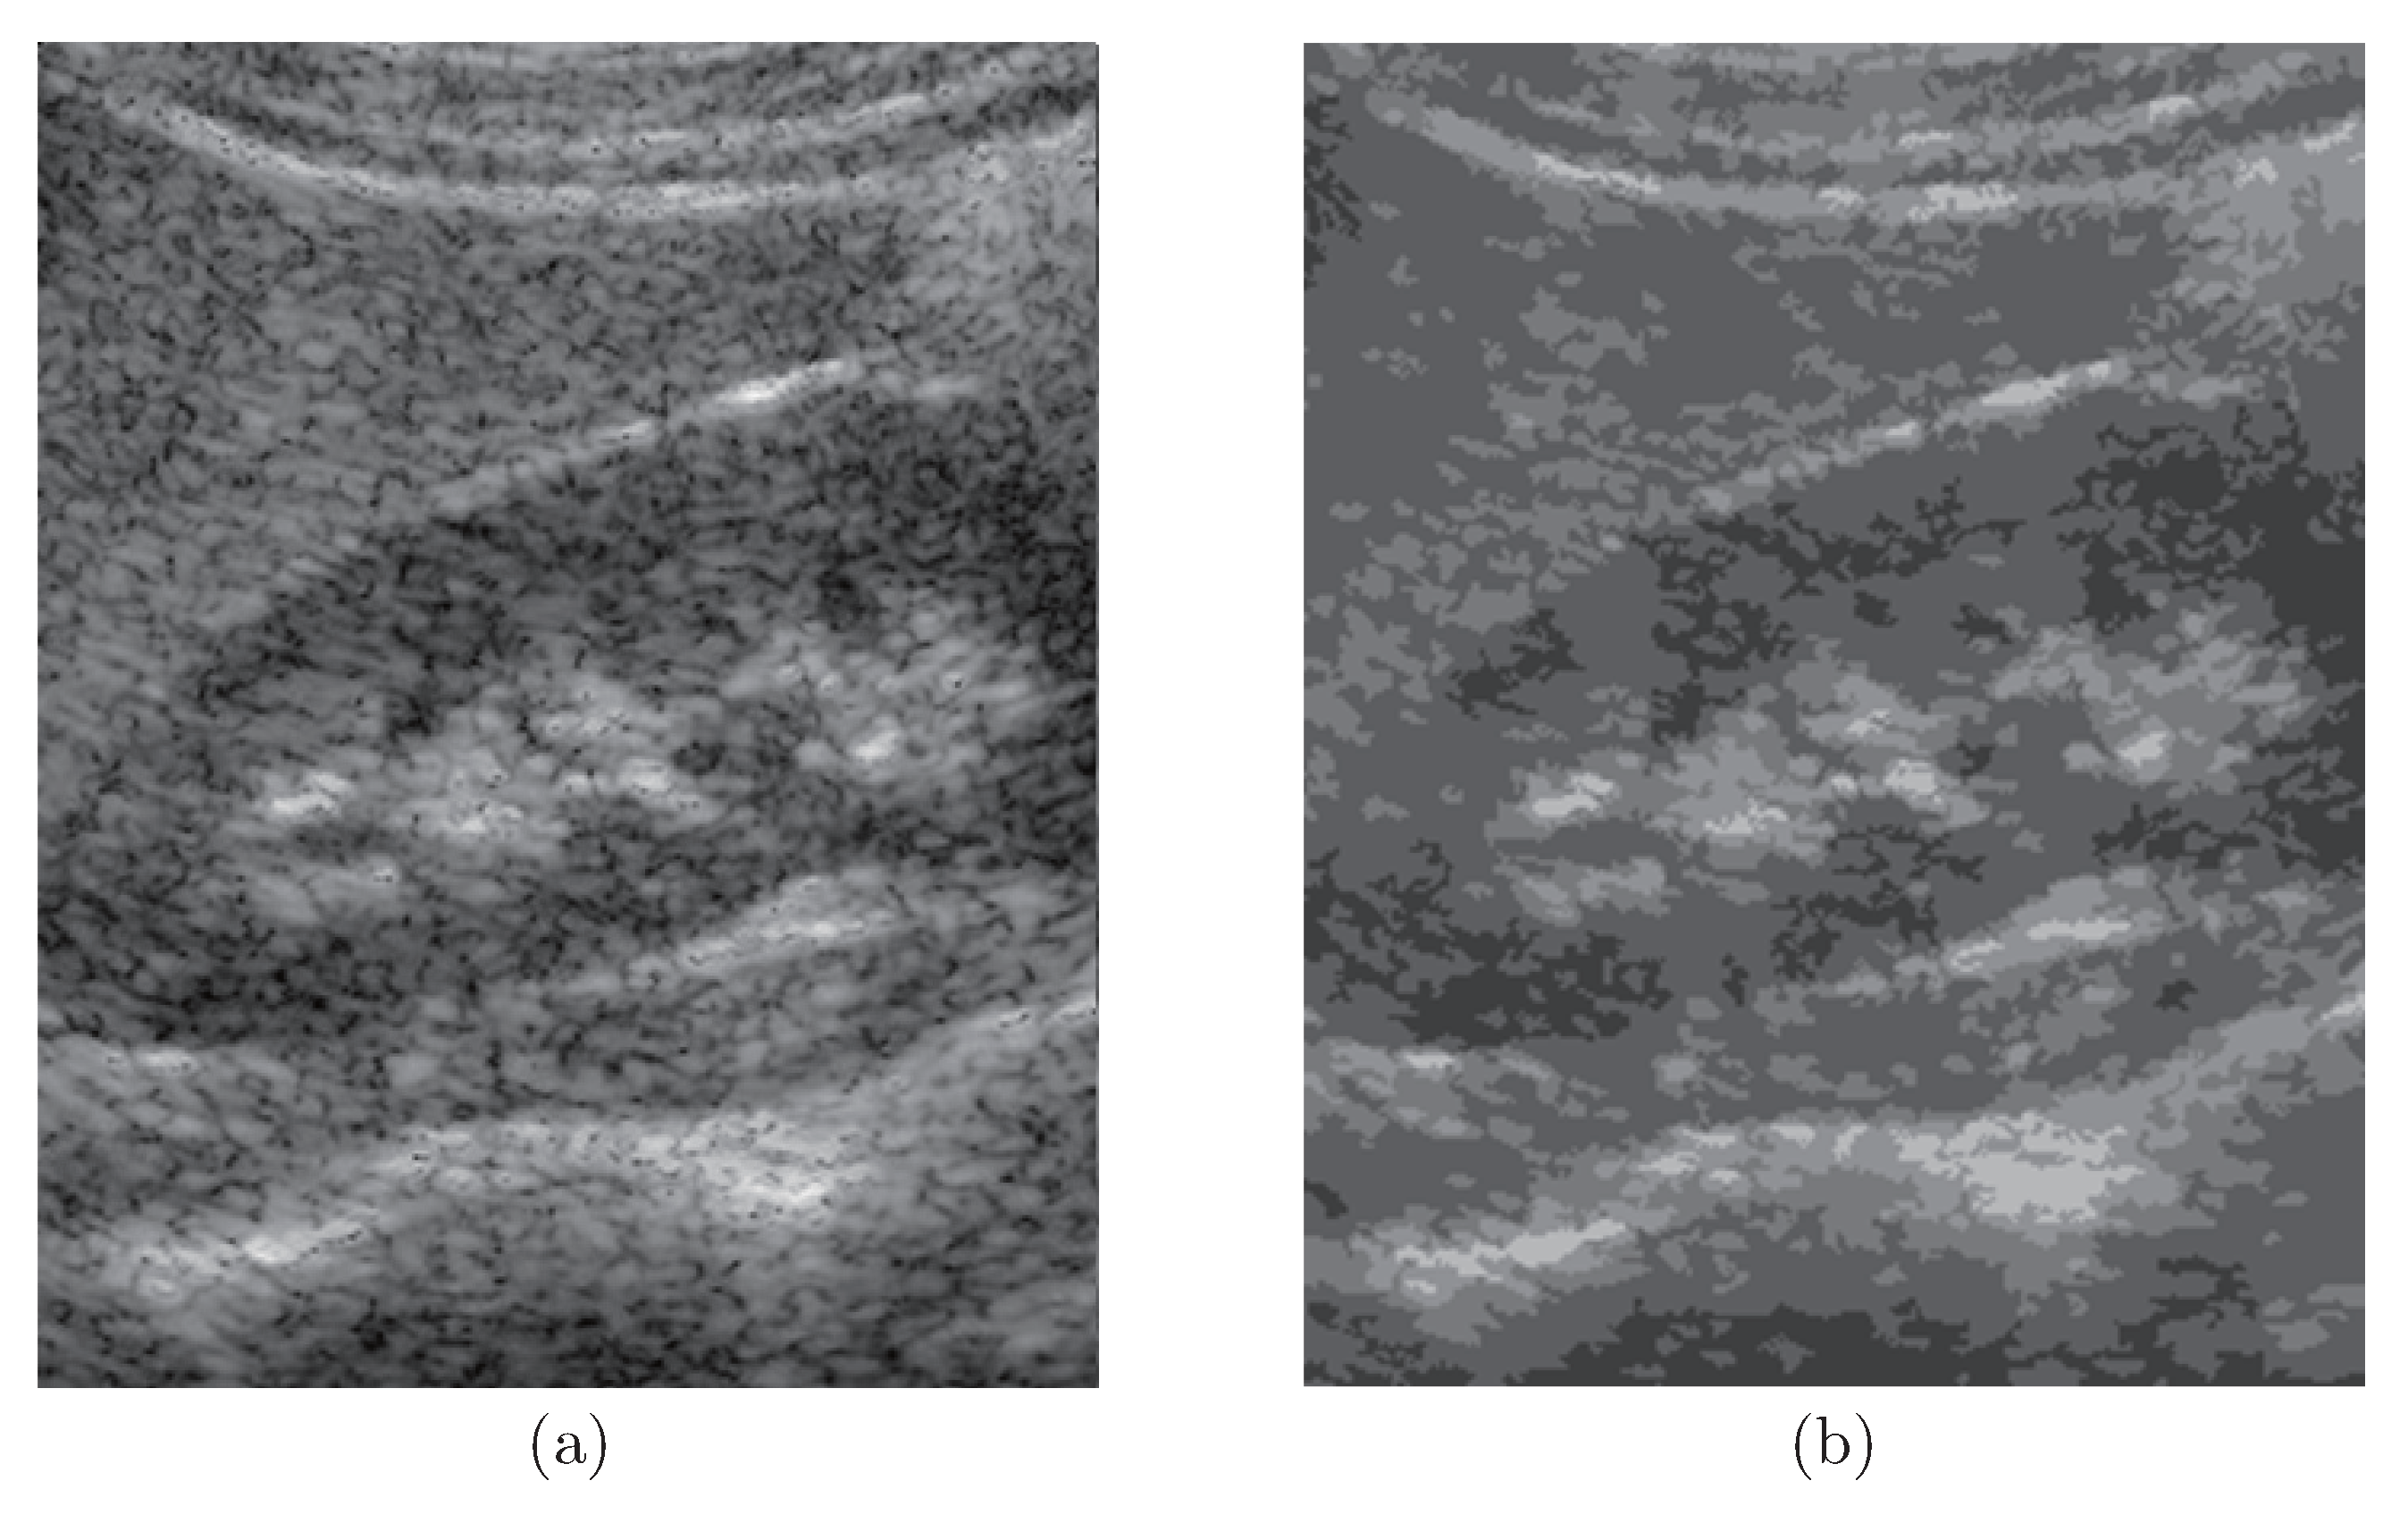
To verify our proposed algorithms, we applied the propose approach to simulated phantom images and in vivo images. The goal is to enhance the region of interest on these ultrasound images the physician may concern. Fig. 1 (a) is a medical ultrasound image that was simulated using Filed II [8,9]. Fig. 1 (b) shows the corresponding segmented image has obtained using our proposed multi-threshhold segmentation approach. It is clear that, in Fig. 1 (b), the speckle noise has been successfully reduced and smoothed.
Figure 1.
(a) Original computer simulated speckle image, (b) Multi-threshhold segmentation-processed image (SE1 = SE2 = 3 × 3, ∂ = 1, β = 60).
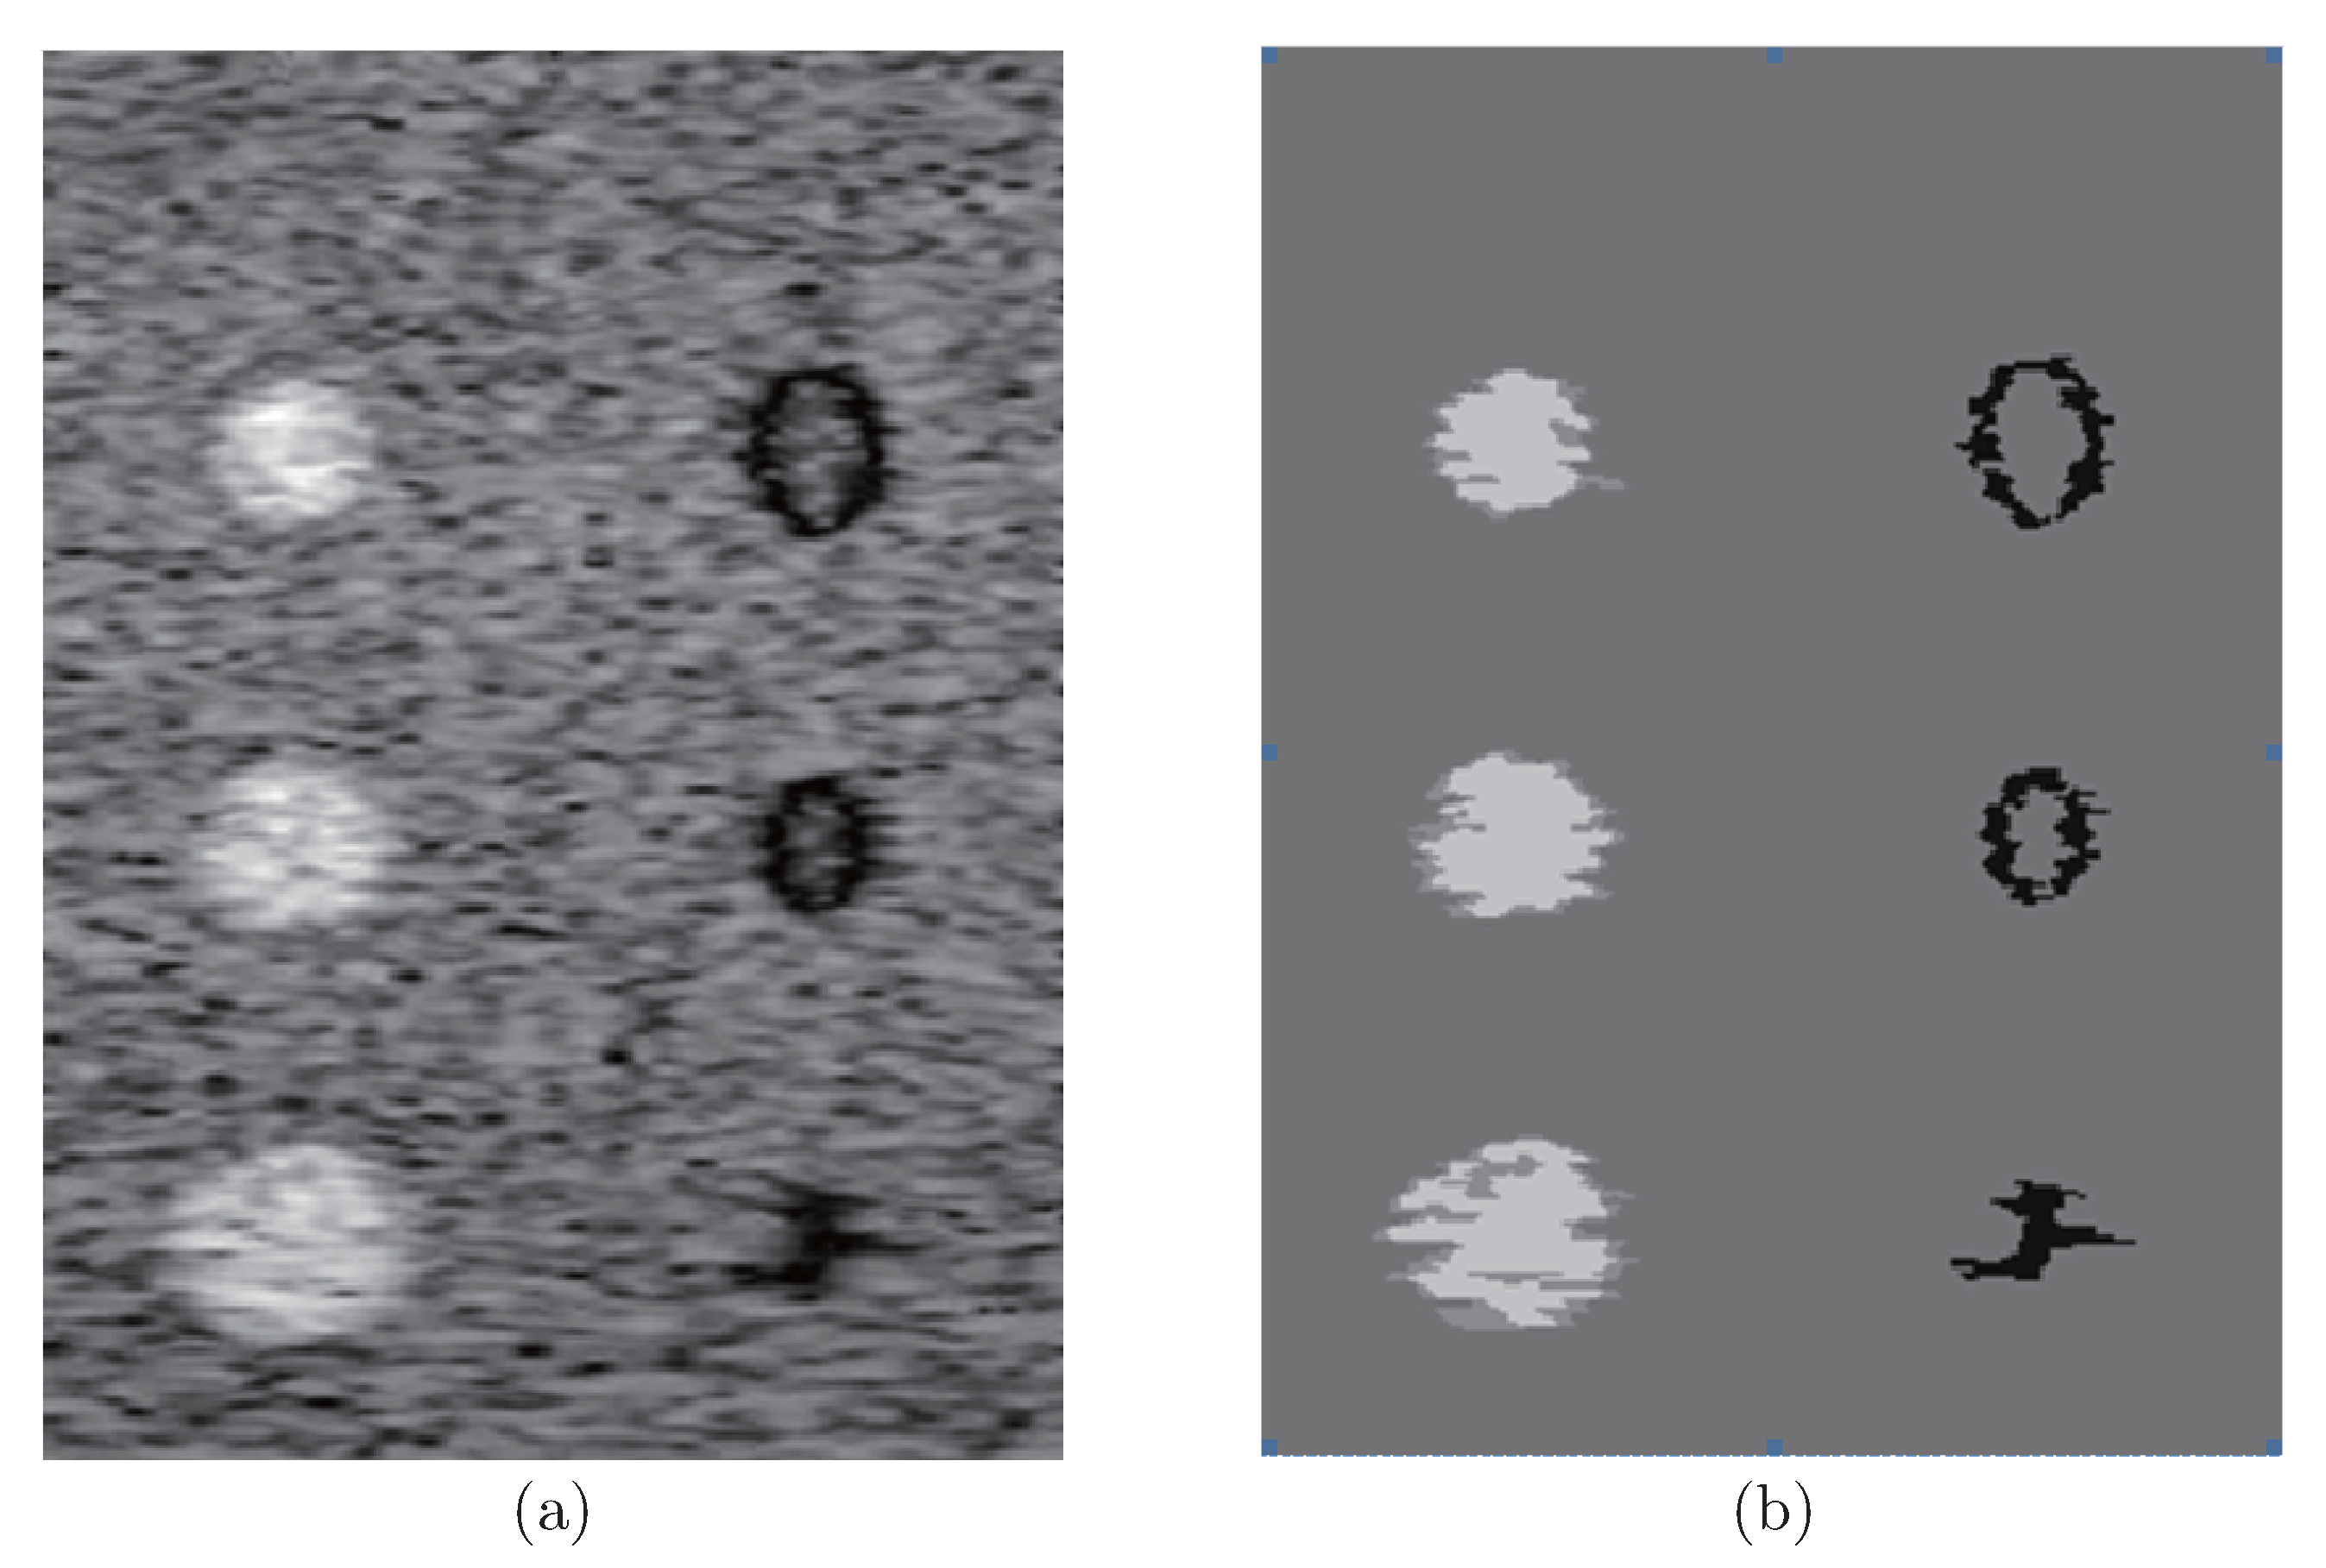
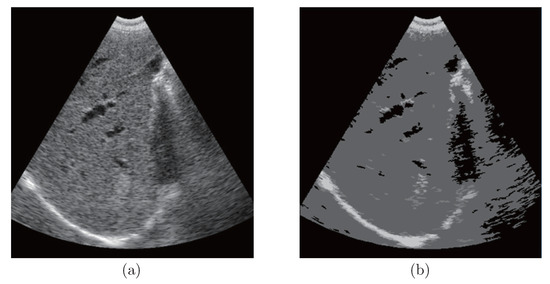
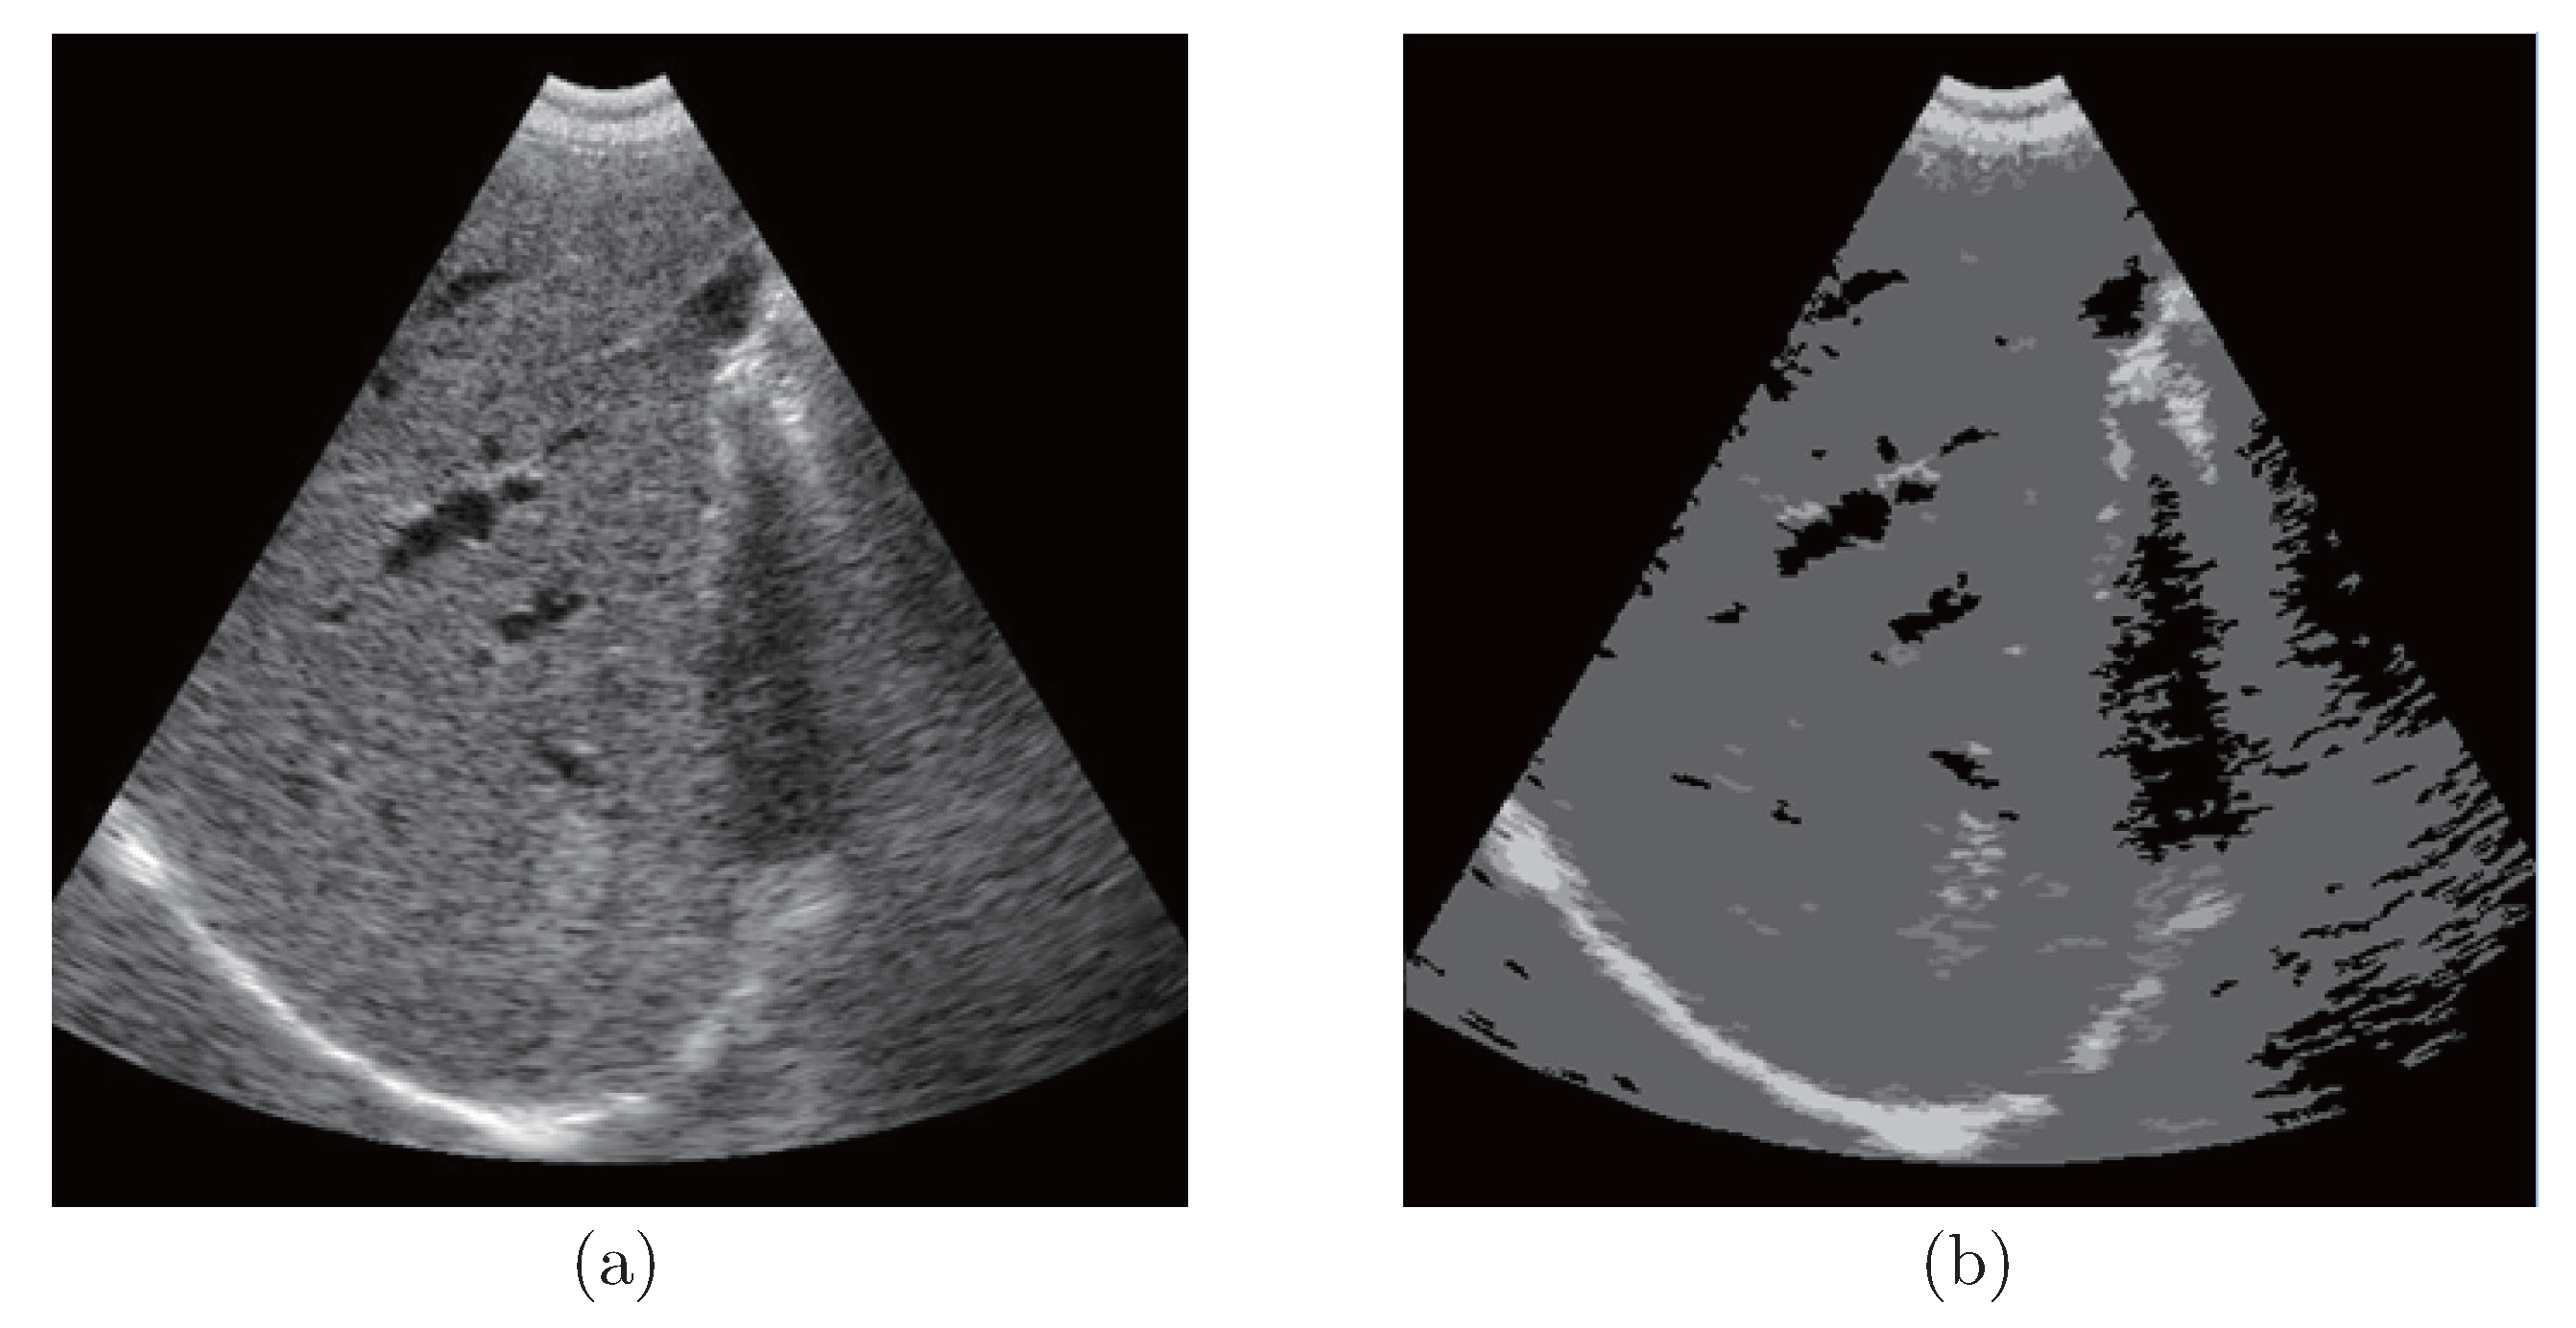
Fig. 2 shows similar results where we apply our proposed method to in vivo images. Fig. 2 (a) is an image showing a liver and kidney with strong edges. In Fig. 2 (b), the hypo- and hyper-echoic areas have been segmented in a more clear way than the original image in Fig. 2 (a). The features could have been ignored by doctors during scanning if we do not processing. Again, the speckle area was smoothed to help improve diagnostic accuracy.
Figure 2.
(a) Original liver image with a metastasis, (b) Multi-threshhold segmentation-processed image (SE1 = SE2 = 3 × 3, ∂ = 1, β = 30).
Fig. 3 (a) shows an image of a liver with possible metastaisis seen as a hyperechoic region. Fig. 3 (b) shows that the metastasis has been successfully segmented and enhanced. In this case, the size of our structural element in the morphological opening-closing operation is 3×3 for noise reduction.
Figure 3.
(a) Original image contains liver and kidney, (b) Multi-threshhold segmentation-processed image (SE1 = SE2 = 3 × 3, ∂ = 1, β = 60).
The proposed multi-threshhold segmentation algorithm in this paper not only provide effective segmentation for medical ultrasound images, but can also meet the different needs of clinical diagnosis through parameter adjustments. By varying the structural elements (SE1, SE2), attenuation parameters, α, and the experimental parameter, β, our algorithm can control the fine degree of the multi-threshhold classification. The structural elements are used to control the degree of noise reduction or detail preservation. The smaller the elements, the more detail is preserved. The attenuation rate becomes slower when the attenuation parameters become bigger, and vice versa. In addition, the experimental parameter and the radius of attenuation will be bigger when the adaptive fuzzy attenuation factor, f, becomes smaller.
Beside the above-mentioned advantages, the algorithm proposed by this paper has high efficiency in real-time operation. The data in Table 1 show the high efficiency of operation. The main reason for this is that the algorithm has a natural parallel computing structure. It also can uses a parallel multi-threshhold segmentation method in the image segmentation process. The proposed algorithm was implemented in MATLAB R2012b (MathWorks; Natick, MA). All experiments were evaluated on a super-computing workstation with a 3.10 GHz Xeon CPU (Intel Corp.; Santa Clara, CA) and 16 GB memory. The processing times for differently sizes ultrasound images are shown in Table 1.
Table 1.
Processing times for differently-sizes ultrasound images.
4. Conclusion
Our proposed multi-threshhold segmentation algorithm is a semi-automatic image segmentation method. It can meet a variety of clinical diagnosis demands after adjusting certain parameters. First of all, our method uses the space geometry information from the image for pre-processing using a morphological opening-closing reconstruction algorithm. Then, the histogram potential function is divided according to the statistical information that comes from the gray histogram. Finally, the ultrasound image segmentation is completed by cluster multi-threshhold segmentation that comes from the divided potential function of the histogram. Our initial results demonstrated that the proposed method could be used to improve the segmentation quality as post-processing tool. In the near future, we plan to further investigate the use of this algorithm in conjunction with echocardiography.
References
- Wang, Bo; Liu, Dong C. A novel edge enhancement method for ultrasound imaging. In Proceedings of the 2nd International Conference on Bioinformatics and Biomedical Engineering, ICBBE; 2008; 2008, pp. 2414–2417. [Google Scholar]
- Deepti, Mittal; Kumar, Vinod; Chandra Saxena, Suresh; Khandelwal, Niranjan; Kalra, Naveen. Enhancement of the ultrasound images by modified anisotropic diffusion method [J]. Med. Biol. Eng. Comput. 2010, 48(12), 1281–1291. [Google Scholar] [CrossRef] [Scilit]
- Elisa, Veronese; Stramare, Roberto; Campion, Andrea; Raffeiner, Bernd; Beltrame, Valeria; Scagliori, Elena; Coran, Alessandro; Ciprian, Luca; Fiocco, Ugo; Grisan, Enrico. Improved detection of synovial boundaries in ultrasound examination by using a cascade of active-contours [J]. Med. Eng. Phys. 2013, 35(2), 188–194. [Google Scholar] [CrossRef] [Scilit]
- Ali, Kermani; Ayatollahi, Ahmad; Mirzaei, Ahmad; Barekatain, Mohammad. Medical ultrasound image segmentation by modified local histogram range image method [J]. J. Biomed. Sci. Eng. 2010, 3(11), 1078–1084. [Google Scholar]
- Jisheng, Song; Delp, Edward J. The analysis of morphological filters with multiple structuring elements [J]. Comput. Vis. Graph. Image Process. 1990, 50(3), 308–328. [Google Scholar] [CrossRef] [Scilit]
- Pei, Ji-Hong; Xie, Wei-Xin. Adaptive multi threshholds image segmentation based on potential function clustering [J]. Chin. J. Comput. 1999, 22(7), 758–762, in Chinese. [Google Scholar]
- Li, Xiaoying; Liu, Dong C. Ultrasound speckle reduction based on image segmentation and diffused region growing. In Proceedings of the 11th Joint Conference on Information Sciences, 2008. [Google Scholar]
- David, Bæk; Arendt Jensen, Jørgen; Willatzen, Morten. Modeling transducer impulse responses for predicting calibrated pressure pulses with the ultrasound simulation program Field II [J]. J. Acoust. Soc. Am. 2010, 127(5), 2825–2835. [Google Scholar] [CrossRef] [Scilit]
- Jensen, Jørgen Arendt. Simulation of advanced ultrasound systems using Field II. In Proceedings of the IEEE International Symposium on Biomedical Imaging: Nano to Macro, 2004; pp. 636–639. [Google Scholar]

© 2015 Textile Bioengineering and Informatics Society. This article is an open access article distributed under the terms and conditions of the Creative Commons Attribution (CC BY) license (https://creativecommons.org/licenses/by/4.0/).