


Abstract
In order to inspect woven fabric density automatically, a method combining image processing and multiscale wavelet transform is proposed in this paper. Firstly, fabric images are pre-processed by Bimodal Gaussian function histogram equalization to obtain more structure information. Secondly, fabric images are decomposed into horizontal and vertical sub-images by using wavelet filter. Thirdly, texture features are extracted from the sub-images through binarization and smooth processing. Finally, density of yarns is acquired accurately after analyzing features of warps and wefts of the fabric. The experiment results prove that the proposed algorithm is perfectly suitable for three principle weaves and the relative error of automatic inspection compared with manual inspection is less than 0.86%.
1. Introduction
Fabric density is an important index in inspection of the fabric quality. However nowadays fabric density inspection relies on traditional manual operation with the aid of a magnifying glass, microscope and so on [1]. Manual analysis is time-consuming, and results are greatly influenced by subjective factors of checkers, which might lead to different results among different checkers. Therefore, textile industries have a demand of an objective and accurate recognition system, which can obtain the woven fabric density with high speed, to satisfy the need of flexible production. With development of computer vision, pattern recognition, image processing and analysis, some relevant algorithms are presented to detect woven fabric density and many achievements have been obtained. T. J. Kang [2,3] extracts reflected light image and transmitted light image of fabric style with the illumination system. However, this method can only be applied in few fabrics. Gray level co-occurrence matrix is proposed by J. J. Lin in [4] for density inspection, which is just suitable for plain weaves. B. Xu [5] uses the inspection method based on Fast Fourier Transform (FFT) which is applied to acquire energy spectrum diagram. M. Tun’ak et al. [6] use Fourier transform to obtain frequency spectrum image of fabric. By selecting the horizontal and vertical center region of frequency spectrum to reconstruct fabric image, the reconstructed image only consists of warp or weft and then the density of the fabric is calculated. But the method based on Fourier transform is only applicable to monochrome fabrics. Comparing with the Fourier transform, wavelet transform could select a particular frequency band or scale in transformation [7]. Therefore, it is conducive to choose more effective texture information and give up some unrelated texture information making it possible to improve the speed and accuracy of texture analysis.
In this paper, an automatic assessment of woven fabric density based on image processing technology is proposed. Woven fabric image is preprocessed by median filter and Bimodal Gaussian function histogram equalization algorithm in order to filter noise and improve contrast. Then wavelet transformation is applied to decompose the pre-processed image into horizontal and vertical sub-images. After extracting and analyzing features of sub-images, woven fabric density is achieved accurately. The main process of woven fabric density is indicated in Figure 1.
Figure 1.
Flow diagram of automatic inspection of fabric density.
2. Wavelet Transform
Wavelet transform is inherited and developed from traditional Fourier transform. With good localization properties both in the time domain and frequency domain analysis and focusing on the details of any local information, wavelet transform is widely used in signal processing, pattern recognition and many other fields [8,9]. The definition of wavelet transform is shown as follows.
where, a is the dilation factor, b is the translation vector and ψ is Fourier transform.
Continuous Wavelet Transform (CWT) and Discrete Wavelet Transform (DWT) are two types of wavelet transform including. The reason of applying DWT is that only the discrete signals could be processed by computer [10]. Discrete wavelet transform coefficient is shown in Eq. (2):
where, the reconstruction function is given in Eq. (3).
where, C is a constant independent signal.
3. Image Processing
3.1. Image Acquisition and Preprocessing
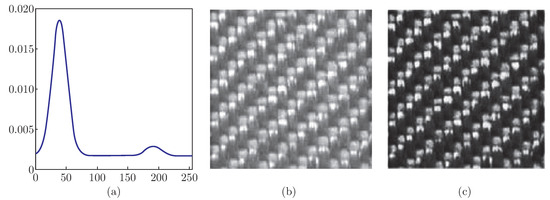
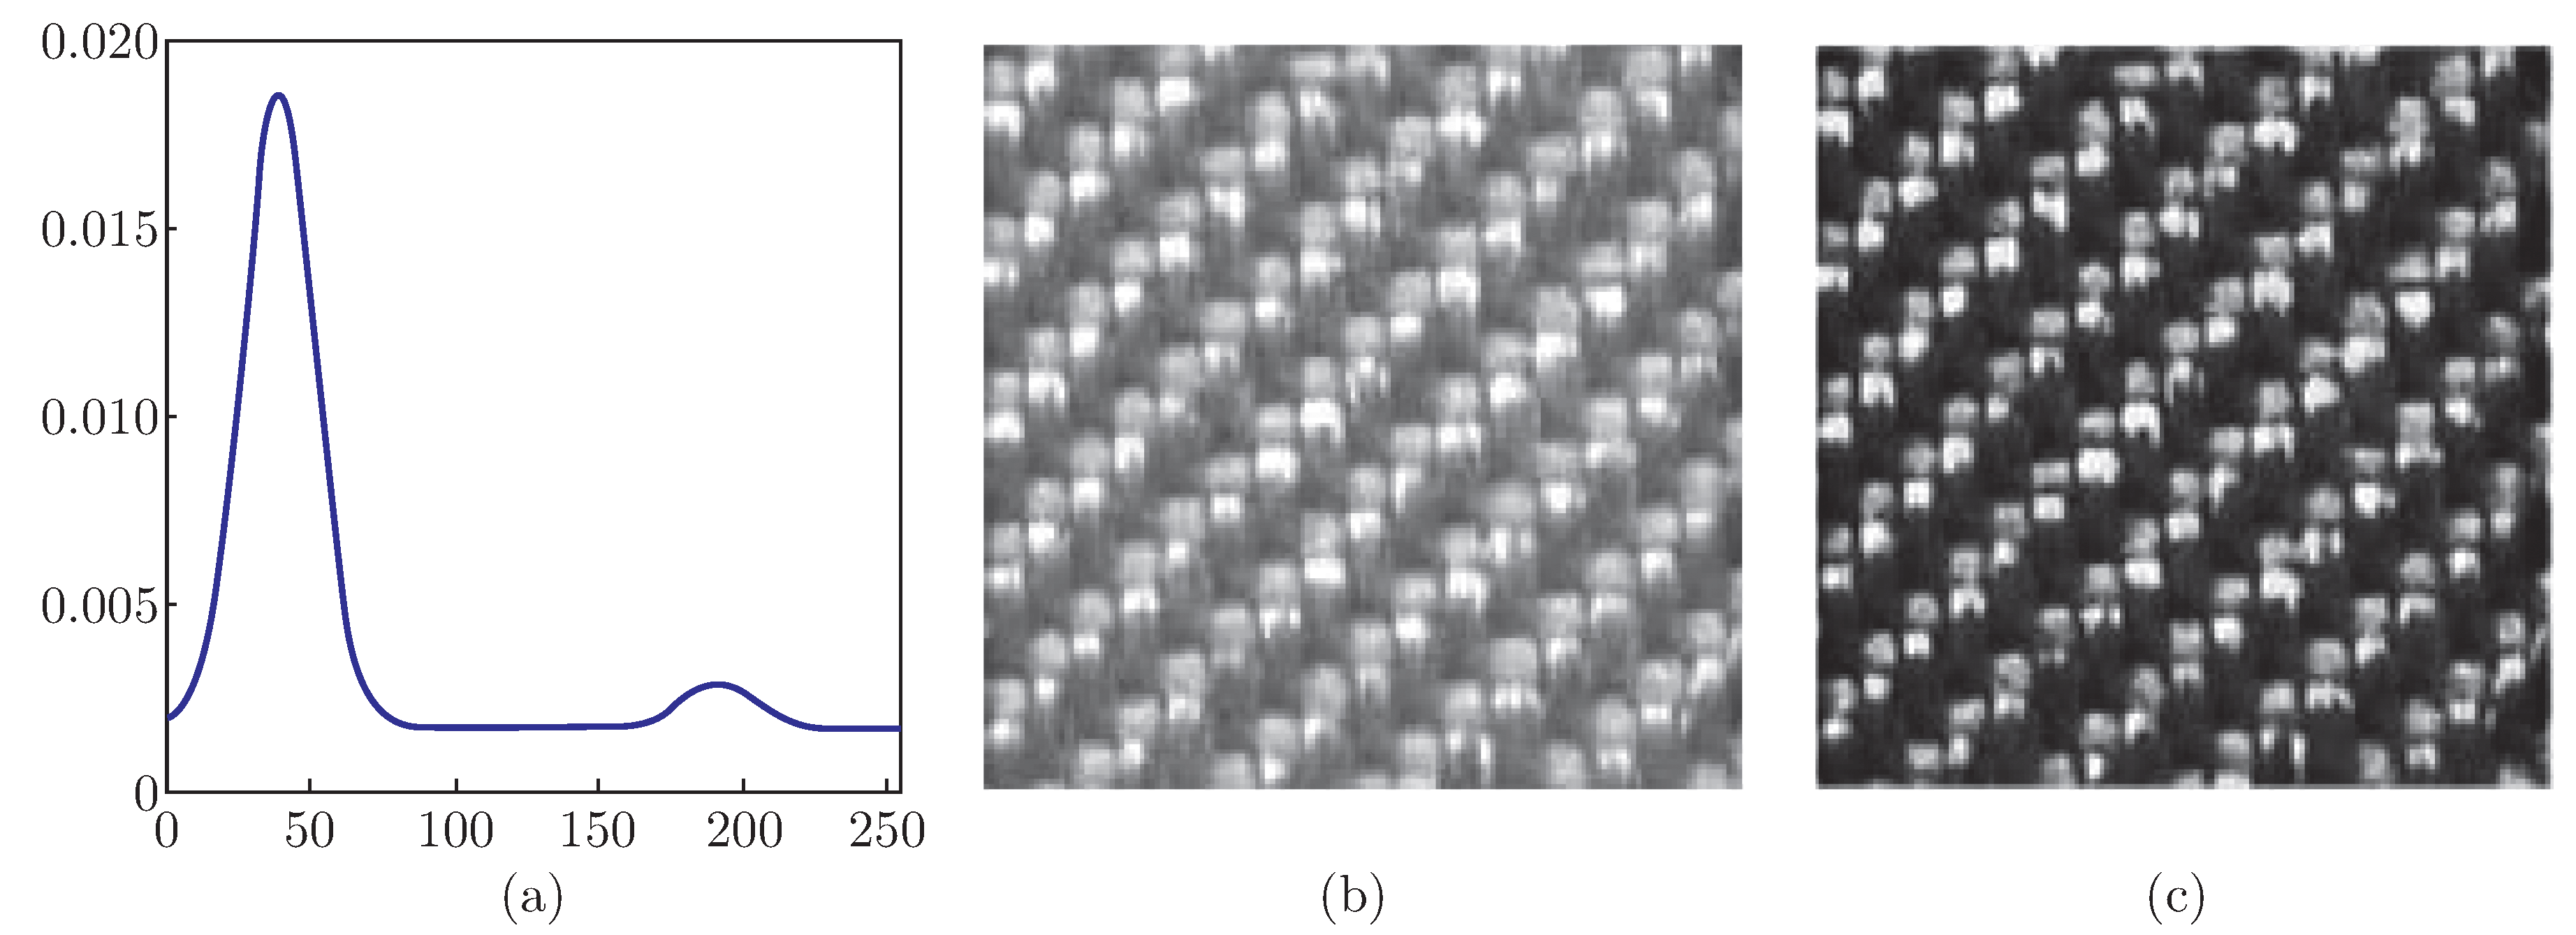
In this paper, three elementary weaves with different warp and weft density are captured via CanonScan 9000F scanner with resolution of 600 dpi. RGB images are resized into 256 × 256 pixels, which can be converted into gray images to improve processing speed and reduce the calculation amount. In order to improve the visual effect and facilitate image analysis of machine, image enhancement is used to make fabric texture more outstanding. Due to the pixel of gray images that is too concentrated, Bimodal Gaussian function histogram equalization is carried out to distribute the images gray level in lower and higher gray level so that fabric images contrast can be enhanced, which is conducive to demonstrate texture structure clearly and extract more structure information. The results of twill woven fabric are indicated in Figure 2.
Figure 2.
Comparison between gray and enhanced fabric images by histogram equalization. (a) Bimodal Gaussian functions graph, (b) The gray fabric image, (c) The enhanced fabric image.
3.2. Decomposition and Reconstruction of Fabric Image
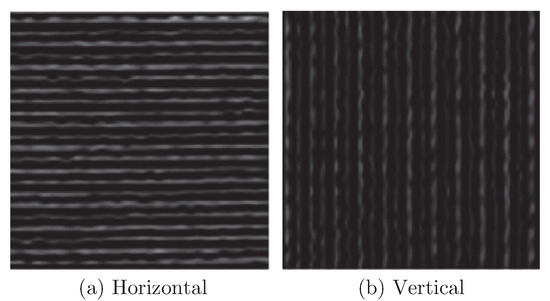
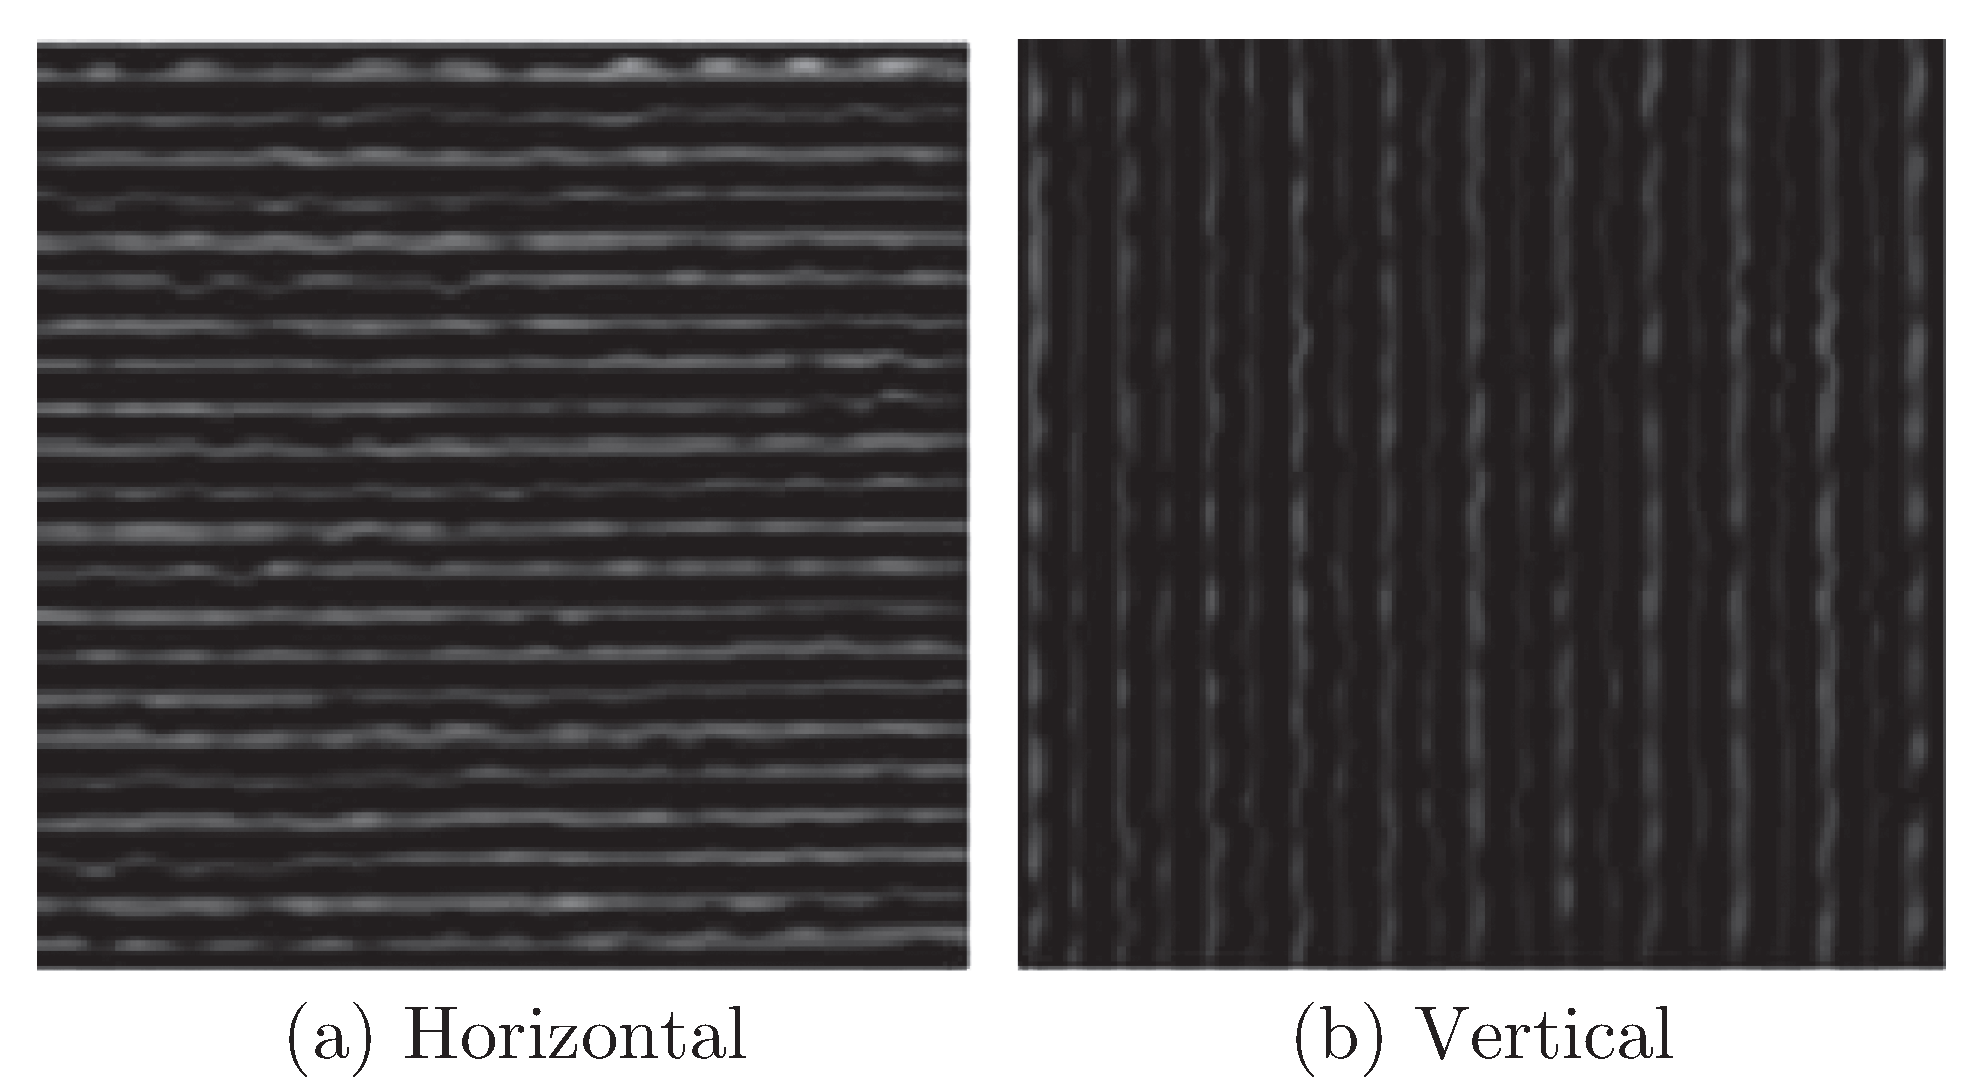
Wavelet transform is used for decomposing a woven fabric image into low and high frequency and reconstructing the high horizontal component and vertical component, after which the yarns information along the warp and weft direction could be acquired. It is important to select appropriate wavelet basis because that different wavelet basis correspond to different clarity of decomposition component, different wavelet decomposition levels and different clarity of images during the wavelet transforming. Compared with other wavelets, biorthogonal wavelet has advantages including scaling function and wavelet function being compacted support, high disappear matrix and linear-phase [11]. In this paper, biorthogonal wavelet 3.7 (bio3.7) is utilized to decompose and reconstruct the fabric image information in horizontal and vertical direction. Being decomposited and reconstructed, the information of warp and weft can be best reserved respectively in a layer of high frequency vertical and high frequency horizontal reconstruction images [12]. The experiments proved that the bio3.7 could make information of high frequency vertical and horizontal reconstructed images that corresponding to warp and weft direction more clearly. Compared with the results of decomposition from each level, it can be concluded that scales 3 wavelet decomposition is suitable for woven fabric and the results of one fabric image are shown in Figure 3.
Figure 3.
Woven fabric horizontal and vertical sub-images decomposed by wavelet.
3.3. Features Extraction and Analysis
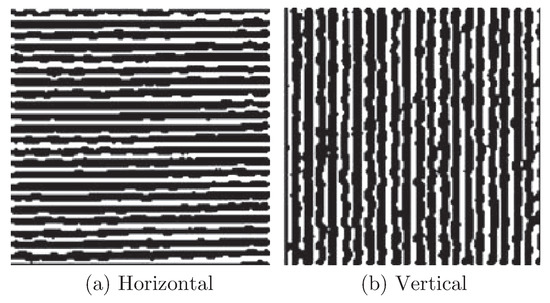
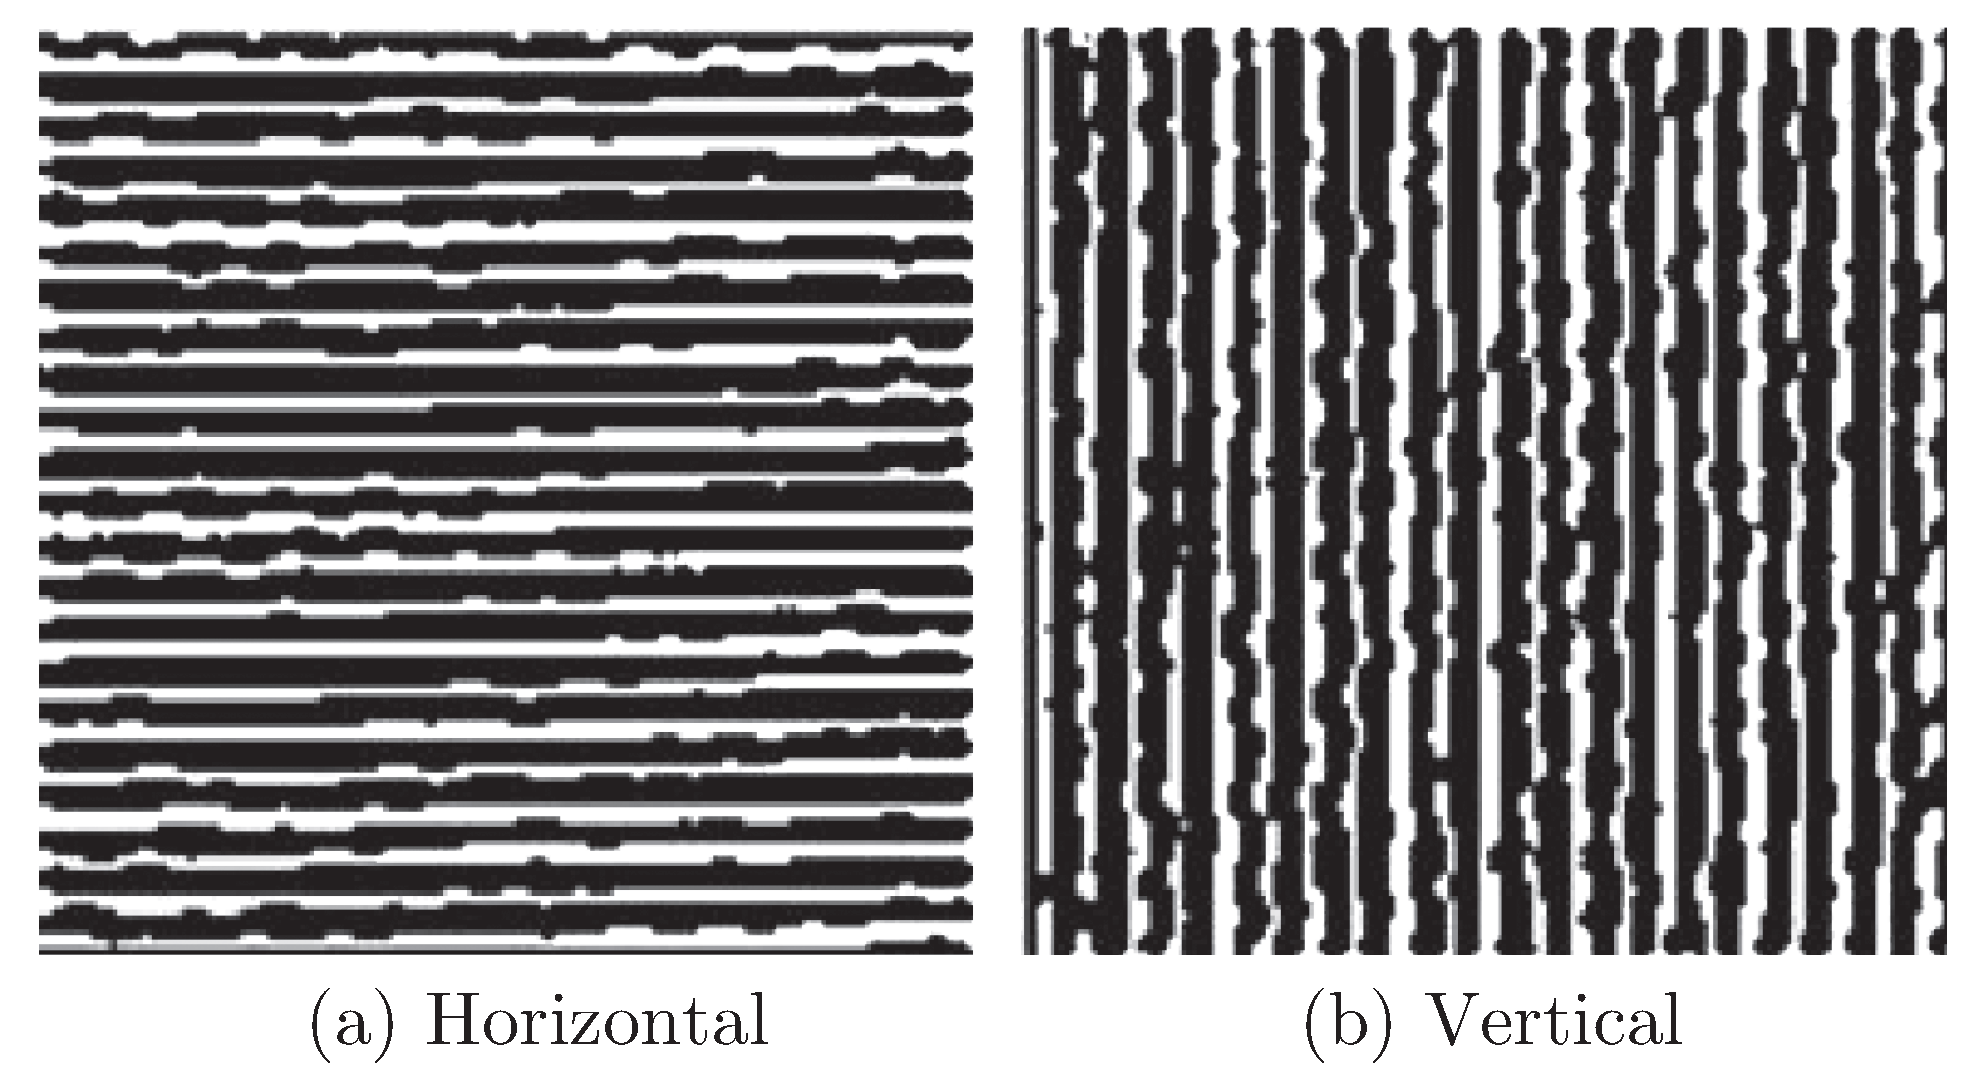
As shown in Figure 3, the arrangement of the yarns could be reflected by horizontal and vertical sub-images after wavelet decomposition and reconstruction. Binarization and smoothing of subimages are processed consequently for expressing information of warp and weft clearly and vividly. Binarization is that the images are represented in form of white and black. Selection of the proper threshold is very crucial in the binary process. Error diffusion dithering is applied in this paper to realize binarization processing [13]. In proposed method, pixel in the gray image is converted into 0 or 1 by comparing with a pre-determined threshold. But there are great errors between gray value (0-255) of this pixel and binary value (0 or 1). In order to reduce the influence of errors, errors are assigned to adjacent pixels according to the error distribution table of Burkers filter [14]. The results are shown as Figure 4.
Figure 4.
Result of binarization of sub-images.
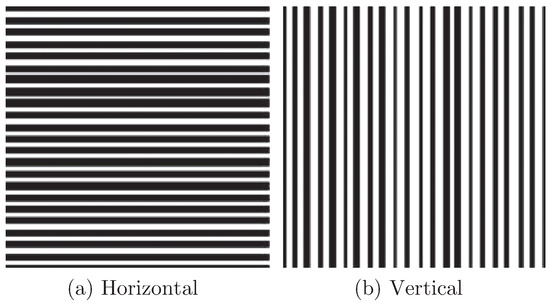
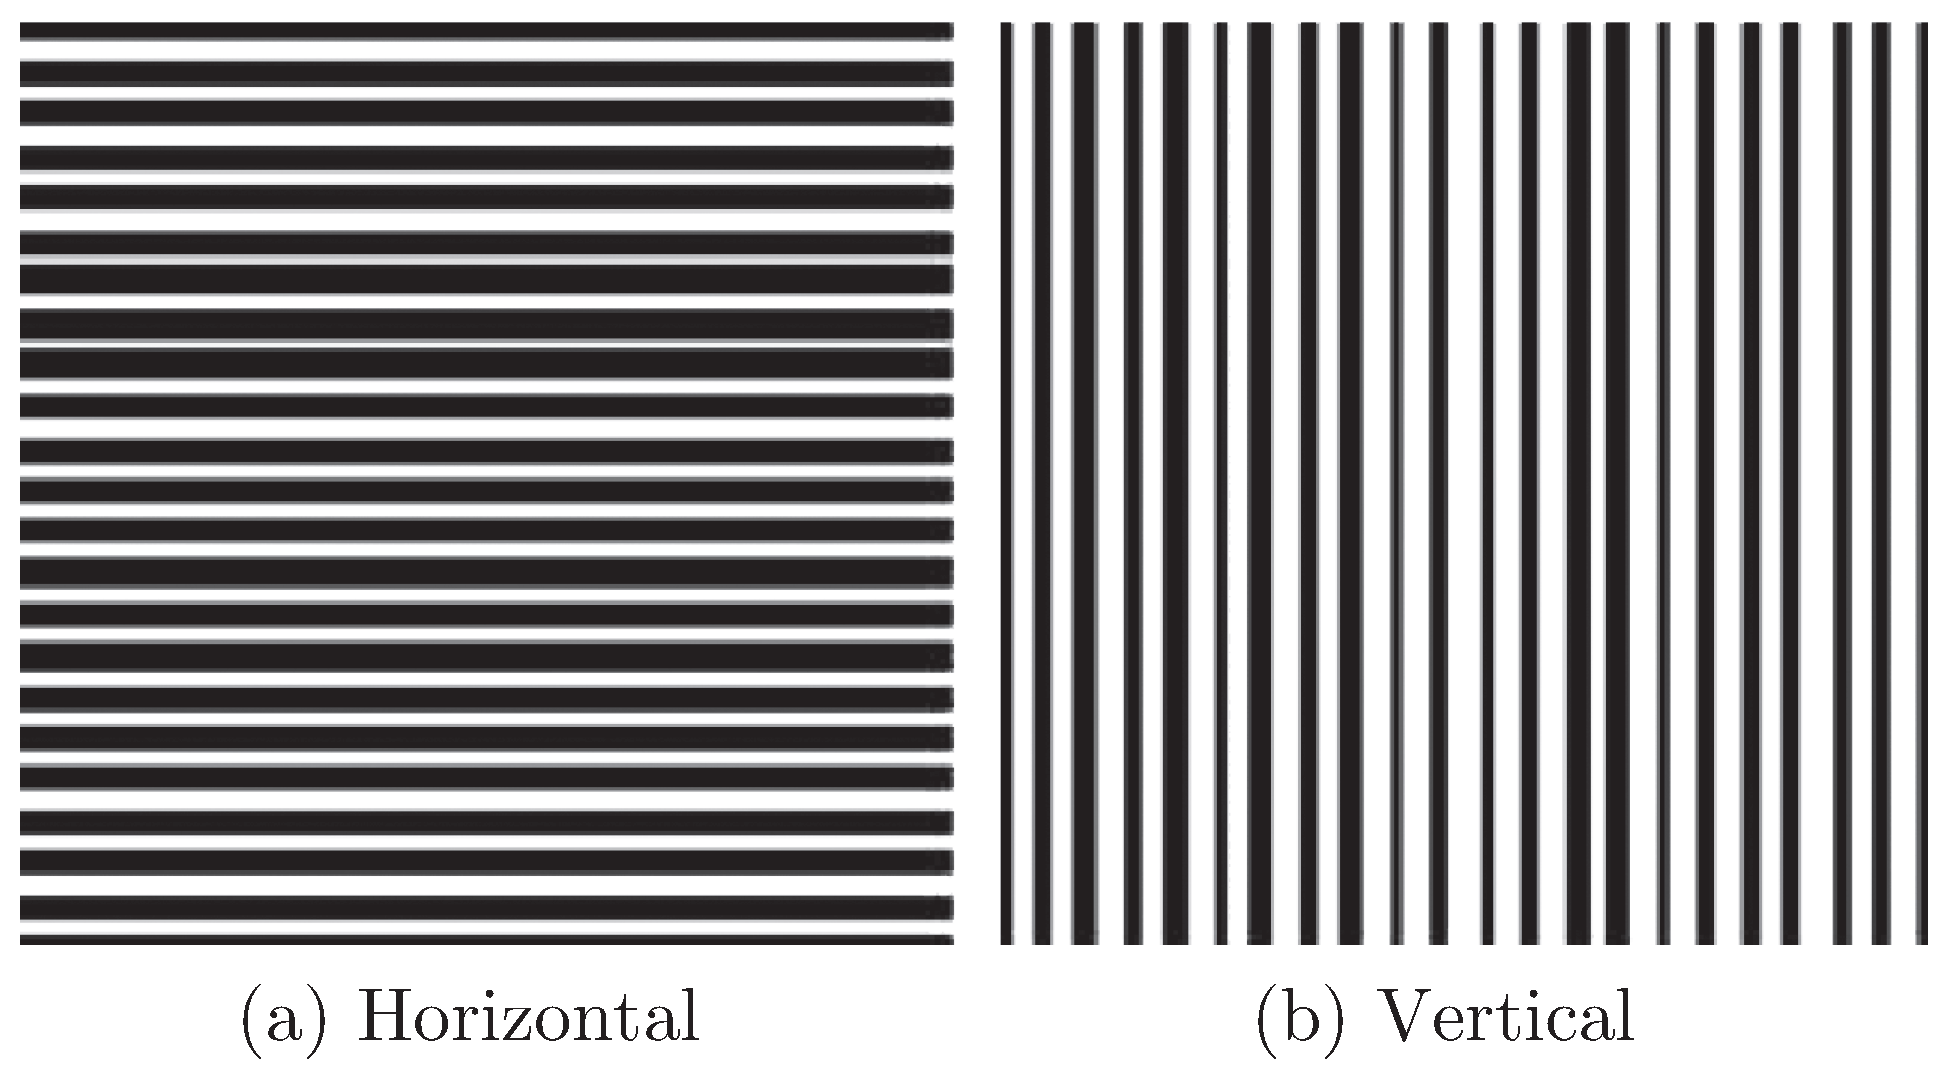
Outline of the yarns is presented after binary processing, but binarization results containing noises are not conducive to the density calculation. In order to reflect the arrangement of yarns more clearly and calculate the density of the yarn, it is significant to smooth the image. Smooth processing is applying gray value (0 or 1) of the majority number of the image pixels to represent the specific form of the yarn on this row (column) [15]. It is convenient to calculate the number of yarns in smoothed image. Results after smooth processing are shown in Figure 5. The yarn becomes very smooth and can be completely separated from the background.
Figure 5.
Result of smooth processing of sub-images.
3.4. Density Calculation
It’s easy to determine the position of yarn and compute fabric density, because the warps and wefts are extracted from original images. Selecting one row (one column) in the matrix of fabric images after smooth processing and calculating the amount of black pixels S which is consecutive, the number of black pixels in each yarn H will be calculated by S dividing the width of image. Density of warp and weft will be calculated by the multiplication of H and resolution of scanner R. Then unit of density is converted into standard density unit. The fabric density (yarns per 10 centimeter) will be calculated as follows:
where, R is resolution of scanner, W is the density of warp and weft of woven fabrics, H is the number of black pixels in each yarn.
4. Analysis of Experimental Results
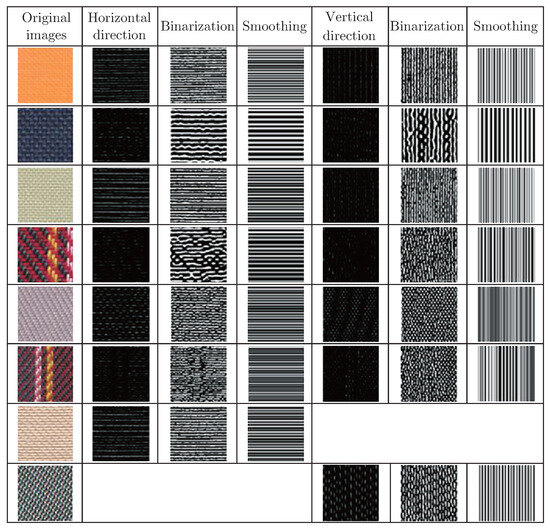
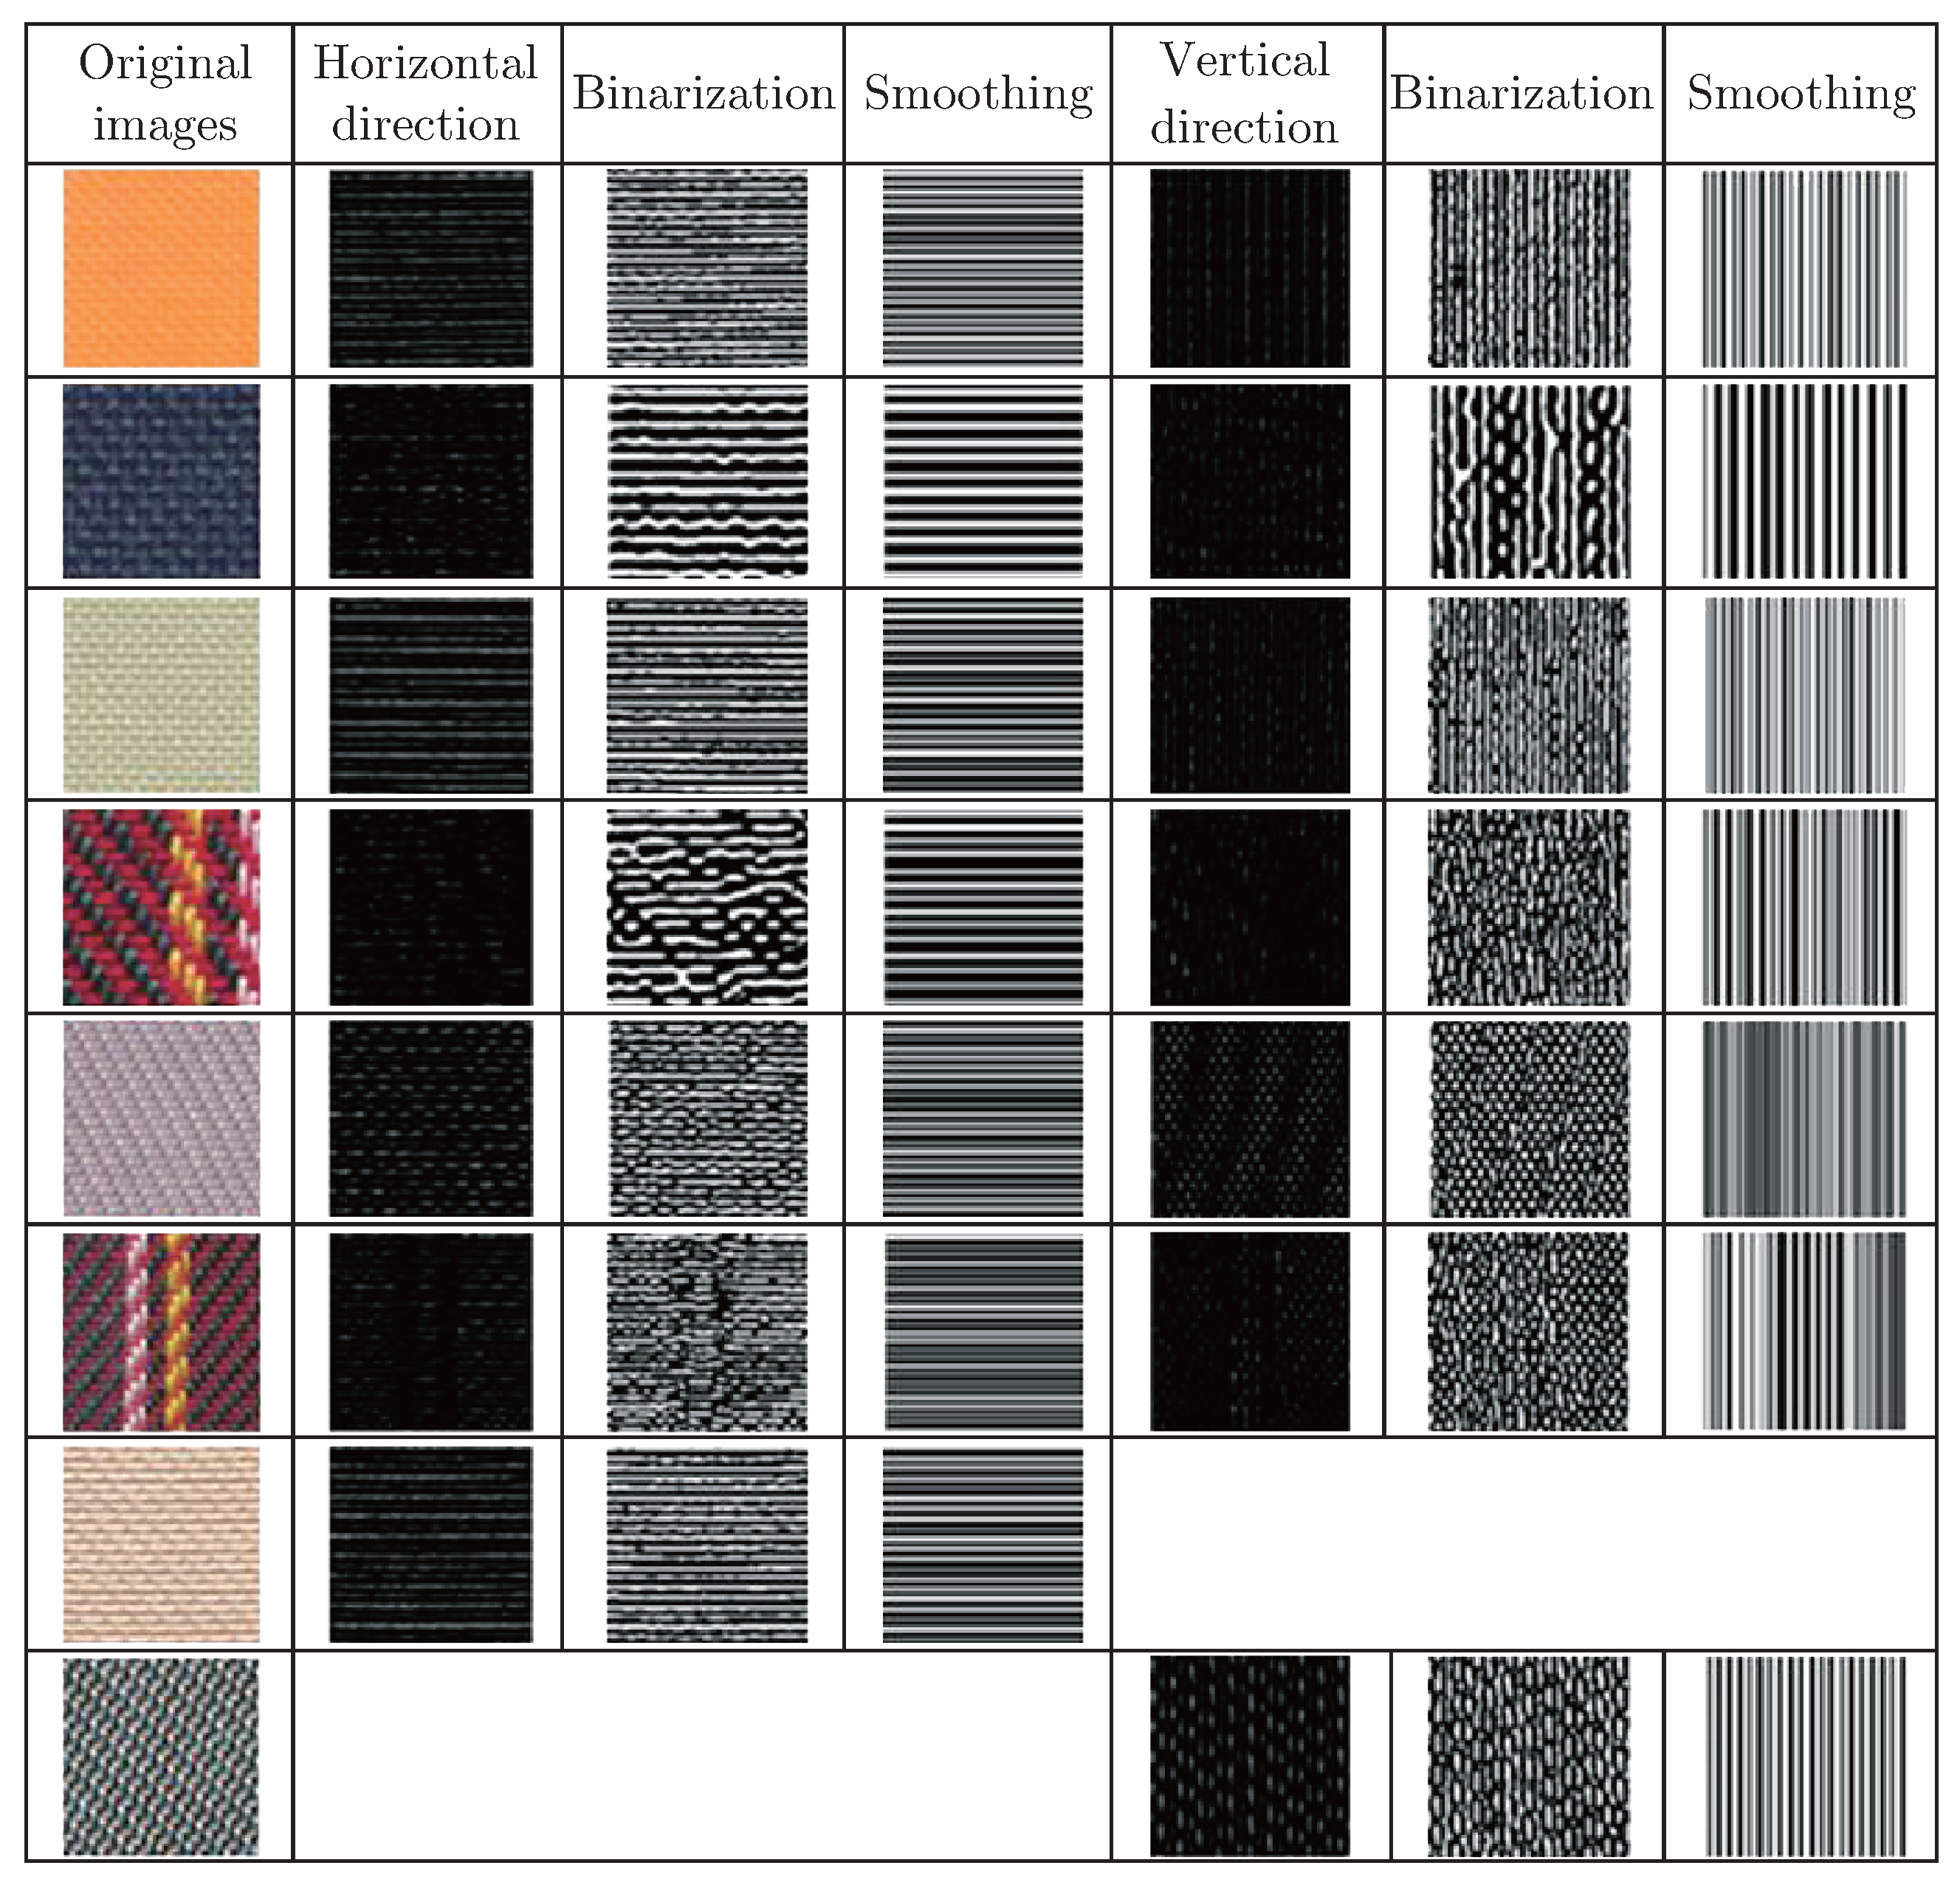
The results of woven fabrics with different densities of warp and weft in experiments are compared with the results of manual test to verify the accuracy improvement of proposed algorithm in this paper. Making skewed angle of fabric image during the image processing has no influence on accuracy of density detection and outline of yarn in the images that captured via the scanner could been observed clearly. Wavelet decomposition is utilized to obtain vertical and horizontal sub-images. So this method is more suitable for inspecting the density of plain weave. It is equally applicable to inspect the density of twill and stain weave through the study. As results of twill weave shown in Figure 6, texture features of non-warp or non-weft direction fabric still could be extracted after wavelet decomposition. Density of weft is calculated by weft image after image processing. Although texture of weft image after image processing is oblique, it still represents the warp which is distributed alternately. In Figure 6, on account of the organization structure of the satin to make the surface texture information shown as warp or weft, the satin weave can be divided into warp satin weave and weft satin weave. For warp satin weave, the weft information is not obvious through wavelet transform, which makes it difficult to compute weft density. But accuracy of the density detection of warp is high for warp satin weave, which is the same for the weft satin weave.
Figure 6.
Consequences from image processing that separately correspond to the original images.
The experimental results contrasted with manual measurement are shown in Table 1. In this Table, eight samples are applied to density detection. Samples number 1-3 are plain weave, Samples number 4-6 are twill weave, Samples number 7 is weft satin weave and Samples number 8 is warp satin weave. The result of manual measurement is x, the result of automatic measurement after image processing is y and the error is defined as (x−y)/x. The maximum error of warp density detection results is 0.56%, the maximum error of results of weft density detection is 0.86%. Manual measurements can be concluded that it has maximum precision of 0.5 yarns. For the whole fabric image, the result of automatic measurement is more accurate.
Table 1.
Woven fabric density inspection results.
5. Graphical User Interface Design
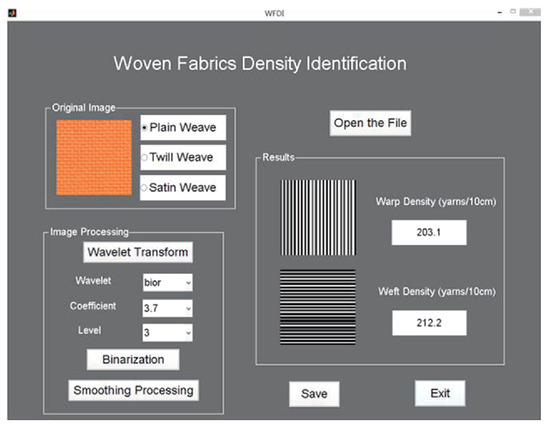
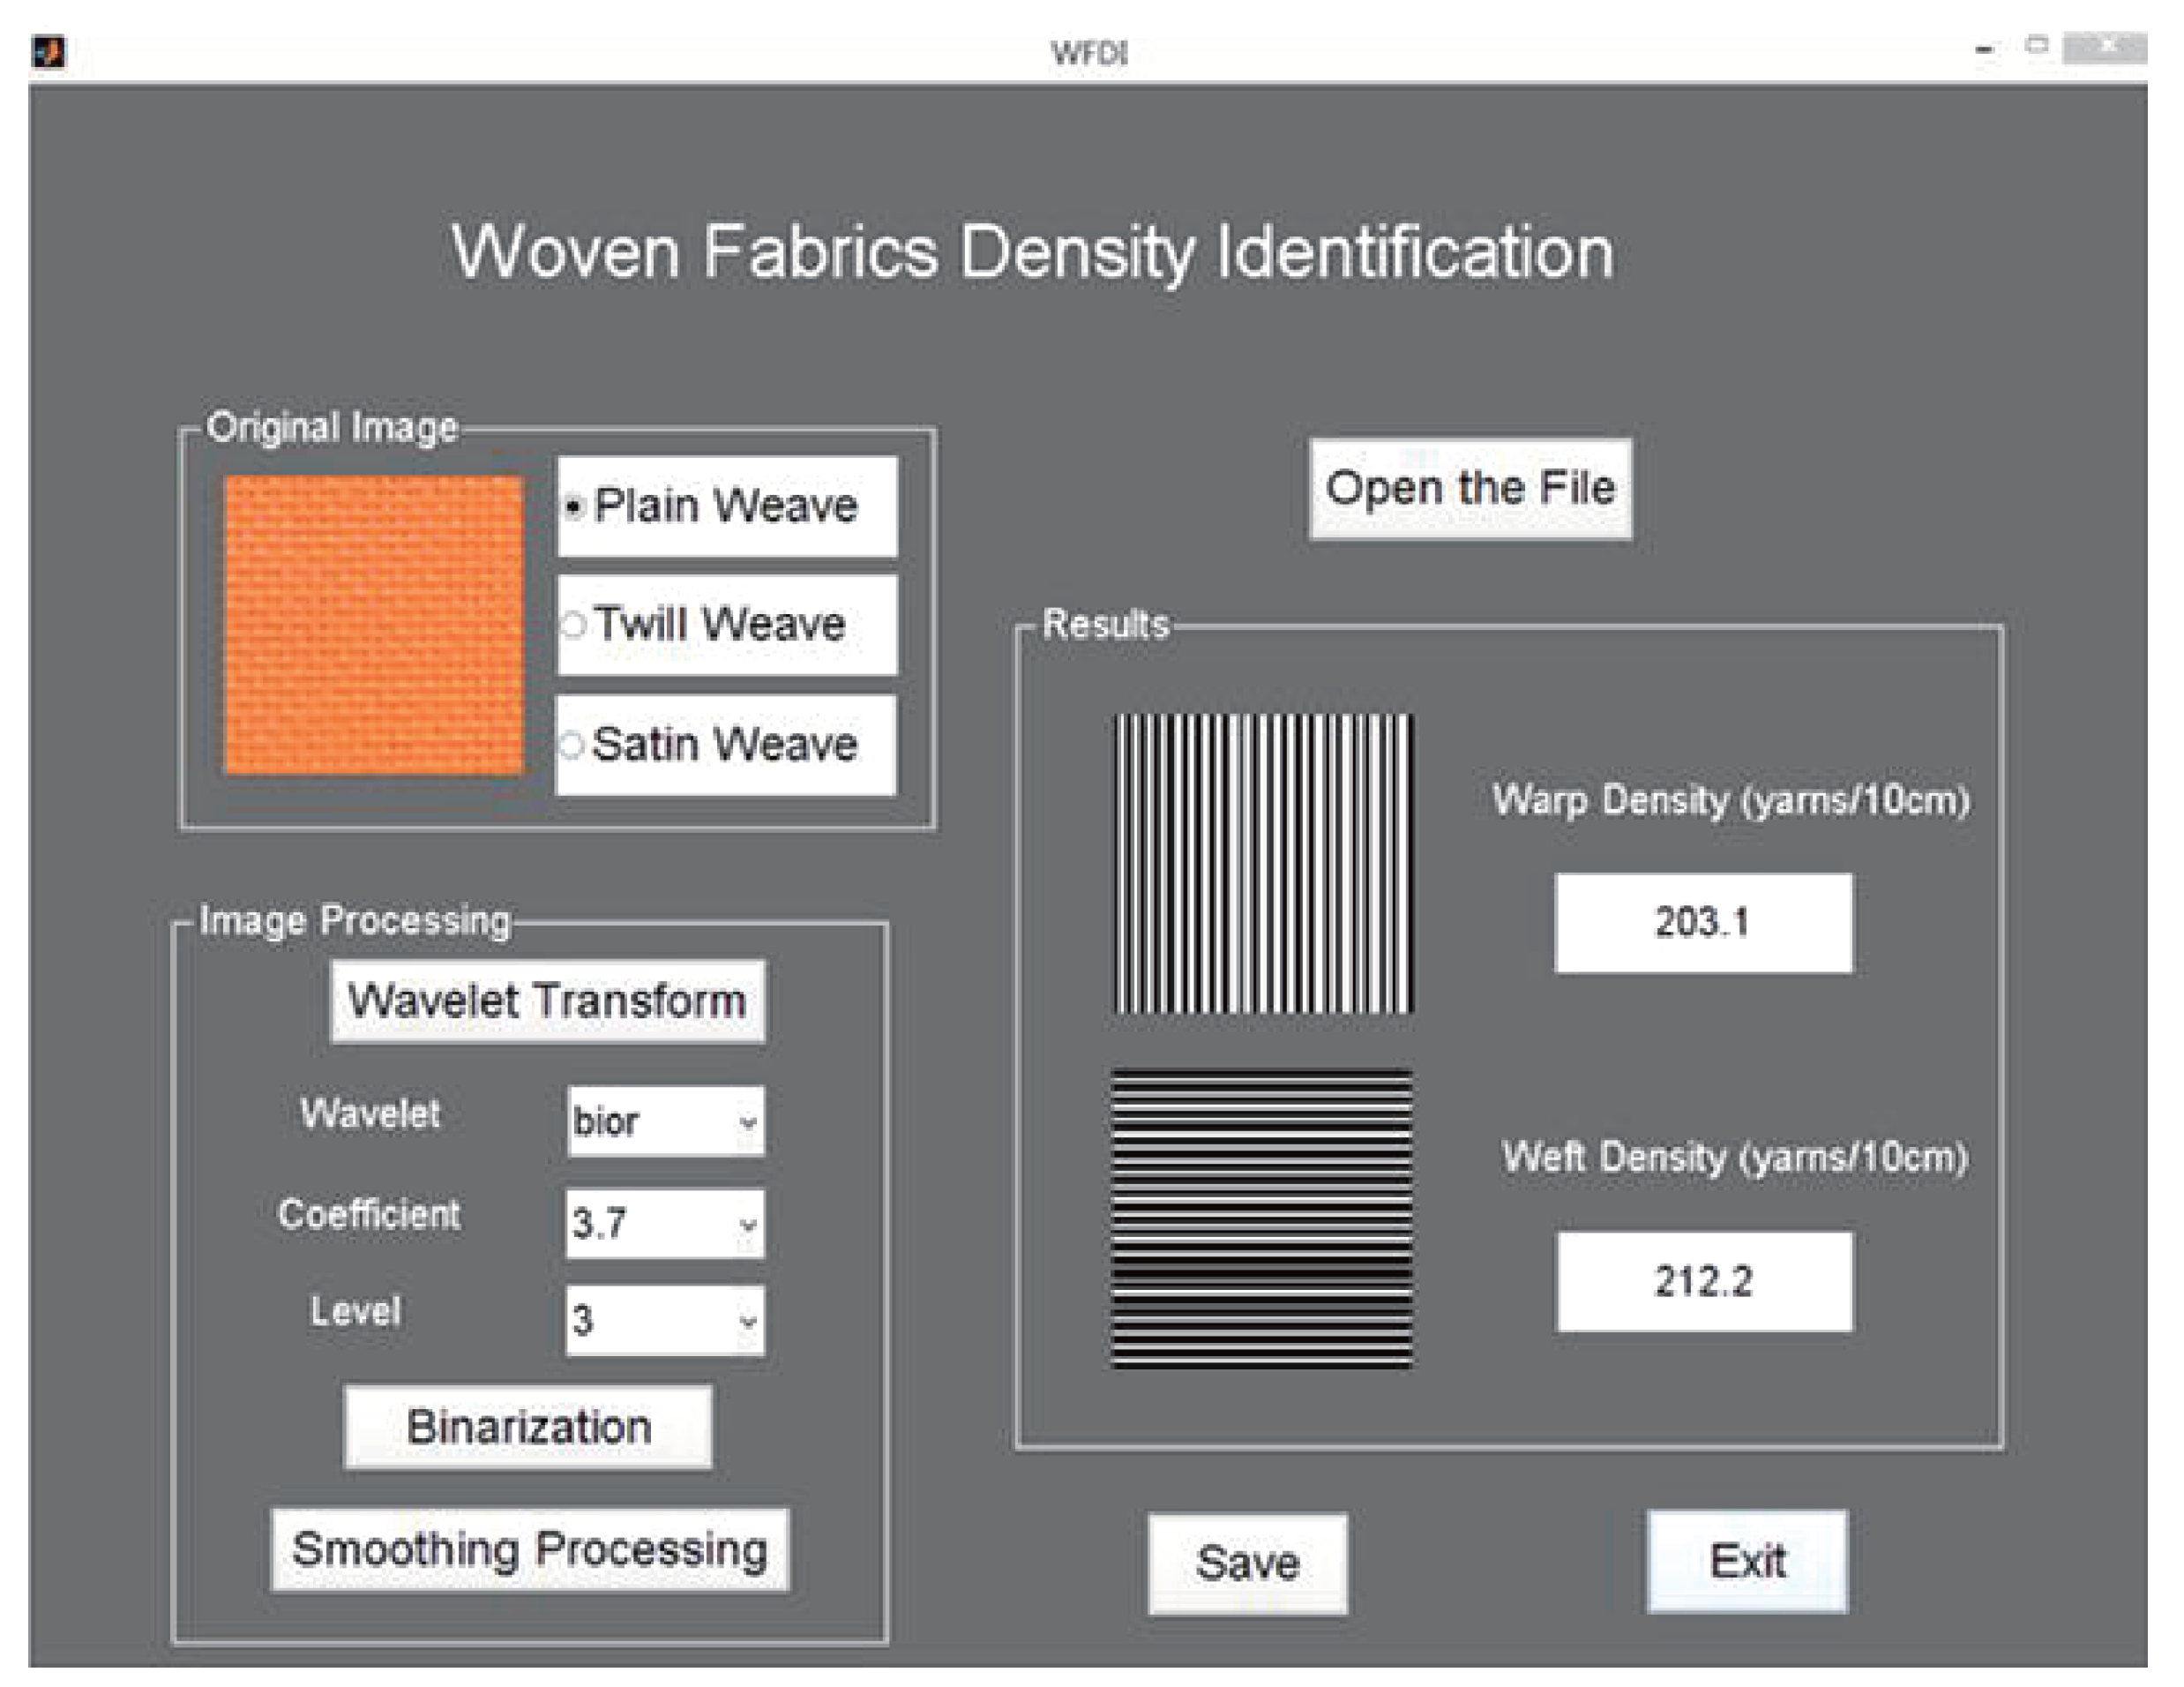
In order to promote experiment of woven fabrics density identification, the building of independent operation original image capturing and image identification software is designed. Interface of woven fabrics density identification Graphical User Interface (GUI) based on Matlab 2012a version has been designed in this paper. Main interface is indicated in Figure 7. This GUI possesses several practical characteristics. First, process of woven fabrics density identification could be decomposed into independent sections. Parameters setting is used for obtaining the best recognition conditions for density inspection of warp and weft, which is conductive to establish identification system. Second feature is real-time supervising function. Top left window in Figure 7 act as display window of original image. Bottom left in Figure 7 is an image processing window. The image processing window has three functions, which are wavelet transform function, image binarization function and smooth processing function. The appropriate selection of wavelet basis, wavelet coefficients and decomposition level can achieve wavelet transform, which could obtain better image information. Image binarization and smoothing processing are helpful to calculate the density of warp and weft. The third feature of interface is a flexible display. Display windows of interface identification process are reserved, relevant process windows and distinct procedures in image processing window can be exhibited for further analysis.
Figure 7.
Main interface of density identification.
6. Conclusion
A method is proposed in this paper, which combining image processing and wavelet transform to detect the density of warp and weft of woven fabric. The woven fabric images could be decomposed into vertical and horizontal sub-images through wavelet transform. Then the density of woven fabrics could be inspected by analyzing features of the sub-images. Thirty plain samples, thirty twill samples and twenty satin samples are employed for confirming the accuracy of wavelet algorithm. According to the experimental results, the proposed method for image processing in density inspection is possessed with higher accuracy and faster speed. Meanwhile, it is suitable for three elementary weaves with the solid color and other mixed color weaves. However, disadvantage of this method is that the density of fabric with complex organizational structure is not inspected precisely. The next target in this study is to improve the implementation of proposed method and expand the range of application.
References
- Xu, Z.K.; Deng, Z.M.; Zhao, Y.; Chen, L.T.; Wu, X.Q. Measure of weaving density for woven fabric based on wavelets transformation. J. Wuhan Univ. Sci. Eng. 2006, 19(2), 30–33. [Google Scholar]
- Kang, T.J.; Kim, C.H.; Oh, K.W. Automatic recognition of fabric weave patterns by digital image analysis. Text. Res. J. 1999, 69(2), 77–83. [Google Scholar] [CrossRef] [Scilit]
- Kang, T.J.; Choi, S.H.; Kim, S.M.; Oh, K.W. Automatic structure analysis and objective evaluation of woven fabric using image analysis. Text. Res. J. 2001, 71(3), 261–270. [Google Scholar] [CrossRef] [Scilit]
- Lin, J.J. Applying a co-occurrence matrix to automatic inspection of weaving density for woven fabrics. Text. Res. J. 2002, 72(6), 486–490. [Google Scholar] [CrossRef] [Scilit]
- Xu, B. Identifying fabric structures with fast Fourier transform techniques. Text. Res. J. 1996, 66(8), 496–506. [Google Scholar] [CrossRef] [Scilit]
- Tun’ak, M.; Linka, A.; Volf, P. Automatic assessing and monitoring of weaving density. Fibers Polym. 2009, 10(6), 830–836. [Google Scholar] [CrossRef] [Scilit]
- Xu, Z.K.; Deng, Z.M.; Zhao, Y.; Chen, L.T. Research actuality on automatic measure method of fabric density. Prog. Text. Sci. Technol. 2006, 6, 3–5. [Google Scholar]
- Li, L.Q.; Huang, X.B. Woven fabric defect detection with features based on adaptive wavelets. J. Donghua Univ. Nat. Sci. 2001, 27(4), 82–87. [Google Scholar]
- Li, L.Q.; Huang, X.B. Recent studies on image-based automatic fabric inspection system. J. Donghua Univ. Nat. Sci. 2002, 28(2), 77–81. [Google Scholar]
- Zhao, X.M.; Dend, Z.M.; Ran, Y.T. The automatic detection technology of woven fabric density based on wavelet transform. Prog. Text. Sci. Technol. 2011, 5, 45–47. [Google Scholar]
- Liu, J.L.; Zuo, B.Q. The selection of wavelet base and confirmation of decomposition progression in fabric texture analysis. Silk 2008, 4, 37–39. [Google Scholar]
- Feng, Y.L.; Li, R.Q. Automatic measurement of weave count with wavelet transfer. J. Text. Res. 2001, 22(2), 30–31. [Google Scholar]
- Sun, S.L.; Ma, Z.Q.; Tang, W. Research on gray-level image binarization algorithms. Value Eng. 2010, 29(5), 142–143. [Google Scholar]
- Jiang, Y.Z.; Zhu, Y.H. Design of imitated camouflage based on palette analysis and error diffusion dither. Jisuanji Gongcheng Yu Yingyong (Computer Engineering and Applications) 2013, 49(4), 181–184. [Google Scholar]
- Zhang, H.Y.; Zhao, Y.G.; Dai, X.Y. Method and application of smoothing the gray image based on VB. J. Shandong Univ. Technol. Nat. Sci. 2003, 17(5), 4–7. [Google Scholar]



© 2015 Textile Bioengineering and Informatics Society. This article is an open access article distributed under the terms and conditions of the Creative Commons Attribution (CC BY) license (https://creativecommons.org/licenses/by/4.0/).