


Abstract
In terms of the prokaryotic expression system Escherichia coli, it is well-known that incubation temperature, OD600 value, isopropyl thiogalactoside concentration and time of induction are general factors which can directly affect the final protein’s expression. The traditional method for this optimization is to study these factors which may influence the protein expression separately, thus, the interactions between factors are ignored. Design of experiment is a time-saving and cost-effective methodology for increasing the productivity and improving the quality of a product. In order to verify if design of experiment is suitable for the optimization of a protein expression and also to reveal if there is any interaction between the factors that have a significant influence on the protein’s expression, the optimization of expression for the protein Bmlebocin3 was carried out using the design of experiment concept. Bmlebocin3 is an antimicrobial peptide in the silkworm, Bombyx mori. It has a unique precursor form which was suitable for this investigation. In this study, the Bmlebocin3 gene was cloned and expressed in Escherichia coli, and then this expression was optimized by design of experiment. The results revealed that through the use of design of experiment, in addition to quantifying the separate effects of the OD600 value and the time of induction, it demonstrated that, their interaction can significantly affect the expression of Bmlebocin3. Furthermore, the best condition for the Bmlebocin3’s expression was identified through fewer experiments. This proved that design of experiment can be used as an efficient way to optimize the protein expression.
1. Introduction
Heterologous expression of a protein is a necessary technology in molecular biology. It is widely used to obtain a protein in a large scale where it is difficult to isolate it directly from original organisms. Escherichia coli (Abbreviation used: E.coli, Escherichia coli; OD, optical density; DoE, design of experiment; LB, Luria-Bertani; IPTG, isopropyl ß-D-1-thiogalactoside; PCR, polymerase chain reaction; SDS-PAGE, sodium dodecyl sulfate polyacrylamide gel electrophoresis; PBS, phosphate-buffered saline.) (E.coli), yeast and various kinds of cells are available as the host for recombinant protein expressions [1,2,3]. No matter which expression system has been chosen, the optimization of the expression is essential after the target protein has been validly expressed.
Optimization is the procedure used to find the best condition for the target protein expression so that the maximum production can be obtained with the lowest cost in the shortest time. In terms of the prokaryotic expression system E.coli, many factors which have a potential influence on the protein’s expression are usually considered during optimization; these include, codon usage, copies and stability of the expression vector plasmids, structure and stability of mRNA, the growth condition of the host such as the pH of the culture medium, agitation, oxygenation, and the carbon source and so on [4,5]. In addition, it is verified that incubation temperature, the OD600 value when induction begins, the isopropyl thiogalactoside (IPTG) concentration and the time of induction can also directly affect the production of a recombinant protein’s expression, so they are general factors to be considered in the optimization. The traditional method for this optimization is to set each factor as a variable in turn whilst fixing the others, this means the factors are investigated one by one, and then are combined to define the best condition [6]. This can be both complicated and time-consuming. Furthermore and most importantly, by using this method, the effects of interactions between the factors ignored.
Design of Experiment (DoE) is a scientific approach to find a time-saving and cost-effective way to increase productivity and to improve product quality in the areas of physical, materials, social sciences and agricultural engineering [7,8,9,10,11]. It is an efficient method that can be used to change one or more process factors so that the corresponding yields and conclusions are determined. In this study, DoE was utilized to determine if it is suitable for the optimization of a recombinant protein expression and also to reveal if there is any interaction between factors having a significant influence on this expression. The protein chosen in this study was a precursor lebocin3, which is a kind of antimicrobial peptide (AMP) from silkworm [12]. Precursor lebocin3 is not a functional protein so it is very suitable for an investigation into the optimization of a recombinant protein expression. In this study, Bmlebocin3 precursor gene was cloned and expressed in E.coli strain BL21, and then DoE was implemented to optimize this expression.
2. Materials and Methods
2.1. Gene Cloning
The primers for the Bmlebocin3 precursor gene (GenBank accession no. AB003035) were designed as follows, forward primer, 5′- CATGCCATGGGCCAGAGGTTCATCCAGCCGACC-3′ and reverse primer, 5′- TTGCGGCCGCTTAATGATGATGATGATGATGTTCTTGGAAAATGTC-CCTCG -3′ (Invitrogen), NcoI and NotI restriction enzyme sites (in bold) were introduced to facilitate vector construction, the relative sequence of six His tag (underlined) was placed ahead of the stop codon for western blot analysis.
The template for the PCR reaction was the fat body cDNA of silkworms (Dazao) after injected induction by DH5a. The PCR reaction condition was as follows: preheating to 94°C for 5 min, 30 cycles of: denaturation at 94°C for 40 s, annealing at 55°C for 40 s, extension at 72°C for 60 s, and finally 72°C for 10 min. The PCR product was subcloned into pMD18-T simple vector (Takara) (pMD18/Bmlebocin3) and the nucleotide sequence of pMD18/Bmlebocin3 was determined by sequencing.
2.2. Vector Construction
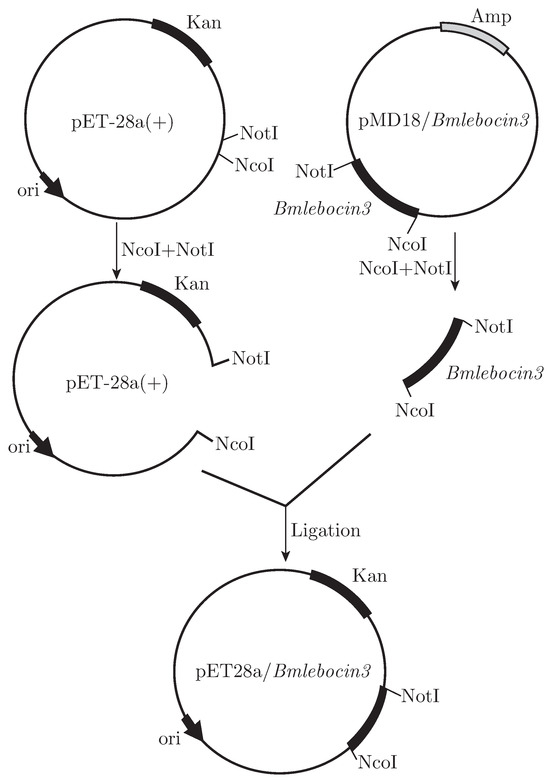
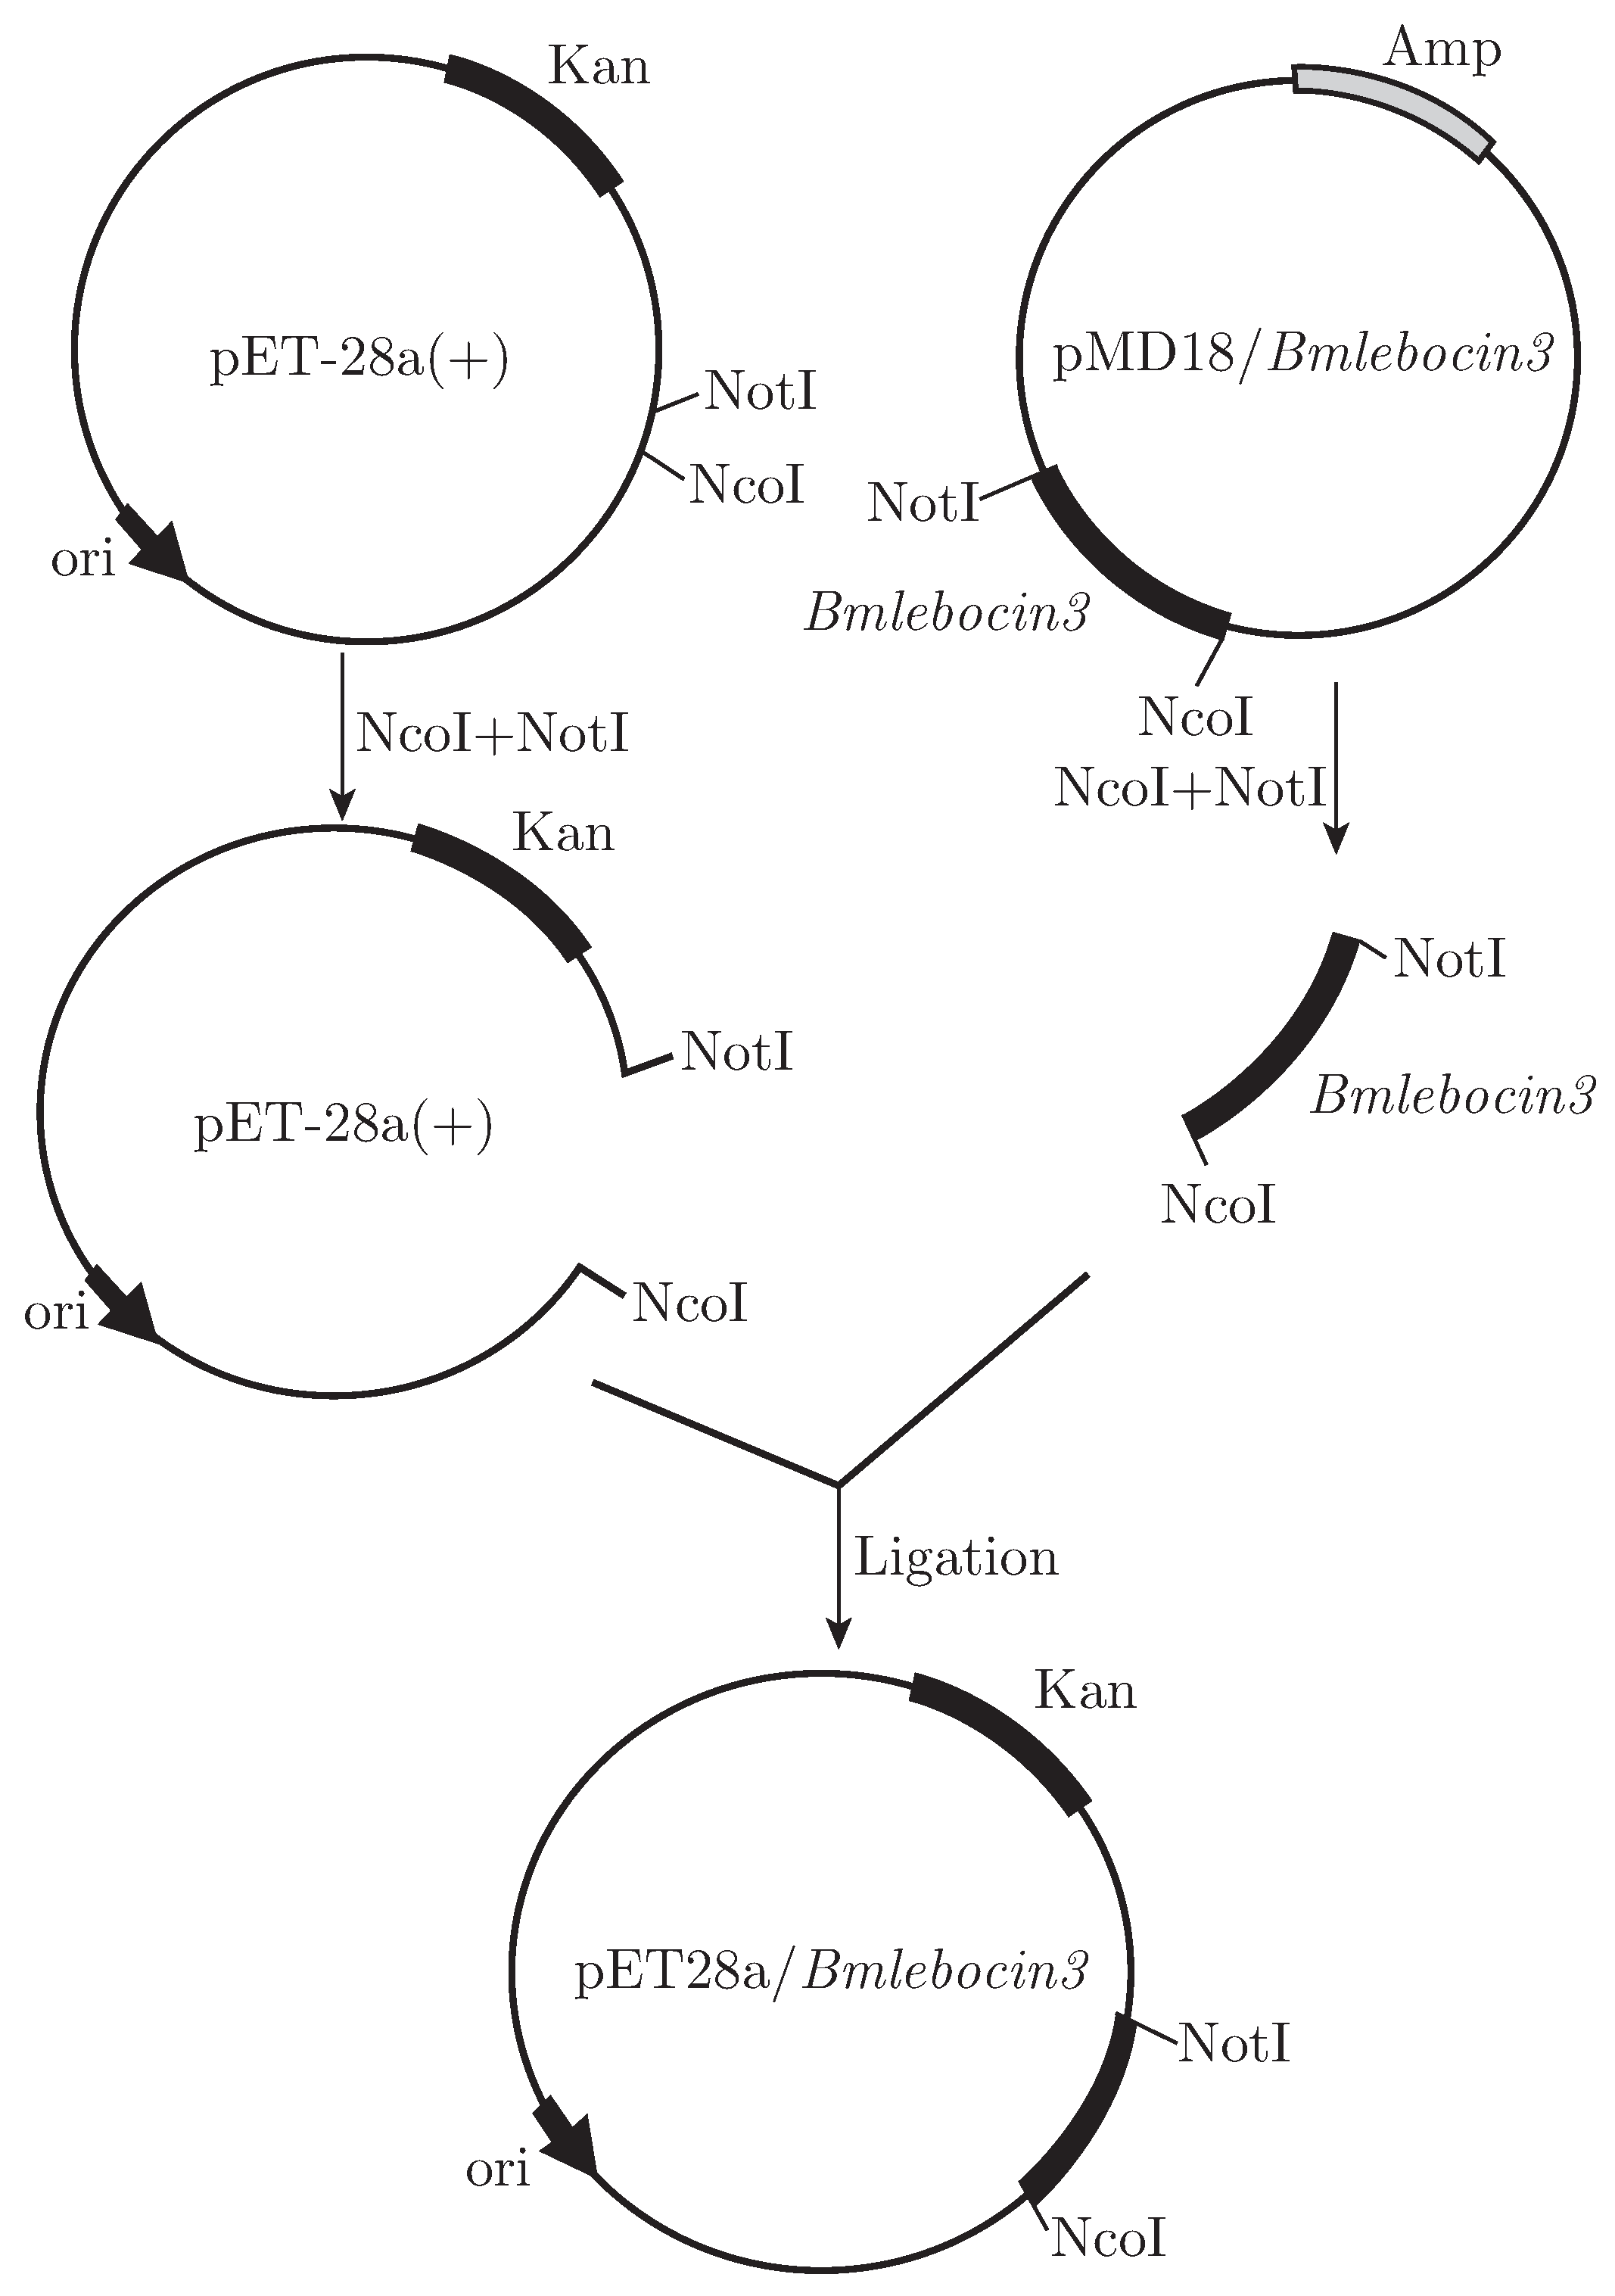
The prokaryotic expression vector pET-28a (+) (Novagen) and pMD18/Bmlebocin3 were digested by NcoI and NotI (Takara) simultaneously, and then the gene fragment and the linear vector were ligated (Fig. 1). The positive transformant (pET28a/Bmlebocin3) was identified after transformation.
Fig. 1.
Schematic representation of Bmlebocin3 expression vector’s construction.
2.3. Expression of Recombinant Plasmid pET28a/Bmlebocin3 in BL21
Plasmid DNA pET28a/Bmlebocin3 was transformed into BL21, then the transformant containing recombinant plasmid was inoculated in 3 ml LB. After the OD600 reached to approximately 0.5, 50 µl of culture was inoculated into the two individual 5 ml LB respectively and cultured to an OD600 of approximately 0.6, then IPTG was added to 1 mM one of the 5 ml LB culture to induce protein expression, and the other one was set as a negative control. After 4 hours’ induction, 1 ml of each culture was collected for further analysis.
All collected samples were centrifuged at 10000×g for 1 min at 4°C, the pellet was re-suspended in 500 µl lysis buffer and kept on ice for 20 min. The suspension was treated by ultrasonication on ice until the cells were completely disrupted. 40 µl of suspension after treatment was mixed with 10 µl 5× protein loading buffer. The mixture was heated immediately for 5 min at 100°C. 10 µl of each sample were separated by using 12% gel in SDS-PAGE.
The gel, after electrophoresis, was transferred onto a polyvinylidene difluoride (PVDF) membrane. Mouse anti-His antibody (GE Healthcare) was used to react with the His tag at the C-terminal of the recombinant protein according to the western blot protocol. All reagents were purchased from Sigma–Aldrich unless otherwise stated.
2.4. Optimization of Bmlebocin3’s Expression by DoE
In order to verify if DoE is suitable for the optimization of the recombinant protein expression and also to reveal if there was any interaction between factors having significant influence on this expression, the optimization of Bmlebocin3’s expression by was carried out using DoE.
Four experimental factors (A: Time of induction; B: OD600 value; C: IPTG concentration; D: Kanamycin concentration) with 2 levels (high and low) were considered at the same time to explore the effect on the expression percentage of the recombinant protein Bmlebocin3 (Table 1).
Table 1.
Table of design of experiments.
Sixteen combinations were designed, and the samples of the induction expression under designed conditions were collected and analyzed using SDS-PAGE. After staining, the band intensity of Bmlebocin3 was calculated using BandScan to get the relative percentage of the Bmlebocin3’s expression. The whole experiment was repeated once. Minitab 16 was used to perform a statistical analysis of the experimental results.
3. Results
3.1. Gene Cloning
After PCR amplification, around 500 base pairs (bp) of DNA fragment encoding precursor Bmlebocin3 was obtained by agarose gel electrophoresis. This PCR product was extracted from the gel and then ligated to the pMD18-T simple vector. Subsequent sequencing results indicated the nucleotide sequence of the cloned Bmlebocin3 gene was identical.
3.2. Vector Construction
pET-28a (+) was digested by restriction enzymes NcoI and NotI and then ligated to the Bmlebocin3 fragment after the same digestion from the recombinant plasmid pMD18/Bmlebocin3 (Fig. 1). The ligation product was transformed into DH5α competent cells. PCR was used to detect the insert, and sequencing results demonstrated that the clone was correct.
3.3. Expression of Recombinant Plasmid pET28a/Bmlebocin3 in BL21
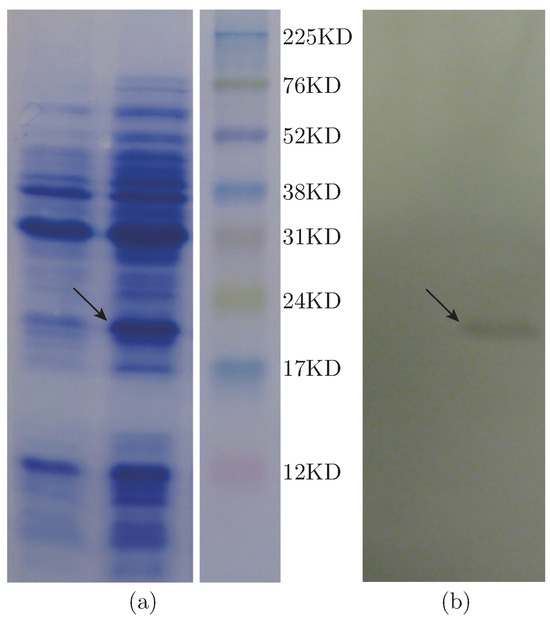
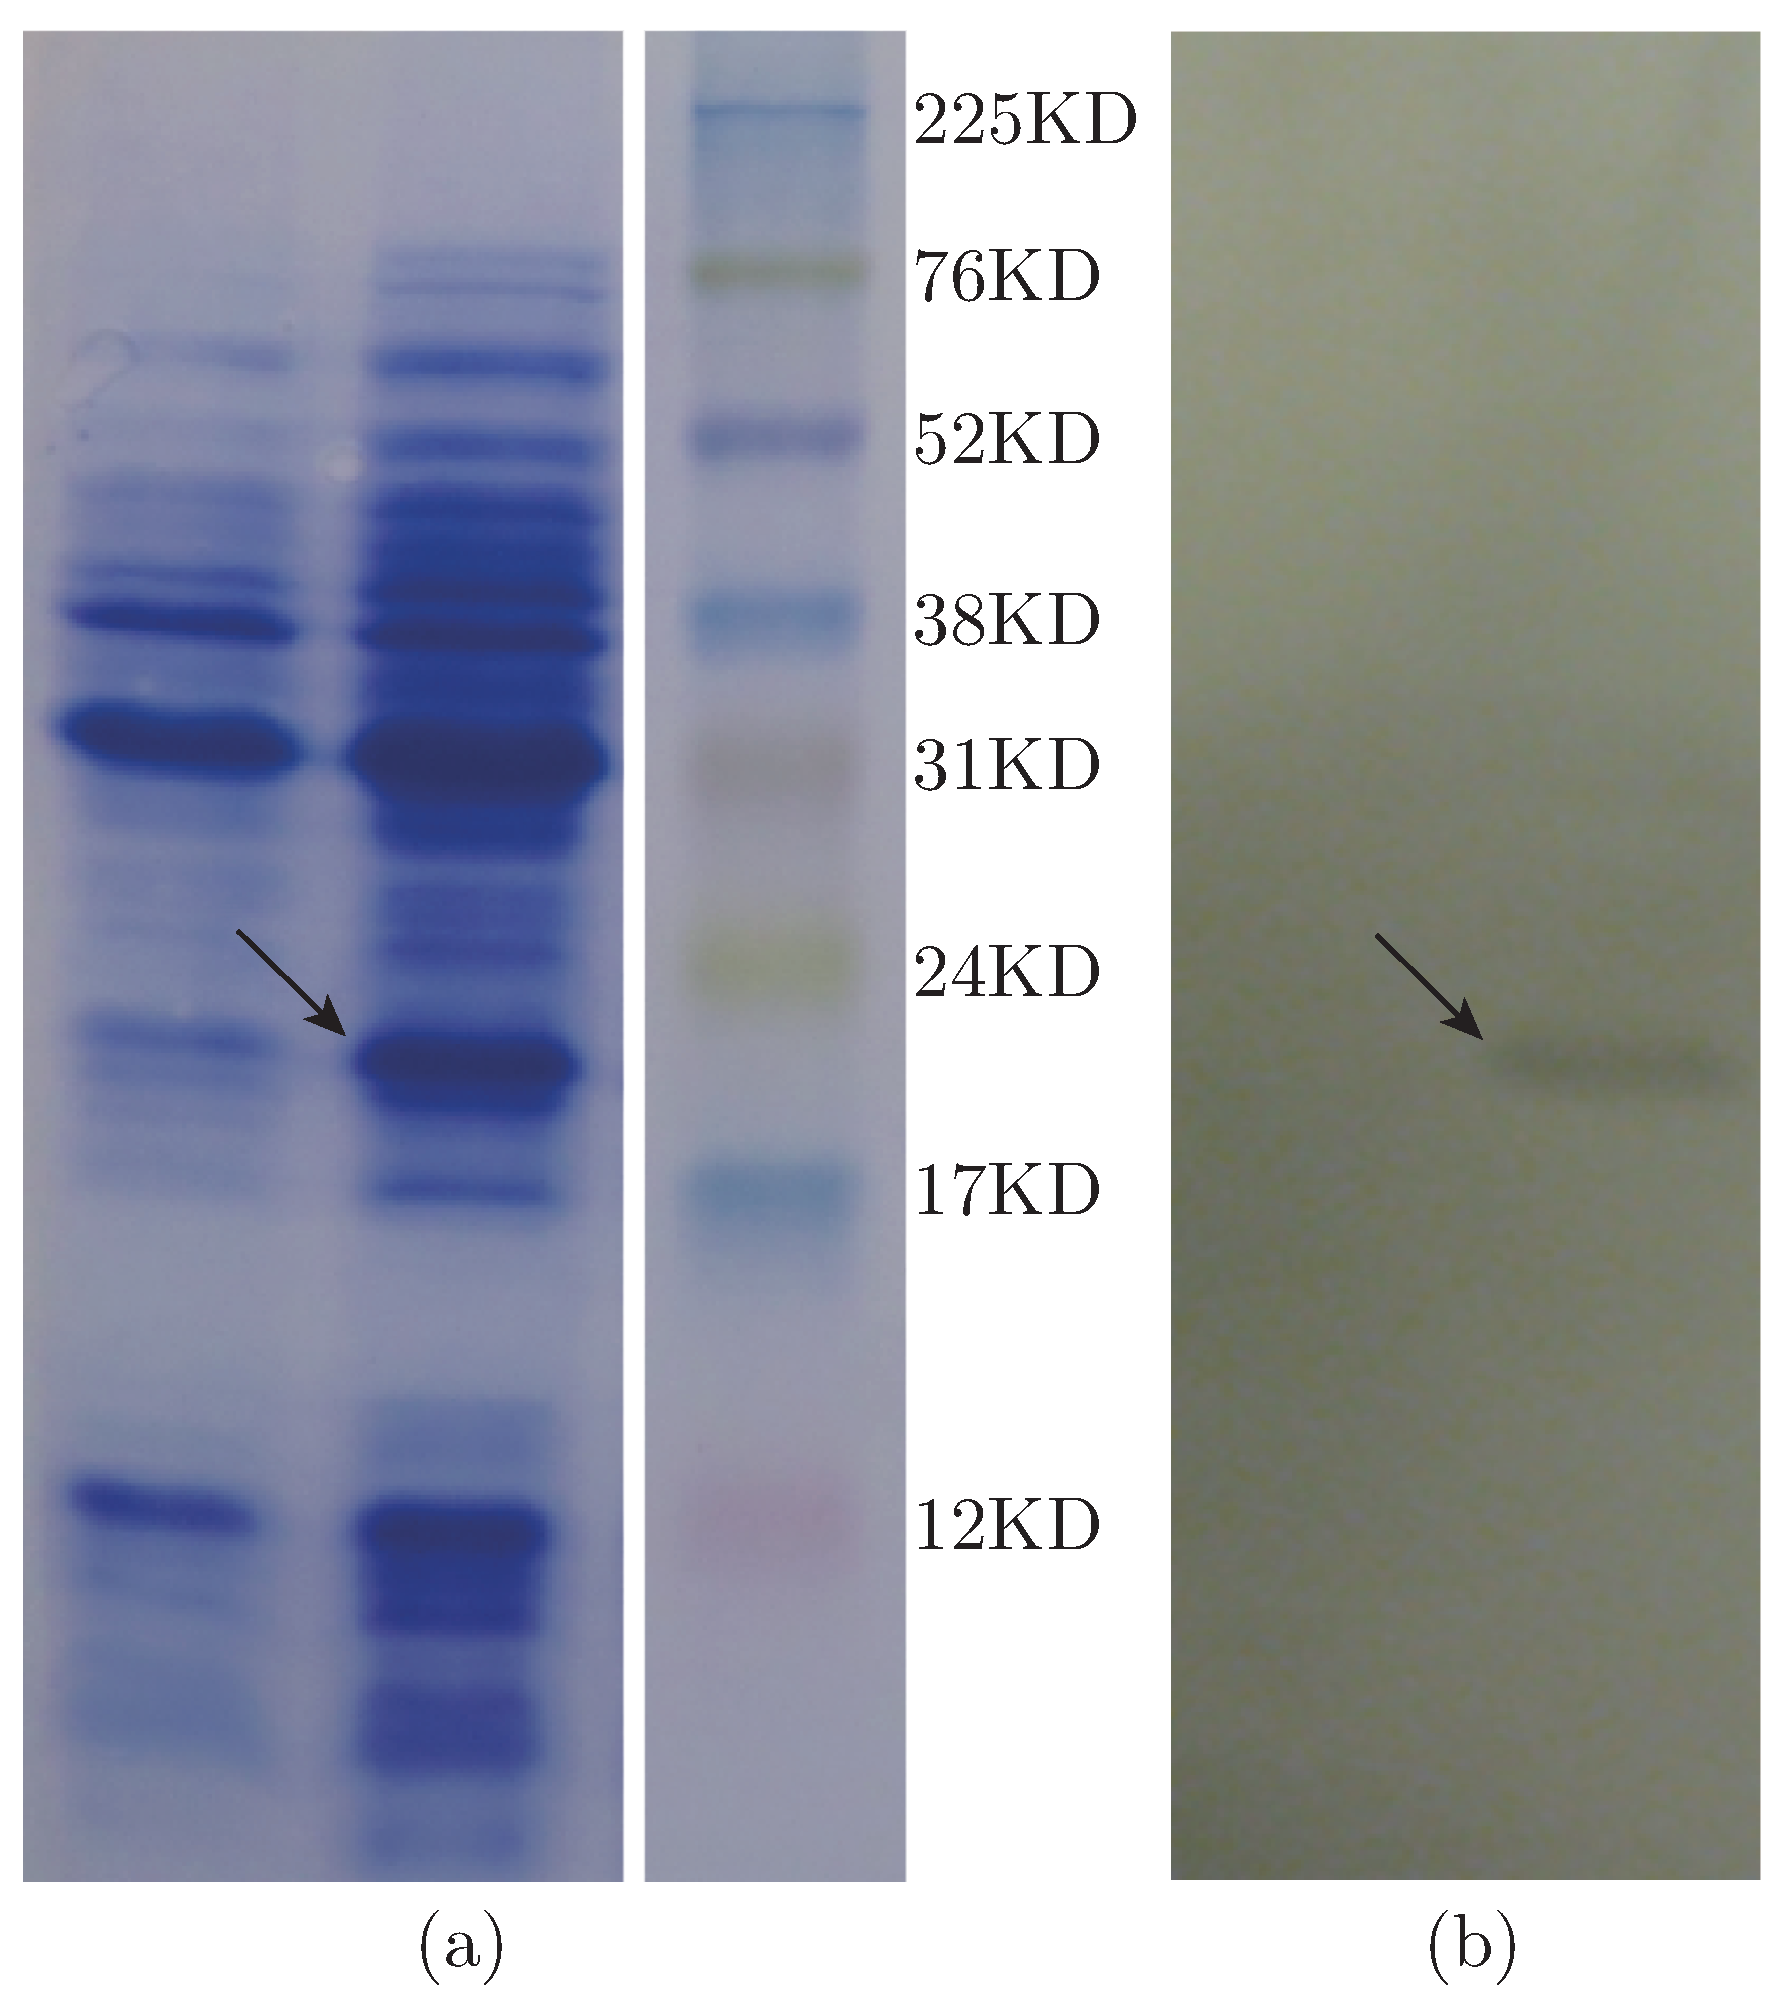
pET28a/Bmlebocin3 was transformed into the expression host BL21, and then standard concentration 1 mM IPTG was used to induce the Bmlebocin3’s expression. Total proteins of the sample and the negative control (uninduced sample) were separated by using SDS-PAGE. The electrophoresis result revealed a significant difference of the protein band between the sample and the negative control. The molecular mass of this unique band was around 20KD which is consistent with the deduced size of Bmlebocin3 (Fig. 2 (a)). It indicated that Bmlebocin3 was expressed in E.coli after induction. Further analysis of the western blot also demonstrated that Bmlebocin3 could be expressed in the prokaryotic expression system E.coli (Fig. 2 (b)).
Fig. 2.
SDS-PAGE (a) and western blot analysis (b) of the expression of Bmlebocin3 in E.coli. (a) Lane M, protein marker; lane 1, sample of pET28a/Bmlebocin3 without induction; lane 2, sample of pET28a/Bmlebocin3 with induction. (b) Lane 3, sample of pET28a/Bmlebocin3 without induction; lane 4, sample of pET28a/Bmlebocin3 with induction.
3.4. Optimization of Bmlebocin3’s Expression by DoE
According to the four listed factors (Table 1) which could have a possible effect on the Bmlebocin3’s expression, sixteen combinations were designed. In total, 32 experiments, including one repetition were conducted. The results presented in Table 2, were then analyzed using Minitab 16.
Table 2.
The production of Bmlebocin3 in the design of experiment.
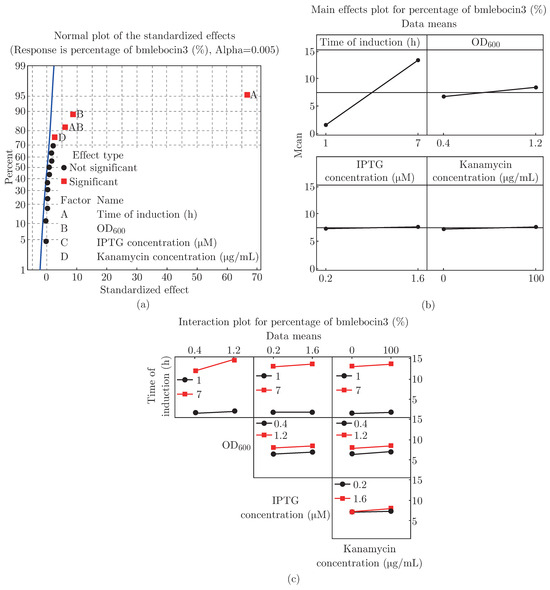
The normal probability plot (Fig. 3 (a)) shows the results and factors that had a significant impact on the production of Bmlebocin3. In total, three factors and one interaction had positive effects. Among these factors, A (time of induction) had the most significant impact on the output of Bmlebocin3. B (OD600 value) also had an obvious influence on the Bmlebocin3’s expression, and D (kanamycin concentration) had only a small positive effect (Fig. 3 (b)). With an increase in each of these three factors, the production of Bmlebocin3 was increased. In addition, there was another positive influence which was an interaction between A (time of induction) and B (OD600 value) which cannot be ignored (Fig. 3 (c)). This influence was smaller than the separate influences of factors A (time of induction) and B (OD600 value), but it was bigger than separate influence of factor D (kanamycin concentration).
Fig. 3.
Identification of the significant factors affecting the expression of Bmlebocin3. (a) Normal plot of the standardized effects for the expression percentage of Bmlebocin3; (b) Main effects plot (data means) for the expression percentage of Bmlebocin3; (c) Interaction plot for the expression percentage of Bmlebocin3.
3.4.1. Phase 0-Factor Screening Factorial Design
Fit a first-order model
According to the factorial fit table (Table 3), three factors, A (time of induction), B (OD600 separate influence) and D (kanamycin concentration), and an interaction between A and B with a P value < 0.5 had a significant effect. Also, the goodness of fit (R2) value of 99.65% and the goodness of predictability (Q2) value of 98.61% show this is a reliable model.
Table 3.
Estimated effects and coefficients for the expression of Bmlebocin3.
Derive a predictive equation
The time of induction and the OD600 value were the two factors which affected the percentage of recombinant Bmlebocin3 the most. Based on the factorial fit table, a predictive equation was derived as follows where x1 is the OD600 value and x2 is the time of induction:
Y = 7.47188 − 0.77187x1 + 5.93438x2
The contour plot shows that the percentage of Bmlebocin3 present amounted to approximately 14% when the condition of the time of the induction was 7 hours, the OD600 value was 0.75, the IPTG concentration was 1.6 mM and the antibiotic concentration was 100 µg/ml (data not shown). However, in order to achieve a percentage of recombinant Bmlebocin3 of about 25%, further steps must be taken.
3.4.2. Phase 1-Approaching Optimization/Steepest Ascent Method
Compute a path of steepest ascent
According to the predictive equation (1), the output will move along the path of steepest ascent if the point x1 and x2 are set to 0. Thus the path of steepest ascent passes through the point (x1 = 0, x2 = 0) and will have a slope of 5.93438/0.77187≈8.
Conduct experimental runs along the path
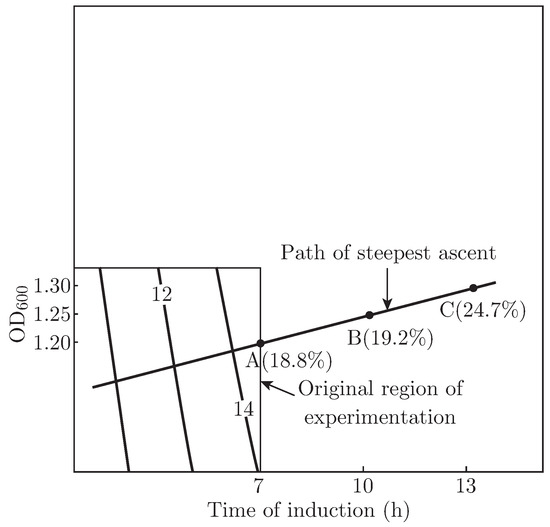
Using 3 hours’ time of induction as a basic step size, then the conclusion can be reached that, for each 3 hours’ increment, the OD600 value should change by 0.4/8 = 0.05 to ensure that the output continues to move along the path of steepest ascent. So, three points were defined to try to get an approximation of the maximum expression of Bmlebocin3 (Fig. 4):
Fig. 4.
Steepest ascent of experiment.
Point A (OD600 = 1.20, Time of induction=7 h)
Point B (OD600 = 1.25, Time of induction=10 h)
Point C (OD600 = 1.30, Time of induction=13 h)
Find the point which approximates to the maximum
The experiment showed that at all three points, 18.8%, 19.2% and 24.7% of recombinant Bmlebocin3 respectively was detected (Fig. 4). Point C corresponding to the condition (OD600= 1.30, Time of induction=13 h) gave data very close to the expected value, so, then a central composite design would be utilized to achieve the goal.
3.4.3. Phase 2-Optimization/Central Composite Design
Based on the previous experiments, the point closet to the desired target has been determined. In order to produce higher percentage of recombinant Bmlebocin3, central composite design was used.
12 experiments were performed, including four central points, and the results are shown in Table 4, which were analyzed using Minitab 16.
Table 4.
The production of Bmlebocin3 in central composite design.
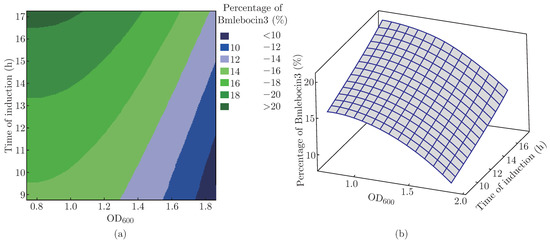
According to the analyzed results (data not shown), a second-order equation to predict Bmlebocin3 percentage response was derived where x1 represents the OD600 value and x2 represents the time of induction:
The graph (Fig. 5) shows the contour plot and the response surface for the percentage of recombinant Bmlebocin3 concluded by this model. It indicates that when the OD600 value exceeded 1.2, the production of Bmlebocin3 began to decrease irrespective of the length of the time of induction. However, when the OD600 value was between 0.8–1.2, prolonging the time of induction raised productivity. This also proves that the interaction between the OD600 value and the time of induction was significantly associated with the expression of Bmlebocin3.
Fig. 5.
Contour plot (a) and Surface Plot (b) of the percentage of Bmlebocin3 production vs the time of induction and the OD600 value.
To sum up, the optimization by DoE indicated that three factors including the OD600 value, the time of induction, the kanamycin concentration and the interaction between the OD600 value and the time of induction influenced the production of Bmlebocin3. Through this optimization, the best condition for the Bmlebocin3’s expression could be identified through fewer experiments, and this optimization enabled the final production of Bmlebocin3 to be increased to more than 20%, compared to only around 15% production using standard protocol before optimization. This proves that DoE can be used as an efficient tool for optimizing different recombinant protein’s expression in molecular biology.
4. Discussion
Although the prokaryotic expression system lacks the necessary post-transcriptional modification mechanism, E.coli remains a powerful system for the expression of heterologous protein since it possesses the merits of high production, lower cost and easy culturing [13,14]. However, due to the difference in origin, the sequence itself, the function and the process of translation and folding, the production of each recombinant protein apparently varies. Therefore, careful optimization plays a vital role in this expression because of its potential for enhancement of production of the target protein.
Some factors can be optimized before induction, such as codon usage, double colony selection and well-prepared starting culture [15]. However, temperature, OD600 value, IPTG concentration and time of induction are other factors which must also be considered.
The general temperature for prokaryotic expression is 37°C, however, lowering it will increase the solubility of some proteins [16]. The other advantage of lowering the temperature is that it reduces the degradation by proteinases for some recombinant proteins with a protein mass of less than 10 KD. However hardly researches revealed that the temperature have a significant influence on the production of recombinant protein with a mass of more than 20 KD, this is the main reason why we did not choose the temperature in our DoE investigation.
0.5 to 1.0 mM IPTG is suitable for the induction of most proteins. Occasionally, a lower IPTG concentration can have certain negative effects on some recombinant protein expressions [6], while higher concentrations make the plasmid’s stability and cell growth decline and this may affect the final protein production [17,18]. In this study, no significant influence of the IPTG concentration on Bmlebocin3’s expression was observed even at lower (below 0.5 mM) or higher (above 1.0 mM) IPTG concentrations (Fig. 3 (b)). 0.2 mM IPTG was enough for the expression of Bmlebocin3 under the all conditions. However, in order to lower the production cost, it is still very important to find out the lowest IPTG concentration necessary to maximize protein expression. Actually, this is essential for large scale protein expression in industry since the use of oversaturated IPTG is a waste of money [19].
The lack of a selective antibiotic in the expression system slightly decreases the stability of the plasmid especially after 6 hours’ induction. In such a situation, the host cells lacking plasmid can rapidly grow in the culture without a pertinent antibiotic, which may eventually reduce the productivity of the target protein [17,20]. Small effects caused by the change in kanamycin concentration was detected in the Bmlebocin3’s expression (Fig. 3 (b)), which verified that the appropriate antibiotic in the E.coli expression system can mildly improve the expression of the recombinant protein.
It is well-known that the OD600 value at the beginning of induction has an obvious impact on the production of most recombinant proteins. The OD600 value for traditional induction is 0.6 when the cells are in the best condition for growth, however, some high-cell-density bacterial expression methods have been developed, in which, the production of protein can be raised several times [15,21]. For the Bmlebocin3’s expression, the influence brought about by the OD600 value was quite clear (Fig. 3 (b)), however, any increase in the OD600 value above 1.2 did not result in a higher final yield possibly because of the negative effects of the declined oxygen level and pH as well as the increase of proteases in the culture (Fig. 5) [4,22].
The time of induction is a factor which clearly has to be taken into consideration in almost all optimizations of protein expressions. Incubation for three hours can make most recombinant proteins detectable. Extending the time of induction does not always lead to high yields of target protein because the longer times of induction also cause unfavorable effects on cell growth. In this work, the production of Bmlebocin3 increased slowly after 10 hours’ induction until it reached a maximum at 16.5 hours approximately (Fig. 3 (b) and Fig. 5).
It is worth noting that not only can the two factors, the OD600 value and the time of induction, separately affect the production of Bmlebocin3, but also their interaction can have significant influence, which is a factor which has never been considered in other optimizations of protein expressions. Therefore, simply investigating the optimization of a protein expression using a ‘one factor at a time’ method is not reasonable for all recombinant proteins. Contrastingly, DoE has been shown to provide an easy and fast way for optimizations through the use of a limited number of experiments, which also highlights potential interactions of the factors.
5. Conclusions
DoE was applied to optimize the expression of Bmlebocin3, and it identified three out of the four chosen factors, including the time of induction, the OD600 value and the kanamycin concentration, that significantly influenced this expression. Furthermore, the interaction between the OD600 value and the time of induction was shown to have a significant effect. Through this optimization, most importantly, the best condition for Bmlebocin3’s expression was discovered, which efficiently improved the production of recombinant Bmlebocin3. This verified that DoE is an efficient and scientific method that can be used for the optimization of recombinant proteins’ expression.
Acknowledgments
We would like to thank the Hong Kong Innovation Technology Commission and Hong Kong Research Institute of Textiles and Apparel for providing funding support to this research through project ITP/001/07TP, ITP/031/08TP, the Hong Kong Research Grant Council and the Hong Kong Polytechnic University through project PolyU5242/09E, G-YX1M, J-BB6Q and GU942. Also, we would like to thank the support of Guangdong Provincial Department of Science and Technology through the Guangdong-Hong Kong International Textile Bioengineering Joint Research Center with project code 2011B050300023, as well as the sponsorship from Hong Kong Jockey Club Sports Medicine and Health Science Center.
References
- Lu, W.; Cao, P.; Lei, H.; Zhang, S. High-level expression and purification of heparin-binding epidermal growth factor (HB-EGF) with SUMO fusion. Mol. Biotechnol. 2010, 44, 198–203. [Google Scholar]
- Vu, T. T.; Quyen, D. T.; Dao, T. T.; Nguyen Sle, T. Cloning, high-level expression, purification, and properties of a novel endo-beta-1, 4-mannanase from Bacillus subtilis G1 in Pichia pastoris. J. Microbiol. Biotechnol. 2012, 22, 331–338. [Google Scholar] [CrossRef] [Scilit]
- Palomares, L. A.; Mena, J. A.; Ramirez, O. T. Simultaneous expression of recombinant proteins in the insect cell-baculovirus system: Production of virus-like particles. Methods 2012, 56, 389–395. [Google Scholar]
- Jana, S.; Deb, J. K. Strategies for efficient production of heterologous proteins in Escherichia coli. Appl. Microbiol. Biotechnol. 2005, 67, 289–298. [Google Scholar]
- Jasniewski, J.; Cailliez-Grimal, C.; Gelhaye, E.; Revol-Junelles, A. M. Optimization of the production and purification processes of carnobacteriocins Cbn BM1 and Cbn B2 from Carnobacterium maltaromaticum CP5 by heterologous expression in Escherichia coli. J. Microbiol. Meth. 2008, 73, 41–48. [Google Scholar] [CrossRef] [Scilit]
- Tabatabaee; Siadat, S. D.; Moosavi, S. F.; Aghasadeghi, M. R.; Memarnejadian, A.; Pouriayevali, M. H.; Yavari, N. Overexpression and purification of c-terminal fragment of the passenger domain of hap protein from nontypeable haemophilus influenzae in a highly optimized escherichia coli expression system. Avicenna J. Med. Biotechnol. 2013, 5, 176–185. [Google Scholar]
- Brock, D.; Zeitler, J. A.; Funke, A.; Knop, K.; Kleinebudde, P. Evaluation of critical process parameters for intra-tablet coating uniformity using terahertz pulsed imaging. Eur. J. Pharm. Biopharma. 2013. [Google Scholar] [CrossRef] [Scilit]
- Vink, T.; Oudshoorn-Dickmann, M.; Roza, M.; Reitsma, J. J.; de Jong, R. N. A simple, robust and highly efficient transient expression system for producing antibodies. Methods 2013. [Google Scholar] [CrossRef] [Scilit]
- Zhang, M.; Miesegaes, G. R.; Lee, M.; Coleman, D.; Yang, B.; Trexler-Schmidt, M.; Norling, L.; Lester, P.; Brorson, K. A.; Chen, Q. Quality by design approach for viral clearance by protein A chromatography. Biotechnol. Bioeng. 2013. [Google Scholar] [CrossRef] [Scilit]
- Zhao, Z.; Li, Y.; Chen, A. Z.; Zheng, Z. J.; Hu, J. Y.; Li, J. S.; Li, G. Generation of silk fibroin nanoparticles via solution-enhanced dispersion by supercritical CO2. Ind. Eng. Chem. Res. 2013, 52, 3752–3761. [Google Scholar] [CrossRef] [Scilit]
- Li, G.; Li, Y.; Lan, P.; He, X.; Hu, H. Polydioxanone weft-knitted intestinal stents: Fabrication and mechanics optimization. Text. Res. J. 2013. [Google Scholar] [CrossRef] [Scilit]
- Hara, S.; Yamakawa, M. A novel antibacterial peptide family isolated from the silkworm, Bombyx mori. Biochem. J. 1995, 310, 651–656. [Google Scholar] [CrossRef] [Scilit]
- Swartz, J. R. Advances in Escherichia coli production of therapeutic proteins. Curr. Opin. Biotechnol. 2001, 12, 195–201. [Google Scholar]
- Peti, W.; Page, R. Strategies to maximize heterologous protein expression in Escherichia coli with minimal cost. Protein Expr. Purif. 2007, 51, 1–10. [Google Scholar]
- Sivashanmugam; Murray, V.; Cui, C. X.; Zhang, Y. H.; Wang, J. J.; Li, Q. Q. Practical protocols for production of very high yields of recombinant proteins using Escherichia coli. Protein Sci. 2009, 18, 936–948. [Google Scholar] [CrossRef] [Scilit]
- Pacheco; Crombet, L.; Loppnau, P.; Cossar, D. A screening strategy for heterologous protein expression in Escherichia coli with the highest return of investment. Protein Expr. Purif. 2012, 81, 33–41. [Google Scholar]
- Xu, J.; Li, W.; Wu, J.; Zhang, Y.; Zhu, Z.; Liu, J.; Hu, Z. Stability of plasmid and expression of a recombinant gonadotropin-releasing hormone (GnRH) vaccine in Escherichia coli. Appl. Microbiol. Biotechnol. 2006, 73, 780–788. [Google Scholar]
- Pan, H. F.; Xie, Z. P.; Bao, W. N.; Zhang, J. G. Optimization of culture conditions to enhance cis-epoxysuccinate hydrolase production in Escherichia coli by response surface methodology. Biochem. Eng. J. 2008, 42, 133–138. [Google Scholar] [CrossRef] [Scilit]
- Malakar, P.; Venkatesh, K. V. Effect of substrate and IPTG concentrations on the burden to growth of Escherichia coli on glycerol due to the expression of Lac proteins. Appl. Microbiol. Biotechnol. 2012, 93, 2543–2549. [Google Scholar] [CrossRef] [Scilit]
- Einsfeldt, K.; Severo Junior, J. B.; Correa Argondizzo, A. P.; Medeiros, M. A.; Alves, T. L.; Almeida, R. V.; Larentis, A. L. Cloning and expression of protease ClpP from Streptococcus pneumoniae in Escherichia coli: Study of the influence of kanamycin and IPTG concentration on cell growth, recombinant protein production and plasmid stability. Vaccine 2011, 29, 7136–7143. [Google Scholar]
- Studier, F. W. Protein production by auto-induction in high-density shaking cultures. Protein Expr. Purif. 2005, 41, 207–234. [Google Scholar] [CrossRef] [Scilit]
- C. Structural Genomics; C. China Structural Genomics; C. Northeast Structural Genomics; Graslund, S.; Nordlund, P.; Weigelt, J.; Hallberg, B. M.; Bray, J.; Gileadi, O.; Knapp, S.; Oppermann, U.; Arrowsmith, C.; Hui, R.; Ming, J.; dhe-Paganon, S.; Park, H. W.; Savchenko, A.; Yee, A.; Edwards, A.; Vincentelli, R.; Cambillau, C.; Kim, R.; Kim, S. H.; Rao, Z.; Shi, Y.; Terwilliger, T. C.; Kim, C. Y.; Hung, L. W.; Waldo, G. S.; Peleg, Y.; Albeck, S.; Unger, T.; Dym, O.; Prilusky, J.; Sussman, J. L.; Stevens, R. C.; Lesley, S. A.; Wilson, I. A.; Joachimiak, A.; Collart, F.; Dementieva, I.; Donnelly, M. I.; Eschenfeldt, W. H.; Kim, Y.; Stols, L.; Wu, R.; Zhou, M.; Burley, S. K.; Emtage, J. S.; Sauder, J. M.; Thompson, D.; Bain, K.; Luz, J.; Gheyi, T.; Zhang, F.; Atwell, S.; Almo, S. C.; Bonanno, J. B.; Fiser, A.; Swaminathan, S.; Studier, F. W.; Chance, M. R.; Sali, A.; Acton, T. B.; Xiao, R.; Zhao, L.; Ma, L. C.; Hunt, J. F.; Tong, L.; Cunningham, K.; Inouye, M.; Anderson, S.; Janjua, H.; Shastry, R.; Ho, C. K.; Wang, D.; Wang, H.; Jiang, M.; Montelione, G. T.; Stuart, D. I.; Owens, R. J.; Daenke, S.; Schutz, A.; Heinemann, U.; Yokoyama, S.; Bussow, K.; Gunsalus, K. C. Protein production and purification. Nat. Methods 2008, 5, 135–146. [Google Scholar] [CrossRef] [Scilit]

© 2015 Textile Bioengineering and Informatics Society. This article is an open access article distributed under the terms and conditions of the Creative Commons Attribution (CC BY) license (https://creativecommons.org/licenses/by/4.0/).