


Abstract
The determination of curve generation rules for the body features is the lynchpin in the creation of computer generated three dimensional (3D) lower body human mannequins. In this paper, methods to determine the characteristic features of the curves, such as the waist curve, abdomen curve and hip curve were analyzed as a precursor to creating female lower body 3D mannequins. Methods to generate the profile curves for the different body features were devised by adding insertion points onto the curves. The relationships between the coordinates of the insertion points and body measurement data were analyzed using SPSS software and rules for the generation of curves for each of the featured parts were determined. Subsequently these were used to provide the basis for the creation of a female lower body 3D mannequin, which can be useful for the further development of clothing e-commerce. The modelling system was developed by automatically extracting anthropometric data from a noncontact 2D anthropometry system (photographs) and used to generate human models according to their different body features. The system can facilitate the interactive design of different fashion styles and the automatic generation of garment patterns.
1. Introduction
Associated with the evolution of the garment industry and the increasing demands by consumers for clothing that both fits well and is comfortable to wear, there has been a steady development in 3D garment CAD systems. The design and development of apparel through the use of intelligent, information-based, 3D CAD has become commonplace within the contemporary garment industry. The establishment of 3D garment mannequins provides the basis for the development of threedimensional CAD for garments. The methods used to create 3D garment mannequins determine the research direction for 3D garment CAD systems, the level of difficulty in their development and the integrity of the systems devised [1,2].
The human body is a complex free-form surface which requires adaptive modelling tools to be able to reconstruct the 3D body surface using measured data. Although three-dimensional drawing software can be used to create a model of the human body, this does not provide a convenient method to determine the key anthropometric data points for subsequent garment modelling. Furthermore it is also difficult to design and control the human-computer interaction interface to produce the three-dimensional CAD software [3,4].
Various methods have been used in the development of human modelling technology. These include wireframe, solid and surface models. Wireframe models have the advantage of a simple structure, require less data, lower computer hardware requirements and they compute rapidly. However they produce ambiguous data that is difficult to understand, give a poor sense of reality and cannot realize hidden line removal and shading. Solid models have the advantages of being unambiguous and are able to realize cross-sectional profile operation and hidden line removal, with control of localised features to achieve a high sense of reality and clearly defined textures. Despite this, it also has various disadvantages, such as a complex structure, making it difficult to realize surfaces, requiring a vast amount of data and a high specification of computer hardware and slow computational speed. Surface models produce high resolution and real surfaces, and they can achieve hidden line removal, and can control localised features to produce realistic images with clearly defined textures. However, to produce complex structures they require both a large amount of data and a high computer hardware specification and they also tend to compute at a slow speed [5,6,7,8,9].
3D garment CAD systems have been principally developed for: virtual sample manufacture (or tailor-made manufacture), remote clothing fitting (or virtual fitting and virtual shopping), merchandise planning, and quick response manufacturing. 3D modelling of the human body is the key element necessary for the development of these systems [10,11,12].
Nadia Magnenat-Thalmann has studied the problem and proposed solutions for the automatic modelling of animated virtual humans. Methods for capturing the shapes of real people and parameterization techniques for modelling static and dynamic shapes of virtual humans were classified, summarized, and compared. Finally, methods for creating clothed virtual humans were reviewed [13].
Many researchers have proposed methods for simulating human mannequins using 3D human body scanners based on 3D point cloud data. For example, Wu simulated a mannequin using scanner software [14] and Zhang provided a technical platform for the parameterized design of a female body model with different chest shapes [15]. However, few researchers have considered the simulation of human mannequins based on 2D photographs of humans.
In the present study, we aimed to automatically generate individual 3D human models based only on data extracted from front and side photographs, which can be processed rapidly with low costs. Moreover, such automatic generation of individual 3D human models can meet the individual needs of customers, provide technical support for personalized customization and electronic commerce, and satisfy the requirement for interactive design of products based on the use of 3D CAD.
In the research reported in this paper, reverse engineering software was used to conduct secondary development of the point cloud data, and the body features of the female lower body were studied to establish the rules for automatically generating female lower human models, which can be used to model an individual female’s lower body. Subsequently, a modelling system was developed to generate the anatomical features of human models from data automatically extracted from a non-contact 2D anthropometry system, to enable the interactive design of different fashion styles and the automatic generation of garment patterns for different body sizes.
The research methodology comprised the following 3 stages:
- (1)
- Anthropometry
In the first stage 3D body measurements, photo measurements and manual measurement methods were used to derive anthropometric data for young female students from Soochow University. Secondary development of 3D human point cloud data was performed to measure the width, thickness and girths of different parts of their anatomy using Imageware software.
- (2)
- Generate rules for the characteristic position curves
The second stage was to devise rules to generate the characteristic position curves for the waist, abdomen, hips, thighs, knees and calves. From the central point of each curve width, the extreme left and right points were determined, and the front and back points were determined according to the division rules for the front and back thickness. Then related points were inserted between these four base points, and the relationship between the inserted points and the base points was analyzed to generate the curves according to the human features.
- (3)
- 3D mannequin modelling
The final stage was to use OpenGL and Visual C# as the development software, to develop a 3D mannequin modelling system using anthropometric data for different body sizes automatically extracted from a non-contact 2D anthropometry system (photographs) which can then be used to generate human models of different body features to enable the interactive design of different fashion styles and the automatic generation of garment patterns.
2. Anthropometry
300 Female students from Soochow University, aged between 18 and 24 years, and between 150 and 170 cm in height were selected as the main research participants. The students were selected at random from groups of students without any obvious physical abnormalities.
In this study, 2D front and side digital photographs were taken. These were subsequently processed using image processing software, such as Photoshop, to allow human measurements to be extracted using MATLAB.
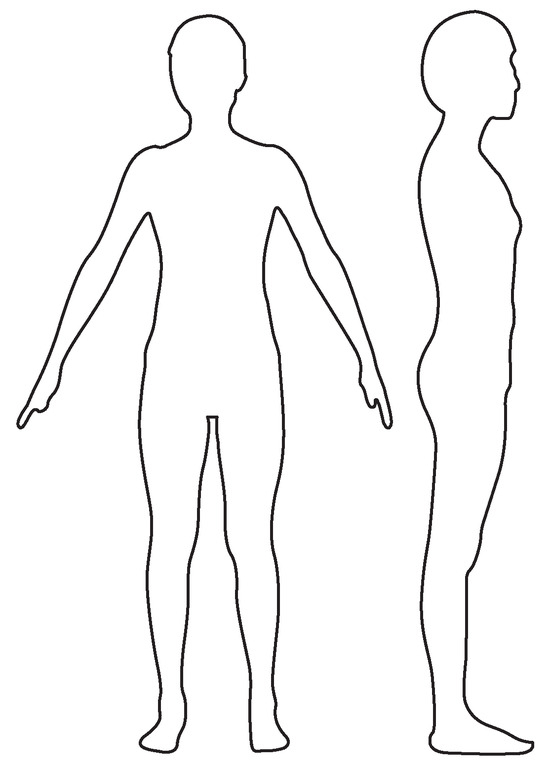
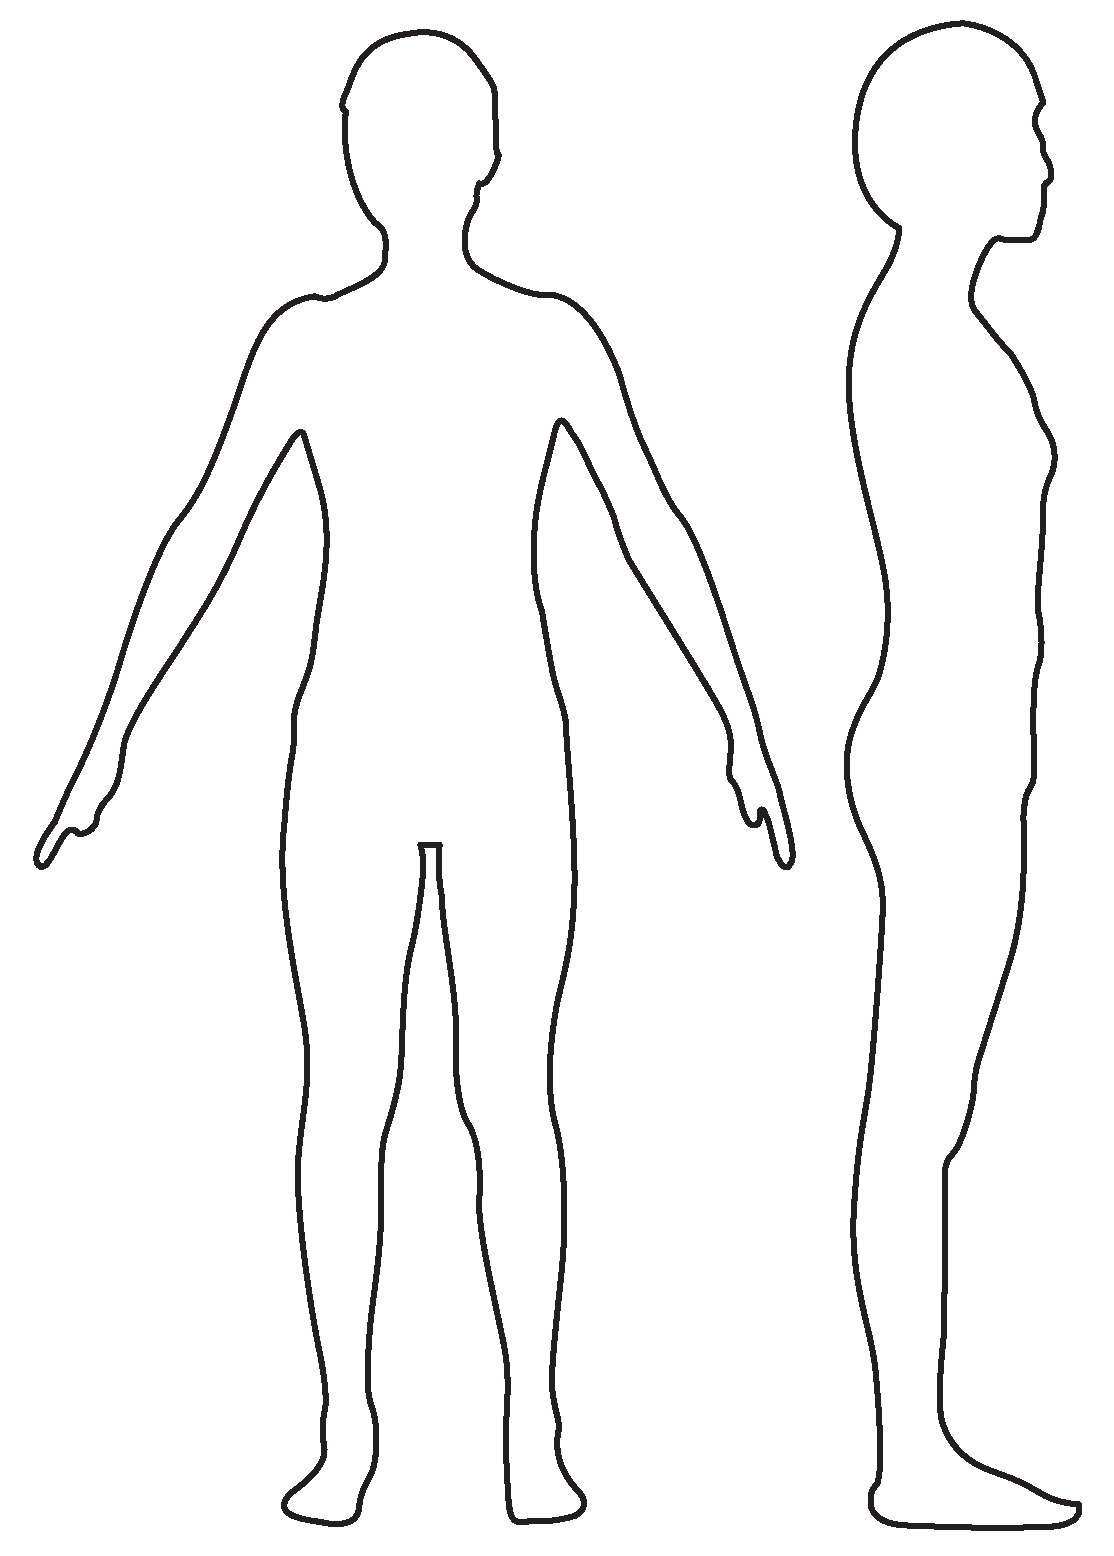
Body sizes were automatically collected from the front and side photographs by calling the M file based on MATLAB software. Figure 1, shows that the front and side silhouettes could be extracted precisely. Moreover, from the front and side silhouettes, it was possible to automatically extract the main dimensions, which included values of height, width and thickness to provide basic data for the auto-generation of mannequins corresponding to the main groups of human sizes. The extractable height values were body height, neck height, shoulder height, chest height, waist height, abdomen height, hip height, thigh height, knee height and calf height. The width values were neck width, chest width, waist width, hip width, abdomen width, thigh width, knee width, calf width, the width between bust points and the maximum back width. The thickness values were neck thickness, chest thickness, waist thickness, hip thickness, belt thickness, thigh thickness, knee thickness and calf thickness. Based on the ratios between the thickness and width values (ratio=thickness/width), a classification was done to establish the girth fitting formula for each position within each category using the procedures shown in Table 1 for the hips, as an example.
Figure 1.
Human body silhouettes.
Table 1.
Extraction methods for hip width and thickness.
3. Determination of the Various Body Feature Crosssectional Profiles
Based on the automatic extraction of the silhouettes and the sizes from the front and side photographs, it was possible to generate an individual female’s lower body 3D mannequin. However, to do this it was necessary to determine the curve generation rules for the different human body features. In this study, the featured curves comprised the waist curve, abdomen curve, hip curve, thigh curve, knee curve and calf curve for the respective cross-sectional profiles.
3.1. Determination of the Waist Cross-sectional Profile
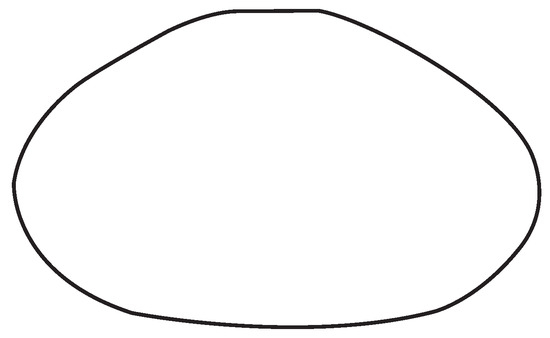
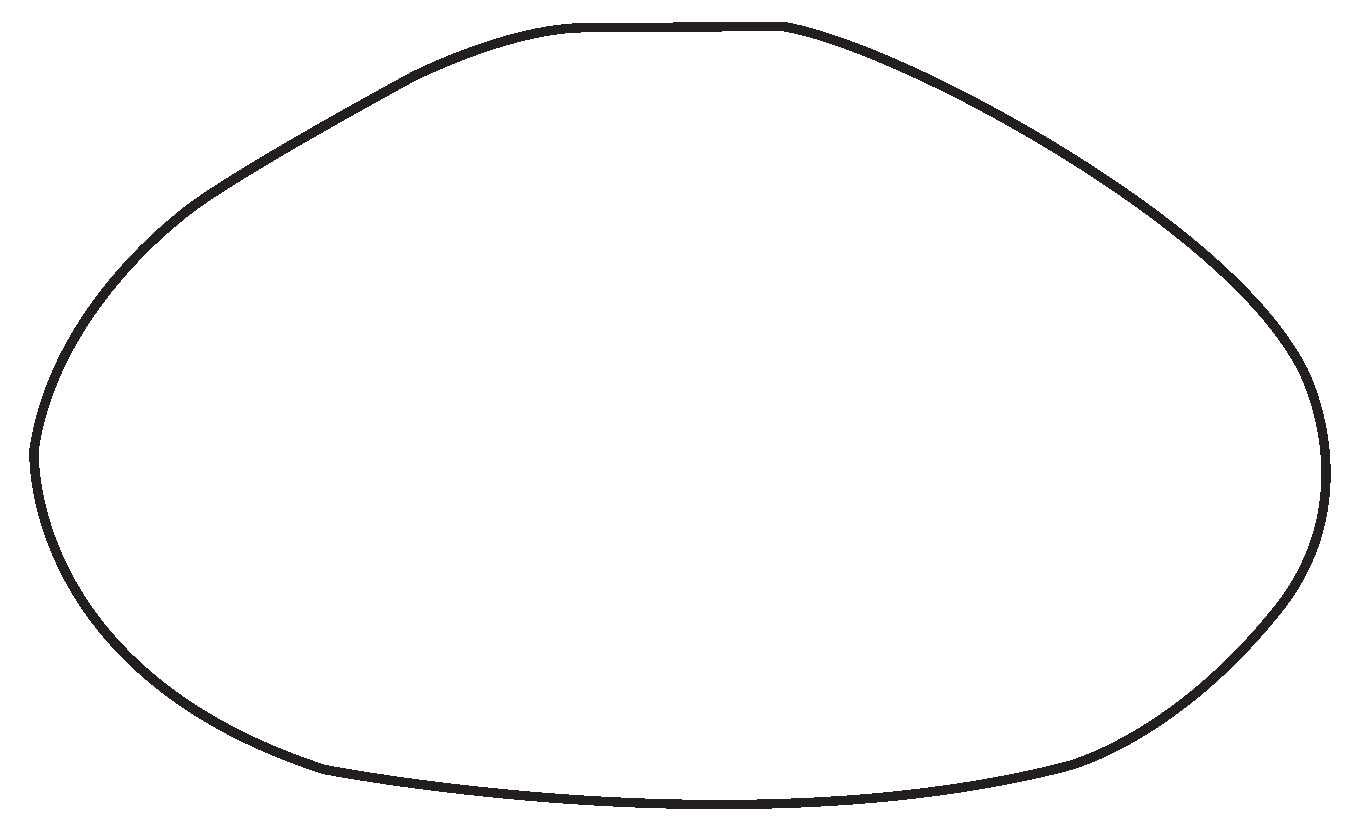
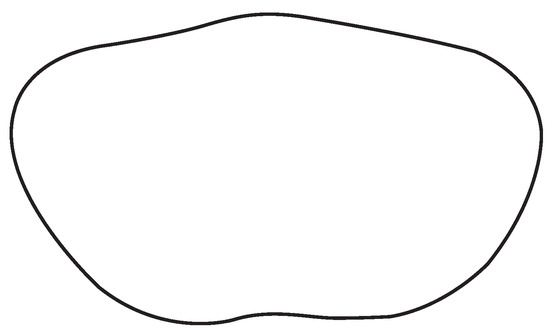
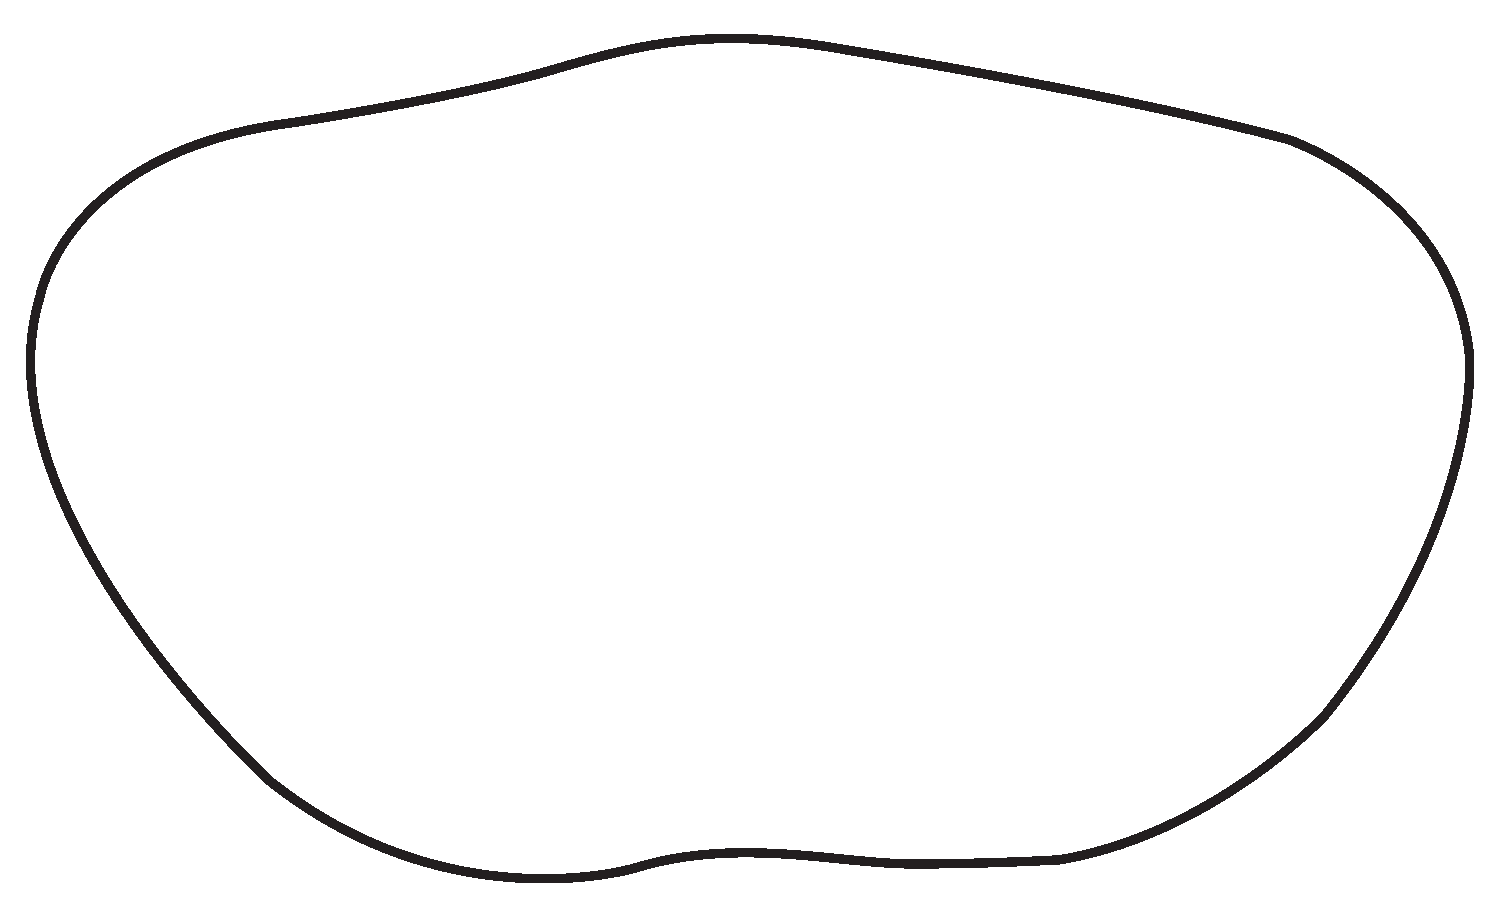
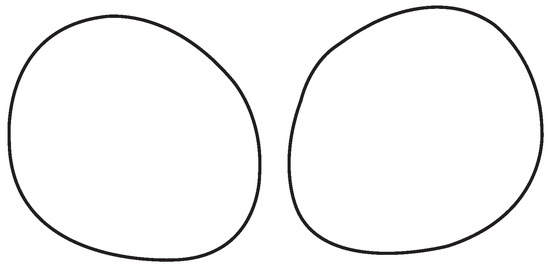
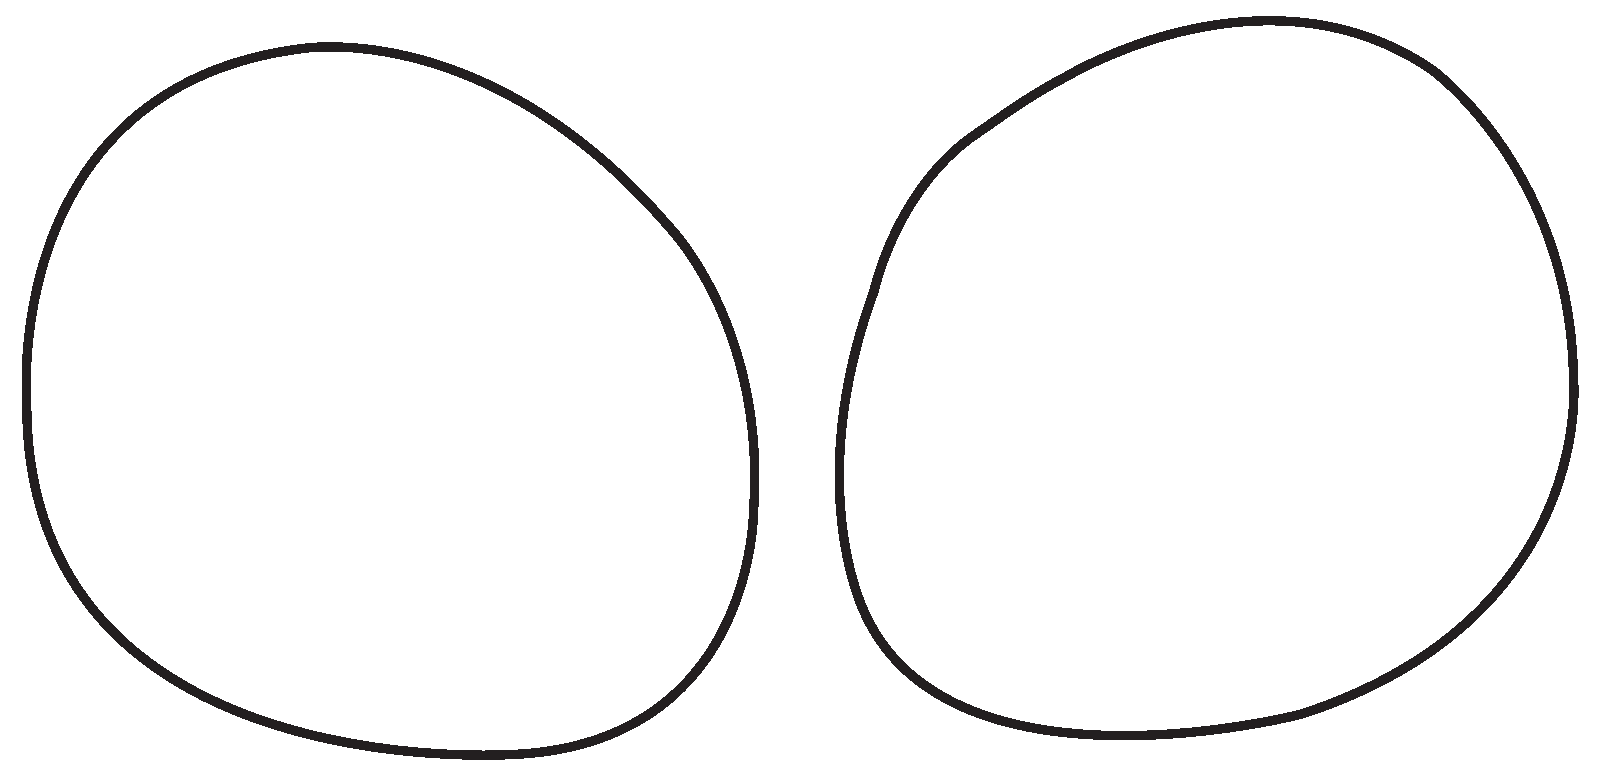
From the front view of the 3D human body point cloud diagram, shown in Figure 2, the waist cross-section was defined as the narrowest part of the torso. From the front view, the horizontal distance determined the width of the waist curve. From the side view, the perpendicular distance determined the thickness of the waist curve, shown in Figure 3. The waist cross-sectional profile is shown in Figure 4.
Figure 2.
Determination of waist curve width.
Figure 3.
Determination of waist curve thickness.
Figure 4.
Cross-section of waist.
3.2. Determination of Abdomen Cross-sectional Profile
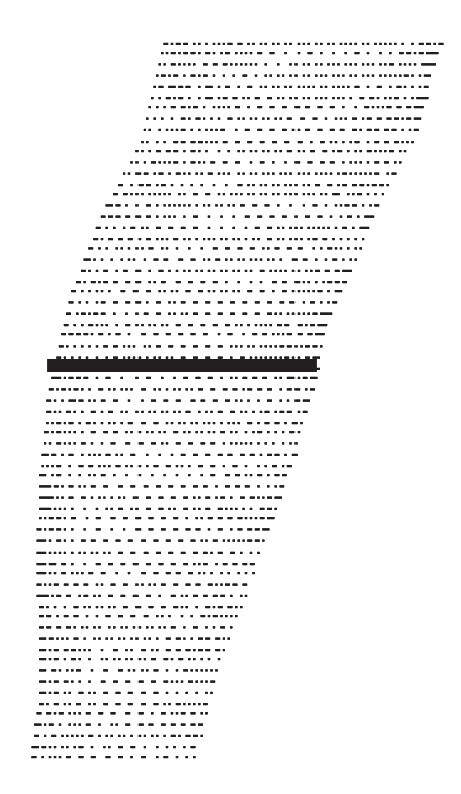
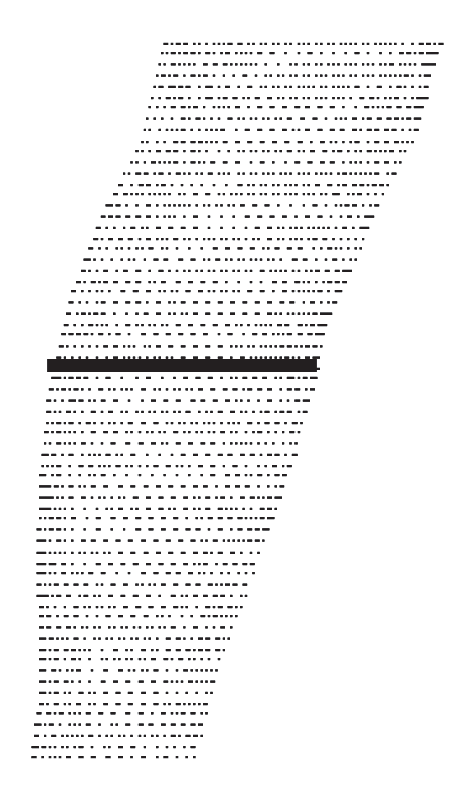
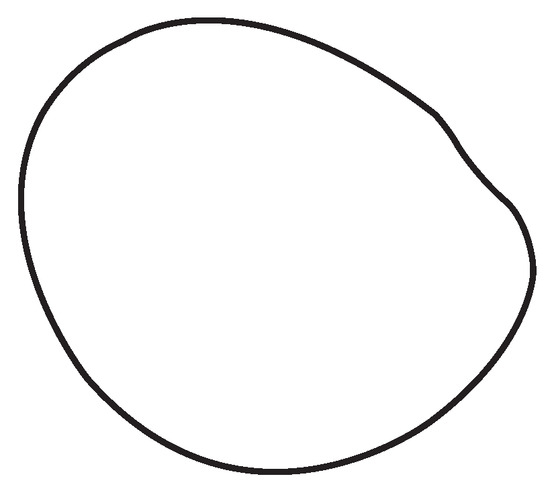
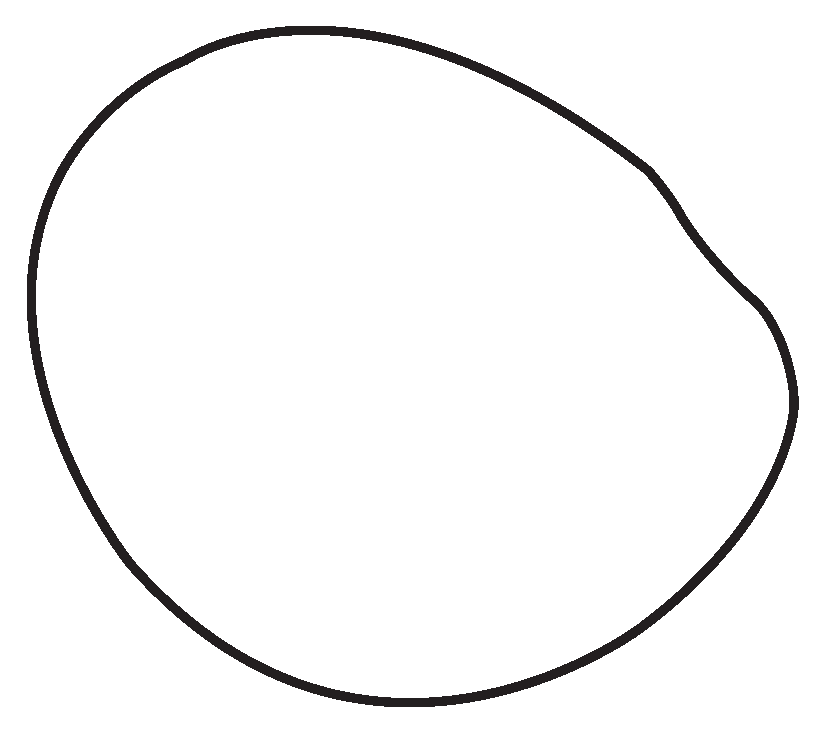
From the side view of the 3D human body point cloud diagram, the abdomen cross-section was defined through the maximum convex point on the abdomen. From the side view, shown in Figure 5, the perpendicular distance determined the thickness of the abdomen curve. From the front view, shown in Figure 6, the horizontal distance determined the width of the abdomen curve. The abdomen cross-sectional profile is shown in Figure 7.
Figure 5.
Determination of abdomen curve width.
Figure 6.
Determination of abdomen curve thickness.
Figure 7.
Cross-section of abdomen.
3.3. Determination of Hip Cross-sectional Profile
From the side view of the 3D human body point cloud diagram, the hip cross-section was defined through the hip maximum convex point. From the side view, shown in Figure 8, the perpendicular distance determined the thickness of hip curve. From the front view, shown in Figure 9, the horizontal distance determined the width of the hip curve. The hip cross-sectional profile is shown in Figure 10.
Figure 8.
Determination of hip curve width.
Figure 9.
Determination of hip curve thickness.
Figure 10.
Cross-section of hip.
3.4. Determination of Thigh Cross-sectional Profile
From the side view of the 3D human body point cloud diagram, the thigh cross-section was defined through the thigh maximum convex point. From the side view, the perpendicular distance determined the thickness of the thigh curve, as shown in Figure 11. From the front view, the horizontal distance determined the width of the thigh curve, as shown in Figure 12. The thigh cross sectional profile is shown in Figure 13.
Figure 11.
Determination of thigh curve width.
Figure 12.
Determination of thigh curve thickness.
Figure 13.
Cross-section of thigh.
3.5. Determination of Knee Cross-sectional Profile
From the side view of the 3D human body point cloud diagram, the knee cross-section was defined through the knee maximum convex point. From the side view, the perpendicular distance determined the thickness of the knee curve, as shown in Figure 14. From the front view, the horizontal distance determined the width of the knee curve, as shown in Figure 15. The knee cross sectional profile is shown in Figure 16.
Figure 14.
Determination of knee curve width.
Figure 15.
Determination of knee curve thickness.
Figure 16.
Cross-section of knee.
3.6. Determination of Calf Cross-sectional Profile
From the side view of the 3D human body point cloud diagram, the calf cross-section was defined through the calf maximum convex point. From the side view, the perpendicular distance determined the thickness of the calf curve which is shown in Figure 17. From the front view, the horizontal distance determined the width of the calf curve which is shown in Figure 18. The calf cross-sectional profile is shown in Figure 19.
Figure 17.
Determination of calf curve width.
Figure 18.
Determination of calf curve thickness.
Figure 19.
Cross-section of calf.
4. Curve Generation Methods
3D B-Spline curves were used to simulate the human body curves using IMAGEWARE software. In this study, some insertion points were added to the curves of the featured parts, and the relationship between the inserted points and the body dimensions were analyzed using correlation and regression analysis. The cross sectional profile generation of the waist is chosen as an example to explain the method used for the curve generation.
The procedure for generating the cross sectional profile curve was as follows:
- A.
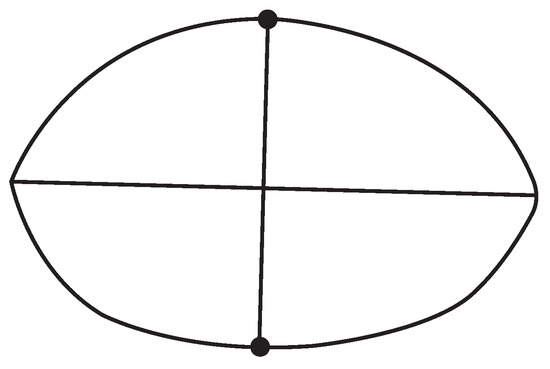
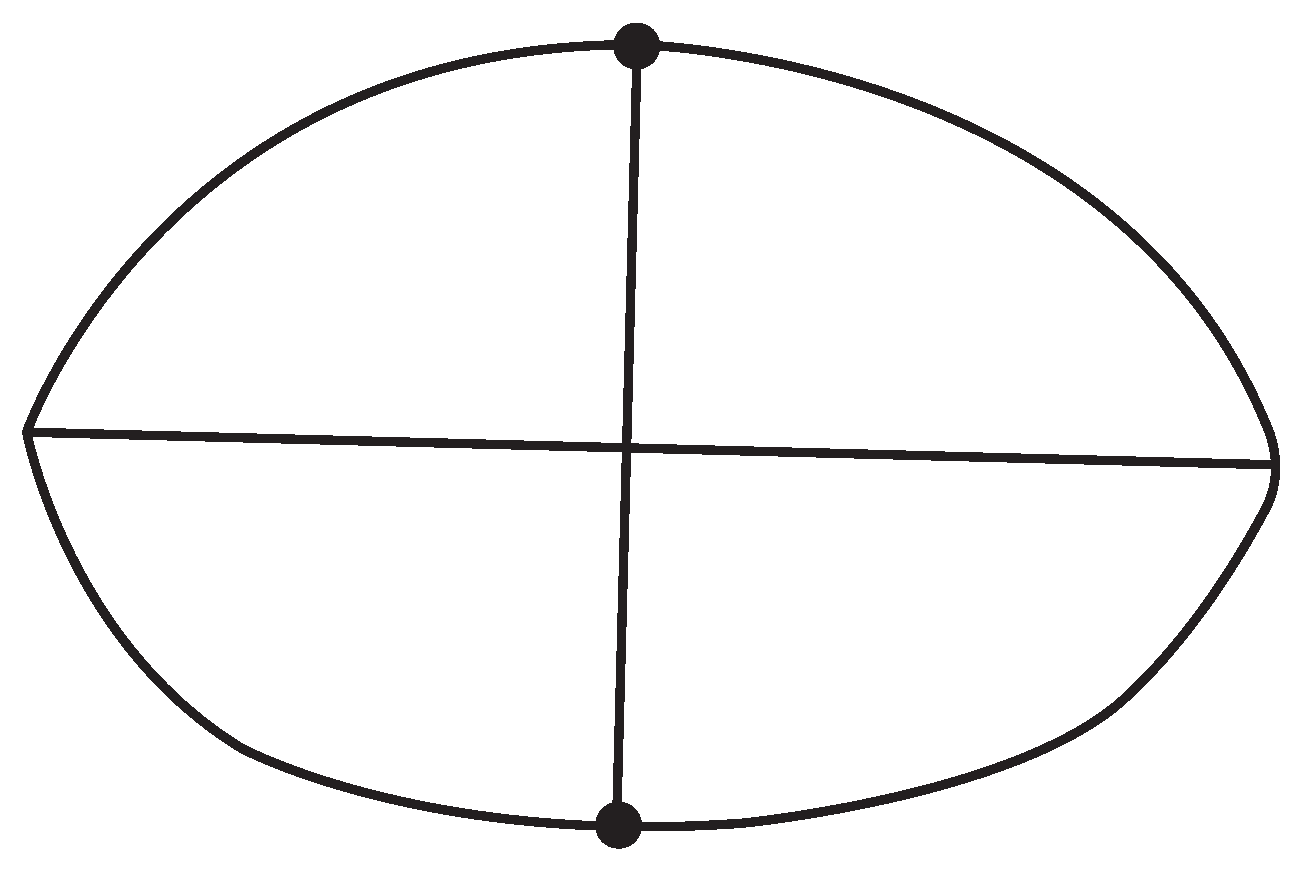
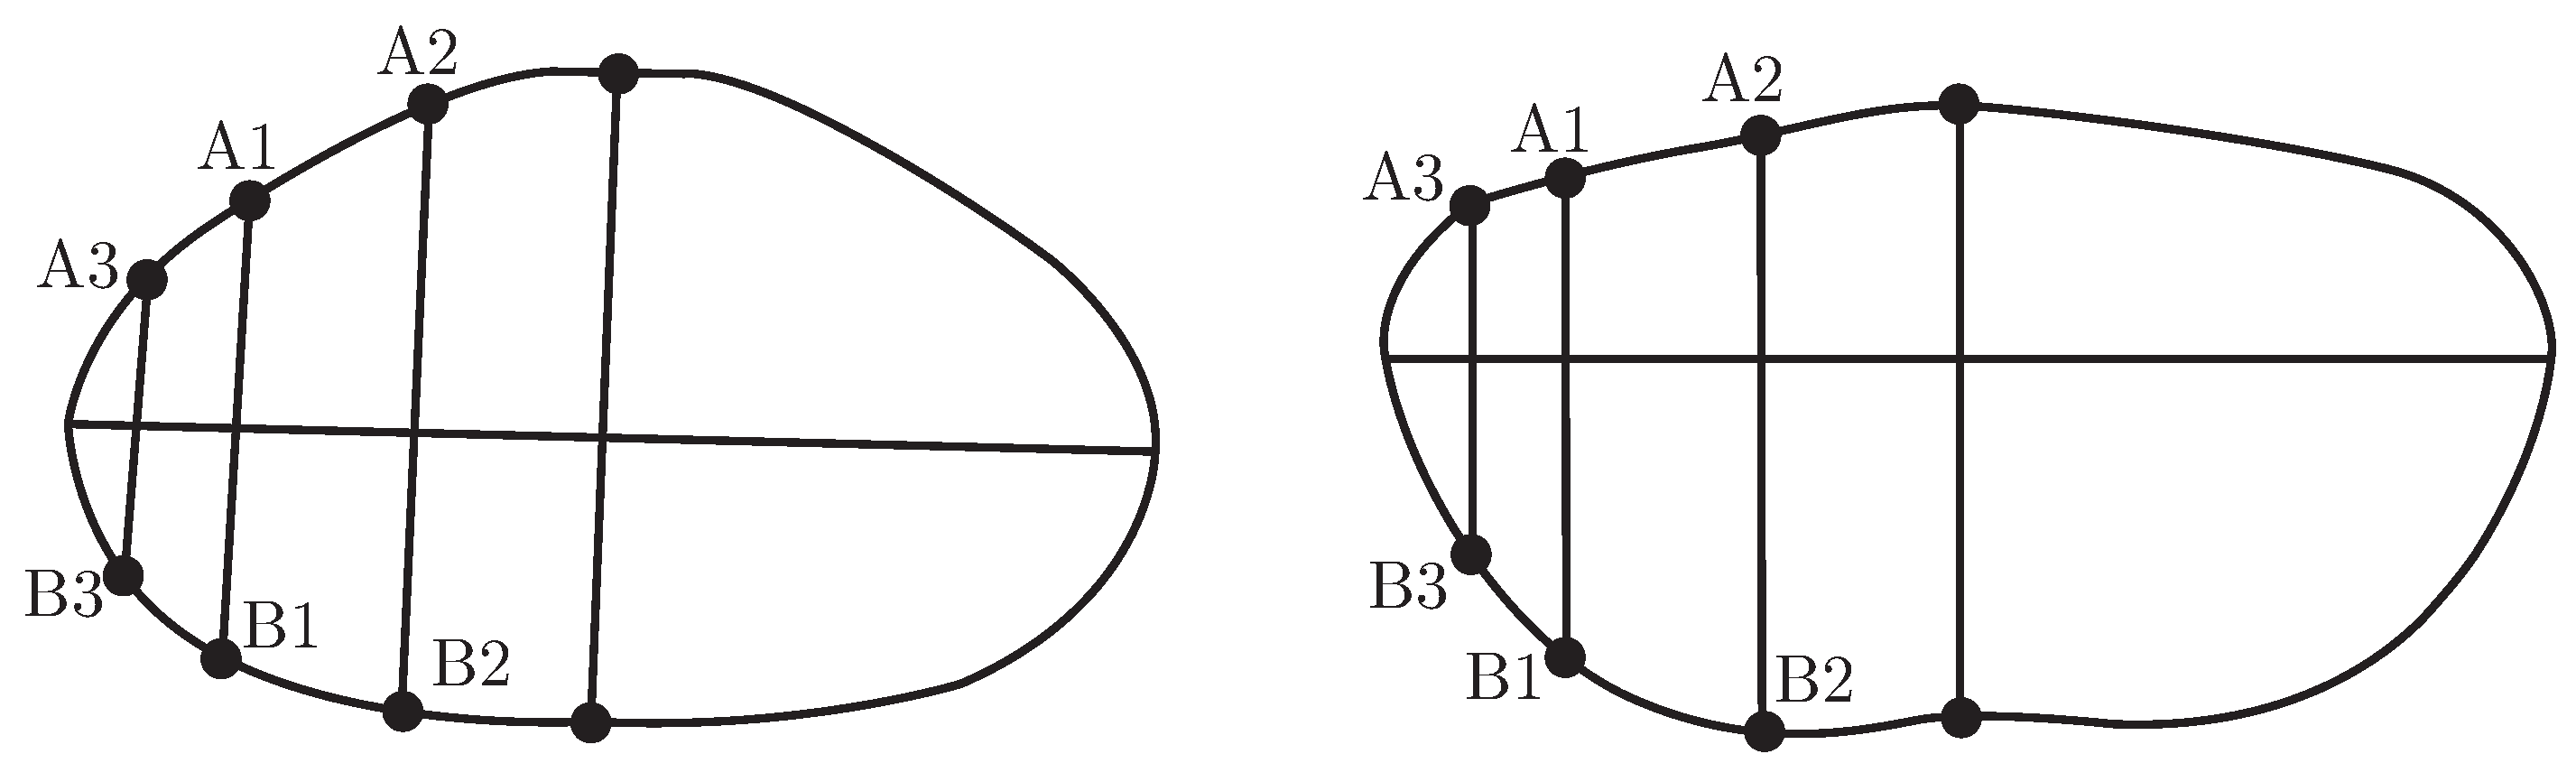
- the left and right points of the waist curve width from the front view of the waist cross-section cloud point diagram were determined and then the midpoint of the two points was found, from which a perpendicular line was drawn. The top and bottom points were obtained, as shown in Figure 20.Figure 20. Feature point for the waist.
- B.
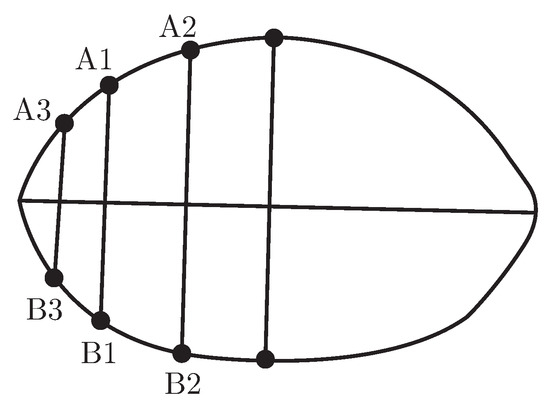
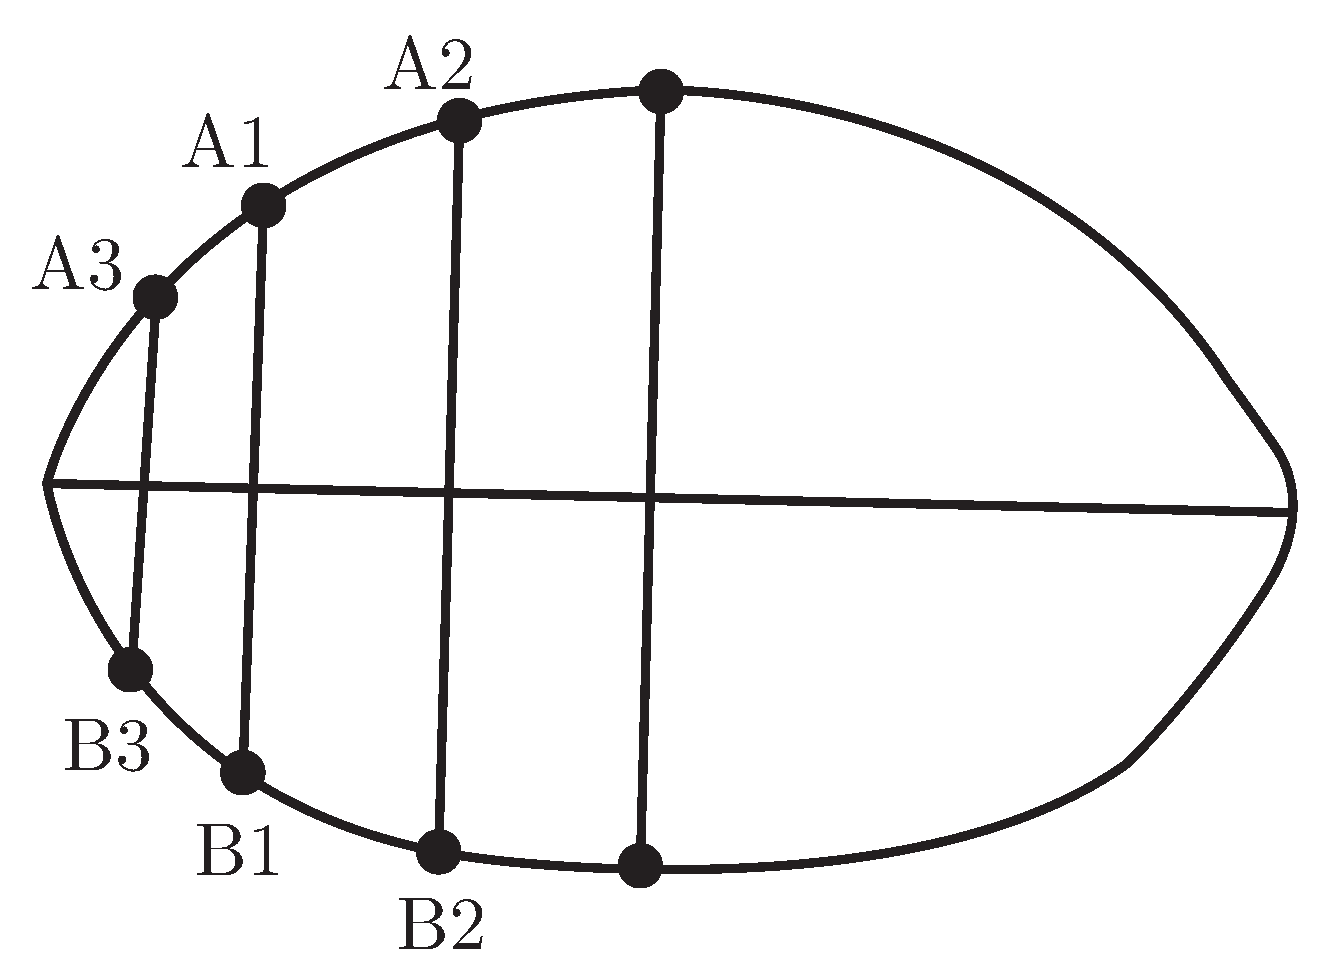
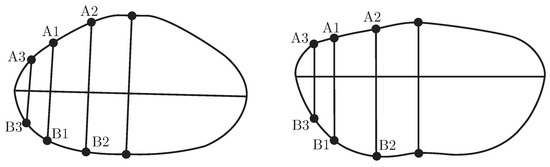
- the distance between the left and middle point of the waist width line was measured andthen this distance was trisected. A perpendicular line was dropped across each triplicate point which joined the waist curve at A1, A2, B1 and B2; the result is shown in Figure 21.Figure 21. Inserted-points for the waist.
- C.
- the left and right slope of the waist curve was so large that inserting three points couldnot obtain the best simulation level using the 3D-B spline curve in the IMAGEWARE software. Therefore, another insertion point was added between the left point and the first triplicate point. Then a perpendicular line was drawn to join the waist curve at A3 and B3 as shown in Figure 21.
- D.
- the perpendicular distances between A1, A2, A3, B1, B2, B3 and the waist width line weremeasured.
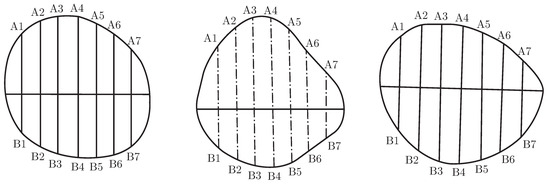
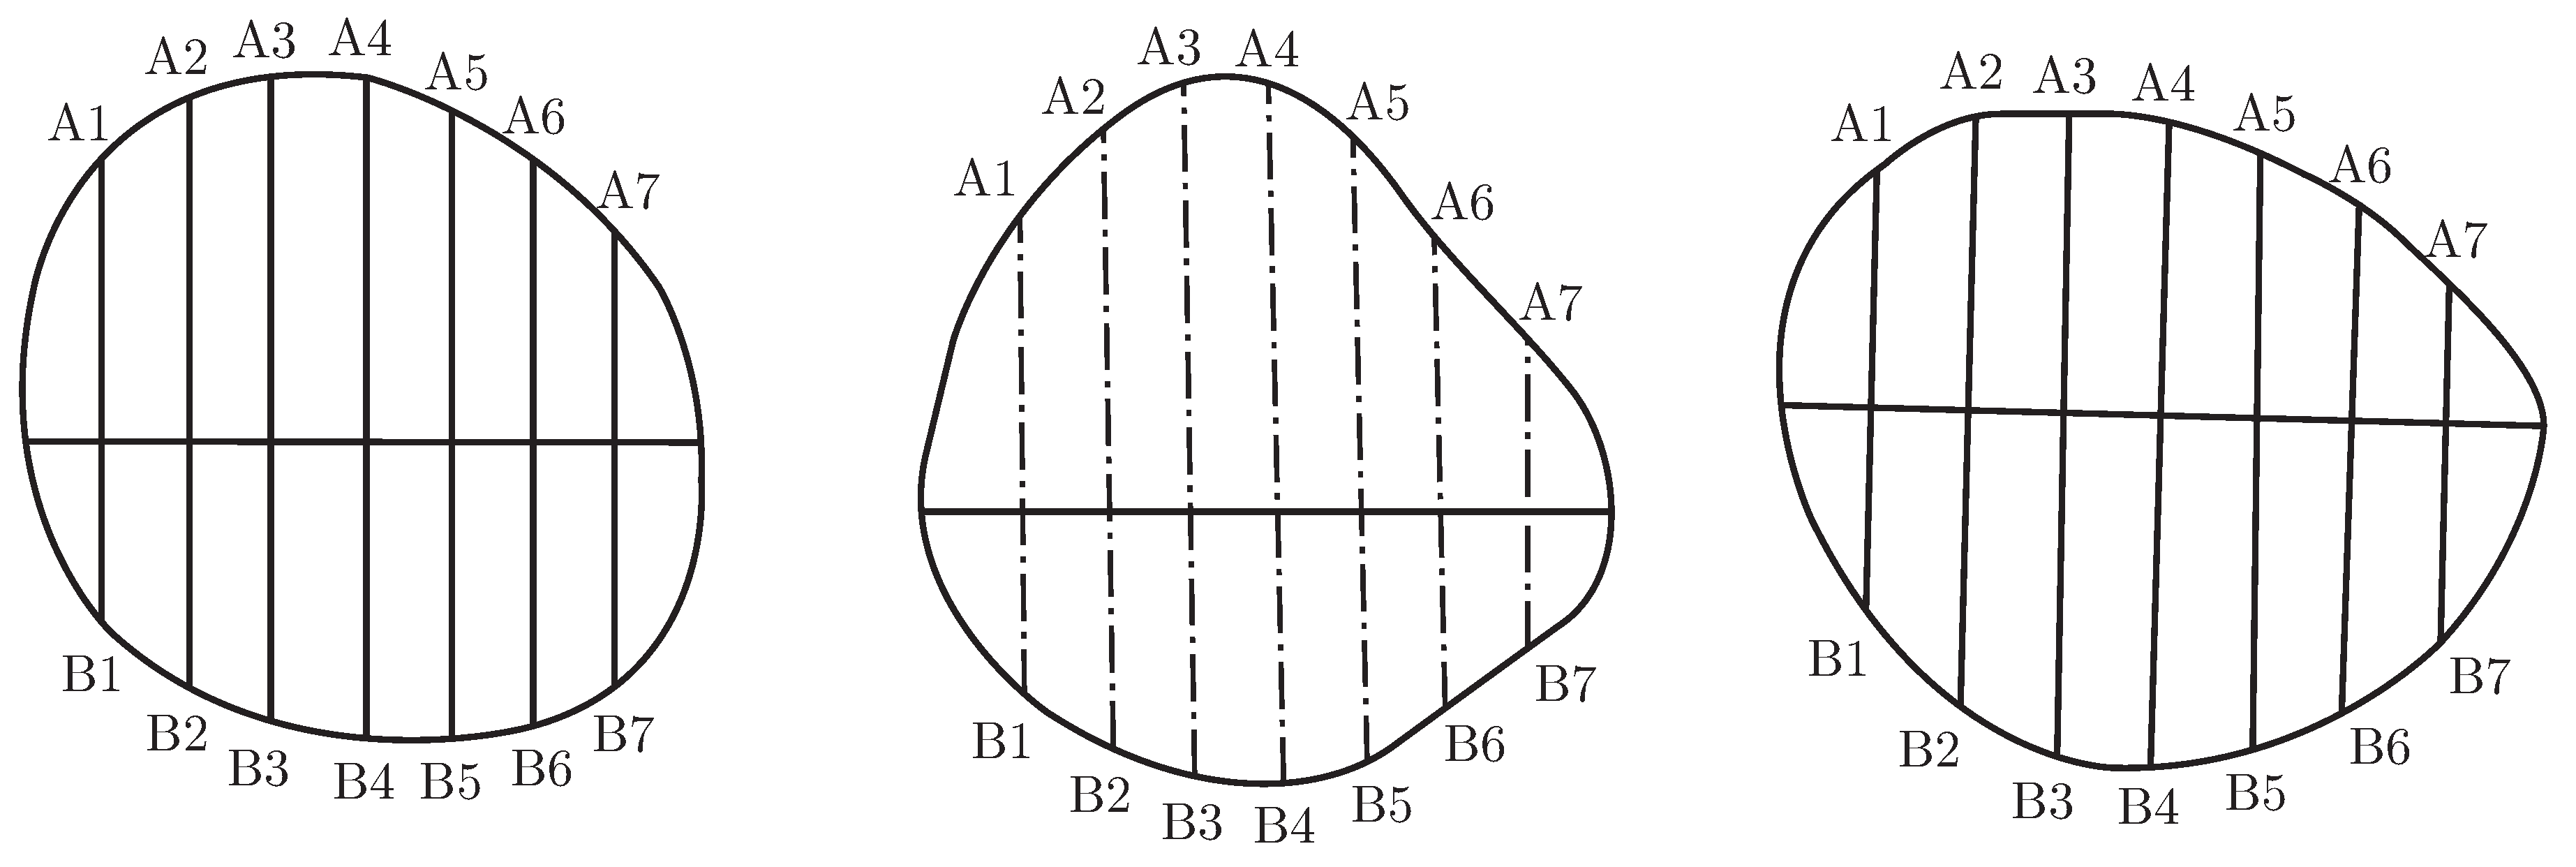
The abdomen curve and hip curve generation method was the same as that used for the waist curve. Figure 22 shows the diagrams of the abdomen curve and hip curves respectively and the inserted-points.
Figure 22.
Inserted points for the abdomen and hip.
The thigh curve, knee curve, and calf curve generation methods were similar, which involved dividing the width into eight portions, as shown in Figure 23.
Figure 23.
Inserted points for the thigh, knee and calf.
Taking the waist curve as an example, the relationships between the coordinates of the insertedpoints A1(X1, Y1), A2(X2, Y2), A3(X3, Y3), B1(X’1, Y’1), B2(X’2, Y’2), B3(X’3, Y’3) and the human body waist dimensions were determined using SPSS software.
The results were as follows:
X1=0.526+0.611×QYH
X2=-0.259+0.949×QYH
X3=0.472+0.416×QYH
X’1=0.512+0.749×HYH
X’2=0.318+0.938×HYH
X’3=0.579+0.493×HYH
QYH==-3.195+0.718×YH
HYH=3.195+0.282×YH
Y1=Y’1=YK/6
Y2=Y’2=YK*2/6
Y3=Y’3=YK/12
In these formulas, QYH is the “front waist thickness”, HYH is the “back waist thickness”, YH is the “waist thickness” and YK is the “waist width”.
5. Human Body Modelling
5.1. Basic Program Structure
A 3D mannequin for a female’s lower body was created by calling a routine Csgl to complete the whole OpenGL function under the platform of C#. There were two files in Csgl, which were csgl.dll and csgl.native.dll, and the two files were copied to the same fold in the file System32 of Windows. Then the csgl.dll file was added into the program of C#, and was also added in to the namespace. The sentence “using CsGl.OpenGL” was written in the program window and the whole OpenGL function was then used in the C# program.
First the custom controls of OpenGL were added in the C# program, and reconfiguration was done to three functions, which were glDraw, InitGLContext, OnSizeChanged. Drawing was done in glDraw, and the initial environment was set in the InitGlContext. When the window size was changed, the projection view could be reset in OnSizeChanged. The complete program was as follows:
class CSGLControl : OpenGLControl
{
public override void glDraw()
{
base.glDraw(); /* OpenGL initialize, eg. glEnable(GL BLEND); and so on */
···
GL.glBegin(GLenum mode); //Draw Your Images Here
···
GL.glEnd();
}
protected override void InitGLContext()
{
base.InitGLContext();
/*initialize the drawing environment, eg. GL.glShadeModel(GL.GL SMOOTH);and so on */
···
}
protected override void OnSizeChanged (EventArgs e)
{
base.OnSizeChanged(e);
/* used when the window size is changed, eg. GL.glViewport(0, 0, this.Width, this.Height); and so on */
···
}
5.2. Simulation of the Mannequin
Three methods were used to model the curves: Bezier curves, B-spline curves, and NURBS curves. All these curves were generated based on the control points and related functions. However, the positions of the control points could only change the basic shape of the curve, therefore, the designed curve could not meet the necessary requirements. To provide a suitable basis for generating the human body mannequin, the curves of the different features had to maintain the shape and pass through the control points.
The final surface had to pass through all of the original points in the characteristic curves, and, therefore, back-calculation of the surface had to be performed according to the method for the back-calculation of curves based on the properties of a B-spline surface. Thus, the basic points of the curves were calculated first and then the control points for each control curve were determined based on these points. For example, in the waist curve there were 16 points and 19 control points could be determined according to the back-calculation formula.
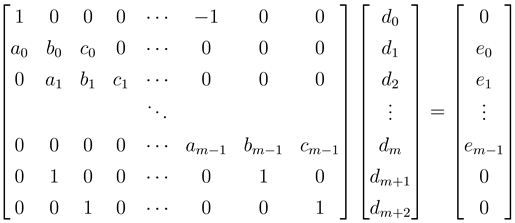
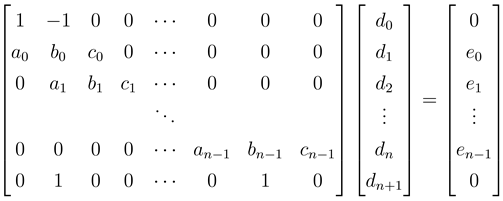
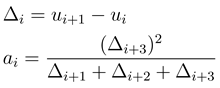
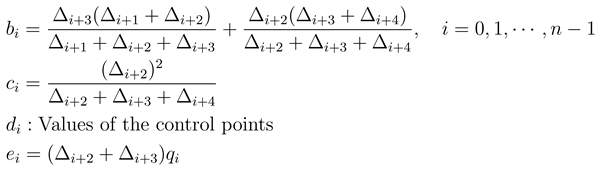
In this study, the chord length accumulation parameters were used to calculate the panel points for each curve to determine the control points. The specific procedure was as follows. When the control points in the rows were calculated, some periodic boundary conditions were added, which were d0 = dm, d1 = dm+1, d2 = dm+2, shown in equation (1). When the control points in the columns were calculated, some conditions of double control points were added at the endpoints, which were d0=d1, dn=dn+1,as shown in the equation (2).
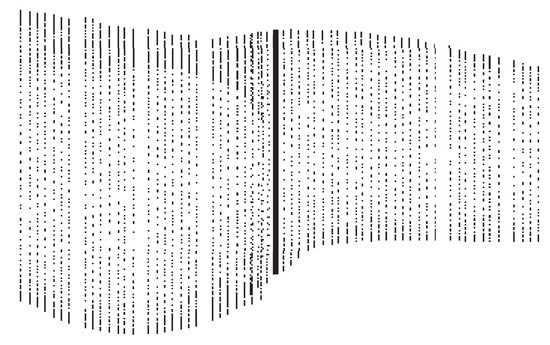
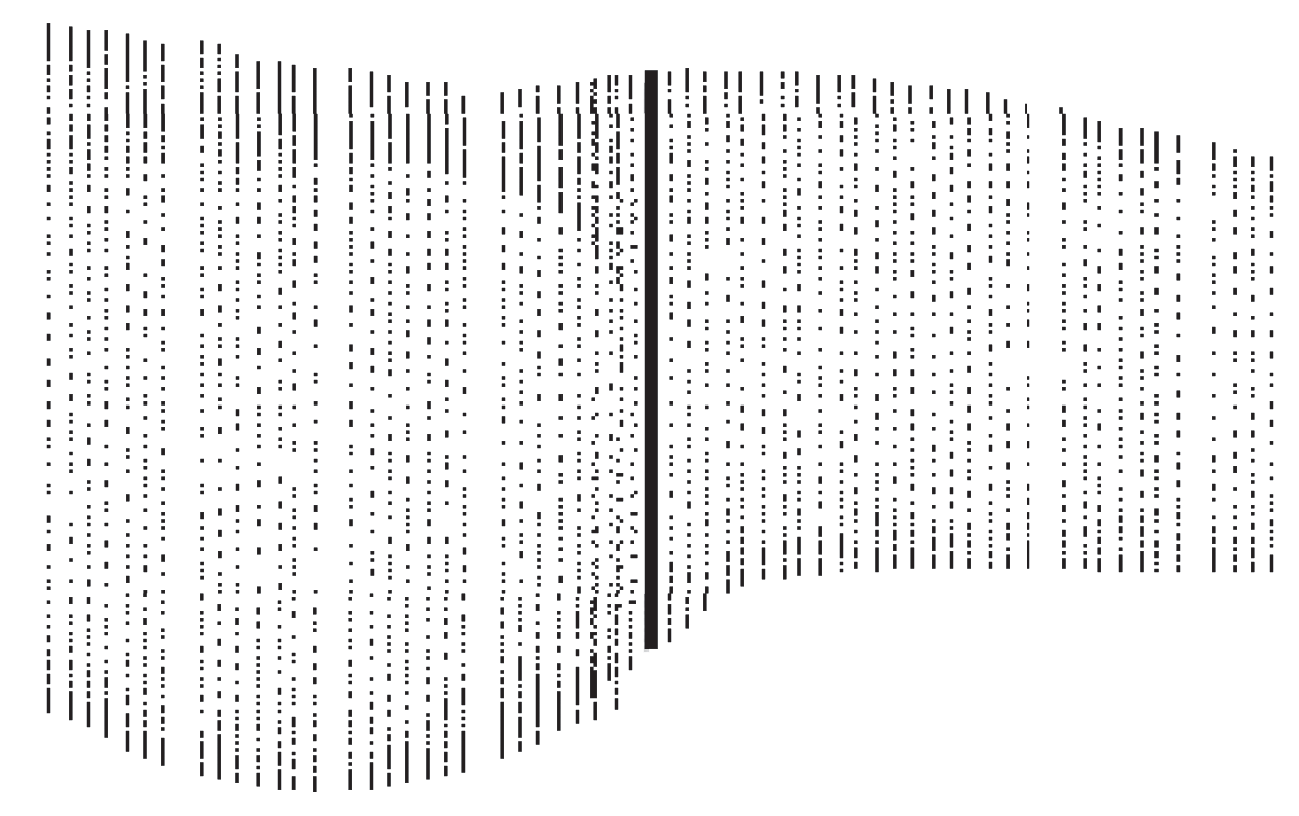
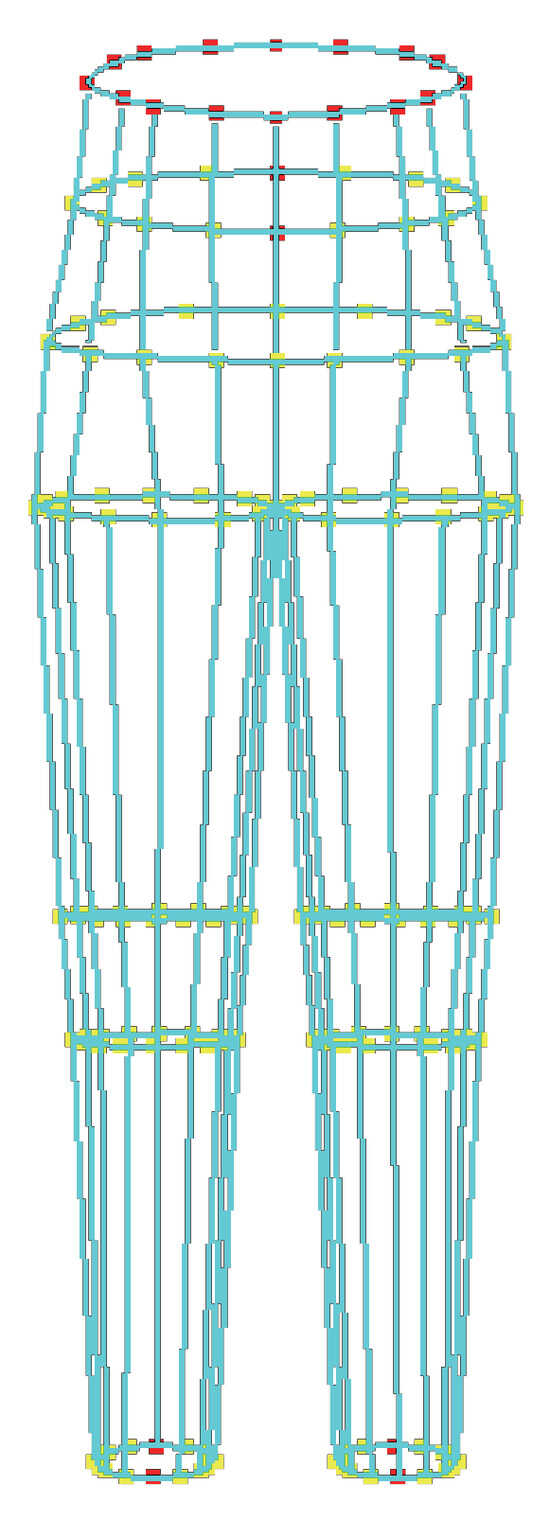
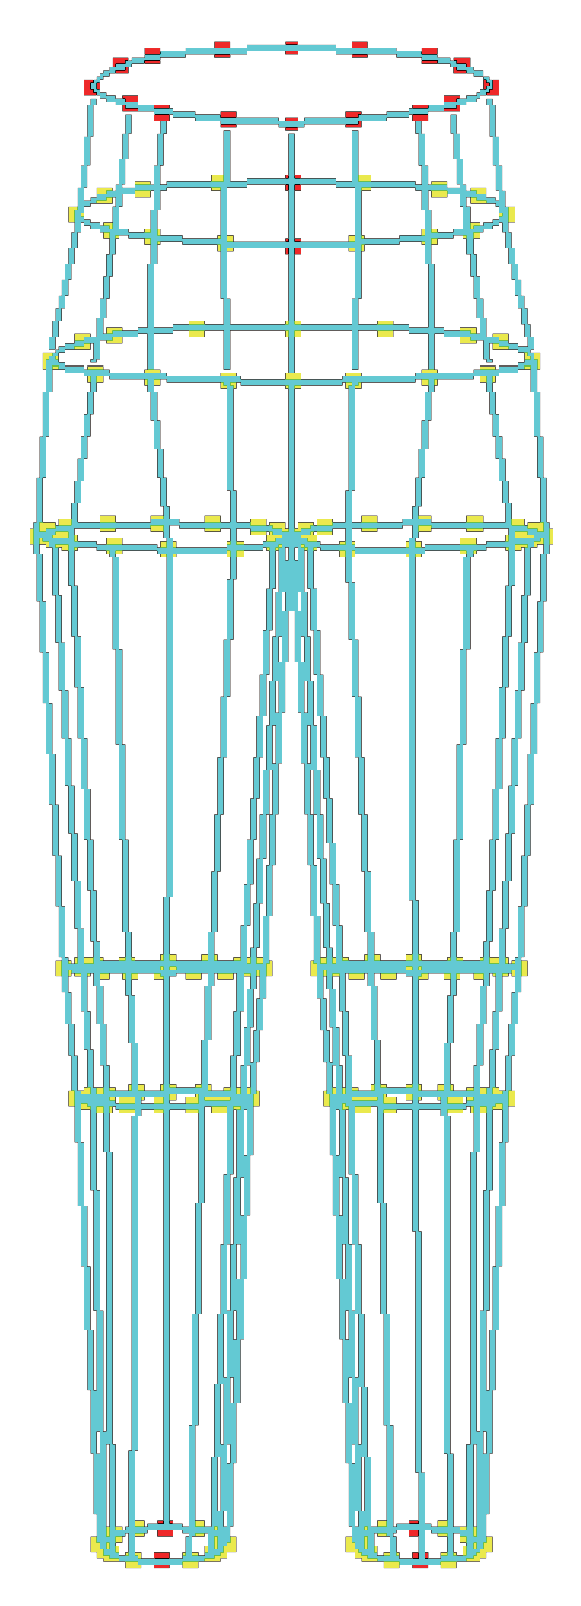
After working out a series of control points, the surface of young female’s lower body was simulated using the function gluNurbsSurface() in OpenGL, and the individual mannequin was generated using each feature’s curves, as shown in Figure 24.
Figure 24.
Mannequin representing the lower body of a young female.
In this study, the program for generating the mannequin was as follows:
GL.gluBeginSurface (pNurb);
GL.gluNurbsSurface(GLUnurbsObj *nobj, GLint sknot count, GLfloat *sknot, GLint tknot count, GLfloat *tknot, GLint s stride, GLint t stride, GLfloat *ctlarray, GLint sorder, GLint torder, GLenum type);
GL.gluEndSurface(pNurb).
5.3. Error Analysis
To illustrate the accuracy of the modelling methods, the waist curve is used as an example. The waist thickness was entered into the fitting formulae to obtain the fitting values for the insertion points. Comparisons of the fitted values with the measured values and the error distributions for the waist curve are listed in Table 2.
Table 2.
Error distributions for the waist curve.
In Table 2, the column heading e.g., [−2,−1] indicates that the error value was between −2 and −1. According to Table 2, the rules for the insertion points in the waist curve were precise, and therefore, the modelling was feasible. Previously, many researchers have simulated human mannequins based on 3D scanners, which meant that the cost was considerably high. Moreover, 3D scanners are considerably large and difficult to move. Consequently, their operation is inconvenient. However, our method for modelling a human mannequin is based on 2D photographs and avoids these disadvantages and it can also satisfy the needs of customers with respect to fit and customisation. After modelling the mannequin, virtual garment design can be performed using human models and garment patterns can be generated automatically.
6. Conclusion
In this study, the curved features of the female lower body were analysed and a method to generate the curves to define them was determined. The relationships between the coordinates of insertion points on these curves and body measurement data were analysed and generation rules for the cross-sectional profiles of the features were obtained to provide the basis for the creation of female lower body 3D mannequins. Finally, an automatic system for the 3D modelling of females’ lower bodies was realised based solely on the use of front and side photographs. The human models generated can generally describe the basic human body style, and the curve structures at characteristic positions can also express the real body features. This research has laid a solid foundation for the further interactive design of different fashion styles and the automatic generation of garment patterns.
Acknowledgments
This study was funded by the Innovative Engineering of Training Graduate in Jiangsu Province (number CXZZ13 08) and by the First Phase of Jiangsu Universities’ Distinctive Discipline Development Program for Textile Science and Engineering of Soochow University.
References
- Liu, H.; Xu, D.Q.; Chen, C. Summarize of garment CAD. J. Comput. Aided Des. Graph. 2000, 6, 12–16. [Google Scholar] [CrossRef] [Scilit]
- Xu, M.L. CAD application and development in clothing industry. J. Text. Res. 2002, 2, 24–26. [Google Scholar]
- Oua, Y.X.; Wang, R.M.; Zhou, F.; Liu, L. A sketch-based 3D garment model retrieval algorithm. J. Fiber Bioeng. Inform. 2013, 6(2), 217–224. [Google Scholar] [CrossRef] [Scilit]
- Zhu, L.L.; Deng, Z.M.; Li, G.Y. Mannequin summarize of 3D garment CAD. J. Wuhan Technol. Coll. 2004, 17(1), 19–21. [Google Scholar]
- Li, Y.; Hu, M.; Fu, X.L. Research of 3D mannequin methods. J. Text. Res. 2002, 23(10), 80–82. [Google Scholar]
- Kuang, C.Y.; Ji, K.C.; Jin, R.; Liu, G.L. Prediction of the main girths of young female based on 3D point cloud data. J. Fiber Bioeng. Inform. 2012, 5(3), 289–298. [Google Scholar] [CrossRef] [Scilit]
- Hu, M.; Li, Y.; Zhang, X.M. 3D body modelling based on feature. J. Tianjin Ind. Univ. 2002, 21(10), 80–82. [Google Scholar]
- Li, F.Z.; Li, Y.; Wang, Y. A 3D finite element thermal model for clothed human body. J. Fiber Bioeng. Inform. 2013, 6(2), 149–160. [Google Scholar] [CrossRef] [Scilit]
- Zhang, J. Talking of modelling technology. J. Yuncheng Coll. 2005, 23(2), 37–38. [Google Scholar]
- Maja, M.; Slavenka, P. Investigation of the fit of computer-based parametric garment prototypes. J. Fiber Bioeng. Inform. 2013, 6(1), 51–61. [Google Scholar] [CrossRef] [Scilit]
- Gu, L.; Xue, W.S. Research of 3D mannequin drawing methods based on OpenGL. J. Text. Technol. Dev. 2007, 4, 86–87. [Google Scholar]
- Zhang, R.Y.; Li, R.Q. Dealing of 3D human body data and curve face simulation. J. China Text. Univ. 2000, 26(4), 50–52. [Google Scholar]
- Nadia, M.T.; Hyewon, S.; Frederic, C. Automatic modelling of virtual humans and body clothing. J. Comput. Sci. Technol. 2004, 19(5), 575–584. [Google Scholar] [CrossRef] [Scilit]
- Wu, L.; Zhang, X. A parameterized mannequin for apparel design. J. Fiber Bioeng. Inform. 2008, 1(2), 37–41. [Google Scholar] [CrossRef] [Scilit]
- Zhang, X.; Liu, F.Y.; Ying, B.; Bai, Y. Parameterized design of female chest shape based on UGplatform. J. Fiber Bioeng. Inform. 2011, 4(3), 221–233. [Google Scholar] [CrossRef] [Scilit]



© 2014 Textile Bioengineering and Informatics Society. This article is an open access article distributed under the terms and conditions of the Creative Commons Attribution (CC BY) license (https://creativecommons.org/licenses/by/4.0/).