


Abstract
Use of improved Wheatstone bridge in measurement of fabric moisture content as well as its measurement principle is introduced in this paper. A new detection circuit of fabric moisture content based on improved Wheatstone bridge is designed, and its measurement result is standardized by oven method. The fitted curves representing fabric moisture content of different materials are plotted after the experimental data is processed. Compared with oven method, errors are analyzed. The results reveal that the detection circuit can accurately measure the changes in fabric moisture content and errors are small (within 1% for cotton), which can meet the need of fabric moisture content detection online system.
1. Introduction
The moisture content is a fundamental parameter of fabric textile dyeing process, which directly affects the textiles processing quality. Moisture content is defined as the ratio of the weight of the water that fabric absorbs and the weight of dry fabric. Namely moisture content = (the weight of wet fabric –the weight of dry fabric) / the weight of dry fabric [1].
Top measurement methods of moisture content are oven drying, infrared hygrometry, capacitance method, microwave method, and resistance method. The oven method holds the highest accuracy, and it can be used to calibrate the results measured via other measurements. However, it can’t be achieved online, because the time it takes is too long [2]. Infrared and microwave test methods are non-contact measuring methods, their biggest strength is that measurement does not require to be in touch with fabric and detection-online is easy to be achieved. However, they are born with deathful disadvantage that they have many demands from the external environment and the radiation may affect workers health or interfere with other equipments [3,4]. Capacitance method and resistance method are electrical measurement method; they obtain fabric moisture content indirectly by measuring the conductivity of fabrics. Currently capacitance method is not yet mature because of its instability. And owing to easier implementation, low cost, and support for online testing, the resistance method is widely used in textile industry [5]. A new method of measuring fabric moisture content based on resistance method will be introduced in which Wheatstone bridge is improved to effectively solve the problem of the wide resistance change range of fabric with different moisture. And stably output current signal after conversion and conditioning. The relationship between the output current and fabric moisture is fitted after cotton, denim, linen and chiffon samples are tested by circuit designed, which is applied on the setting machine for testing moisture of fabric online. After theoretical analysis and experimental testing, this method is confirmed with feasibility.
2. Measurement Principle and Realization
2.1. The Effect of Fabric Hygroscopicity on the Electrical Conductivity
Most of the textile materials inherently possess a certain degree of hygroscopicity, mainly manifested as moisture content of textile materials varies with the changes of exterior ambient humidity. Place drying fabrics in a highly humid air or directly into a liquid solution, the moisture content of textile materials will increase. Similarly, place the fabric with higher moisture content in a relatively arid environment, the water will gradually decrease [6]. Whether absorbing water or releasing water, in certain conditions, the moisture content of the fabric will gradually become steady; this phenomenon is called moisture balance. When it reaches moisture balance, the moisture content that the fabric possess depends on the external environmental factors such as relative humidity and temperature [7,8].
After absorbent of textile materials, its electrical properties will change a lot, in order to describe the specific nature of conductive textile materials, the model similar to textile material geometry and various technical indexes must be introduced, and are defined as follows:
Definition: R is the resistance value (Ω) of fabric material, L is the length (cm) of fabric material, S is the cross-sectional area (cm2) of fabric material and ρv is volume resistivity of fabric material. Then,
From the formula (1), ρm is the resistivity of material, and its unit is Ω·cm. In value, it is equal to the resistance value of fabric material with the length of 1 cm and the cross-sectional area of 1 cm2.
Definition: d is the density of fabric material (g/cm3), ρm is mass resistivity. Then,
It is easy to know from formula (2) that ρm in value is equal to the resistance value of fabric material with the mass of 1 g and the length of 1 cm, and its unit is Ω·g/cm2. Mass resistivity can reflect material conductive properties. For textiles, length and mass is easier to measure than the cross-sectional area and volume, and the error is relatively small. Hence, mass resistivity is often utilized to indicate the conductive properties of materials [9,10].
Textile materials are important electrical insulating materials [9,11]. Generally textile materials are polymers; they have a high electrical insulation property thanks to special molecular structure.
The mass resistivity of dry fabric may be up to about 1014 Ω·g/cm². However, after absorbent, the water or other printing materials that wet fabrics contain have good conductivity, which will make insulation deteriorate, namely the dielectric coefficient is improved, enhancing the conductivity of materials. The mass resistivity will decrease even to about 103 Ω·g/cm², crossing ten orders of magnitude. Therefore, moisture content of fabrics can be measured indirectly by measuring its conductivity.
2.2. Wheatstone Bridge Measurement Circuit
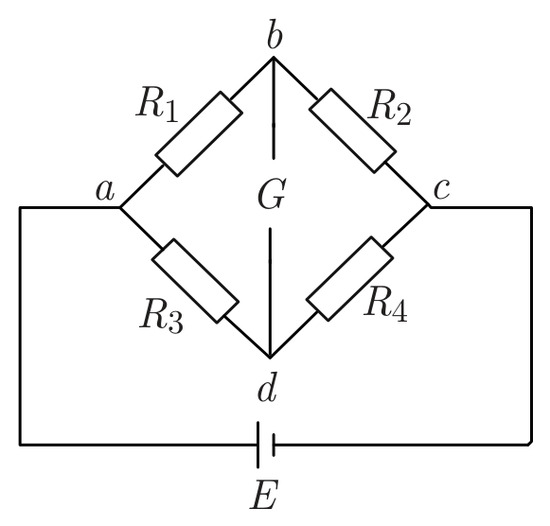
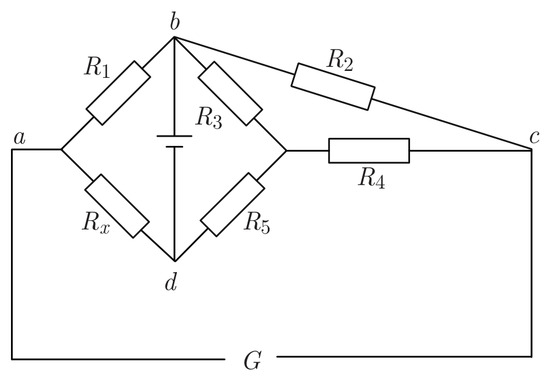
Wheatstone bridge [12] is also known as single bridge, and its schematic circuit diagram is shown in Figure 1. Assuming a certain condition, galvanometer G refers to zero, which indicates no current flows in the circuit where the galvanometer is, and it also means Ubd = 0. Namely, the electric potential at the point b is equal to that at the point d, which can be expressed as:
Figure 1.
Schematic circuit diagram of Wheatstone bridge.
The expression (4) is the condition when the bridge is balanced. Namely, at the time the bridge reaches balance, the products of the value of the resistance on the opposite bridge arms are equal. Another nature of balance bridge is also easy to obtain, whether the bridge reaches balance or not only depends on the relationship between the parameter of each bridge arm, instead of the supply voltage and the internal resistance of galvanometer, which is the biggest advantage of Wheatstone bridge.
According to the condition of Wheatstone bridge, assuming among four bridge arms, R1 is unknown, indicated as Rx, while others are known, then expression (5) will be obtained, which also is the measurement principle of Wheatstone bridge.
Two main factors that impact measurement sensitivity of Wheatstone bridge are shown as follows,
1) Supply voltage. The higher the supply voltage is, the higher the sensitivity is. Of course, the voltage must be in safe voltage range.
2) n, n = R1/R2 = R4/R3. When n is equal to 1, the bridge gets maximum sensitivity.
2.3. Y-Δ Transformation
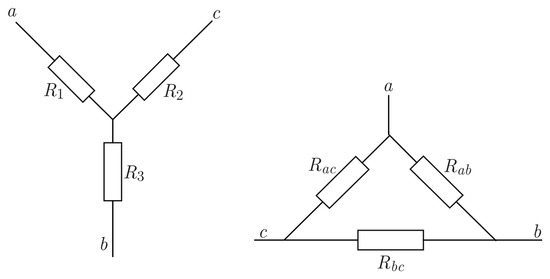
For Y network built with three resistances possessing known value, apply Y-Δ transformation [13], to form a Δ network with equivalent resistance provided with high value. Y-Δ transformation is shown in Figure 2.
Figure 2.
Y-Δ transformation circuit.
From the three formulas above, the equivalent standard resistance up to more than 1010 Ω can be formed using three resistances no more than 1 MΩ through Y-Δ transformation. If R1 is 10 Ω, R2 and R3 are 1 MΩ, and then Rbc will be up to 1011 Ω, effectively solving the problem of the cost high-value resistor.
2.4. Improved Wheatstone Bridge
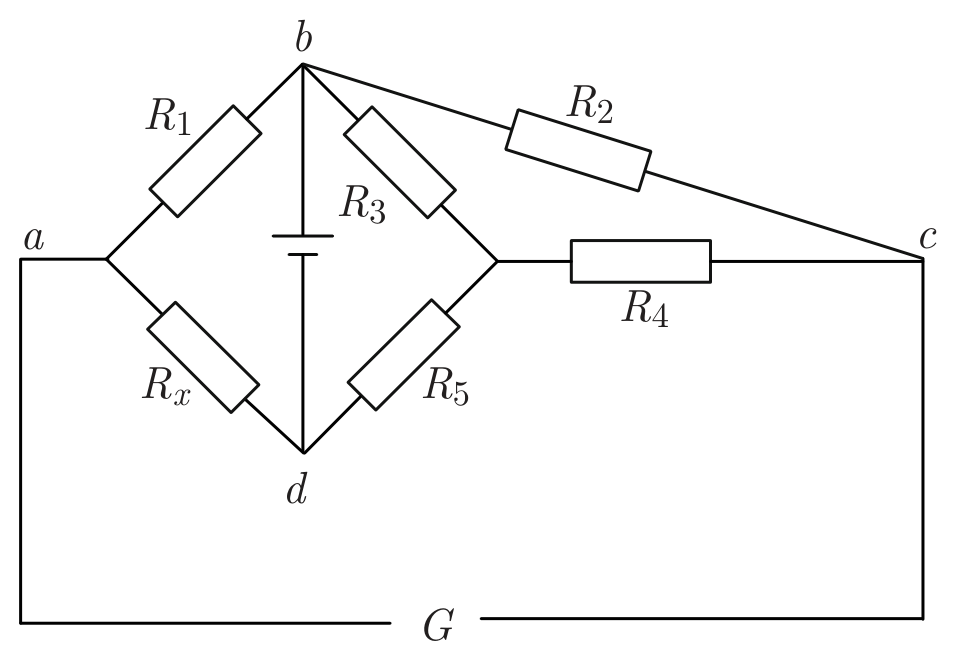
The improved Wheatstone bridge shown in Figure 3 combines traditional Wheatstone bridge with Y-Δ transformation, forming a resistor bridge, one of whose arms is equipped with equivalent high value resistor [14]. Its advantage lies in extending bridge measurement range to 1011 Ω using resistors just no more than 1 MΩ, solving the measurement problem of fabric maximum resistance (about 300 to 400 MΩ).
Figure 3.
Improved Wheatstone bridge.
According to the rules obtained in parallel with the resistor, expression (9) will be obtained, and then in the light of expression (5), expression (10) will be obtained.
2.5. Signal Conversion and Conditioning
Measure resistance by Wheatstone bridge, usually by changing the parameters of the bridge arm until the galvanometer refers to zero, and then calculating the value of measured resistance through the balance equation. While measuring resistance of the fabric needs to configure the parameters of bridge arms in advance and keep no longer change, taking online detection into account. Then calculate the fabric resistance according to its output voltage. However, the use of voltage signal transmission will produce the following questions:
(1) As the transmission signal is a voltage signal, the transmission lines are susceptible to noise interference;
(2) The distribution of the transmission line resistance will produce a voltage drop;
(3) How to provide on-site operating voltage of the instrumentation amplifier is also a problem.
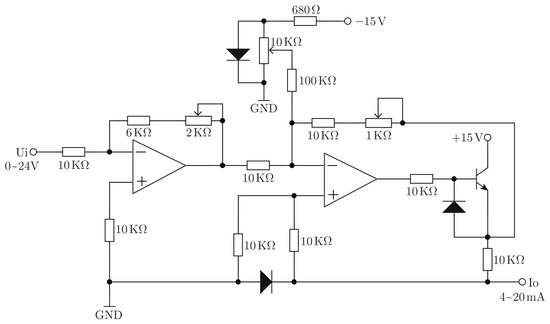
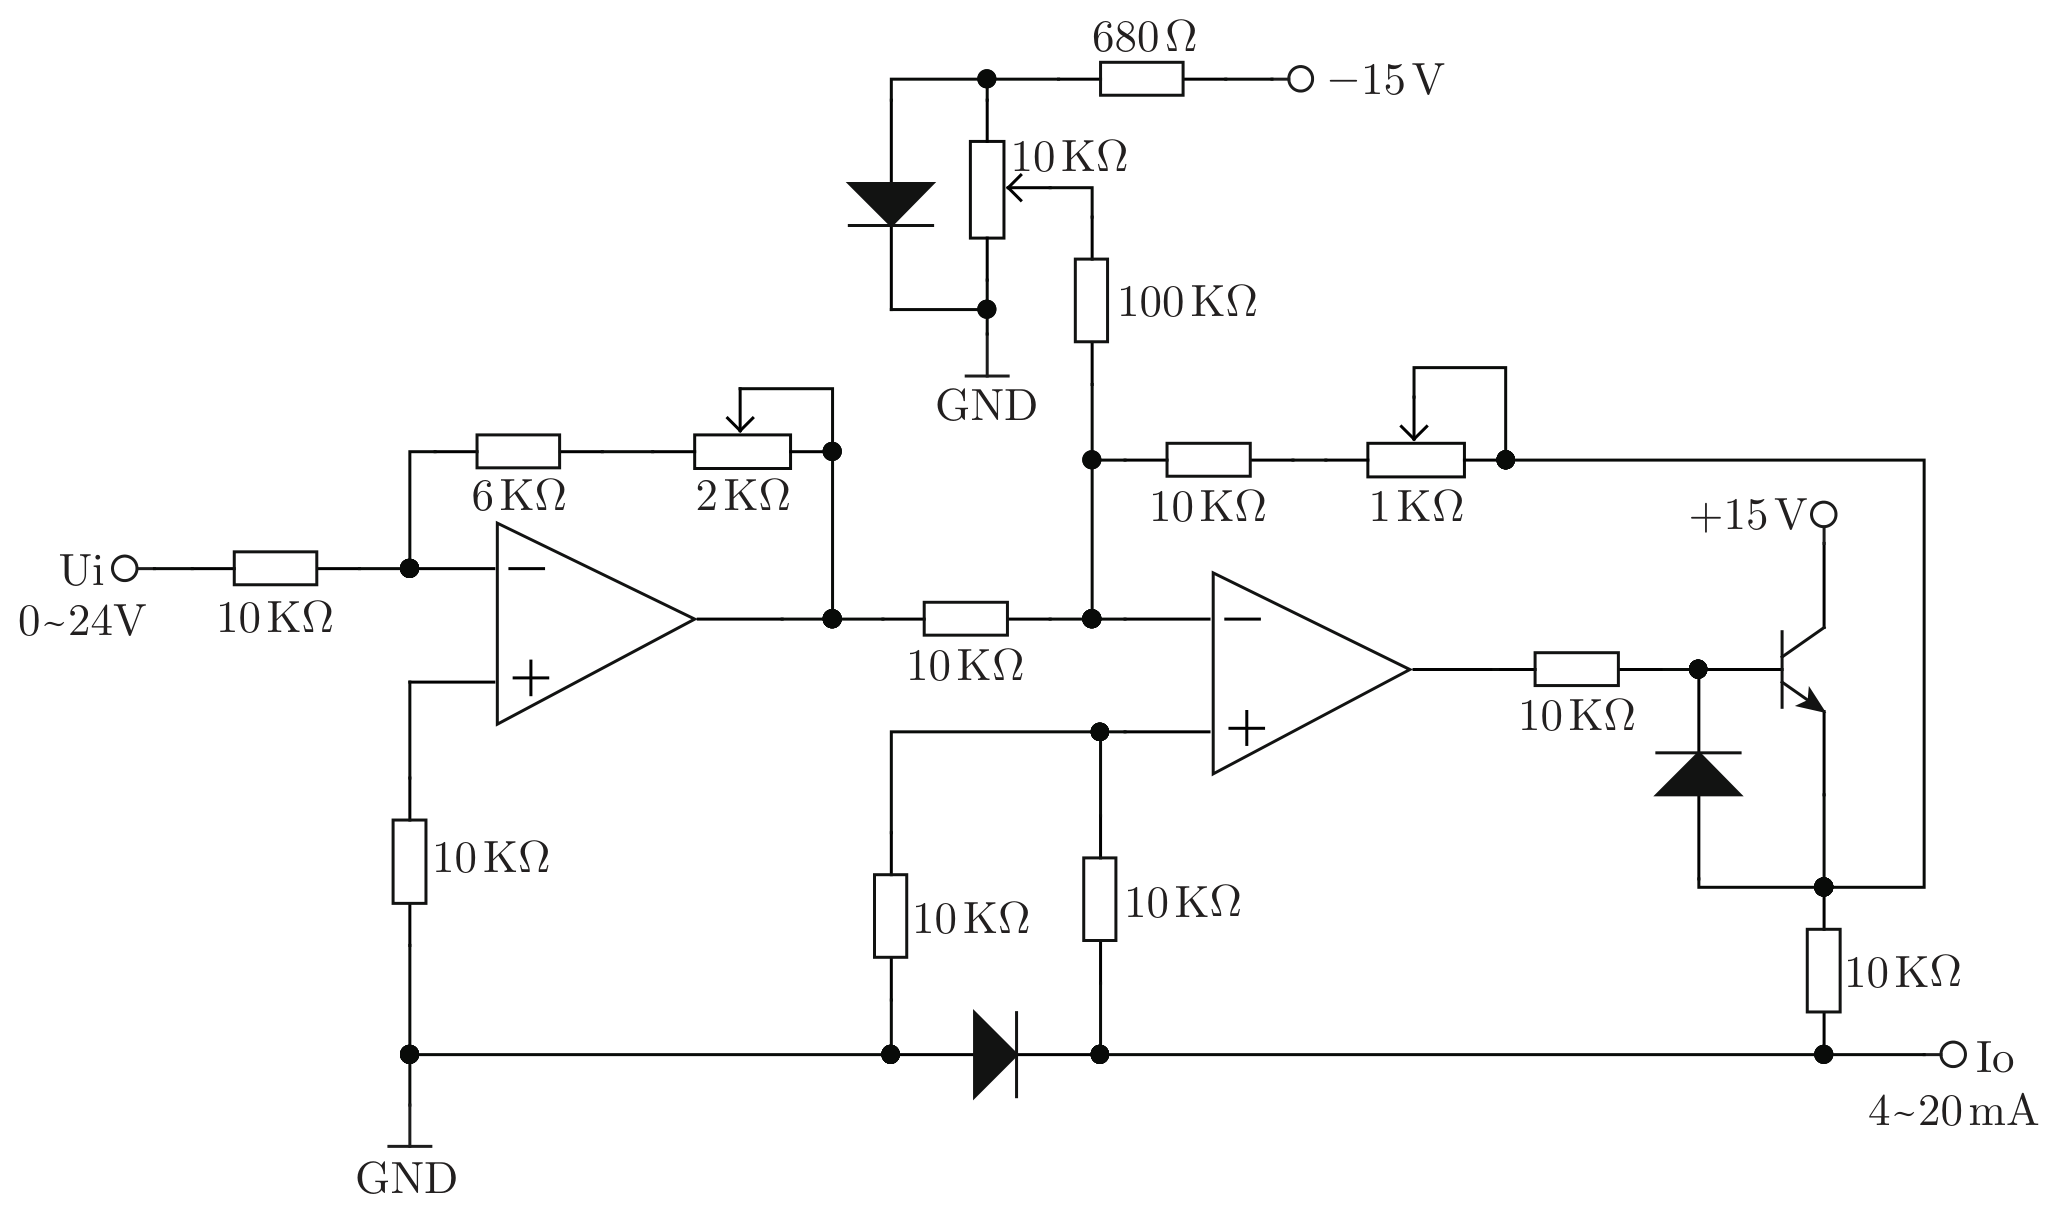
To solve the problems above and avoid related noise, we have to transmit the current signal instead of voltage signal, because the current is not sensitive to noise. The current loop of 0~20 mA is applied in this paper, 3.5 mA indicating zero input signal and 20 mA indicating the full scale of input signal. The current signal must meet the following conditions: the value of the output current only varies with the input voltage, having nothing to do with the load. Namely, the current is a constant current source for the load.
Conversion circuit is shown in Figure 4.
Figure 4.
Signal conversion circuit.
2.6. Simple Model of Testing Method and Hardware Design
2.6.1. Simple Model of Testing Method
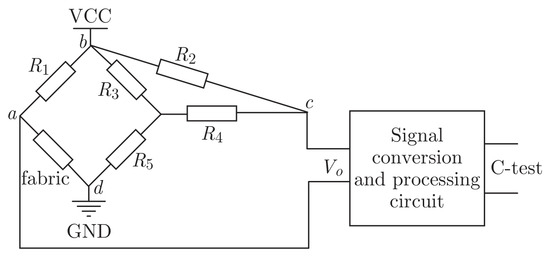
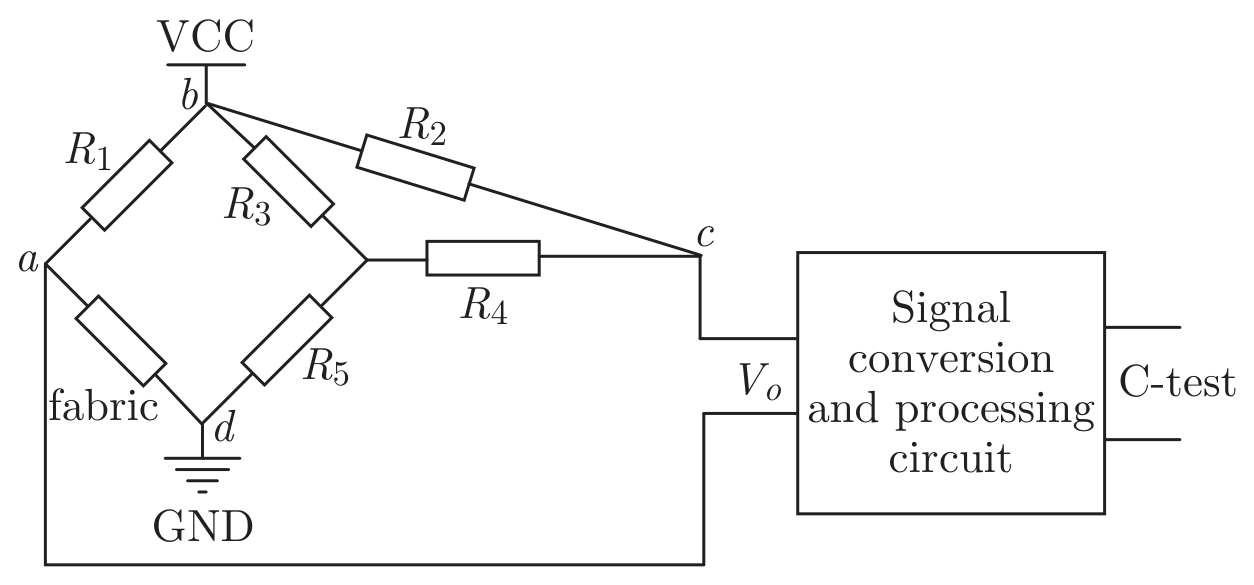
When the fabric contains lots of water even the obvious dripping phenomenon would be seen, its resistance would reduce to 10 K or less. Conversely, when there is very little water in the fabric, a thickness of 0.1 mm per 100 cm2 containing about 1 g water, the fabric resistance will be up to 10 MΩ–300 MΩ [1,6,15]. Obviously, the range of variation of the fabric resistance is large, with its moisture changing. However, improved Wheatstone bridge would solve the problem according to the analysis in 2.4. Therefore, the simple model in Figure 5 is applied to obtain fabric resistance.
Figure 5.
Simple model of testing method.
Measure resistance by Wheatstone bridge, usually through changing the parameters of the bridge arm until the galvanometer refers to zero, and then calculating the value of measured resistance through the balance equation. While measuring resistance of the fabric needs to configure the parameters of bridge arms in advance and keep no longer change, taking online detection into account. Then calculate the fabric resistance according to its output voltage. The expression (11) can be obtained from Figure 5, where the Y-network is built by R3, R4 and R5. In expression (11), Vo represents the output voltage of improved Wheatstone bridge, Vs represents the voltage between VCC and GND, Rf represents the resistance of fabric, all of R1, R2, R3, R4 and R5 are the resistors with known value, and C-test represents the current tested.
So,
As known, moisture content (M) is a function of fabric resistance (Rf), thus it also is a function of output voltage (Vo), expressed as (13).
In addition, the current tested (Ct) is a function of output voltage (Vo), shown as (14).
Finally, moisture content (M) of fabric is a function of current tested (Ct), and their relationship would be fitted by matlab after gaining enough experimental data.
2.6.2. Hardware Design
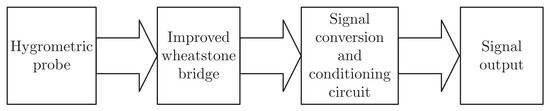
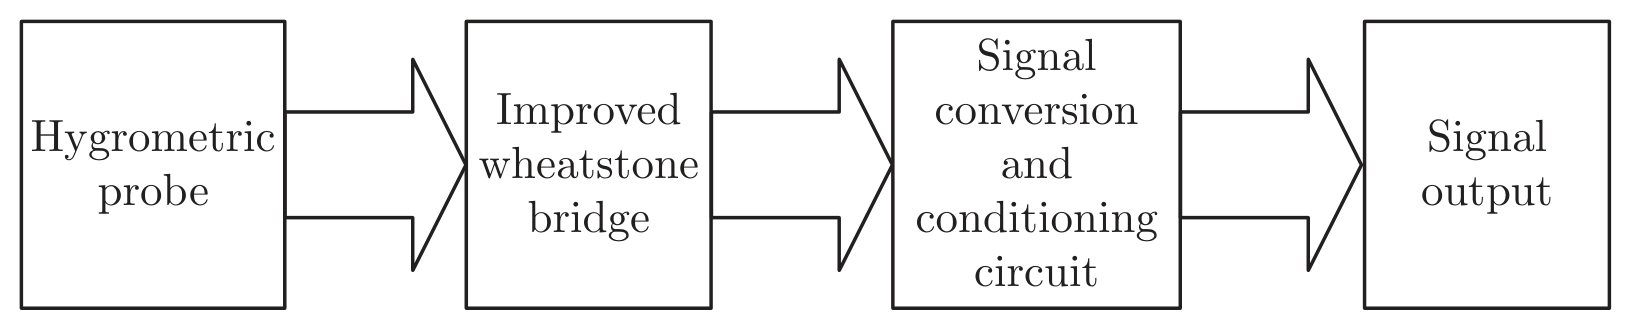
The whole hardware consists of hygrometric probe, signal acquisition circuit (improved Wheatstone bridge) and signal processing circuit, outputting standard current industry used for industrial inspection. The design is shown in Figure 6.
Figure 6.
Hardware design.
Moisture probe is made by aluminum measuring humidity roll, because aluminum is provided with light weight, good corrosion resistance, affordability and able to adapt to the industrial environment of textile and dyeing industry. Simultaneously measuring humidity rolls can simulate the industrial field, and realize real-time monitoring changes in moisture content. Signal acquisition (improved Wheatstone bridge) and processing circuit are printed on integrated circuit board.
3. Experimental Content and Data Processing
3.1. Experimental Environment Equipments
All experimental data are obtained in a conditioning room at 25±1 °C and 60±5% RH. During drying stage, the temperature of oven is set to be 40 °C, thus the speed of drying would be appropriate, taking drying time and enough moisture value tested. To reduce the influence of the temperature, the oven must be heated to 40 °C before drying, and the moisture is measured after staying 1 minute in conditioning room after every drying for 1minute.
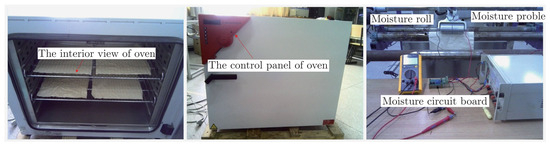
The equipments for testing moisture are shown in Figure 7.
Figure 7.
The oven and circuit for testing moisture.
3.2. Test Circuit Using Resistor Box to Simulate Fabric Resistance Changes
The resistance measuring range of circuit is designed on the basis of fabric resistance, and its main measuring area is 10 K~10 MΩ. Only when the fabric contains very much water even the obvious dripping phenomenon would be seen, its resistance would reduce to 10 K or less. Conversely, when there is very little water in the fabric, a thickness of 0.1 mm per 100 cm2 containing about 1 g water, the fabric resistance will be up to 10 M–300 MΩ [1,6,15]. Therefore, these two regions are extremely humid or extremely dry areas. In industrial applications, it doesn’t make sense to measure humidity in these two regions, so accuracy requirements are more lenient. Hence, when the resistance value used for test is selected, more emphasis is put on the middle area.
Fabrics are replaced by resistor box to be an access circuit. And the resistances of resistor box are adjusted in turn to the values in the table1 to simulate fabric resistance changes led by fabric moisture. The corresponding output current values are recorded. The measurement should be operated 5 times, and the averages of current values corresponding to the same input resistance are calculated.
Table 1.
The output current when use resistance-box to simulate fabric resistance changes.
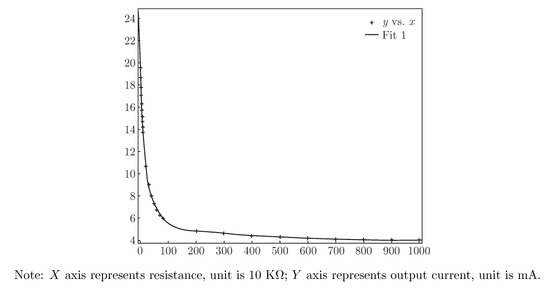
Fit the measured data function curve by matlab software, and the results shown in Figure 7 are obtained.
The horizontal axis represents the input resistance R and its unit is 10 KΩ, while the vertical axis represents the output current I, the unit is mA.
The function fitting the curve in Figure 8 is shown as (16).
where the parameters are:
Figure 8.
The output current curve when the resistance of resistance-box changes.
a = 13.72;
b = −0.0517;
c = 5.932;
d = −0.000515;
I represents output current, unit is mA;
R represents input resistance, unit is 10 KΩ.
It can be seen from Figure 8, the curve model matches more accurately (coefficient of determination: 0.99965, and corrected coefficient of determination: 0.9997). There is a certain deviation in the area between 1 MΩ and 10 MΩ, but the deviation is within the error range. Therefore, this circuit, designed as detection circuit of fabric moisture content, can accurately measure the value of resistance within the range of fabric resistance changes.
3.3. The Output Signal Data when the Fabric Moisture Content Changes
During the research experiment, an oven is used to dry the fabric and weighing method is applied to standardize the output result of the circuit.
Experimental operation: First, 10 samples with same physical parameters of each fabric material are collected and their physical parameters such as sample size, thickness and dry weight are measured carefully; then the samples are put into a pool of water completely to simulate printing, and the wet weight is measured; finally begin to dry, the weight and output current are measured and recorded every 1 minute during drying stage until the difference in the weight between two consecutive measurements is less than 1 g, end drying. After the experiment, the corresponding content of each output current is calculated according to the weighing method. The textile literature and industry standards show that moisture content is defined as the ratio of the weight of the water that fabric absorbs and the weight of dry fabric. The formula for moisture content is written as:
Note: MC represents moisture content of fabric, WW represents weight of wet fabric, and DW represents weight of dry fabric.
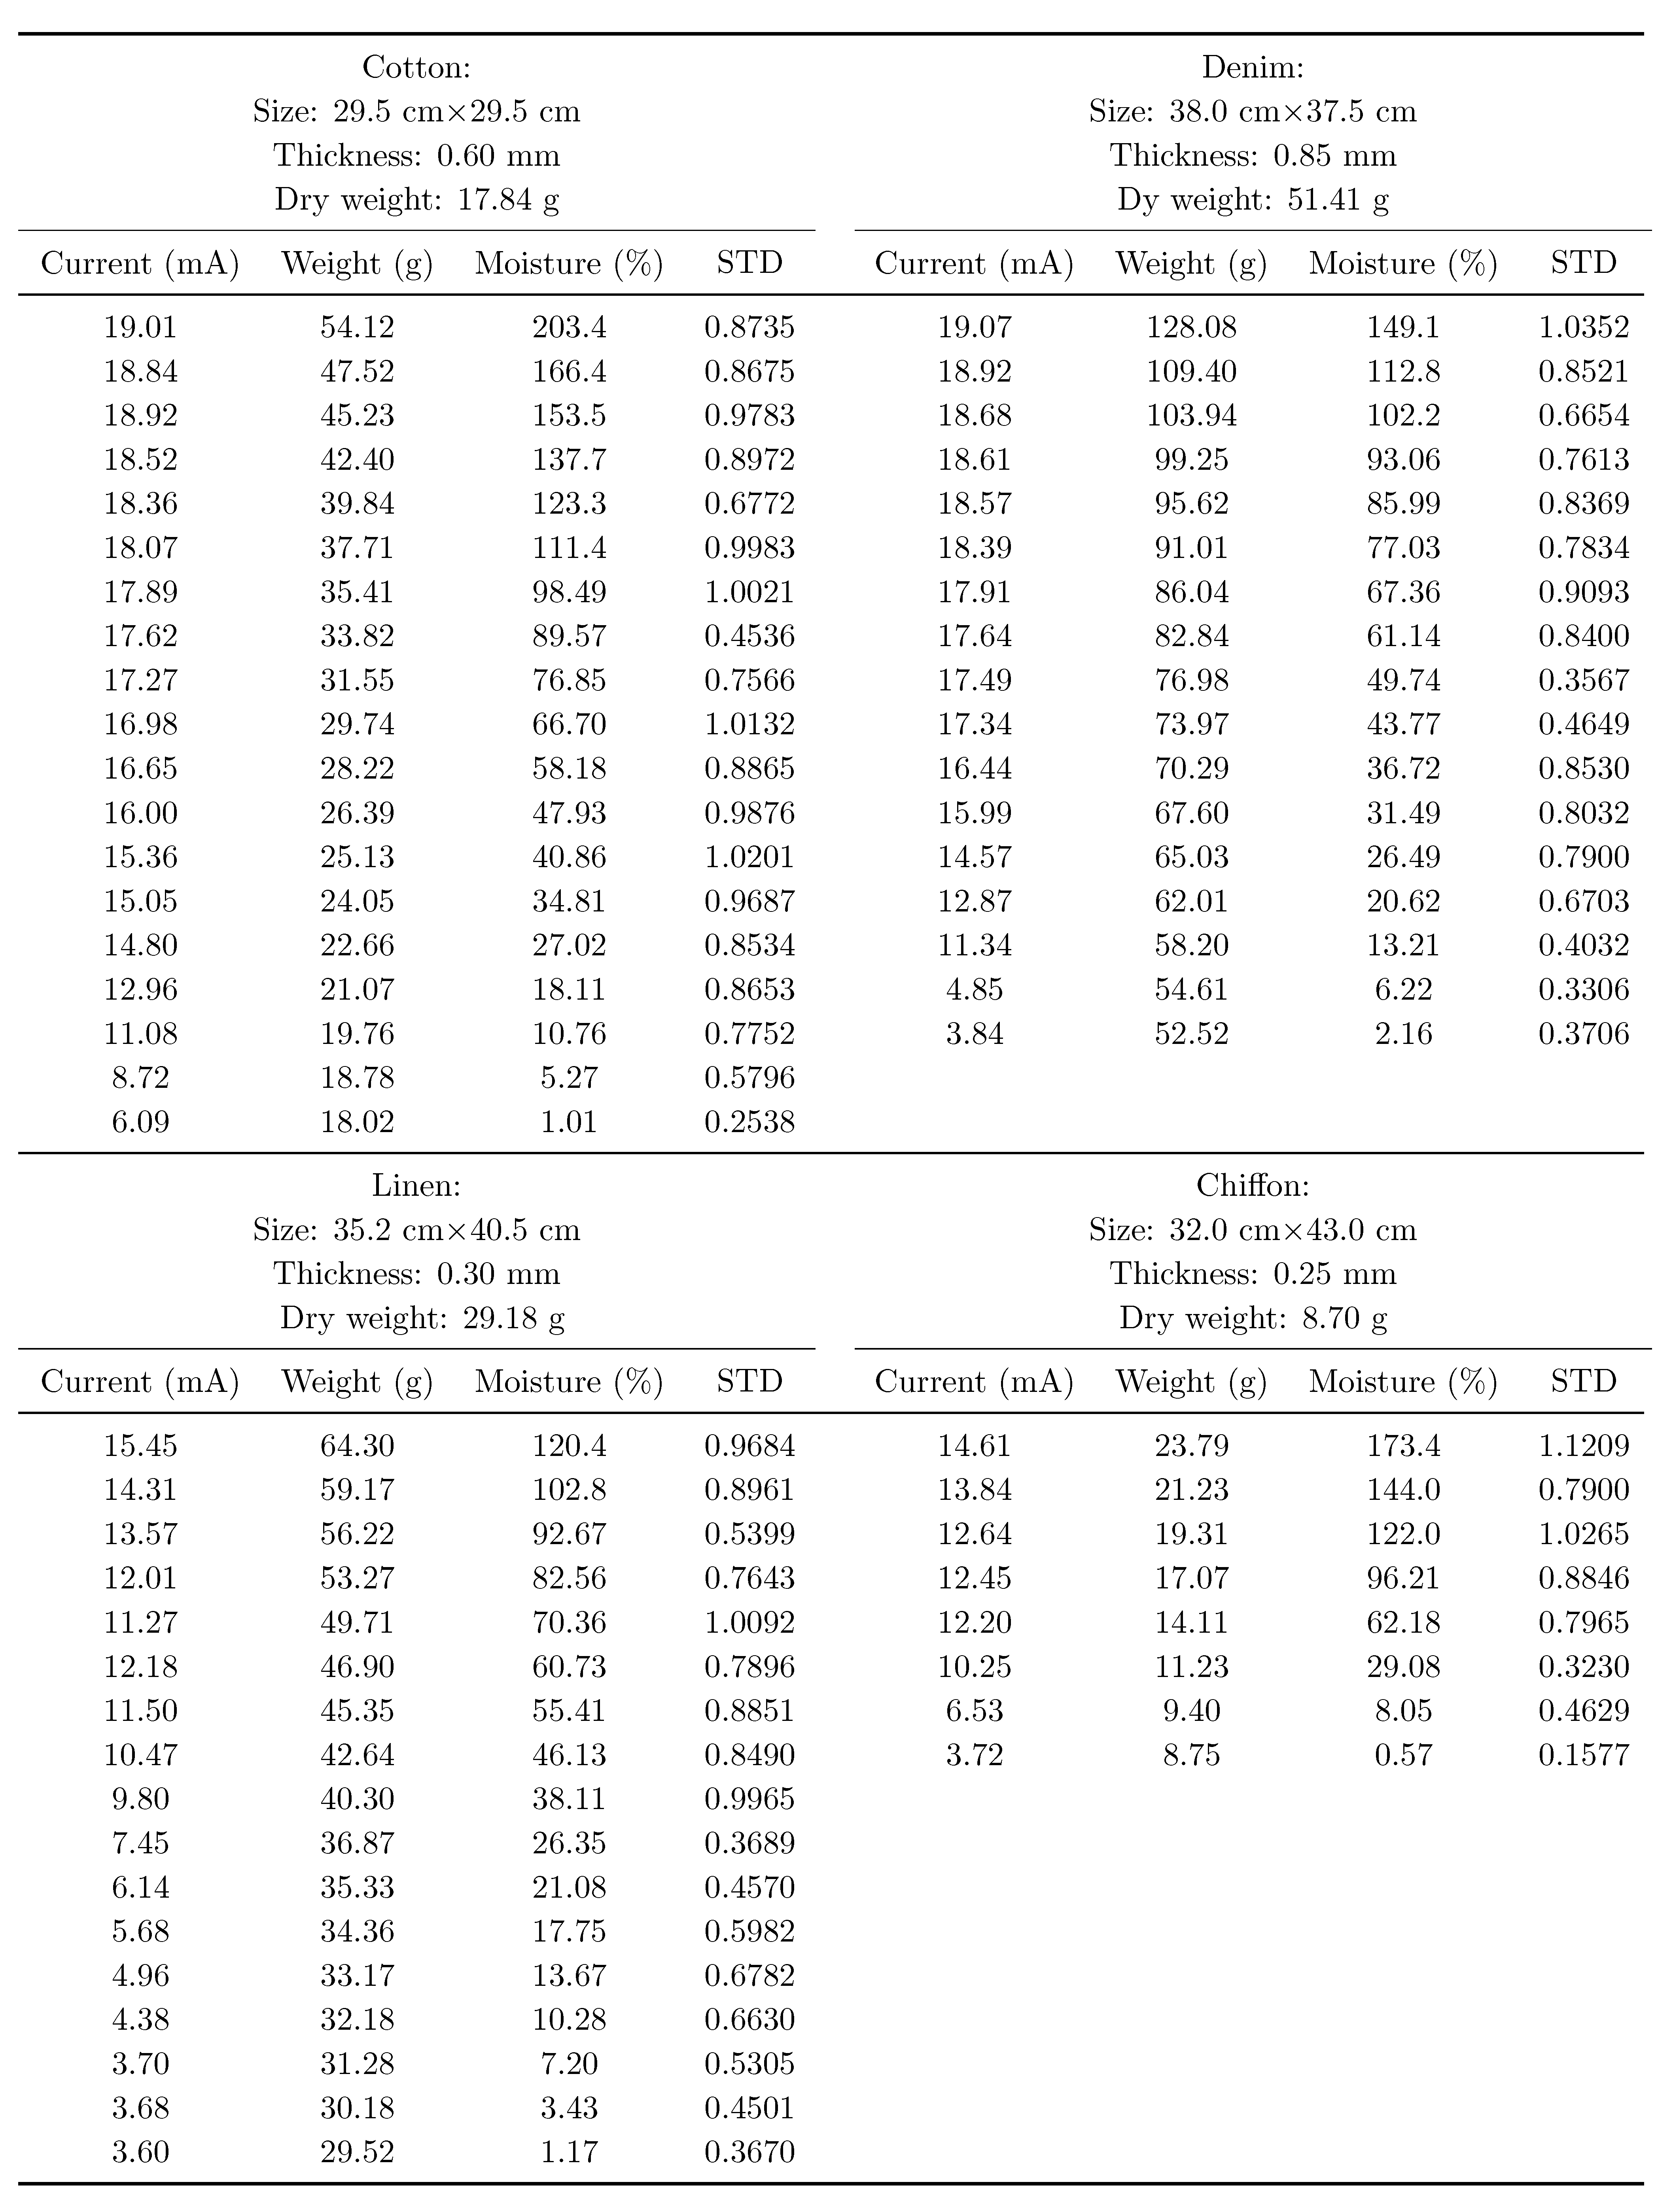
Experimental data and STD Errors are shown in Table 2.
Table 2.
The corresponding output current when the moisture content of fabric changes (Mean+STD).
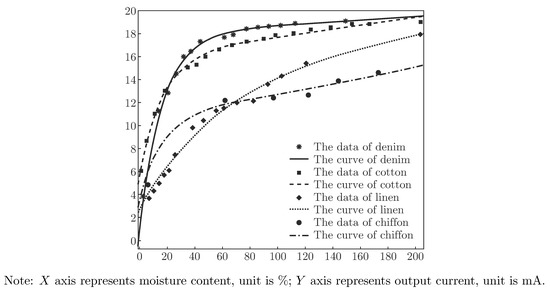
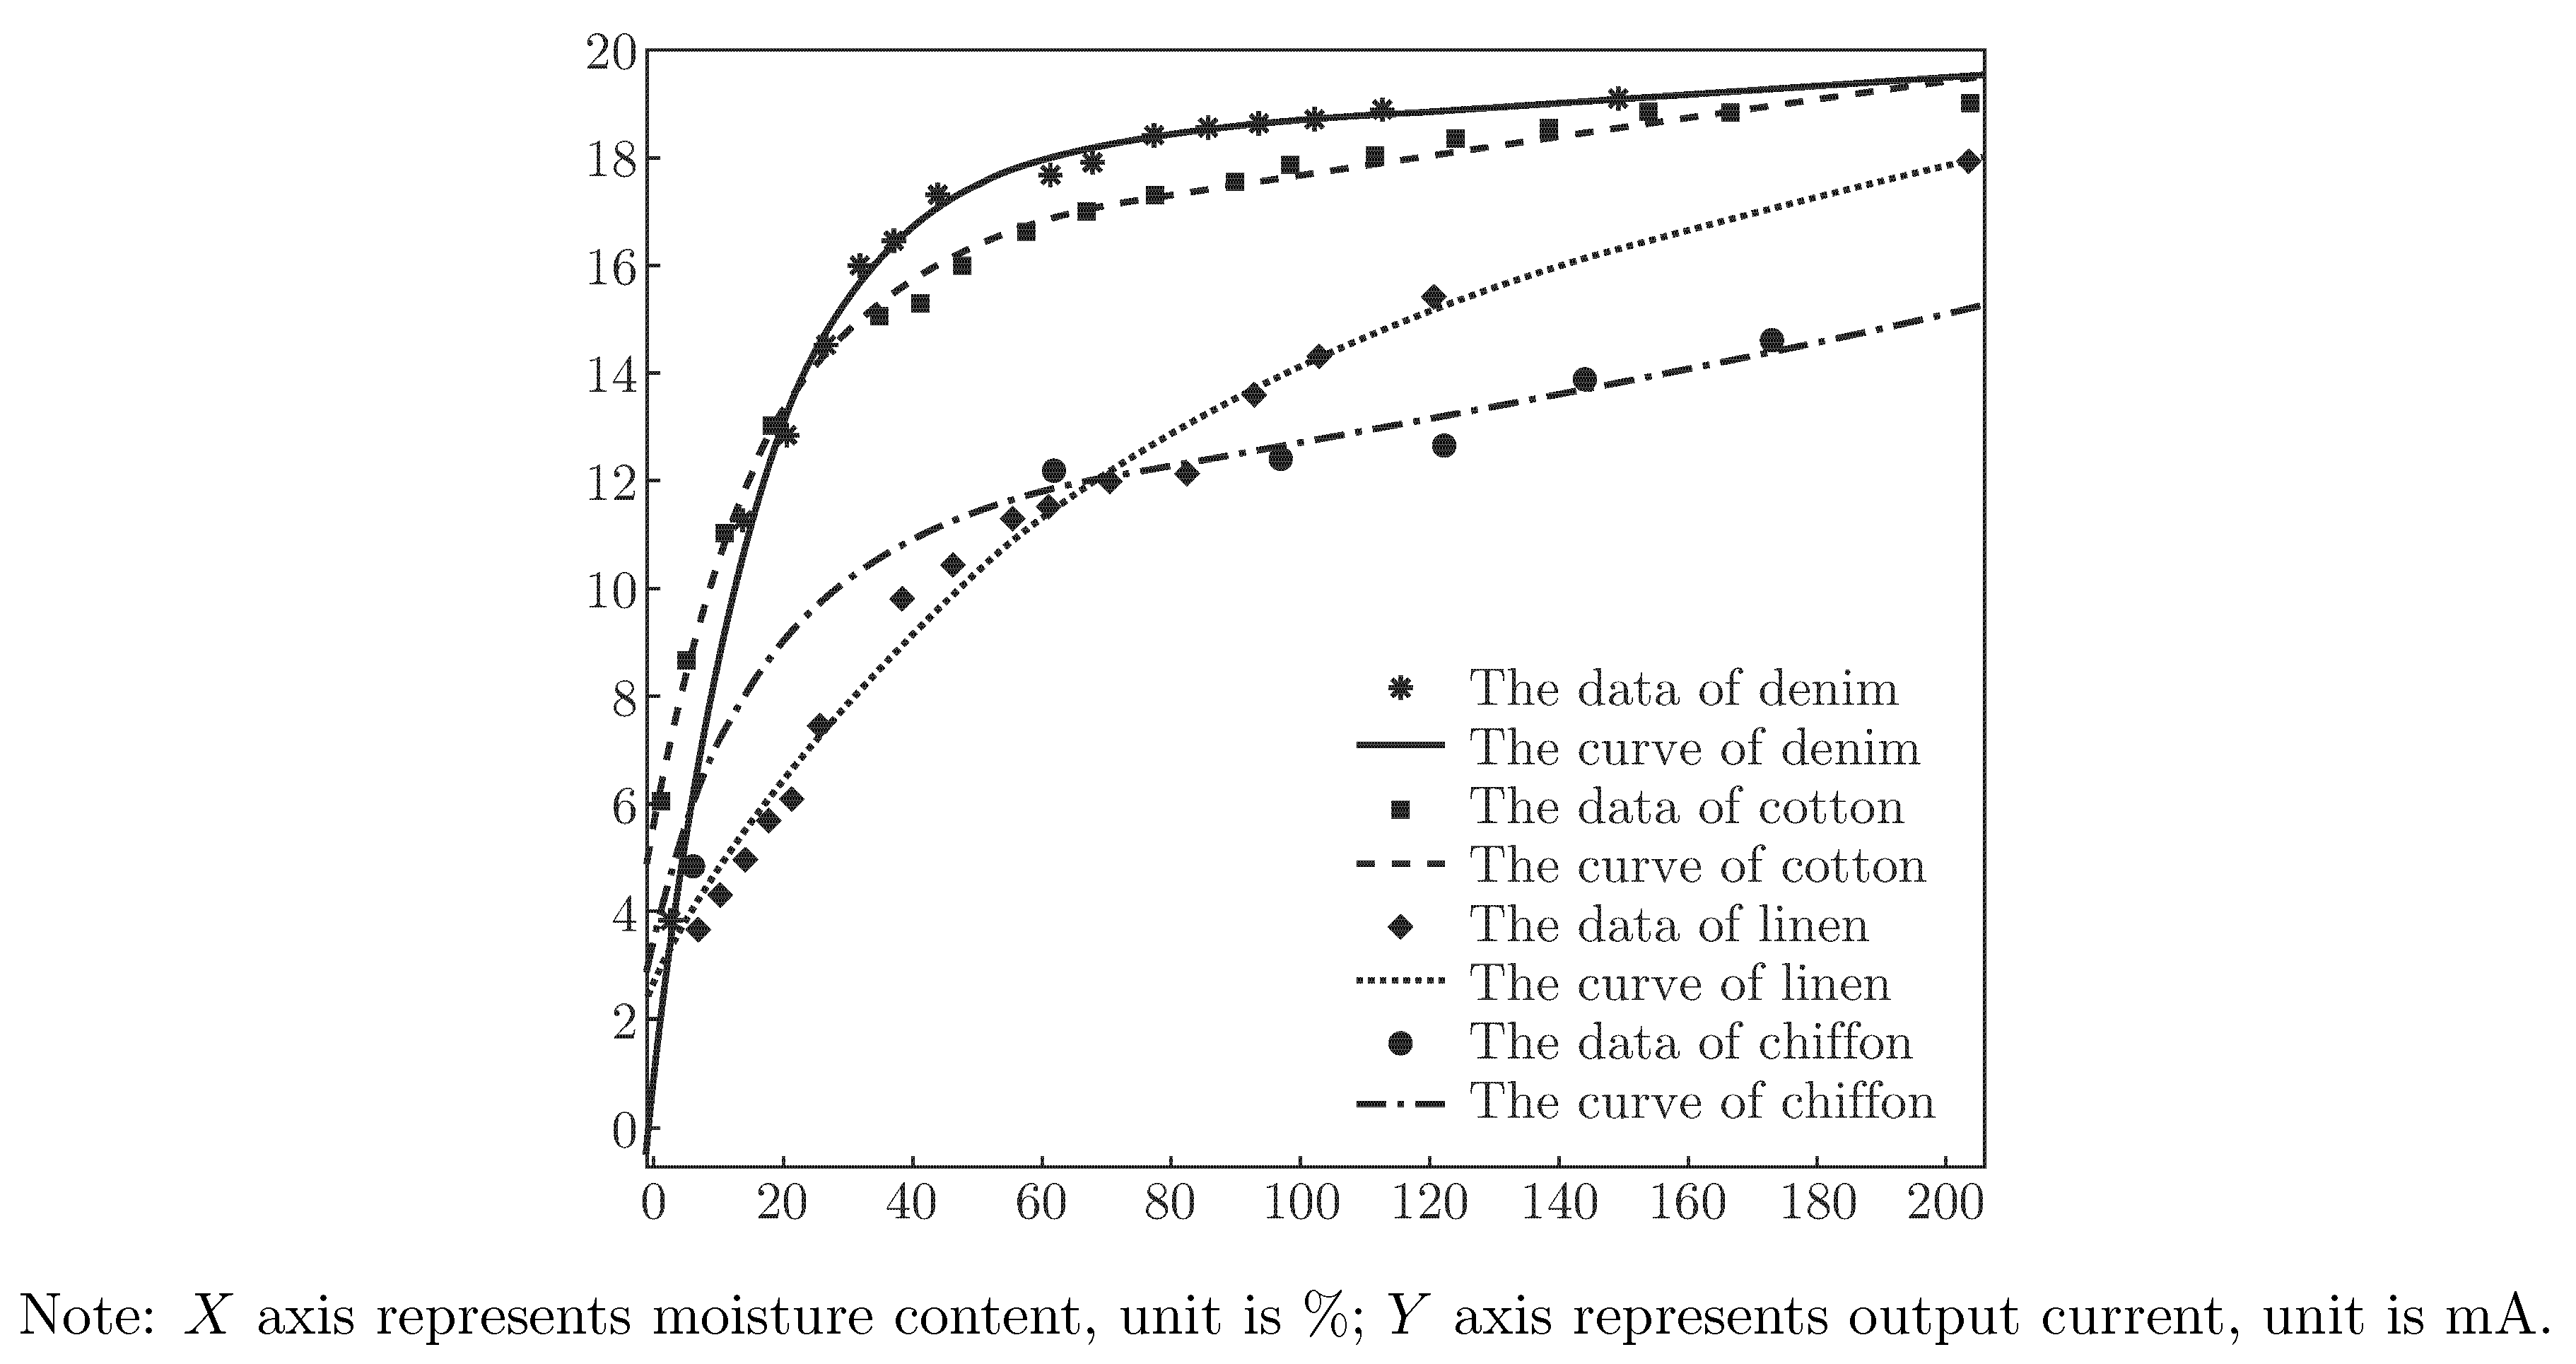
According to the data in Table 2, the corresponding output current of various materials in different moisture content is shown in Figure 9. The corresponding function of fitted curve is shown in formula (18), and the corresponding coefficients of various materials are listed in Table 3.
Figure 9.
The corresponding output current curve of various materials.
Table 3.
The corresponding coefficients of various materials.
Curve fit can be used as a function through which fabric moisture content can be calculated by the corresponding output current. It can simplify the calculation procedure and reduce the amount of calculation. Thus, on the one hand, it can reduce the workload of the control chip; on the other hand, it can improve the response speed of the control chip. The circuit is designed as acquisition circuit of moisture content online testing system, building foundation for the realization of fabric moisture content real-time detection.
The additional would be got from Figure 9 shown as follows: (1) Fabric conductivity has a great relationship with its texture. The max ordinates of cotton curve and denim curve are larger, indicating a good conductivity; in contrast, linen and chiffon are less conductive.
(2) Fabric absorbent has a terrific relationship with fabric texture [16,17]. From the corresponding max horizontal of each curve, it can be understood that cotton and chiffon have strongest absorbent, followed by denim, and linen’s is weakest.
3.4. Error Analysis
After system set-up and materials data fitting are finished, the fabric moisture content measured by circuit designed is compared with the result measured by oven method. Specific date is shown in Table 4.
Table 4.
The data of error test.
From the data in Table 4, it can be seen that the system error is small; the relative error is between 0.2% and 0.6%, which is less than fabric moisture content detection index (1%). Simultaneously, it can be got that the error in the beginning and end of measurment is larger than others. Analysis is as follows: Moisture content is defined as the ratio of the weight of the water that fabric absorbs and the weight of dry fabric, the water includes liquid water in the fabrics and the water absorbed into the fibers [6]. And the changes in resistance mainly depend on the weight of liquid water in the fabrics. However, too much liquid attached to the fabric surface, easily leads to a short circuit between the collections terminals, making the moisture content measured large. Similarly, when only the water inside the fiber is left, because of intermittent distribution of water inside the fibers, likely to cause an open circuit, leading to the moisture content measured is smaller than the true value [9].
Also other factors are: (1) When circuit is designed, more emphasis is put on the accuracy in the main measurement ranges than that in the edge.
(2) The changes of temperature affect the measurement result [18,19].
(3) The absorption capacity of fabric in the air varies with different moisture content. The speed of releasing into the air or absorbing from the air changes during the measurement, which affects the measurement [18,20].
(4) The output of circuit is affected by unstable power voltage.
During building the moisture content online detection system, the impact of Factors influencing the result described above can be minimized, and the error is reduced. The first three reasons above can be compensated by means of algorithms to correct measurement results, reduce measurement error. The fourth reason needs to build the hardware circuit ensure power supply voltage is stable. So, the circuit designed in the paper can be used as acquisition circuit of fabric moisture content online detection system.
When the circuit is designed, the moisture content, i.e. instant water content is what the method mainly concerns. So it must be able to measure any possible moisture value of fabric. Taking the large range of fabric into account, the range of its measurement should satisfy both conditions that the fabric is over dried and that the fabric absorbs enough water. If applied to measure equilibrium regain, the parameter of the circuit designed should be adjusted to fit the requirement of equilibrium regain measurement.
4. Conclusion
In this paper, the improved Wheatstone bridge is applied to acquire the changing signal of fabric moisture content indirectly by measuring fabric resistance and output industry current signal after conversion and conditioning. The following conclusions are drawn after a great deal of theoretical studies and experimental verification.
(1) The circuit designed in this paper can effectively measure resistance changes of fabric in different moisture conditions, indicating that the model built is correct and can meet the needs of fabric moisture content online detection.
(2) The function curve indicting the relationship between fabric moisture content and output current signal is fitted, through which fabric moisture content can be calculated directly by output current, instead of calculating fabric resistance first, then continuing to calculate fabric moisture content by its resistance. Thus, it simplifies calculating steps and reduces computational workload, which is helpful in improving response speed of detection system.
(3) Different fabric texture density affects the final result of measurement, namely, materials is influential on the measurement of moisture content.
(4) After debugging, circuit is confirmed to be of nice usability, operation ability and real-time. And results standardized by oven method holds small errors.
Acknowledgments
The authors wish to acknowledgement the financial fund supported by non-contact measurement of fabric moisture content online technology research and product development projects of Shaanxi Science and Technology Department (Project No. 2011K07-25), and non-contact measurement of the moisture content of the fabric system project of Shaanxi Education Department (Project No. 2011JG18).
References
- Fusan, G. Moisture regain control of the sized yarn; Tianjin Polytechnic University, 2006. [Google Scholar]
- Lu, B.; Qin, B.X.; Wang, H.B. Error analysis of detection of cotton regain by oven method and electrical devices. China Fiber Insp. 2009, 12, 68–70. [Google Scholar]
- Jing, J.F.; Sun, L.; Li, P.F. Method for fabric moisture content measurement based on microwave technique. J. Text. Res. 2012, 09, 61–65. [Google Scholar]
- Weder, M.; Brihwiler, P.A.; Laib, A. X-ray tomography measurements of the moisture distribution in multilayered clothing systems. Text. Res. J. 2006, 76(1), 18–26. [Google Scholar] [CrossRef] [Scilit]
- Zhang, K.Y. A new system for moisture regain online inspection of sized yarn; Donghua University, 2005. [Google Scholar]
- Huang, Y. Online moisture regain control system; Zhejiang University, 2010. [Google Scholar]
- Zhou, L.; Feng, X.; Du, Y.; Li, Y. Characterization of liquid moisture transport performance of wool knitted fabrics. Text. Res. J. 2007, 77(12), 951–956. [Google Scholar] [CrossRef] [Scilit]
- Du, Y.; Li, J. Dynamic moisture absorption behavior of polyester-cotton fabric and mathematical model. Text. Res. J. 2010, 80(17), 1793–1802. [Google Scholar] [CrossRef] [Scilit]
- Sengupta, S.; Sengupta, A. Electrical resistance of jute fabrics. Indian J. Fibre Text. Res. 2012, 37(1), 55–59. [Google Scholar]
- Satyanarayana, K.G.; Sukumaran, K.; Kulkarni, A.G.; Pillai, S.G.K.; Rohatgi, P.K. Fabrication and properties of natural fibre-reinforced polyester composites. Composites 1986, 17(4), 329–333. [Google Scholar] [CrossRef] [Scilit]
- Zaman, H.U.; Khan, A.H.; Hossain, M.A.; Khan, M.A.; Khan, R.A. Mechanical and electrical properties of jute fabrics reinforced polyethylene/polypropylene composites: role of gamma radiation. Polym.-Plast. Technol. Eng. 2009, 48(7), 760–766. [Google Scholar] [CrossRef] [Scilit]
- Chang, J.S.; Shi, Y.W.; Chang, R. Detection and conversion technology (third edition); Machinery Industry Press: Beijing, 2009. [Google Scholar]
- Qiu, G.Y. Circuit principle (fifth edition); Higher Education Press: Beijing, 2006. [Google Scholar]
- Zeng, J.R. Method of measuring high-value resistor based on the Wheatstone bridge. J. Yibin Collage 2006, 06, 105–106. [Google Scholar]
- Hu, J.; Li, Y.; Yeung, K.W.; Wong, A.S.W.; Xu, W. Moisture management tester: a method to characterize fabric liquid moisture management properties. Text. Res. J. 2005, 75(1), 57–62. [Google Scholar] [CrossRef] [Scilit]
- Hasan, M.M.B.; Calvinmotes, A.; Synytska, A.; Dutschk, V. Effects of topographic structure on wettability of differently woven fabrics. Text. Res. J. 2008, 78(11), 996–1003. [Google Scholar] [CrossRef] [Scilit]
- Xu, D.H.; Cheng, J.X.; Zhou, X.H. A model of heat and moisture transfer through the parallel pore textiles. J. Fiber Bioeng. Inform. 2010, 3(4), 250–255. [Google Scholar] [CrossRef] [Scilit]
- Zhua, C.; Takaterab, M. Change of temperature of cotton and polyester fabrics in wetting and drying process. J. Fiber Bioeng. Inform. 2012, 5(4), 433–446. [Google Scholar] [CrossRef] [Scilit]
- Wu, H.; Fan, J. Study of heat and moisture transfer within multi-layer clothing assemblies consisting of different types of battings. Int. J. Therm. Sci. 2008, 47(5), 641–647. [Google Scholar] [CrossRef] [Scilit]
- Su, C.I.; Fang, J.X.; Chen, X.H.; Wu, W.Y. Moisture absorption and release of profiled polyester and cotton composite knitted fabrics. Text. Res. J. 2007, 77(10), 764–769. [Google Scholar] [CrossRef] [Scilit]

© 2014 Textile Bioengineering and Informatics Society. This article is an open access article distributed under the terms and conditions of the Creative Commons Attribution (CC BY) license (https://creativecommons.org/licenses/by/4.0/).