


Abstract
In recent years, more and more researchers presented their graphic representations for protein sequence. Here, we present a new 2D graphic representation of protein sequence based on four physicochemical properties of 20 amino acids. By this graphic representation we define a distance calculation formula to quantificationally calculate the similarity degree of different protein sequences. Then we apply the proposed graphical curve and new distance in the similarity/dissimilarity comparison of 10 ND5 proteins and the protein sub-cellular localization prediction about two common test datasets, ZD98 and CL317. The results show the proposed method is easy and effective.
1. Introduction
As bio-molecular sequences are rapidly growing, it is of great importance for people to reveal their meaning of life by analyzing these bio-molecular data. Now, people have developed many information methods to research the huge amounts of bio-molecular sequences. The graphic representation of biology sequences such as DNA or protein sequence has been a useful method to get important information from the primary sequences.
In 1983 [1], Hamori first tried to use graphical technique to research and analyze the DNA sequences. Thereafter, many researchers followed this research method and proposed some other graphic representations of DNA sequences [2,3,4,5,6,7,8,9,10,11]. For instance, Randić [7,8,9], Qi [5] and Yuan [10] introduced 2D or 3D graphic representations of DNA sequences. Liao [11] and Chi [3] presented higher dimensional methods to graphically represent DNA sequences. Moreover, researchers like Randić [7,8,9] presented some graphic representations to analyze protein sequences. Considering the physicochemical properties of amino acids Yao [12] proposed a graphical method based on the PKα values of COOH and of the 20 amino acids. Xiao [13] and Wu [13] also developed their 2D graphic representations considering the physicochemical properties of 20 amino acids.
An important application of the proposed graphic representations of DNA or protein sequences is to get the similarities or dissimilarities among different biological sequences but not considering the alignment [12]. Based on the graphic representation of sequence, some mathematical descriptors like E, M/M, L/L [7,8,14] are developed to quantificationally compute the evolution distance among sequences. Recently, Liao et al. [15] proposes a new 2D graphic representation. They defined a distance computing formula to calculate the similarities or dissimilarities among different protein sequences. Then the method was used for protein sub-cellular localization prediction and got satisfactory results.
In this paper we propose a new graphic representation of protein sequences considering four main physicochemical properties of amino acids. According to the graphic representation we give a 20D characteristic vector to represent the corresponding protein sequence. The vector method can deal with sequences with different length. Then we use the characteristic vector extracted from graphic representation of protein sequence to analyze the similarities or dissimilarities of ten ND5 protein sequences. The test results show that the proposed method is a useful method in finding the similarities or dissimilarities among different protein sequences. Then, we utilized the similarity evaluation ability of the proposed method to take a prediction of sub-cellular localization of proteins. It is well-known that if two proteins are more similar, the two proteins are more likely to exist in the same sub-cellular location. We take two test datasets, the apoptosis proteins ZD98 and CL317. The prediction accuracy in jackknife test shows that the proposed method is effective on protein sub-cellular localization prediction.
2. Novel 2D Graphic Representation of Protein Sequences
Although proteins have many types and are different in nature and functions, they are composed of 20 native amino acids, which everyone knows have a variety of properties. People can study the structures and functions of proteins by these properties of amino acids. Some graphic representations of protein sequence are presented according to the physicochemical properties of amino acids. For example, Randić in [16] proposed a 2D graphic representation of protein. This method considered a pair of physicochemical properties of 20 amino acids, the pKa values of —NH3 and —COOH. Yao et al. in [12] also proposed a dynamic 2D graphic representation of protein sequence based on the pKa values. In this paper, we present a novel 2D graphic representation based on four main physicochemical characteristic properties of 20 amino acids. They are relative molecular mass, isoelectric point, hydropathy index and melting point. The relative molecular mass can reflect the composition of the side chain. The isoelectric point is the pH value at which a particular surface or molecule carries no net electrical charge. The hydropathy index is a number representing the hydrophobic or hydrophilic properties of side chain of an amino acid. The melting point of amino acid is considered to be that temperature at which its crystalline substance becomes unreliable. The four physicochemical characteristic properties are essential for the protein structure and the catalytic activities of enzymes. The detailed data of the four physicochemical properties are listed in Table 1.
Table 1.
Four main physicochemical properties associated with the 20 basic Amino acids.
Observing Table 1, we find that similar amino acids have similar physicochemical properties. To clearly know the similarities/dissimilarities among amino acids, we take a similarity analysis of the 20 amino acids based on the four main physicochemical properties. However, the different physicochemical property values in Table 1 have different orders of magnitude. The different magnitude is likely to take bad effect on the similarity analysis of the amino acids. To eliminate the negative we firstly normalize each property value of 20 amino acids into the range from −1 to 1. The normalization formula is as follows,
where a_mean is the average value of the corresponding property, and a_var is the variance of this property. The a is the original value of the property of each amino acid, and a′ is the normalized value.
a′ = (a − a_mean)/a_var
Then we can construct a characteristic vector to represent the 20 amino acids, consisting of the four normalized property values by the formula (1). Now, let V1 and V2 denote the characteristic vectors of two amino acids, respectively. Let C(V1,V2) denote the correlation between two amino acids. It is computed as the Cosine function of the angle of the two vectors V1 and V2,
The Cosine value of the angle is from -1 to 1 when the angle changes from 180° to 0°. To get a more clear description, we normalize the C(V1,V2) value to the range from 0 to 1. Then we define the distance Dis(V1,V2) between two amino acids as follows.
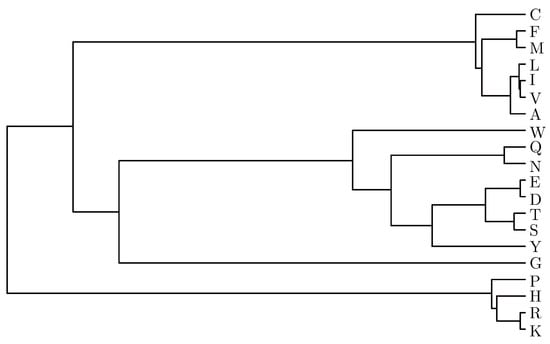
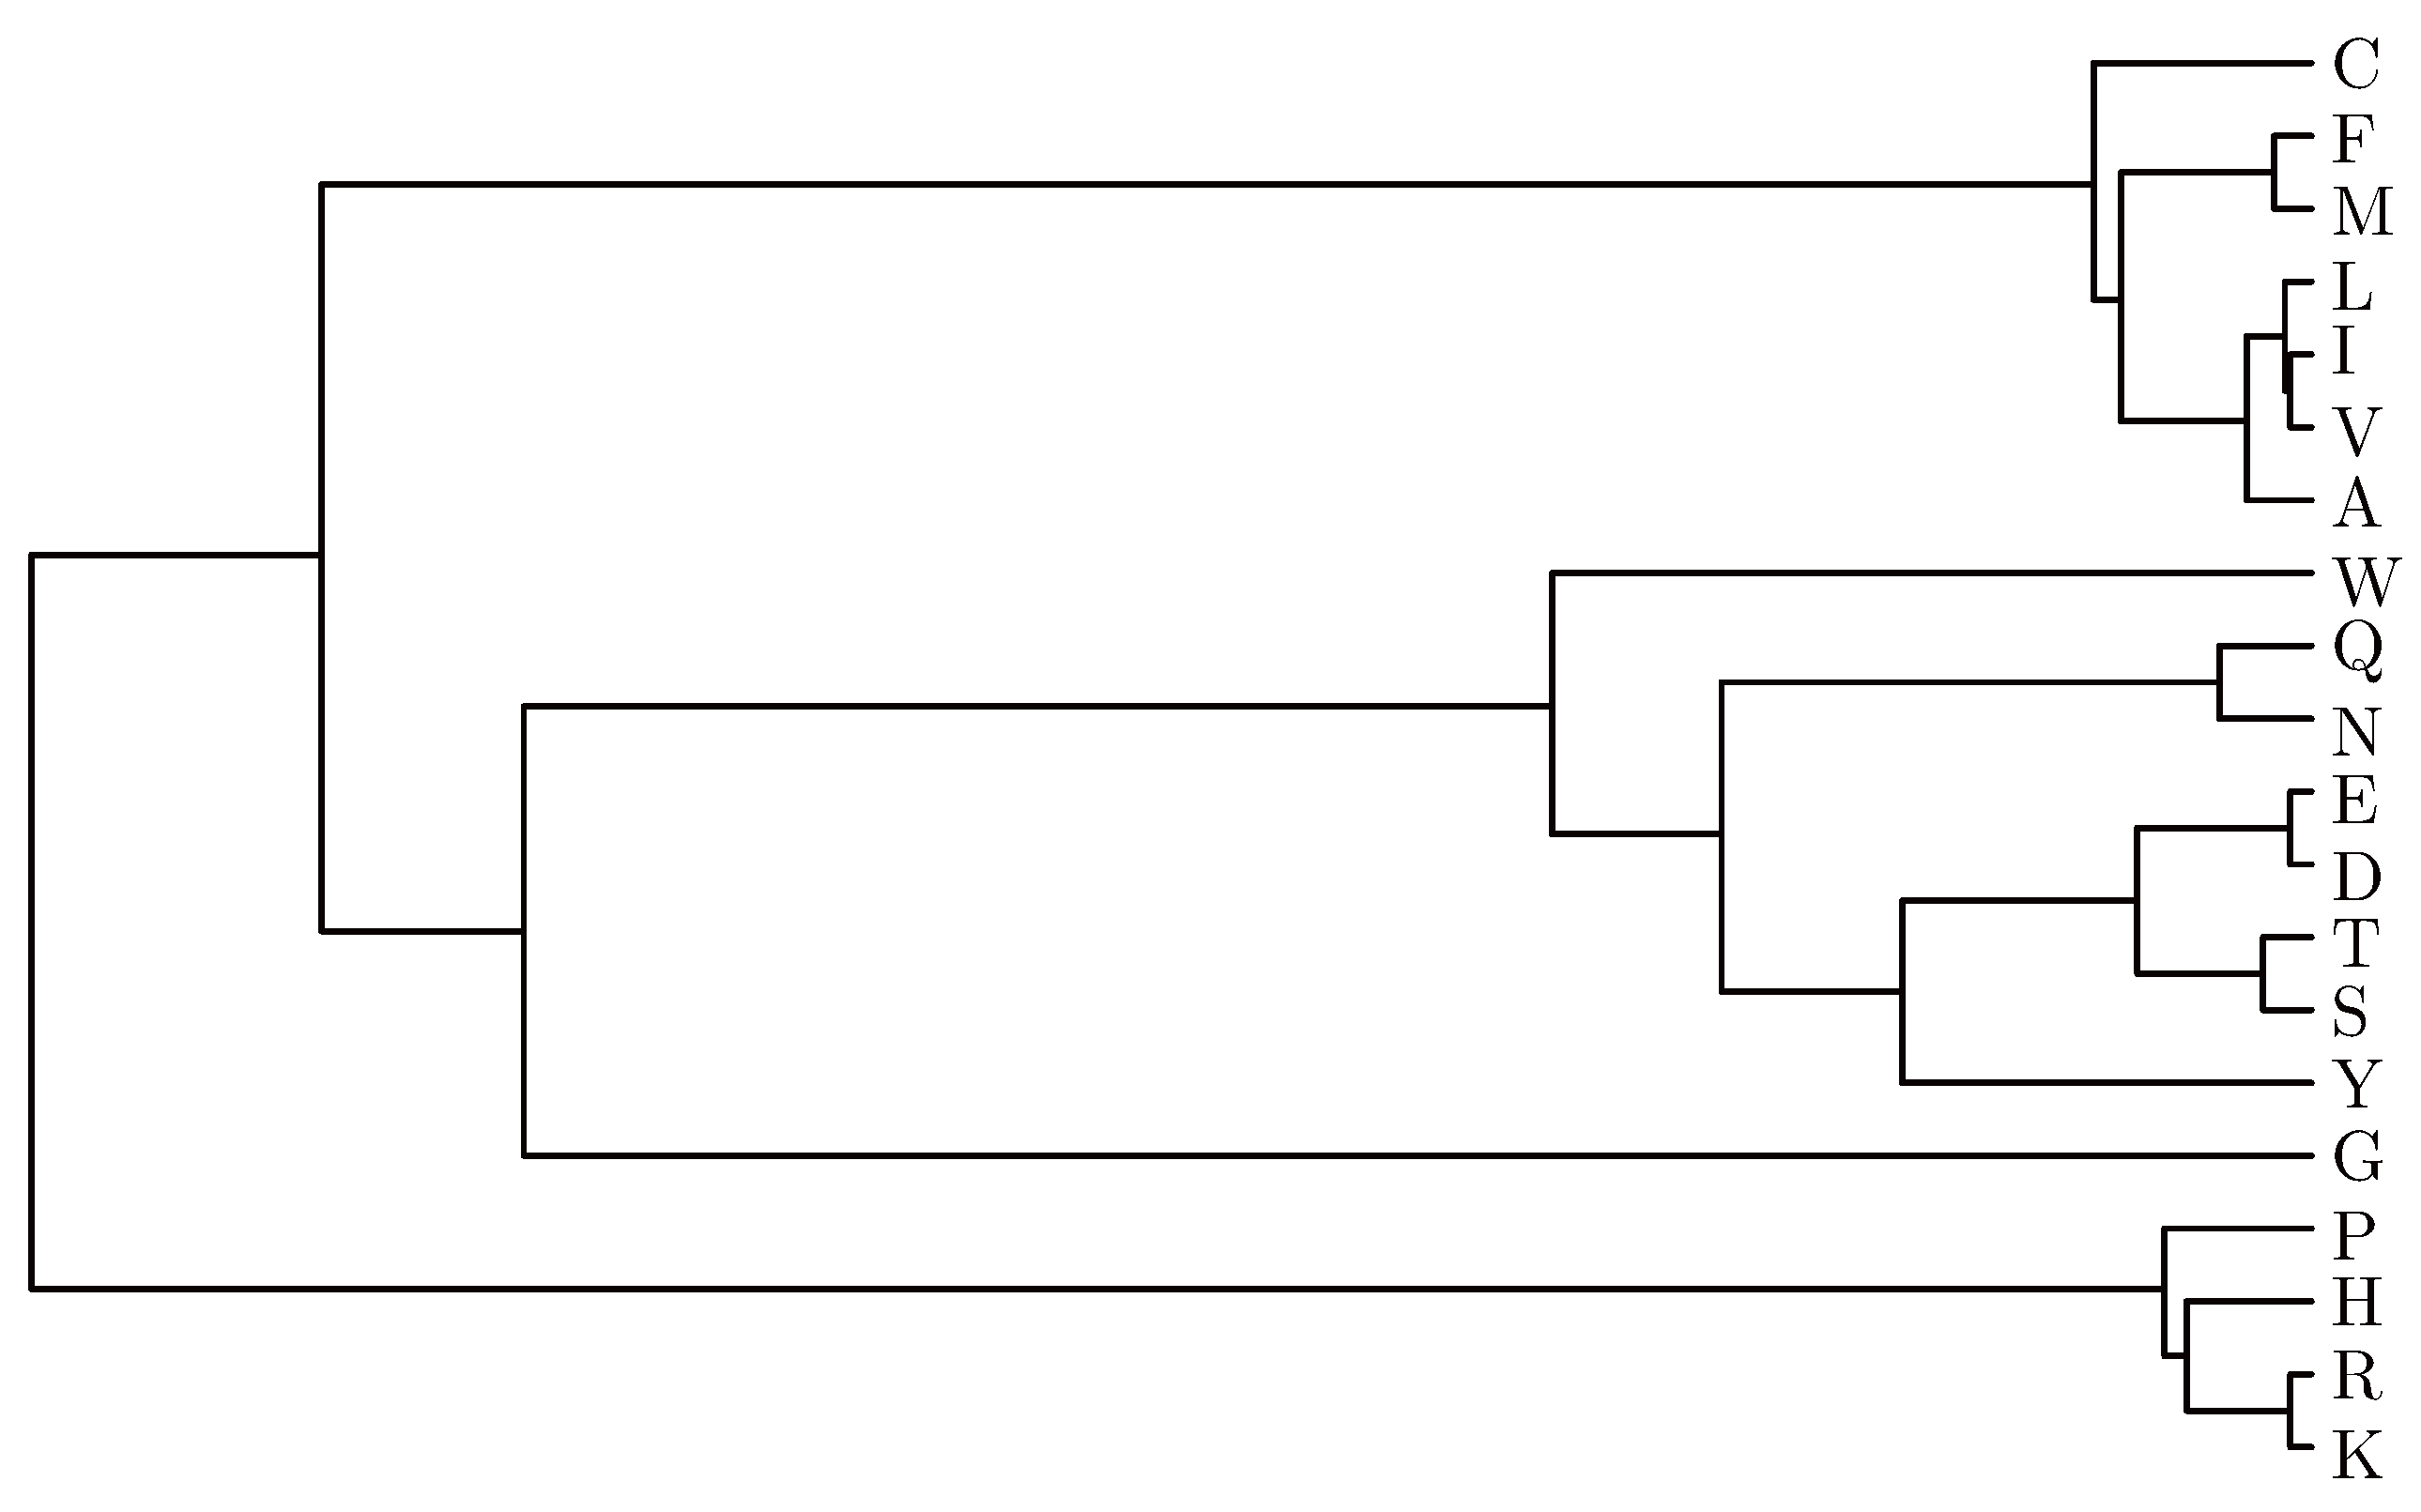
Then two amino acids are more similar if the distance D is smaller. Based on all the distances among 20 amino acids we use the linkage and dendrogram functions of Matlab to achieve their cluster analysis. The clustering result of the 20 amino acids is shown in Fig. 1.
Fig. 1.
Clustering results of the 20 amino acids considering the four main physicochemical properties.
Observing the Fig. 1, we can map the 20 amino acids into a series of numbers if we assign 1 to amino acid K,
The two amino acids with closer number have more similar physicochemical properties. Based on the number mapping we give a new graphic representation of protein sequence. Now let S be a protein sequence with N amino acids, S = s1s2,⋯, sN. For each amino acid si in S, according to the number mapping we can map it into the Cartesian coordinate system as follows,
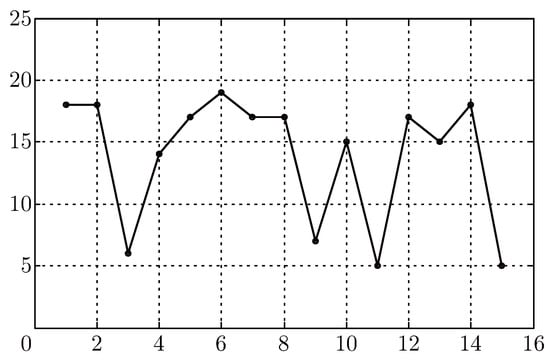
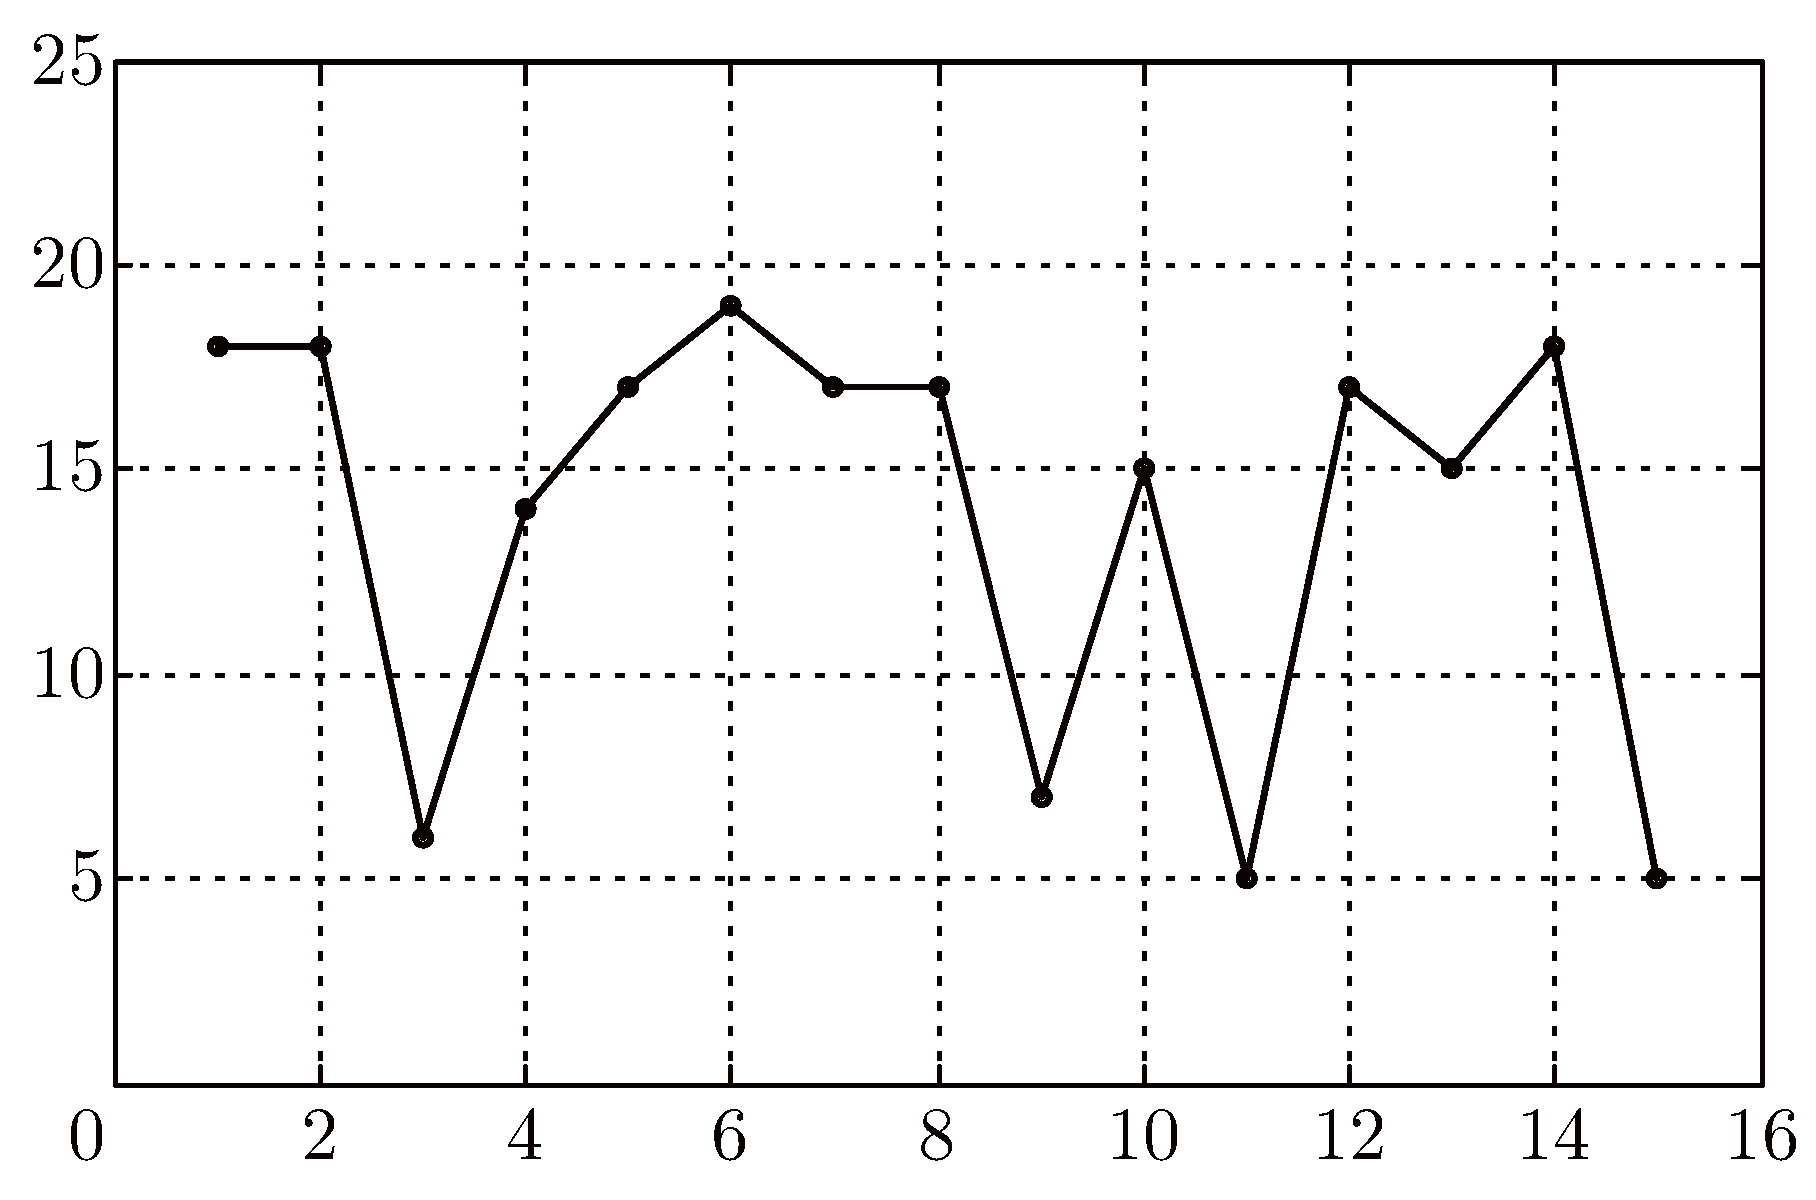
Then we can get N points in the 2D space. Connecting these points by the order of the amino acid in the protein sequence, we can obtain a graphic curve. The protein sequence S is represented by the graphic curve in a 2D space. Here we give a random sequence MMYALFLLSVGLVMG as an example to illustrate the proposed method. The 2D graphic curve of the random sequence is shown in Fig. 2.
Fig. 2.
The 2D curve of the sequence MMYALFLLSVGLVMG.
3. Similarities and Dissimilarities of Protein Sequences
Here we first consider two short segments of a protein of yeast Saccharomyces cerevisiae, which was gotten from the Handbook of Chemoinformatics by Randić [16]. As an example, we find some of characterization from the 2D graphic curve with the proposed approach. The two protein sequences are illustrated as follows,
Protein 1, WTFESRNDPAKDPVILWLNGGPGCSSLTGL
Protein 2, WFFESRNDPANDPIILWLNGGPGCSSFTGL
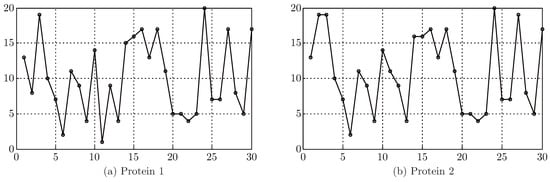
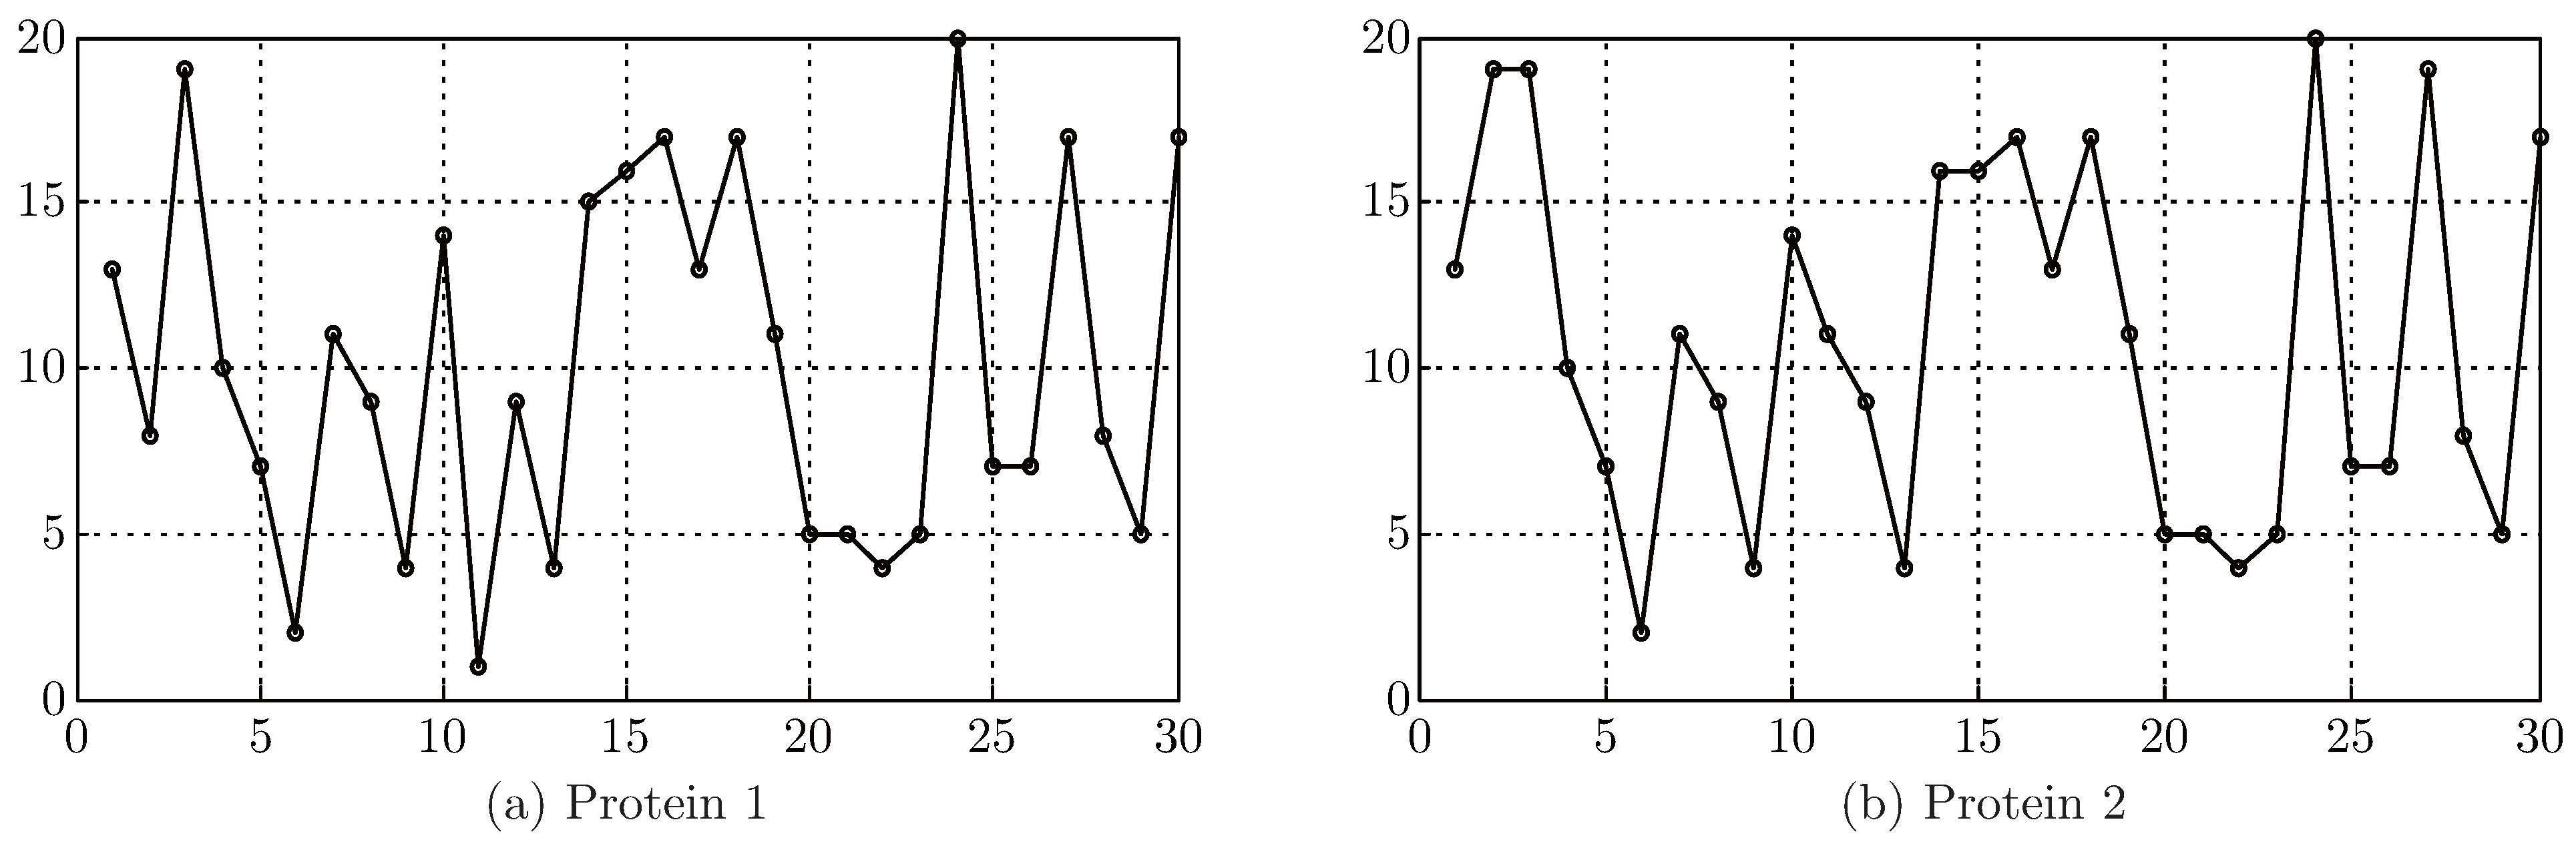
Fig. 3 (a) and (b) show the 2D graphic curves of Protein 1 and Protein 2, respectively. From Fig. 3 we can see that the two curves are very similar. It indicates that the two protein sequences may be highly similar.
Fig. 3.
The 2D graphic curves of Protein 1 and Protein 2.
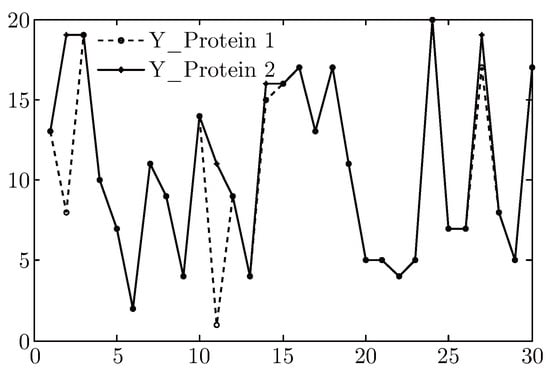
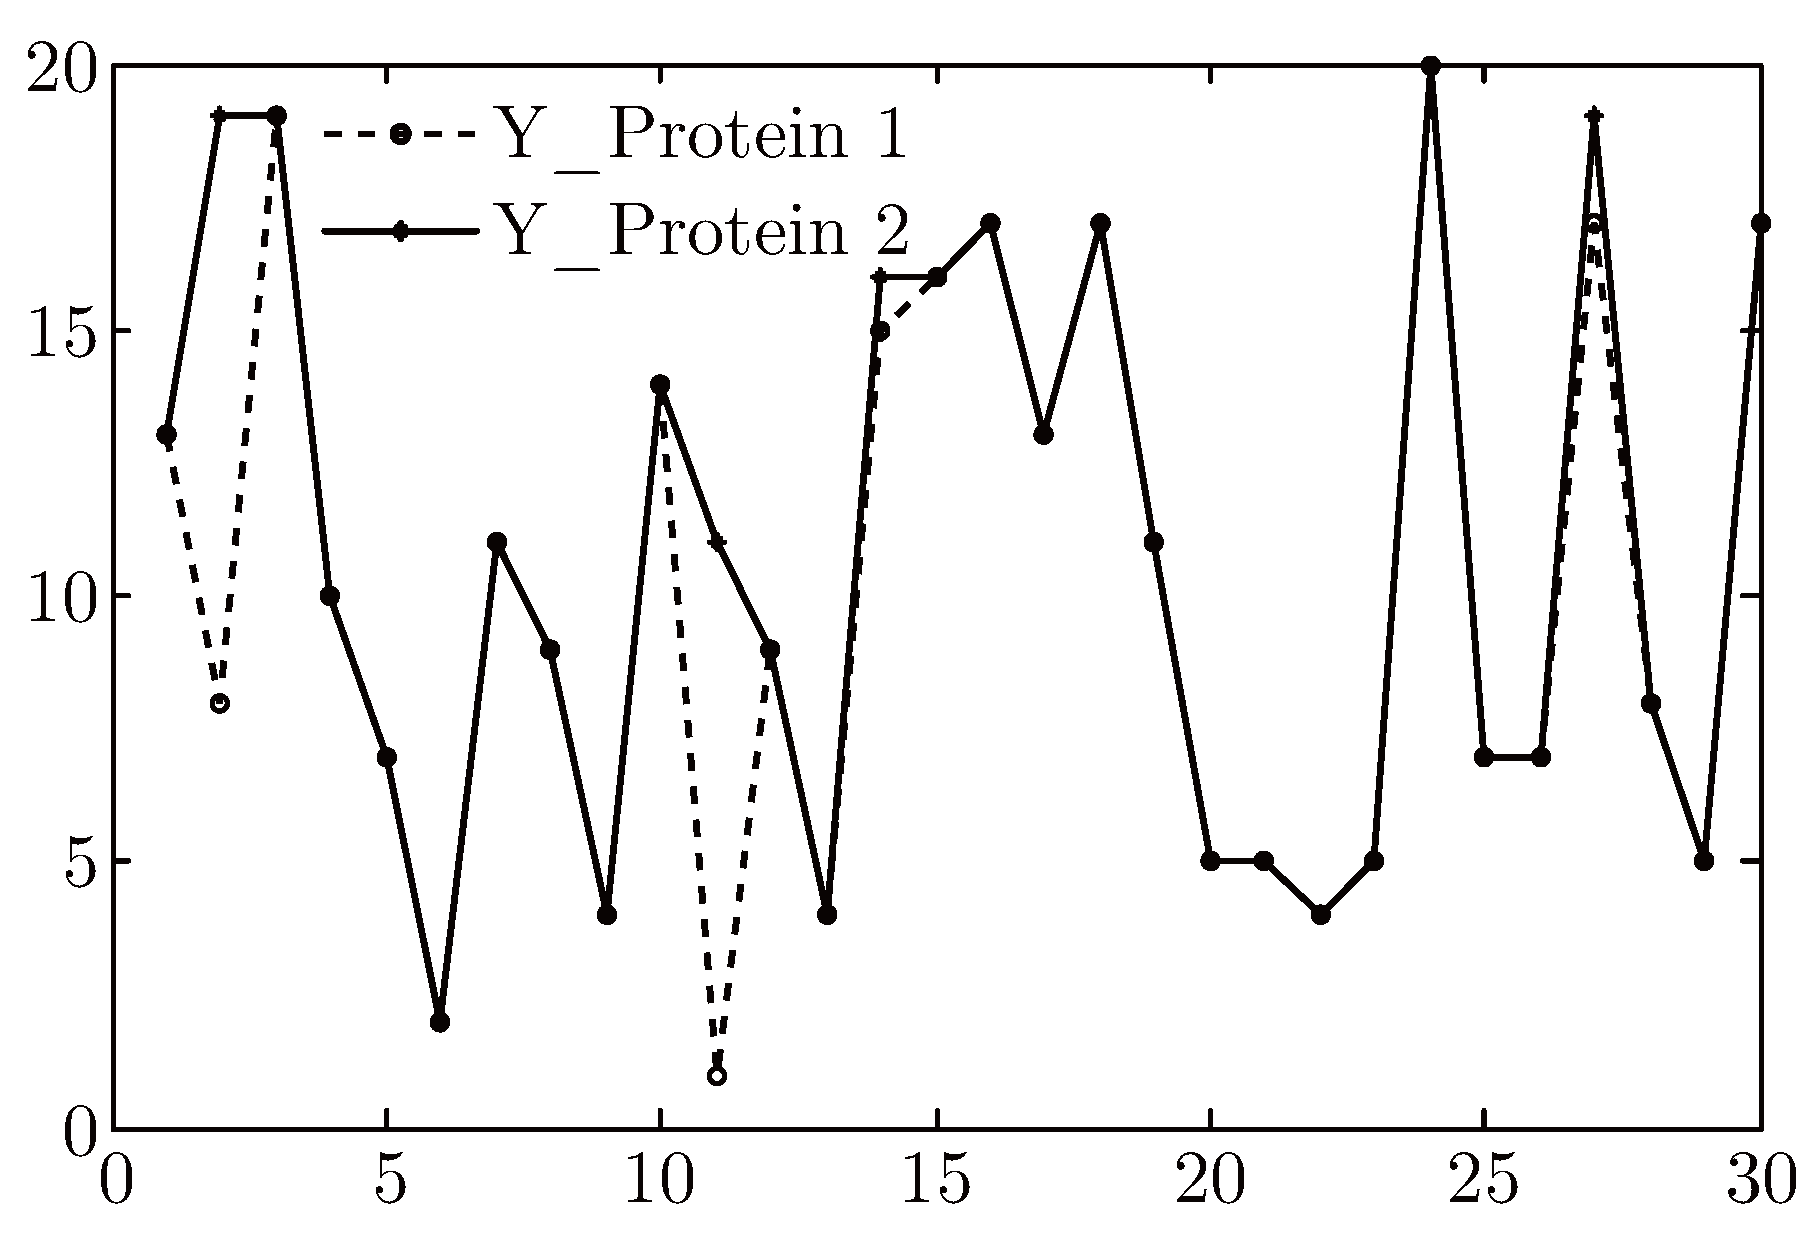
In Fig. 4 we show the Y-components of the 2D graphic representation of the two segments. From the figure, we can see that the amino acids corresponding to those points are different when the Y_ Protein 1 and Y_ Protein 2 are not overlapped closely. From the figure, we find that the two protein sequences are generally similar except at some special points. The two proteins are different at the 2-th, 11-th, 14-th, 27-th amino acids.
Fig. 4.
The Y-components of the graphic curves of Protein 1 and Protein 2.
In order to take quantitative similarities/dissimilarities analysis of protein sequences we define a new distance calculating method based on the proposed graphic curve. Observing the curve in Fig. 3 we find that different vertexes of the curve have different y-axis values. According to the number mapping of 20 amino acids there are 20 different y-axis values. Now let ki be the amount of y-axis value i. Then for a protein sequence S we can construct a 20D vector VS as follows,
VS = (k1,2k2,…,20k20)
Then we can define a new distance computing method based on the 20D vector derived from the proposed graphic curve. The calculating formula is as follows:
The S1 and S2 refer to any two protein sequences, respectively. The VS1(i) in the formula means the i-th element of the vector VS1 of the sequence S1. And the VS2(i) denotes the i-th element of the vector VS2 of the sequence S2.
Based on the 2D graphic representation and the distance calculation formula, we can analyze the similarity of protein sequences. The similarity analysis is based on the assumption that two protein sequences are similar if their computing distance has similar magnitude. That is to say, the smaller is the distance, the more similar are the two protein sequences. Now in order to test the utility of the proposed method, we use it to analyze ND5 proteins of the 10 species. These species include human, chimpanzee, Norway rat, house mouse, North American opossum, chicken, cattle, dog, fruit fly and zebrafish [17]. The computing distance matrix of 10 species is listed in Table 2. For convenience, all elements of the distance matrix are reduced 10000 times.
Table 2.
Distance matrix of ND5 proteins of 10 species.
From Table 2, we find that the pair human - chimpanzee has the smallest entries. So the ND5 protein of chimpanzee is the most similar to that of human than other species. The smaller distance shows the two sequences are more similar. What’s more, the largest entry comes from the pair of fruit fly - zebrafish. This reveals that there are significant dissimilarities between the two species. Similar results were obtained [17].
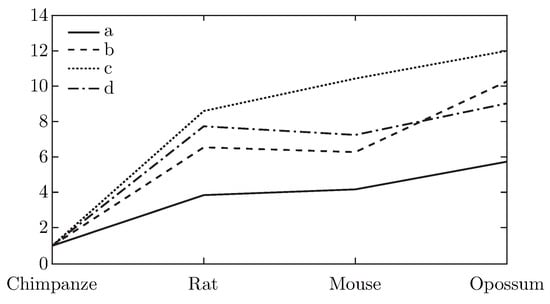
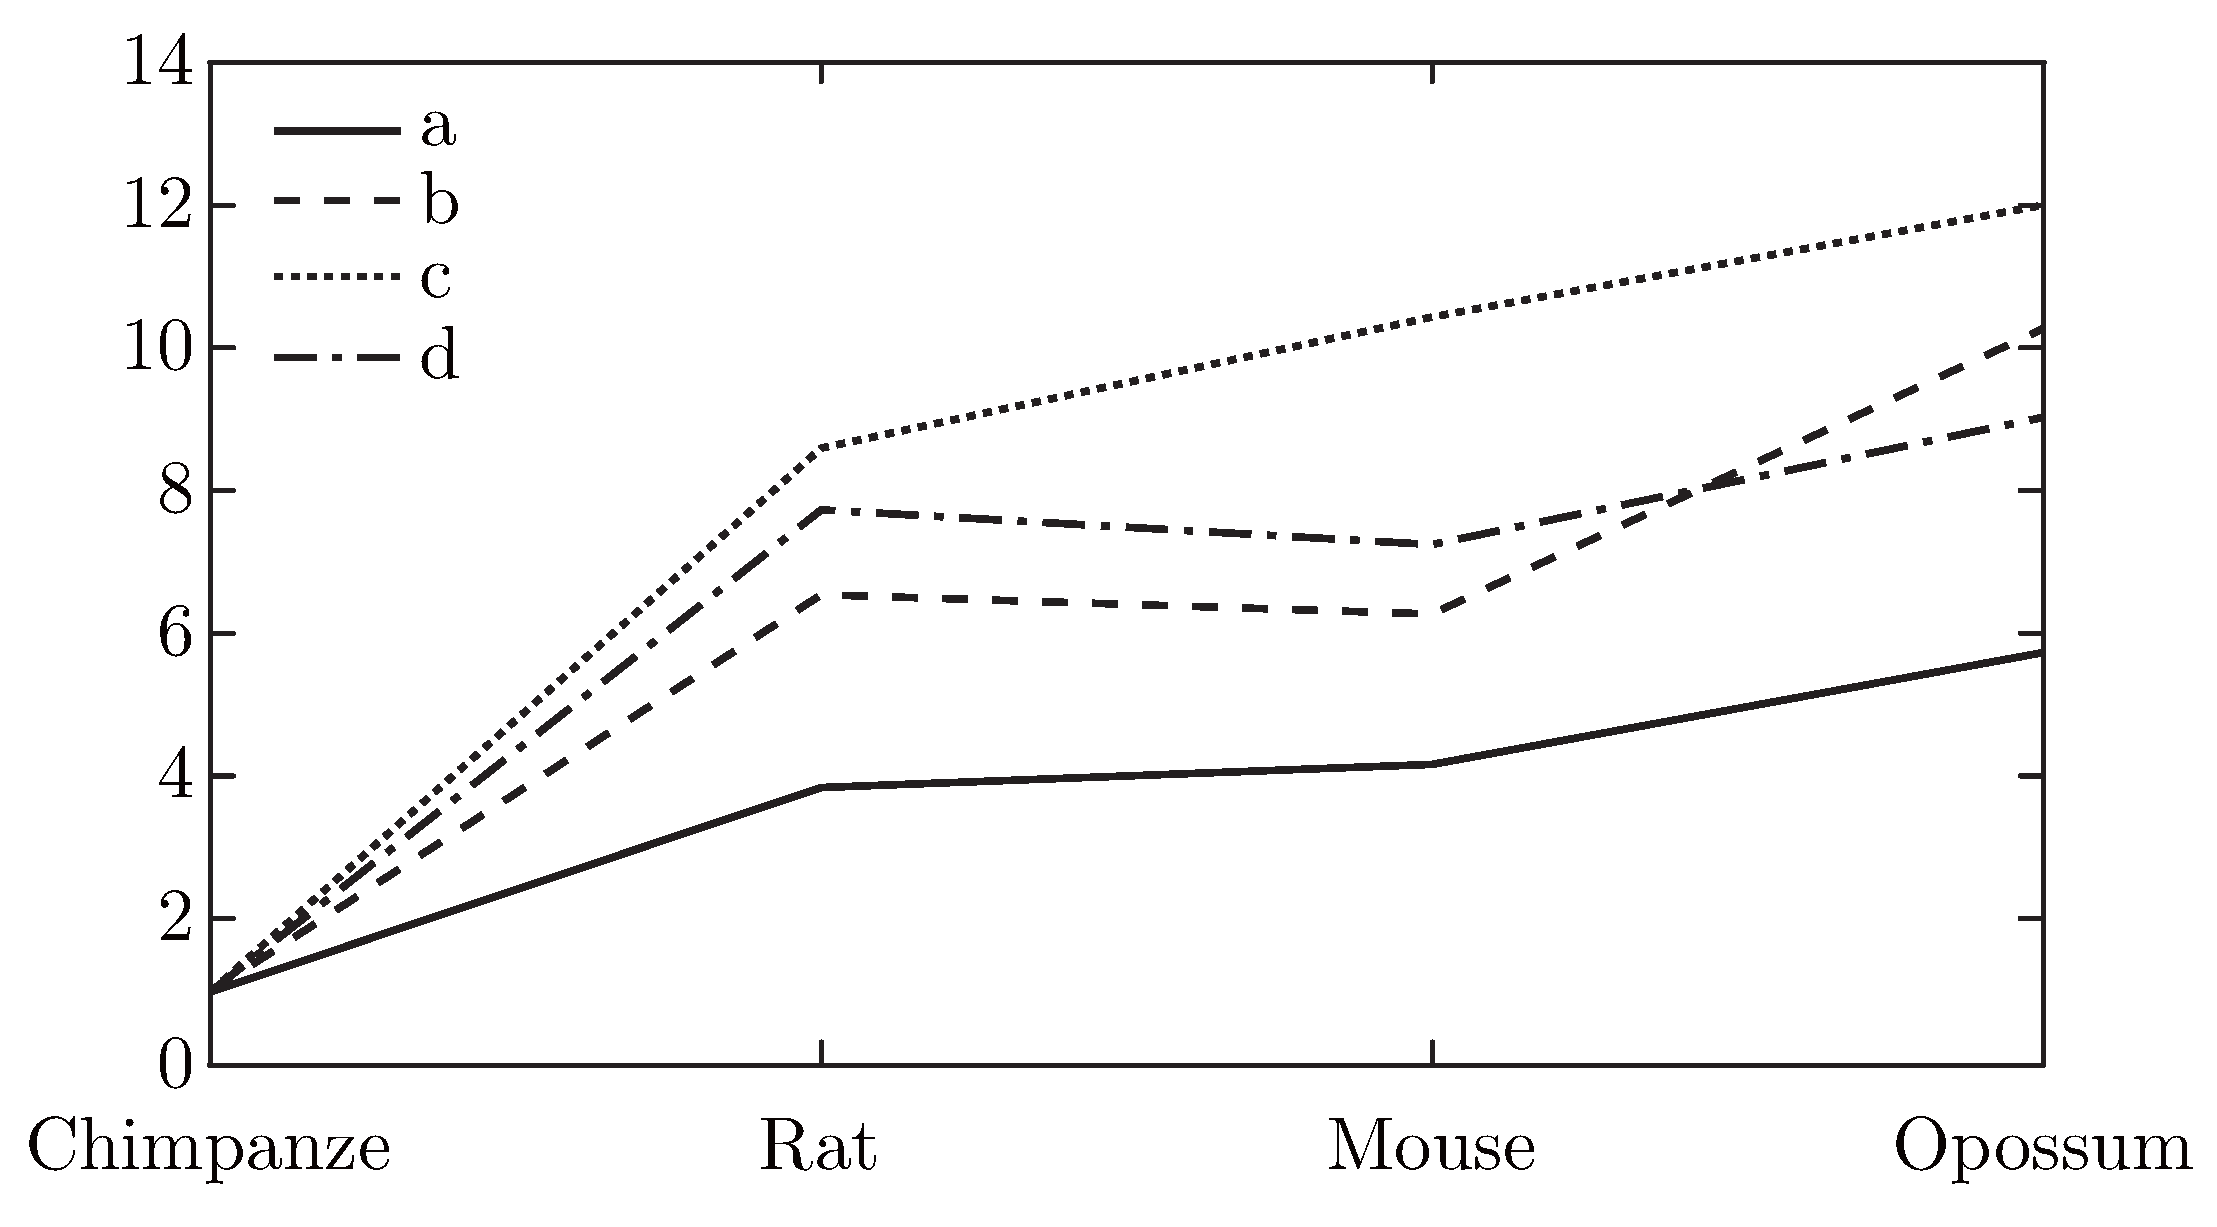
For comparison, we denote the similarity degree of the pair human - chimpanzee as 1. And in Fig. 5 we list the results of the similarity degree of human and other several species. In Fig. 5 we only consider the four pairs, human - chimpanzee, human - rat, human - house mouse and human - opossum, because only the five ND5 proteins are analyzed by all authors. From Fig. 5 we find that there is a consistent variation tendency by different methods although there is some variation. The results are not occasional, but reveal that the species have much closer evolutionary relationship.
4. Application in Prediction for the Protein Sub-cellular Localization
Protein sub-cellular localization refers to their specific locations in cells. A certain protein or substance of protein expression is likely to exist in different locations of cells, such as in the nucleus (NU), cytoplasm (CY), membrane (ME), and so on [19,20]. The different locations of proteins in cell are related to the structure and function of biological cell. We can usually get the protein function and structure information by the prediction for the protein sub-cellular localization. In addition, the more similar proteins are more likely to exist in the same sub-cellular localization of cell. Thus, generally by analyzing the similarities/dissimilarities and classification of protein sequences, we can predict the protein sub-cellular localization.
To predict the protein sub-cellular localization, we use the proposed 2D representation method and the distance calculation formula to take the similarity analysis of protein sequences. Here we consider two apoptosis protein data sets, the 98 apoptosis protein data set (ZD98) suggested by Zhou and Doctor [19], and the 317 apoptosis protein data set (CL317) suggested by Chen and Li [20]. The 98 apoptosis proteins includes 43 cytoplasm proteins (CY), 13 mitochondrial inner and outer proteins (MI), 12 other proteins (OTHER), and 30 plasma membrane-bound proteins (ME). The 317 apoptosis protein data set has 112 cytoplasm proteins (CY), 47 endoplasmic reticulum proteins (EN), 52 nuclear proteins (NU), 55 membrane proteins (ME), 34 mitochondrial proteins (MI), and 17 secreted proteins (SE).
Generally, for any prediction method, it is necessary to evaluate its performance using some evaluation index and test methods. Here, we test the prediction accuracy by the jackknife test method [21,22].
At present, the following four evaluating indicators are commonly used in bioinformatics to evaluate and compare the prediction effects by different classification prediction methods. They are ACC (prediction accuracy), SEN (individual sensitivity), SPE (individual specificity) and MCC (Matthew’s correlation coefficient). Now, given a test protein data set, there are N protein sequences and k protein categories. Then the four evaluating indicators are defined as follows,
where TPk is the amount of the sequences in the k-th protein category correctly classified as the k-th category, FPk is the amount of the sequences in other protein categories classified as the k-th category, TNk is the amount of the sequences in other protein categories correctly classified as their corresponding categories, and FNk the numbers of the sequences in the k-th protein category falsely classified as other categories.
We use the four evaluating indicators to perform the prediction effect of the proposed method for the dataset ZD98 and the dataset CL317. Table 3 and Table 4 list the evaluation results. From the two tables we find that the proposed method is useful in prediction for the protein sub-cellular localization.
Table 3.
Evaluation results for the dataset ZD98 by the proposed method.
Table 4.
Evaluation results of the dataset CL317 by the proposed method.
Then, in order to compare our method with others, in Table 5 and Table 6 we show the results of evaluating indicators SEN and ACC for the two datasets. Observing Table 5, we find that the ACC (prediction accuracy) for the dataset ZD98 by the proposed method achieves 90.8% in jackknife test. This value is higher than the BC method [23], the HensBC method [23], the covariant method [19], the ID SVM method [24] and the method Liao [15]. Besides, the individual sensitivity SEN for CY, ME and MI reaches 93%, 93.3% and 92.3%, respectively. Although the lowest SEN value for other proteins (OTHER) only arrives in 75%, the percentage compared with other methods is also high.
Moreover, Table 6 shows that for our method the overall prediction accuracy ACC for the dataset CL317 achieves 89.3%, which is the highest among the compared methods, including ID [20], ID SVM [24], LABSVM [25] and the method Liao [15]. The individual sensitivity SEN for ME and MI are highest, and reach 90.9% and 88.2%, respectively.
Table 5.
Evaluating indicators SEN and ACC for the datasets ZD98.
Table 6.
Evaluating indicators SEN and ACC for the datasets CL317.
The results in Table 5 and Table 6 show that the proposed method and the SVM methods are better than others although they also have different prediction results for different test dataset. For example, in Table 5 our overall prediction accuracy ACC for the dataset ZD98 is 2.1% lower than EBGW_SVM [26] and 3.1% lower than LABSVM [25]. This shows that for the dataset ZD98 the machine-learning methods, such as EBGW_SVM and LABSVM, have better overall prediction effect. But in Table 6 our ACC value for the dataset CL317 is the highest among the methods including the SVM methods. From a statistical standpoint, the difference is negligible. The proposed method is as good as the SVM methods. However, our method has other advantages, easiness and less time consuming.
5. Conclusions
In this paper, we proposed a novel 2D graphic representation of protein sequences considering four main physicochemical properties of 20 amino acids. Based on the proposed graphical curve we define a new distance calculating method and its application in the similarity or dissimilarity comparison of ND5 proteins of 10 species. The similarity/dissimilarity results by the new distance computing method derived from the proposed graphical curve are consistent with the results obtained from other methods.
Then we use the proposed method in another important application using similarity comparison, the protein sub-cellular localization prediction. Two common test datasets, ZD98 and CL317, are used to evaluate the prediction performance. The results show that the proposed prediction method are more efficient than most of the other methods. Its prediction performance is almost as good as the machine-learning methods. It is a simple method with lower computing complexity.
Acknowledgments
This work supported by the National Natural Science Foundation of China (Grant No. 61272254), and by the Natural Science Foundation of Hebei Province, China (Project No. F2012210017), and by the Humanities and Social Sciences Research of Ministry of Education of China (Project name, The Origin, Propagation and Migration of Human Influenza Epidemic (1918-2010) from Spacetime Perspective; Project No. 11YJCZH132).
References
- Hamori, E.; Ruskin, J. H curves, a novel method of representation of nucleotide series especially suited for long DNA sequences. J. Biol. Chem. 1983, 258, 1318–1327. [Google Scholar] [CrossRef] [Scilit]
- Guo, X.; Nandy, A. Numerical characterization of DNA sequences in a 2-D graphical representation scheme of low degeneracy. Chem. Phys. Lett. 2003, 369, 361–366. [Google Scholar] [CrossRef] [Scilit]
- Chi, R.; Ding, K.Q. Novel 4D numerical representation of DNA sequences. Chem. Phys. Lett. 2005, 407, 63–67. [Google Scholar] [CrossRef] [Scilit]
- Dai, Q.; Liu, X.Q.; Wang, T.M. A novel 2D graphical representation of DNA sequences and its application. J. Mol. Graph. Modell. 2006, 25, 340–344. [Google Scholar] [CrossRef] [Scilit]
- Qi, Z.H.; Li, L.; Qi, X.Q. Using Huffman Coding Method to Visualize and Analyze DNA Sequences. J. Comput Chem. 2011, 32(15), 3233–3240. [Google Scholar] [CrossRef] [Scilit]
- Qi, Z.H.; W, J.M.; Qi, X.Q. Classification analysis of dual nucleotides using dimension reduction. J. Theor. Biol. 2009, 260, 104–109. [Google Scholar] [CrossRef] [Scilit]
- Randić, M. Graphical representations of DNA as 2-D map. Chem. Phys. Lett. 2004, 386, 468–471. [Google Scholar] [CrossRef] [Scilit]
- Randić, M.; Vracko, M.; Lers, N.; Plavsic, D. Novel 2-D graphical representation of DNA sequences and their numerical characterization. Chem. Phys. Lett. 2003, 368, 1–6. [Google Scholar] [CrossRef] [Scilit]
- Randić, M.; Vracko, M.; Nandy, A.; Basak, S.C. On 3-D graphical representation of DNA primary sequences and their numerical characterization. J. Chem. Inf. Model 2000, 40, 1235–1244. [Google Scholar] [CrossRef] [Scilit]
- Yuan, C.X.; Liao, B.; Wang, T.M. New 3D graphical representation of DNA sequences and their numerical characterization. Chem. Phys. Lett. 2003, 379, 412–417. [Google Scholar] [CrossRef] [Scilit]
- Liao, B.; Tan, M.S.; Ding, K.Q. A 4D representation of DNA sequences and its application. Chem. Phys. Lett. 2005, 402, 380–383. [Google Scholar] [CrossRef] [Scilit]
- Yao, Y.H.; Dai, Q.; Li, C.; He, P.A.; Nan, X.Y.; Zhang, Y.Z. Analysis of similarity/dissimilarity of protein sequences. Proteins 2008, 73, 864–871. [Google Scholar] [CrossRef] [Scilit]
- Wu, Z.C.; Xiao, X.; Chou, K.C. 2D-MH: A web-server for generating graphic representation of protein sequences based on the physicochemical properties of their constituent amino acids. J. Theor. Biol. 2010, 267, 29–34. [Google Scholar] [CrossRef] [Scilit]
- Qi, Z.H.; Fan, T.R. PN-curve: A 3D graphical representation of DNA sequences and their numerical characterization. Chem. Phys. Lett. 2007, 442, 434–440. [Google Scholar] [CrossRef] [Scilit]
- Liao, B.; Liao, B.Y.; Sun, X.M.; Zeng, Q.G. A novel method for similarity analysis and protein subcellular localization prediction. Bioinformatics 2010, 26, 2678–2683. [Google Scholar] [CrossRef] [Scilit]
- Randić, M. Withdrawn: 2-D graphical representation of proteins based on physico-chemical properties of amino acids. Chem. Phys. Lett. 2007, 444, 176–180. [Google Scholar] [CrossRef] [Scilit]
- Qi, Z.H.; Feng, J.; Qi, X.Q.; Li, L. Application of 2D graphic representation of protein sequence based on Huffman tree method. Comput Biol. Med. 2012, 42, 556–563. [Google Scholar] [CrossRef] [Scilit]
- He, P.A.; Wei, J.Z.; Yao, Y.H.; Tie, Z.X. A novel graphical representation of proteins and its application. Physica A 2012, 391, 93–99. [Google Scholar] [CrossRef] [Scilit]
- Zhou, G.P.; Doctor, K. Subcellular Location Prediction of Apoptosis Proteins. Proteins 2003, 50, 44–48. [Google Scholar] [CrossRef] [Scilit]
- Chen, Y.L.; Li, Q.Z. Prediction of the subcellular location of apoptosis proteins. J. Theor. Biol. 2007, 245, 775–783. [Google Scholar] [CrossRef] [Scilit]
- Chou, K.C.; Zhang, C.T. Prediction of Protein Structural Classes. Crit. Rev. Biochem Mol. Biol. 1995, 30, 275–349. [Google Scholar] [CrossRef] [Scilit]
- Li, F.M.; Li, Q.Z. Predicting protein subcellular location using Chou’s pseudo amino acid composition and improved hybrid approach. Protein Pept. Lett. 2008, 15, 612–616. [Google Scholar] [CrossRef] [Scilit]
- Bulashevska, A.; Eils, R. Predicting protein subcellular locations using hierarchical ensemble of Bayesian classifiers based on Markov chains. BMC Bioinform. 2006, 7, 298. [Google Scholar] [CrossRef] [Scilit]
- Chen, Y.L.; Li, Q.Z. Prediction of apoptosis protein subcellular location using improved hybrid approach and pseudo-amino acid composition. J. Theor. Biol. 2007, 248, 377–381. [Google Scholar] [CrossRef] [Scilit]
- Zhang, L.; Liao, B.; Li, D.C.; Zhu, W. A novel representation for apoptosis protein subcellular localization prediction using support vector machine. J. Theor. Biol. 2009, 259, 361–365. [Google Scholar] [CrossRef] [Scilit]
- Zhang, Z.H.; Wang, Z.H.; Zhang, Z.R.; Wang, Y.X. A novel method for apoptosis protein subcellular localization prediction combining encoding based on grouped weight and support vector machine. FEBS Lett. 2006, 580, 6169–6174. [Google Scholar] [CrossRef] [Scilit]

© 2014 by the authors. This article is an open access article distributed under the terms and conditions of the Creative Commons Attribution (CC BY) license (https://creativecommons.org/licenses/by/4.0/).