


Abstract
A kind of regenerated Silk Fibroin (SF), nano-blended membrane, was made using an ionic liquid as a solvent. The membranes were characterized by SEM, XRD, FTIR, TG. The SEM showed that more agglomerations were observed with the increase of blended nano-TiO2 (TD). XRD and FTIR verified that nano-TD made conformational changes in SF membrane and the conformation changes from random coil or Silk I into Silk II with the increase of nano TD. The TG analysis showed that pure silk fibroin membrane and nano TD membranes had only one apparent thermal transition region, at about 300°C. Based on the mechanical performance test of SF membranes, tensile strength obviously increased when the amount of nano TD increased, which indicated that the mechanical strength improved with the addition of certain amount of nano TD.
1. Introduction
Silkworm silk, namely silk produced by Bombyx mori, has been studied extensively because of its long (at least 5000-year) history and use as a source of textile-grade fibers [1]. To date, with the development of science and technology, silk has received increased interest in non-apparel area due to the good biocompatibility and oxygen permeability of its main component—silk fibroin (SF). After dissolution in proper solvents, fibroin can be processed to obtain powder, fibers, films and other types of materials.
The SF, a kind of natural polymer fibrin, accounts for about 70%-80% of the silk. It contains 18 kinds of amino acids, among which glycin, alanine, and serine constitute above 80%. Fibroin contains outstanding mechanical, physical and chemical properties, such as good flexibility, high strength, good breathable moisture permeability, slow release ability [2,3,4]. In addition, various forms including fiber, solution, power, membrane, gel could obtain through different treatments [5,6,7].
In this study, silk spun by Bombyx mori was dissolved in 1-methylallyl-3-methylimidazolium chloride ([(MA)MIM]Cl) and then regenerated by distilled water. Pure SF membrane is easily soluble in water. This limits the applications of SF membranes. However, the current general method has been made to modify the solubility by treating the regenerated membrane with ethanol or methanol [8,9], the SF membrane treated by alcohol is brittle. Based on this point, we added polyvinyl alcohol (PVA) into the SF solution [10], and prepared a novel nanometer titanium dioxide (nano TD)/SF blend membrane by gel, in this paper we report on the properties and structure of this novel SF membrane.
2. Experimental Section
2.1. Materials
The materials used in experiment are listed in Table 1.
Table 1.
The materials are used in experiment.
2.2. Preparation of SF Membrane
2.2.1. The Dissolution and Dialysis of Silk and the Recovery of Ionic Liquid
Silk (3g) was added into 150ml [(MA) MIM] Cl, and incubated in an oil bath at 90°C for 4.5 hrs. And then the liquid was cooled to room temperature, the SF was regenerated by adding ethanol into the solution. After that, the SF flocs were collected by a vacuum filtration, followed by a thorough drying/washing with distilled water. After dialyzing for 24 hrs, pure SF solution was obtained. In addition, evaporating the filtrate through a rotary evaporator, the recovery [(MA)MIM]Cl was left. And the recovery rate was approximately 68.7%.
2.2.2. Solid Concentration of the SF Solution
Pure SF solution (5 mL) cast in a Petri dish, then dried in an oven at 105°C until a constant weight. Calculated by the formula (1), the solid concentration of the SF solution was 4.63%. Each SF solution was prepared approximately 4.5% W/V.

Where W1 is the sum weight of the SF and the Petri dish after drying, W2 is the weight of Petri dish.
2.2.3. Preparation of Nano TD/SF Blend Membranes
Pure SF solution (25 mL), polyvinyl alcohol (0.05 g) and 0, 0.002, 0.004, 0.006, 0.008 g nano TD were separately added into five numbered beakers. Each mixture was maintained at 70°C with a constant stirring for 1 hr and then cast into a polystyrene Petri dish (diameter=90 mm). The solution is about 4 mm thickness. After ultrasonic vibrating for 0.5 hr and then drying at 45°C for 24 hrs, the nano TD/SF blend membrane was formed.
2.3. Analysis Methods
2.3.1. Scanning Electron Microscopy analysis of SF Membranes
To visualize the changes of the surface morphology in blended SF membranes and the pure SF membrane, samples were scanned by JSM-6360LV SEM.
2.3.2. FT-IR Analysis of SF Membranes
To visualize the changes of structure in blended SF membranes and pure SF membrane, samples were measured by Nicolet FT-IR 200. The spectra (4000-400 cm−1) were recorded with a resolution of 4 cm−1 and 16 scans per sample. About 2.0 mg samples were pre- pared by mixing with 120.0 mg of spectroscopic grade KBr then pressed in a standard device using a pressure of 6000 psi to produce 13 mm diameter pellets.
2.3.3. X-ray Powder Diffraction Analysis of SF Membranes
To determine the changes of crystallinity index (CrI) in blended SF membranes and pure SF membrane, samples were scanned by an X’Pert MDP powder diffractometer with X’celerator detector using Nickel filtered Cukα radiation. Scans were collected at 40 kV and 50 mA.
2.3.4. Thermogravimetric Analysis of SF Membranes
To obtain the changes of structures in blended SF membranes and pure SF membrane, 5mg samples were determined by PRT-1A thermogravimetric analyzer. Scans were collected at 20.0 mL/min, 50-650°C and 20°C/min.
2.3.5. Mechanical Performance Test of SF Membranes
To obtain the changes of flexibility and strength in blended SF membranes and pure SF membrane, samples (40 mm*10 mm) were measured by Instron universal testing machine at 20±0.5°C, humidity 65%±2%. Grip length of the samples was 30 mm and aliasing velocity was 0.2 mm/min.
3. Results and Discussion
3.1. The Recovery of the Ionic Liquid
It is difficult to separate the ionic liquid and water, which affects the solubility of ionic liquids. In our study, we use ethanol to regenerate SF to improve the recovery ratio and to reuse ethanol.
3.2. Dialysis of SF Solution and Preparation of SF Membranes
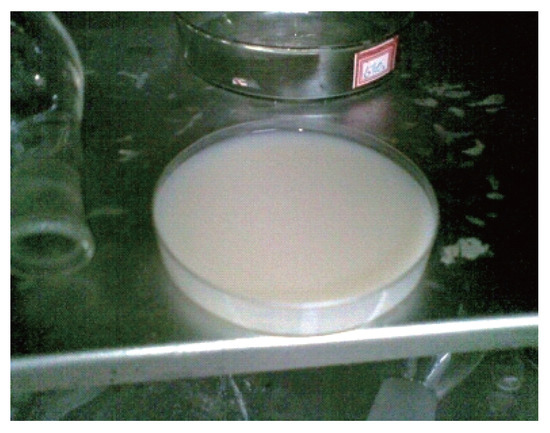
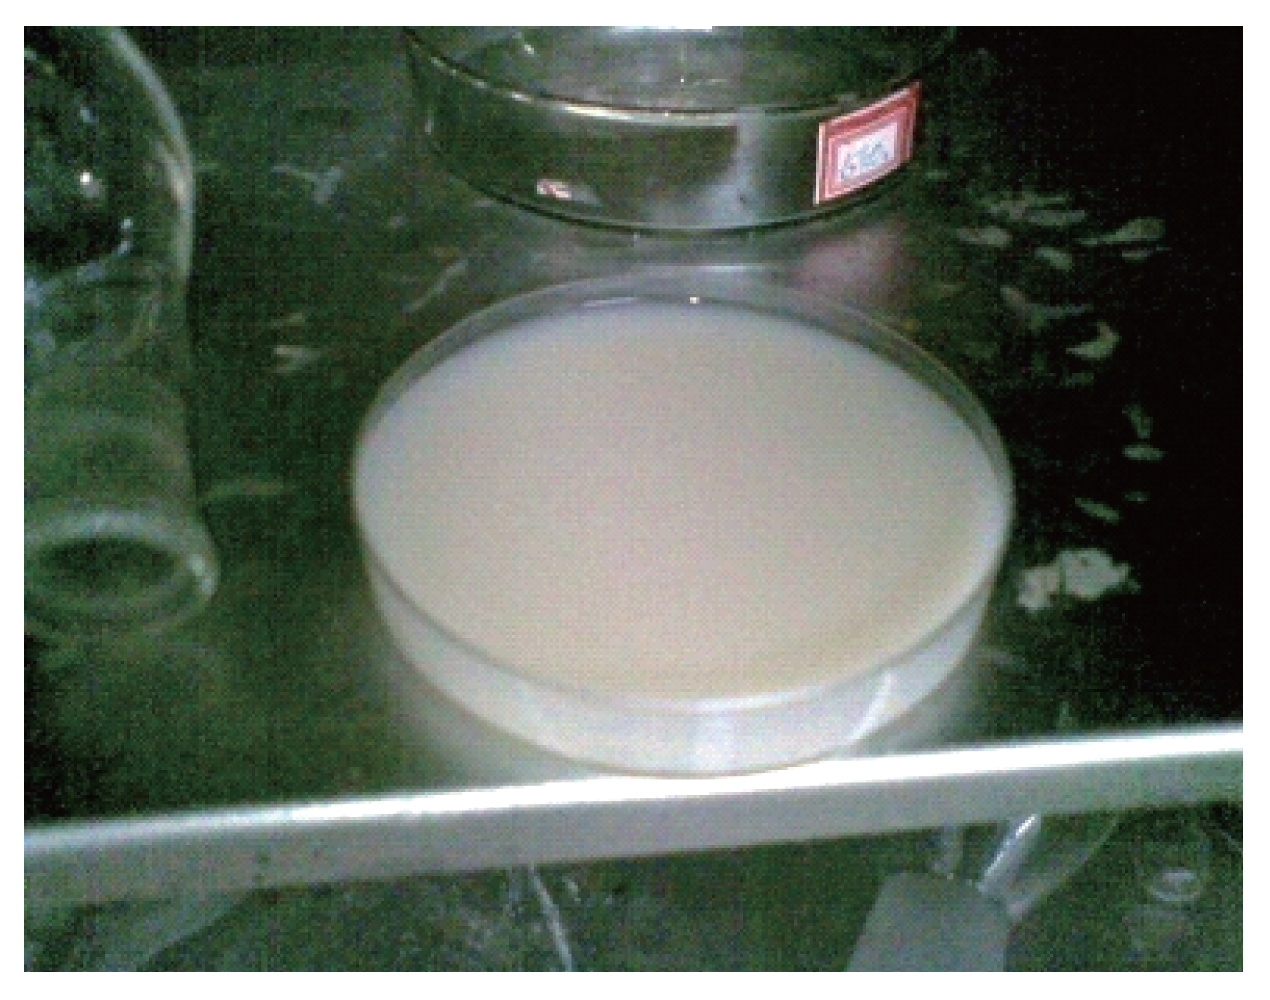
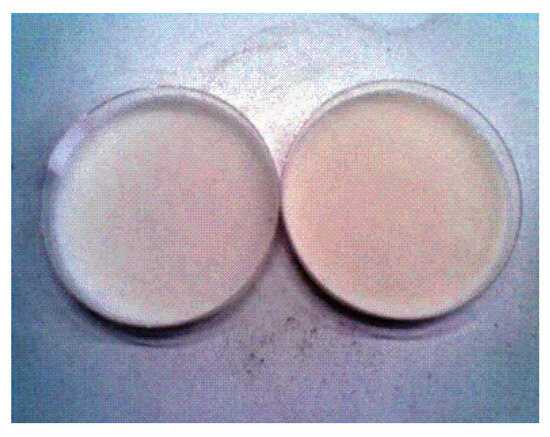
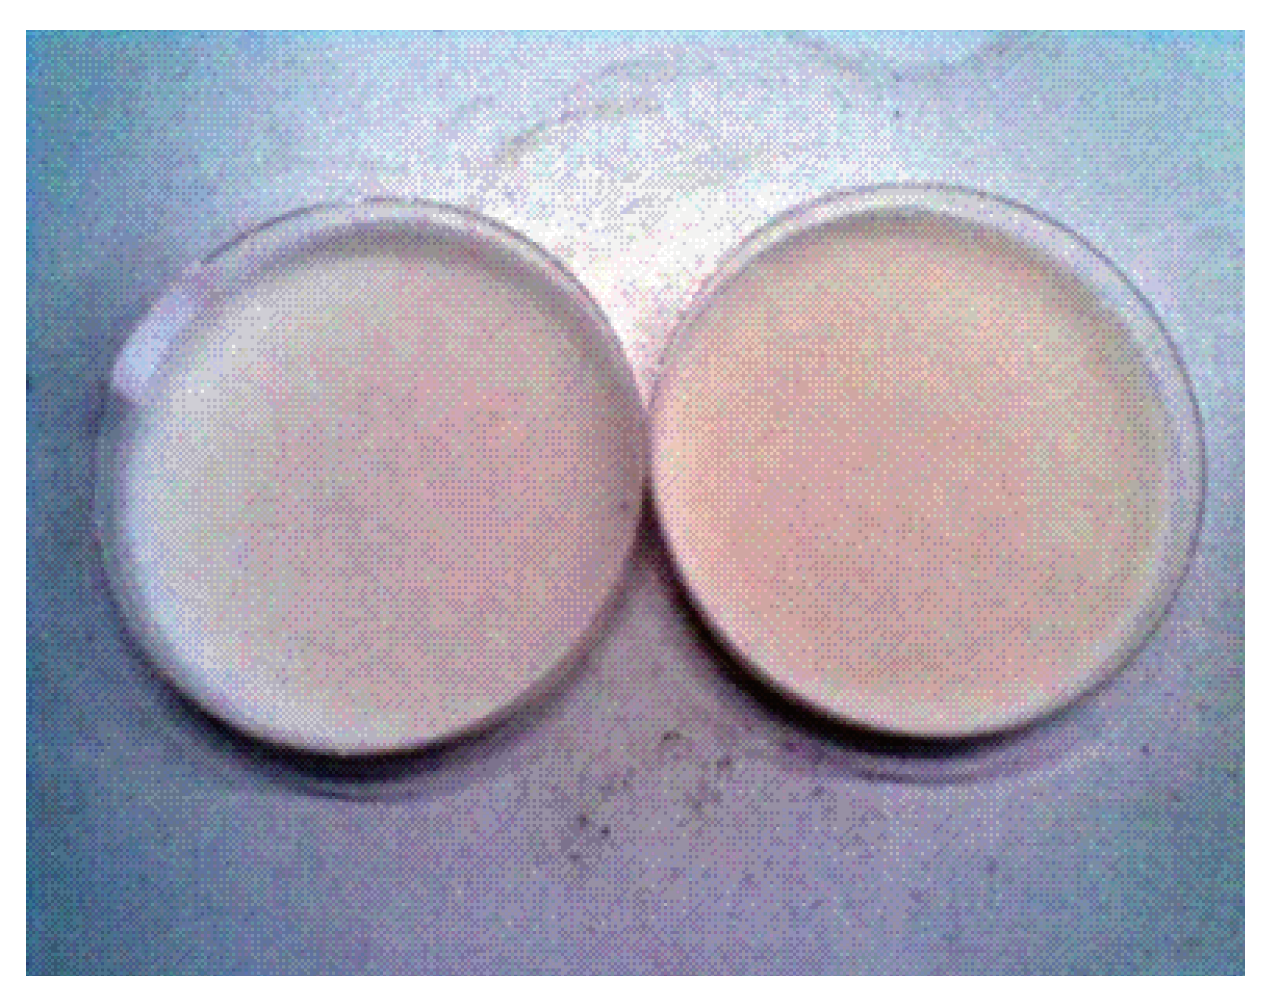
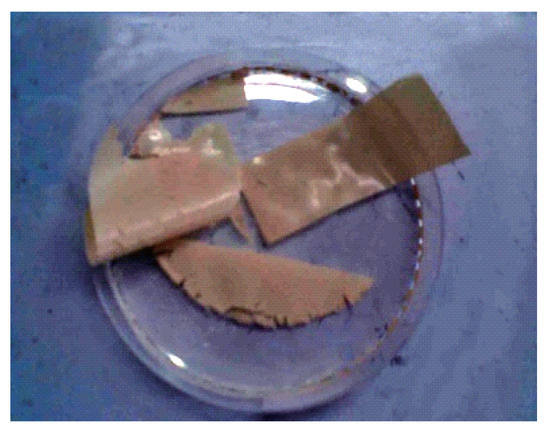
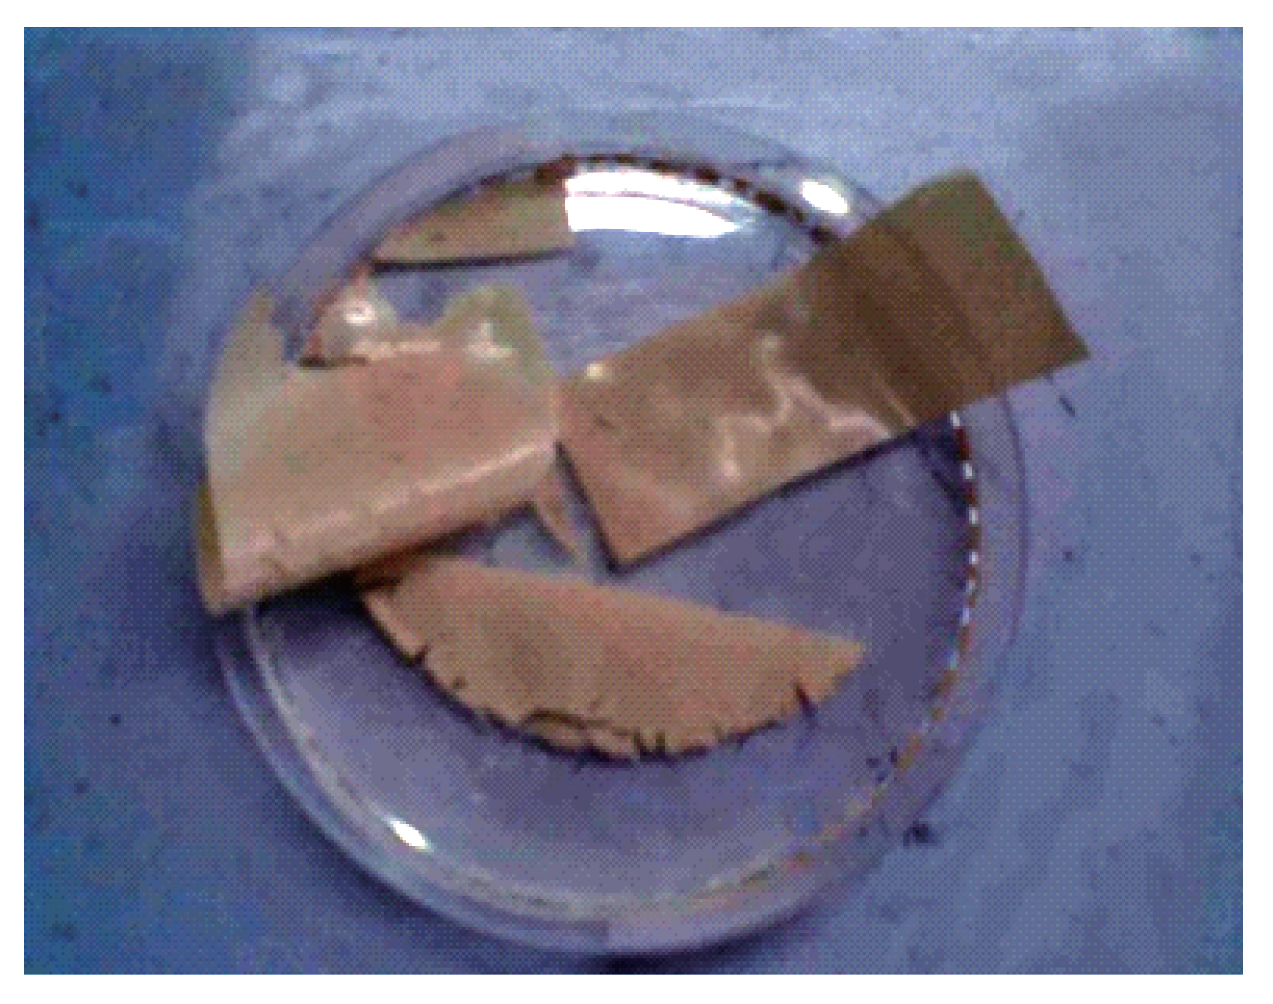
Discovery in the process of preparing membranes: Without dialysis, SF membranes cracked easily in the process. The preparation of SF membranes can be visualized as follows (Figure 1, Figure 2 and Figure 3):
Figure 1.
The mixture solution.
Figure 2.
The mixture after drying.
Figure 3.
The SF membrane.
3.3. Properties of SF Membranes
3.3.1. Scanning Electron Microscope
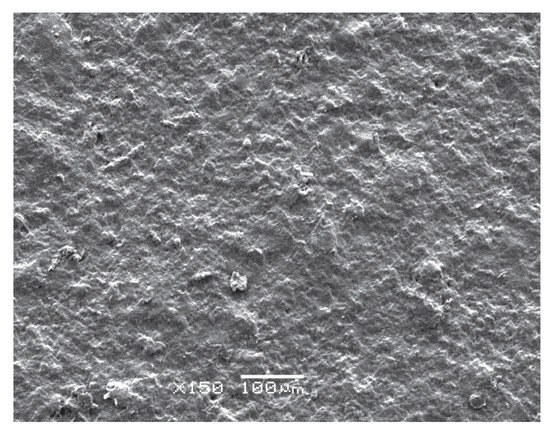
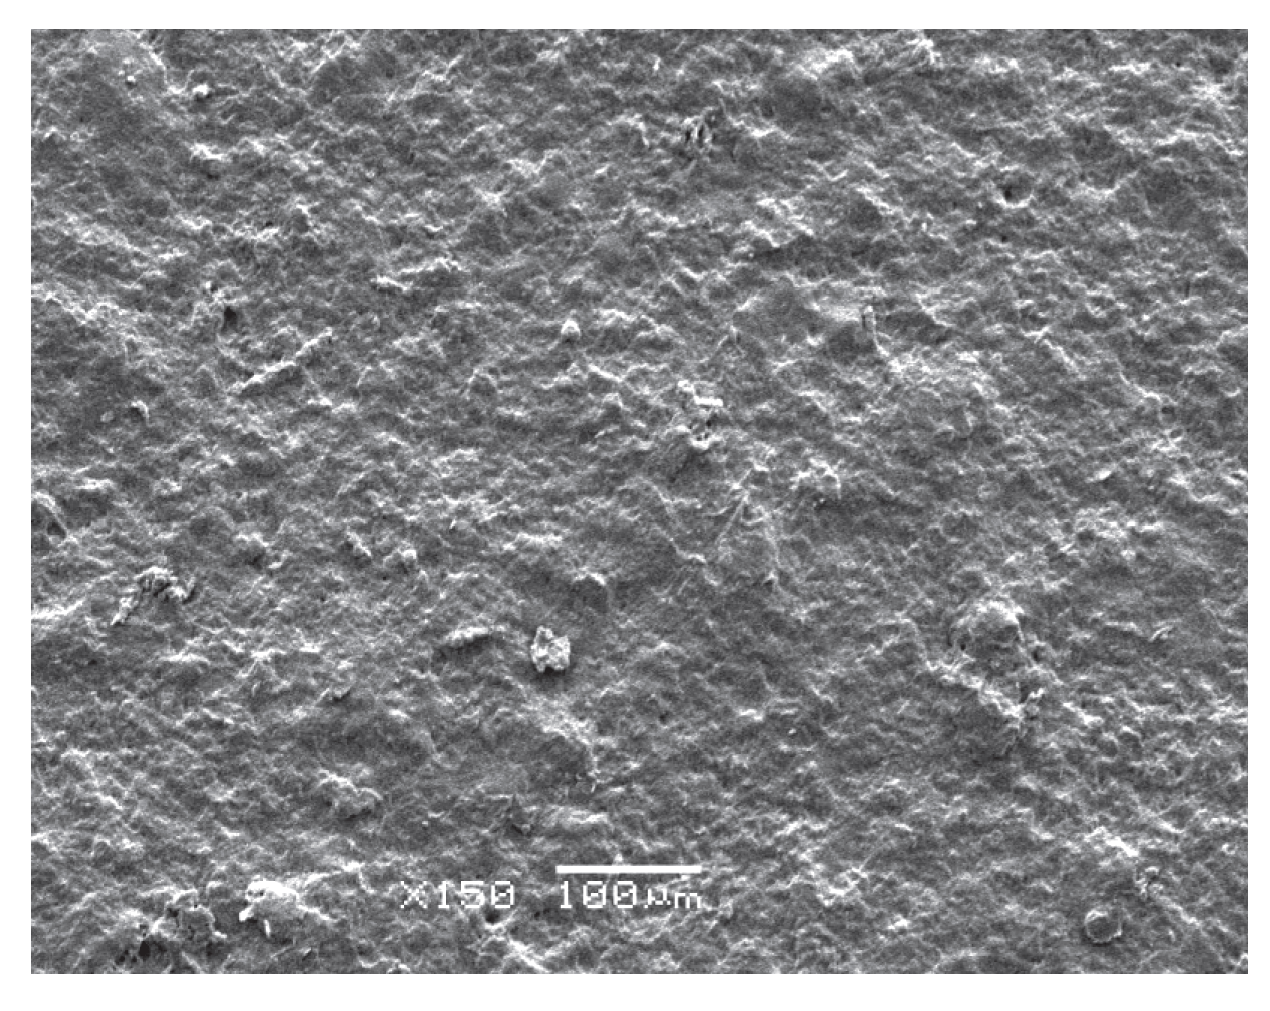
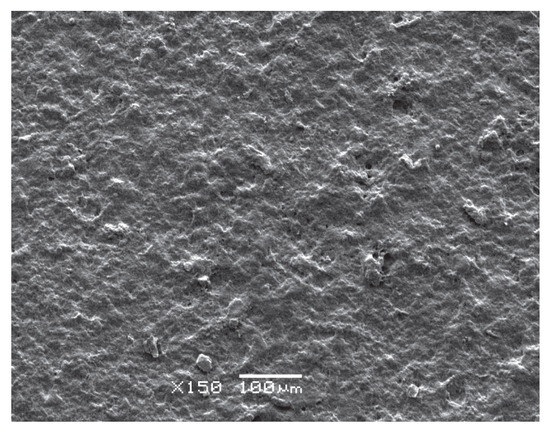
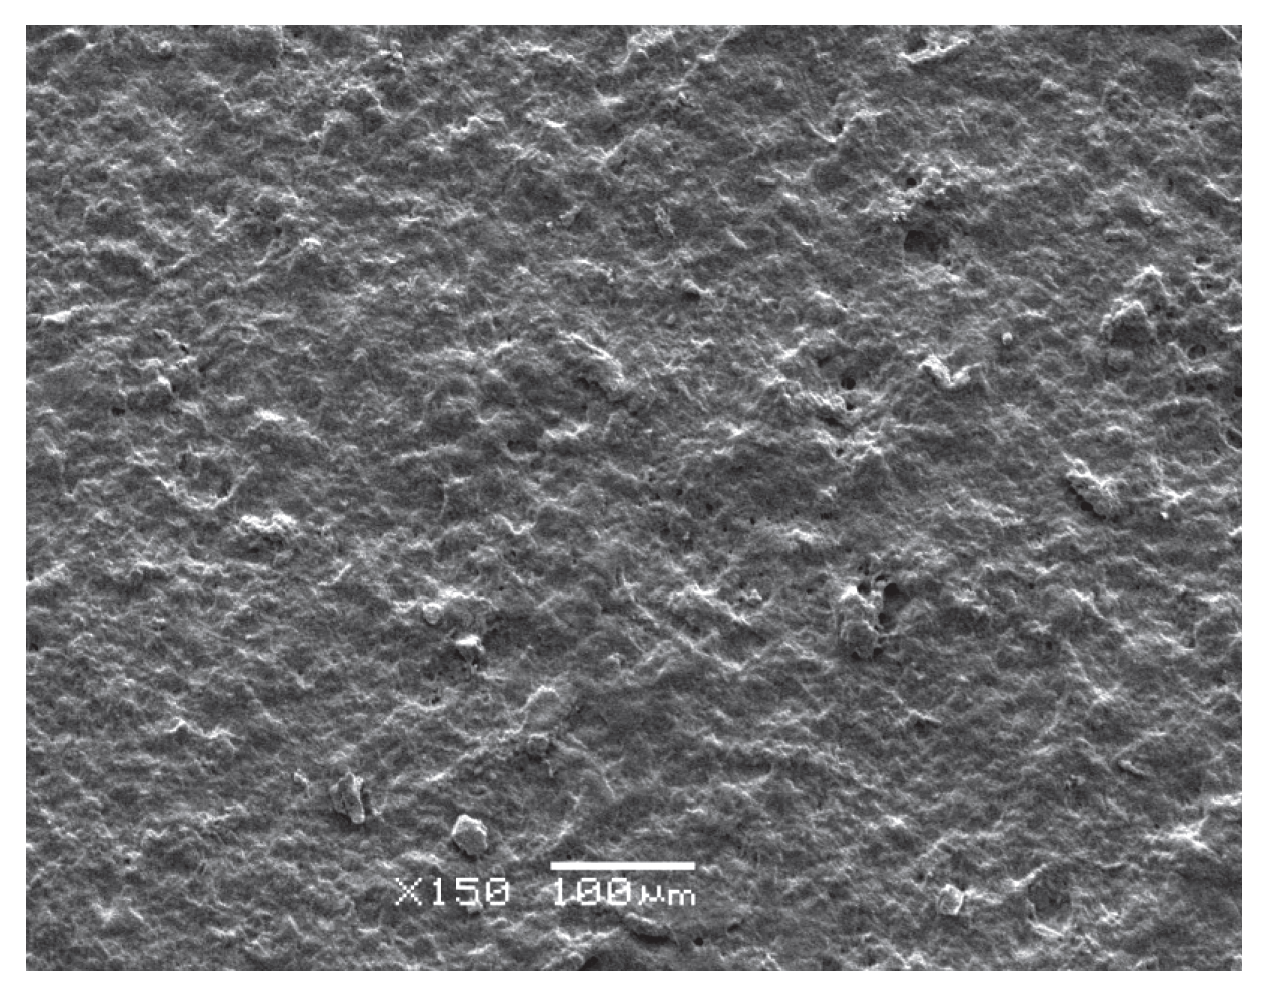
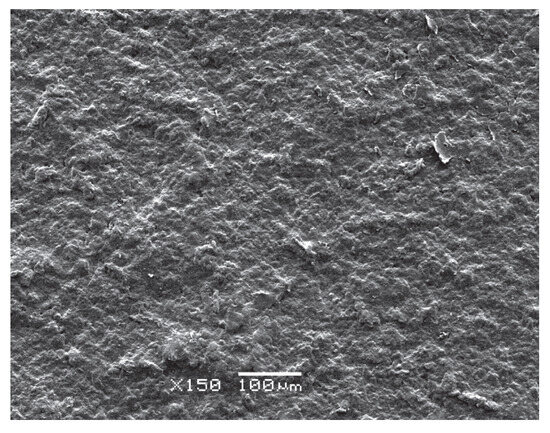
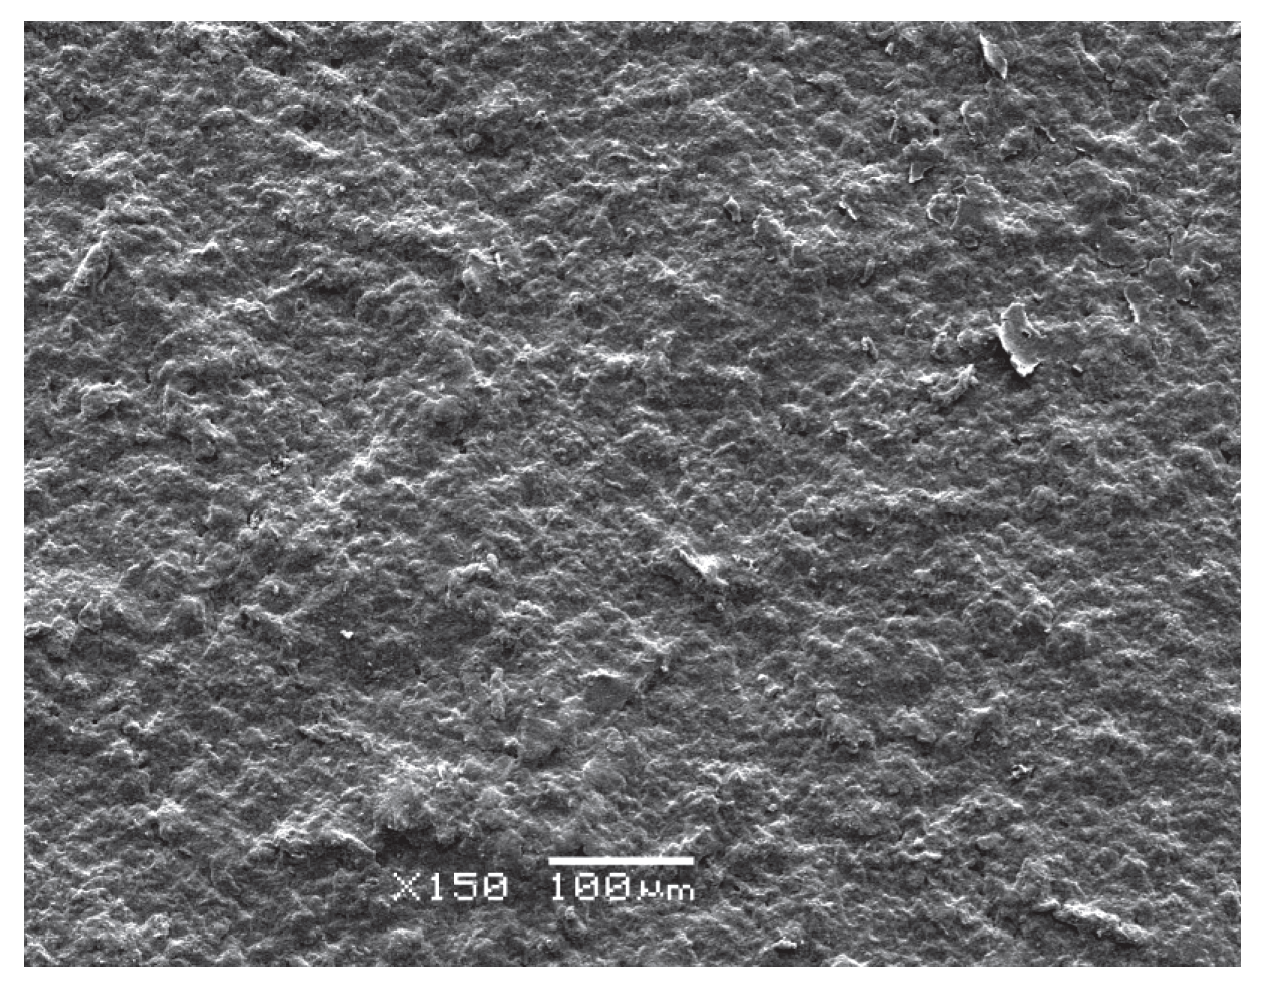
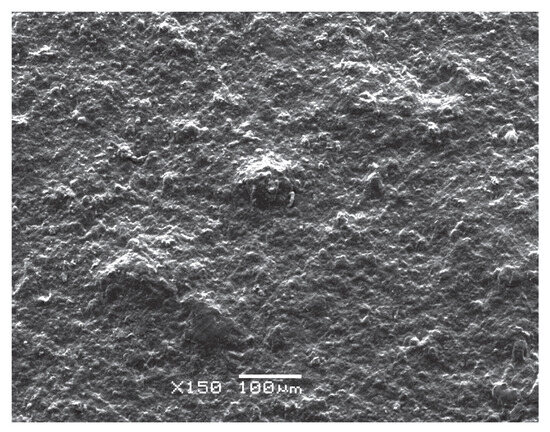
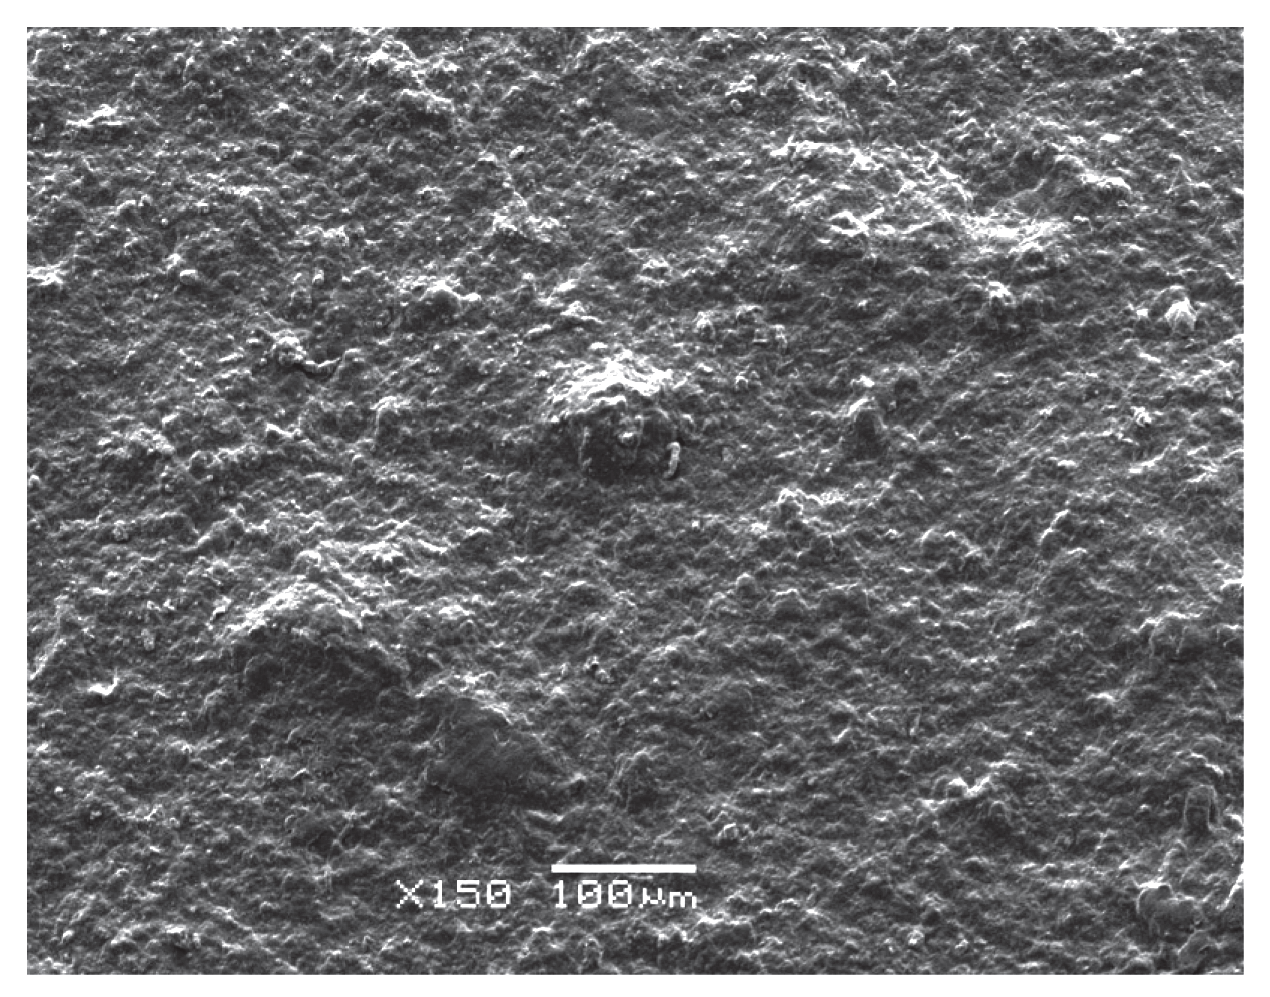
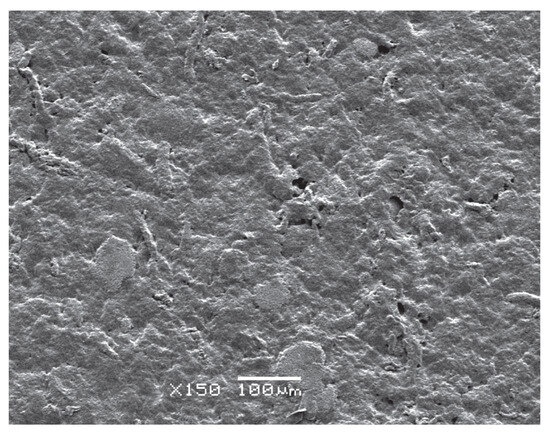
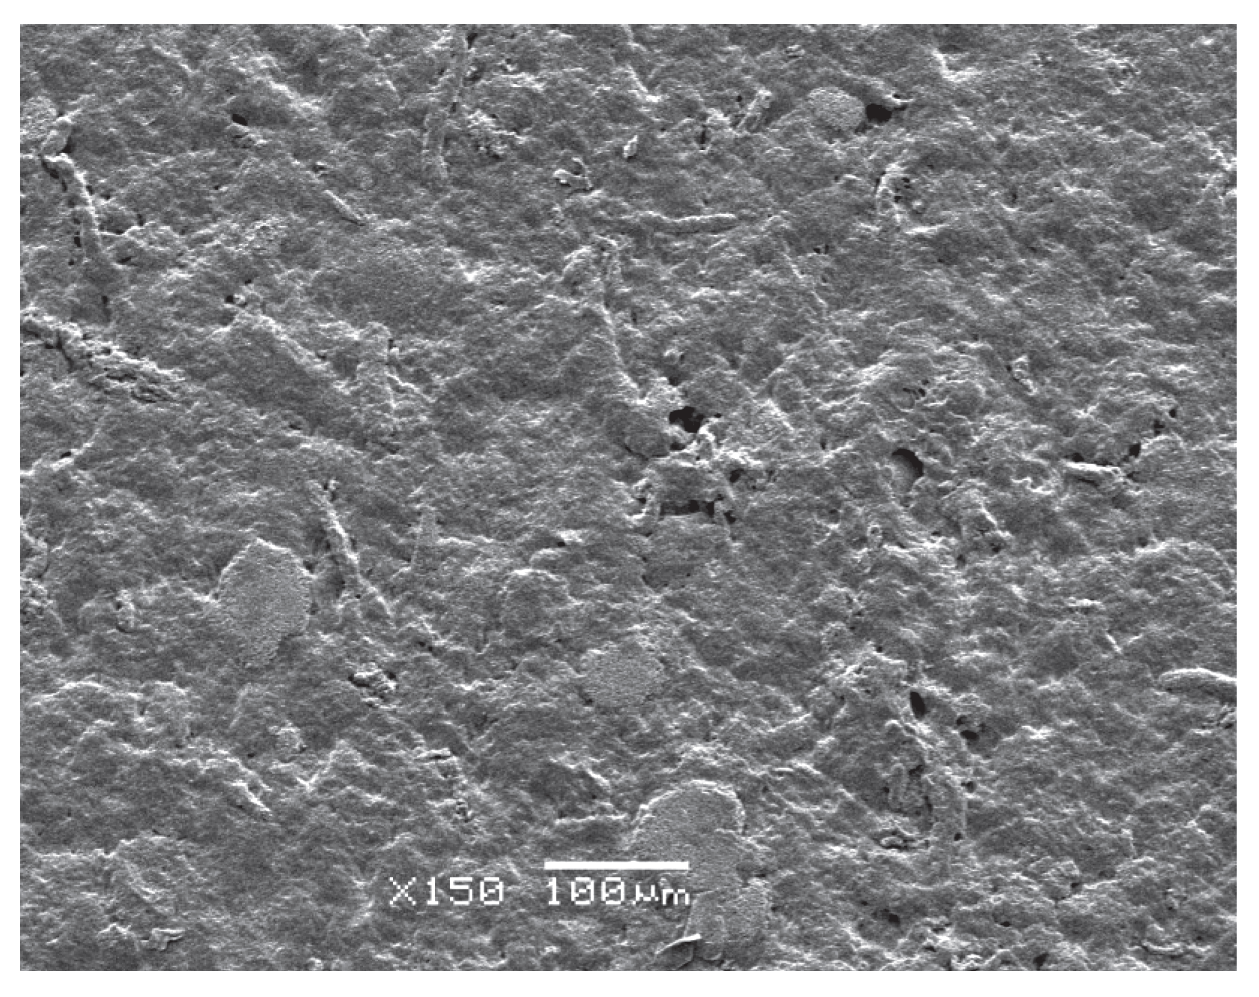
The appearance of the regeneration SF membranes is light yellow, soft and no cracking. The SEM images (Figure 4, Figure 5, Figure 6, Figure 7 and Figure 8) show that TD is more likely to as its increasing amount blended into the membranes.
Figure 4.
SEM image of SF membrane (mass ratio of nano TD / SF is 0/100).
Figure 5.
SEM image of SF membrane (mass ratio of nano TD / SF is 0.2/100).
Figure 6.
SEM image of SF membrane (mass ratio of nano TD / SF is 0.4/100).
Figure 7.
SEM image of SF membrane (mass ratio of nano TD / SF is 0.6/100).
Figure 8.
SEM image of SF membrane (mass ratio of nano TD / SF is 0.8/100).
3.3.2. FT-IR Spectroscopy
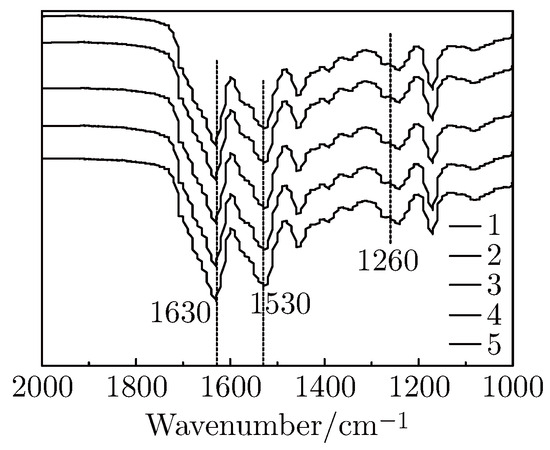
Infrared Spectroscopy is an effective means of analyzing protein, C=O stretch in protein is sensitive to the environment of secondary structure. The main crystalline conformations of fibroin are Silk I and Silk II. Three bands (Table 2) are used to monitor the changes of crystal conformation in fibroin.
Table 2.
Characteristic bonds of SF.
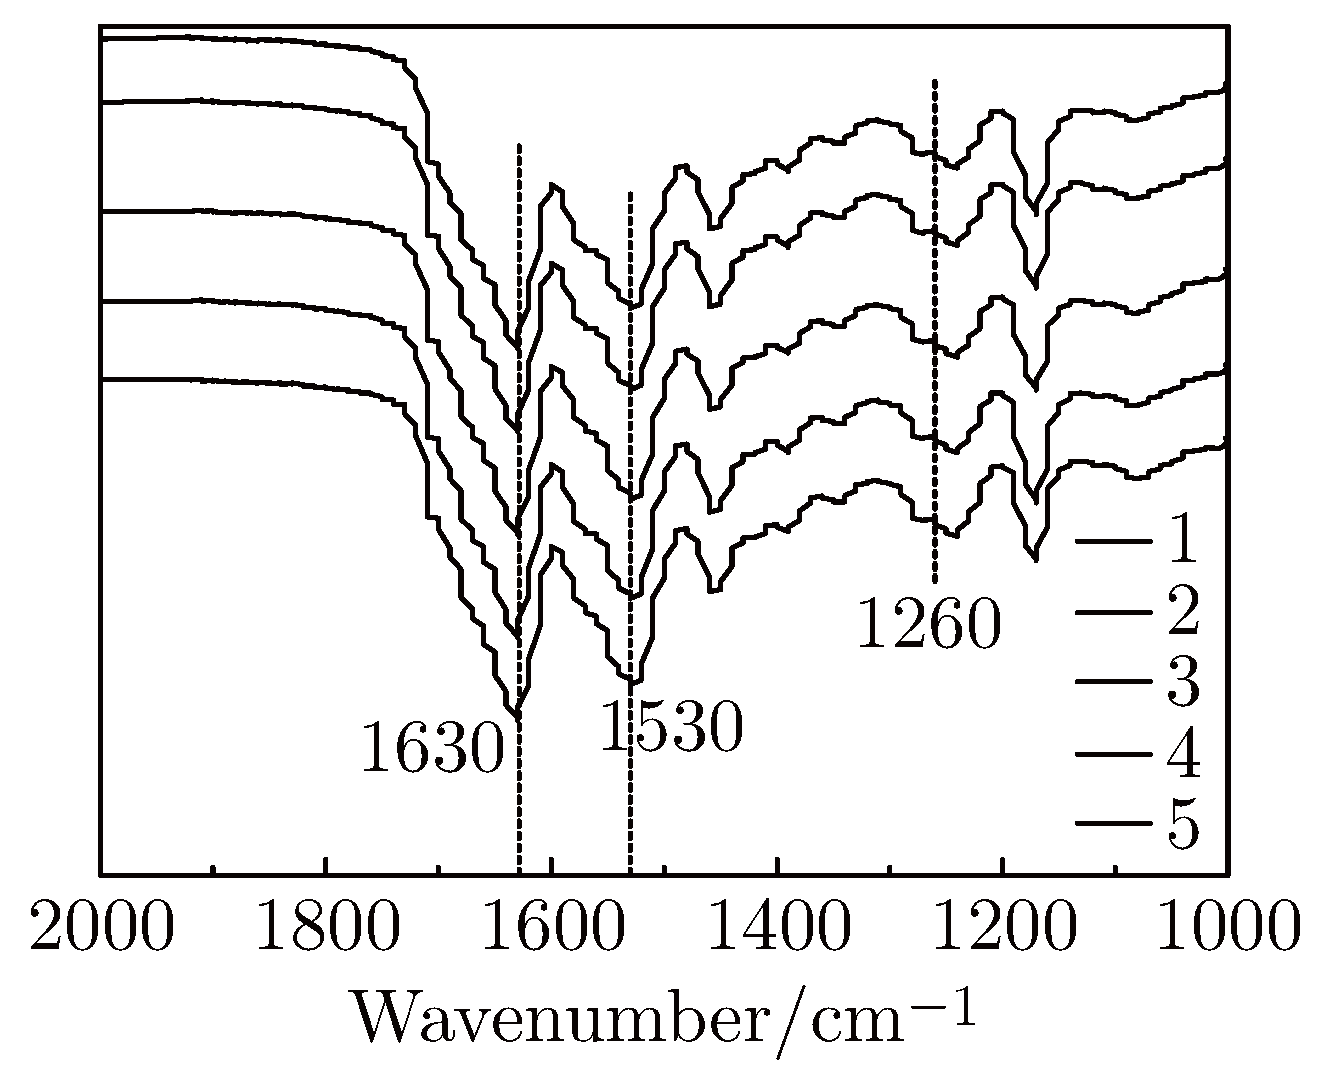
From Figure 9, we can know that there was no significant difference in the characteristic peaks between the pure SF membrane and the blended membrane at 2000 cm−1 ∼1000 cm−1. Three peaks at 1630 cm−1, 1530 cm−1, 1260 cm−1 appeared strongly in the pure SF membrane spectra, which indicates both Silk I and Silk II exist in the pure SF membrane. The three peak areas are increased with the increasing amount of nano-TD, which indicates that the Silk II is increased. Through the analysis above, nano-TD can induce conformational changes in SF membrane. Since SF and nano-particles form intermolecular hydrogen bonds, leading to molecular rearrangement of fibroin and transform state from the disordered to the ordered. Thus SF conformation changed from random coil or Silk I into Silk II.
Figure 9.
FT-IR spectra for nano DT/SF membranes with different nano DT/SF mass ratio: (1) 0/100, (2) 0.2/100, (3) 0.4/100, (4) 0.6/100, (5) 0.8/100.
3.3.3. X-ray Powder Diffraction
The formation of SF membrane material mainly consists of two structures, namely Silk I and Silk II, is relatively less structured, unstable and easily be destroyed; Silk II is dominated by anti-parallel β-sheet chain which is more structured. Silk II is the stable conformation in all the SF conformations. To further understand, the crystallization of the pure SF membrane and the blended SF membrane sample was tested by XRD. XRD peaks of Fibroin conformation are shown in Table 3.
Table 3.
XRD peaks of Fibroin conformation.
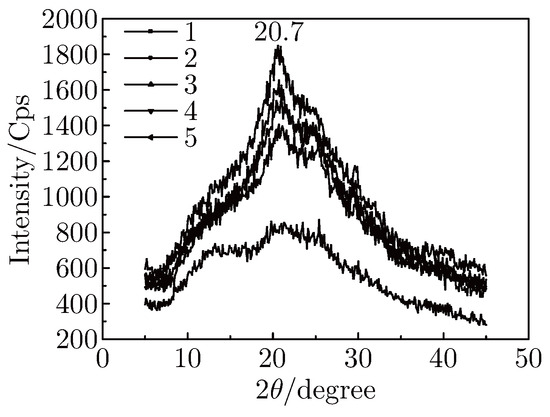
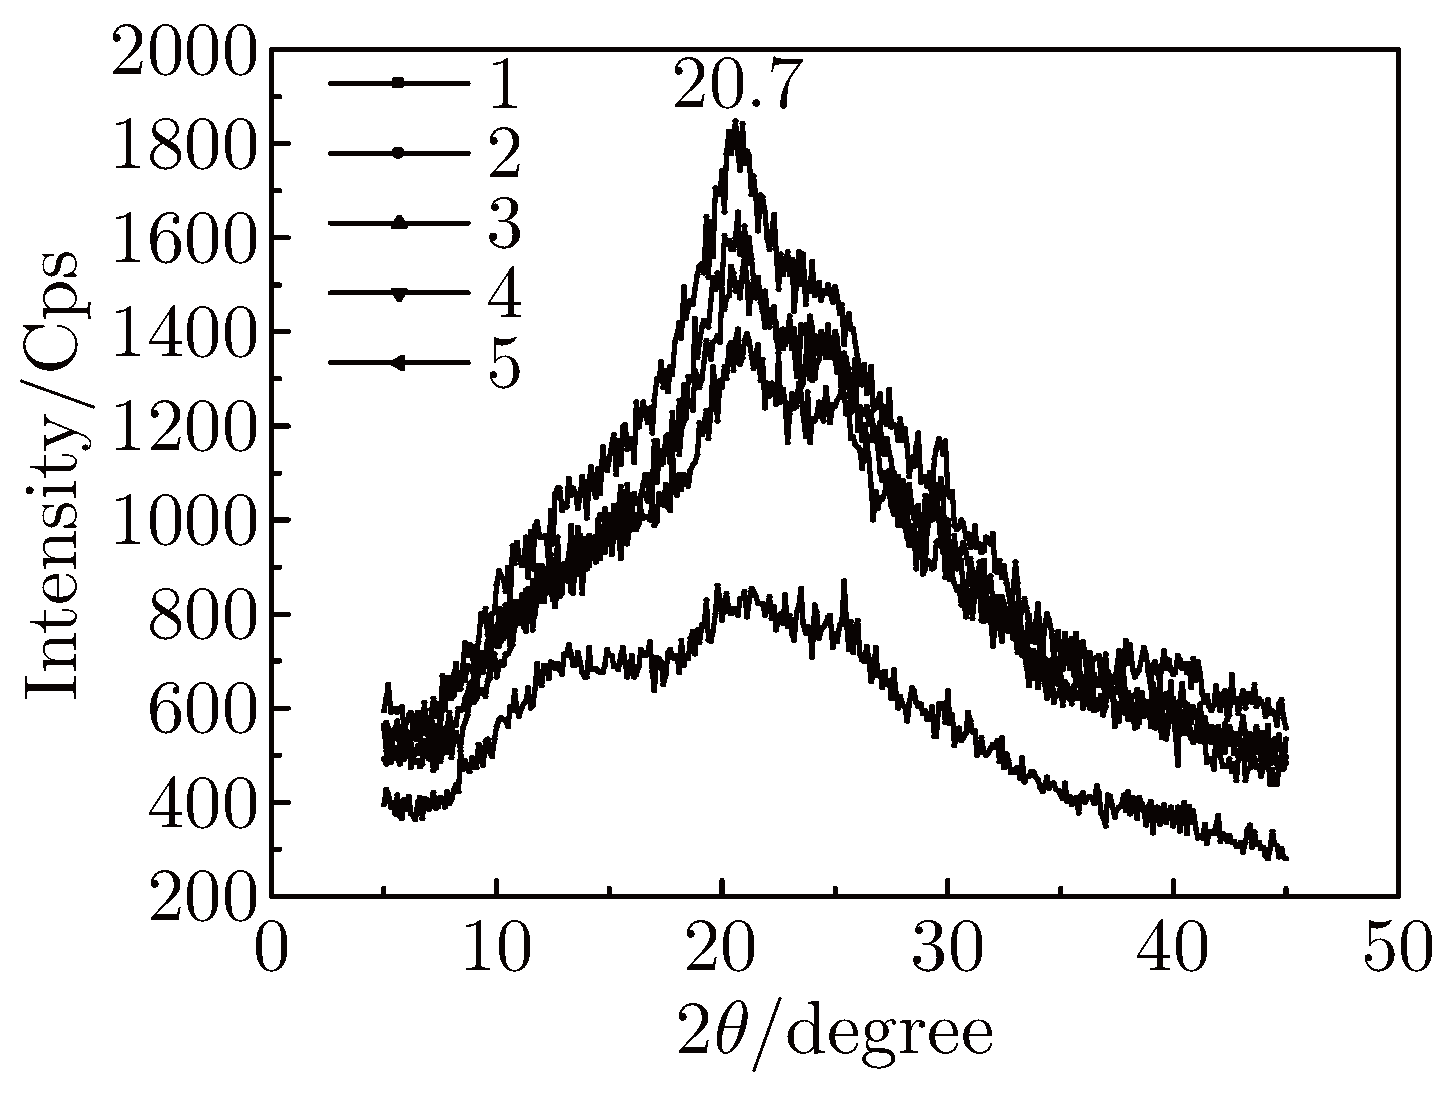
From Figure 10, we can obtain that pure SF membrane and blended SF membranes all appear at its peaks in the range of 17 ∼ 25°. We supposed that the peak is the superposition of four peaks at 18.9°, 19.7°, 20.7° and 24.7°. As shown in Figure 10 and Table 3, whether it is pure SF membrane or blended SF membranes, all existed Silk I and Silk II. And blended SF membranes contain more Silk II than that of pure SF membrane. With the increase amount of nano TD blended, SF membrane conformation gradually changed from Silk I to Silk II. Therefore, nano-TD can induce conformational changes in SF membrane. This result is corresponding with the conclusion of IR.
Figure 10.
XRD of nano TD/SF membranes 1-5 curves separately show the mass ratios of naon TD/SF which are 0/100, 0.2/100, 0.4/100, 0.6/100, 0.8/100.
3.3.4. Thermogravimetric Analysis (TGA)
After adding inorganic nano-particles to the SF membrane, its structure changed a lot. Hydrogen bonding was formed among the main carbon chains, peptide chains and side groups. These changes leaded to an increase of decomposition temperature.
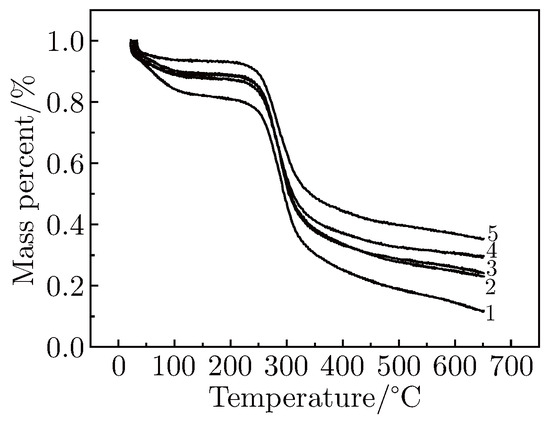
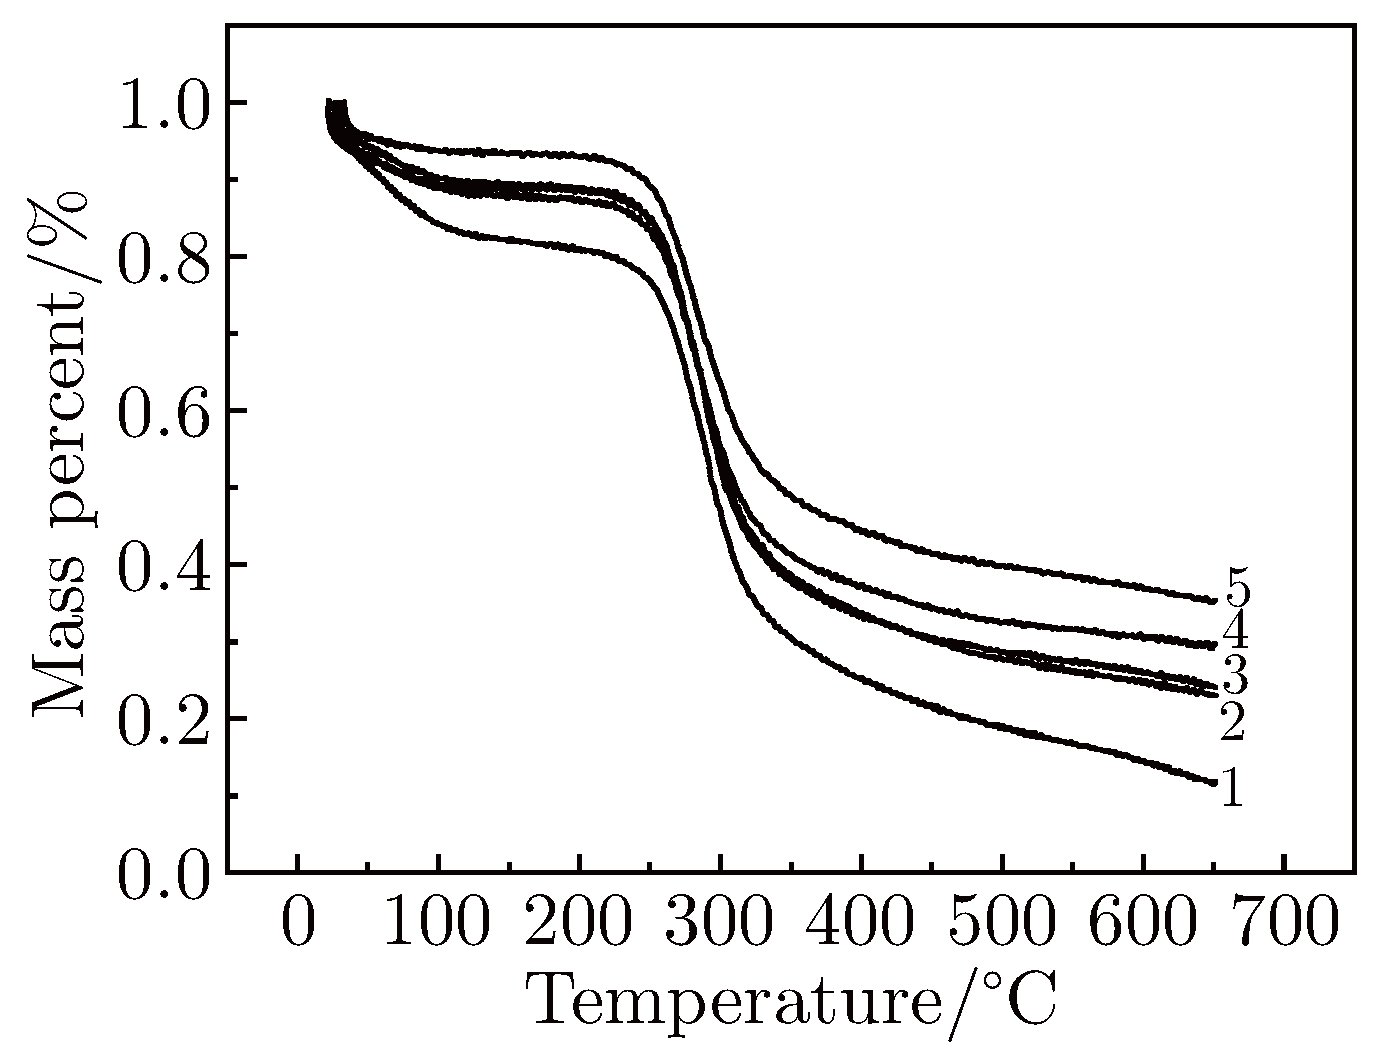
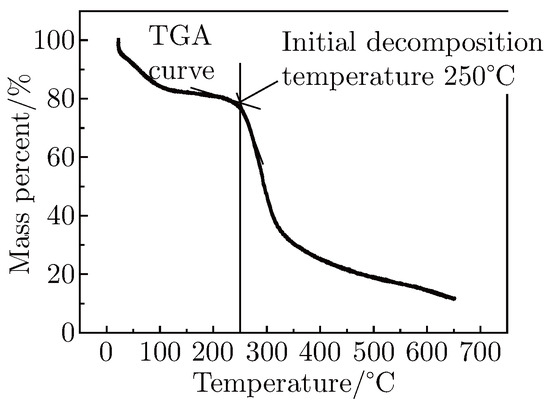
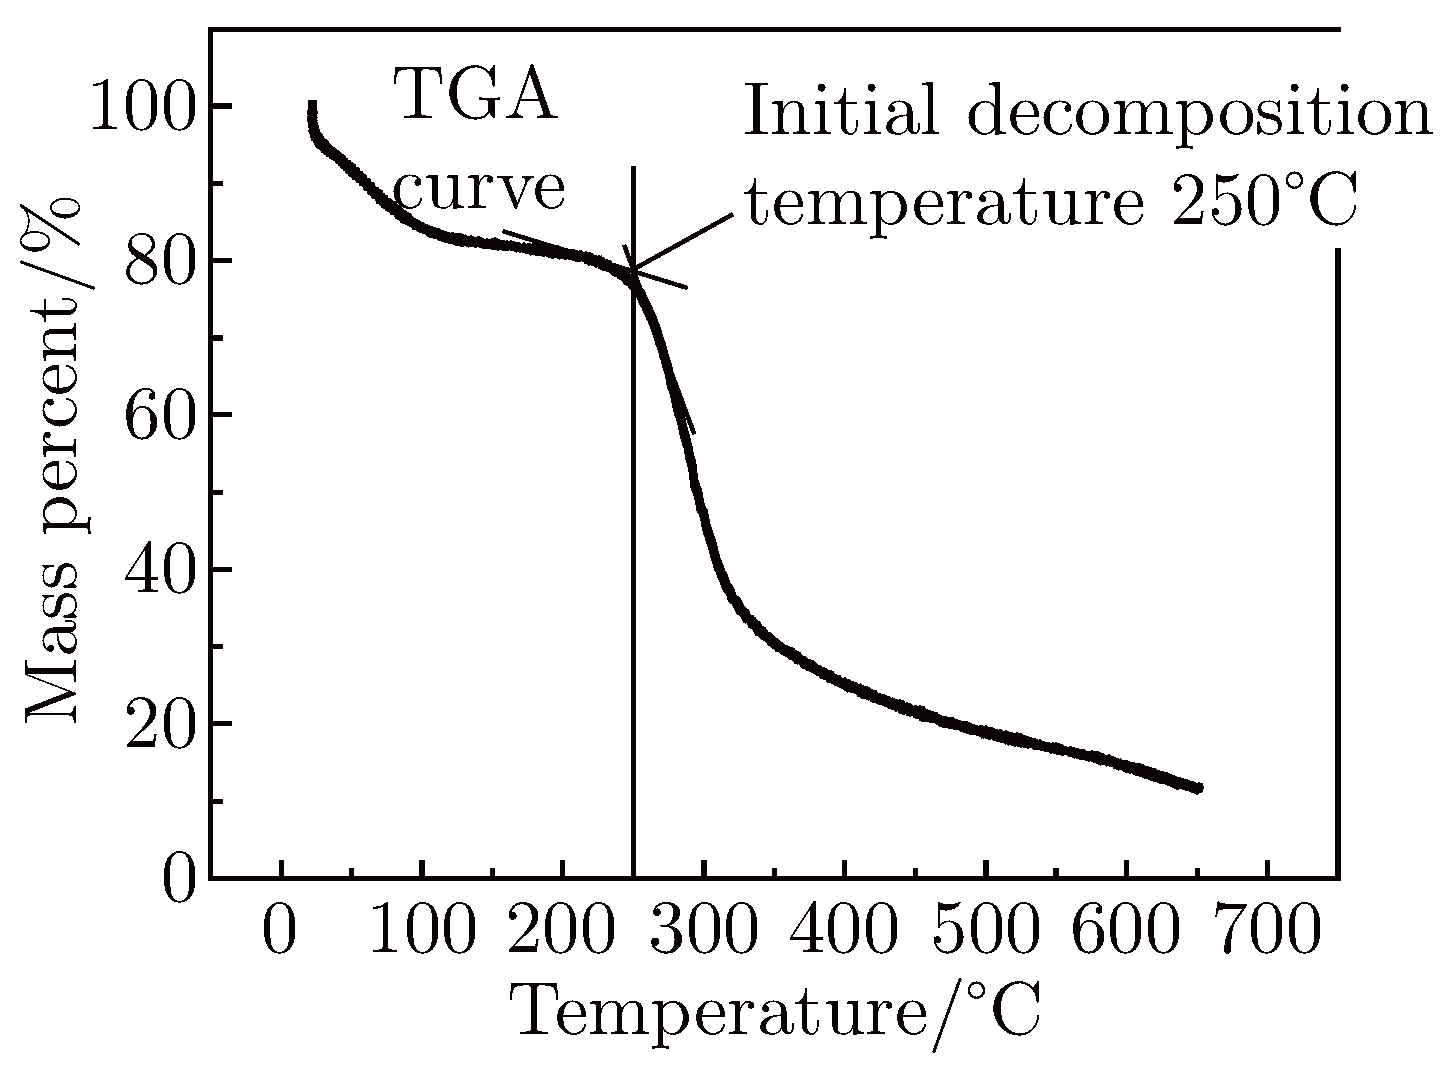
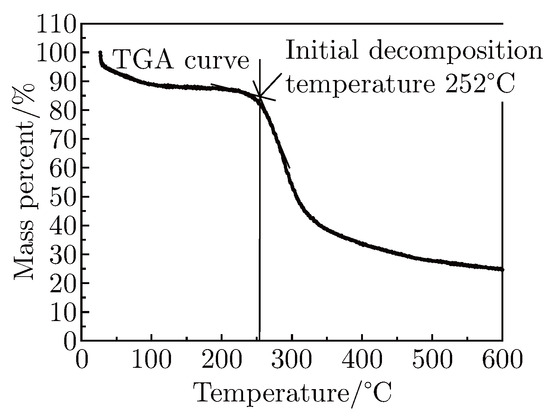
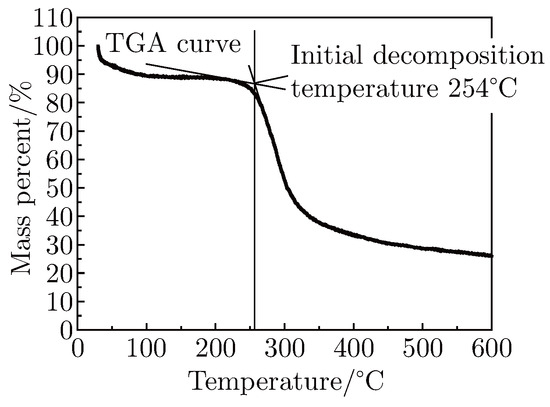
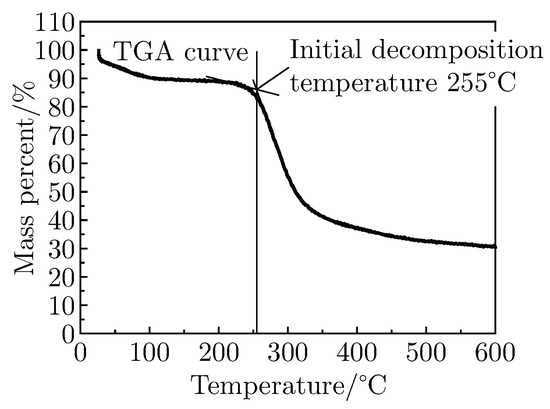
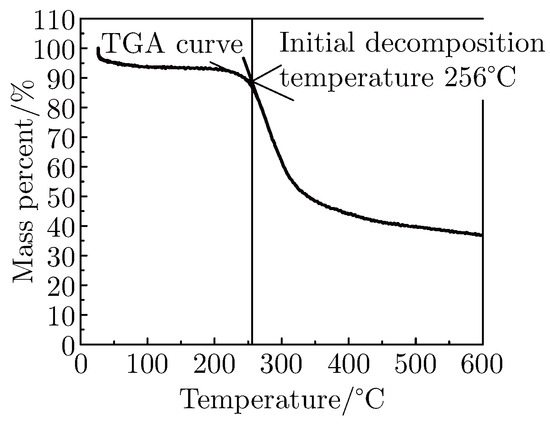
The Figure 11 shows the thermalgravimetric curves of nano TD/SF membranes, all of those possessed only one obvious thermal transition area, existing in around 300°C. In details, the free water evaporated, pure SF membrane and the blended SF membranes both bear 10% weight loss at 50°C. Then, heated up to 290-350°C, both pure SF membrane and the blended of SF membrane’s weight lost sharply. This is mainly caused by the decomposition of the SF molecular chain structure. Afterwards those curves leveled off until the reaction stopped. Figure 12, Figure 13, Figure 14, Figure 15 and Figure 16 show the change of initial decomposition temperature.
Figure 11.
TG curves of the nano TD/SF membranes. (1-5 curves separately show the mass ratios of naon TD/SF which are 0/100, 0.2/100, 0.4/100, 0.6/100, 0.8/100).
Figure 12.
The mass ration of nano TD/SF is 0/100.
Figure 13.
The mass ration of nano TD/SF is 0.2/100.
Figure 14.
The mass ration of nano TD/SF is 0.4/100.
Figure 15.
The mass ration of nano TD/SF is 0.6/100.
Figure 16.
The mass ration of nano TD/SF is 0.8/100.
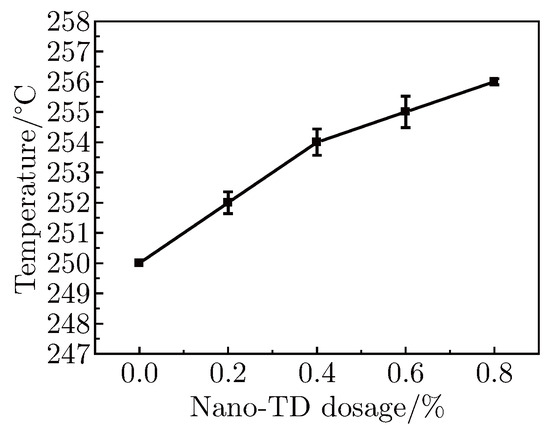
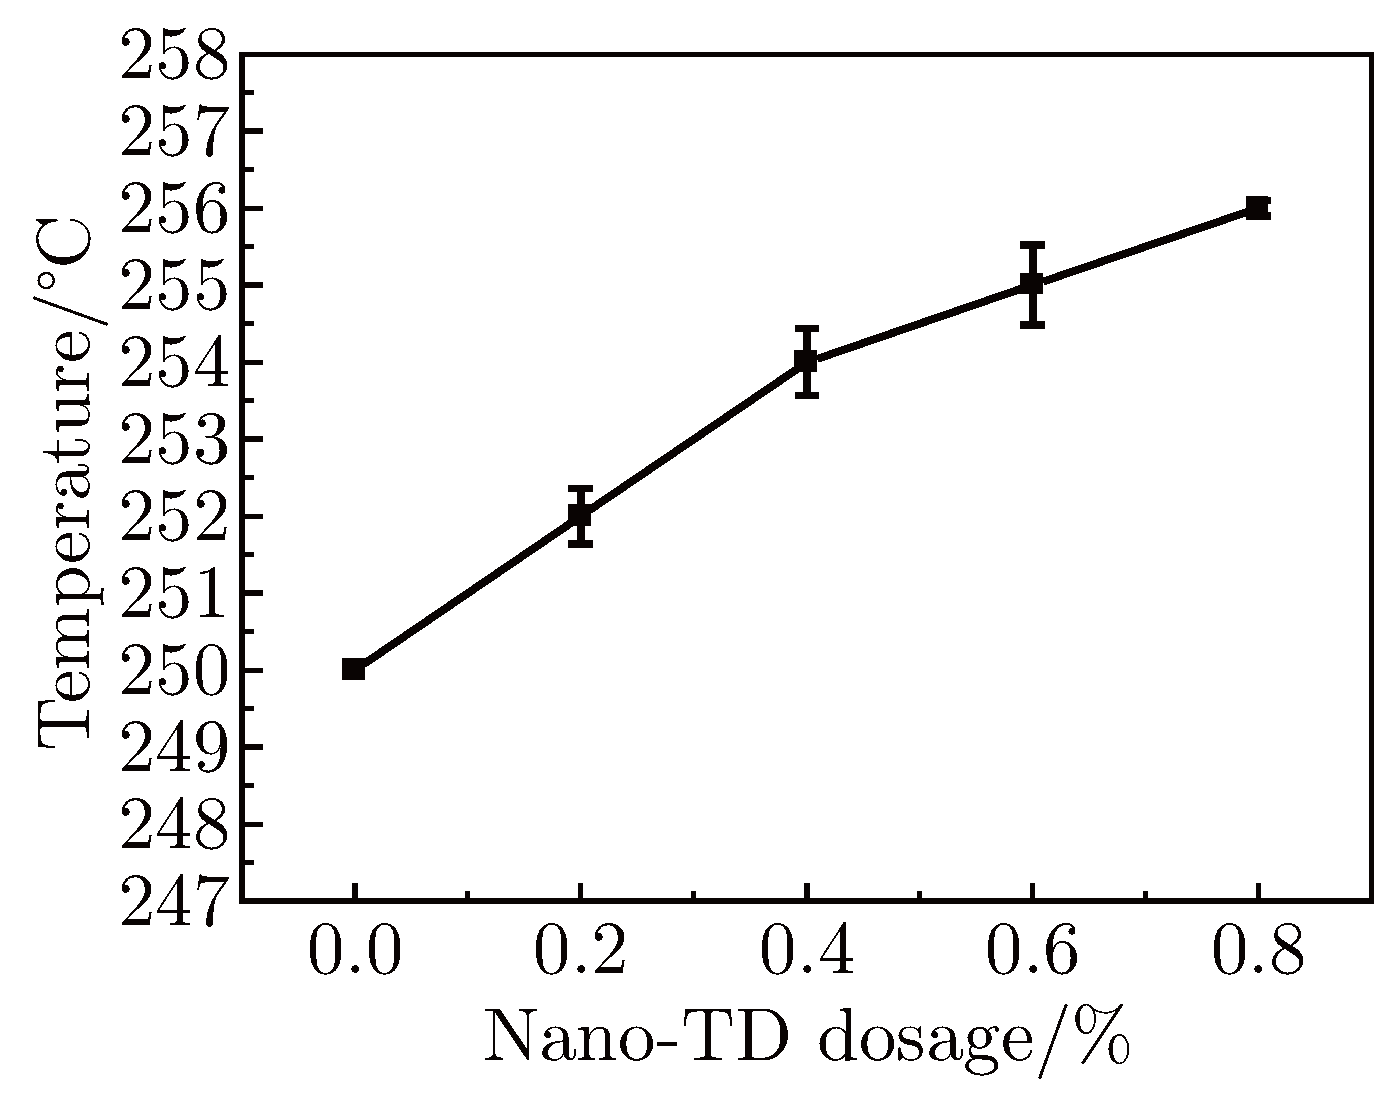
It can be seen in Figure 17, pure SF membrane initial decomposition temperature is 250°C and, it is also evident that for a nanoTD/SF weight ratio of 0.2%, the decomposition temperature of the blend membrane was 252°C. With an increase in weight ratio, the decomposition temperature increased. The highest temperature reach 256°C with 0.8% concentrate of nano TD. By adding more nano-TD, the crystallinity degree of SF increased, which could lead to the increase of energy to break the silk molecular chain. Thus, we concluded that the temperature was affected by the crystallinity degree, which illustrates that the configuration change is due to the different amount of nano TD. The nano TD acted as core centre for the SF to crystallize, which influenced the crystallization behavior of SF and prompted SF conformation changed from Silk I to Silk II.
Figure 17.
The relation curve between initial decomposition temperature and addition of nano TD.
3.3.5. Mechanical Testing
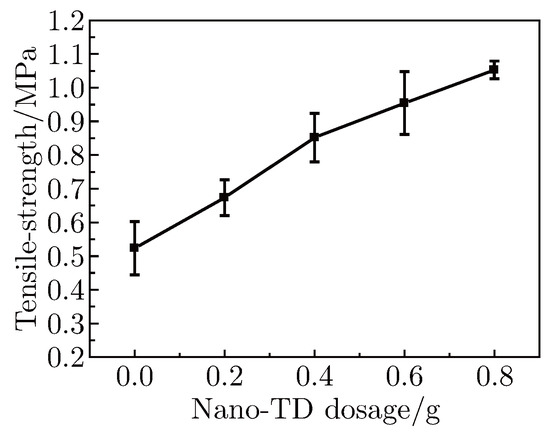
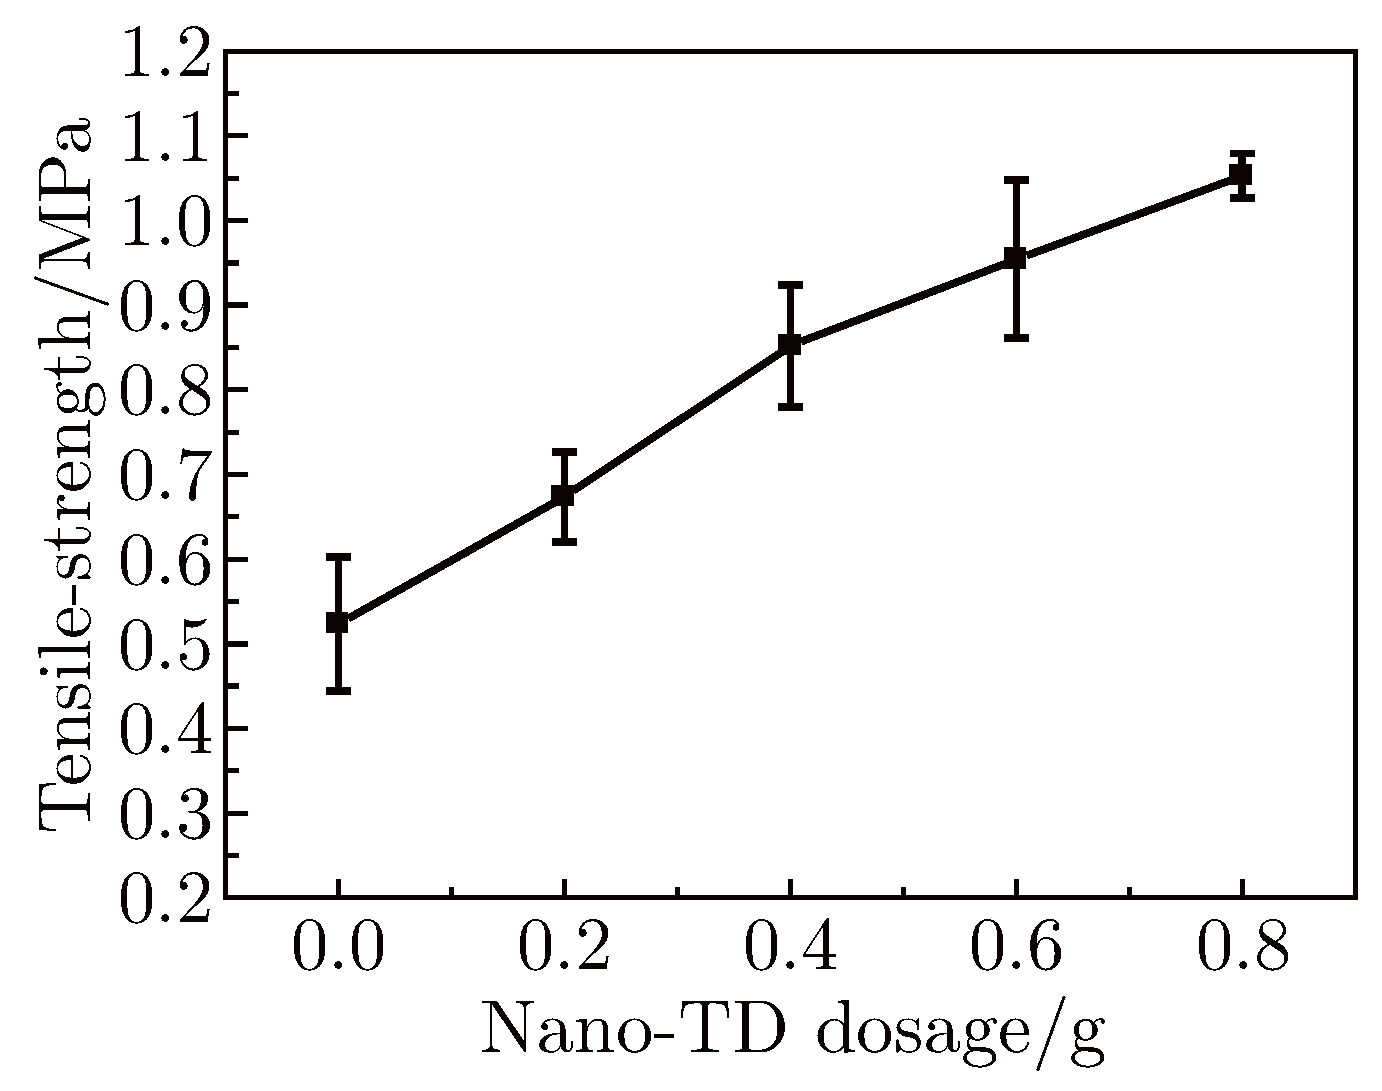
Pretreated with ethanol, the SF membranes were shown to be very brittle and had and poor mechanical properties. This limited the use of SF in biomedical application. However, after blending with PVA and nano-TD, the porous SF membranes gained special elasticity and improved mechanical properties. The results of Instron mechanical testing are shown in Table 4. All experiments were run in triplicate. Error bars shown the standard deviation of triplicate measurements.
Table 4.
Mechanical testing of silk fibroin membrane.
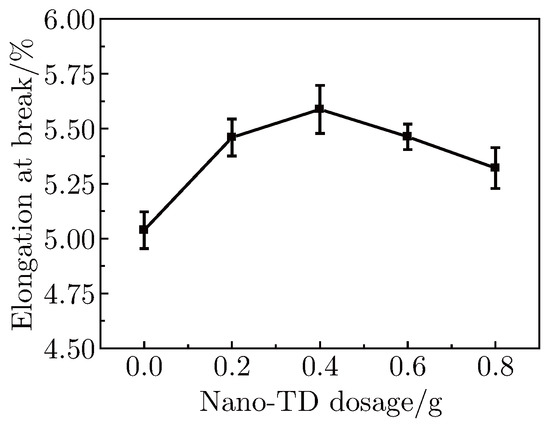
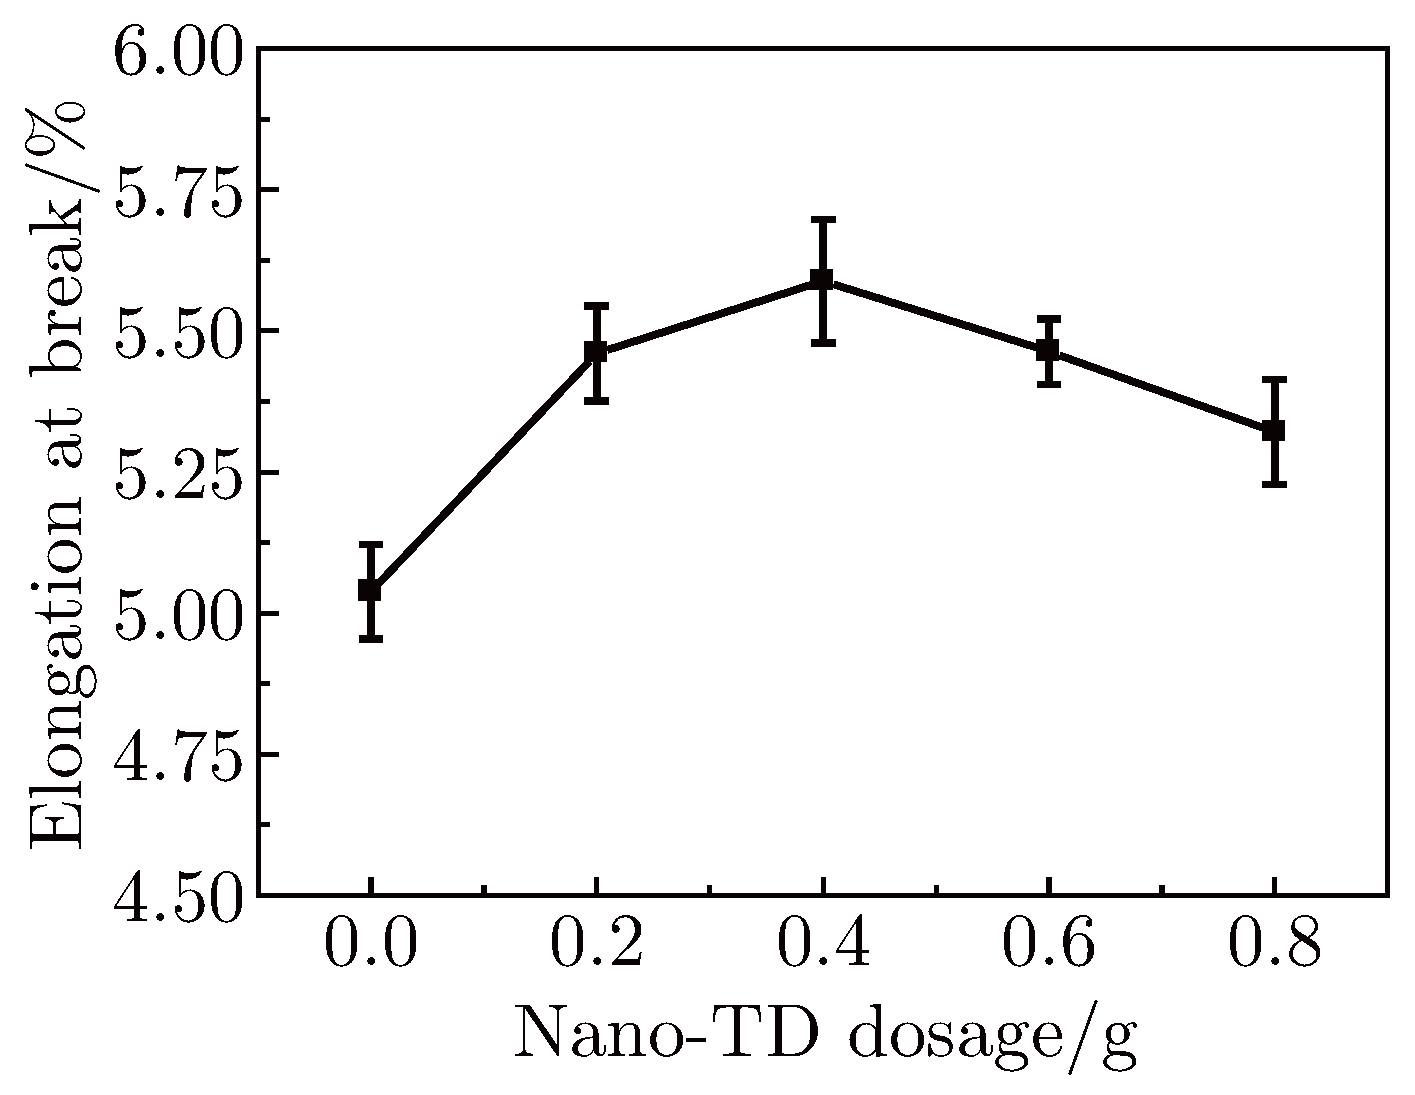
From Figure 18, the elongation at break was arised up to 5.58 at 0.4 g. nano TD blended and then decreased with the addition amount of nano TD. As seen in Figure 19, tensile strength obviously increased with the increased amount of nano TD, which indicated that the mechanical strength improved with adding certain amount of nano TD. This is due to the SF’s configuration change from Silk I to Silk II. The intermolecular hydrogen-bonding between SF and nano- particle were formed with the adding of nano-TD. As a result, the configuration of SF was rearranged from a disorderly structure to an orderly arrangement.
Figure 18.
The relation curve between elongation at break and addition of nano TD.
Figure 19.
The relation curve between tensilestrength and addition of nano TD.
4. Conclusion
SF membranes have wide applications in chemical and biological fields. It is possible to prepare nanoTD/SF blend membranes. In this work, FTIR and XRD results indicated that nanoTD particles induced a transition in the SF macromolecules from a Silk I to Silk II structure, leading to higher crystallinity of the blend membrane, which thus showed better tensile strength and non-shattering properties. Because of those, the nanoTD blended SF membrane could widen the potential application of silk fibroin and would be found usefully in many biomaterial fields including artificial skin, tissue engineering scaffold and other biomaterial fields.
References
- Hyde N. The Queen of Textiles.National Geographic Magazine 1984, 165, 2-49.
- Liang J W, Wu J L, Wang W X. Application of natural silk and regenerated silk as biological materials. Fangzhi Keji Jinzhan 2010, 5, 24-27.
- Li X Y, Feng L X. Dissolution and regeneration properties of silk fibroin in ionic liquid. Bei Jing Fuzhuang Xueyuan Xuebao Ziran Kexueban 2010, 30(2), 42-47.
- Jiang C Y, Wang X Y, Ray G et al. Mechanical properties of robust ultrathin silk fibroin films. Advanced functional materials 2007, 17, 2229-2237.
- Zhu Z H, Kikuchi Y, Kojima K, et al. Mechanical properties of regenerated bombyx mori silk fibers and recombinant silk ¯bers produced by transgenic silkworms. Journal of Biomaterials Science, Polymer Edition 2010, 21(3), 395-411.
- Zuo B Q, Liu L G, Zhang F. Structure and properties of regenerated Antheraea pernyi silk fibroin. Jour- nal of Applied Polymer Science 2009, 113(4), 2160-2165.
- Lawrence B D, Marchant J K, Pindrus M A. Silk film biomaterials for cornea tissue engineering. Bioma- terials 2009, 30(7), 1299-1308.
- Ogueira G M, Rodas A D, Higa O Z et al. Preparation and characterization of ethanol-treated silk fibroin dense membranes for biomaterials application using waste silk fibers as raw material. Bioresource Technology 2010, 101(21), 8446-8451.
- Altman G H, Horan R L, Collette A L et al. Silk fibroin hydrogels for biomedical uses. PCT Int. WO 2010123946, 2010.
- Sun D H, Wu Z Y, Lu F. Study on the Structure and Properties of the Mixed Membrane of Polyvinyl Alcohol/Silk Fibroin. Silk Monthly 2001, 11, 6-9.

© 2011 Textile Bioengineering and Informatics Society. This article is an open access article distributed under the terms and conditions of the Creative Commons Attribution (CC BY) license (https://creativecommons.org/licenses/by/4.0/).