


Abstract
Bubble electrospinning is a novel method to produce ultrafine nanofibers. In this work, a mathematical model of the electric field distribution in a critical state was established for bubble electrospinning process and was numerically simulated using finite element method. The results indicated that the maximum electric force occurred at the tip of the bubble, it is probably for this reason that the first jet occurs at the tip of the bubble, when the electrical force exceeds the surface tension, which also possibly induces bubble bursting.
1. Introduction
Electrospinning is an economical and straightforward method to produce ultrafine nanofibers from polymer solutions [1,2]. In this process, the electrostatic force, which is generated in an electrical field from a variety of polymer solutions, enables the production of ultrafine nanofibers. The traditional electrospinning setup uses a hollow needle as the spinning nozzle. Each nozzle only generates one polymer jet that results in a very limited fiber productivity, about 0.1-1.0g/h [3].
Bubble electrospinning, as a novel electrospinning technique, was designed to increase the number of jets which finally formed nanofibers. In bubble electrospinning, multiple jets can be easily obtained by the bursting of the polymer bubble which is produced by releasing the compressed gas via a gas tube (the reader can refer to [4,5] for a detailed description of the bubble electrospinning process and its principles). The electrostatic force on bubble surface plays a key role in bursting of the bubble. Although various experimental studies have been conducted, a mathematical model has not yet been obtained. In this work, a 2D mathematical model of the electric field distribution in a critical state was established for bubble electrospinning process. For simplicity, some assumptions were considered such as the bubble was exposed to a uniform electrical field and the polymer solution was perfectly dielectric. In the critical state, we assumed that the bubble was elliptical and it was symmetrical around the central axis in the rectangular coordinate in a two-dimensional condition.
2. Mathematical model of electrical field distribution
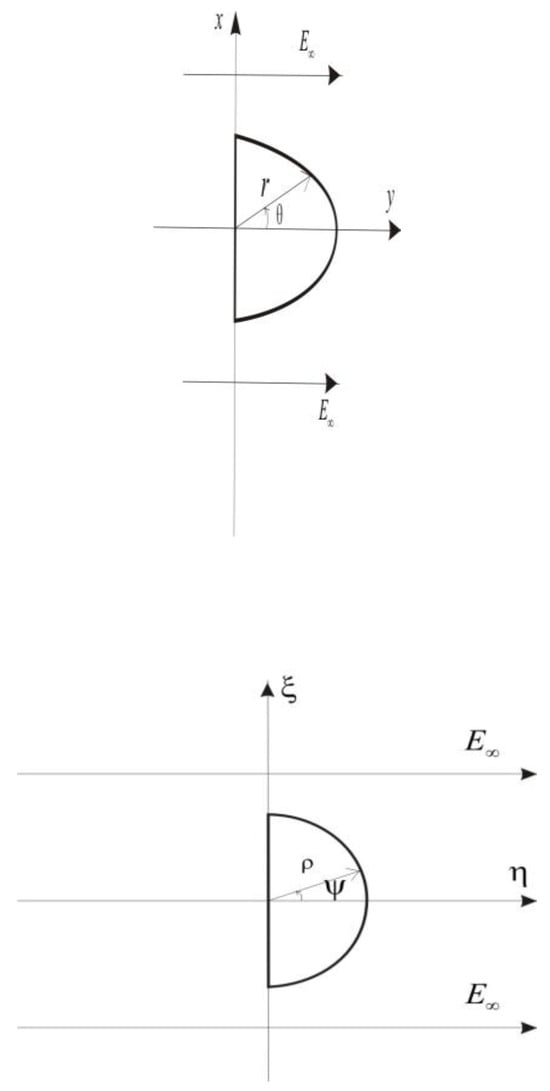
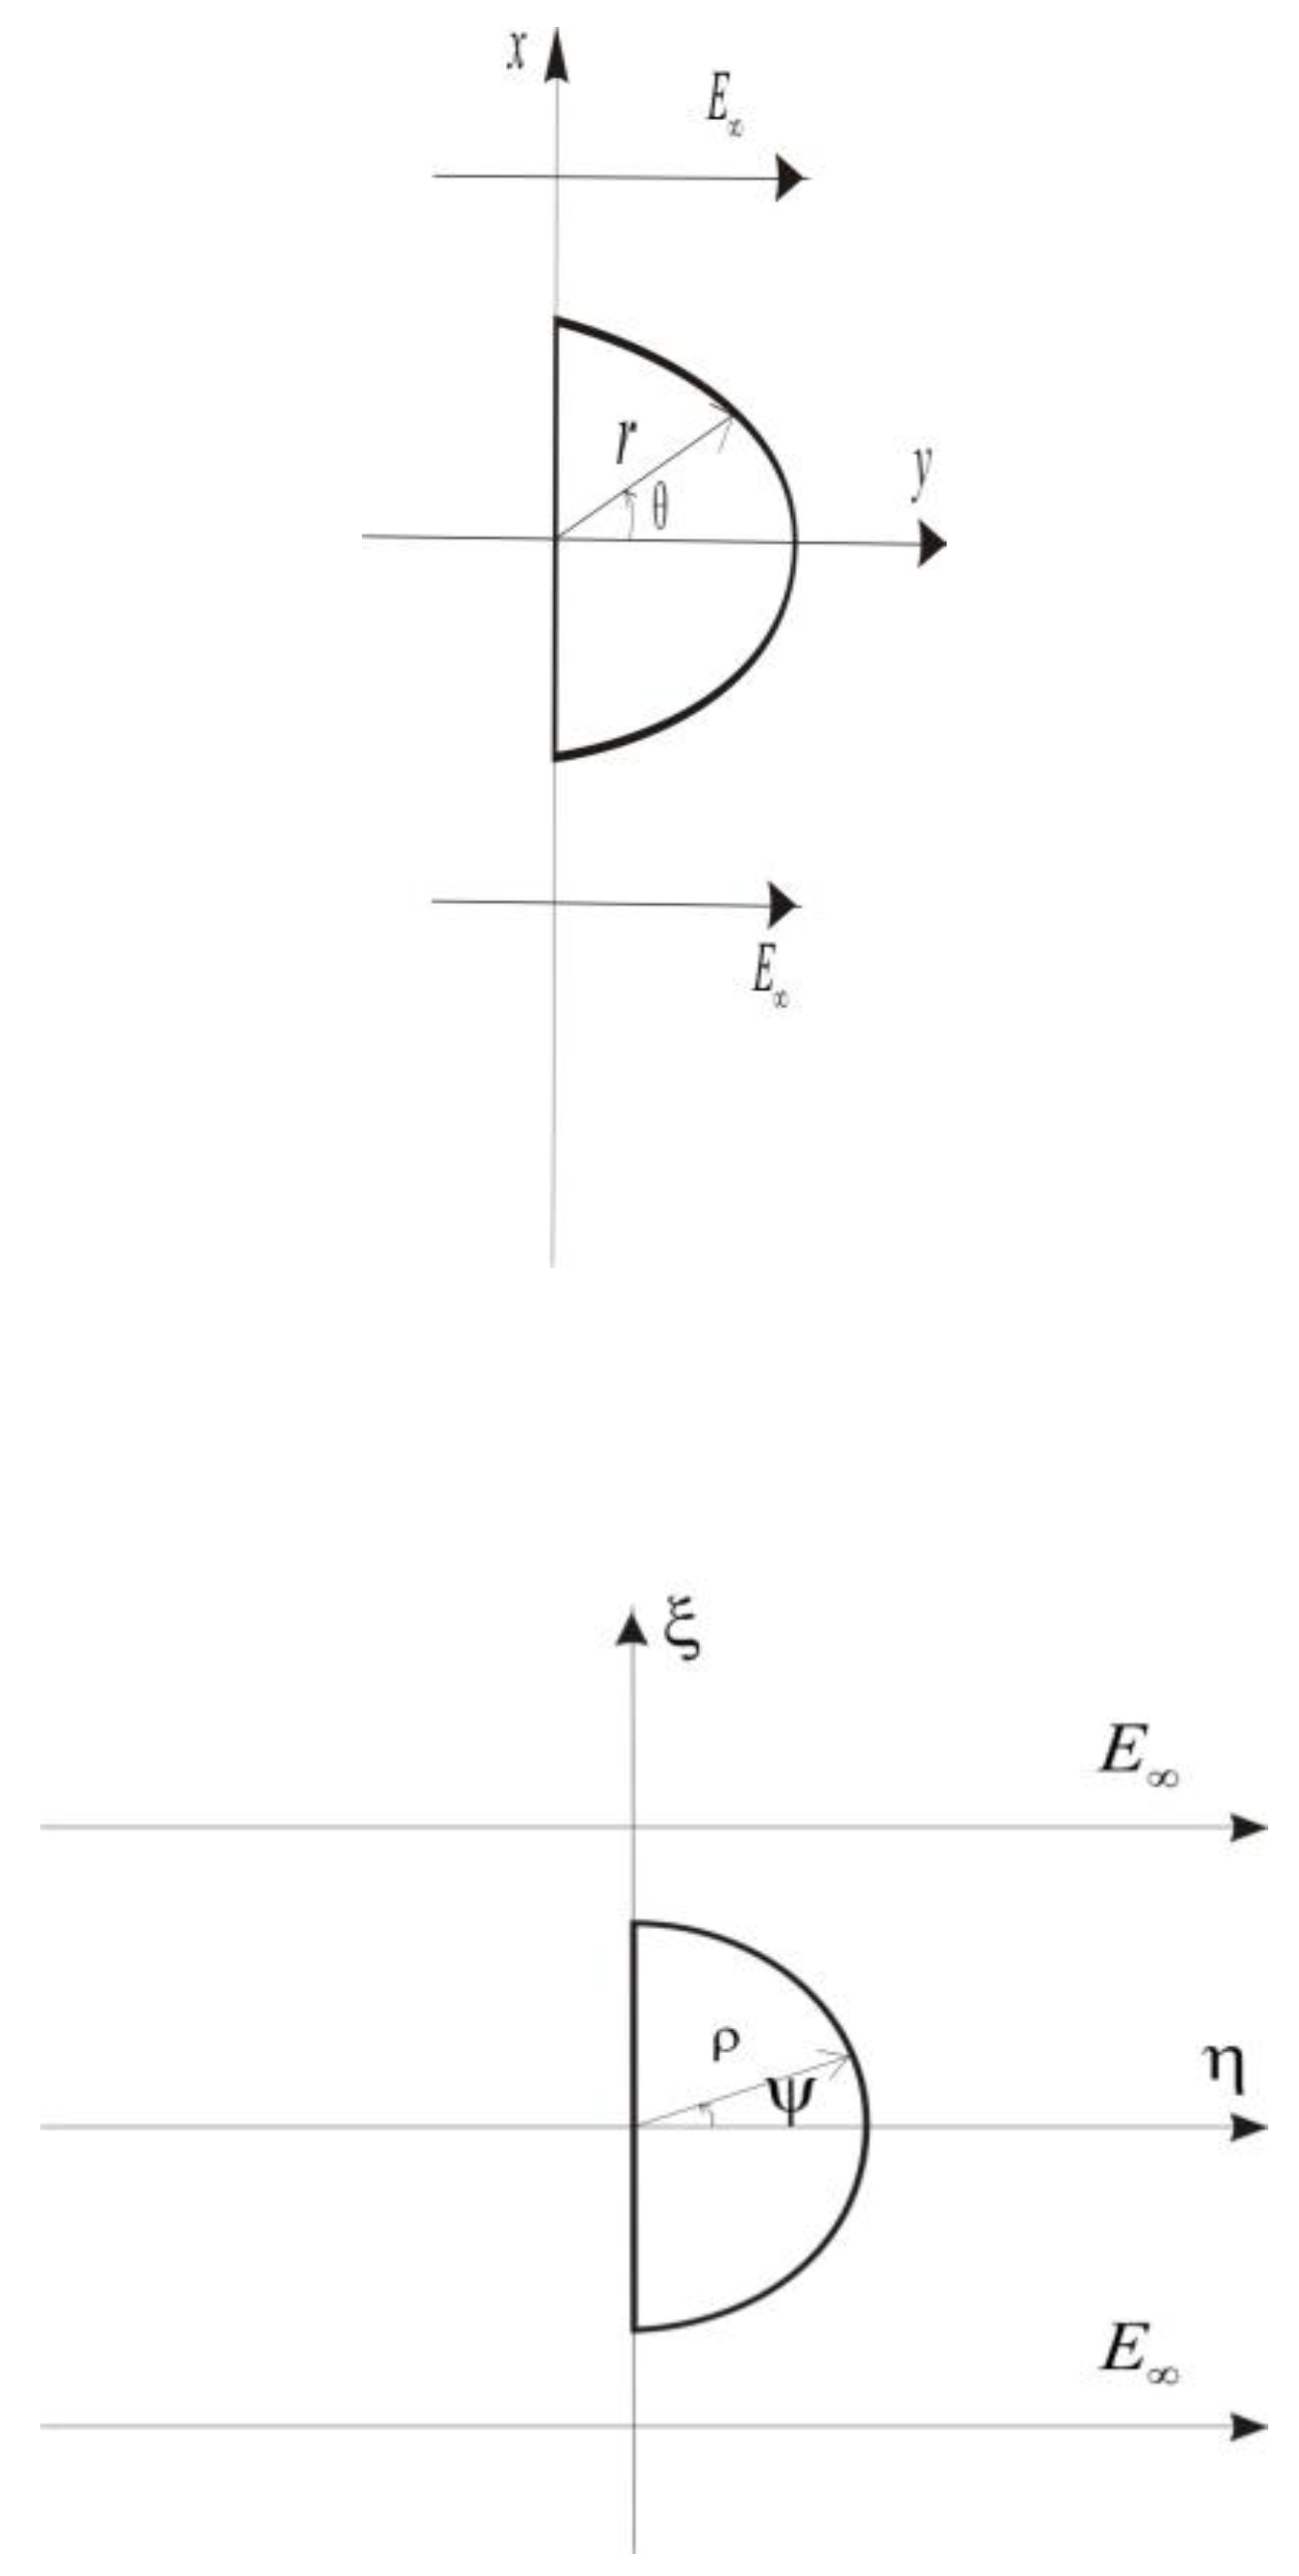
According to our previous studies [4,5,6], the bubble was subjected to electric field and stretched from a spherical shape to a cone shape. In order to simplify the calculation, we assumed that the bubble is elliptical in shape at the critical state in this process. Joukowski Transformation, which is a conformal map historically used to understand some principles of airfoil design, was used to describe the deformation of the bubble. The transform is
where and are complex variable, and a presents major semiaxis and minor semi-axis of the ellipse, respectively. According to Eq. (1), the equations can be obtained as follows:
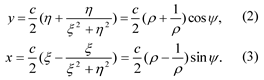
When
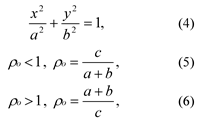
Where is the radius of circle in the plane. And is the polar angle and is the radial distance from the origin in the cylindrical coordinates. So the elliptical bubble is generated in the z plane by employing the Joukowsky transform to a circular bubble in the plane, as shown in Figure 1.
Figure 1.
(a) the z plane; (b) the ζ plane.
The behavior of a fluid cylinder suspended in another fluid and subjected to an electrical field has been discussed by MN Reddy and A Esmaeeli [7]. In their paper, a mathematical model of the electrical field distribution for a perfect dielectric fluid immersed in another a perfect dielectric fluid was established. Based on their study, the electric potential outside the polymer circular bubble, which is surrounded by air in the plane, can be expressed as
where presents uniform Electrical field strength in the plane, and are the relative permittivities of the bubble and the air, respectively.
According to Eqs. (2) and (3), we can get
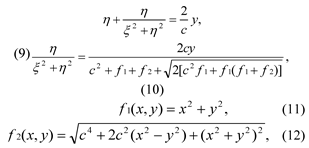
The electric potential outside the polymer’s elliptical bubble in the z plane can be expressed as
Since the electric field is irrotational, it is possible to define the electric field strength and , which are the Y-axis direction and the X-axis direction components of the electrical field strength, respectively.
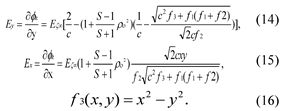
Where and are the electrical field strength on the elliptical bubble surface respectively. According to Eqs. (4) and (5), we obtained
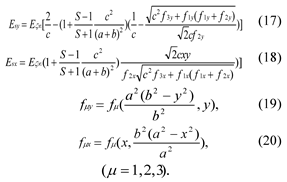
To simplify the calculation, here we assume that the electrical field is uniform. Thus
where U is the applied voltage in bubble electrospinning, and represent the distance between the metal electrodes and the grounded collector in the and z plane respectively.
3. Results and discussion
In order to numerically simulate the electrical field distribution, a CFD software package, ANSYS 11.0, was used to analyze the electrical field strength distribution at the critical state in bubble electrospinning. For meshing the calculation domain, PLANE121, which is a 2-D, 8-node, charge-based electric element, was used in the bubble and neighbourhood. The element had one degree of freedom voltage, at each node. The values of those parameters that were designed are listed in Table 1.
Table 1.
Some parameters used in calculation.
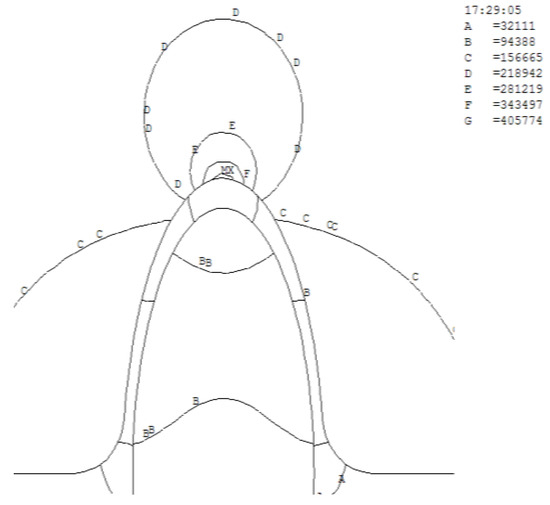
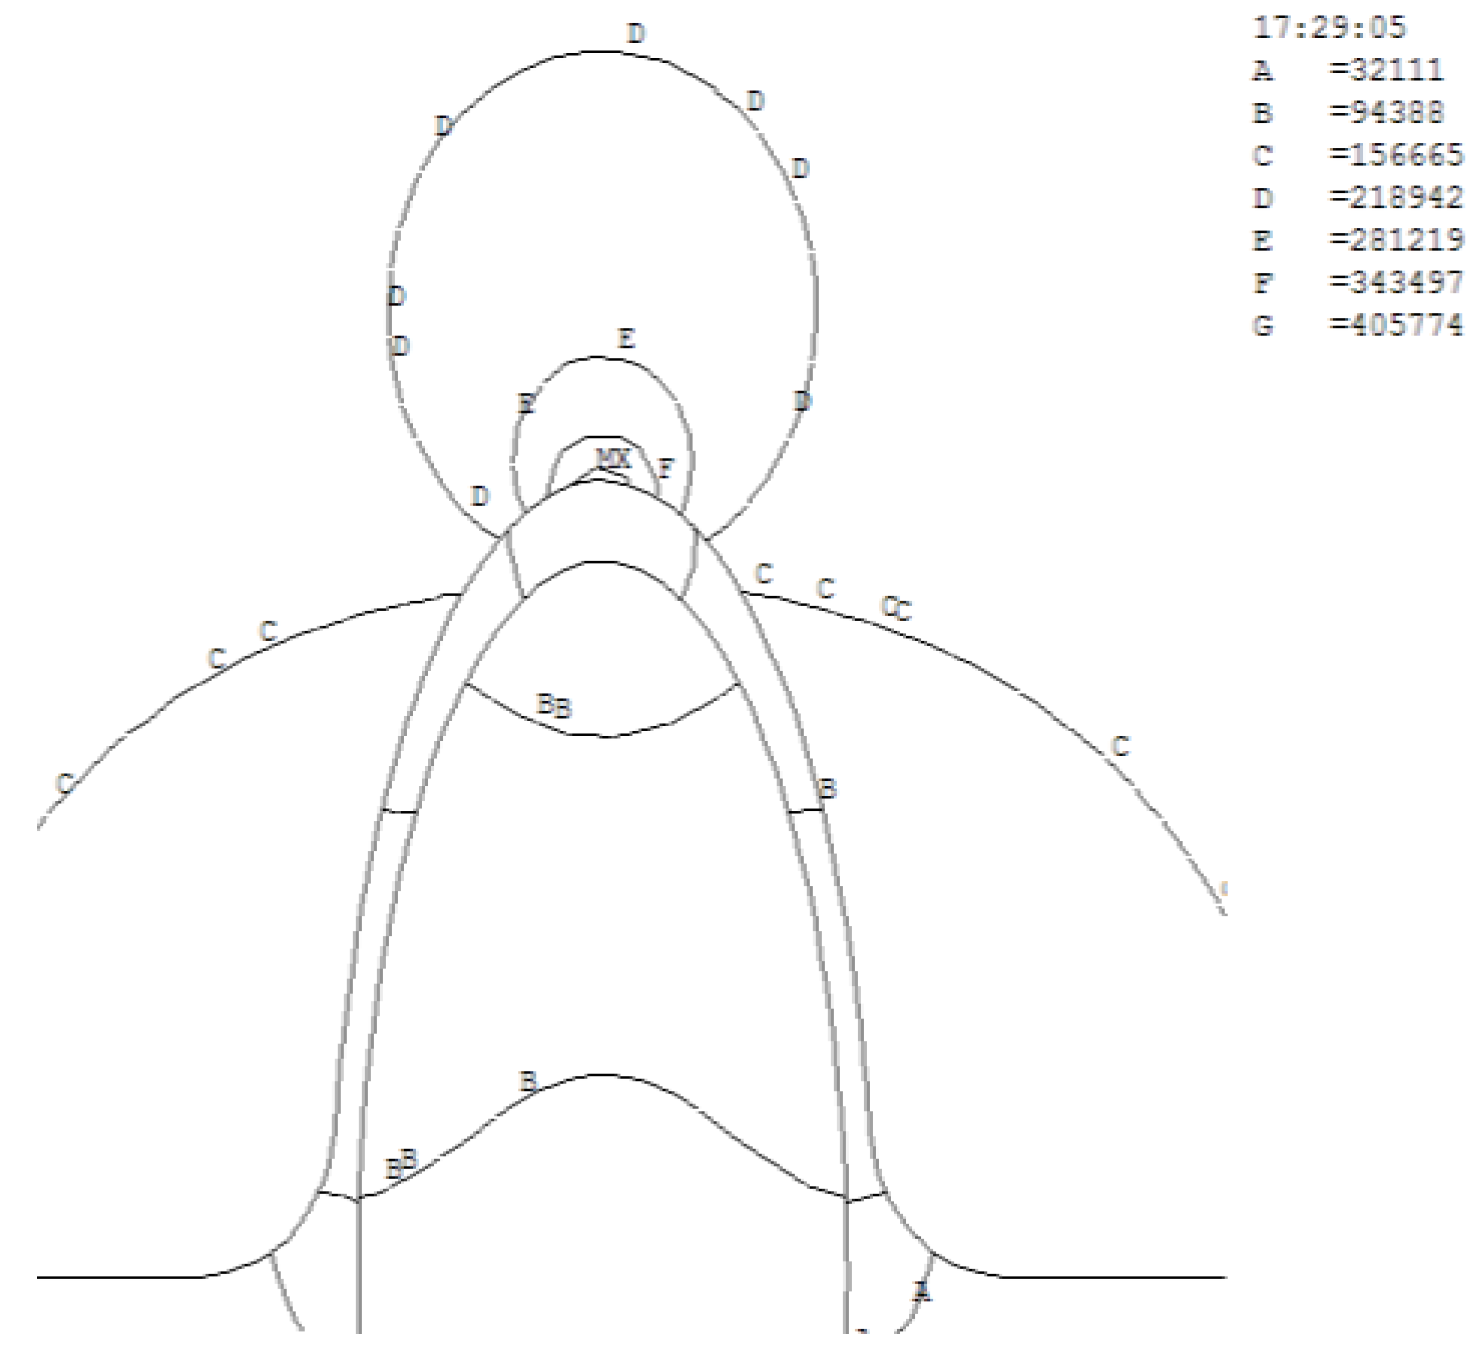
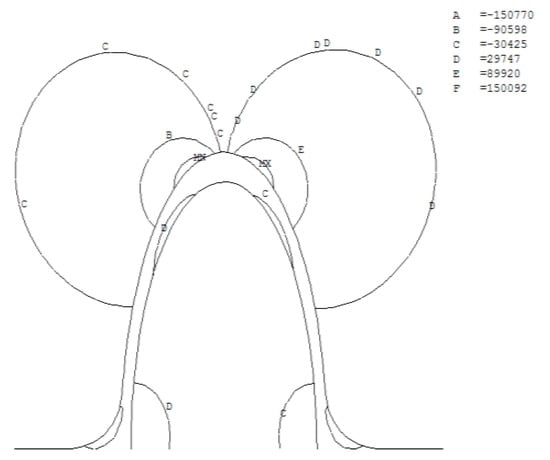
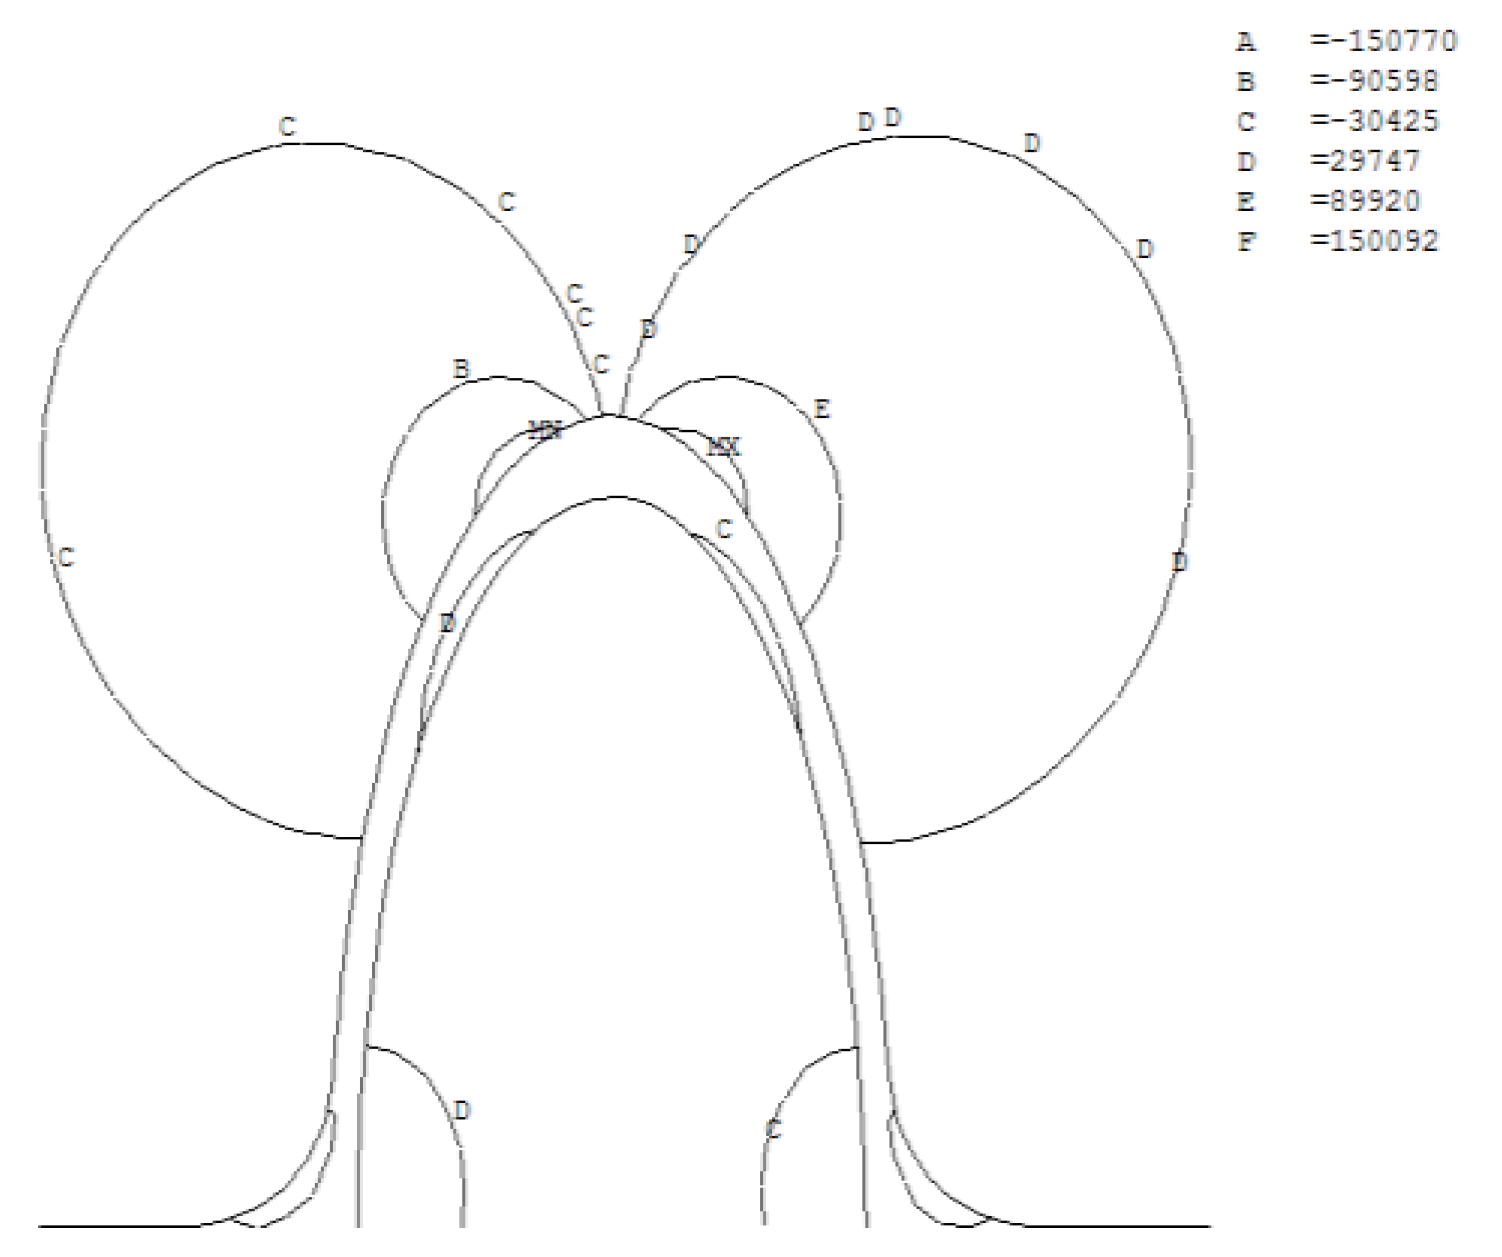
The results of the numerical simulation, as shown in Figure 2 and 3, show that the Y-axis and X-axis electrical field distribution nephogram of the whole area, respectively. In Figure 2, the label "MX" at the tip of bubble, indicated that the maximum value of the electrical field strength was located there. And the Y-axis Electrical field strength decreased gradually from the tip to the bottom of the bubble. The values of electrical field strength suddenly and precipitously increased around the tip of the bubble. As shown in Figure 3, the X-axis electrical field distribution is symmetric, which possibly indicates that the electrical force has little effect on the process.
Figure 2.
The contour map of Y-axis Electrical field Ey.
Figure 3.
The contour map of X-axis Electrical field Ex.
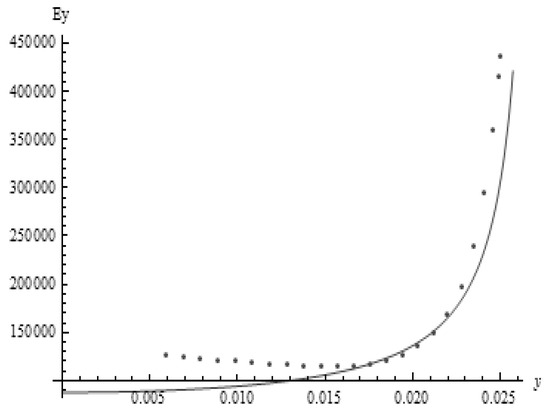
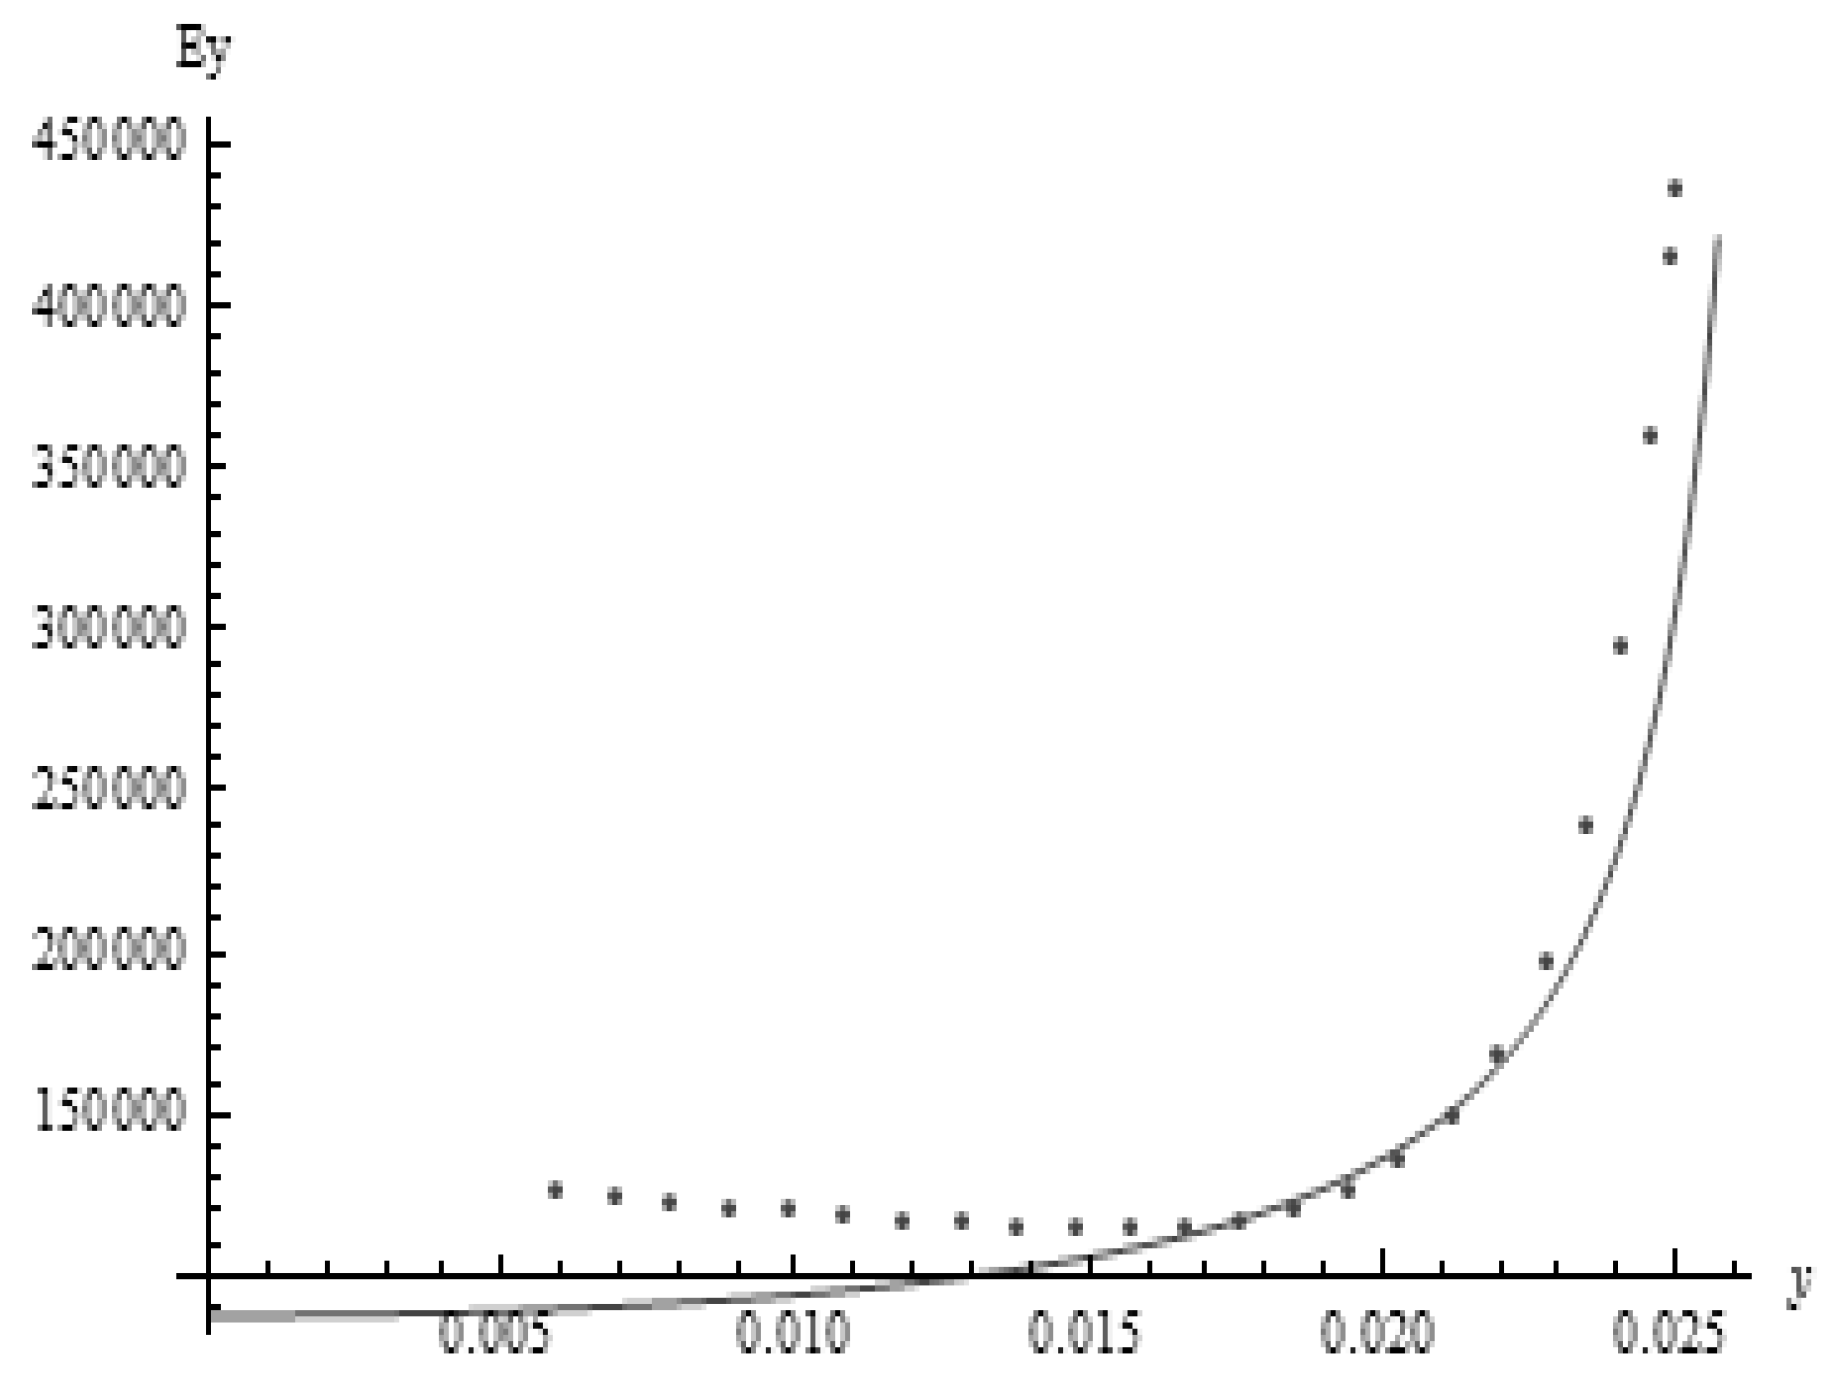
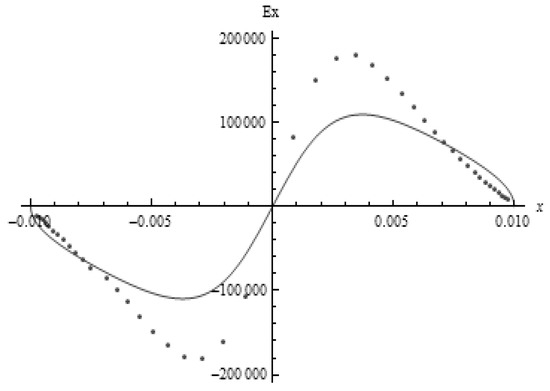
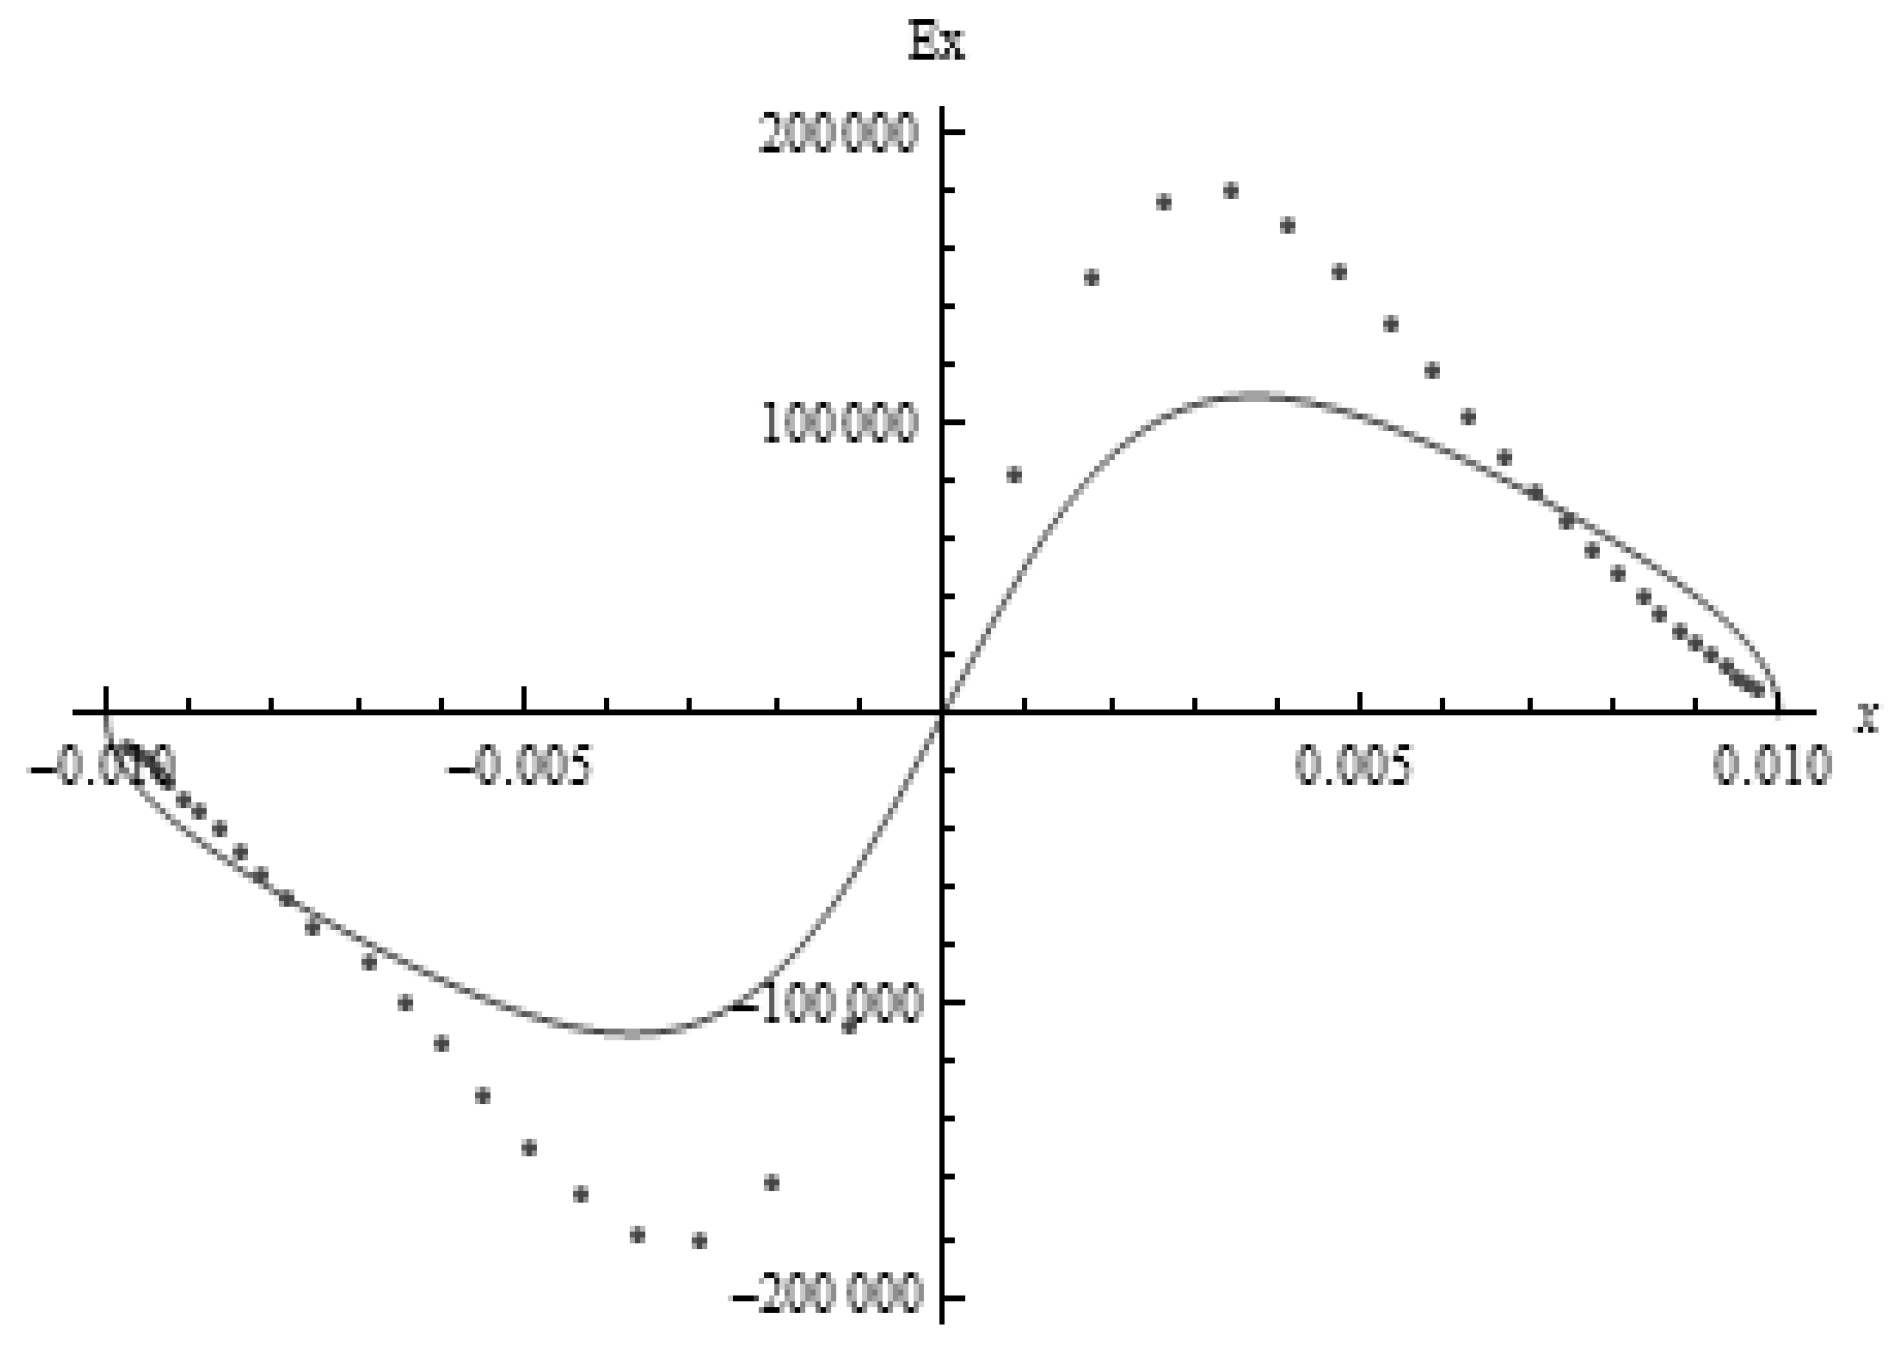
When the values in Table 1 are substituted in Eqs. (7) and (8), the graphical representations of those equations are shown in Figure 4 and Figure 5, respectively. The vertical axis represents the Electrical field strength (E) and the horizontal axis represents the transverse radius and the longitudinal radius, respectively. The scattered dots were obtained by plotting and values of nodes on bubble surface from the 2D CFD simulation results. It can be easily found that the electrical field strength distribution model corresponds well with the results of the simulation.
Figure 4.
The distribution of the electric field components Ey. The points represent the result obtained from the numerical simulation and the solid curve represents Eq. 7.
Figure 5.
The spatial distribution of the electric field components Ex. The points represent the result obtained from the numerical simulation and the solid curve represents Eq. 8.
According to the Coulomb’s electric force law, the electric force equation is
where q is the surface charge per unit length. Considering the electrical field strength distribution on the bubble, we can conclude that the maximum electrical force acts on the tip of bubble. It is for this reason that the first jet occurs at the tip of bubble, when the electrical force exceeds the surface tension. This also possibly induces bubble bursting.
4. Conclusions
In this paper, we developed a mathematical model of the electrical field distribution at a critical state in bubble electrospinning process. According to the analysis of the electrical field strength distribution on the surface of elliptical bubble, we found that the maximum electric force occurs at the tip of bubble. It is for this reason that the first jet occurs at the tip of the bubble, when the electrical force exceeds the surface tension, which also possibly induces bubble bursting.
Acknowledgment
This work is supported by National Natural Science Foundation of China No.51003073, Key Project of Chinese Ministry of Education No.210006, Tianjin Universities Science and Technology Development Fund Project No.20080322, National Science Foundation of Tianjin Nos.10JCYBJC02200 (Y. Liu) and 09JCYBJC04500 (W.Kang), and Research Program of China Petrochemical Corporation No. 208071.
References
- He, J.H.; Liu, Y.; Mo, L.F.; Wan, Y.Q.; Xu, L. Electrospun nanofibers and their applications; Smithers Rapra Technology: UK, 2008. [Google Scholar]
- Liu, Y.; He, J.H.; Yu, J.Y.; Zeng, H.M. Controlling numbers and sizes of beads in electrospun nanofibers. Polym. Int. 2008, 57, 632–636. [Google Scholar] [CrossRef] [Scilit]
- Zhou, F.L.; Gong, R.H.; Porat, I. Mass production of nanofibre assemblies by electrostatic spinning. Polym. Int. 2009, 58, 331–342. [Google Scholar] [CrossRef] [Scilit]
- Liu, Y.; He, J.H. Bubble electrospinning for mass production of nanofibers. Int. J. Nonlinear Sci. 2007, 8, 393–396. [Google Scholar] [CrossRef] [Scilit]
- Liu, Y.; He, J.H.; Xu, L.; Yu, J.Y. The principle of bubble electrospinning and its experimental verification. J. Polym. Eng. 2008, 28, 55–66. [Google Scholar] [CrossRef] [Scilit]
- Liu, Y.; He, J.H.; Wang, R.; Xu, L.; Yu, J.Y. Multiple Jets from a Polymer Bubble in Electrospinning. In Proceedings of The Fiber Society 2009 Spring Conference, Vols I and II; Textile & Apparel Press: Beijing, China, 2009; pp. 411–413. [Google Scholar]
- Reddy, M.N.; Esmaeel, A. The EHD-driven fluid flow and deformation of a liquid jet by a transverse electric field. Int. J. Multiph. Flow 2009, 35, 1051–1065. [Google Scholar] [CrossRef] [Scilit]


© 2010 Textile Bioengineering and Informatics Society. This article is an open access article distributed under the terms and conditions of the Creative Commons Attribution (CC BY) license (https://creativecommons.org/licenses/by/4.0/).