


Abstract
Our aim is to develop a pantyhose that fit without being too tight and to reduce muscle fatigue. This study was conducted with 17 Japanese women who wore two types of pantyhose with a structural difference in the panty part. When wearing pantyhose with a clothing pressure that gradually increased from 2.9 hPa in the waist to 11.0 hPa in the foot, participants reported a nearly perfect pressure sensation using a ratio scale. Thus, pantyhose with an optimized pressure sensation can be created according to the clothing pressure gradient rule. When participants wore pantyhose, EMG changes in the lower leg significantly restricted muscle activity when compared to that in the barefoot condition, that was clarified the local distribution of pressure intensity determines the intensity of muscle activity.
1. Introduction
Wearing high heels can make the wearer appear taller, which results in a slimming effect on the appearance of the legs. However, compared with being barefoot, wearing high heels is thought to put more strain on the lower legs [1,2,3,4,5,6]. Pantyhose makes the appearance of bare skin beautiful [7] and pantyhose is often worn with pumps and exerts cosmetic effects [8], such as raising the hip line and causing the legs to appear longer. In order to create a more comfortable pantyhose, Dan et al. calculated the compression rate of the abdomen during wearing and attempted to provide useful information for manufacturing comfortable pantyhose [9]. When actually wearing legwear, Liu et al. stated that the difference in skin pressure of the four stages affects core body temperature and skin temperature. High skin pressure (moderate level: 25.1-32.1 mmHg, strong level: 36.4-46.5 mmHg at the ankle) due to compression legwear increasing skin temperature and core temperature transiently, but both significantly decrease with long-term wear. In other words, it had a negative impact on the human body. However, when wearing compression legwear, the light and mild level skin pressure (10-14 mmHg, 18.4-21.2 mmHg in that order) decreased the leg fatigue feeling and maintained a comfortable wearing sensation after wearing for 180 min [10]. Nakahashi et al. used pantyhose to apply a high pressure of about 3-5 kPa only to the calf part but compared to the control of 1 kPa or less, the support-type pantyhose stated that the heart rate and core temperature decreased [11]. In this way, we thought that a pantyhose pressure design that could be completed within a physiologically comfortable pressure range for humans was necessary. Therefore, the purpose of this paper is to clarify the allowable pressure when wearing pantyhose and to clarify the pressure distribution when pantyhose is made.
Heavy clothing pressure leads Wearers typically expect pantyhose to fit well but not too tightly, and for the pantyhose to reduce fatigue on the legs and hips when wearing heeled shoes. Thus, the goal of this research study was to develop pantyhose that can reduce leg muscle fatigue [12] when wearing heels. In more specific terms, to develop a product that reduces muscle activity in the lower limbs and provides a comfortable wearing sensation when worn for many hours daily. Therefore, the relationship between clothing pressure and pressure sensation while wearing pantyhose was investigated changes in the muscle activity with and without pantyhose were examined [13].
2. Experimental Methods
2.1. Design and Composition of Experimental Pantyhose
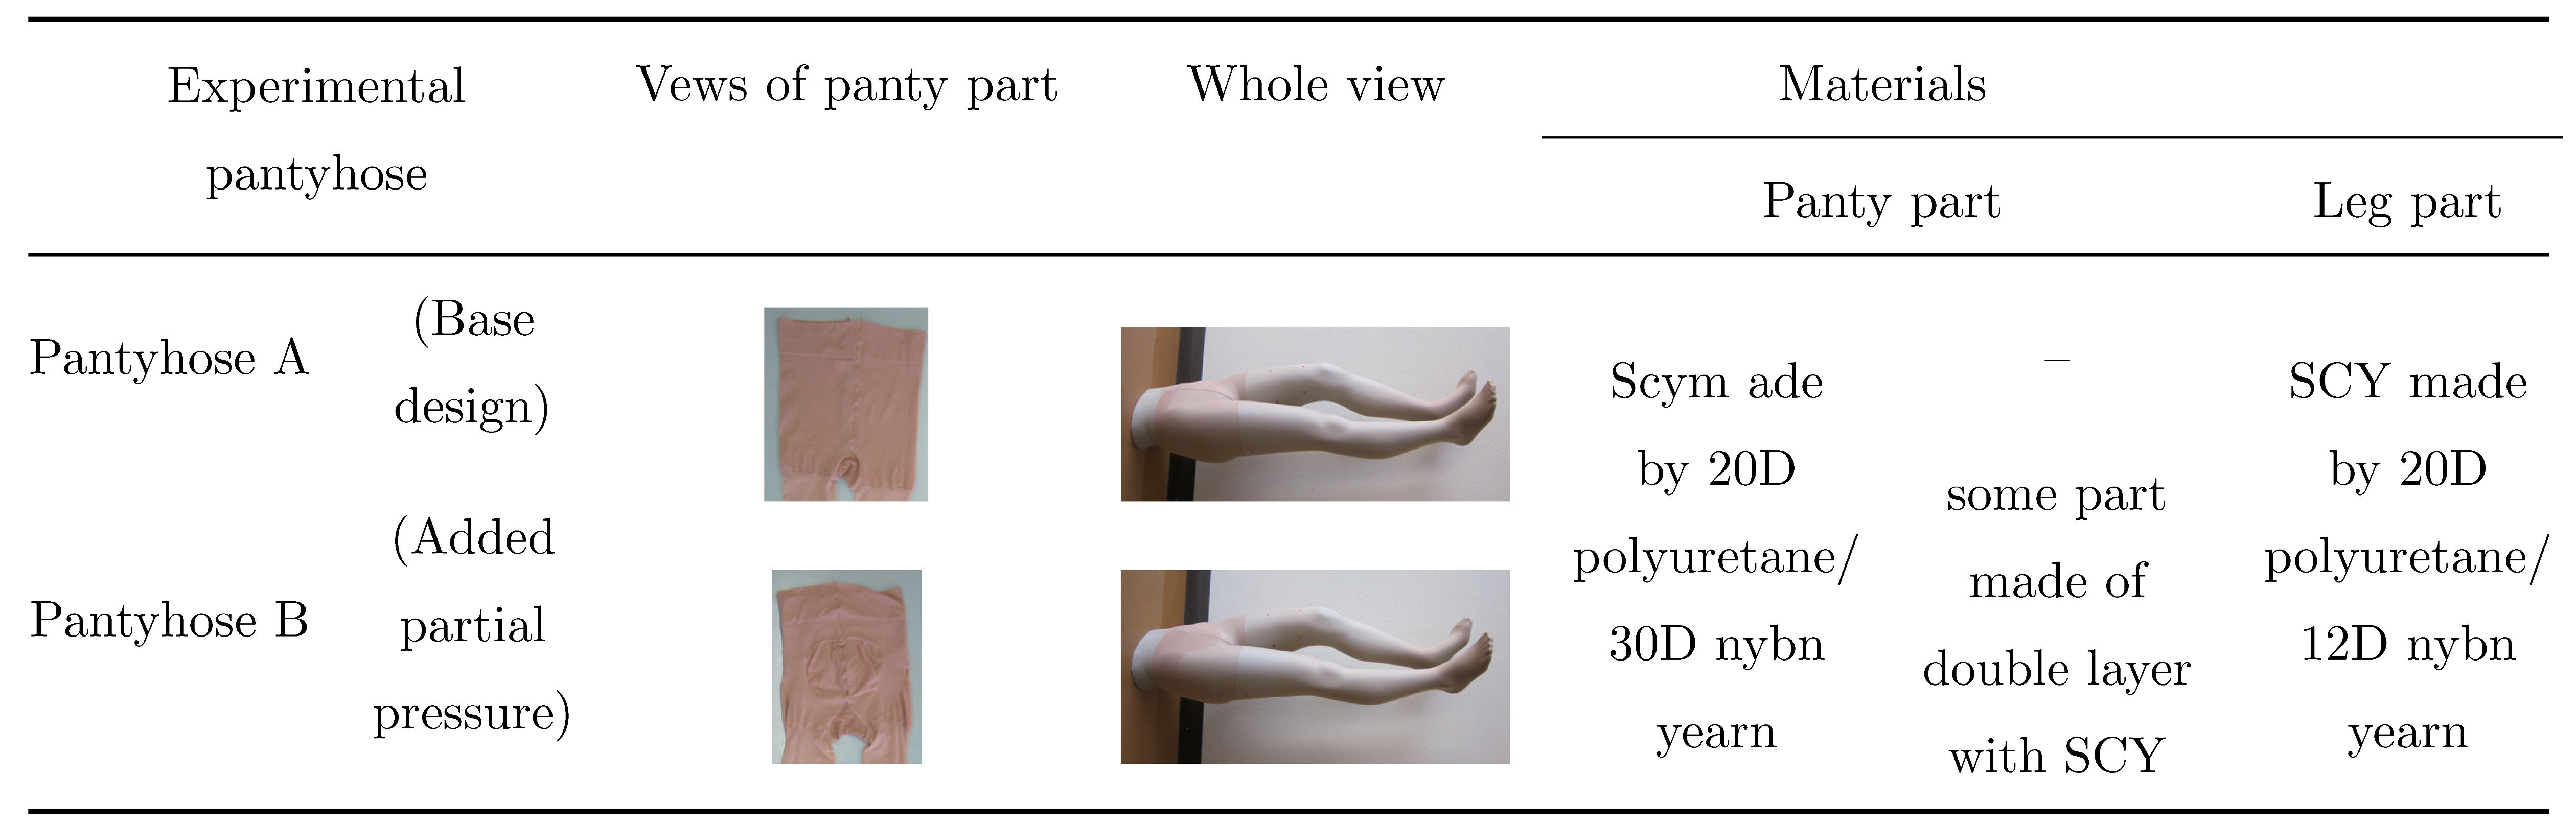
Two types of pantyhose were examined in this study, namely size M and L. Japanese women of 88% can be covered by the JIS standards with S, M and L (Their heights were about 150 cm, 158 cm and 166 cm) sizes. The pantyhose used in this study were sized to fit M and L size people; their height was 159.5 ± 6.1 cm, and their weight was 50.3 ± 3.3 kg (See 3.2 as follows). The material and knitting structures of two experimental pantyhose are shown in Table 1. The pantyhose was composed of a single covered yarn (SCY) composed of 20D (2.2 tex) polyurethane/12D (1.3 tex) nylon in the legs. In the panty part, the thickness of the nylon yarn was changed from 12D (1.3 tex) to 30D (3.3 tex), and woolly nylon yarn was added to increase the strength (pantyhose A). Using the design of pantyhose A as a baseline, the SCY was partially doubled in pantyhose B to change the supporting pressure of the panty part. The clothing pressure gradient design of the panty part of the pantyhose in this experiment applied the material properties and pressure distribution of half pants reported in 2016 [10]. In addition, the design of the pressure gradient from the toes to the waist was designed based on the preferred clothing pressure balance of the whole body reported by Mitsuno and Kai in 2018 [15]. However, the result of the report was the preferred pressure when using a single elastic band to compress only one plane of the body part simultaneously. It is known, when the surface area of the body compressed at the same time increases, the pressure value evaluated as just right decreases [16]. That is, the covered area increases, and the pressure sensation saturates with a smaller pressure value, then we tried to configure the pantyhose to cover the entire lower half of the body, with a smaller pressure value than reported in 2018 while maintaining the balance of the pressure gradient. This is designed to reduce excess movement around the knees and distribute the load on the lower back [13]. The basic knitting structure of the pantyhose comprised of plane stiches, and the section of fabric with partial supporting pressure consisted of single-rib stitches.
Table 1.
Two kinds of experimental pantyhose.
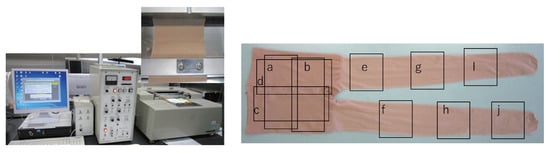
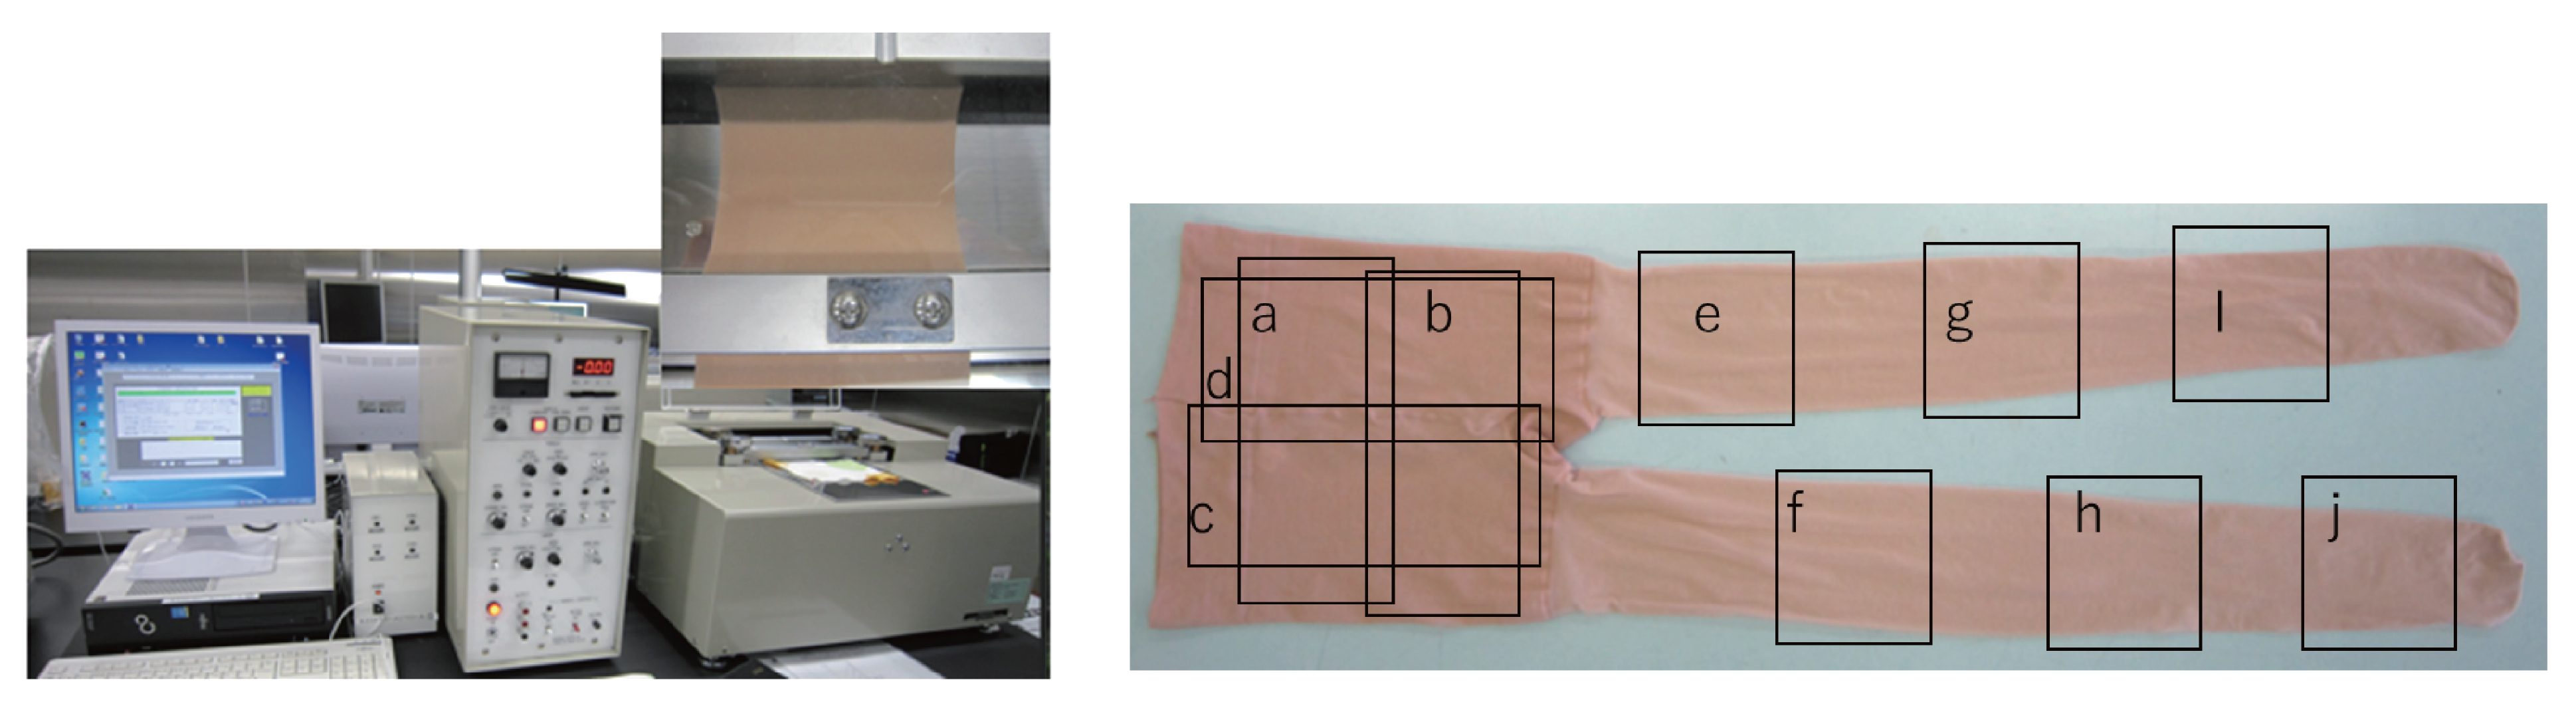
The measuring system for sample materials’ tensile force and strain is shown in the left Figure 1 and the right figure is shown the measuring area of experimental pantyhose. The tensile force and strain in the wale direction of the legs of the pantyhose (Areas from e to j) and the course (Areas a and b) and wale direction (Areas c and d) of the panties were measured using a KESFB1-A-AUTO (KatoTech, Kyoto, Japan) with a speed of 0.2 mm/s, chuck size of 5.0 cm, and maximum load of 25 gf/cm at 20 °C and 65% relative humidity at the Fii Research Centre at Shinshu University (used in manual operation). When the sample is cut to a specific size, the pantyhose fabric tends to fray, and the obtained size is likely to deviate from the desired value. Therefore, the sample was not cut out, and the measurement was performed with the whole garment in the pre-cut state.
Figure 1.
Measuring system for sample materials and measuring parts of experimental pantyhose. The right upper figure in the left figure is shown as pulling whole sample garment by measurment system.
2.2. Physical Parameters of the Participants
The participants were 17 healthy Japanese women in their twenties, who slept for 7 hours the night before the measurement. The participants ate a meal 2 hours before the measurement and entered an artificially climate-controlled room (Shinshu University Artificial Climate Experimental System) with an environmental temperature of 24.5 ± 0.3 °C, relative humidity of 50.0% ± 3.0%, illuminance of 827 ± 27.0 lx and airflow of 0.8 ± 0.1 m/s. The participants’ weight, muscle mass, and body fat mass were then measured using a body composition scanner (InnerScan, TANITA, Japan). Circumference measurements (above/under bust, waist, lower waist, hip, thigh, above/under knee, calf, ankle, arch) were obtained using a tape measure, and height measurements (hip, groin, knee, calf) were obtained using a Martin-type human body measuring instrument (Takei Scientific Instruments Co., Ltd., Japan). Changes in muscle activity, clothing pressure and pressure sensation while wearing pantyhose were also monitored continuously [9].
2.3. Measurement of Clothing Pressure While Wearing the Experimental Pantyhose
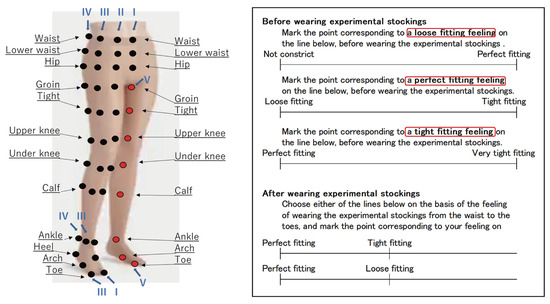
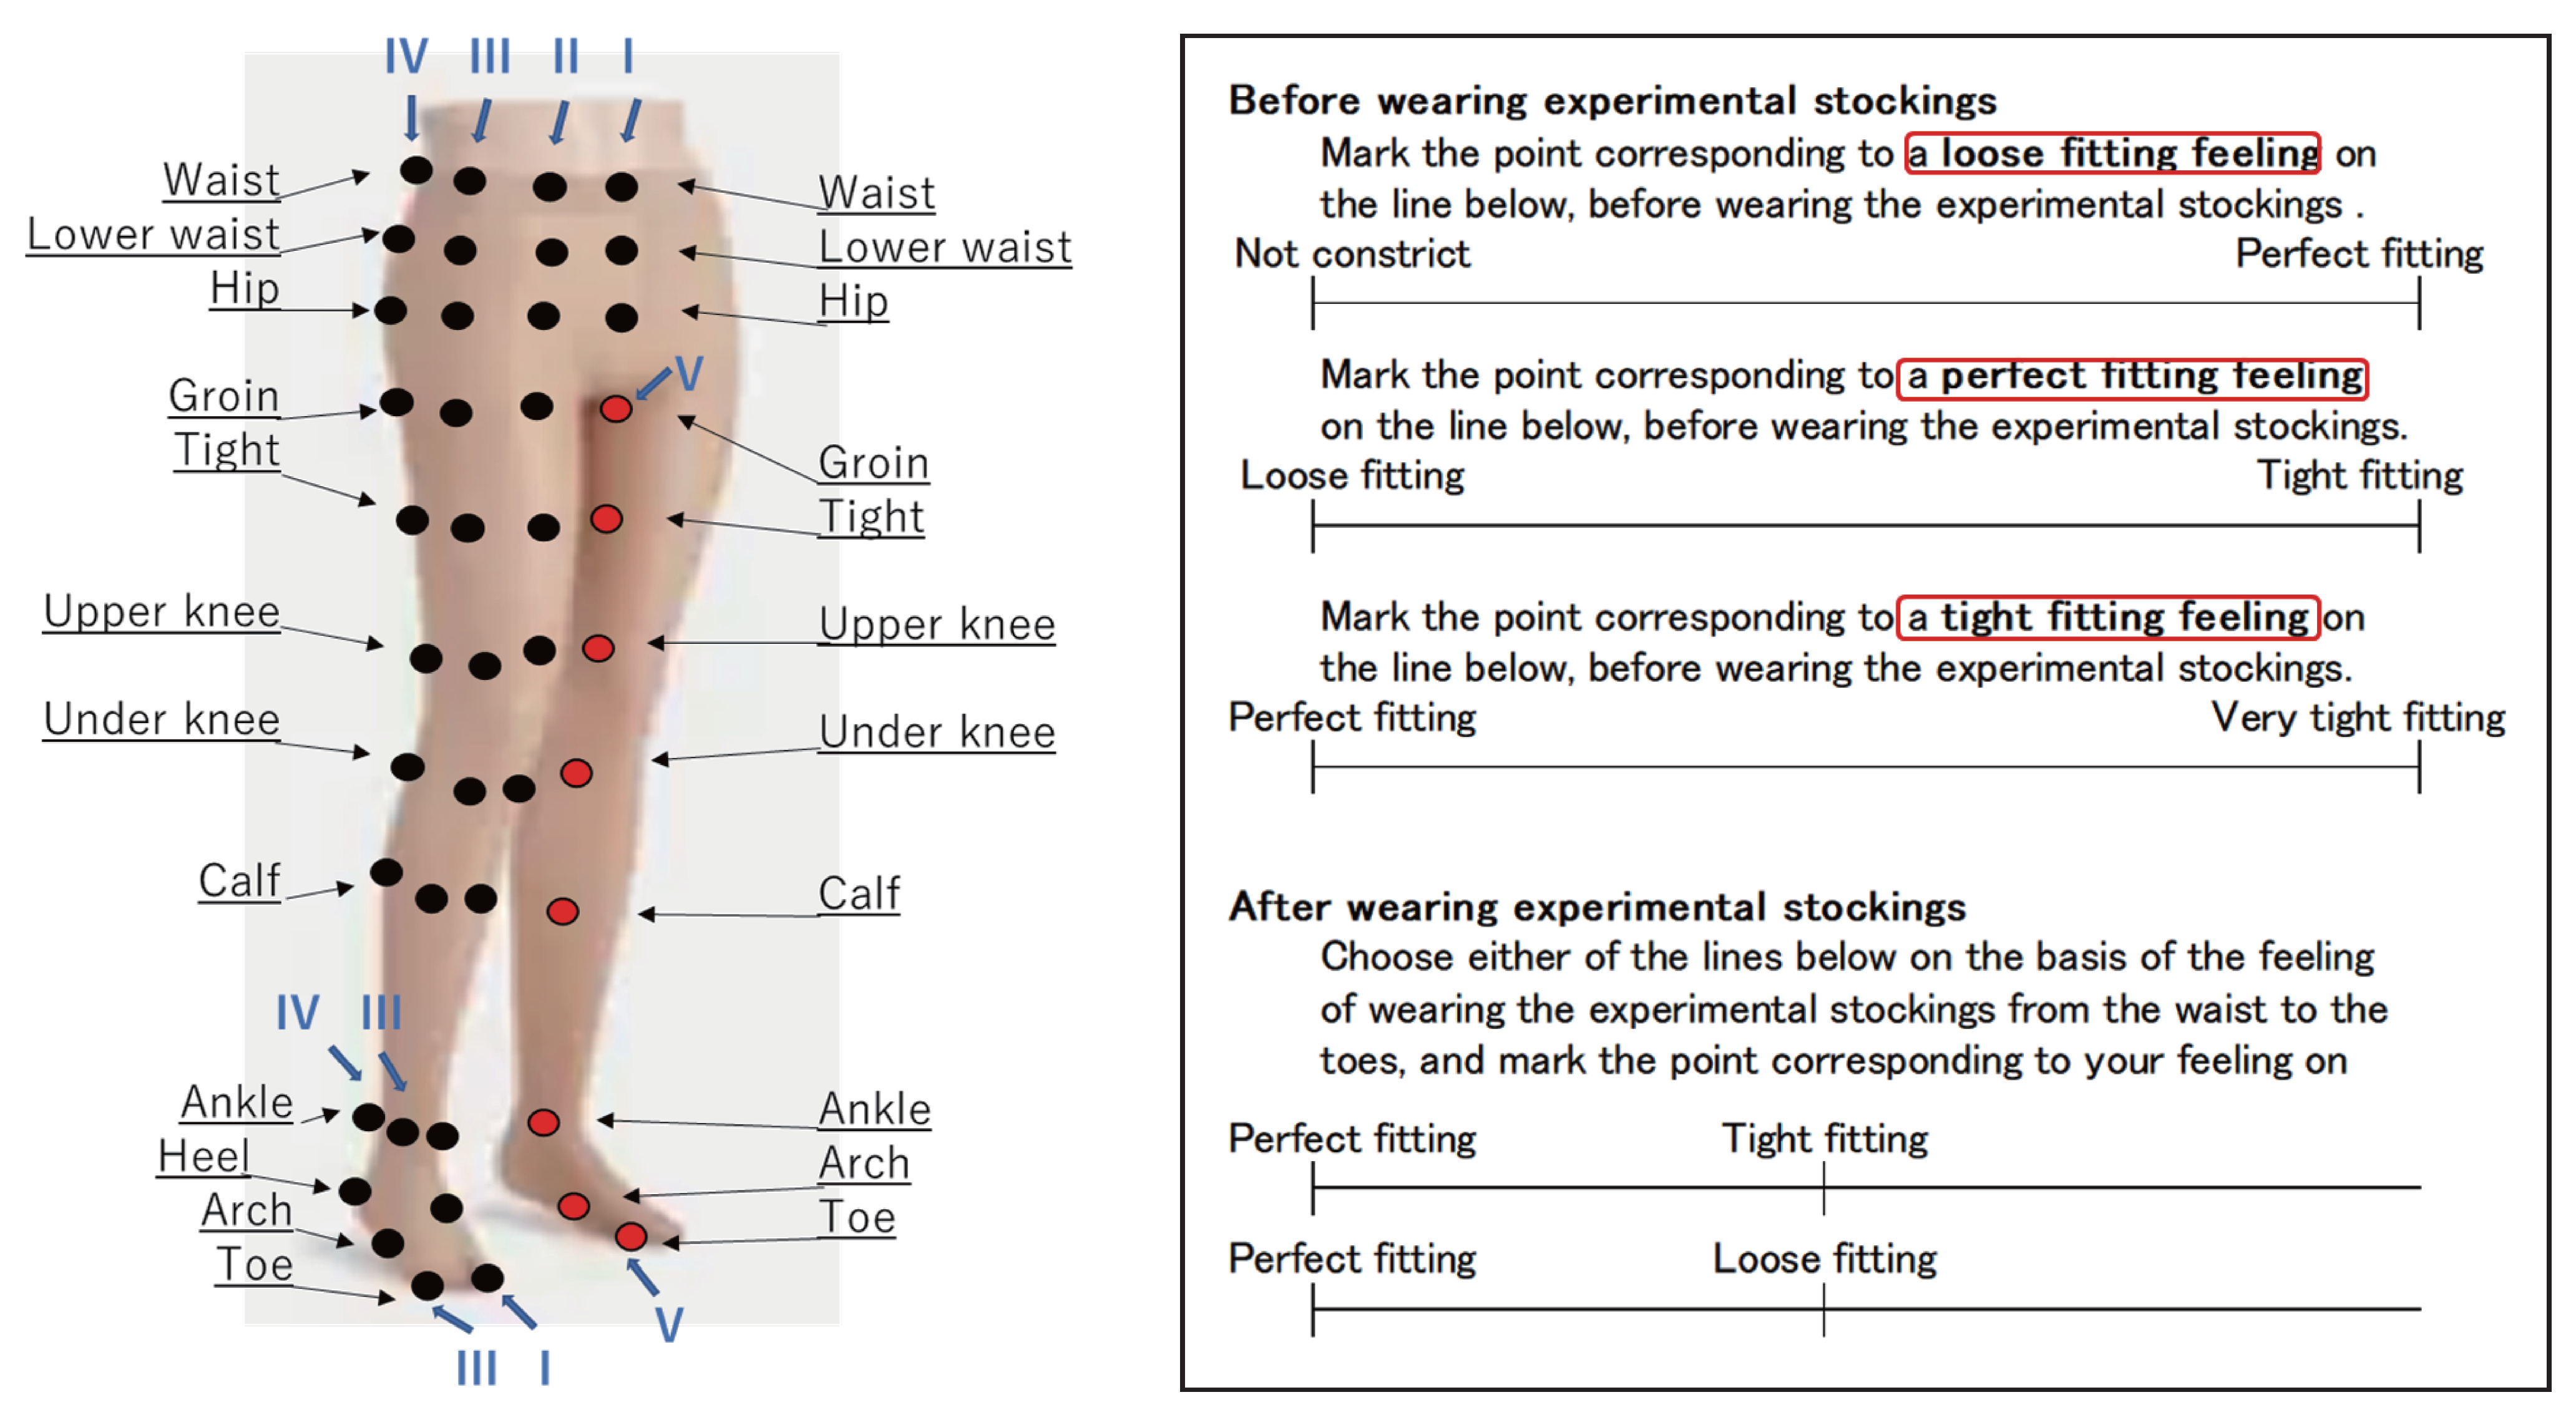
The clothing pressure of the pantyhose was determined using a clothing pressure measurement system based on a hydrostatic pressure-balanced method [15,17,18,19,20]. The 46 measuring points used on the right half of the body for clothing pressure are shown in Figure 2 [13]. Vertical lines I–V were as follows: line I: frontal midline, II: mamillary line, III: outside body line, IV: dorsal scapula line, V: inside body line. The back midlines on three planes (waist/lower waist/hip planes) were invisible; thus, three cross points were omitted. Because the inside line of the right half of the body was invisible, for convenience, the measuring points online V are shown as red points on the left half of the body. All 46 measuring points are shown: 15 measuring points are cross points between three planes (waist/lower waist/hip planes) and five vertical lines (front/back midlines, mamillary line, outside body line, dorsal scapula line). Another 24 measuring points were cross points between six planes (groin, tight, upper/lower knee, calf, ankle) and four vertical lines (front/back midlines, outside/inside lines). Finally, six measuring points were between two planes (arch, toe), three vertical lines (frontal midline, outside/inside lines) and the heel.
Figure 2.
Measuring points for clothing pressure and its evaluation sheet of the pressure sensation on a ratio scale. In left figure, the black spot indicates the position of the right half of the body. The inside of the leg on the right half of the body cannot be seen, so for convenience, the left side of the body is marked with a red spot. In the right figure, the evaluation sheet is divided into two parts. “Before” is evaluated before putting on pantyhose, and “After” in the lower half is done after putting on pantyhose.
2.4. Measurement of Pressure Sensation While Wearing Experimental Pantyhose
Participants wore each type of pantyhose while walking for 30 minutes to allow us to measure muscle activity, as described in Section 2.5. The pressure sensation was then reported based on a visual scale [21,22] (see the right figure of Figure 2). The two types of pantyhose were worn in the order of A then B. Human sensations of tightness and looseness are not always evenly distributed; for example, sensations of gradually increasing pressure (i.e., no pressure, loose, perfectly fitting, tight, and very tight) and the magnitudes of intervals vary from person to person.
Therefore, before wearing the pantyhose, participants’ perceptions of loose, perfectly fitting, and tight sensations enclosed red square in the figure were plotted in a straight line using three lines in the upper part of the figure. Next, participants plotted the pressure sensation by selecting either the tight axis or the loose axis shown in the lower part of the figure at the target body part: the waist, hips, thighs, upper knees, calf, ankle, foot, and the entire body. With the “perfect fit sensation” set to 1 and the case in which the participant was not wearing pantyhose set to 0, values for “loose-feeling”, “tight-fitting” and “very tight-fitting” were calculated accordingly. Based on these values, the pressure sensation in each body part was quantified [14].
2.5. Measurement of Muscle Activity While Wearing Experimental Pantyhose
After entering the artificial climate room, participants rested in a sitting position for an hour. The myoelectric potential of the lower limbs was then measured as the participants either walked with bare feet, or while wearing one of the two types of pantyhose. Participants walked on a treadmill at 3 km/h for a certain period. The surface myo-electric potential was measured using a multi-channel telemeter (WEB-1000, Nihon Kohden, Japan). Eight measurement points on the right half of the body were separated into two groups of muscles: muscles around the knee (i.e., the tibialis anterior muscle, gastrocnemius muscle, rectus femoris muscle and biceps femoris long head) and the hip (i.e., the rectus abdominis, latissimus dorsi, gluteus maximus and semitendinosus). The root mean square (RMS) value of muscle activity was calculated from the myoelectric potential signal obtained for 2 minutes of a 3-minute measurement using Equation (1) for three conditions: barefoot, wearing pantyhose A, and wearing pantyhose B.
Here, T is the selection time, e is the potential at the time of observation, t is the observation time, and τ is a time constant. The values obtained for participants who were barefoot or wearing pantyhose were confirmed to be significantly different in a paired analysis of variance, with the significance tested using the Bonferroni method [12,23,24].
2.6. Statistical Analyses
Statistical analyses were performed using SPSS software (IBM, Ver. 27). The values obtained between pantyhose A and B were compared with material characters, clothing pressure, pressure sensation, waist/hip circumference, and hip/groin height. When participants who were barefoot or wearing pantyhose A/B were confirmed to be significantly different between groups by paired analysis of variance, and significant differences were tested using the Bonferroni method. Differences were considered significant at a level of p < 0.05.
3. Results
3.1. Tensile Test for the Two Types of Experimental Pantyhose
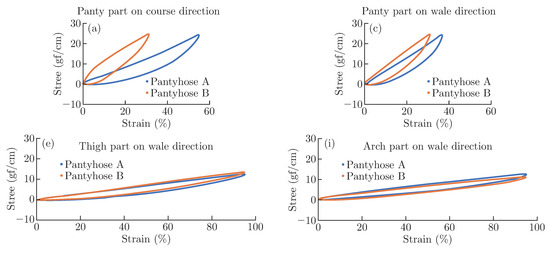
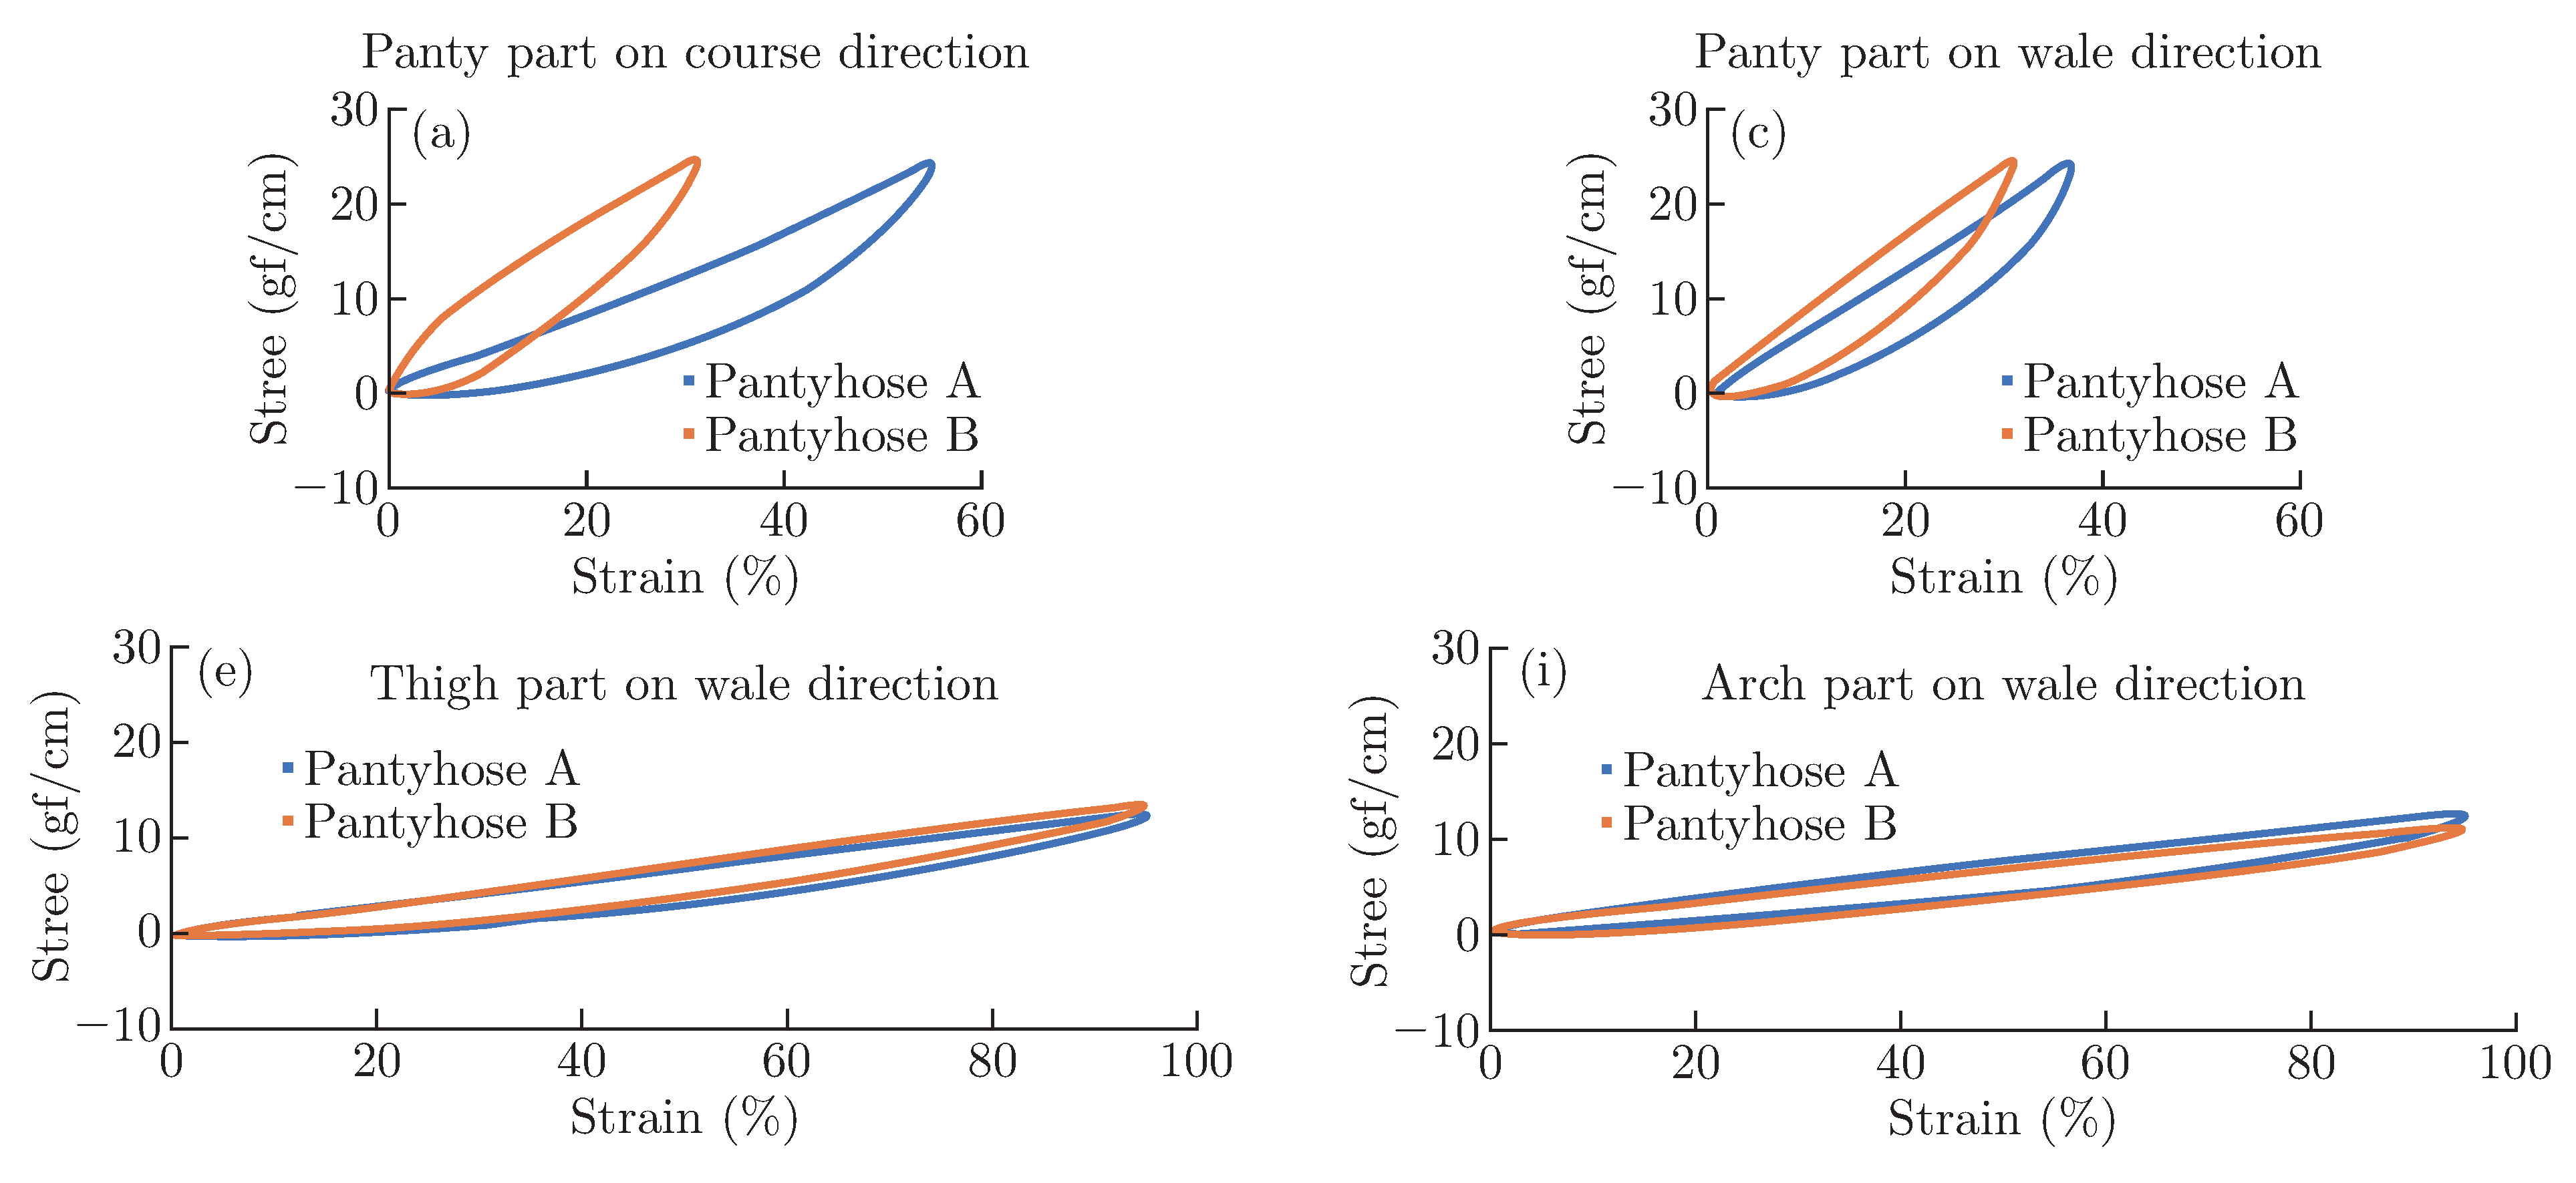
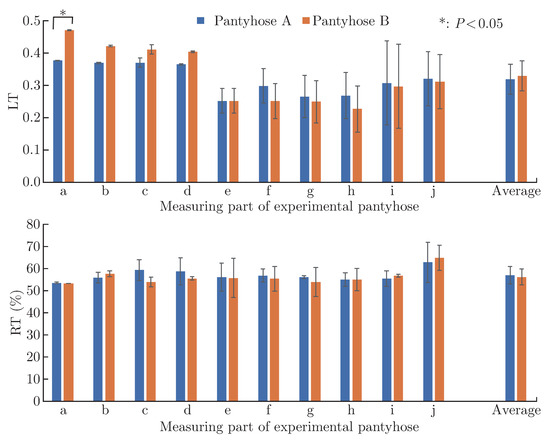
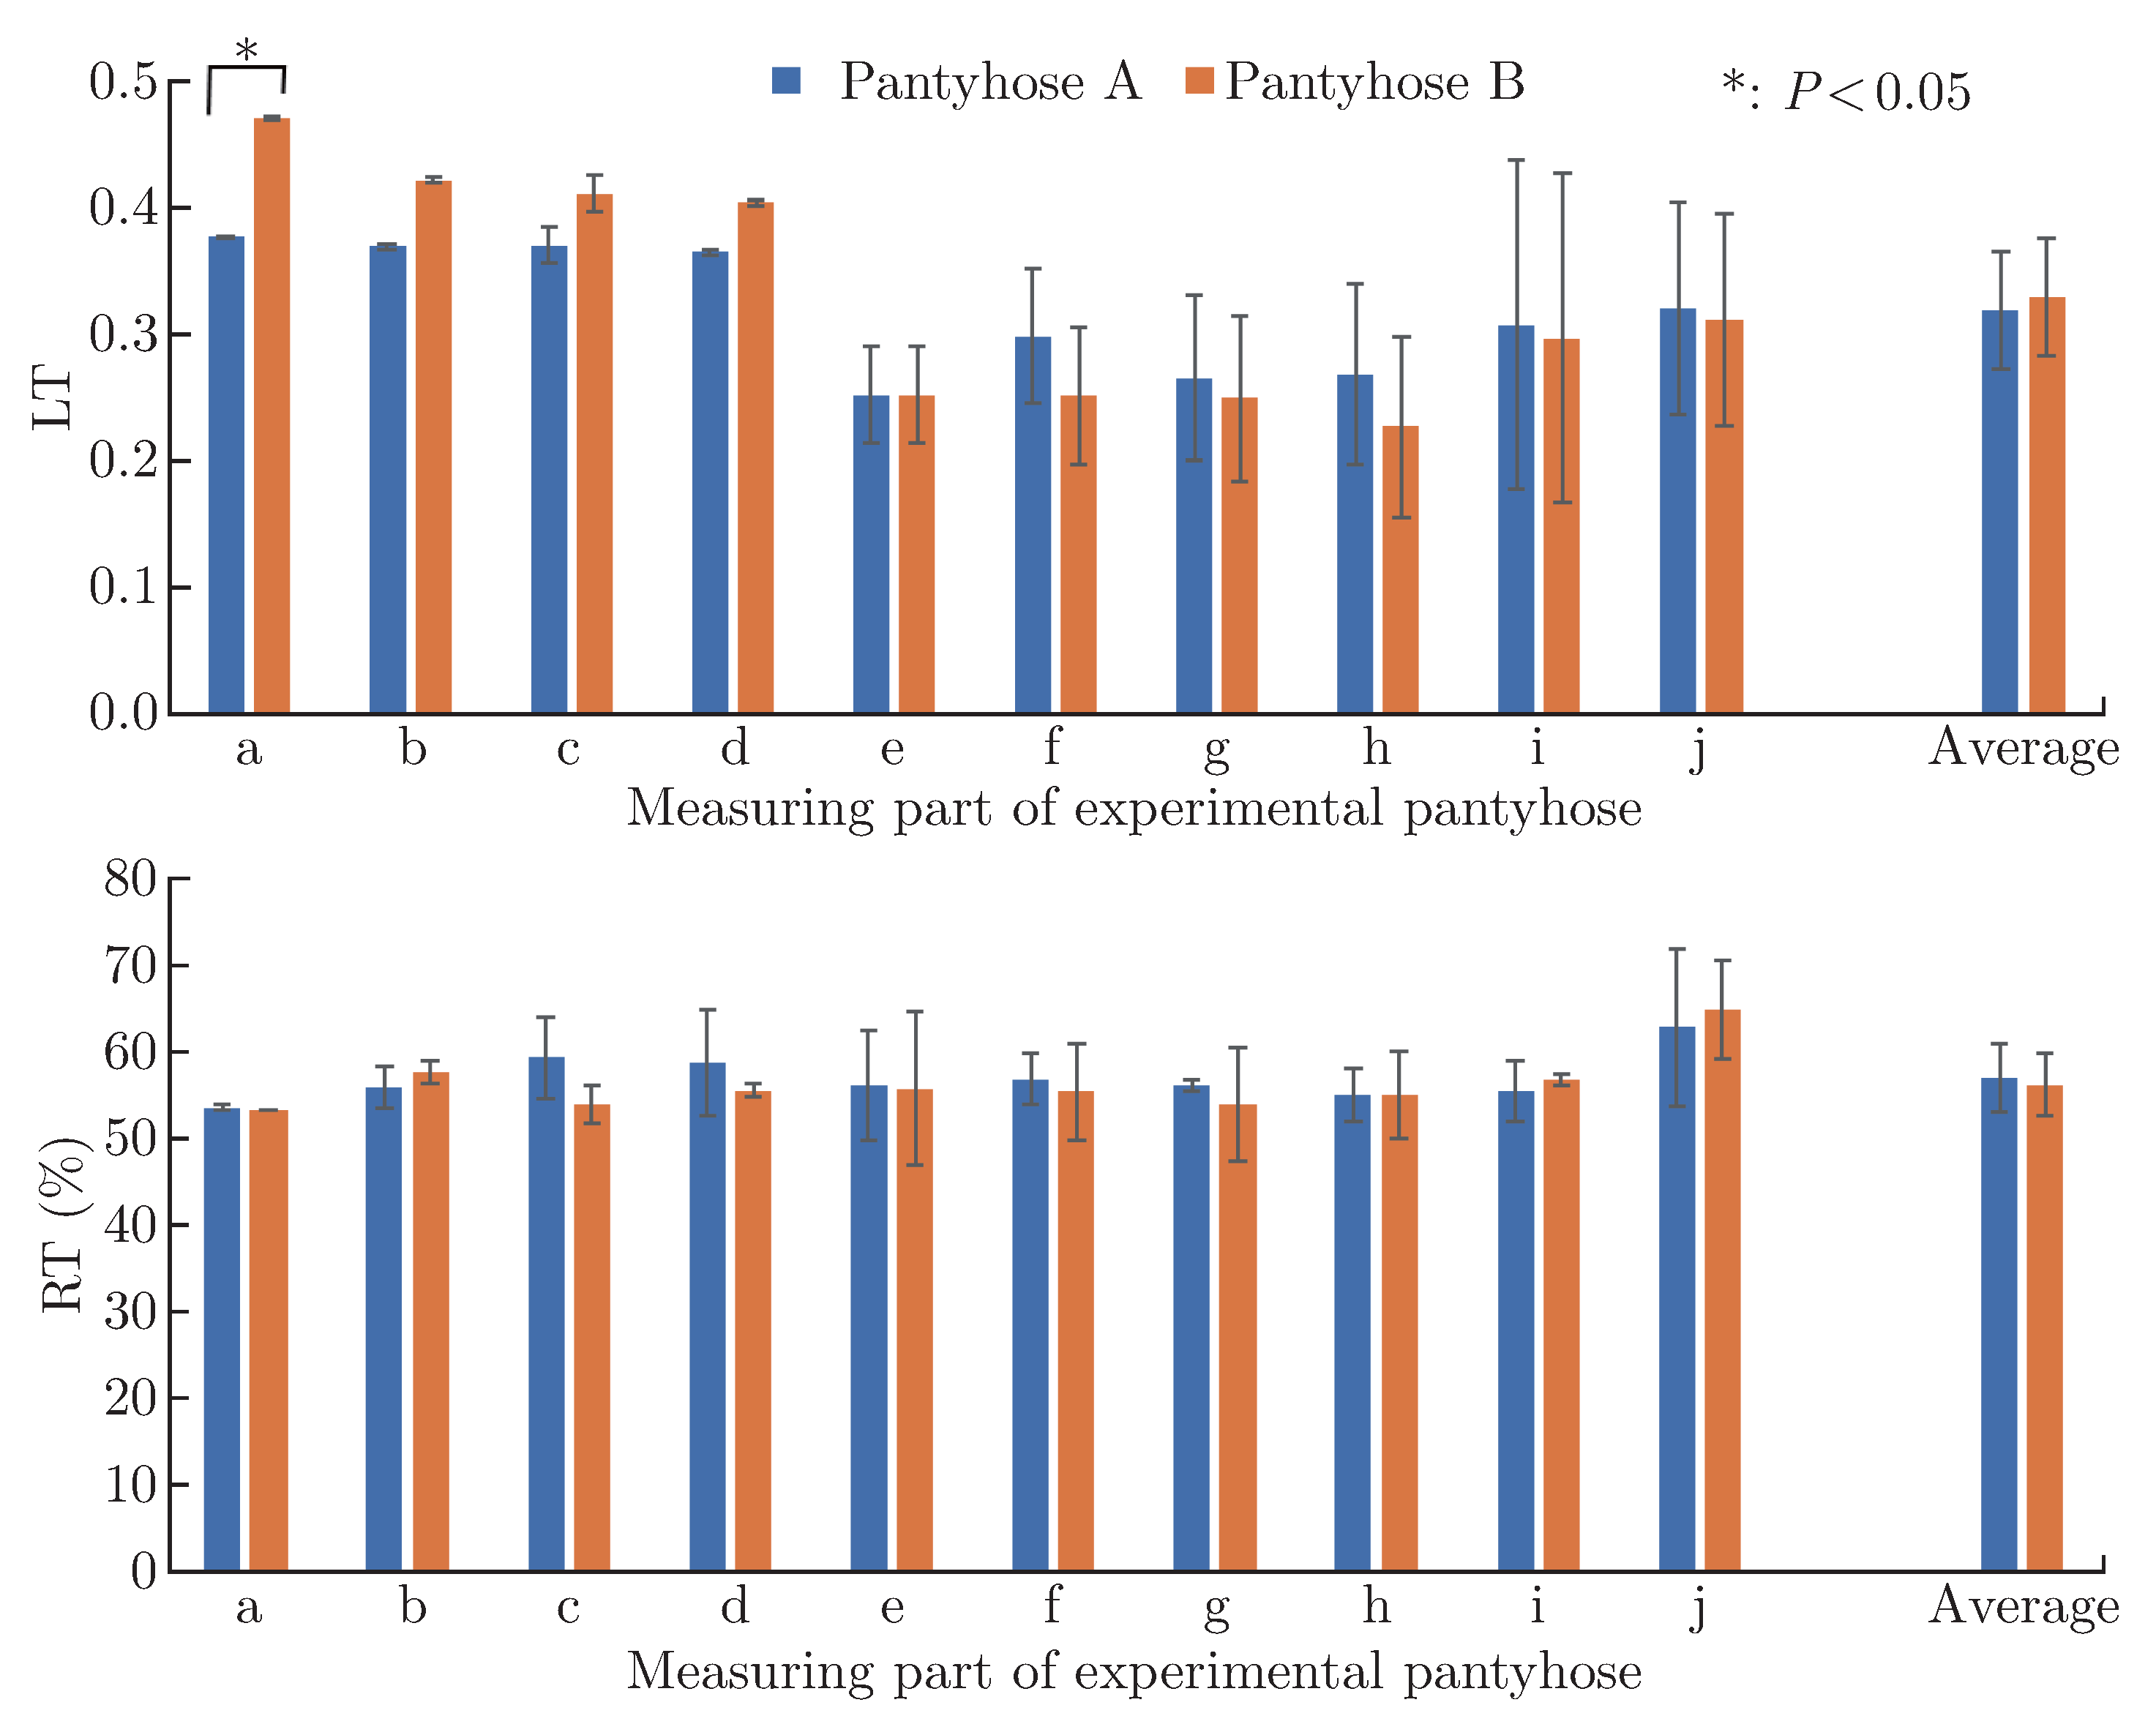
A typical example of the tensile test conducted with pantyhose A and B is shown in Figure 3. The final dimensions of the leg part gradually narrowed from 80 mm to 62 mm from the thighs to the toes. When comparing the thickest thigh dimension and the thinnest arch dimension, almost the same curves were drawn, as shown in Figure 3e and i. This result indicates that pantyhose A and B were both well-stretched materials with knitted structures. In addition, the width of the panty part was set at 185-195 mm for both pantyhose A and B. Thus, when compared without conversion, pantyhose B was less stretchy than pantyhose A, as pantyhose B was made by partially doubling the threads and changing the knitting method. In addition, the panty part was stretcher in the course direction than in the wale direction. LT and RT are shown in Figure 4. LT, which is an index of difficulty in stretching, indicates that the closer to “1”, the more difficult is to stretch. The panty part (from area a to d, of which the average was 0.399 ± 0.036: mean ± SD) was significantly less stretchable in both samples A and B than the leg part (from area e to j, of which the average was 0.275 ± 0.071, p < 0.001). Comparing each part, pantyhose B was significantly larger than A only in area a, and it was more difficult to stretch in the course direction in near the waist. RT indicates tensile recovery, and the closer the value is to 100%, which is the more recoverable. Although there was no difference between A and B in both the panty part (55.8 ± 3.5%) and the leg part (57.5 ± 5.0%) for both samples. Overall, it was found that the structures of pantyhose A and B differed only in the panty part.
Figure 4.
LT and RT of experimental pantyhose.
3.2. Physical Parameters of the Participants
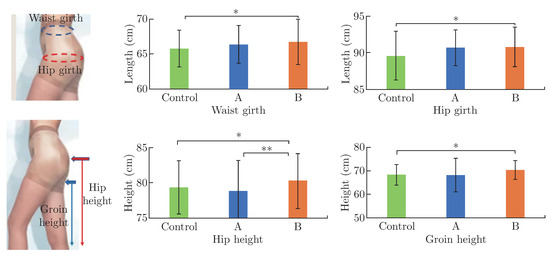
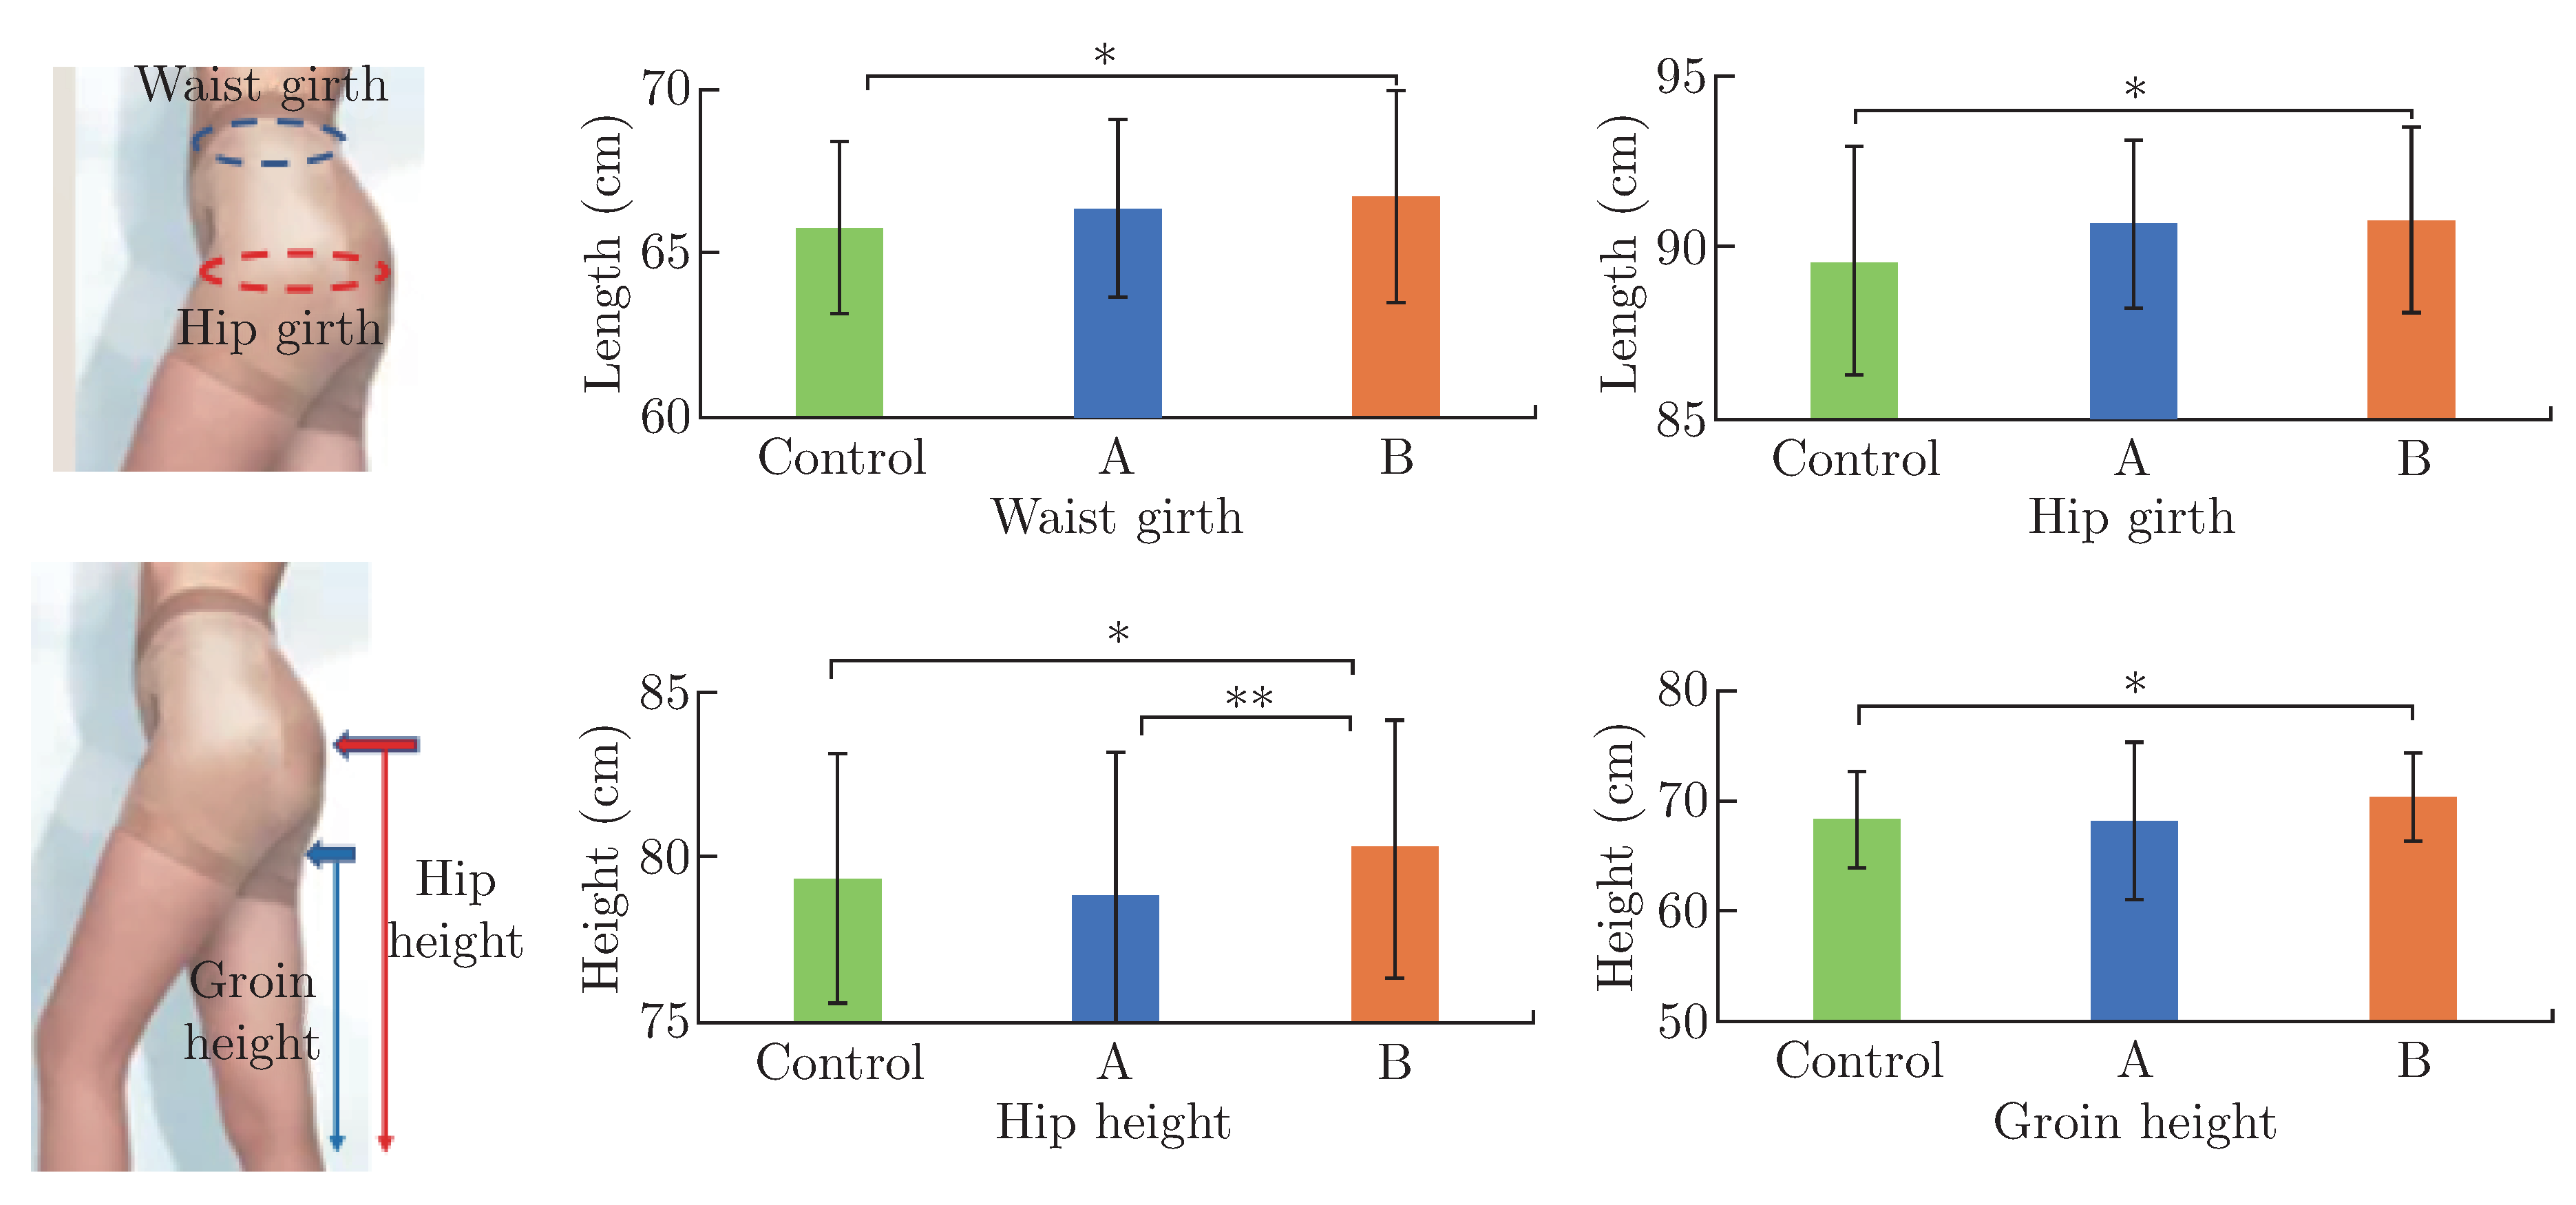
The physical parameters of the participants are shown in Table 2. As reflected by the body mass index (BMI) and body fat values, the body shapes of the participants resemble those of average Japanese women aged 20-30 years (height: 1.59 m, weight: 50.8 ± 5.9 kg, BMI: 20.1). The girth (waist/hip) and height parameters (hip/groin) that exhibited significant changes when the participants were wearing pantyhose versus not wearing pantyhose are shown in Figure 5. For pantyhose B, the waist/hip girths and hip/groin heights were significantly larger compared with those in the control condition. The results revealed that pantyhose B increased the tensile strength by partially changing the clothing pressure applied to the panty part and significantly increased the hip height by 9.3 mm and the groin height by 20.1 mm when compared with the control condition. However, the adipose tissue of the lifted hips shifted to around the hips and the waist, causing the hip and waist circumference to increase by 12.2 mm and 9.0 mm, respectively. Thus, pantyhose B caused the legs to appear longer [10].
Table 2.
Participants’ physical parameters [910].
Figure 5.
Change in girth and height parameters while wearing experimental pantyhose. Upper figures show the girth and lower figures show the height. Control shows the results of not wearing pantyhose, A/B show wearing pantyhose A/B in the order. ∗ : p < 0.05, ∗∗: 0.01.
3.3. Clothing Pressure
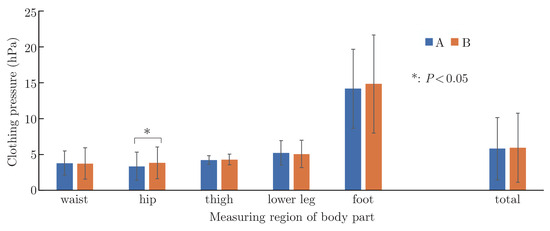
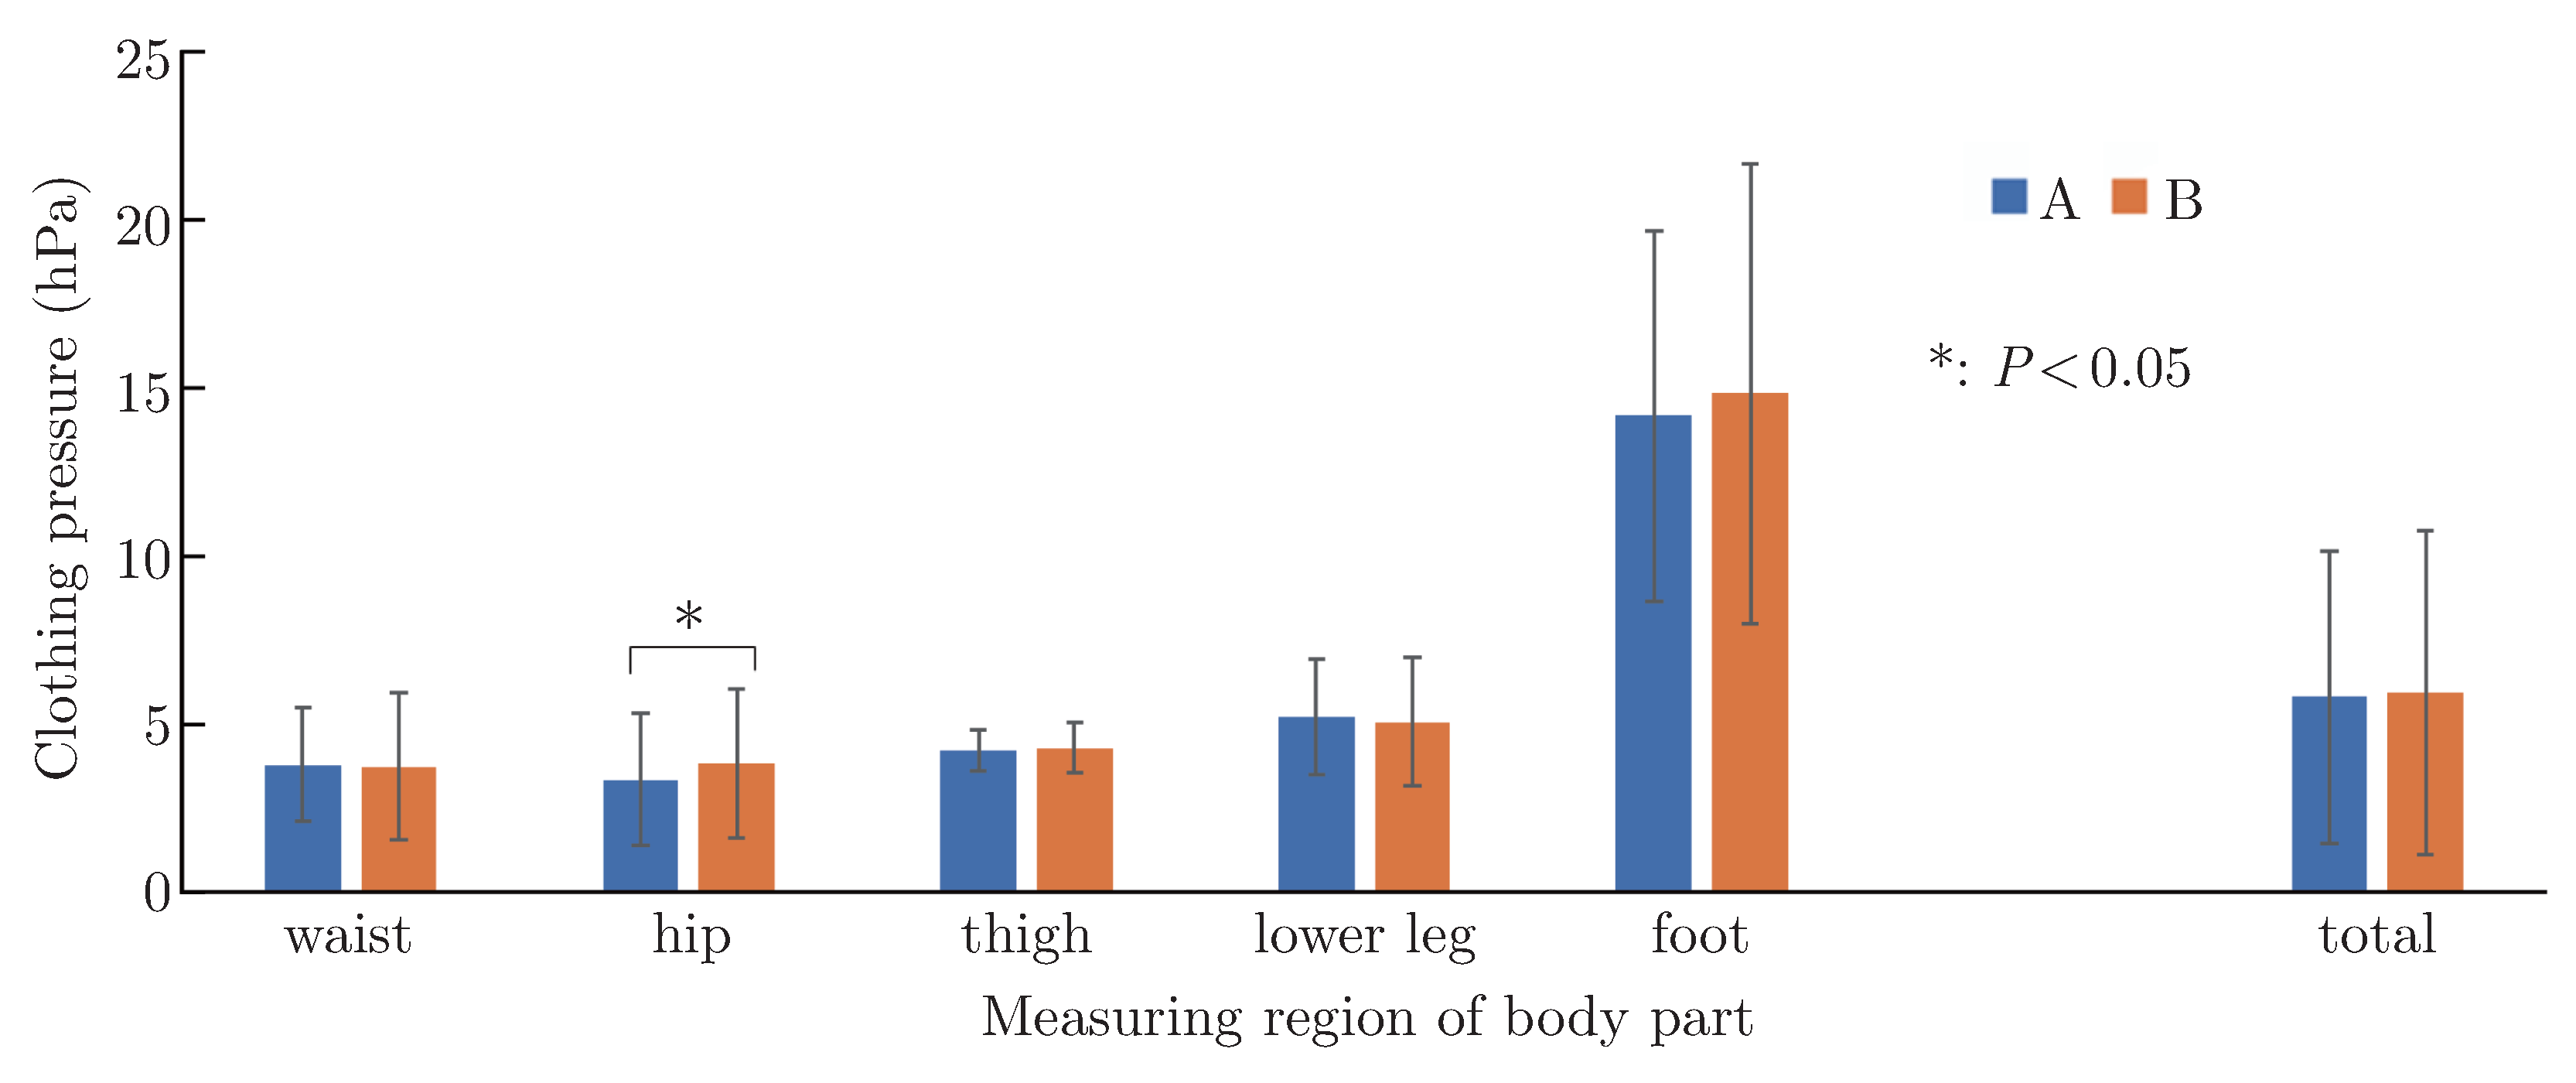
Clothing pressures wearing tow experimental pantyhose for each body part are shown in Figure 6. For the experimental pantyhose, the clothing pressure at the hips was significantly higher for pantyhose B than for pantyhose A, but there was no significant difference in the other body parts. In addition, when the clothing pressure generated for pantyhose A and B were compared for each body part, the clothing pressure at the foot was always significantly higher than that of the other body parts (p < 0.001).
Figure 6.
Clothing pressure wearing two experimental pantyhose for each body part.
3.4. Pressure Sensation
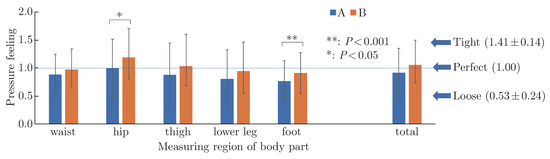
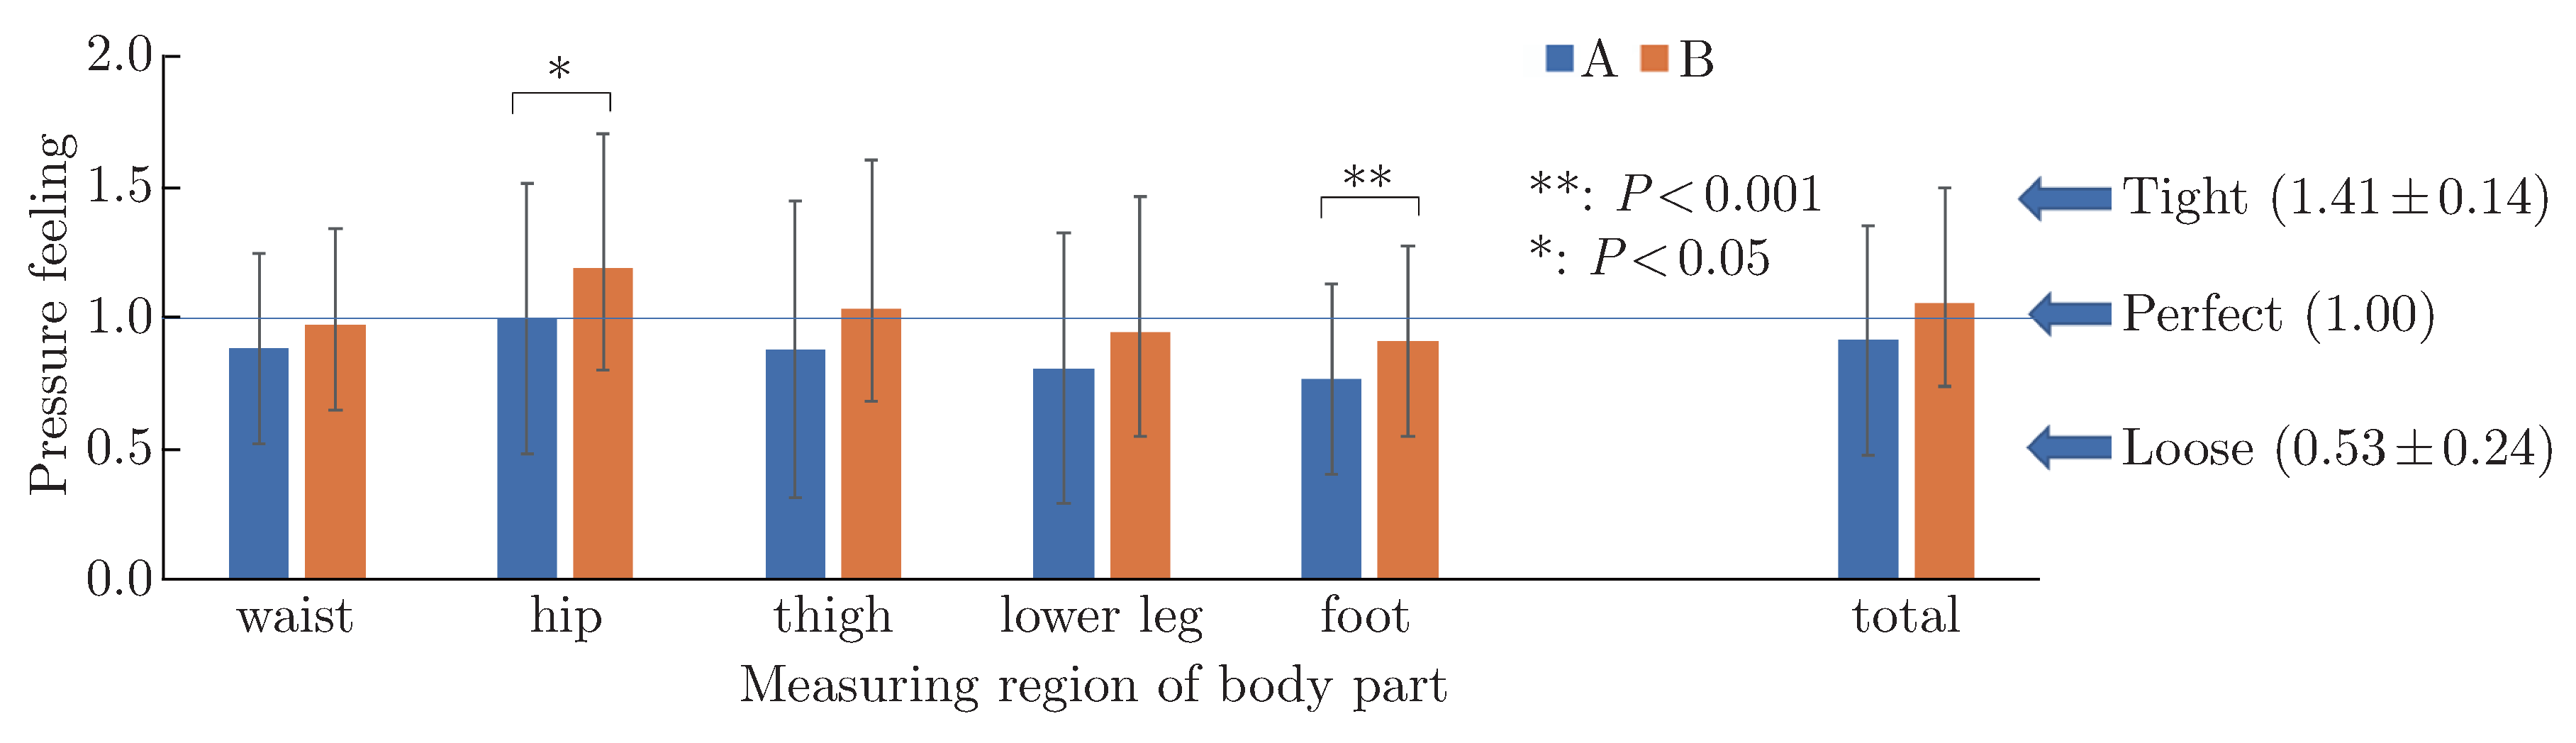
Pressure sensation wearing two experimental pantyhose for each body part are shown in Figure 7. The range of pressure sensation in this study did not reach tight value, indicating that the pantyhose was within the loose to tight range, as described below. The pressure sensation was significantly higher for pantyhose B than for pantyhose A in the hips and foot, but the pressure sensation showed no difference between pantyhose A and B for the other body parts. The participants reported that pantyhose A felt slightly loose, whereas pantyhose B provided a nearly perfect fitting sensation.
Figure 7.
Pressure sensation wearing two experimental pantyhose for each body part. The arrows at the right end of the lower figure show the sensations of “tight” (1.41 ± 0.14) and “loose” (0.53 ± 0.24). These values were calculated by setting “no pressure” to 0 and “a perfect pressure sensation” to 1. A very tight pressure sensation corresponded to 1.74 ± 1.2.
3.5. Electromyographic (EMG) Changes While Wearing Experimental Pantyhose
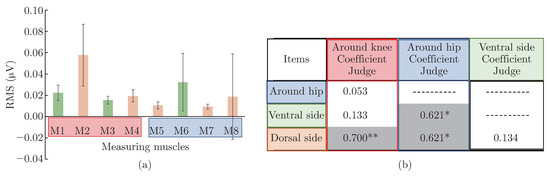
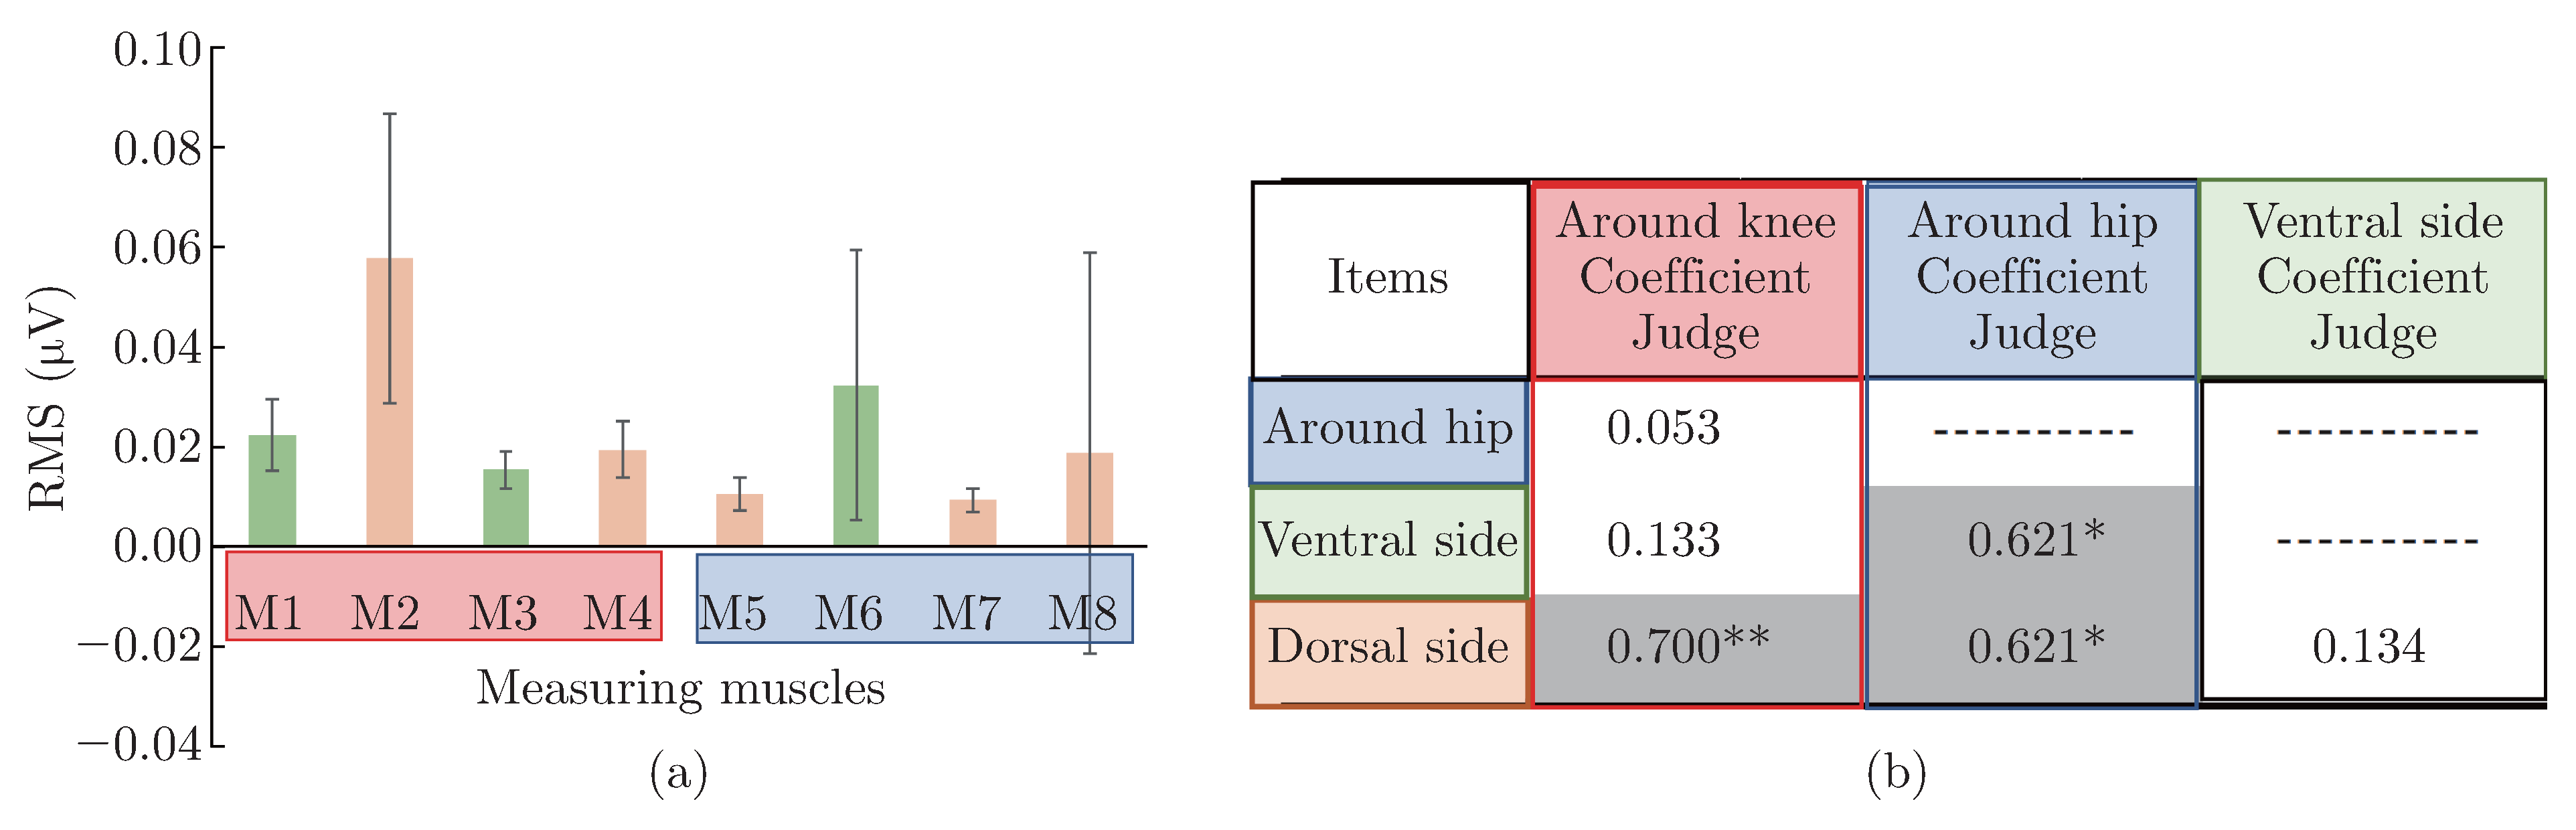
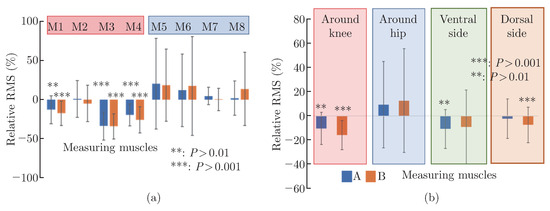
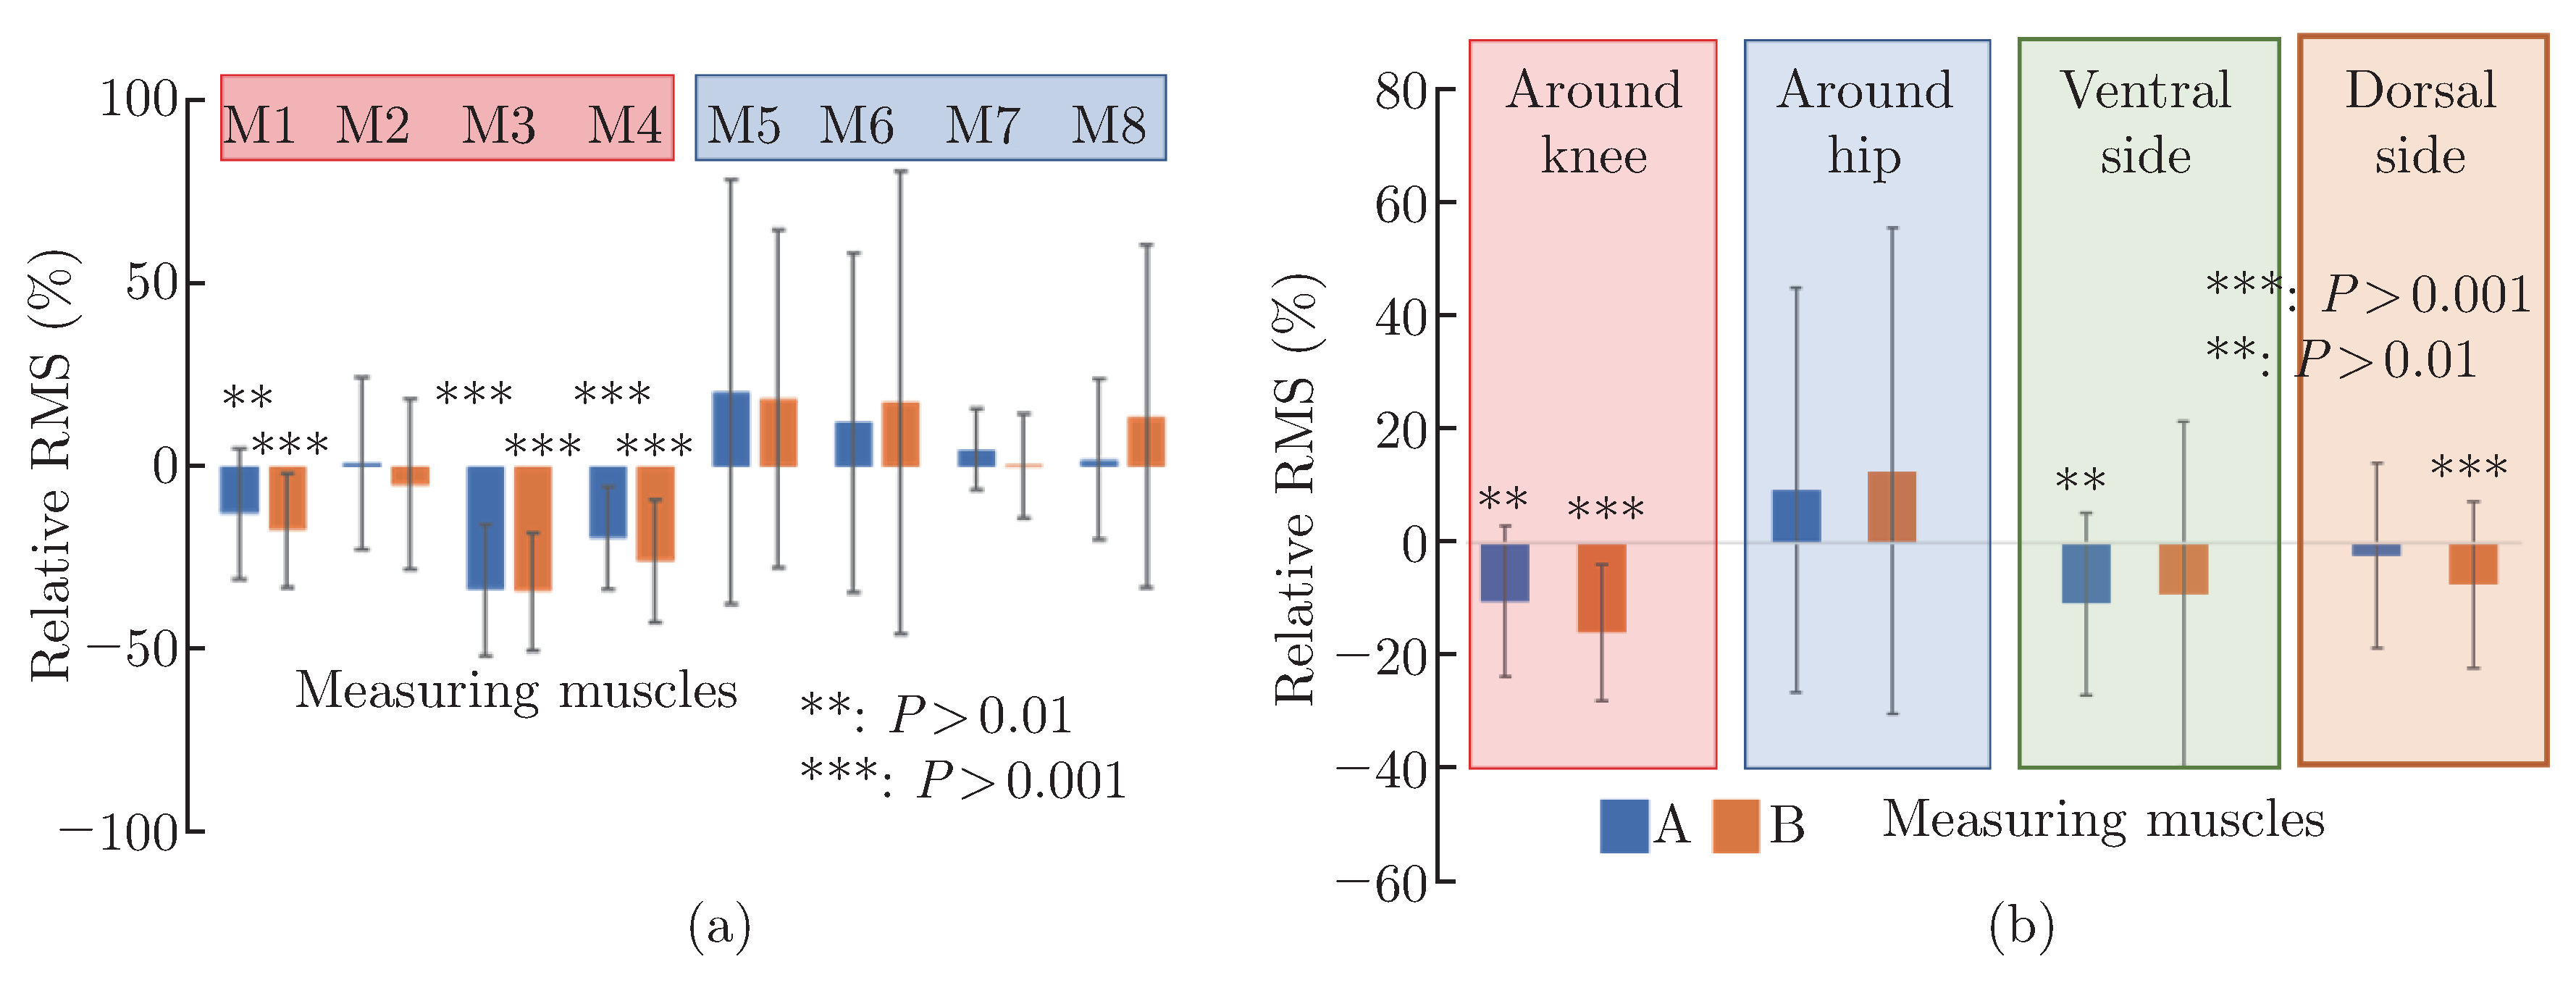
The RMS values of eight muscles under the bare feet conditions (the left figure a) and its correlation coefficients (the right table b) are shown in Figure 8. The RMSs were calculated M1: 23.9±8.9 µV, M2: 58.0±28.5 µV, M3: 15.1±3.8 µV, M4: 19.0±5.4 µV, M5: 10.4±3.4 µV, M6: 28.9±27.0 µV, M7: 8.9 ± 2.4 µV, and M8: 16.4 ± 1.9 µV, respectively. There is a different value for each muscle group activity, and the activities of the gastrocnemius (M2) and rectus abdominis (M6) muscles were higher than the rest. The correlation coefficients were calculated among four muscle groups, significant positive correlations between tree couples: Around knee muscle and Dorsal side Relative RMS of each muscle was shown in the right figure of Figure 8, and the results are summarized for the relative RMS of the eight surface myoelectric potentials (see the left figure of Figure 9) for the muscle groups around the knee and waist and the ventral and dorsal muscle groups (see the right figure of Figure 9). Each relative RMS was calculated based on these values, and the values of the eight surface myoelectric potentials for participants wearing pantyhose A and B. There was no significant difference between pantyhose A and B at any measurement point. However, for both pantyhose A and B, muscle activity was significantly suppressed in muscles M1, M3, and M4. This result indicates that wearing pantyhose significantly suppressed muscle activity in the muscle groups around the knee, except for the gastrocnemius muscle (M2). In the right figure, there was no significant difference between pantyhose A and B in any combination.
Figure 8.
The RMS values of eight muscles under the bare feet and its correlation coefficients. The eight muscles were divided four groups: Around knee muscles groups circled in red line (M1: Anterior tibial muscle, M2: Gastrocnemius, M3: Rectus femoris, M4: Biceps femoris long head), Around hip muscle group circled in blue line (M5: Latissimus dorsi, M6: Rectus abdominis muscle, M7: Gluteus maximus, M8: Semitendinosus muscle), Ventral side muscle group circled in green line (M1, M3, M6), and dorsal side muscle group in circled orange line (M2, M4, M5, M7, M8). “Judge” in the table b shows a level of significance. Differences were significant at levels of p < 0.05: *, and p < 0.01: **.
Figure 9.
Relative EMG for each muscle and for four groups while wearing pantyhose. The left figure a shows relative RMS for each muscle and the right figure b shows relative RMS for four muscle groups. In both figures, a value of 0 indicates that the activity was equivalent to the muscle activity in the barefoot condition. Asterisks on the bar graph indicated a significant difference compared with the barefoot condition. The eight muscles were divided four groups: Around knee muscles groups circled in red line (M1: Anterior tibial muscle, M2: Gastrocnemius, M3: Rectus femoris, M4: Biceps femoris long head), Around hip muscle group circled in blue line (M5: Latissimus dorsi, M6: Rectus abdominis muscle, M7: Gluteus maximus, M8: Semitendinosus muscle), Ventral side muscle group circled in green line (M1, M3, M6), and dorsal side muscle group in circled orange line (M2, M4, M5, M7, M8).
However, the muscle activity around the knee was significantly suppressed when either pantyhose A or B were worn, compared with the barefoot condition. Furthermore, for pantyhose A, the ventral muscle group was significantly suppressed, while for pantyhose B, the dorsal muscle group was significantly suppressed, compared with that in the barefoot condition. There were positive correlations between Around knee muscles and dorsal muscles, between Around hip muscles and Ventral/Dorsal muscles. When walking, some people tend to use muscles around the knees, who use dorsal side muscles, whereas others use muscles around the hip, who use ventral- and dorsal muscles.
4. Discussion
Pantyhose A and B were structurally different in the panty part. The construction of Pantyhose B was based on pantyhose A. However, a partially less stretchy region was incorporated in the panty part because of a change in the number of threads and the knitting method, which leads to a change in the pressure distribution. The structure of this panty part is derived from the structure of half pants made to burn body fat [14]. Therefore, as shown in Figure 3/4, the tensile strength of pantyhose B was greater than that of pantyhose A in the vertical and horizontal directions of the panty part. In pantyhose B, the knitted tissue with increased (see Table 1) strength pulled up the soft tissue of the hips, such as the adipose tissue. Thus, the circumference increased and the clothing pressure for pantyhose B was significantly higher than that of pantyhose A in the hip region, with a similar result for the pressure sensation. From this, there is need to use a thicker thread and strong knitting to pull up the hips.
If the pressure is focused on one body part (i.e., if the clothing pressure of a waistband is high), the pressure-sensation is typically evaluated as tight [25]. However, according to Mitsuno et al. [14], the clothing pressure corresponding to a perfect pressure sensation varies significantly depending on the body part, and the pressure distribution gradually increases from the waist to the tip of the foot [23,24]. Therefore, pantyhose B was constructed according to this principle and was evaluated as fitting almost perfectly for each body part. The pressure from 2.9 ± 1.5 hPa at the waist to 11.0 ± 5.1 hPa at the foot achieved a rating within the “perfectly fitting sensation” pressure range. However, this clothing pressure value is smaller than in previous report [14], with preferred values for a tightened 2.5-cm-wide elastic band as 7.1 hPa at the waist and 35.6 hPa at the arch. This difference may be related to the body surface areas that are compressed at the same time. Even if the clothing pressure is evaluated as a perfect fitting sensation when the area is small, the pressure sensation increases as the area of coverage increases (i.e., as the number of activated baroreceptors increases) [22]. According to pressure sensation, the participants reported a nearly perfect pressure sensation wearing both experimental pantyhose based on a ratio scale. Thus, pantyhose with an optimized pressure sensation can be created. Therefore, for pantyhose that covered the lower half of the body (i.e., a large area of coverage), the pressure sensation was optimized by designing the pantyhose to suppress the clothing pressure while maintaining a pressure gradient from the waist to the toes. Pantyhose B were harder to stretch than pantyhose A, because pantyhose B were constructed by partially doubling the threads and changing the knitting method, so, the panty part was easier to stretch in the course direction than in the wale direction. Overall, it was found that the structures of pantyhose A and B differed only in the panty part.
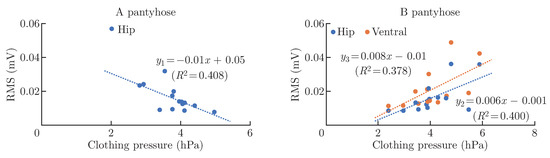
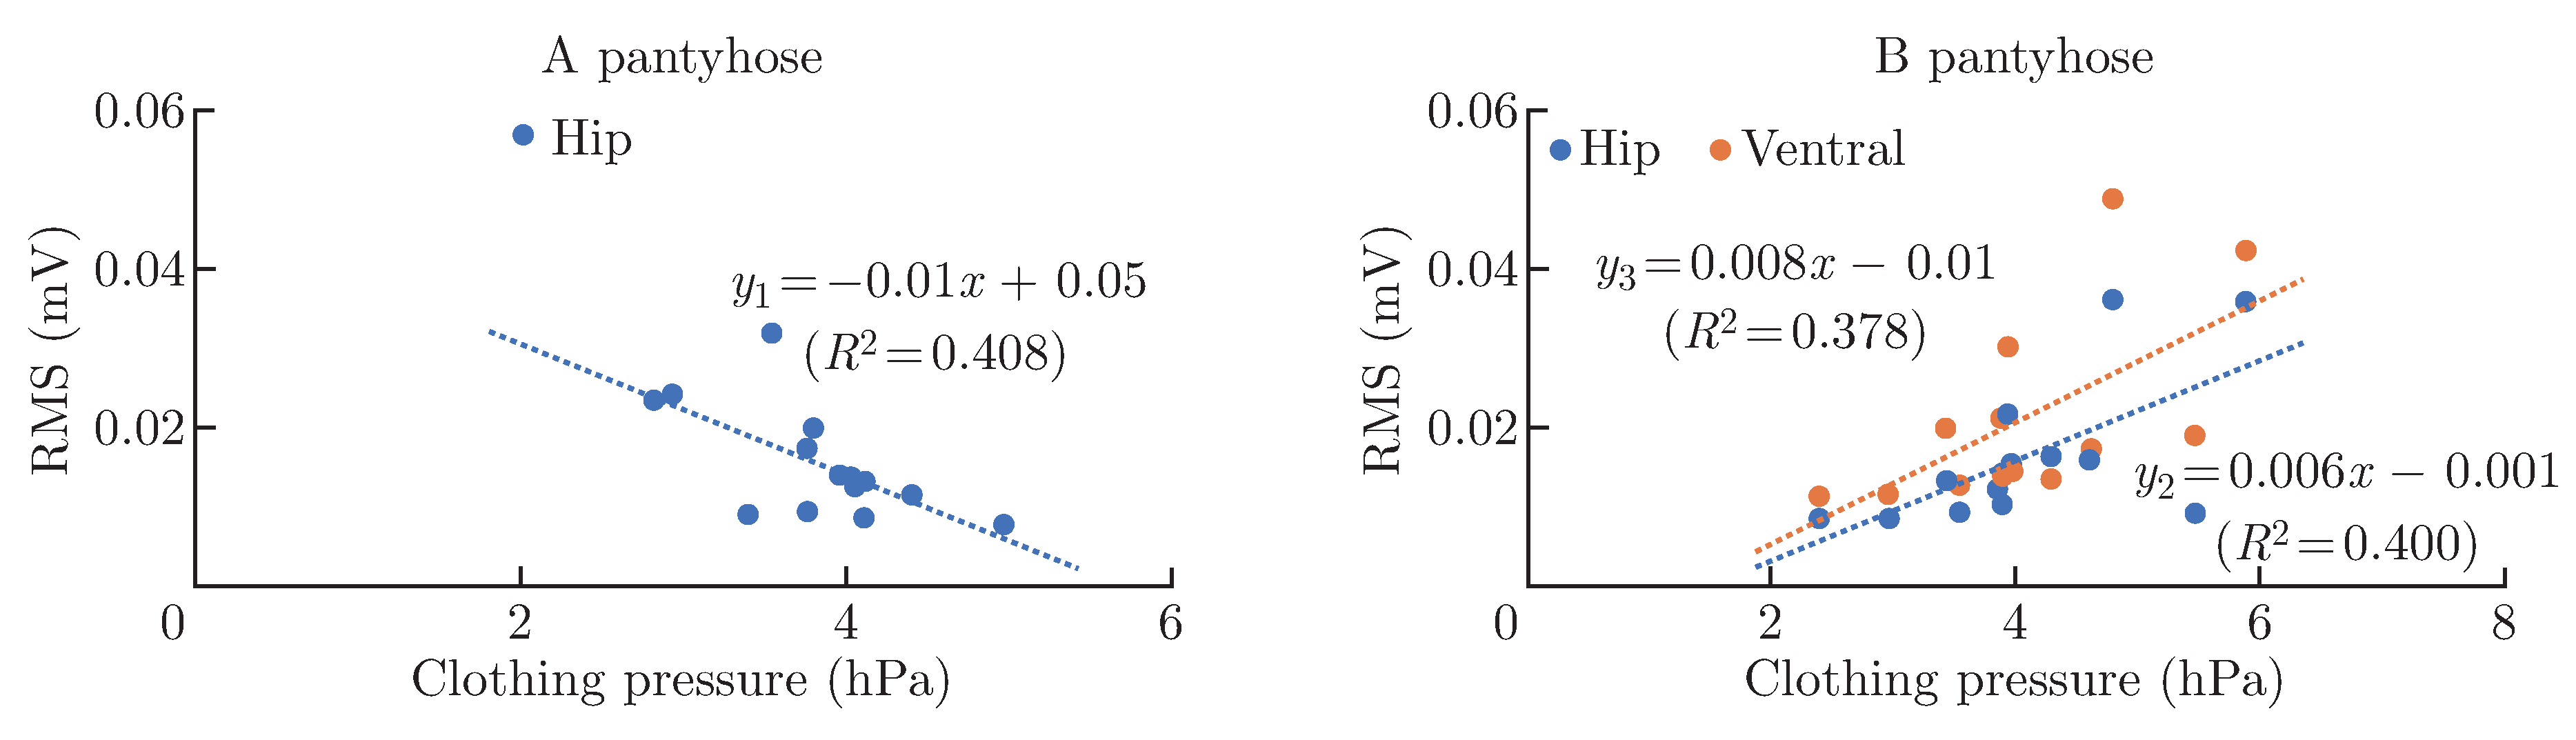
The myoelectric potential, the pressure sensation, and the clothing pressure were divided into the four groups described above, and the correlation coefficients were obtained. There was no significant correlation between pressure sense and clothing pressure/RMS, because the pressure senses obtained from all combinations were almost just fitting feelings. There were significant positive or negative correlations between RMS and clothing pressure. When wearing pantyhose A, the negative correlation coefficient between muscle activities around the hip and clothing pressure on the ventral side, and when wearing pantyhose B, the positive correlations between clothing pressure on the ventral side and RMS around the hip/on the ventral side are shown in Figure 10. The same level of pressure was generated around the hips wearing pantyhose A and B, but in pantyhose A, muscle activity decreased significantly as the pressure increased while in pantyhose B it increased significantly. The relationships were shown by straight lines: y1 (RMS around hip wearing pantyhose A) = -0.01x (clothing pressure around hip) + 0.05. y2 (RMS around hip wearing pantyhose B) = 0.06x (clothing pressure around hip) − 0.001, y3 (RMS on ventral side) = 0.008x (clothing pressure on ventral side) − 0.01. These results occurred the design of increasing the strength from the front of the abdomen through the sides to the hips designed in the panties. In other words, the local distribution of pressure intensity determines the intensity of muscle activity. In addition, if we want to need the looking of the long leg, we need to choose pantyhose B.
Figure 10.
Relationship between RMS and clothing pressure when wearing experimental pantyhose. The results were shown in two figures: the left figure shows wearing pantyhose A and the right figure shows wearing pantyhose B.
We were able to develop a new type of comfortable pantyhose with clothing pressure less than 15 hPa according to the clothing pressure gradient rule [25]. When participants wore this pantyhose, the changes in muscle activity between the different types of pantyhose were not significant, despite significant compression of muscle activity in M1, M3, and M4. Thus, it was found that this type of pantyhose primarily affected the muscle group of the lower leg. However, wearing shoes may change the muscle activity. It has been reported that when the shoe heel is high, the muscles on the dorsal side around the knees are not used, and the muscles on the back side of the hip are used for walking instead [12]. This result is consistent with the findings of Snow et al. [26], who reported that the vertical force exerted on the forefoot during standing increases as the heel height increases and that the centre of gravity moves forward as the heel height increases, causing difficulty in using the muscles on the back side. In future studies, we will examine changes in myoelectric potential for participants wearing both shoes and pantyhose.
5. Conclusion
We aimed to develop pantyhose that fit without being too tight and reduce muscle fatigue. We conducted a study with 17 Japanese women who wore two types of pantyhose with a structural difference in the panty part. Pantyhose B were less stretchy than pantyhose A, as pantyhose B were constructed by partially doubling the threads and changing the knitting method. In addition, the panty part was stretcher in the course direction than in the wale direction. Overall, it was found that the structures of pantyhose A and B differed only in the panty part. For pantyhose B, the waist/hip girths and hip/groin heights were significantly larger compared with those in the control condition. As a result, pantyhose B increased the tensile strength by partially changing the clothing pressure applied to the panty part and significantly increased the hip height by 9.3 mm and the groin height by 20.1 mm compared with the control condition. However, the adipose tissue of the lifted hips shifted to around the hips and the waist, causing the hip and waist circumference to increase by 12.2 mm and 9.0 mm, respectively. As a result, pantyhose B caused the legs to appear longer. When the clothing pressure gradually increased from 2.9 ± 1.5 hPa in the waist to 11.0 ± 5.1 hPa in the foot, participants reported a nearly perfect pressure sensation based on a ratio scale. Thus, pantyhose with an optimized pressure sensation can be created according to the clothing pressure gradient rule. When participants wore pantyhose, EMG changes in the lower leg significantly restricted muscle activity when compared to that in the barefoot condition, that was clarified the local distribution of pressure intensity determines the intensity of muscle activity.
Acknowledgements
Part of this work was supported by the Japanese Society for the Promotion of Science, KAKENHI Grant Number 17H01954/22K02111. The authors wish to acknowledge Mr. A. Yoshida and Ms. A. Bando of Fukusuke Co., Ltd. for providing the experimental pantyhose. We thank Professor Takatera, Associate Professor Kanai, and Technical Officer Hayashi of the Faculty of Textiles Science and Technology at Shinshu University for providing equipment for the material test.
Trial Registration
This study was conducted after a review by the Ethical Review Board for Human Research at Shinshu University (approval number 222).
References
- Kim, Y.; Koo, J.; Oh, D. Influence of Shoe Heel Height and Muscle Fatigue on Static and Dynamic Balance in Healthy Young Women. Phys. Ther. Kor. 2013, 20, 36–44. [Google Scholar] [CrossRef] [Scilit]
- Wiedemeijer, M.M.; Otten, E. Effects of high heeled shoes on gait. A review. Gait Posture 2018, 61, 423–430. [Google Scholar] [CrossRef] [Scilit]
- Barkema, D.D.; Derrick, T.R.; Martin, P.E. Heel height affects lower extremity frontal plane joint moments during walking. Gait Posture 2012, 35, 483–8. [Google Scholar] [CrossRef] [Scilit]
- Simonsen, E.B. Contributions to the understanding of gait control. Dan Med. J. 2014, 61, B4823. [Google Scholar]
- Blanchette, M.G.; Brault, J.R.; Powers, C.M. The influence of heel height on utilized coefficient of friction during walking. Gait Posture 2011, 34, 107–10. [Google Scholar] [CrossRef] [Scilit]
- Satsumoto, Y.; Shimazaki, Y.; Saito, H.; Maruta, N. The effect of the height of the heel of pumps and the age to the gait analysis in wearing business pumps. Desant Sports Sci. 2020, 40, 236–246. [Google Scholar]
- Wakako, L.; Shimokawa, T.; Kinari, T. Analyss of the evaluation factors and indexes for the aesthetic properties of pantyhose. J. Fiber Sci. Technol. 2016, 72, 112–119. [Google Scholar] [CrossRef] [Scilit]
- Orhon, S.; Morooka, H.; Morooka, H.; Manabe, I.; Nakahashi, M.; Wakashima, K. Relationship between aesthetic and shape of legs. Kansei Eng. Int. 2002, 2, 1–8, English abstract and Japanese text. [Google Scholar]
- Dan, R.; Shi, Z. Dynamic simulation of the relationship between pressure and displacement for the waist of elastic pantyhose in the walking process using the finite element method. Text. Res. J. 2021, 91, 1497–1508. [Google Scholar] [CrossRef] [Scilit]
- Lui, R.; Lao, T.T.; Kwok, Y.L.; Li, Y.; Tokura, H. Effects of Compression Legwear on Body Temperature, Heart Rate, and Blood Pressure Following Prolonged Standing and Sitting in Women. FIBERS Polym. 2010, 11, 128–135. [Google Scholar] [CrossRef] [Scilit]
- Nakahashi, M.; Norooka, H.; Nakajima, C.; Sato, S.; Morooka, H. Effects of clothing pressue of pantyhose with controlled loop length on the human circulatory system. SEN’I GAKKAISHI 2003, 59, 407413. [Google Scholar] [CrossRef] [Scilit]
- Mitsuno, T.; Sugawara, A. Effect of the shoe heel height on lower-limb muscle activity. Phys. Ergon. Hum. Factors 2022, 63, 13–20. [Google Scholar] [CrossRef] [Scilit]
- Mitsuno, T.; Kondo, S. Comfortable pantyhose pressure and muscle activity in the legs. Textile Bioengineering and Informatics Symposium Proceedings, 2022; pp. 169–176, ISSN 19423438. [Google Scholar]
- Mitsuno, T.; Hibino, A. Which Support Pants are the Most Effective for Burning Body Fat? J. Fiber Bioeng. Inform. 2016, 9, 187–199. [Google Scholar] [CrossRef] [Scilit]
- Mitsuno, T.; Kai, A. Distribution of the preferred clothing pressure over the whole body. Text. Res. J. 2019, 89, 2187–2198. [Google Scholar] [CrossRef] [Scilit]
- Mitsuno, T.; Aruga, T. Effect of the Size of the Covered Area of the Chest Surface on Pressure Sensation. AHFE 2020, AISC 1202: 2020: 831-840, 2020G; Di Bucchianico, et al., Eds.; AHFE 2020, AISC 1202, 2020; pp. 831–840. [Google Scholar] [CrossRef] [Scilit]
- Mitsuno, T.; Makabe, H.; Momota, H.; Ueda, K. Study on the clothing pressure (Part 1) Measurements by a hydrostatic pressure-balanced method. J. Jpn. Res. Assoc. Text. End.-Uses 1991, 32, 362–367, (English abstract and Japanese text). [Google Scholar]
- Mitsuno, T.; Makabe, H.; Momota, H.; Ueda, K. Study on the clothing pressure (Part 2) Measurements by a hydrostatic pressure-balanced method. J. Jpn. Res. Assoc. Text. End.-Uses 1991, 132, 368–367, (English abstract and Japanese text). [Google Scholar]
- Mitsuno, T.; Ueda, K. Measurement for clothing pressure. J. Home Econ. Jpn. 1994, 45, 179–188. [Google Scholar]
- Mitsuno, T.; Ueda, K. Time relation among clothing pressure developed at waistband, respiratory movement, and girth of abdomen. SEN’I GAKKAISHI 2010, 66, 74–81. [Google Scholar] [CrossRef] [Scilit]
- Bijur, P.E.; Silver, W.; Gallagher, M.A.E. Reliability of the visual analog scale for measurement of acute pain. Acad. Emerg. Med. 2001, 8, 1153–1157. [Google Scholar] [CrossRef] [Scilit]
- Mitsuno, T.; Ueda, K. The clothing pressure developed at waistband and the pressure sense estimated in a ratio scale. J. Home Econ. Jpn. 1997, 11, 989–998, (English abstract and Japanese text). [Google Scholar]
- Kondo, S.; Mitsuno, T. Effect of wearing pantyhose on lower limb muscle activity. Textile Bioengineering and Informatics Symposium Proceedings, 2022; pp. 128–135, ISSN 19423438. [Google Scholar]
- Mitsuno, T.T.; Kondo, S. Possibility of pantyhose design using clothing pressure and myoelectric potential as indices. J. Fibre Bioeng. Inform. in press. [Google Scholar] [CrossRef] [Scilit]
- Mituno, T. Recent clothing pressure. J. Jpn. Res. Assoc. Text. End.-Uses 2017, 58, 34–38, (research review, Japanese text). [Google Scholar]
- Snow, R.E.; Williams, K.R. High heeled shoes: their effect on center of mass position, posture, threedimensional kinematics, rearfoot motion, and ground reaction forces. Arch. Phys. Med. Rehabil. 1994, 75, 568–576. [Google Scholar] [CrossRef] [Scilit]

© 2022 Textile Bioengineering and Informatics Society. This article is an open access article distributed under the terms and conditions of the Creative Commons Attribution (CC BY) license (https://creativecommons.org/licenses/by/4.0/).