Abstract
The 2025 fire season in Portugal was marked by large fires, underscoring the vulnerability of the forested areas to fire. The study analyzes the main meteorological conditions during a critical period of fire activity and addresses the following question: Why can the northeast (NE) weather pattern be so critical for fire danger in Portugal? Fire severity in the Arouca wildfire, the largest fire of the period, was estimated using a methodology that integrates foundation vision models with computer vision algorithms. ECMWF analyses and convection-permitting Meso-NH simulations are used to examine large-scale circulation and the mesoscale environment, respectively. Synoptic-scale analysis revealed the Azores anticyclone centered slightly northwest of the Iberian Peninsula (IP), with its eastern sector directly affecting the northern IP under north/northeast winds. The hectometric-scale simulation demonstrated that orographically enhanced wind gusts over the northern Portuguese mountains substantially intensified near-surface fire-weather conditions when the winds were nearly easterly. Furthermore, strong low-level winds and atmospheric stability constrained vertical plume growth, favoring horizontal smoke transport. In addition, the study highlights that Arouca’s fire had 88% of its area affected with moderate to high severity. Overall, the results demonstrate that the interaction between large-scale NE circulation and local orography plays a decisive role in amplifying fire danger in northern Portugal, emphasizing the need for high-resolution atmospheric modeling to identify fire-prone regions under specific synoptic patterns.
1. Introduction
Understanding fire danger at the local scale is critical for citizens and decision-makers and encompasses multiple elements. In the context of wildfire activity, while climatic conditions can define fire seasons, once initiated, fire development results from the interaction of many factors, including fuel availability, topography, and meteorology. Therefore, how does meteorology affect or relate to wildfire behavior in Portugal? In recent years, this simple question has guided several Portuguese studies aiming to understand the atmospheric environments during large wildfires [1,2,3,4,5,6,7,8]. These studies represent efforts to identify large-fire meteorological precursors and to provide a solid foundation for future advancements in the fire meteorology framework. In addition, the improved knowledge comes from the use of different methodologies and case studies.
For instance, for one of the most dramatic Portuguese wildfires, datasets from numerical modeling and observations showed how a Mesoscale Convective System (MCS) developing in a dry thunderstorm environment can influence fire activity by its convective dynamics and generation of gusty winds at the surface, as well as its potential for natural fire ignition [1,2]. However, atmospheric modeling has been used in numerous other case studies, either through the application of convection-permitting simulations only [2,3,4,5,6] or through its coupling with a fire-propagation model [7,8]. In the first context, numerical experiments revealed the atmospheric circulation during large wildfires and, in some cases, exposed the effects of airflow interacting with local and isolated mountains, which can enhance fire danger or drive fire spread [3,4,5]. Despite their high computational costs, hectometric-scale simulations, typically ranging from 1 km to 100 m, have been crucial for improving our understanding of atmospheric processes at finer scales, although some challenges remain [9].
The occurrence of extreme wildfires has increasingly highlighted the role of meteorological factors in fire behavior worldwide and has demonstrated how these events can vary depending on the combination of atmospheric elements across different scales [10,11,12,13,14,15,16]. Studies reporting fire phenomena (e.g., plume-dominated fire behavior, rotating pyroconvective plume, fire tornadoes, and fire spotting) have become more common in the last years [17,18,19,20,21,22,23], and they also indicate that some fire-prone regions begin to emerge, with their forested areas being more susceptible to fire activity and large wildfires, as seen in Sweden [24], Alaska [25,26,27], South Korea [28], China [29,30], among others. Therefore, the current reality continues to drive the development and improvement of the Numerical Weather Prediction (NWP) models, particularly by incorporating fire-related aspects into their code [31,32]. From this perspective, some studies have started to explore fire–atmosphere interaction, fire plume dynamics, and pyroconvective clouds during some Portuguese wildfires [7,8].
All these works are complemented by studies that aim to identify fire-weather conditions through the calculation of fire danger indices. Indices like the Fire-Weather Index (FWI), Hot–Dry–Windy (HDW) index, Burning Index (BI), Forest Fire Danger Index (FFDI), Haines Index, Wildland–Urban Interface Index, among others, allow us to assess wildfire risk based on the meteorological and fuel conditions, providing crucial information for early warning and mitigation practices. In Portugal, these indices are applied in a climatological context or for specific events during wildfire outbreaks too [33,34,35,36,37]. Recently, advances have been made in FWI calculations based on high spatiotemporal resolution atmospheric simulations over southern Portugal [6]. Additionally, although there has been a trend towards an early build-up of fire danger after the 2000s [38], an increase in fire occurrence during the winter of 2021/22 and the occurrence of a large fire in January 2022 indicates that climate variability may create atmospheric conditions propitious for fire development even during the winter season [3].
In 2025, Portugal experienced an extreme fire season. Although the number of rural fire events decreased compared to the previous decade, the total burned area increased substantially, making 2025 one of the most severe years in recent times [39]. In particular, it was the fourth year with a total burned area above 250,000 ha, only behind 2005, 2003, and 2017 [39]. Furthermore, although Portugal has experienced other extreme fire seasons associated with climate conditions that favor fuel availability, the 2025 fire season still highlights the vulnerability of Portuguese forests to fire. This scenario emphasizes that wildfires are a recurring problem that requires ongoing management and measures to prevent and mitigate the impacts of these events. It is therefore crucial to accurately assess fire danger based on mesoscale atmospheric circulation and multiple meteorological elements.
Finally, regarding weather patterns that favor fire danger in Portugal, several have been documented in the literature [40,41]. Our study focuses on a specific weather pattern documented by [40]. The authors stated that when the Azores high extends over the Bay of Biscay, the northeasterly circulation (NE hereafter) aggravates fire-weather summer conditions by increasing temperature and decreasing humidity, but without significant variations in the wind intensity. Therefore, given the presumed importance of northeasterly winds across northern Portugal, this research aims to provide evidence of the role of orographic effects in enhancing fire danger under such weather patterns, in light of the following question: Why can the NE weather pattern be so critical for fire danger in Portugal? We discuss the main meteorological conditions during a critical period of active fires in northern Portugal, thereby contributing to the current efforts to better understand the role of terrain in fire danger and behavior in real cases, as well as to the broader meteorological context. The paper is structured as follows: Section 2 describes the data and methodology adopted; Section 3 presents the results and their analysis; and Section 4 discusses the results. Conclusions and future perspectives are given in Section 5.
2. Materials and Methods
2.1. Study Period
On 28 and 29 July, multiple significant wildfires were active simultaneously in Portugal, including the Arouca, Ponte de Lima, Penafiel, Cinfães, Penamacor, and Nisa fires, placing considerable pressure on national firefighting resources. Here, we consider Arouca’s wildfire as the main representative case, whereas the wildfire that affected Penafiel County, the Serra da Boneca fire, was defined as a secondary case. In 2025, wildfires significantly affected Arouca, burning about 5896 hectares [39], mainly in forested areas. During that period, access restrictions and safety measures led to cancelled visits and immediate losses for the local tourism sector [42].
The Arouca region, located in northern Portugal, is characterized by a temperate Mediterranean climate with a strong Atlantic influence, featuring mild, wet winters and warm to hot, dry summers, with pronounced seasonal variability in precipitation (e.g., [43]). The northern region’s complex mountainous terrain plays a key role in modulating local atmospheric conditions, frequently intensifying wind fields through orographic effects and increasing fire-weather severity. These combined climatic and topographic characteristics make the northern region particularly vulnerable to wind-driven wildfire events during summer.
Arouca is a municipality in northern Portugal, located in the district of Aveiro, covering an area of 329 km2. It is a largely rural, mountainous territory with a population of around 21,000 inhabitants [44]. The local landscape is strongly shaped by rugged relief and deep valleys, especially those associated with the Freita Massif and the Paiva River. Steep slopes that mark elevation differences and exposed geological formations are common features of the area and help to explain its integration into the Arouca Geopark network [45,46].
The Paiva River plays a central role in the municipality, acting as both an ecological corridor and a structuring element of human occupation. More recently, the river valley has also become a key asset for nature-based tourism, with infrastructures such as the Paiva Walkways attracting a growing number of visitors. The local economy remains largely based on agriculture, livestock farming, and forestry, while tourism linked to natural and landscape values has gained increasing importance in recent years. All these factors make the region vulnerable to wildfires, which can easily impact various sectors of the local economy.
2.2. Models Data
The main methodology is atmospheric modeling that represents various dynamic and physical processes observed in the Earth’s atmosphere, providing insights into and supporting the understanding of processes underlying real cases.
The large-scale environment was characterized by using the European Centre for Medium-Range Weather Forecasts (ECMWF) analysis, accessed through the Meteorological Archival and Retrieval System (MARS) [47]. The dataset has a horizontal resolution of 0.125 × 0.125 degrees and was extracted for 0000 UTC, 0600 UTC, 1200 UTC, and 1800 UTC. The atmospheric circulation analysis and weather pattern identification were based on the wind field at 850 hPa, 500 hPa, and 250 hPa levels.
At the regional scale, limited-area models have been critical for advancing the knowledge of atmospheric processes at finer scales. The non-hydrostatic mesoscale atmospheric model Meso-NH plays an important role in mesoscale atmospheric studies, especially within the French meteorological community [48]. In Portugal, it has been successfully used to improve knowledge of different atmospheric phenomena, for example, related to orographically induced clouds and precipitation [49], desert dust outbreaks in Portugal [50], fire–atmosphere interaction [7], downward solar radiation at the surface [51], the atmospheric impacts of lakes and reservoirs [52], among others.
The study covers the northwestern IP, which comprises the following three main mountain ranges: the Cantabrian Mountains, the Central System, and a small portion of the Iberian System. The arrangement of these mountains forms the Northern Plateau (Figure 1a). To study the mesoscale environment during active fires and the orographic influence on increasing fire danger, the following two simulations were performed: EXP1 and EXP2, using a two-way grid nesting technique. Both experiments have a nested configuration with an outer domain designed at 2.5 km resolution (300 × 300 grid points), covering a large part of the Iberian Peninsula (Figure 1a) and an inner domain at 0.5 km resolution (500 × 500 grid points), covering northern Portugal (Figure 1b). The vertical grid, configured with 50 stretched levels, follows the terrain and has the first level at 30 m. The initial and lateral boundary conditions are provided by the ECMWF analysis, updated every 6 h. The difference between the experiments lies in the topography database; the EXP1 considers the Shuttle Radar Topography Mission (SRTM) database, whereas in EXP2, the topography is set to zero across the entire domain. The latter was performed without the mountain systems, providing evidence of the role of the mountains in the northern Iberian Peninsula in intensifying potential wind gusts and enhancing fire danger in northern Portugal under specific atmospheric circulations. It is noteworthy that neither experiment considers the effects of fire on the atmosphere.
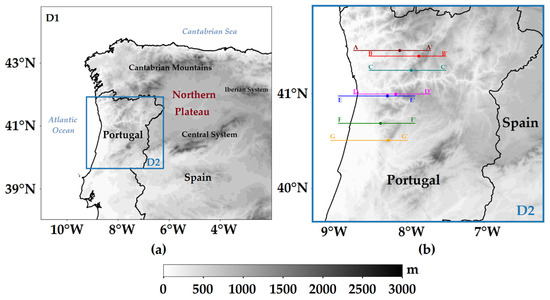
Figure 1.
Study region and model configuration. (a) Model configuration showing the 2500 m and 500 m (blue square) horizontal resolution domains and orography (m, shaded areas) obtained from the SRTM database; (b) inner domain at 500 m resolution. The symbols indicate Arouca’s wildfire location (blue dot) and regions (other color dots) where orographic effects were identified, whereas color lines represent vertical cross-sections to be discussed in Section 3.
Both experiments were configured with the standard Meso-NH physical parameterizations package to represent the main atmospheric physical processes. At these resolutions (2.5 km and 0.5 km), deep convection is explicitly resolved, while shallow convection parameterization was only activated at the outer domain. For this study, we use the Eddy-Diffusivity/Kain–Fritsch (EDKF) Shallow Convection Scheme from the parameterization of dry updrafts and shallow cumulus [53]. The turbulence scheme is based on a prognostic equation for turbulent kinetic energy (TKE) [54]. It employs a one-and-a-half-order closure method that relies on TKE and a mixing length derived from BL89 [55]. The large domain uses a 1D version, in which only the vertical turbulent fluxes are taken into account. In the inner domain, the 3D version is applied, accounting for all the turbulent fluxes. The cloud microphysics represented by the one-moment mixed-phase scheme ICE3 predicts the mixing ratio of five categories of hydrometeors. In addition to water vapor, the scheme considers two categories of liquid water (e.g., cloud droplets and raindrops) and three categories of ice particles (e.g., ice crystals, snow or aggregates, and graupel) [56]. The ECMWF radiation package is used to parameterize the radiative transfer in the atmosphere, based on the Rapid Radiative Transfer Model [57]. Radiation terms are updated every 900 s, whereas the timesteps are 8 s and 1.6 s in the outer and inner domains, respectively. Finally, surface energy exchanges are parameterized according to different schemes using the SURFEX platform of surface models [58].
The experiments were performed for the period between 28 July at 1200 UTC and 30 July 2025 at 0000 UTC for the large domain and from 1800 UTC on 28 July for the inner domain. Using a configuration (e.g., spatial resolution and physical parameterization package) consistent with previous studies that explored the role of local effects in producing atmospheric conditions favorable to fire spread in Portugal, this study seeks to investigate the meteorological factors that can contribute to enhancing fire danger from surface–atmosphere interactions under a specific and well-known weather pattern.
The Meso-NH simulation is initialized from an atmospheric state (the ECMWF analysis) that has already undergone a quality control process and global data assimilation. Since the ECMWF analysis is physically consistent and based on observations, Meso-NH acts as a dynamic downscaling process increasing the spatial resolution and detailing smaller-scale processes associated with terrain, turbulence, and cloud development, on a base that is already considered faithful to reality. This process uses physical parameterizations exhaustively validated in the literature. Furthermore, error margins have already been widely documented in previous works that used the same physical configuration presented in this study. For instance, the model has been widely validated for key near-surface fire-weather variables at the same horizontal resolution and physical parameterizations used here (2 m air temperature and relative humidity, and 10 m wind speed and wind gusts) (e.g., [4,5]). Overall, the experiments show occasional under- or over-estimation, but the model is able to reproduce the main behavior of these variables. Reported mismatches at 1.5 km have been linked to coastal influences and fire impacts near stations (e.g., [3,6]). In this study, the model is primarily used to investigate surface–atmosphere interactions that are difficult to validate directly, such as orographically driven downslope winds associated with mountain gravity waves, which are poorly captured at coarser resolutions and by the sparse weather station network in mountainous regions. Here, the sounding launched in Lisbon is compared with the results at 2.5 km (Figure S1). The sounding confirmed a stable profile characterized by anticyclonic shear, a feature successfully captured by the model’s vertical profile. However, a discrepancy exists regarding surface temperature, namely, high surface temperatures around 30 °C. This may be attributed to the model’s spatial resolution (2.5 km), which could not be enough to resolve the complex coastal processes of the Lisbon area. This simple comparison aims to mitigate the study’s limitations regarding validation against observations.
2.3. Burn Scar Assessment
Computer Vision has evolved to extract knowledge about Earth surface features from satellite imagery, supported by advances in image processing algorithms, machine learning models, deep learning architectures, and foundation models (FMs). FMs are trained on large amounts of data and are adaptable to a wide range of application domains [59,60,61]. In recent years, Vision Foundation Models (VFMs) have emerged and shown potential for object and semantic segmentation, scene classification, and object detection, among other tasks [62].
Sentinel–2 imagery [63] was used to determine the area of the burned scars (Figure S2). The images are radiometrically and atmospherically corrected, corresponding to a raster of 2016 × 1872 pixels. The dates considered were 17 June 2025 (pre-event, Figure S2a) and 1st August to 5th September 2025 (post-event, Figure S2b). The images contain over 3,773,952 pixels, with each pixel representing an area of 0.01 ha on the ground. The cover area is approximately 37,740 ha. The data are referenced in the EPSG:4326—WGS 84 coordinate reference system.
Segmentation, defined as the separation of foreground objects from the background, is a fundamental step for subsequent analysis and interpretation. In this context, the Segment Anything Model (SAM) developed by Meta Artificial Intelligence was used to segment fire scar boundaries [64,65,66]. SAM was applied to satellite imagery through the open-source Python package Segment Anything Geospatial (SAMGeo), SAMGeo Version 1. This package is available on PyPI and conda-forge and integrates several additional Python libraries [65,67,68,69,70]. A region of interest (ROI) which includes the burned scars was defined. The Arouca wildfire was centered at latitude 40.9790° N and longitude 8.2613° W, while the secondary case (Serra da Boneca’s wildfire) was centered at latitude 41.0888° N and longitude 8.3793° W. SAMGeo was applied using various initialization parameters to automatically generate masks representing the fire scars. Initially, the masks were in raster format and converted to vector format. Then, the masks were filtered to eliminate isolated and spurious zones based on their size and location. The fire perimeter burned area boundary was measured. Within this perimeter, burned and unburned patches were identified using the Normalized Difference Vegetation Index (NDVI), Normalized Burn Ratio (NBR) spectral indices, or soil and terrestrial vegetation.
The NDVI is the most commonly used vegetation index and is highly informative about the vegetation physiological conditions, the vegetation distribution over geographical areas, and the vegetation dynamics [71,72,73]. The NDVI combines the red (R) and near-infrared (NIR) wavelengths and ranges from −1 to 1, where higher values indicate denser and healthier vegetation. NBR is an index that highlights burned areas in large fire zones and combines the NIR and shortwave infrared (SWIR) wavelengths. Lower NBR values are associated with burned surfaces; values close to zero indicate recently burned areas. In contrast, high positive NBR values correspond to unburned, dense, and healthy vegetation [74,75,76].
To estimate burn severity, the delta NBR (dNBR) was calculated as the difference between pre-fire and post-fire NBR. Highest dNBR values indicate more severe damage, while negative dNBR values may indicate post-fire vegetation regrowth. The Burn Severity information could be used in post-fire emergency response and restoration planning [77]. Burn severity was classified using dNBR according to the thresholds proposed by the United States Geological Survey (USGS) [78], which define severity levels ranging from enhanced post-fire regrowth to high burn severity.
2.4. Meteorological Satellite Imagery and Fire Activity Data
The large-scale analysis is complemented by satellite imagery information using the water vapor channel (6.3 μm, °C) with 2.0 km spatial resolution, obtained from the Flexible Combined Imager (FCI) spectral imaging instrument onboard the geostationary satellite METEOSAT-12, formerly the Meteosat Third Generation (MTG) Imager 1 [79]. The FCI instrument supports the geostationary spectral imaging mission of the MTG program and comprises channels across 16 spectral ranges, covering visible to infrared wavelengths. The High-Resolution Fire Index (HRFI) dataset has 4 spectral channels at VIS 0.6 µm, NIR 2.2 µm, IR 3.8 µm, and IR 10.5 µm, with a spatial resolution of 0.5 km for the visible and near-infrared channels and 1 km for the infrared channels.
Fire activity was determined using satellite information from the Fire Information for Resource Management System (FIRMS) [80]. The active fire product data used were derived from the Visible Imaging Radiometer Suite (VIIRS) sensor aboard the joint NASA/NOAA Suomi National Polar-orbiting Partnership (S-NPP), NOAA-20, and NOAA-21 satellites, as well as information for each location across the globe at least twice a day. The VIIRS active fire product has a nominal spatial resolution of 375 m at nadir, enabling the detection of small fires and improving spatial agreement with the burned-area perimeter [81].
3. Results
This section presents the results on wildfire characteristics in the Arouca region, followed by the analysis of atmospheric dynamics on different scales.
3.1. Arouca’s Wildfire, Burn Scar Area, and Fire Severity
Active fires were detected overnight, spreading westward, and by the afternoon, they had already encompassed a large burned area (Figure 2). The smoke plume followed the same direction, being transported westward (Figure 2, top left corner).
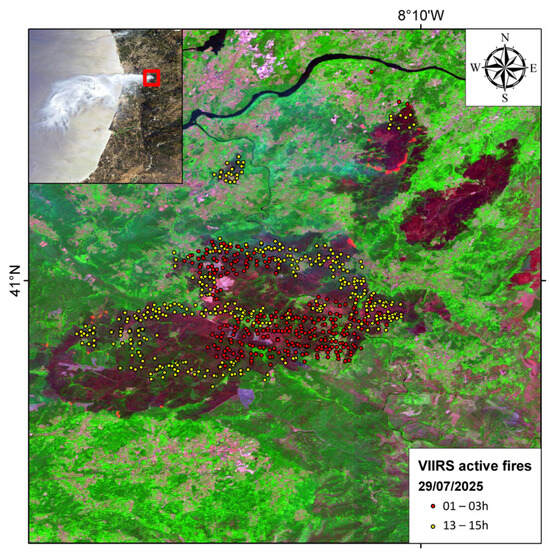
Figure 2.
Fire characteristics on 29 July 2025 showing VIIRS active fires extracted from the S-NPP, NOAA-20, and NOAA-21 satellites. A true color image highlighting the smoke plume transport derived from wildfires is found in the top left corner. The red square indicates the fire location.
The SAMGeo model allowed the segmentation of objects with similar intensity values into groups, in which the burn scars corresponding to both cases were identified. Also, other groups were recognized and filtered. For the Arouca wildfire, the area and perimeter values are 6110 ha and 54.5 km for the first burn scar, 890 ha and 18.7 km for the second burn scar, and 840 ha and 19.4 km for the third burn scar. In the Sierra da Boneca, the area and perimeter are 1610 ha and 27.6 km, respectively. This information allows the analysis of the spatial extent of the fire-affected area, estimated at 7720 ha. In addition, the segmented objects are used as masks to analyze burned and unburned areas and to assess fire severity (Figure 3).
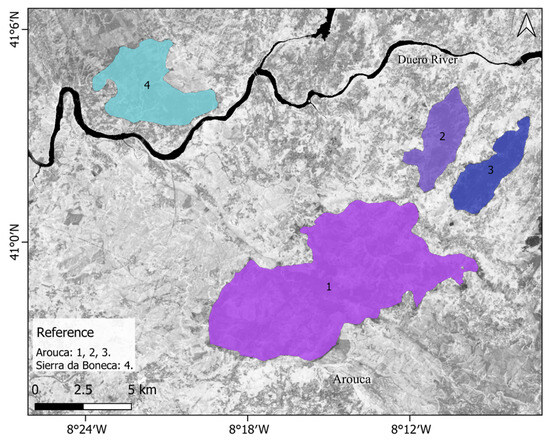
Figure 3.
Burn scars detected by the SAMGeo model corresponding to 1 August 2025. Numbers 1–3 correspond to the Arouca fire, while number 4 corresponds to the Serra da Boneca fire.
Information from multispectral indices such as the NDVI and NBR highlights areas of vegetation, water bodies, rivers, soils, and burn scar (Figure S3). In the NDVI image, the highest vegetation values within the burn scar extent mask are associated with riparian areas following the drainage network. Thresholding was applied to segment pixels classified as vegetation in NDVI images and as burned area in NBR images. For the NDVI images, a threshold value greater than 0.25 was applied; for the NBR, a value greater than zero was selected. Figure S4 shows the segmentation results of the NDVI and NBR within the boundary delimited by the SAMGeo mask. Finally, the area of vegetation pixels derived from the NDVI and the pixels corresponding to burn scars were measured (Table 1).

Table 1.
Measurement of burned and unburned areas (ha) from NDVI and NBR segmented regions.
The NBR is better at detecting burned areas when compared with the NDVI, since the SWIR enhances spectral separability. After a visual inspection, we found that urban or bare-soil pixels were classified as burned areas. For this reason, to assess fire severity within each burn scar, we used the burned-area mask based on the NBR index. Fire severity results are shown in Figure 4 and Table 2. The primary case had 88% of its area affected, with dNBR values ranging from moderate to high severity, whereas the second case had 77% of its area affected (Figure S5).
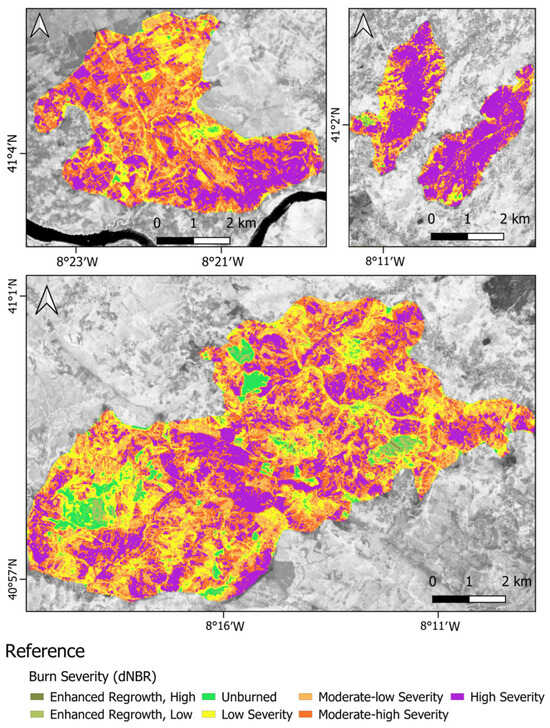
Figure 4.
Burn severity of the fire corresponding to pre-fire (17 June 2025) and post-fire (5 September 2025) conditions.
Table 2.
Burn severity levels based on the USGS-proposed dNBR thresholds, in ha.
3.2. Meteorological Conditions
3.2.1. Large-Scale Environment
Figure 5 shows the evolution of the deep-layer Azores anticyclone, centered at 38° N/20° W at upper-levels (250 hPa) on July 25 and 26, 2025 (Figure 5a,b). However, mainland Portugal was under the influence of an upper-level trough, associated with a low-pressure system centered near western France on July 25 (Figure 5a). On the following two days, as the cyclone moved towards northern Italy, the high-pressure system weakened at altitude, and a jet stream crossed the United Kingdom and France in a NW/SE orientation towards the Mediterranean Sea on July 28 (Figure 5c). At that moment, an upper-level low-pressure system was visible between the Madeira and Azores archipelagos, while mainland Portugal was under the influence of the dissipating stage of the anticyclone in altitude, i.e., the system no longer presented a well-defined counterclockwise circulation at altitude. On July 29 (Figure 5d), the main study period, mainland Portugal was affected by the approach of an upper-level ridge, associated with the anticyclone development of the previous days.
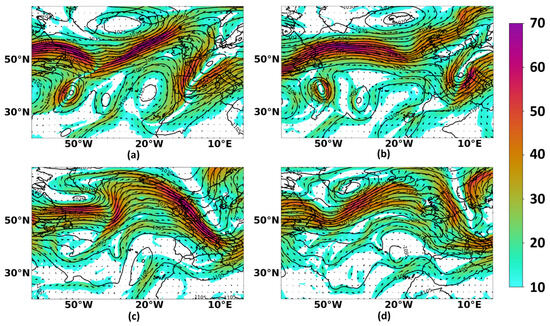
Figure 5.
Wind speed (m·s−1, shaded areas) and direction (arrows) at 250 hPa for (a) 25 July 2025 at 0000 UTC, (b) 26 July 2025 at 0000 UTC, (c) 28 July 2025 at 0000 UTC, and (d) 29 July 2025 at 0000 UTC. The contour lines represent the geopotential height (dam).
Figure 6 shows the wind speed at middle levels, where the influence of the Azores anticyclone is evident during the days preceding the study period. On July 25 (Figure 6a), the anticyclone was identified centered east of the Azores archipelago, being observed closer to the Portuguese coast on July 28 (Figure 6b). During the study period, the northward-shifted system, positioned close to mainland Portugal, favored a northerly circulation over the northwest of the Iberian Peninsula, especially during the night and in the morning of 29 July (Figure 6c). This circulation weakened during the afternoon and toward the end of the day (Figure 6d).
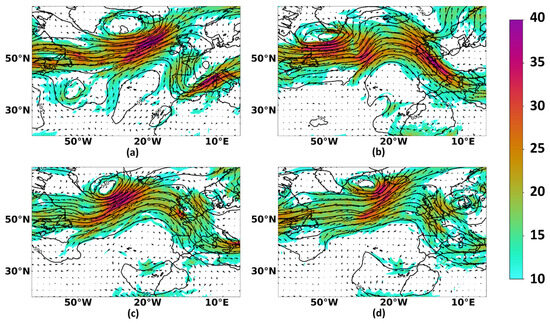
Figure 6.
Wind speed (m·s−1, shaded areas) and direction (arrows) at 500 hPa for (a) 25 July 2025 at 0000 UTC, (b) 28 July 2025 at 0000 UTC, (c) 29 July 2025 at 0600 UTC, and (d) 29 July 2025 at 1800 UTC. The contour lines represent the geopotential height (dam).
In the lower troposphere, at 850 hPa (Figure 7), the presence of the Azores high-pressure system centered northwest of Iberia is evident (AA, Figure 7). As the anticyclone moves northeast of the Azores archipelago, the system approaches mainland Portugal, inducing northerly winds over the region associated with the system’s eastern edge (Figure 7a). An intensification of the 850 hPa winds is observed in the Northwest of the Iberian Peninsula during the night and in the morning of July 29 (Figure 7a), followed by weaker winds in the afternoon (Figure 7b).
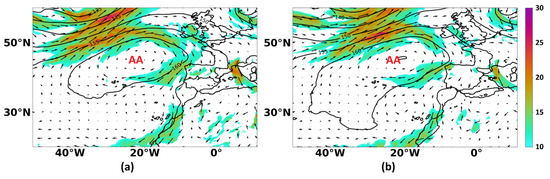
Figure 7.
Wind speed (m·s−1, shaded areas) and direction (arrows) at 850 hPa on 29 July 2025: (a) at 0600 UTC, and (b) at 1200 UTC. AA indicates the Azores Anticyclone. The contour lines represent the geopotential height (dam).
The air mass dynamics between the central Atlantic and northern Portugal during the period of the wildfires are assessed using water vapor satellite imagery (6.3 μm; Figure S6) from 28 to 29 July. In the morning of July 28 (Figure S6a), the Iberian Peninsula remained under the influence of a relatively moist air mass (Figure S6a, blue arrows), likely a remnant of the frontal trough observed between July 25 and 26 (Figure 5a,b). Concurrently, a dry subtropical air transport, driven by the Azores anticyclone (yellow arrows), was observed near the eastern coast of the British Isles (51° N, 10° W).
Between July 28 and 29 (Figure S6b–d), the approach of an extratropical cyclone (L) from the central Atlantic is evident around 50° N, as well as the development of a baroclinic wave (BW) near the British Isles (Figure S6c,d). The system’s occluded front shifted the mean flow southward, transporting warm, dry subtropical air into northern Portugal and disrupting previous moisture transport. This BW development amplified the southward advection of dry air, establishing a meridionally displaced warm front over northern Spain. These dynamics effectively reflected atmospheric blocking conditions, significantly altering the regional moisture profile.
The presence of dry air in the western sector of the BW warm front is observed in the vertical profiles of the EXP1 simulation (Figure 8). Figure 8a shows dry weather conditions in all isobaric levels, a clear anticlockwise windshear between the middle (~600 hPa) and upper (100 hPa) troposphere, and a strong inversion below 900 hPa. The simulation showed a water vapor mixing ratio vertical profile with values around 7 g/kg near the surface (Figure S7). The stable conditions are also emphasized by the extremely low values observed in the Convectively Available Potential Energy (CAPE) index and the high values in the Lifted (LFTD) and Showalter (SW) indices (Figure 8a,b).
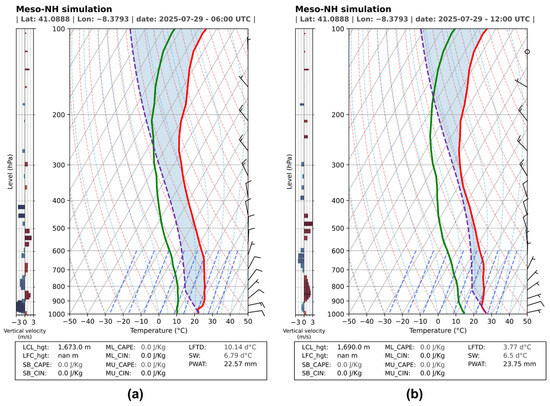
Figure 8.
SkewT/LogP on July 29, 2025: (a) at 0600 UTC, and (b) at 1200 UTC. Data obtained from the EXP1 simulation at horizontal resolution of 0.5 km. The solid red and green lines represent temperature and dew point temperature, respectively. The dashed purple line represents the profile path. The CIN is represented by the blue shaded area.
Such stable conditions persisted through the entire study period between the morning and noon of July 29, suggesting drier vertical profiles and stronger inversions as the warm front of the BW advanced eastward to the western sector of Spain (Figure S6e,f, red line; Figure 8b), possibly enhancing fire danger through the low relative humidity and inversion of the surface winds. In addition, the mean flow at the cold sector of the BW showed similar characteristics to those observed during an Anticyclonic Rossby wave breaking event (Figure S6d–f; AWB), with the amplification of a meridional ridge at the rear side of the extratropical cyclone and the southward motion of the trough located at the warm sector of the front [82]. Those conditions are consistently associated with the development of high-pressure systems below the upper-level ridge, the development of low-pressure systems to the NW and SE of the upper-level ridge [82], and the onset of atmospheric blocking events and meteorological heat waves [83].
3.2.2. Mesoscale Analysis
This section focuses on the Meso-NH simulations, aiming to elucidate the large mesoscale dynamics [EXP1 at 2.5 km resolution] and the effects of mountain-scale processes on local airflow and fire danger amplification [EXP1 and EXP2 at 0.5 km resolution]. In particular, 10 m wind gusts are analyzed, given their potential to influence fire behavior over short timescales and their strong spatial variability over complex terrain. In the Portuguese context, wind gusts have emerged as a critical variable in assessing wildfire danger. This variable was examined focusing on convective outflows during the Pedrógão Grande wildfire [2], whereas recent evidence from Madeira [4] and northern mainland Portugal [3] underscores the role of topographically induced wind gusts. Consequently, while standard fire-weather indices remain fundamental, it is important to integrate wind gusts into the analysis of fire danger, as they can cause extreme fluctuations in fire propagation.
The winds associated with the general circulation of the anticyclone blow between the Cantabrian Mountains and the central system, maintaining a semi-stationary condition along the 29 July (Figure 9a–c). These winds are from the NE over the Northern Plateau and are directed towards northern Portugal. The winds are mostly from the east over the northern region of Portugal and near the Arouca region (blue dot).
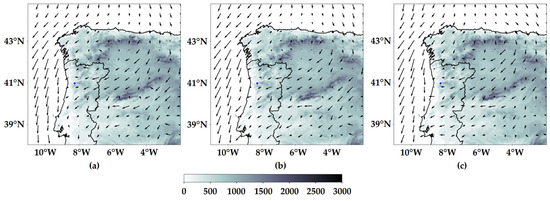
Figure 9.
Orography (m, shaded areas) and wind vectors at 10 m from the outer domain at 2.5 km horizontal on June 29, 2025: (a) at 0000 UTC, (b) at 0600 UTC, and (c) at 1200 UTC. Blue dot indicates Arouca’s wildfire location.
Figure 10 presents a dominant condition observed throughout the study period. The wind field at 10 m showed relatively low values, below 10 m·s−1, near the surface (Figure 10a). This dry flow, with low precipitable water values (20 mm; Figure 10b), is colder over the Plateau and in high-altitude regions and slightly warmer in regions below 500 m, near the Portuguese coast and in the south of the domain (Figure 10c). The total accumulated precipitation during the entire period of the EXP1 numerical experiment indicates that only weak orographic precipitation occurred in northern Iberia (Figure 10d). Anticyclone circulation is favorable for fire activity, given the associated fair-weather conditions, allowing high temperatures and low relative humidity throughout the diurnal cycle, as well as due to the inhibition of the formation of deep precipitation systems.
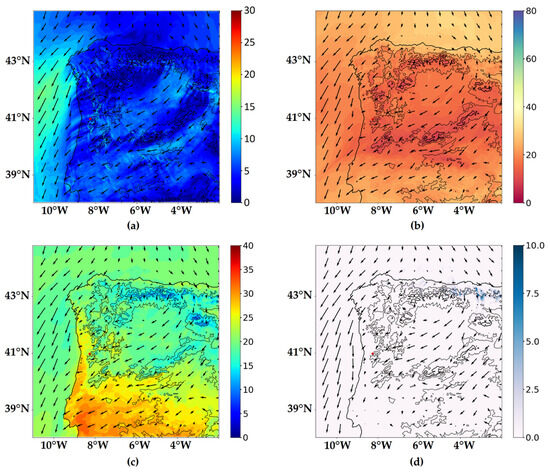
Figure 10.
Fire-weather conditions from the EXP1 outer domain simulation. July 29, 2025, at 0900 UTC: (a) wind magnitude at 10 m (m·s−1, shaded areas), (b) precipitable water (mm, shaded areas), (c) air temperature at 2 m (°C, shaded areas), and (d) total accumulated precipitation (30-h period) (mm, shaded areas). Arrows represent wind direction at 10 m and contours indicate orography at 500 m intervals. Red dot represents fire location.
After describing the spatiotemporal aspects of the main fire-weather conditions, the local effects are further investigated. The complex terrain of northern Portugal perturbs the atmospheric flow, increasing near-surface turbulence and influencing wind gusts. Therefore, this variable should also be taken into account in wildfire danger assessment. Figure 11 shows that as the NE wind reaches the northern Portuguese mountains, intense wind gusts exceeding 20 m/s are identified, especially when the wind is nearly easterly. The simulation indicates that this flow strengthened after 0000 UTC (Figure 11a,b), leading to an increase in wind gusts overnight. Wind gusts reached their maximum of about 25 m/s around 0600 UTC (Figure 11c), losing intensity during the morning as the wind no longer affected the mountains from a direction almost perpendicular to them (Figure 11d–f).
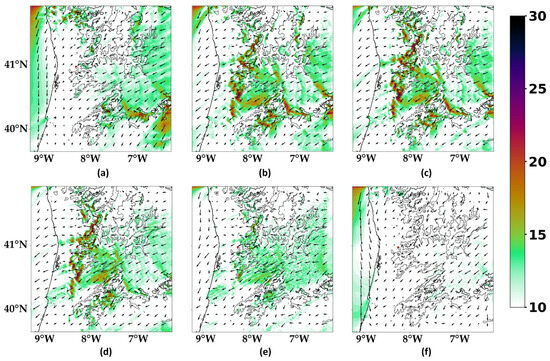
Figure 11.
Inner domain EXP1 wind gust (m·s−1, shaded areas) field and wind direction (arrows) (a) at 2100 UTC on July 28, 2025; July 29, 2025: (b) at 0300 UTC, (c) at 0600 UTC, (d) at 0900 UTC, (e) 1200 UTC, and (f) 1800 UTC. The red dot represents Arouca’s fire location. Contours indicate orography at 500 m intervals. Red dot represents fire location.
To better understand the effects of orography on wind field, seven vertical cross-sections were considered along the mountains where the strongest wind gusts were identified (Figure 1b and Figure 11c,d). The vertical cross-sections shown in Figure 12 indicate that the strong wind gusts are linked to downslope flow on the leeward side of the mountains, where vertical velocity reaches values around 3–4 m·s−1 (DD’ and FF’, Figure 12b and Figure 12d, respectively), occasionally exceeding 5 m·s−1 (CC’, Figure 12a). Over the Arouca region, these effects are weaker but still present (EE’, Figure 12c). In some cases, this disturbance in the flow is reflected in the generation of gravity waves (FF’, Figure 12d). The remaining vertical cross-sections are shown in Figure S8. Furthermore, a slight warming of the air associated with these effects can be seen in the vertical sections of potential temperature and, in certain situations, extends down to near-surface levels (Figure S9).
Figure 12.
Vertical cross-sections of vertical velocity (m·s−1, shaded areas) for (a) CC’, at 0900 UTC; (b) DD’, at 0600 UTC; (c) EE’, at 0600 UTC; and (d) FF’, at 0900 UTC. Vertical cross-sections are indicated in Figure 1b. The dotted red lines in c) represent the maximum longitudinal extent of the fire perimeter.
Therefore, the results show that when NE winds reach northern Portugal, some areas exhibit extreme wind gust values when these winds are nearly easterly, indicating a local danger associated with the region’s complex terrain. The impact of orography was verified using the EXP2 simulation, which did not consider topographic elevations. Figure 13a clearly shows that the intense gusty winds only appear when orography is considered, indicating the nature of the gusty winds with differences greater than 10 m·s−1. These peak wind gusts did not directly drive the Arouca fire in some areas. Figure 13b illustrates the conditions within the fire perimeter, where the discrepancy between the two simulations is less pronounced. In Figure 13c, relative to the purple dot, EXP1 shows slightly higher wind gust speeds during the early morning hours; however, from the morning of the 29th onward, EXP2 values exceed those of EXP1. In Figure 13d (yellow dot), a clear orographic effect is observed, with EXP2 maintaining significantly lower and more stable wind speeds, whereas EXP1 exhibits high-amplitude fluctuations in wind gust magnitude. Notably, the two simulations present a marked contrast and show how local mountains influence fire danger during the critical fire-active period and under a specific weather pattern (Figure S10).
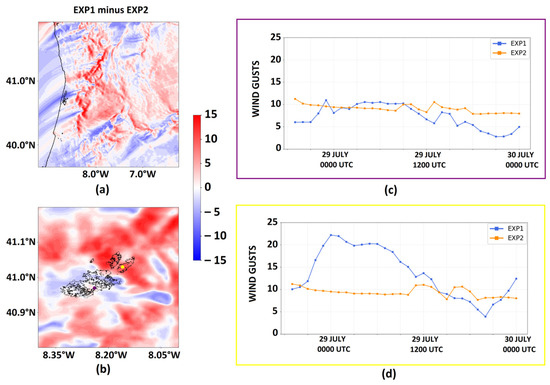
Figure 13.
Difference between the wind gusts (m·s−1, shaded areas) at 10 m in the numerical experiments, i.e., EXP1 minus EXP2, at 0700 UTC on 29 July 2025: (a) 500 m-resolution domain and (b) zoom over the fire zone. Black contours represent the Arouca fire perimeter, taken from: https://mapping.emergency.copernicus.eu/activations/EMSR824/aois/ (accessed on 18 February 2026). Temporal evolution over wind gust (m·s−1) at purple point (c) and yellow point (d). The blue line represents EXP1, while the orange line represents EXP2. The yellow and purple points in (b) correspond to the yellow and purple boxes in (c) and (d), respectively.
4. Discussion and Summary
This study investigates the meteorological conditions during a critical fire outbreak, focusing on the Arouca wildfire on 29 July 2025 and addressing the following central question: Why can the NE weather pattern be so significant for fire danger in Portugal?
Fire burn severity in the Arouca wildfire was estimated using a methodology that integrates foundation vision models with computer vision algorithms. A pre-trained foundation model was first employed to delineate the burn scar from Sentinel-2 imagery. Based on this segmentation, the NDVI, NBR, and dNBR were computed and subsequently processed using computer vision-based segmentation and classification algorithms to measure burned and vegetated areas and to quantify fire severity. Results indicate that 88% of the Arouca fire experienced moderate-to-high burn severity.
The topic of fire meteorology has been increasingly explored in recent years, highlighting several mesoscale phenomena that can increase fire danger in different regions. In the last few years, a solid background has been built from the use of atmospheric modeling applications in Portuguese case studies of large fires and in fire meteorology. Atmospheric conditions can directly influence fire behavior. For example, in October 2017, the passage of Hurricane Ophelia, associated with strong south/southwest winds, favored extreme wildfire outbreaks [9]. Recently, a cyclonic circulation was documented influencing fire weather in the Iberian Peninsula by remaining stationary west of Portugal and advecting warm, dry air from North Africa [6]. Some other weather patterns have also been identified as favorable for precipitating systems and lightning production during the summer. In this case, there is an increasing possibility of natural fire ignition in some regions of Portugal [84].
The results represent a step towards understanding how large-scale meteorological conditions can influence wildfire development in Portugal, particularly by considering the positioning of synoptic-scale systems. The Azores anticyclone was highlighted as the dominant meteorological system during the fire outbreak. Anticyclone systems have also been identified during other fire events in Portugal. For instance, in a large fire during the wintertime, an anticyclone was centered in the Biscay Gulf, which favored easterly winds over the North Iberian Peninsula [3]. In that case, the orographic effect was triggered in the mountains surrounding the Montesinhos Natural Park, where a fire front was driven by downslope winds created from the interaction between airflow and local terrain. Another study documenting the Azores anticyclone positioning was related to the ‘Vila de Rei’ wildfire that occurred in 2019. The eastern sector of the Azores anticyclone, interacting with the thermal low over the Iberian Peninsula, increased the horizontal temperature and pressure gradients over the western Iberian Peninsula, producing intense winds at the lowest levels of the atmosphere. When interacting with the complex terrain of central Portugal, local orographic effects were triggered, intensifying fire spread and causing a total burned area of almost 10,000 ha in 24 h [5]. The influence of the Azores anticyclone and its NE winds was also documented to have enhanced fire-weather in Madeira Island through orographic effects, as well as to have produced large fires [4]. In all these cases, convection-permitting simulations were used to assess the meteorological conditions during wildfire evolution. The high-resolution simulation helped us identify specific features of fire danger in northern Portugal when the NE weather pattern is present, which can be enhanced by orographic effects.
Interactions between weather systems and regional orography create favorable conditions for fire ignition and spread worldwide. The well-known Santa Ana Winds are downslope winds that play an important role in producing recurrent large extreme wildfire events in California [85,86]. Synoptic conditions interacting with the Andes Mountains can produce large fires through orographically induced winds [87,88], whereas the position and slow motion of anticyclones on the Andes’ east side have also influenced fire activity [89]. In addition, downslope winds were identified in isolated mountains by driving fire propagation and creating fire-weather conditions conducive to fire, which are directly linked to the geometry and orientation of such a barrier relative to the mean airflow (e.g., Madeira Island, Hawaii, and Canary Islands) [4,90,91].
Although studies highlight the fire danger favored by large-scale weather patterns, our study sought to provide real evidence of the role that the positioning of such patterns can have in intensifying active fires or enhancing fire danger. The study shows that, even though it was not directly affected by extreme wind gusts from orographic effects, Arouca’s wildfire was intensified, influenced by the mean winds westward of the mountains in the North. In general, a simulation without the Iberian Peninsula orography reveals the terrain’s impact on the wind gust field, mainly in regions where orographic effects considerably increase wind gust intensity near the surface.
The schematic illustrates that when the Azores anticyclone is positioned in such a manner that the E/SE sector affects the North region of the Iberian Peninsula (Figure 14, PHASE I), the northerly winds align with the mountains’ chains in the region, namely, the Northern Plateau, being channeled toward northern Portugal when they are found to be northeasterly winds or nearly easterly in some regions (Figure 14, PHASE II). In this region, the local mountains interact with this airflow, triggering orographic effects (Figure 14, PHASE III). The orographic effects are evident in meteorological fields, such as wind gusts at 10 m. This study uses wind gusts at 10 m as a variable indicative of fire weather, given that they can directly influence fire behavior. In an orographic context, intense wind gusts can persist for many hours as the mesoscale circulation remains semi-stationary. Regarding the vertical structure of the atmosphere, which is crucial for determining the behavior of the smoke plume and the generation of pyroconvective clouds [7,92,93], the Skew-T/logP diagram from the 0.5 km simulation helped us to understand why the convective plume did not rise vertically but was instead advected toward the Atlantic Ocean, likely remaining within the boundary layer. Strong low-level winds at 950 hPa, together with a stable atmosphere associated with the anticyclone, supported these environmental conditions and fire plume behavior, thereby inhibiting the formation of pyroconvective clouds.
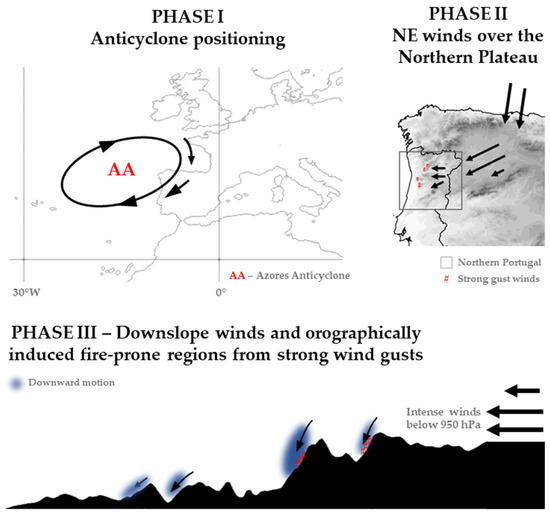
Figure 14.
Schematic representation of dynamical processes during the critical fire period.
The study reveals why the NE pattern can be important in a fire danger context in Portugal, namely, due to the orographic effects that are triggered over the northern mountains. However, some challenges remain. The correlation between weather patterns and wildfires is difficult to establish because fire frequency depends largely on human factors, and fire danger can exist without fire occurrence. Moreover, orographic effects should be in phase with regions that are largely forested, for example.
5. Conclusions and Future Perspectives
Artificial intelligence proved to be an effective approach for delineating and measuring burn scars in Arouca’s wildfire. The use of foundation models, trained on large volumes of information and applicable across different research domains, enabled a fast and reliable characterization of fire extent while significantly reducing the need for extensive data labeling. The integration of traditional computer vision techniques complemented the use of foundation models, allowing a more precise quantification of the affected areas. The results supported the identification of the most impacted zones and highlighted that riparian environments show a higher degree of conservation during fire events. Overall, this work demonstrates the potential of combining foundation models with classical vision methods for post-fire assessment and environmental monitoring. Future research will focus on incorporating additional geospatial information and expert knowledge to support decision-making processes aimed at identifying areas with higher fire occurrence and defining mitigation and emergency-response strategies.
Concerning the meteorological aspects, the case study was simulated using a limited-area setup of the Meso-NH model. The 0.5 km simulation demonstrated that mountains in northern Portugal play a crucial role in shaping local meteorology and fire danger conditions by enhancing wind gusts. Here, the study draws attention to a critical fire period but highlights the challenges of identifying fire danger when considering synoptic and smaller-scale meteorological conditions.
The large-scale analysis confirmed the influence of the Azores anticyclone before and during the study period. As it moved eastward, the eastern edge of the anticyclone induced northerly winds over the Bay of Biscay, transporting relatively dry air and leading to conditions analogous to those observed during atmospheric blocking events. Since this circulation pattern primarily affected the northern region of the Iberian Peninsula, the effect of the northeasterly winds was predominant over the Northern Plateau. Previous studies have considered only results from low-resolution global models, highlighting large-scale meteorological patterns during wildfire events. Here, fine-scale analysis indicated that the NE wind pattern, driven by large-scale circulation, can trigger orographic effects in the local mountains across northern Portugal, intensifying fire danger by increasing wind gusts near the surface. This study reveals the growing need to account for orographic effects when assessing fire danger and encourages extending this approach to future events with similar synoptic conditions, thus providing insights for earlier warnings and mitigation practices. Furthermore, the fire burn severity estimated for Arouca’s wildfire revealed that 88% of its area was affected with moderate-to-high severity, suggesting enhanced fire danger over northern Portugal during the transport of dry air and a NE displacement of the surface wind.
In a broader context, this study is part of efforts to increase knowledge of meteorological factors at different scales that can lead to the development of large wildfires in Portugal. The hectometric-scale simulation underscores the benefits of increasing NWP model resolution, particularly for capturing smaller-scale phenomena that were neglected in previous works about weather patterns and wildfires in Portugal. The study shows the meteorological conditions during a critical fire-active period and identifies fire-prone regions which can be taken into consideration in fire management and prevention, namely, when synoptic conditions are similar to those documented in the present study.
Finally, this case study highlights the need for increased long-term efforts to accurately predict fire danger on a local scale by also accounting for vegetation characteristics in order to improve fire danger assessments. A mountain’s impact on fire danger due to its enhancement of surface wind gusts is highly relevant to planning. The present study intends to serve as a background for the ongoing efforts to improve atmospheric modeling by using a fire–atmosphere coupled system in LES mode. Therefore, scientific advancement is expected by using fire–atmosphere coupled simulation to explore the main aspects of Arouca’s fire at the fire scale, namely, its fire plume dynamics and its interaction with the environment.
Supplementary Materials
The following supporting information can be downloaded at: https://www.mdpi.com/article/10.3390/fire9030111/s1, Figure S1. Thermodynamic profiles on 29 July 2025 at 1200 UTC from: (a) sounding launched from Lisbon (Available online at: https://weather.uwyo.edu/upperair/sounding.shtml, accessed on 11 February 2025), and (b) simulated by the Meso-NH model at 2500 m resolution. The solid red and green lines represent temperature and dew point temperature, respectively. The dashed purple line represents the profile path. CAPE and CIN areas are shaded in red and blue, respectively; Figure S2. Pseudocolor images from the Sentinel-2 satellite on: (a) 17 June 2025 and (b) 1 August 2025. Before and after the wildfire event occurred on 29 July 2025. The burn scars are observed in reddish tones two days after the event (b); Figure S3. (a) Normalized Difference Vegetation Index of burn scars corresponding to 1 August 2025 in northern Portugal, and (b) Normalized Burned Ratio of burn scars corresponding to 1 August 2025 in northern Portugal; Figure S4. Thresholded image from the Normalized Difference Vegetation Index (left panel), and thresholded image from the Normalized Burned Ratio (right panel); Figure S5. Classified burn severity image, showing areas from moderate to high severity; Figure S6. Satellite imagery from the METEOSAT-12 water vapor channel (6.3 μm, °C) at (a) 0600 UTC, (b) 1200 UTC, and (c) 1800 UTC of June 28 and (d) 0000 UTC, (e) 0600 UTC, and (f) 1200 UTC of June 29. Yellow arrows represent the transport of dry air; light blue arrows represent the transport of moist air; purple (orange) dashed lines represent the limits between the polar (subtropical) and subtropical (polar) air masses; red (blue, purple) lines represent warm (cold, occluded) fronts. L and BW are used to point out the regions near the centers of a low-pressure system and a baroclinic wave, respectively, while AWB is used to point out the region near an anticyclonic Rossby wave break; Figure S7. MRV (mixing ratio of water vapor) vertical profile from the 500 m simulation, on 29 July 2025 at 0600 UTC; Figure S8. Vertical cross-sections of vertical velocity (m·s−1, shaded areas) for AA’, at 0600 UTC (top), BB’, at 0600 UTC (middle), and GG’, at 0900 UTC (bottom). Vertical cross-sections are indicated in Figure 1b; Figure S9. Vertical cross-sections of potential temperature (Kelvin, shaded areas) for (a) CC’, at 0900 UTC; (b) DD’, at 0600 UTC; (c) EE’, at 0600 UTC; and (d) FF’, at 0900 UTC. Vertical cross-sections are indicated in Figure 1b; Figure S10. Difference between the wind gusts (m·s−1) at 10 m in the numerical experiments at 500 m horizontal resolution, i.e., EXP1 minus EXP2, on 29 July 2025.
Author Contributions
Conceptualization, F.T.C. and C.C.; methodology, F.T.C., C.C., F.J.B.d.l.P., N.V.R., N.A., F.L.M.S. and P.V.d.A.M.; software, F.T.C., R.S. and N.V.R.; validation, P.V.d.A.M.; formal analysis, F.T.C., C.C., F.L.M.S., R.S., F.J.B.d.l.P., P.V.d.A.M., H.N.A., K.F.d.S.B., N.V.R. and A.B.N.; investigation, F.T.C., C.C., N.V.R., N.A. and P.V.d.A.M.; resources, F.T.C. and R.S.; data curation, F.T.C., C.C., F.J.B.d.l.P., N.V.R. and F.L.M.S.; writing—original draft preparation, F.T.C.; writing—review and editing, C.C., F.L.M.S., R.S., F.J.B.d.l.P., P.V.d.A.M., H.N.A., K.F.d.S.B., N.A., N.V.R. and A.B.N.; visualization, F.T.C., C.C., F.J.B.d.l.P., N.V.R., F.L.M.S. and P.V.d.A.M.; supervision and project administration, R.S.; funding acquisition, F.T.C., C.C., N.A., F.L.M.S. and R.S. All authors have read and agreed to the published version of the manuscript.
Funding
This research was funded by the European Union through the European Regional Development Fund within the framework of the Interreg V-A Spain–Portugal program (POCTEP) under the FIREPOCTEP+ (0139_FIREPOCTEP_MAS_6_E) project, and co-funded by the European Union through the Interreg Sudoe program under the EUBURN-RISK project. The work is also funded by national funds through FCT—Fundação para a Ciência e Tecnologia, I.P., within the framework of the UIDB/06107—Centro de Investigação em Ciência e Tecnologia para o Sistema Terra e Energia and CIDEHUS (CIDEHUS/UIDB/00057/2020). F.L.M.S was supported by FCT under project reference 2022.11960.BD and DOI identifier https://doi.org/10.54499/2022.11960.BD. N.A. was supported by FCT under project reference 2025.05550.BD. C.A. was supported by FCT under project reference 2025.05886.BD.
Institutional Review Board Statement
Not applicable.
Informed Consent Statement
Not applicable.
Data Availability Statement
ECMWF—MARS User Documentation, available online: https://confluence.ecmwf.int/display/UDOC/MARS+user+documentation (accessed on 1 October 2025); MTG-FCI data, available online: https://user.eumetsat.int/catalogue/EO:EUM:DAT:0665 (accessed on 17 December 2025); FIRMS, available online: https://firms.modaps.eosdis.nasa.gov/map/#d:24hrs;@0.0,0.0,3.0z (accessed on 17 December 2025); Sentinel-2, European Space Agency. Sentinel-2 Image, Bahía Blanca, Buenos Aires, Argentina. Copernicus Open Access Hub. 2025. Available online: https://browser.dataspace.copernicus.eu/ (accessed on 18 December 2025).
Acknowledgments
We acknowledge the use of imagery from the NASA LANCE FIRMS (https://earthdata.nasa.gov/firms, accessed on 18 February 2026), part of the NASA Earth Science Data and Information System (ESDIS).
Conflicts of Interest
The authors declare no conflicts of interest.
References
- Pinto, P.; Silva, Á.P.; Viegas, D.X.; Almeida, M.; Raposo, J.; Ribeiro, L.M. Influence of Convectively Driven Flows in the Course of a Large Fire in Portugal: The Case of Pedrógão Grande. Atmosphere 2022, 13, 414. [Google Scholar] [CrossRef]
- Couto, F.T.; Iakunin, M.; Salgado, R.; Pinto, P.; Viegas, T.; Pinty, J.-P. Lightning modelling for the research of forest fire ignition in Portugal. Atmos. Res. 2020, 242, 104993. [Google Scholar] [CrossRef]
- Couto, F.T.; Santos, F.L.M.; Campos, C.; Andrade, N.; Purificação, C.; Salgado, R. Is Portugal Starting to Burn All Year Long? The Transboundary Fire in January 2022. Atmosphere 2022, 13, 1677. [Google Scholar] [CrossRef]
- Couto, F.T.; Salgado, R.; Guiomar, N. Forest Fires in Madeira Island and the Fire Weather Created by Orographic Effects. Atmosphere 2021, 12, 827. [Google Scholar] [CrossRef]
- Purificação, C.; Andrade, N.; Potes, M.; Salgueiro, V.; Couto, F.T.; Salgado, R. Modelling the Atmospheric Environment Associated with a Wind-Driven Fire Event in Portugal. Atmosphere 2022, 13, 1124. [Google Scholar] [CrossRef]
- Couto, F.T.; Campos, C.; Purificação, C.; Santos, F.L.M.; Andrade, H.N.; Andrade, N.; Nunes, A.B.; Guiomar, N.; Salgado, R. Synoptic and Regional Meteorological Drivers of a Wildfire in the Wildland–Urban Interface of Faro (Portugal). Fire 2025, 8, 362. [Google Scholar] [CrossRef]
- Campos, C.; Couto, F.T.; Filippi, J.-B.; Baggio, R.; Salgado, R. Modelling pyro-convection phenomenon during a mega-fire event in Portugal. Atmos. Res. 2023, 290, 106776. [Google Scholar] [CrossRef]
- Vaz, R.; Silva, R.; Pereira, S.C.; Carvalho, A.C.; Carvalho, D.; Rocha, A. Formation of Pyrocumulus During a Megafire Event in Portugal Using the Coupled Atmosphere-Fire Spread Model WRF-SFIRE. Meteorol. Geophys. 2023, 66, 66–76. [Google Scholar] [CrossRef]
- Lean, H.W.; Theeuwes, N.E.; Baldauf, M.; Barkmeijer, J.; Bessardon, G.; Blunn, L.; Bojarova, J.; Boutle, I.A.; Clark, P.A.; Demuzere, M.; et al. The hectometric modelling challenge: Gaps in the current state of the art and ways forward towards the implementation of 100-m scale weather and climate models. Q. J. R. Meteorol. Soc. 2024, 150, 4671–4708. [Google Scholar] [CrossRef]
- Kartsios, S.; Karacostas, T.; Pytharoulis, I.; Dimitrakopoulos, A.P. Numerical investigation of atmosphere-fire interactions during high-impact wildland fire events in Greece. Atmos. Res. 2020, 247, 105253. [Google Scholar] [CrossRef]
- Tomašević, I.C.; Cheung, K.K.W.; Vučetić, V.; Fox-Hughes, P.; Horvath, K.; Telišman Prtenjak, M.; Beggs, P.J.; Malečić, B.; Milić, V. The 2017 Split wildfire in Croatia: Evolution and the role of meteorological conditions. Nat. Hazards Earth Syst. Sci. 2022, 22, 3143–3165. [Google Scholar] [CrossRef]
- Wiles, J.T.; Lin, Y.L.; Kaplan, M.L. Multi-scale numerical simulations of the synoptic environment, Diablo windstorm, and wildfire formation mechanisms for the Tubbs Fire (2017). Meteorol. Atmos. Phys. 2024, 136, 5. [Google Scholar] [CrossRef]
- Sharples, J.J.; Mills, G.A.; McRae, R.H.D.; Weber, R.O. Foehn-Like Winds and Elevated Fire Danger Conditions in Southeastern Australia. J. Appl. Meteorol. Climatol. 2010, 49, 1067–1095. [Google Scholar] [CrossRef]
- Couto, F.T.; Santos, F.L.M.; Campos, C.; Purificação, C.; Andrade, N.; López-Vega, J.M.; Lacroix, M. A Case Study of the Possible Meteorological Causes of Unexpected Fire Behavior in the Pantanal Wetland, Brazil. Earth 2024, 5, 548–563. [Google Scholar] [CrossRef]
- Mass, C.F.; Ovens, D. The Synoptic and Mesoscale Evolution Accompanying the 2018 Camp Fire of Northern California. Bull. Am. Meteorol. Soc. 2021, 102, E168–E192. [Google Scholar] [CrossRef]
- Russell, E.N.; Loikith, P.C.; Ajibade, I.; Done, J.M.; Lower, C. The Meteorology and Impacts of the September 2020 Western United States Extreme Weather Event. Weather Clim. Extrem. 2024, 43, 100647. [Google Scholar] [CrossRef]
- Peace, M.; Ye, H.; Greenslade, J.; Kepert, J.D. The Destructive Sir Ivan Fire in New South Wales, Australia; Simulations Using a Coupled Fire—Atmosphere Model. Fire 2023, 6, 438. [Google Scholar] [CrossRef]
- Lareau, N.P.; Nauslar, N.J.; Abatzoglou, J.T. The Carr fire vortex: A case of pyrotornadogenesis? Geophys. Res. Lett. 2018, 45, 13107–13115. [Google Scholar] [CrossRef]
- Sharples, J.J.; Hilton, J.E. Modeling vorticity-driven wildfire behavior using near-field techniques. Front. Mech. Eng. 2020, 5, 69. [Google Scholar] [CrossRef]
- Lareau, N.P.; Nauslar, N.J.; Bentley, E.; Roberts, M.; Emmerson, S.; Brong, B.; Mehle, M.; Wallman, J. Fire-Generated Tornadic Vortices. Bull. Am. Meteorol. Soc. 2022, 103, E1296–E1320. [Google Scholar] [CrossRef]
- Lareau, N.P.; Clements, C.B.; Kochanski, A.; Aydell, T.; Hudak, A.T.; McCarley, T.R.; Ottmar, R. Observations of a rotating pyroconvective plume. Int. J. Wildland Fire 2024, 33, WF23045. [Google Scholar] [CrossRef]
- Cardoso, E.; Viegas, D.X.; Lopes, A.G. A Systematic Review of Models for Fire Spread in Wildfires by Spotting. Fire 2025, 8, 392. [Google Scholar] [CrossRef]
- Athanasiou, M.; Xanthopoulos, G. Observations on wildfire spotting occurrence and characteristics in Greece. In Advances in Forest Fire Research 2018; Chapter 3—Fire Management; Viegas, D.X., Ed.; Coimbra University Press: Coimbra, Portugal, 2018; pp. 588–597. [Google Scholar] [CrossRef]
- Eriksson, C.P.; Johansson, N.; McNamee, M. The performance of wildfire danger indices: A Swedish case study. Saf. Sci. 2023, 159, 106038. [Google Scholar] [CrossRef]
- Sierra-Hernández, M.R.; Beaudon, E.; Porter, S.E.; Mosley-Thompson, E.; Thompson, L.G. Increased fire activity in Alaska since the 1980s: Evidence from an ice core-derived black carbon record. J. Geophys. Res. Atmos. 2022, 127, e2021JD035668. [Google Scholar] [CrossRef]
- Gaw, E.; Jaisawal, N.; Folorunsho, A.; Lindsey, S.; Lu, T.; Liu, Y.; Wang, M.; Li, Y. Changes in wildfire season in Alaska and the consequences for ambient fine PM in recent decades. Glob. Planet. Change 2025, 255, 105076. [Google Scholar] [CrossRef]
- Hayasaka, H. Recent Active Wildland Fires Related to Rossby Wave Breaking (RWB) in Alaska. Remote Sens. 2025, 17, 2719. [Google Scholar] [CrossRef]
- Chang, D.Y.; Jeong, S.; Park, C.-E.; Park, H.; Shin, J.; Bae, Y.; Park, H.; Park, C.R. Unprecedented Wildfires in Korea: Historical Evidence of Increasing Wildfire Activity Due to Climate Change. Agric. For. Meteorol. 2024, 348, 109920. [Google Scholar] [CrossRef]
- Wu, M.; Zhang, C.; Li, M.; Du, W.; Chen, J.; Zhao, C. Self-Organizing Map-Based Classification for Fire Weather Index in the Beijing–Tianjin–Hebei Region and Their Potential Causes. Atmosphere 2025, 16, 403. [Google Scholar] [CrossRef]
- Bai, M.; Zhang, P.; Xing, P.; Du, W.; Hao, Z.; Zhang, H.; Shi, Y.; Liu, L. Spatiotemporal Characteristics, Causes, and Prediction of Wildfires in North China: A Study Using Satellite, Reanalysis, and Climate Model Datasets. Remote Sens. 2025, 17, 1038. [Google Scholar] [CrossRef]
- Coen, J. Some Requirements for Simulating Wildland Fire Behavior Using Insight from Coupled Weather—Wildland Fire Models. Fire 2018, 1, 6. [Google Scholar] [CrossRef]
- Bakhshaii, A.; Johnson, E. A review of a new generation of wildfire−atmosphere modeling. Can. J. For. Res. 2019, 49, 565–574. [Google Scholar] [CrossRef]
- Bugalho, L. Temporal variability of the Haines index and its relationship with forest fire in Portugal. In Advances in Forest Fire Research; Chapter 1—Fire Danger Management; Coimbra University Press: Coimbra, Portugal, 2018; pp. 127–137. [Google Scholar] [CrossRef]
- Andrade, C.; Bugalho, L. Multi-Indices Diagnosis of the Conditions That Led to the Two 2017 Major Wildfires in Portugal. Fire 2023, 6, 56. [Google Scholar] [CrossRef]
- Andrade, C.; Bugalho, L. Fire Danger Climatology Using the Hot–Dry–Windy Index: Case Studies from Portugal. Forests 2025, 16, 1417. [Google Scholar] [CrossRef]
- Silva, D.; Ferreira, T.M.; Rodrigues, H. Wildland-Urban Interface fire exposure of rural settlements: The case of Montesinho Natural Park. Int. J. Disaster Risk Reduct. 2024, 112, 104790. [Google Scholar] [CrossRef]
- Russo, A.; Gouveia, C.M.; Páscoa, P.; DaCamara, C.C.; Sousa, P.M.; Trigo, R.M. Assessing the Role of Drought Events on Wildfires in the Iberian Peninsula. Agric. For. Meteorol. 2017, 237–238, 50–59. [Google Scholar] [CrossRef]
- Silva, P.; Carmo, M.; Rio, J.; Novo, I. Changes in the Seasonality of Fire Activity and Fire Weather in Portugal: Is the Wildfire Season Really Longer? Meteorology 2023, 2, 74–86. [Google Scholar] [CrossRef]
- Sistema de Gestão Integrada de Fogos Rurais. Incêndios 2025—Análise Preliminar—1 January to 31 October. 2025. Available online: https://www.sgifr.gov.pt/documents/196633/0/54699d1c_Analise_incendios_01jan_31out_2025.pdf/16efe319-d387-48c7-26ab-9ebda009793e?t=1764849737675 (accessed on 29 December 2025).
- Carmo, M.; Ferreira, J.; Mendes, M.; Silva, A.; Silva, P.; Alves, D.; Reis, L.; Novo, I.; Xavier Viegas, D. The climatology of extreme wildfires in Portugal, 1980–2018: Contributions to forecasting and preparedness. Int. J. Climatol. 2022, 42, 3123–3146. [Google Scholar] [CrossRef]
- Novo, I.; Ferreira, J.; Silva, P.; Ponte, J.; Moreira, N.; Ramos, R.; Rio, J.; Cardoso, E. Large Fires in Portugal and Synoptic Circulation Patterns: Meteorological parameters and fire danger indices associated to Critical Weather Types. In Advances in Forest Fire Research; Coimbra University Press: Coimbra, Portugal, 2022; Available online: http://books.uc.pt/chapter?chapter=9789892622989180 (accessed on 29 December 2025).
- Câmara Municipal de Arouca. Critical Wildfire Period—Information and Measures. Available online: https://www.cm-arouca.pt/municipio/areas-de-atuacao/floresta/periodo-critico-de-incendios/ (accessed on 9 December 2025).
- Instituto Português do Mar e da Atmosfera. Climatic Data and Forecasts. 2024. Available online: https://www.ipma.pt/ (accessed on 9 December 2025).
- Instituto Nacional de Estatística. Census 2021: Provisional Results. 2021. Available online: https://www.ine.pt/xportal/xmain?xpid=INE&xpgid=ine_destaques&DESTAQUESdest_boui=526271534&DESTAQUESmodo=2 (accessed on 9 December 2025).
- Arouca Geopark. Arouca Geopark. Available online: https://aroucageopark.pt/ (accessed on 9 December 2025).
- UNESCO. Arouca UNESCO Global Geopark. Available online: https://www.unesco.org/en/iggp/geoparks/about?hub=67817 (accessed on 9 December 2025).
- ECMWF—MARS User Documentation. Available online: https://confluence.ecmwf.int/display/UDOC/MARS+user+documentation (accessed on 1 October 2025).
- Lac, C.; Chaboureau, J.-P.; Masson, V.; Pinty, J.-P.; Tulet, P.; Escobar, J.; Leriche, M.; Barthe, C.; Aouizerats, B.; Augros, C.; et al. Overview of the Meso-NH model version 5.4 and its applications. Geosci. Model Dev. 2018, 11, 1929–1969. [Google Scholar] [CrossRef]
- Couto, F.T.; Ducrocq, V.; Salgado, R.; Costa, M.J. Understanding significant precipitation in Madeira island using high-resolution numerical simulations of real cases. Q. J. R. Meteorol. Soc. 2017, 143, 251–264. [Google Scholar] [CrossRef]
- Couto, F.T.; Cardoso, E.H.C.; Costa, M.J.; Salgado, R.; Guerrero-Rascado, J.L.; Salgueiro, V. How a mesoscale cyclonic vortex over Sahara leads to a dust outbreak in South-western Iberia. Atmos. Res. 2021, 249, 105302. [Google Scholar] [CrossRef]
- Pereira, S.; Abreu, E.F.M.; Iakunin, M.; Cavaco, A.; Salgado, R.; Canhoto, P. Method for solar resource assessment using numerical weather prediction and artificial neural network models based on typical meteorological data: Application to the south of Portugal. Sol. Energy 2022, 236, 225–238. [Google Scholar] [CrossRef]
- Iakunin, M.; Salgado, R.; Potes, M. Breeze effects at a large artificial lake: Summer case study. Hydrol. Earth Syst. Sci. 2018, 22, 5191–5210. [Google Scholar] [CrossRef]
- Pergaud, J.; Masson, V.; Malardel, S.; Couvreux, F. A Parameterization of Dry Thermals and Shallow Cumuli for Mesoscale Numerical Weather Prediction. Bound. Layer Meteorol. 2009, 132, 83–106. [Google Scholar] [CrossRef]
- Cuxart, J.; Bougeault, P.; Redelsperger, J.L. A turbulence scheme allowing for mesoscale and large-eddy simulations. Q. J. R. Meteorol. Soc. 2000, 126, 1–30. [Google Scholar] [CrossRef]
- Bougeault, P.; Lacarrere, P. Parameterization of Orography-Induced Turbulence in a Mesobeta–Scale Model. Mon. Weather Rev. 1989, 117, 1872–1890. [Google Scholar] [CrossRef]
- Pinty, J.-P.; Jabouille, P. A mixed-phase cloud parameterization for use in mesoscale non-hydrostatic model: Simulations of a squall line and of orographic precipitations. In Proceedings of the Conference on Cloud Physics, Everett, WA, USA, 17–21 August 1998; American Meteorological Society: Boston, MA, USA, 1999; pp. 217–220. [Google Scholar]
- Mlawer, E.J.; Taubman, S.J.; Brown, P.D.; Iacono, M.J.; Clough, S.A. Radiative transfer for inhomogeneous atmospheres: RRTM, a validated correlated-k model for the longwave. J. Geophys. Res. 1997, 102, 16663–16682. [Google Scholar] [CrossRef]
- Masson, V.; Le Moigne, P.; Martin, E.; Faroux, S.; Alias, A.; Alkama, R.; Belamari, S.; Barbu, A.; Boone, A.; Bouyssel, F.; et al. The SURFEXv7.2 land and ocean surface platform for coupled or offline simulation of earth surface variables and fluxes. Geosci. Model Dev. 2013, 6, 929–960. [Google Scholar] [CrossRef]
- Bommasani, R.; Hudson, D.A.; Adeli, E.; Altman, R.; Arora, S.; von Arx, S.; Bernstein, M.S.; Bohg, J.; Bosselut, A.; Brunskill, E.; et al. On the Opportunities and Risks of Foundation Models. arXiv 2021, arXiv:2108.07258. [Google Scholar] [CrossRef]
- Jiao, L.; Huang, Z.; Lu, X.; Liu, X.; Yang, Y.; Zhao, J.; Zhang, J.; Hou, B.; Yang, S.; Liu, F.; et al. Brain-Inspired Remote Sensing Foundation Models and Open Problems: A Comprehensive Survey. IEEE J. Sel. Top. Appl. Earth Obs. Remote Sens. 2023, 16, 10084–10120. [Google Scholar] [CrossRef]
- Ozdemir, S.; Akbulut, Z.; Karsli, F.; Kavzoglu, T. Extraction of Water Bodies from High-Resolution Aerial and Satellite Images Using Visual Foundation Models. Sustainability 2024, 16, 2995. [Google Scholar] [CrossRef]
- Lu, S.; Guo, J.; Zimmer-Dauphinee, J.R.; Nieusma, J.M.; Wang, X.; van Valkenburgh, P.; Wernke, S.A.; Huo, Y. Vision Foundation Models in Remote Sensing: A Survey. IEEE Geosci. Remote Sens. Mag. 2025, 13, 190–215. [Google Scholar] [CrossRef]
- Sentinel-2, European Space Agency. Sentinel-2 Image, Bahía Blanca, Buenos Aires, Argentina. Copernicus Open Access Hub. 2025. Available online: https://browser.dataspace.copernicus.eu/ (accessed on 18 December 2025).
- Kirillov, A.; Mintun, E.; Ravi, N.; Mao, H.; Rolland, C.; Gustafson, L.; Xiao, T.; Whitehead, S.; Berg, A.C.; Lo, W.-Y.; et al. Segment Anything. In Proceedings of the IEEE/CVF International Conference on Computer Vision (ICCV), Paris, France, 2–6 October 2023; pp. 4015–4026. [Google Scholar]
- Prado Osco, L.; Wu, Q.; Lopes de Lemos, E.; Nunes Gonçalves, W.; Marques Ramos, A.P.; Li, J.; Marcato Junior, J. The Segment Anything Model (SAM) for Remote Sensing Applications: From Zero to One Shot. arXiv 2023, arXiv:2306.16623. [Google Scholar] [CrossRef]
- Lee, H.; Kim, K.; Lee, K. Application of Geo-Segment Anything Model (SAM) Scheme to Water Body Segmentation: An Experimental Study Using CAS500-1 Images. Korean J. Remote Sens. 2024, 40, 343–350. [Google Scholar]
- GitHub Repository. Rasterio: Geospatial Raster I/O for Python Programmers. GitHub Repository, 2013. Available online: https://github.com/rasterio/rasterio (accessed on 17 December 2025).
- Wu, Q. Leafmap: A Python Package for Interactive Mapping and Geospatial Analysis with Minimal Coding in a Jupyter Environment. J. Open Source Softw. 2021, 6, 3414. [Google Scholar] [CrossRef]
- GitHub Repository. ipywidgets: Interactive HTML Widgets. GitHub Repository, 2021. Available online: https://github.com/jupyter-widgets/ipywidgets (accessed on 17 December 2025).
- Jordahl, K.; Van den Bossche, J.; Fleischmann, M.; McBride, J.; Wasserman, J.; Gerard, J. Geopandas/Geopandas: V0.9.0. Zenodo. 2021. Available online: https://zenodo.org/records/4569086 (accessed on 17 December 2025).
- Eidenshink, J.C. The 1990 Conterminous U. S. AVHRR Data Set. Photogramm. Eng. Remote Sens. 1992, 58, 809–881. [Google Scholar]
- Marsh, S.E.; Walsh, J.L.; Lee, C.T.; Beck, L.; Hutchinson, C.F. Comparison of Multi Temporal NOAA-AVHRR and SPOT-XS Data for Mapping Land Cover Dynamics in the West African Sahel. Int. J. Remote Sens. 1992, 13, 2997–3016. [Google Scholar] [CrossRef]
- Lyon, J.G.; Yuan, D.; Lunetta, R.; Elvidge, C. A Change Detection Experiment Using Vegetation Indices. Photogramm. Eng. Remote Sens. 1998, 64, 143–150. [Google Scholar]
- García, M.L.; Caselles, V. Mapping Burns and Natural Reforestation Using Thematic Mapper Data. Geocarto Int. 1991, 6, 31–37. [Google Scholar] [CrossRef]
- Key, C.H.; Benson, N.C. Landscape Assessment: Remote Sensing of Severity, the Normalized Burn Ratio and Ground Measure of Severity, the Composite Burn Index. In FIREMON: Fire Effects Monitoring and Inventory System; USDA Forest Service, Rocky Mountain Research Station: Ogden, UT, USA, 2005; p. 108. [Google Scholar]
- Escuin, S.; Navarro, R.; Fernández, P. Fire Severity Assessment by Using NBR (Normalized Burn Ratio) and NDVI (Normalized Difference Vegetation Index) Derived from LANDSAT TM/ETM Images. Int. J. Remote Sens. 2008, 29, 1053–1073. [Google Scholar] [CrossRef]
- Keeley, J.E. Fire Intensity, Fire Severity and Burn Severity: A Brief Review and Suggested Usage. Int. J. Wildland Fire 2009, 18, 116–126. [Google Scholar] [CrossRef]
- United States Geological Survey (USGS). Normalized Burn Ratio (NBR) and dNBR Severity Classification. Available online: https://un-spider.org/advisory-support/recommended-practices/recommended-practice-burn-severity/in-detail/normalized-burn-ratio (accessed on 18 December 2025).
- MTG-FCI Data. Available online: https://user.eumetsat.int/catalogue/EO:EUM:DAT:0665 (accessed on 17 December 2025).
- FIRMS. Available online: https://firms.modaps.eosdis.nasa.gov/map/#d:24hrs;@0.0,0.0,3.0z (accessed on 17 December 2025).
- Schroeder, W.; Oliva, P.; Giglio, L.; Csiszar, I.A. The New VIIRS 375 m active fire detection data product: Algorithm description and initial assessment. Remote Sens. Environ. 2014, 143, 85–96. [Google Scholar] [CrossRef]
- Brodsky, T.T.; Harnik, N. The relation between Rossby wave-breaking events and low-level weather systems. Weather Clim. Dyn. 2024, 5, 87–108. [Google Scholar] [CrossRef]
- Ward, N.; Fink, A.H.; Keane, R.J.; Parker, D.J. Upper-level midlatitude troughs in boreal winter have an amplified low-latitude linkage over Africa. Atmos. Sci. Lett. 2023, 24, e1129. [Google Scholar] [CrossRef]
- Campos, C.; Couto, F.T.; Santos, F.L.M.; Rio, J.; Ferreira, T.; Salgado, R. ECMWF Lightning Forecast in Mainland Portugal during Four Fire Seasons. Atmosphere 2024, 15, 156. [Google Scholar] [CrossRef]
- Raphael, M.N. The Santa Ana Winds of California. Earth Interact. 2003, 7, 1–13. [Google Scholar] [CrossRef]
- Rolinski, T.; Capps, S.B.; Zhuang, W. Santa Ana Winds: A Descriptive Climatology. Weather Forecast. 2019, 34, 257–275. [Google Scholar] [CrossRef]
- Montecinos, A.; Muñoz, R.C.; Oviedo, S.; Martínez, A.; Villagrán, V. Climatological Characterization of Puelche Winds down the Western Slope of the Extratropical Andes Mountains Using the NCEP Climate Forecast System Reanalysis. J. Appl. Meteorol. Climatol. 2017, 56, 677–696. [Google Scholar] [CrossRef]
- Carrasco-Escaff, T.; Garreaud, R.; Bozkurt, D.; Jacques-Coper, M.; Pauchard, A. The key role of extreme weather and climate change in the occurrence of exceptional fire seasons in south-central Chile. Weather Clim. Extrem. 2024, 45, 100716. [Google Scholar] [CrossRef]
- da Silva Nascimento, A.L.; da Silva Teixeira, M.; Alonso, M.F.; Nunes, A.B.; Laureanti, N.C.; Javarini, L.P. Synoptic patterns associated with the occurrence of fire foci in the Ecological Station Taim and Campos Neutrais—Brazil. Rev. Bras. Climatol. 2023, 32, 463–493. [Google Scholar] [CrossRef]
- Juliano, T.W.; Szasdi-Bardales, F.; Lareau, N.P.; Shamsaei, K.; Kosović, B.; Elhami-Khorasani, N.; James, E.P.; Ebrahimian, H. Brief communication: The Lahaina Fire disaster—How models can be used to understand and predict wildfires. Nat. Hazards Earth Syst. Sci. 2024, 24, 47–52. [Google Scholar] [CrossRef]
- Martín-Raya, N.; López-Díez, A.; Lillo Ezquerra, Á. Characterisation and Analysis of Large Forest Fires (LFFs) in the Canary Islands, 2012–2024. Fire 2026, 9, 7. [Google Scholar] [CrossRef]
- Bezerra, K.F.d.S.; Couto, F.T.; Gomes, H.B.; Nascimento, J.; Mendes, P.V.d.A.; Herdies, D.L.; Baltaci, H.; Silva, M.C.L.d.; Lins, M.C.C.; Bresciani, C.; et al. Wildfires in the Southern Amazon: Insights into Pyro-Convective Cloud Development from Two Case Studies in August 2021. Atmosphere 2026, 17, 173. [Google Scholar] [CrossRef]
- Tory, K.J.; Thurston, W.; Kepert, J.D. Thermodynamics of Pyrocumulus: A Conceptual Study. Mon. Weather Rev. 2018, 146, 2579–2598. [Google Scholar] [CrossRef]


Disclaimer/Publisher’s Note: The statements, opinions and data contained in all publications are solely those of the individual author(s) and contributor(s) and not of MDPI and/or the editor(s). MDPI and/or the editor(s) disclaim responsibility for any injury to people or property resulting from any ideas, methods, instructions or products referred to in the content. |
© 2026 by the authors. Licensee MDPI, Basel, Switzerland. This article is an open access article distributed under the terms and conditions of the Creative Commons Attribution (CC BY) license.