Abstract
Sealing tunnel portals is widely recognized as a pivotal strategy for mitigating fire hazards in tunnel safety management. Nevertheless, the interplay between fire source locations—both longitudinally and transversely—and its impact on flame behavior and ceiling temperature profiles within enclosed structures has not been fully elucidated. Utilizing a 1:15 reduced-scale rectangular tunnel model, this research investigates how varying the fire source position affects the maximum ceiling temperature under enclosed scenarios. Dimensionless parameters, including the longitudinal dimensionless distance D and transverse dimensionless distance Z′, were derived through dimensional analysis. Observations indicate that as the fire approaches the enclosed end, the flame initially leans toward the boundary, peaking in inclination at D = 0.73, and subsequently exhibits a “wall-attached combustion” pattern due to wall confinement. While lateral displacement of the fire source pushes the high-temperature zone toward the corresponding side wall, the longitudinal temperature rise follows a non-monotonic pattern: declining continuously in in Region I (0 ≤ D ≤ 0.73) and rebounding in Region II (0.73 < D < 1). Based on these findings, a dimensionless prediction model incorporating heat release rate (HRR), transverse offset, and longitudinal fire location was developed. Furthermore, a thermal accumulation factor was introduced to refine the predictive model in Region II. The results offer theoretical insights to support fire protection design and risk assessment in enclosed tunnels.
1. Introduction
The construction of highway tunnels is crucial for alleviating traffic congestion, overcoming topographical barriers, and enhancing transportation efficiency [1]. However, their enclosed and elongated nature also poses elevated fire hazards. When a tunnel fire occurs, the smoke generated significantly reduces visibility, hindering personnel evacuation, while the presence of harmful gases can lead to substantial casualties [2,3]. Statistics indicate that most fatalities in tunnel fires are attributed to toxic smoke inhalation [4]. Furthermore, high-temperature smoke rises and impinges on the tunnel ceiling, causing a rapid temperature increase. This weakens the concrete structure and exposes reinforcement bars to extreme heat, potentially resulting in structural damage and partial collapse [5]. Therefore, precisely determining the temperature profile along the tunnel ceiling is essential for assessing thermal risks in tunnels.
Previously, scholars have undertaken extensive research efforts on temperature fields beneath tunnel ceilings during fires using experiments at various scales [6,7,8]. A fundamental model for estimating the maximum ceiling jet temperature rise in open environments was introduced in the early research of Alpert [9], which has informed subsequent studies.
Here, stands for the maximum temperature rise, while Q and Hef correspond to the HRR and effective tunnel height, respectively.
Subsequently, focusing on tunnels as confined spaces, Kurioka et al. [10] performed scaled experiments across different cross-sections to derive a model for the maximum longitudinal ceiling temperature rise, which depends on the dimensionless heat release rate and Froude number. However, this approach is not valid for scenarios with weak or zero longitudinal airflow. Li et al. [11] later analyzed rectangular and circular tunnel profiles. Through these comparisons, they presented a predictive equation for ceiling temperature rise in common tunnel configurations subject to ventilation:
where r denotes the fire source radius and V represents the longitudinal ventilation speed.
Beyond ventilation conditions, factors including fire source location and blockage ratio have also been identified as critical parameters affecting ceiling temperature distribution in tunnels [12,13,14]. Lee [15] examined the impact of vehicle obstruction on the thermal behavior of longitudinally ventilated tunnels, concluding that tunnel fires are mainly influenced by alterations in local ventilation velocity induced by the blockage, which subsequently affects flame spread behavior. Separately, Fan et al. [16] and Ji et al. [17] investigated the impact of lateral fire source displacement, demonstrating that such offsets cause a corresponding displacement of the high-temperature region beneath the ceiling.
Most of the aforementioned studies, however, have concentrated on open or longitudinally ventilated tunnels, with research on enclosed tunnels remaining comparatively limited. With the rapid expansion of urban subsurface transit systems in recent years, there are numerous enclosed or semi-enclosed sections (such as dead-end garages and tunnels under construction). Understanding the thermal distribution in these areas is crucial for the fire resistance design of enclosure structures. Moreover, as a critical measure in tunnel fire safety, portal enclosure fundamentally alters smoke backflow paths and the driving mechanism of thermal pressure compared to ventilated tunnels, rendering conventional predictive models based on ventilation conditions inapplicable. Consequently, a comprehensive investigation into the thermal hazards within enclosed tunnels is essential. Li et al. [18] conducted a reduced-scale experiment on a single-end enclosed subway tunnel, finding a symmetrical transverse ceiling temperature distribution and noting that longitudinal temperature increased with higher heat release rates (HRRs). Using a numerical approach, Gao et al. [19] explored the correlation between longitudinal fire positioning and the maximum temperature rise beneath the ceiling of an enclosed utility tunnel, establishing a corresponding predictive formula. Through 1:8 scaled experiments on a single-end enclosed tunnel, Zhao et al. [20] investigated the impact of fire positioning and HRR on thermal profiles, demonstrating that the dimensionless peak ceiling temperature scales with the 2/3 power of the dimensionless HRR. Next, they developed a longitudinal temperature prediction model incorporating both variables. Utilizing 1:15 scale experiments, Yao et al. [21,22] determined that the maximum temperature rise is proportional to the dimensionless fire size raised to the power of 3/4.
Despite these contributions, significant knowledge gaps persist. The impact of longitudinal fire positioning on ceiling temperature rise in enclosed tunnels has been the primary focus of prior investigations, largely overlooking the practically common scenario of transverse fire offsets due to vehicle positioning in multi-lane tunnels. In enclosed environments, the coupled effect of transverse and longitudinal fire source positions can significantly modify air entrainment and thermal feedback processes, thereby altering the attenuation pattern of the maximum ceiling temperature rise.
To address this gap, a series of experiments were performed in a 1:15 scale rectangular tunnel model, aiming to systematically analyze the coupled impact of transverse and longitudinal fire positions on ceiling temperature rise in enclosed tunnels. A key contribution is the introduction of a correction coefficient, λz′, to refine the maximum temperature prediction. Consequently, a comprehensive dimensionless model incorporating multiple influencing factors was developed. These findings offer a theoretical basis for tunnel safety design, providing engineers with critical insights for optimizing ventilation strategies, enhancing structural fire resistance, and planning effective evacuation routes.
2. Experimental Setups and Procedures
For measuring the correlation between full-size and reduced-scale model tests, the Froude similarity principle has gained broad acceptance and is commonly utilized by numerous investigators [23,24]. By employing the Froude similarity principle in Table 1, a 1:15 scale physical model was developed, enabling the streamlining of relationships to establish the required scaling relationships [25].

Table 1.
The correlation between full-size and reduced-scale model test variables.
As shown in Figure 1a, a 1:15 scale rectangular tunnel model was developed for conducting multiple experiments. With dimensions of 6.6 m (L) × 1.08 m (W) × 0.48 m (H), the structure was strengthened with stainless steel, featuring high-transparency fire-resistant glass on one side for observing experimental phenomena and fireproof panels on the opposite side. The bottom surface was covered with fire-resistant fiber boards. Both tunnel entrances were completely sealable using fireproof panels and flexible fire-resistant blankets to maintain the necessary airtightness in enclosed environments.
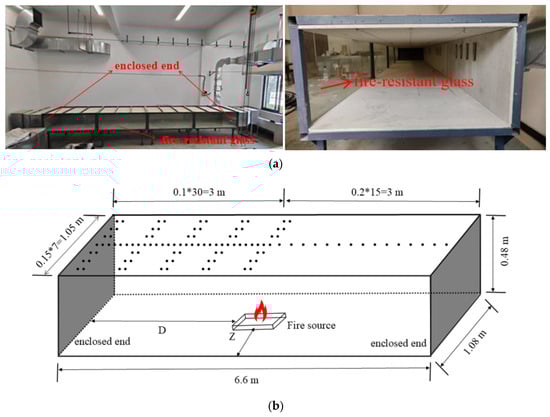
Figure 1.
Rectangular tunnel downsizing model. (a) Overall view and side view of the tunnel model. (b) Layout of thermocouples under a rectangular ceiling.
As shown in Figure 1b, beneath the tunnel ceiling, 108 K-type thermocouples with a 1 mm diameter were arranged to measure the thermal field near the fire source. These thermocouples are capable of measuring temperatures spanning from 0 to 1000 °C. Along the longitudinal centerline, 48 thermocouples were installed at fixed intervals from left to right. For longitudinal measurements, thermocouples were placed at 0.1 m intervals upstream and 0.2 m intervals downstream. Moreover, 60 horizontally aligned thermocouples were fixed to the ceiling, with a transverse separation of 0.15 m.
Propane was selected as the fuel for this experiment. It was stored in the cylinder in liquid form and regulated by a pressure-reducing valve to maintain a stable and safe supply. After pressure reduction, the propane entered a glass rotameter with a measuring range of 100–1000 L/h for precise flow control before being delivered to the burner, as shown in Figure 2. The burner, which measured 0.1 m (L) × 0.1 m (W) × 0.05 m (H), contained a sand layer to facilitate flame stabilization and uniform gas distribution. HRR values were derived from the fuel delivery rate and the effective heat of combustion. Relevant studies have shown that the peak HRRs of full-scale cars, minibuses, and trucks are usually in the range of 2.5–15 MW [26]. Therefore, in this study, four different HRRs were designed to correspond to different types of vehicle fires. Four fuel flow rates were chosen: 143.4, 238.8, 382.2, and 716.4 L/h, which corresponded to HRRs of 3.44, 5.74, 9.18, and 13.77 kW, respectively. Applying the Froude similarity principle, these scaled values corresponded to full-scale fire sources with power outputs of 3, 5, 8, and 12 MW.
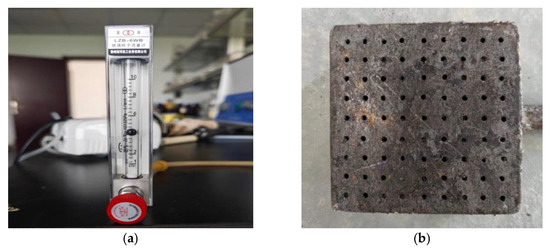
Figure 2.
The heat setting. (a) The glass rotameter and (b) the burner.
Three transverse positions (Z = 0, 0.2,0.4) were selected to simulate accident scenarios occurring in the tunnel center, driving lane center, and near the sidewall, respectively. Meanwhile, the longitudinal position selected five distances (d = 0, 0.8, 1.6, 2.4, and 3.2 m) from the enclosed end to the center of the tunnel to simulate the possible fire situation at different longitudinal positions. Table 2 lists the 60 experimental cases conducted in this study. All tests were performed under a controlled ambient temperature of 26 °C. Each test condition was repeated twice to ensure data reproducibility.
Table 2.
Summary of test conditions.
3. Results and Discussion
3.1. Influence of Fire Source Locations on the Maximum Ceiling Temperature
Figure 3 illustrates the time-dependent variation of smoke temperature for a fire size of 13.77 kW within the enclosed tunnel. As observed, after an initial growth period, the ceiling temperature eventually stabilized and then declined as combustion progressed. This trend is attributed to the gradual consumption of available oxygen, which reduces the actual heat release rate and ultimately leads to flame extinction. Therefore, the temperature data analyzed in this study correspond to the stable combustion phase, during which oxygen supply remained sufficient.
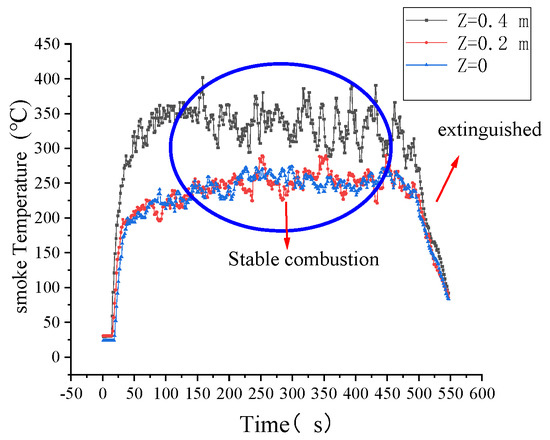
Figure 3.
Smoke temperature history along time.
Figure 4 illustrates the fire development patterns for a 13.77 kW fire source positioned along the tunnel centerline at various longitudinal locations. As the fire source moves longitudinally toward the enclosed end, smoke flows along the sidewalls and is reflected upon reaching the end wall. In the enclosed tunnel, smoke initially propagates longitudinally toward both end walls and then flows back after impinging on them. For maintaining efficient combustion, the flame draws in air from both sides while simultaneously entraining recirculated hot smoke from the surrounding lateral area. When the fire source is offset from the tunnel centerline, the two sides of the flame experience different gas temperatures and pressures. Under such asymmetric conditions, the temperature on the offset side becomes higher due to the accumulation of returned hot smoke, resulting in a smoke density imbalance across the flame [22]. This asymmetry causes the flame to lean toward the sidewall, with the greatest inclination angle occurring at position d = 2.4 m. When the fire source is shifted towards the enclosed end, the confinement effect intensifies. The air entrainment capacity near the sidewall diminishes, and the smoke flow direction alters, causing the flame to extend along the adjacent end wall toward the upstream and ceiling regions, thereby forming a “wall-attached combustion” phenomenon [27].
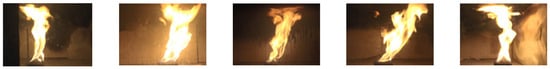
Figure 4.
Flame morphology with the fire source positioned along the centerline.
Figure 5 presents the ceiling temperature distributions corresponding to different longitudinal and transverse fire source locations. With longitudinal displacement of the fire source from the tunnel center (up to 2.4 m), there was a progressive decline in the highest ceiling temperature. In contrast, when the fire source approached the enclosed end (2.4–3.2 m), the maximum temperature increased. This rebound is attributed to the reflection and accumulation of hot smoke at the enclosed end [28]. Concurrently, as the fire source shifted transversely, the peak ceiling temperature increased with greater offset distances. This trend resulted from the combined confinement effect of the sidewall and the enclosed end, which enhanced local smoke accumulation along the sidewall and thereby elevated the ceiling temperature [29,30].
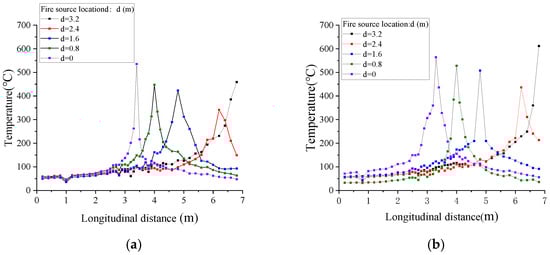
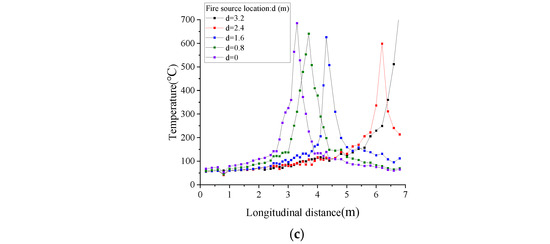
Figure 5.
Maximum ceiling temperature distribution for different longitudinal and transverse locations. (a) Z = 0. (b) Z = 0.2. (c) Z = 0.4.
In order to facilitate the extrapolation of results from reduced-scale experiments, dimensionless parameters were introduced to establish the similarity relationship between model and full-scale scenarios. Figure 6 shows the dimensionless maximum ceiling temperature ( and different dimensionless longitudinal distance between the fire source and tunnel center () and dimensionless transverse distance () with four different heat release rates [22]. Here, the peak temperature rise at varying transverse locations is indicated by , with L and W defining the full length and width of the tunnel structure, respectively. Observations reveal that the location of the fire significantly dictates the maximum temperature rise beneath the ceiling. When 0 ≤ D ≤ 0.73 (Region I), the maximum ceiling temperature decreased; for D > 0.73 (Region II), the maximum ceiling temperature began to rise. In Region I, the flame tilting shortened the contact length between the thermal plume and the ceiling, reducing the residence time of smoke beneath the ceiling, and allowing heat to dissipate rapidly along the tunnel. As a result, the ceiling temperature gradually decreased. In Region II, because of the sidewall and end wall confinement, the returned hot smoke continuously accumulated, and consequently, there was a significant increase in the maximum ceiling temperature [31].
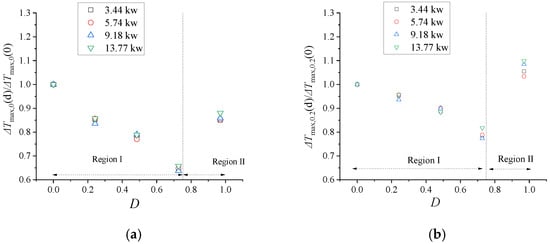
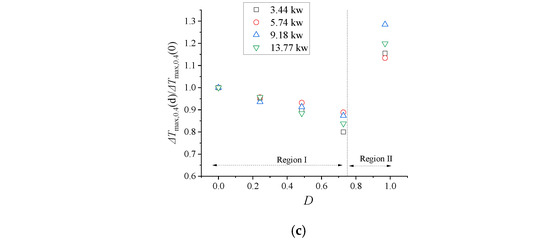
Figure 6.
The relation between the dimensionless maximum temperature and different dimensionless longitudinal and traverse distance. (a) Z = 0. (b) Z = 0.2. (c) Z = 0.4.
3.2. The Prediction Model of Maximum Ceiling Temperature
3.2.1. Region I (0 ≤ D ≤ 0.73)
According to previous studies, a correlation exists where the peak temperature rise increases with but decreases in proportion to [32,33]. Figure 7 shows the correlation between and the maximum ceiling temperature when the fire source is located at the tunnel center (D = 0, Z′ = 0). This indicates that the maximum ceiling temperature increases linearly with , exhibiting a correlation coefficient exceeding 0.89. Therefore, for a fire source positioned at the tunnel center (D = 0, Z′ = 0), the maximum ceiling temperature is given by:
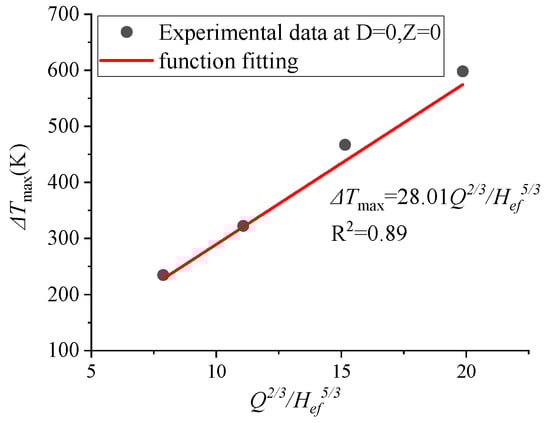
Figure 7.
The maximum temperature at the tunnel center.
Figure 8 compares the predicted maximum temperature rise at the tunnel centerline from the present model with those from the models proposed by Li [11] and Yao [21]. The predictions of Equation (3) and Yao’s model were consistently higher than those of Li’s model. This discrepancy primarily stems from the differing boundary conditions: Li’s model was developed for open tunnels, whereas the current study addressed enclosed conditions, where heat accumulation led to a higher coefficient in the predictive correlation. Furthermore, the height-to-width ratio of the present tunnel model was notably greater than that in Yao’s configuration [21]. This geometric difference restricts the transverse diffusion of the smoke plume, enhancing the accumulation of returned hot smoke and consequently yielding a higher ceiling temperature rise at an equivalent heat release rate under enclosed conditions.
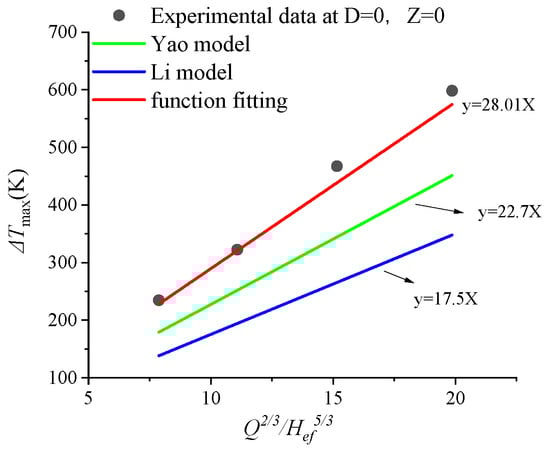
Figure 8.
Comparison between previous predictive models and the experimental data.
Regarding scenarios where the fire is situated in proximity to the sealed end (D > 0), Yao [22] developed a correlation for the dimensionless peak ceiling temperature within enclosed tunnels. This formulation accounts for the interplay between the dimensionless fire source location and the dimensionless heat release rate, as given by:
where T0
represents the background temperature, and denotes the maximum ceiling temperature, which accounts for the separation between the fire source and the tunnel center.
Figure 9 shows the fitting of experimental data for various transverse and longitudinal fire source distances using Equation (4). The results indicate a clear power–law relationship between and . The exponent A was determined to be 2/3 for all tested transverse fire distances across different dimensionless longitudinal distances (D), demonstrating that the power–law relationship between the ceiling temperature rise and the HRR is independent of the transverse fire offset. Additionally, the values of f(D) in Equation (4)—which serves as the coefficient of the power term—were obtained for different fire source locations. The corresponding relationships between f(D) and D are summarized in Table 3.
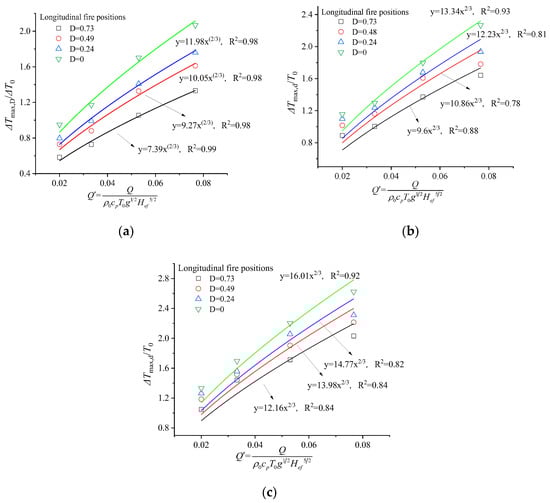
Figure 9.
Linear fitting of dimensionless maximum temperature rise versus dimensionless HRR for different fire source positions. (a) Z = 0. (b) Z = 0.2. (c) Z = 0.4.
Table 3.
The relationships between f(D) and D.
Figure 10 demonstrates the functional relationship between f(D) and D (0 ≤ D ≤ 0.73) under different transverse locations. It is evident that the factors f(D) and D are strongly correlated (R2 = 0.95, 0.97, 0.97), described by:
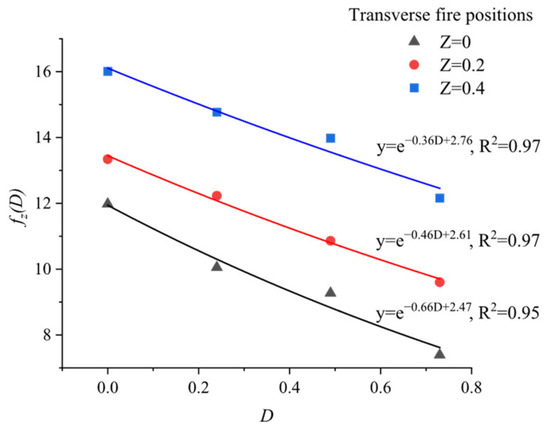
Figure 10.
The correlation between f(D) and D under different transverse locations.
Based on Equation (5) and the preceding analysis, the transverse position of the fire source influences not only the values of f(D) but also the coefficients F1 and F2. The values of F1 and F2, corresponding to different transverse fire locations, are summarized in Table 4. Furthermore, Figure 11 illustrates the correlation between these coefficients and the dimensionless transverse fire location Z′, which is mathematically expressed by Equation (9) and (10).
Table 4.
Fitting coefficients F1 and F2.
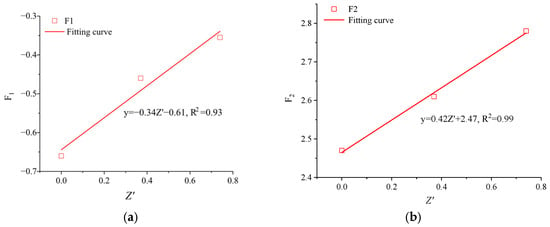
Figure 11.
Exponential fitting of the f(D). (a) The fitting coefficient F1. (b) The fitting coefficient F2.
Combining Equations (4), (5), and (9), (10), the prediction model for scenarios involving a transversely offset fire source can be expressed as:
Hence, for a fire source located in Region I, the maximum ceiling temperature that incorporates transverse and longitudinal position effects is given by:
3.2.2. Region II (0.73 < D < 1)
When the fire source approaches the end wall in enclosed tunnels (Region II), Yao [21] proposed the following expression for the maximum temperature rise along the tunnel centerline:
Here, d represents the distance from the fire source to the tunnel center, K denotes the smoke attenuation coefficient, and Lr and Ll indicate the distances between the fire source and the left and right end walls, respectively.
Figure 12 presents the fitting of experimental data using Equation (13). The results indicate that the model tends to underestimate the temperature rise near the enclosed end. This discrepancy primarily arises because the model does not account for the effects of the transverse fire source offset or the associated accumulation of hot smoke in that region. Furthermore, a comparison with Yao’s model [22] revealed that the coefficients obtained in this study were significantly larger. This difference can be attributed to the distinct height-to-width ratios of the tunnel geometries: while Yao’s tunnel had a ratio of 1.25, the ratio in the present study was approximately 2. To address these factors, an additional correction coefficient, , was introduced to incorporate the influence of transverse fire source location and the enhanced thermal accumulation effect in Region II [22,27]. Accordingly, for Region II, the maximum ceiling temperature rise can be expressed as:
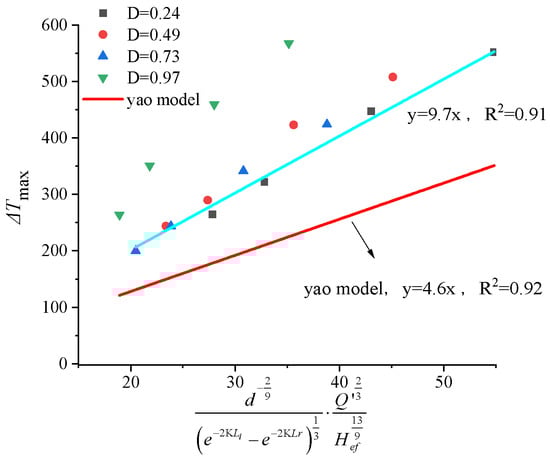
Figure 12.
The fitting of the experimental data using Equation (13).
Figure 13 presents the fitting of the correction coefficient for different transverse fire source positions in Region II based on Equation (14). The results demonstrate that incorporating improves the prediction accuracy of the maximum ceiling temperature and that the value of is itself influenced by the transverse position of the fire source. To derive general expressions for applicable across varying fire locations, the coefficients a, b, and c, obtained from the fitting in Figure 13, are summarized in Table 5 for each transverse position case.
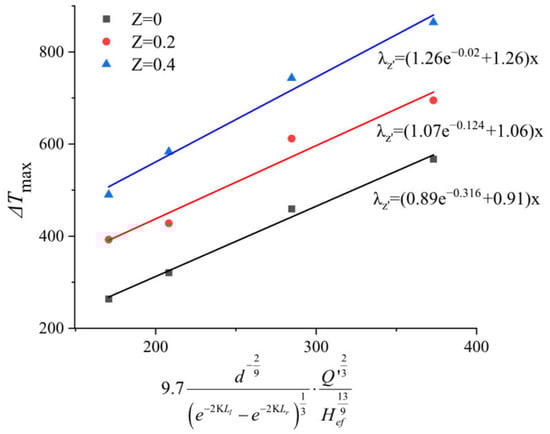
Figure 13.
Linear fitting of the coefficient for different transverse fire positions.
Table 5.
Summary of fitting coefficients.
Figure 14 illustrates the linear fitting of coefficients a, b, and c as a function of the dimensionless transverse fire distance. The clear linear trends indicate that these coefficients serve as robust parameters for at various transverse locations. The resulting fitting equations are given below:
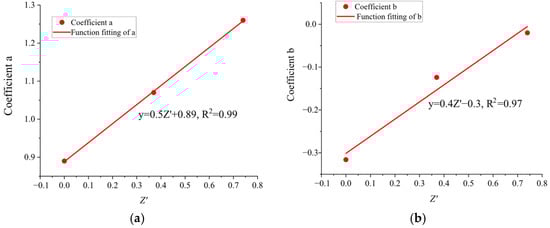
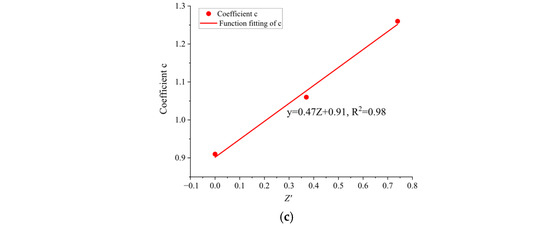
Figure 14.
Coefficient fitting. (a) Linear fitting of a. (b) Linear fitting of b. (c) Linear fitting of c.
By substituting Equations (16)–(18) into Equations (14) and (15), the prediction model for the maximum ceiling temperature rise in Region II, can be given by:
In summary, the prediction model for the maximum ceiling temperature, incorporating both transverse and longitudinal fire source positions, can be expressed as:
To validate the proposed model, Figure 15 compares the predicted and measured values under all experimental conditions. The results show close agreement, confirming the model’s reliability across varying fire source locations.
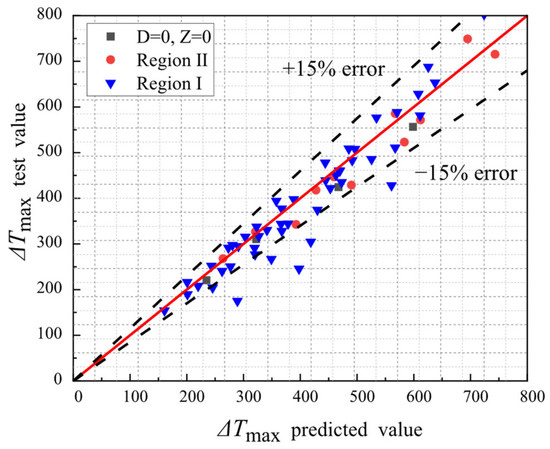
Figure 15.
Comparison between the model predictions and experimental values.
4. Conclusions
Focusing on enclosed tunnels, this study analyzed the effects of fire source positions in both transverse and longitudinal directions on maximum ceiling temperatures based on 1:15 reduced-scale rectangular tunnel model fire testing and established a dimensionless predictive model. The major conclusions are summarized as follows:
- (1)
- Fire source locations significantly influence flame inclination behavior and ceiling temperature distribution. When the fire source moves longitudinally toward the enclosed end (Region I, 0 ≤ D ≤ 0.73), the flame tilts toward the near end wall, causing the maximum ceiling temperature to decrease continuously. As the fire source approaches the enclosed end (Region II, 0.73 < D < 1), the combined effects of end wall and sidewall confinement result in a temperature rebound.
- (2)
- Based on dimensional analysis, a dimensionless prediction model was established, comprehensively accounting for fire HRR, transverse, and longitudinal fire positions. The comparison results indicate that the predicted values align well with the tested data.
Finally, the prediction model proposed in this paper can be used to calculate the maximum temperature near the enclosed end, thereby guiding the design of the fire protection thickness for the tunnel ceiling concrete lining to prevent spalling caused by high temperatures. However, it should be noted that the predictive models in this study were designed to analyze the maximum ceiling temperature in a rectangular tunnel. Due to the differences of the shape of section, caution should be exercised when extrapolating these findings to other tunnels.
Author Contributions
Conceptualization, L.L.; Formal analysis, K.A.; Investigation, Z.W., X.Z. and J.X.; Methodology, K.A., Y.Z. and L.L.; Resources, L.L.; Validation, X.Z.; Writing—original draft, Z.W. and J.X. All authors have read and agreed to the published version of the manuscript.
Funding
This work was supported by the Key Science and Technology Program of the Ministry of Emergency Management (2024EMST111102), the Science and Technology Research Program of Chongqing Municipal Education Commission (KJZD-K202300713), and the Chongqing Natural Science Fund Innovation and Development Joint Fund (CSTB2024NSCQ-LZX0019).
Institutional Review Board Statement
Not applicable.
Informed Consent Statement
Not applicable.
Data Availability Statement
The data that support the findings of this study are available upon request from the corresponding author (L.L.).
Conflicts of Interest
Authors Zhenwei Wang, Ke An and Xueyong Zhou were employed by the company Chongqing Survey and Design Institute Co., Ltd., China Railway Second Institute. The remaining authors declare that the research was conducted in the absence of any commercial or financial relationships that could be construed as a potential conflict of interest.
Nomenclature
| Q | heat release rate (kW) | D | longitudinal dimensionless distance |
| H | tunnel height (m) | Z | transverse fire distance (m) |
| Hef | height from fire source to tunnel ceiling (m) | Z′ | transverse dimensionless distance |
| ΔH | heat of combustion (kJ/kg) | W | tunnel width (m) |
| T0 | ambient air temperature (°C) | L | tunnel length (m) |
| Q′ | dimensionless heat release rate (kW) | K | attenuation coefficient of smoke |
| Ll | distance between the fire source and left end wall (m) | mass loss rate | |
| Lr | distance between the fire source and right end wall (m) | Greek symbols | |
| ΔTmax | maximum ceiling temperature rise (°C) | λ | thermal accumulation correction factor |
| d | distances between the fire source and the enclosed end (m) | β | the coefficient of Equation (10) |
References
- Ye, K.; Tang, X.; Zheng, Y.; Ju, X.; Peng, Y.; Liu, H.; Wang, D.; Cao, B.; Yang, L. Estimating the two-dimensional thermal environment generated by strong fire plumes in an urban utility tunnel. Process Saf. Environ. Prot. 2021, 148, 737–750. [Google Scholar] [CrossRef]
- Ren, R.; Zhou, H.; Hu, Z.; He, S.; Wang, X. Statistical analysis of fire accidents in Chinese highway tunnels 2000–2016. Tunn. Undergr. Space Technol. 2019, 83, 452–460. [Google Scholar] [CrossRef]
- Beard, A.N. Fire safety in tunnels. Fire Saf. J. 2009, 44, 276–278. [Google Scholar] [CrossRef]
- Alarie, Y. Toxicity of fire smoke. Crit. Rev. Toxicol. 2002, 32, 259–289. [Google Scholar] [CrossRef]
- Leitner, A. The fire catastrophe in the Tauern Tunnel: Experience and conclusions for the Austrian guidelines. Tunn. Undergr. Space Technol. 2001, 16, 217–223. [Google Scholar] [CrossRef]
- Hu, L.H.; Huo, R.; Wang, H.B.; Li, Y.; Yang, R. Experimental studies on fire-induced buoyant smoke temperature distribution along tunnel ceiling. Build. Environ. 2007, 42, 3905–3915. [Google Scholar] [CrossRef]
- Luo, J.; Xu, Z.; Li, F.; Zhao, J. Effect of vehicular blocking scene on smoke spread in the longitudinal ventilated tunnel fire. Case Stud. Therm. Eng. 2019, 14, 100495. [Google Scholar] [CrossRef]
- Lei, P.; Chen, C.; Zhang, Y.; Xu, T.; Sun, H. Experimental study on temperature profile in a branched tunnel fire under natural ventilation considering different fire locations. Int. J. Therm. Sci. 2021, 159, 106631. [Google Scholar] [CrossRef]
- Alpert, R.L. Calculation of response time of ceiling-mounted fire detectors. Fire Technol. 1972, 8, 181–195. [Google Scholar] [CrossRef]
- Kurioka, H.; Oka, Y.; Satoh, H.; Sugawa, O. Fire properties in near field of square fire source with longitudinal ventilation in tunnels. Fire Saf. J. 2003, 38, 319–340. [Google Scholar] [CrossRef]
- Li, Y.Z.; Lei, B.; Ingason, H. The maximum temperature of buoyancy-driven smoke flow beneath the ceiling in tunnel fires. Fire Saf. J. 2011, 46, 204–210. [Google Scholar] [CrossRef]
- Shafee, S.; Yozgatligil, A. An analysis of tunnel fire characteristics under the effects of vehicular blockage and tunnel inclination. Tunn. Undergr. Space Technol. 2018, 79, 274–285. [Google Scholar] [CrossRef]
- Li, L.; Cheng, X.; Cui, Y.; Dong, W.; Mei, Z. Effect of blockage ratio on the maximum temperature under the ceiling in tunnel fires. J. Fire Sci. 2013, 31, 245–257. [Google Scholar] [CrossRef]
- Jiang, X.; Zhang, H.; Jing, A. Effect of blockage ratio on critical velocity in tunnel model fire tests. Tunn. Undergr. Space Technol. 2018, 82, 584–591. [Google Scholar] [CrossRef]
- Lee, Y.P.; Tsai, K.C. Effect of vehicular blockage on critical ventilation velocity and tunnel fire behavior in longitudinally ventilated tunnels. Fire Saf. J. 2012, 53, 35–42. [Google Scholar] [CrossRef]
- Fan, C.G.; Ji, J.; Gao, Z.H.; Sun, J. Experimental study on transverse smoke temperature distribution in road tunnel fires. Tunn. Undergr. Space Technol. 2013, 37, 89–95. [Google Scholar] [CrossRef]
- Ji, J.; Fan, C.G.; Zhong, W.; Shen, X.; Sun, J. Experimental investigation on influence of different transverse fire locations on maximum smoke temperature under the tunnel ceiling. Int. J. Heat Mass Transf. 2012, 55, 4817–4826. [Google Scholar] [CrossRef]
- Li, L.; Zhang, W.; Gao, Z.; Yang, L.; Du, F.; Wang, L.; Wei, L.; Huang, F. Experimental study on the maximum temperature under the ceiling in a metro depot with one end closed. Tunn. Undergr. Space Technol. 2023, 134, 104968. [Google Scholar] [CrossRef]
- Gao, Z.; Li, L.; Zhong, W.; Liu, X. Characterization and prediction of ceiling temperature propagation of thermal plume in confined environment of common services tunnel. Tunn. Undergr. Space Technol. 2021, 110, 103714. [Google Scholar] [CrossRef]
- Zhao, J.; Wang, Z.; Ma, H.; Yao, Y.; Zhang, J.; Huang, H. Experiment investigation on temperature distribution in a single-ended tunnel fire. Tunn. Undergr. Space Technol. 2025, 165, 106874. [Google Scholar] [CrossRef]
- Yao, Y.; He, K.; Peng, M.; Shi, L.; Cheng, X.; Zhang, H. Maximum gas temperature rise beneath the ceiling in a portals-sealed tunnel fire. Tunn. Undergr. Space Technol. 2018, 80, 10–15. [Google Scholar] [CrossRef]
- Yao, Y.; Cheng, X.; Zhang, S.; Zhu, K.; Zhang, H.; Shi, L. Maximum smoke temperature beneath the ceiling in an enclosed channel with different fire locations. Appl. Therm. Eng. 2017, 111, 30–38. [Google Scholar] [CrossRef]
- Huang, P.; Ye, S.; Xie, J.; Chen, M.; Liu, C.; Yu, L. Study on the maximum and longitudinal distribution of ceiling gas temperature in a naturally ventilated tunnel: The effect of longitudinal fire location. Int. J. Therm. Sci. 2023, 185, 108037. [Google Scholar] [CrossRef]
- Meng, N.; Shu, Y.; Zhang, S. Study on smoke temperature induced by two fires in a naturally ventilated tunnel. Tunn. Undergr. Space Technol. 2023, 131, 104774. [Google Scholar] [CrossRef]
- Tang, F.; He, Q.; Chen, L.; Li, P. Experimental study on maximum smoke temperature beneath the ceiling induced by carriage fire in a tunnel with ceiling smoke extraction. Sustain. Cities Soc. 2019, 44, 40–45. [Google Scholar] [CrossRef]
- Li, Y.Z.; Ingason, H. Overview of research on fire safety in underground road and railway tunnels. Tunn. Undergr. Space Technol. 2018, 81, 568–589. [Google Scholar] [CrossRef]
- Gao, W.; Liu, N.; Xie, X.; Zhu, H.; Zhang, L.; Jiao, Y. Experimental and analytical study on inclined turbulent fire in still air. Part 1. Line fire. Proc. Combust. Inst. 2023, 39, 4075–4083. [Google Scholar] [CrossRef]
- Ji, J.; Zhong, W.; Li, K.Y.; Shen, X.; Zhang, Y.; Huo, R. A simplified calculation method on maximum smoke temperature under the ceiling in subway station fires. Tunn. Undergr. Space Technol. 2011, 26, 490–496. [Google Scholar] [CrossRef]
- Li, Z.; Zhang, Y.; Qiao, M.; Gao, Y.; Huang, Y. Experimental and theoretical study of the smoke back-layering length in a tunnel with cross-passage: Effects of longitudinal fire source locations. Railw. Eng. Sci. 2025, 1–16. [Google Scholar] [CrossRef]
- Pan, R.; Zhu, G.; Liang, Z.; Zhang, G.; Liu, H.; Zhou, X. Experimental study on the fire shape and maximum temperature beneath ceiling centerline in utility tunnel under the effect of curved sidewall. Tunn. Undergr. Space Technol. 2020, 99, 103304. [Google Scholar] [CrossRef]
- Li, Q.; Kang, J.; Xu, X.; Feng, Y.; Wang, Y. An experimental study on gas temperature characteristic in tunnel fires: The influences of sidewall restriction and sealing effect. Int. J. Heat Mass Transf. 2023, 214, 124385. [Google Scholar] [CrossRef]
- Yao, Y.; He, K.; Peng, M.; Shi, L.; Cheng, X. The maximum gas temperature rises beneath the ceiling in a longitudinal ventilated tunnel fire. Tunn. Undergr. Space Technol. 2021, 108, 103672. [Google Scholar] [CrossRef]
- Gannouni, S. Critical velocity for preventing thermal backlayering flow in tunnel fire using longitudinal ventilation system: Effect of floor-fire separation distance. Int. J. Therm. Sci. 2022, 171, 107192. [Google Scholar] [CrossRef]


Disclaimer/Publisher’s Note: The statements, opinions and data contained in all publications are solely those of the individual author(s) and contributor(s) and not of MDPI and/or the editor(s). MDPI and/or the editor(s) disclaim responsibility for any injury to people or property resulting from any ideas, methods, instructions or products referred to in the content. |
© 2026 by the authors. Licensee MDPI, Basel, Switzerland. This article is an open access article distributed under the terms and conditions of the Creative Commons Attribution (CC BY) license.