Abstract
Bioaerosol particles contribute to the reduced indoor air quality and cause various health issues, thus their concentration must be managed. Air cleaning is one of the most viable technological options for reducing quantities of indoor air contaminants. This study assesses the effectiveness of a prototype multi-stage air cleaner in reducing bioaerosol particle viability and concentrations. The single-pass type unit consisted of non-thermal plasma (NTP), ultraviolet-C (UV-C) irradiation, bipolar ionization (BI), and electrostatic precipitation (ESP) stages. The device was tested under controlled laboratory conditions using Escherichia coli (Gram-negative) and Lactobacillus casei (Gram-positive) bacteria aerosol at varying airflow rates (50–600 m3/h). The device achieved over 99% inactivation efficiency for both bacterial strains at the lowest airflow rate (50 m3/h). Efficiency declined with increasing airflow rates but remained above 94% at the highest flow rate (600 m3/h). Among the individual stages, NTP demonstrated the highest standalone inactivation efficiency, followed by UV-C and BI. The ESP stage effectively captured inactivated bioaerosol particles, preventing re-emission, while an integrated ozone decomposition unit maintained ozone concentrations below safety thresholds. These findings show the potential of multi-stage air cleaning technology for reducing bioaerosol contamination in indoor environments, with applications in healthcare, public spaces, and residential settings.
1. Introduction
In modern society, indoor bioaerosol particles may be considered as significant contributors to indoor air pollution leading to various respiratory issues such as allergic syndromes, toxic reactions, as well as infectious diseases [1]. Bioaerosol comprises living organism particles present in the air and may include bacteria, fungi, viruses, and pollen. The sources of bioaerosol indoors are vast and may include humans and animals (viruses and bacteria), indoor plants (pollen, fungi), building systems, especially those affected by dampness (bacteria, fungi), and outdoor air (pollen, fungi). Ensuring healthy living and well-being is heavily dependent on maintaining good indoor air quality, given that individuals spend up to 90% of their time in enclosed spaces [2]. Consequently, the task of reducing bioaerosol presence in indoor air presents a particular challenge, emphasizing the importance of indoor bioaerosol management strategies [3].
The primary indoor air quality improvement measures include management of pollution sources and improvement of the ventilation. In cases when these measures are insufficient, not cost-effective, or technically feasible, air purification/treatment technologies are employed [4,5]. The use of indoor air cleaners for bioaerosol management spiked in popularity during the COVID-19 pandemic [6,7,8].
Air cleaners may be specifically aimed at only bioaerosol particles (such as UV irradiation) or may be primarily targeted to other pollutants, such as particulate matter (mechanical or electrostatic filtration, deposition by ionization) or volatile organic compounds (non-thermal plasma, photocatalytic processes) [9,10]. UV irradiation effectively inactivates microorganisms at high intensity with adequate contact time [11], while the inactivated microorganisms are then removed from air together with remaining particles via surface deposition or extraction with ventilation. The UV-based cleaners have no impact on particulate matter concentrations but may release ozone and partially oxidize volatile organic compounds (VOCs), although this mechanism is not controlled [10]. Mechanical filtration is the most effective in trapping bioaerosol particles, however, its effectiveness depends on filter quality and maintenance and creates solid waste in the form of spent filters. Moreover, there is a risk of bacterial re-entry to the air stream from poorly maintained filters [12]. Ionization-based methods, depending on the electrode configuration and power inputs, may act as particle charging and/or trapping devices and even decompose organic molecules via oxidation by the radicals formed in an electric field. Such methods have a lower pressure drop compared to filter-based air cleaners, however, their efficiency is lower and the risk of releasing ozone and nitric oxide into indoor air is high [8,10].
Some configurations of indoor air cleaners have multiple sequential stages addressing both particle phase and gas phase pollutants. It has been shown that their operating efficiency, especially the removal of VOCs of such devices, is rather poor [13]. Moreover, very few devices are reported to operate solely on electrical processes [14,15,16] while the majority rely on stages of physical filtration (particles) or adsorption by activated carbon (VOCs) [17]. In terms of bioaerosol particle arrestance, such devices may trap particles in filters, incur charge and deposit on an electrode, or inactivate them upon contact with oxidative radicals [18,19,20,21,22]. However, the data on the efficiency of multi-stage air cleaners to bioaerosol particle removal is yet rather scarce.
A novel concept in the simultaneous removal of particles and VOCs from polluted air includes a gas-to-particle conversion process, which relies on sequential processes of ozonolysis/plasmolysis, photolysis, ionization, and electrostatic precipitation [15,16,23,24]. VOCs are oxidized, polymerized, and nucleated into particles under plasma radicals and UV irradiation, further agglomerate into larger particles in the bipolar ionizer, and finally are captured in the electrostatic precipitator [16]. Such a sequence utilizes low energy inputs to initiate gas-to-particle conversion (as opposed to non-thermal plasma oxidation), thus minimizing O3 formation. While this has been indicated as an efficient VOC and particle removal technology reaching single-pass VOC removal efficiency between 75.7 and 100% [15], the COVID-19 pandemic has revealed the necessity to assess air cleaning technologies against bioaerosol particles [25,26]. This article thus presents the research on the efficiency of gas-to-particle air cleaning technology for the removal/inactivation of bioaerosol (bacteria) particles, testing the hypothesis that the combined ionization stages will provide an efficient sequence for the removal of Gram-positive and Gram-negative viable bacteria from an air stream.
2. Materials and Methods
2.1. Multi-Stage Air Cleaner Technology
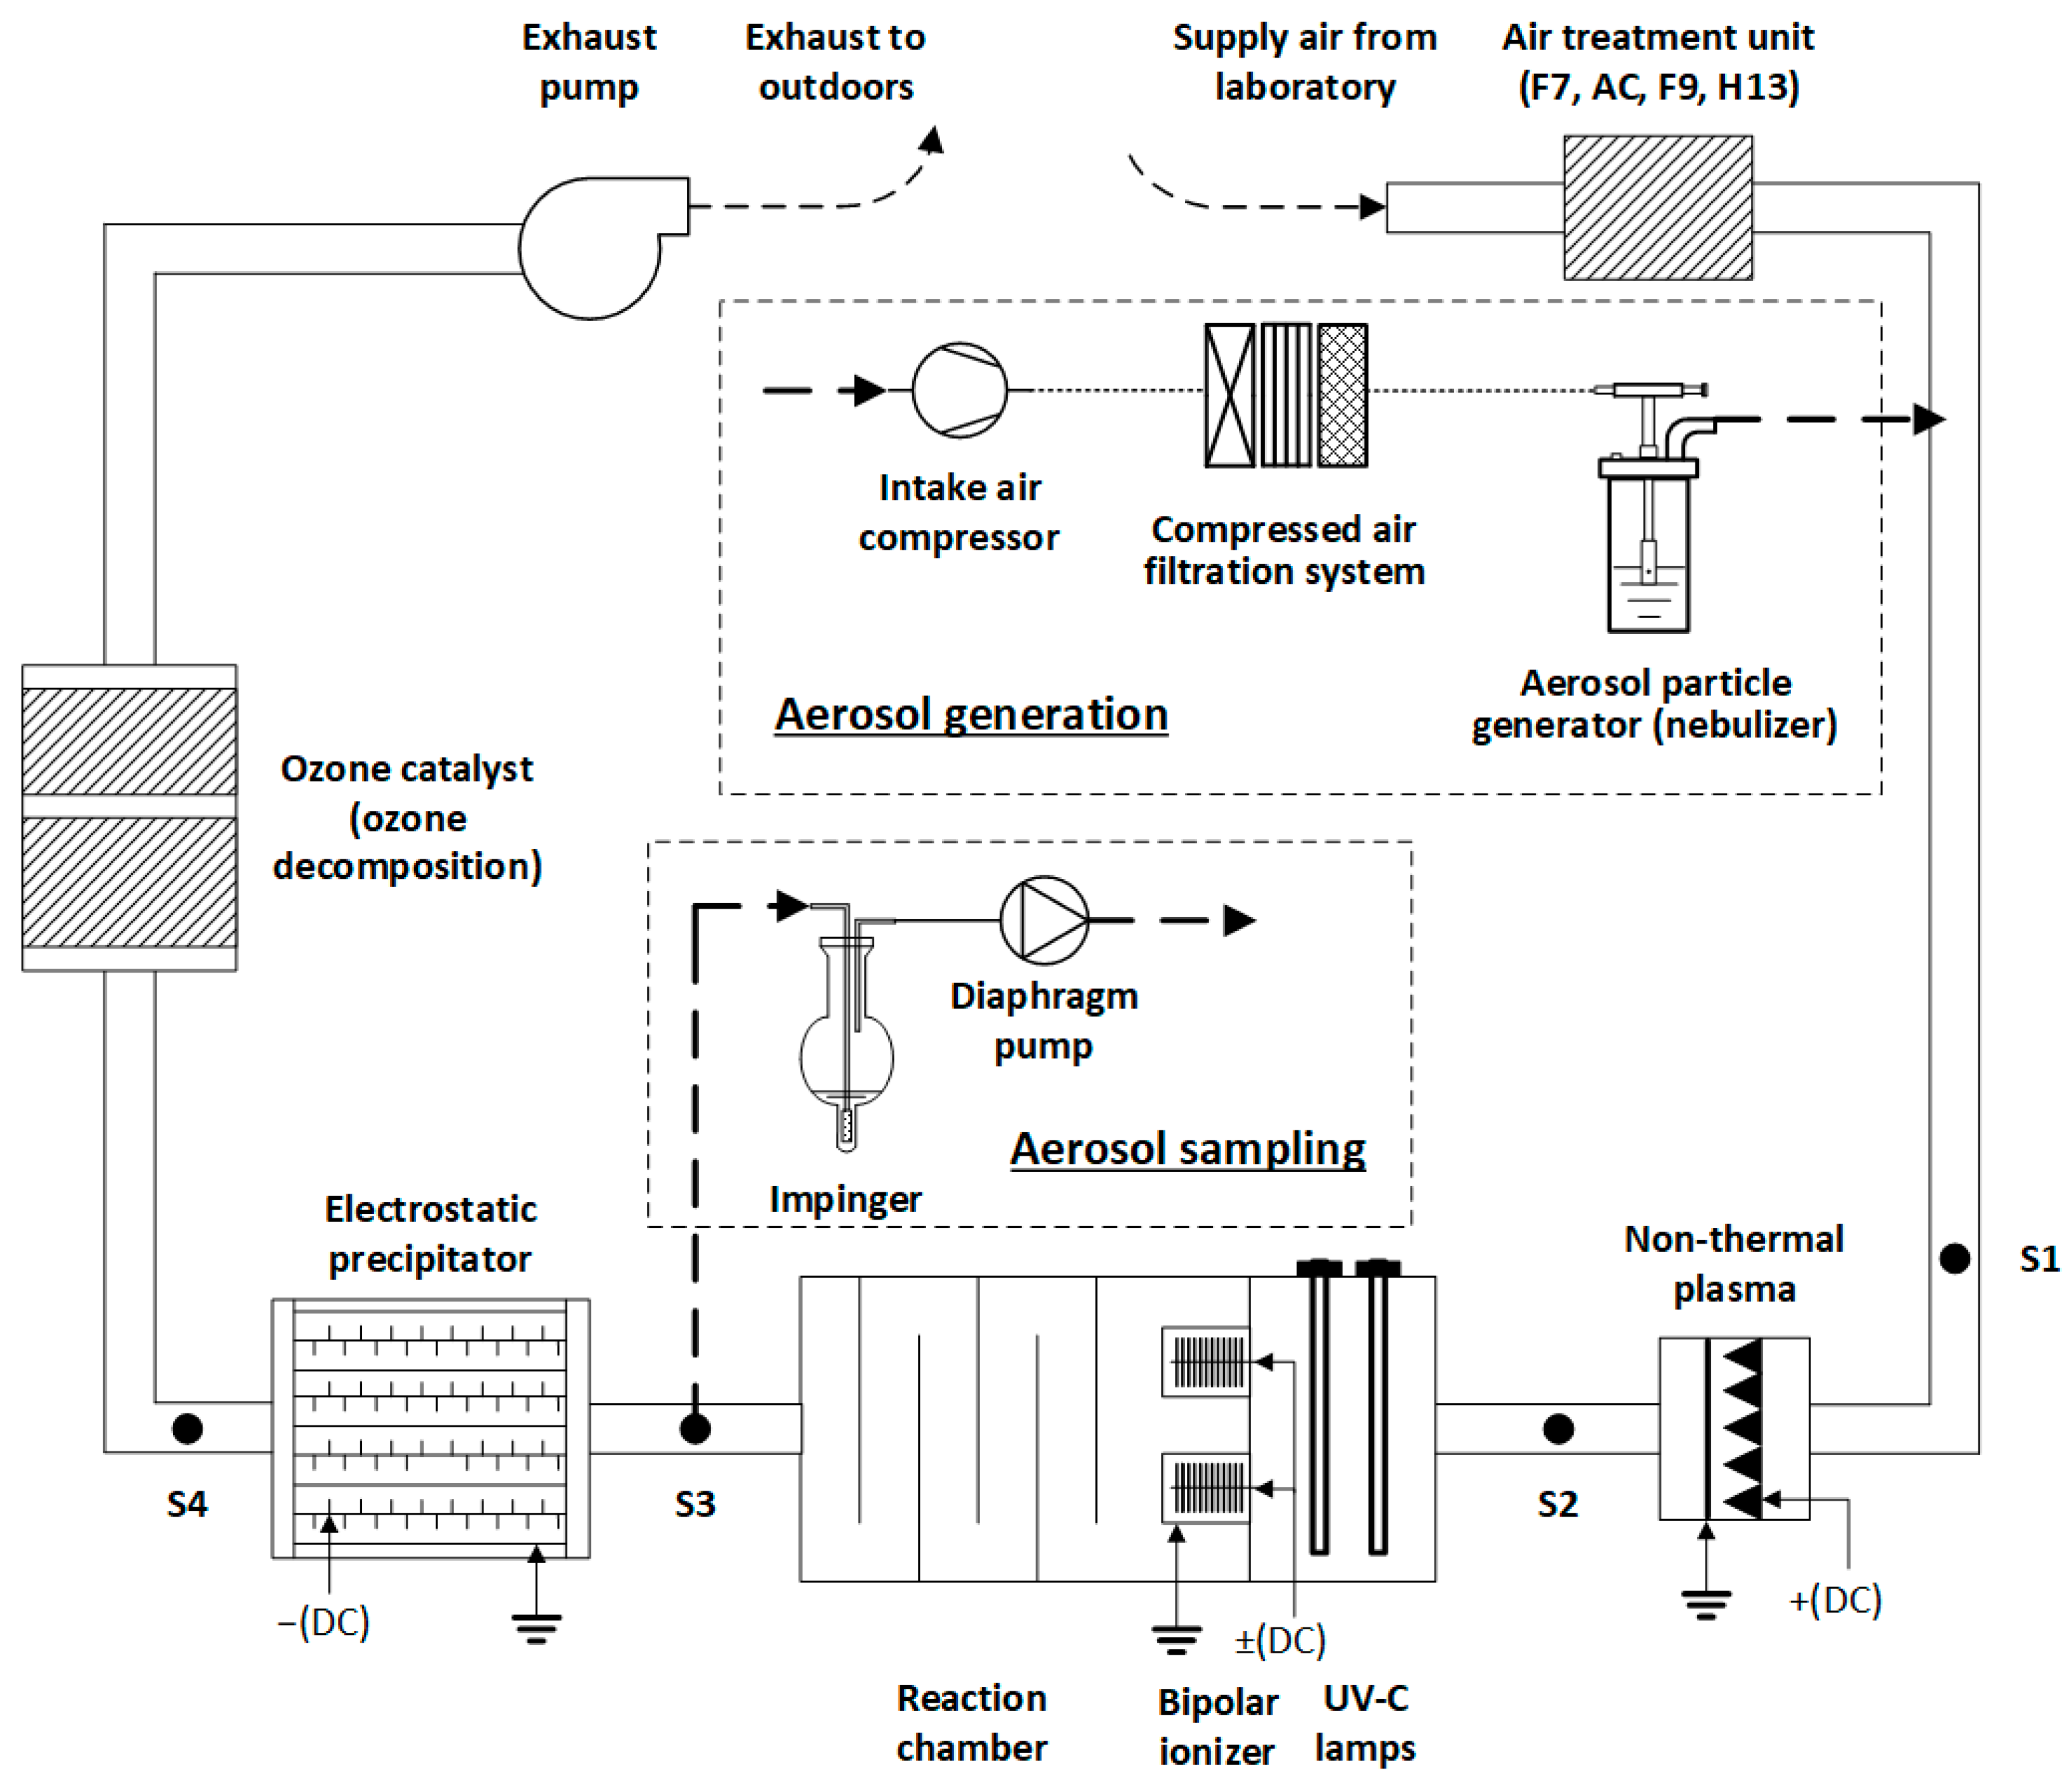
The multi-stage air cleaner has been designed to operate on subsequent processes of plasmolysis, photolysis, ionization, and electrostatic precipitation (Figure 1). It has been fully designed, assembled, and tested at the Department of Environmental Technology, Kaunas University of Technology, Lithuania. The working principle and efficiency in VOC removal have been reported by our earlier studies [15,16].
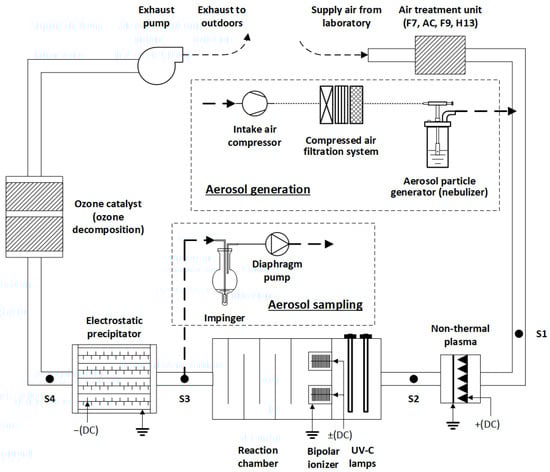
Figure 1.
Principle scheme of multi-stage air cleaning technological sequence in a laboratory setup for researching bioaerosol inactivation. Sampling points for measuring real-time particle size distributions and bioaerosol particles are designated as S#.
The prototype air cleaner was installed in a laboratory with the temperature maintained at 21 ± 2 °C and the relative humidity 45 ± 5%. The air to be treated was drawn from indoors and conditioned through a series of filters and adsorption beds: a grade F7 prefilter, an activated charcoal bed for trapping VOCs, and grade F9 and H13 filters for the final polishing.
In the experiment on bioaerosol particle removal, a corona-discharge-based non-thermal plasma (NTP) reactor functioned using a positive high-voltage (15 kV) direct current (DC) supplied by an in-house-built power supply. The reactor employed 15 saw-like high-voltage electrodes (285 discharge points) paired with a mesh-type grounded electrode to generate a uniform plasma field for particle inactivation. The NTP reactor measured 0.32 m in width, 0.23 m in height, and 0.06 m in depth, with a 0.02 m gap between the sharp parts of the saw-like electrodes and the grounded mesh. The NTP chamber had a cross-sectional area of 0.126 m2.
The UV radiation was achieved using five UV-C lamps (40 W, model F980078BU, LightTech, Budapest, Hungary), placed in a photolysis chamber, oriented perpendicular to the airflow with a 15 cm separation between them. The UV-C photolysis chamber had a cross-sectional area of 0.4489 m2.
The bipolar ionization (BI) phase was implemented using a module consisting of two positive and two negative ionization units, powered by a specially designed high-voltage DC power supply with negative/positive voltages ranging from ±15 kV. The BI module consisted of four grounded cylindrical housings, each 0.15 m in length and 0.125 m in diameter, separated by 0.2 m with brush-type electrodes inside (0.1 m diameter); each cylinder had a cross-sectional area of 0.0123 m2, resulting in a total effective ionization area of 0.049 m2.
Remaining aerosol particles and inactivated bacteria were collected in an electrostatic precipitator (ESP) of the needle-plate type, which operated at a high-negative-voltage (−15 kV) DC. The ESP utilized 1140 needle electrodes aligned opposite 5 grounded plates (8 collection faces) to enhance particle capture through localized electric fields. The ESP unit measured 0.66 m in width, 0.45 m in height, and 0.6 m in depth, with a gap of approximately 0.03 m between the needle tips and the grounded plates and a chamber cross-sectional area of 0.285 m2.
To prevent potential emission of O3, a ceramic MnO2-embedded catalyst (Tombo no. 8803-CZH2, Nichias Corp., Tokushima, Japan) was installed at the final stage of the system as an O3 destructor.
2.2. Energy Performance of Air Cleaning Stages
The electric power draw was determined by measuring voltage and current applied to each stage, using the following formula:
here Poutput denotes output power (W); E—voltage (V); I—electric current (A).
The energy density was calculated to evaluate the power applied to the volume unit by individual stages using the following equation:
here J denotes energy density (J/m3); Fv—volumetric airflow rate (m3/s).
2.3. Measurement of Aerosol Particle Concentration and Size Distribution
The real-time aerosol particle concentration and size distribution were measured using an Electric Low-Pressure Impactor (ELPI+, Dekati Ltd., Kangasala, Finland). This instrument utilizes the cascade impaction principle and divides aerosol particles to 15 fractions (0.006–10.0 µm), sampling at a flow rate of 10 L/min. Real-time aerosol particle number concentrations were registered in one-second intervals. Air samples were passed through an 85Kr bi-polar neutralizer (3054 A, TSI Inc., Shoreview, MN, USA) prior to entering ELPI+.
2.4. Ozone Measurement
O3 concentration that potentially formed during the operation of each ionization stage was measured using an O3 detector (GRI-9106-E-03, Hunan Guorui (GRI) Instrument Co., Ltd., Changsha, China) at sampling port S4 (Figure 1). The efficiency of the destruction catalyst was monitored by measuring O3 at the exhaust air.
2.5. Bacterial Strains and Culture Conditions
The inactivation efficiency was tested against two microorganism species, namely Gram-positive Lactobacillus casei (L. casei) and Gram-negative Escherichia coli (E. coli). All instruments used for microbiology and aerosol sampling (including impingers) were sterilized in an autoclave at 120 °C prior to the experiments. L. casei was obtained from plain milk yogurt by applying 1 mL of yogurt onto selective De Man–Rogosa–Sharpe (MRS) agar (Cat. 1043, Laboratorios Conda S.A., Madrid, Spain) and inoculated for 72 h at 30 °C. Lyophilized E. coli (strain B, lyophilized cells EC11303, Sigma Aldrich Corp., St. Louis, MO, USA) was revived by submerging 10 mg bacteria in lysogeny broth (Cat. L3152, Sigma Aldrich) and after 30 min inoculated on tryptic soy agar (1138.00, Laboratorios Conda) for 24 h at 37 °C.
2.6. Generation of NaCl Aerosol and Bioaerosol
Prior to analyzing the inactivation of bacteria, the efficiency of individual stages in removal of non-biological aerosol particles (sodium chloride, NaCl) at different airflow rates was researched. NaCl aerosol was generated using a Collison nebulizer (Model CN 24 J, BGI Inc., Cambridge, MA, USA) operating at 2 bar pressure and introduced into the system after the prefilter and before the NTP stage (Figure 1, S1).
The bacterial suspension for nebulization was prepared by submerging bacterial cultures on media in physiological solution (0.9% sodium chloride) and then removed using a Drigalski spatula. The spatula was sterilized before each use by submerging it in ethanol (98%) and then burning off the ethanol. The concentration was maintained at 1 × 10⁹ cfu/mL for L. casei suspension and 1.5 × 10⁹ cfu/mL for E. coli. This concentration was verified using a spectrophotometer at a wavelength of 600 nm (1 × 10⁹ bacteria/mL is equivalent to 1 OD at 600 nm). The bioaerosol was generated under same conditions as NaCl and introduced at the same location in the system.
2.7. Bioaerosol Sampling and Sample Processing
At each experimental stage, two air samples were collected at the sampling point S3 (Figure 1) using an impinger filled with 10 mL of physiological solution, both before and after activating the disinfection stages. Samples were taken at the same point to minimize the impact of bacterial losses within the system. Air samples were collected through an isokinetic head inserted in the middle of the system, positioned parallel to the airflow direction and directly facing the airflow. For sampling L. casei, air was pumped through the impinger for a continuous 20 min duration at a consistent airflow rate of 5 L/min. Bioaerosol of E. coli was sampled in the same way at the lowest operating flow rate (50 m3/h). At greater airflow rates (200–600 m3/h), the sampling duration was increased to 30 min. The impinger pump flow rate was increased to maintain a constant airflow rate of 7 L/min when the flow rate in the system was at 600 m3/h, because the flow rate of 5 L/min was not sufficient to obtain sufficient concentration of bacteria for cultivation.
The collected samples were diluted in sterile physiological solution and inoculated onto the appropriate medium (MRS agar for L. casei and tryptic soy agar for E. coli) by dispersing 0.1 mL of the sample using a Drigalski spatula. The inoculated bacteria were then incubated in a thermostat: L. casei for 72 h at 30 °C and E. coli for 24 h at 37 °C. After incubation, bacterial colony-forming units (CFU) were counted, and inactivation efficiency was calculated.
2.8. The Experimental Design
The following parameters were kept constant throughout the experiment:
- Concentration of bacteria for bioaerosol generation 1·× 109 ± 1·× 108 cfu/mL;
- Power of the bipolar ionizer 19.6 W (+14 kV 0.6 mA, −14 kV, 0.8 mA, direct input power 55 W);
- Power of the NTP—19.75 W (15.8 kV, 1.25 mA, direct input power 51 W);
- Optical power of UV-C (5 lamps)—70 W (direct input power 200 W);
- Power of ESP—34.5 W (15 kV, 0.6 mA, direct input power 55 W);
- Air temperature in laboratory—21 ± 2 °C and relative humidity—45 ± 5%.
The airflow rate through the cleaner varied at the steps of 50, 200, 400, and 600 m3/h.
The experiment was conducted in two parts. The first part aimed to determine the aerosol particle (sodium chloride aerosol) arrestance in the stages of the air cleaner. This was achieved by measuring aerosol particle concentration at sampling points S1, S2, S3, and S4 (Figure 1). The second part of the experiment was conducted to evaluate the bacterial inactivation efficiency of the NTP, UV-C, and BI stages, individually and in combination, as displayed in Table 1.

Table 1.
Experimental plan for evaluating the bacterial inactivation efficiency of individual stages in a multi-stage air cleaner.
Before each experiment, ethanol aerosol (70%) was generated and introduced into the system for 15 min to sterilize the system.
3. Results and Discussion
3.1. Energy Performance of Separate Stages and Entire Air Cleaning Sequence
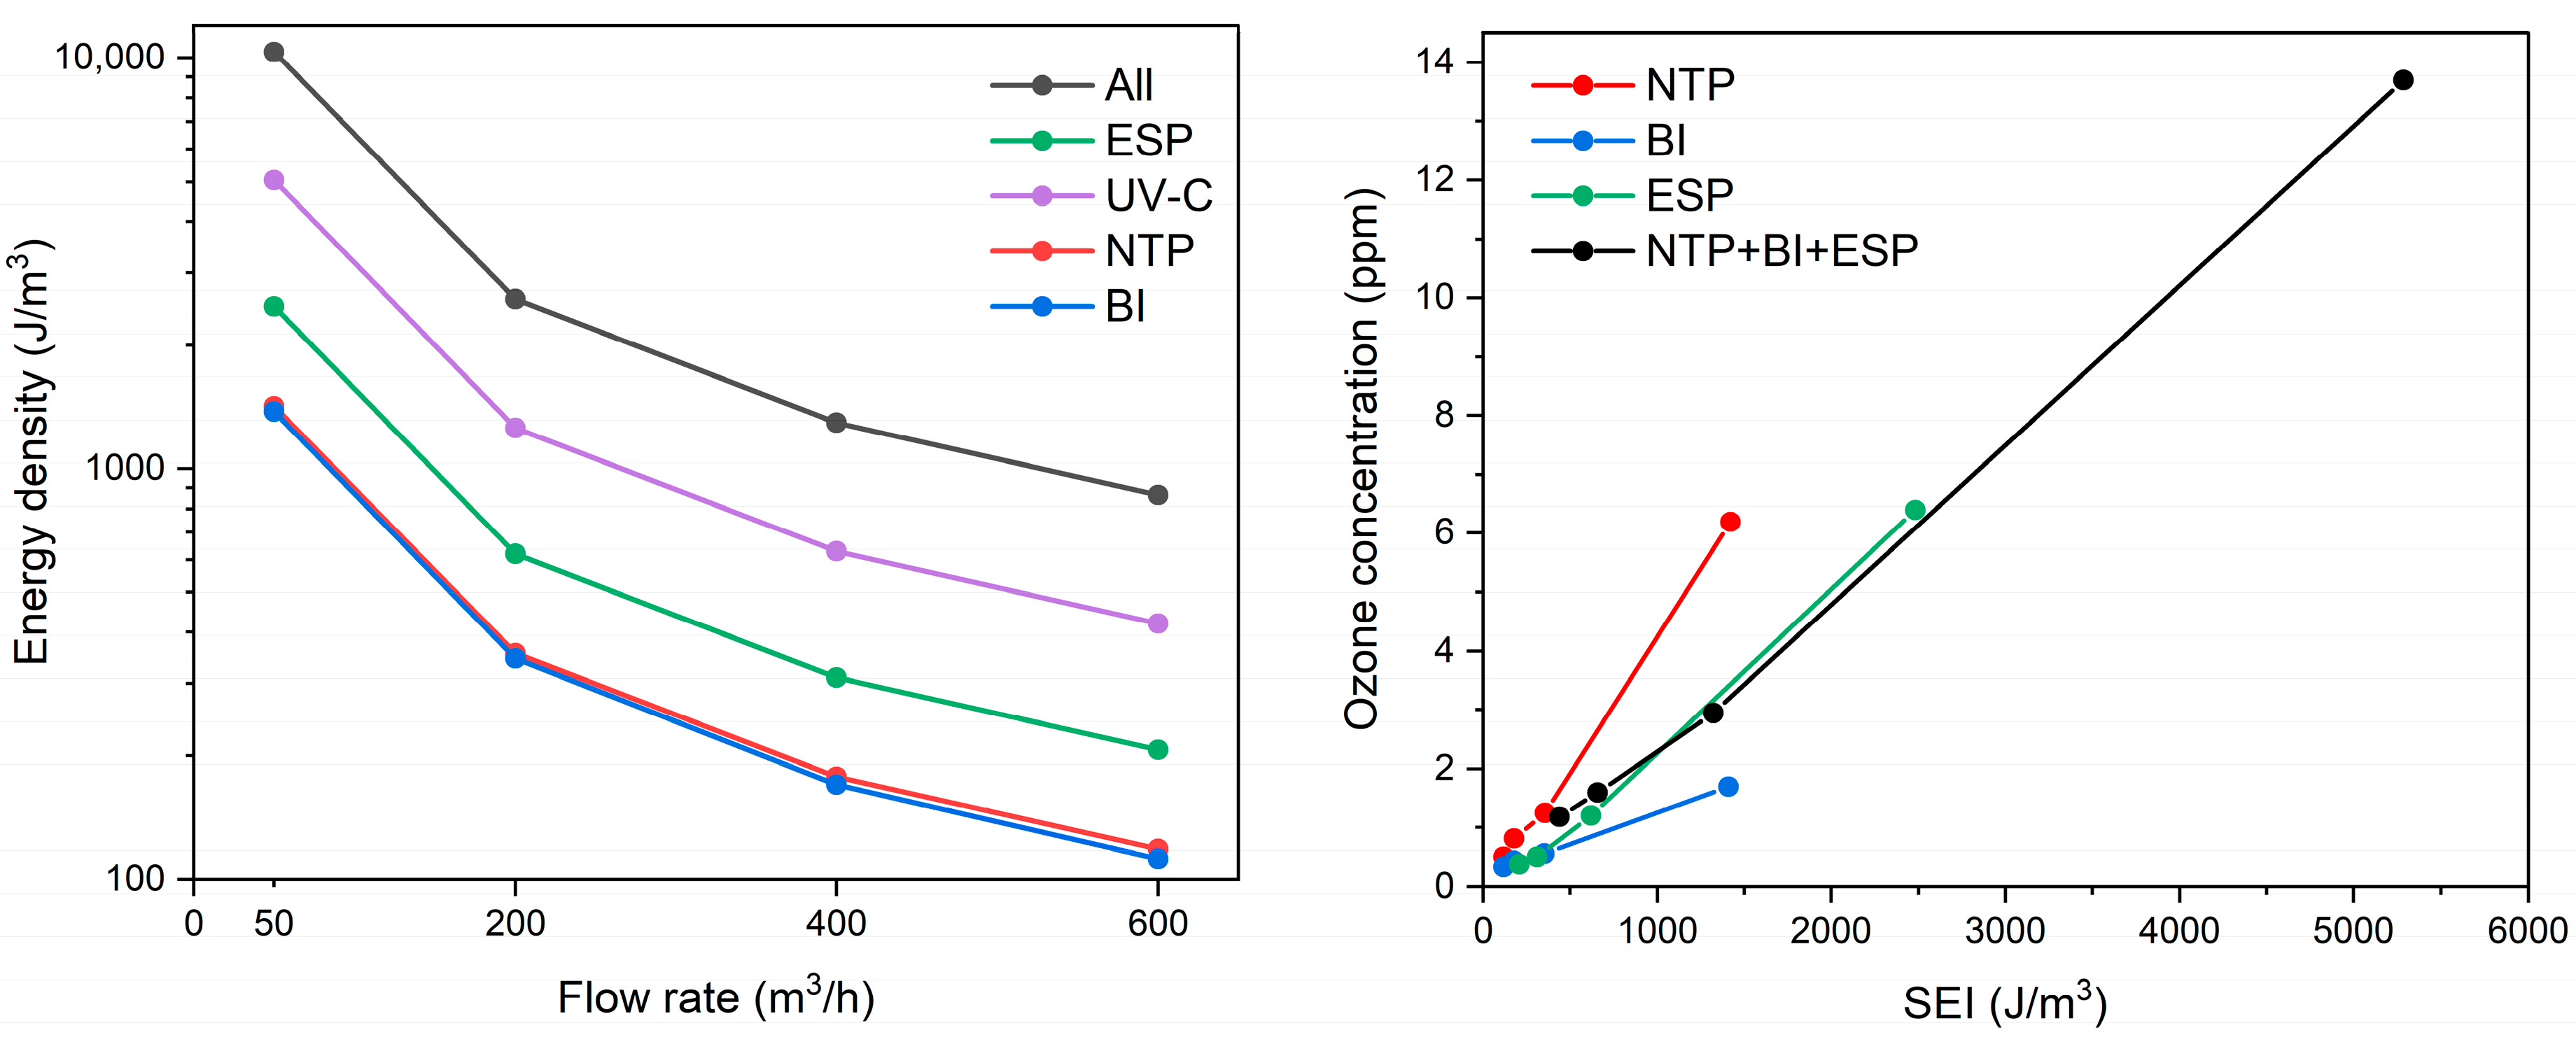
The energy density is adversely proportional to the flow rate as determined by the rational function, thus the lowest flow rate results in the highest energy input to the treated air (Figure 2, left). For example, an airflow of 50 m3/h through the system resulted in energy densities of approx. 1400 J/m3 for the NTP and BI stages, and up to 5000 J/m3 for the UV-C stage. The photolysis stage was the most powerful, providing some 3–4 times higher energy as compared to NTP and BI across all flow rate ranges. The current setup utilized mercury-based lamps that are energy-demanding, although they provided superior germicidal properties for both air and water disinfection. The irradiance at the quartz cylinder shell surface was 27.5 mW/cm2; however, actual irradiance varies depending on the distance from the UV-C lamp and the relative positioning of the lamps, which may affect uniformity of microbial exposure. The replacement with an LED-based UV-C emitter may be considered in the future. The NTP and BI stages exhibited similar energy densities, with the NTP stage providing higher energy by 0.9–9.8 J/m3, depending on the airflow rate. With increasing specific energy input, ozone generation also increased, particularly in the NTP and ESP stages (Figure 2, right). The NTP stage exhibited the most pronounced rise in ozone concentration, emitting up to 6.2 ppm at an SEI of 1422 J/m3 (corresponding to 50 m3/h). The ESP stage, while not designed for oxidation, produced a slightly higher ozone level of 6.4 ppm but at a significantly higher SEI of 2484 J/m3, indicating lower ozone generation efficiency per unit of energy input. In contrast, the BI stage generated considerably less ozone, peaking at 1.7 ppm at an SEI of 1411 J/m3. The UV-C stage did not contribute to ozone formation. When all stages were operated simultaneously, the total ozone concentration reached 13.7 ppm at the highest cumulative SEI of 5286 J/m3. These results demonstrate that ozone generation is strongly correlated with energy density and should be considered as part of the energy performance profile of ionization-based air treatment systems.
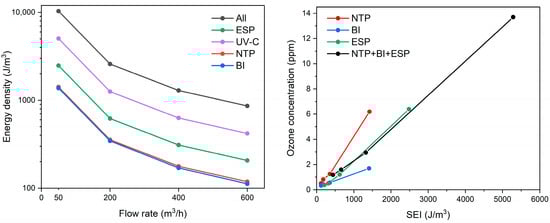
Figure 2.
The effect of airflow rate on the energy density (left) and energy density effect on emitted ozone concentration (right) at various air cleaning device stages (“All” represents the sum of energy densities from all subsequent stages operating together).
3.2. The Removal of Particulate Matter in Various Stages
3.2.1. Particle Losses Due to Non-Ionization-Related Effects
The presented air cleaner was designed for the conversion of VOCs to particles (“gas-to-particles”) and subsequent removal of both particles originally present in air and those newly formed from VOCs [15,16]. The collection of particles is meant to occur in the final ESP stage. The preceding stages of ionization (NTP, BI, UV-C) are not designed to remove particles but to provide energy to organic molecules to nucleate. Nevertheless, due to aerodynamic obstacles and static electrical effects, these stages also result in particle collection or removal from the air stream, and that effect was investigated by passing NaCl aerosol through the system.
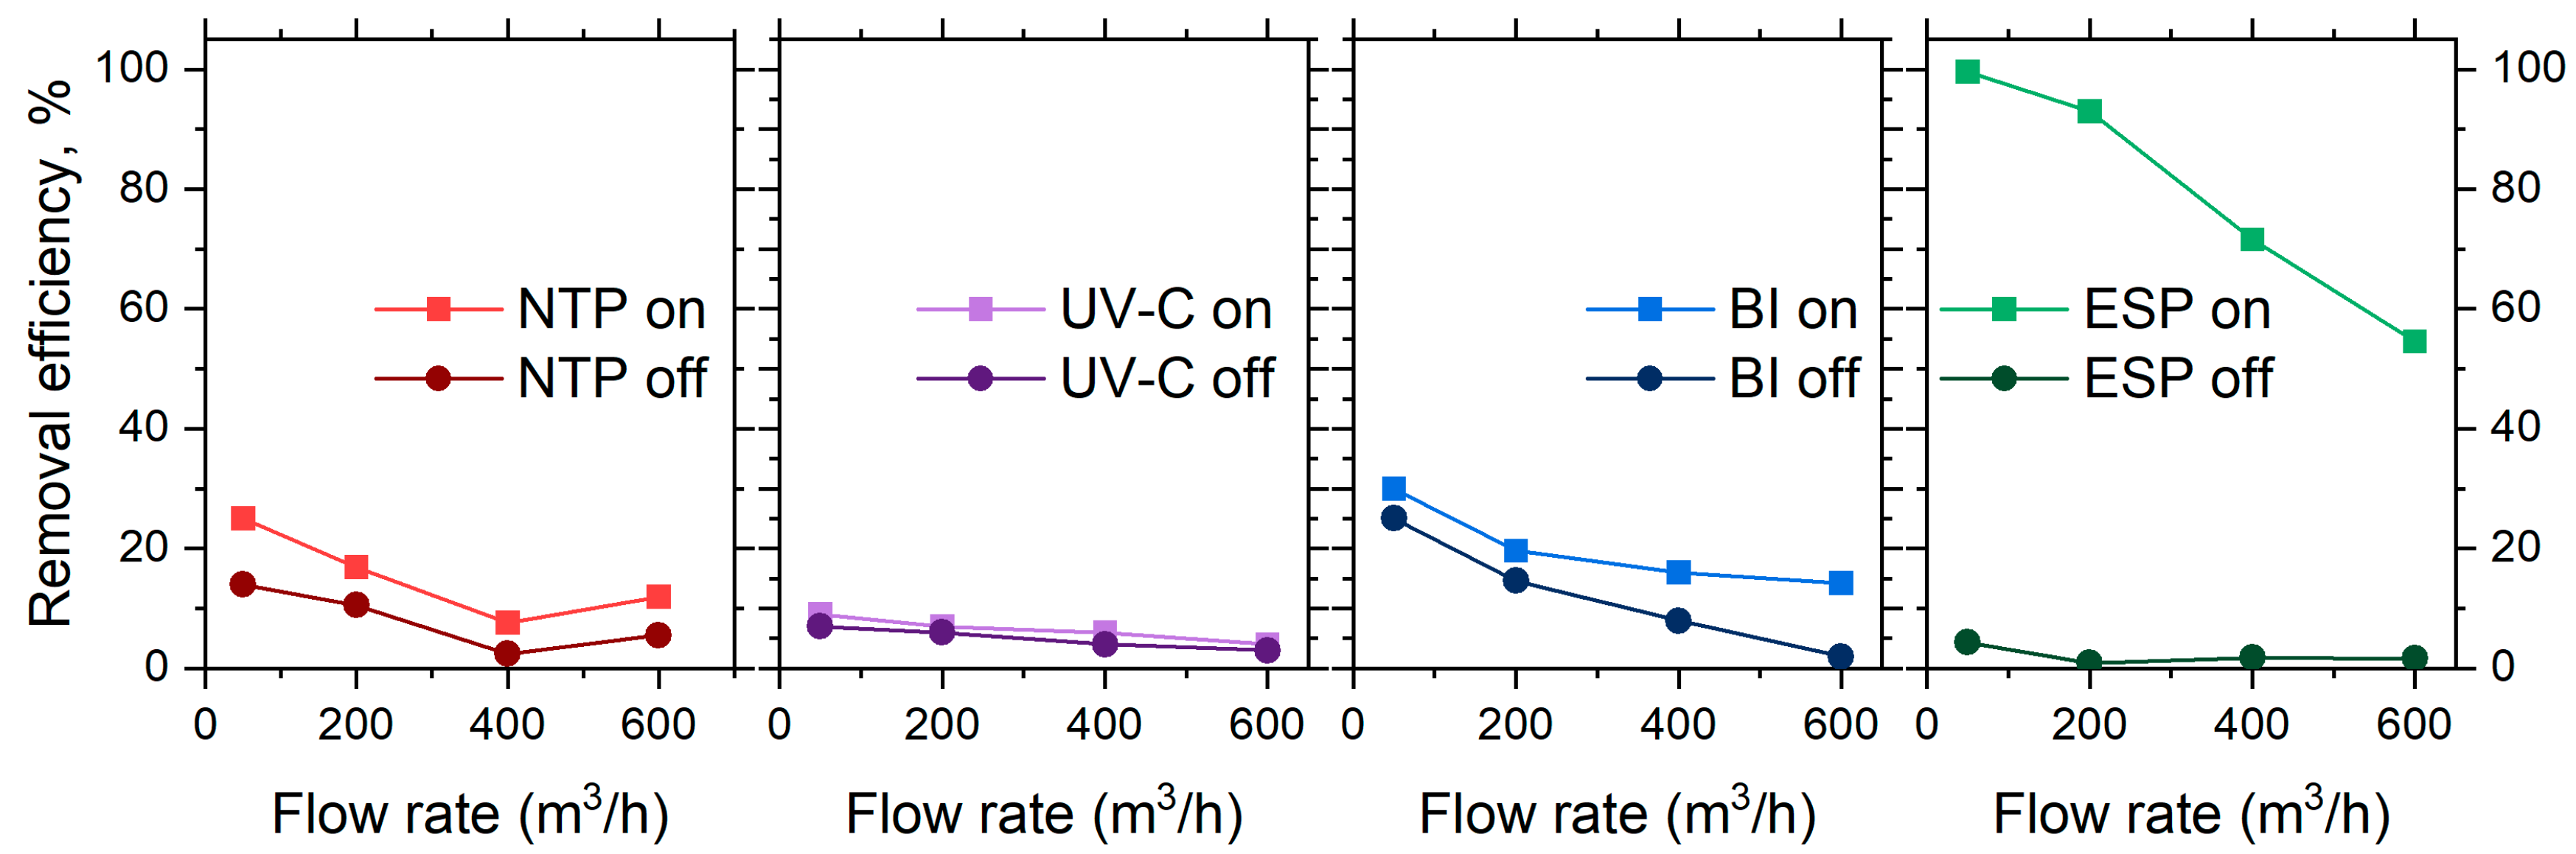
With the stages switched off, particle losses in separate stages were up to 25% at the lowest flow rate of 50 m3/h (Figure 3). The higher particle losses observed at lower flow rates may be attributed to aerosol particle deposition on the walls of reactors and connecting channels. The governing effects may include diffusional losses or electrostatic effects [27,28,29]. Due to large channel geometries (20 cm in diameter), diffusional losses were unlikely. The reactor walls were made of polypropylene and thus may have accumulated static charge during aerosol transport. This in turn may have resulted in the channel walls acquiring a net charge, which then interacted with charged particles [30]. A slight increase in particle losses at a high flow rate (600 m3/h) may indicate the effects of enhanced turbulence, promoting additional particle transport towards obstacle surfaces. To minimize the impact of these losses on measurement accuracy, all subsequent bioaerosol measurements were conducted at the same sampling point, S3 (Figure 1).
Figure 3.
The removal efficiency of NaCl aerosol particles (based on the total particle number concentration reduction) of the air cleaner at tested flow rates, with separate stages operating individually.
3.2.2. Particle Losses Due to Ionization Effects
The introduced energy to each ionization stage resulted in increased particle losses, comparable to those that occurred without the ionization (Figure 3). Again, the low flow rate appeared as the key factor in providing energy for particle removal. The NTP and BI stages indirectly contribute to particle removal through charge modification and agglomeration. The particle charging process is typically described by two mechanisms: diffusion and field charging [31,32]. In the NTP, ionization occurs via corona discharge, creating a high concentration of low-energy ions within the reactor. This environment favors diffusion charging, where the random thermal motion of ions leads to a gradual transfer of charge onto aerosol particles [33]. At higher flow rates, the residence time of the aerosol particles within the reactor is reduced, with limited exposure to the corona discharge. As a result, aerosol particles entering the NTP stage at higher flow rates acquire less charge, which may limit the efficiency of subsequent removal mechanisms. Lower flow rates extend the residence time, enabling more extensive diffusion charging and thereby enhancing the overall effectiveness of the NTP process. At the same time, BI generates a balanced mix of positive and negative ions, also favoring diffusion charging as particles acquire charge through random thermal collisions. At lower flow rates, enhanced exposure to the ion-rich environment promotes more effective charging and particle coagulation.
3.2.3. Particle Collection in ESP
The ESP is specifically designed to capture particles by utilizing an external electric field to direct charged particles towards collection electrodes, therefore the main mechanism of this step is field charging [34]. Operating at lower flow rates reduces aerodynamic forces and prolongs the exposure of precharged particles to the applied field, maximizing the effect of the field charge and improving the overall performance of the ESP stage (nearly 99%, Figure 3 right). The residence time of air in the ESP stage ranged from approximately 12.83 s at 50 m3/h (0.05 m/s) to 1.07 s at 600 m3/h (0.58 m/s), which directly influenced the duration of exposure of aerosol particles to the electric field and contributed to the variation in collection efficiency across flow rates. Conversely, operating at higher flow rates poses a challenge for the ESP, as the aerodynamic drag of the particles increases and the shortened residence time in the electric field may not allow sufficient acceleration of the particle movement towards the electrodes. This leads to a reduction in collection efficiency to ca. 52%.
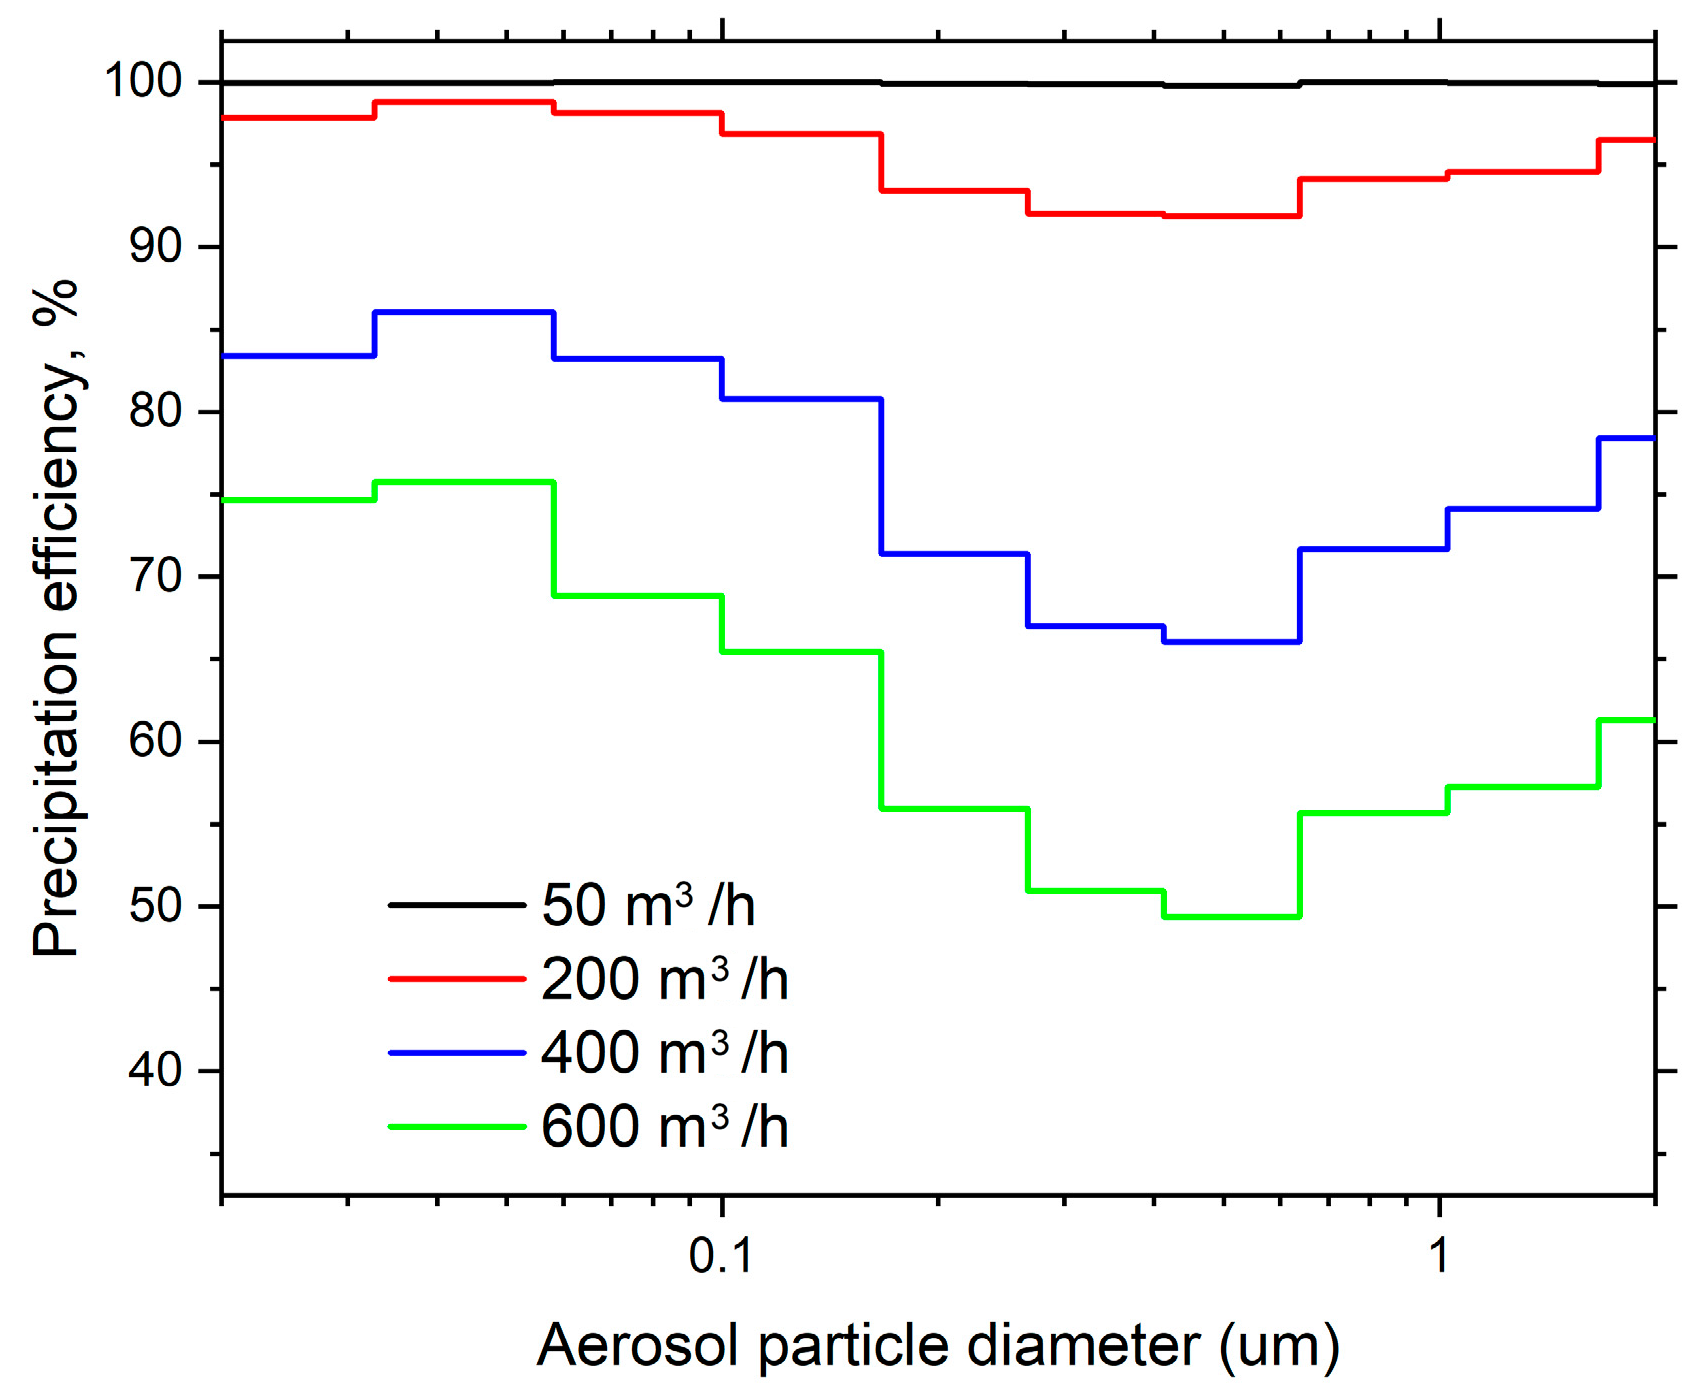
The ESP has a precipitation efficiency curve which is not uniform across all particle sizes (Figure 4). The lowest precipitation efficiency was observed at particle sizes of 0.5 µm, ranging from 99.8% at 50 m3/h to 49.4% at 600 m3/h. The initial decline in precipitation efficiency within the particle size range of 0.01–0.03 µm is attributed to the partial charging, which occurs due to a reduction in particle charge as the particle size decreases [35]. The subsequent decrease in precipitation efficiency, forming a “U” curve in the graph within the particle size range of 0.1–1 µm, is associated with a change in particle charging mechanisms, observed at a variety of applied voltages [36].
Figure 4.
The efficiency of the ESP stage in precipitating of polydisperse NaCl particles at different airflow rates.
3.3. Bacteria Inactivation Efficiency
3.3.1. The NTP Stage
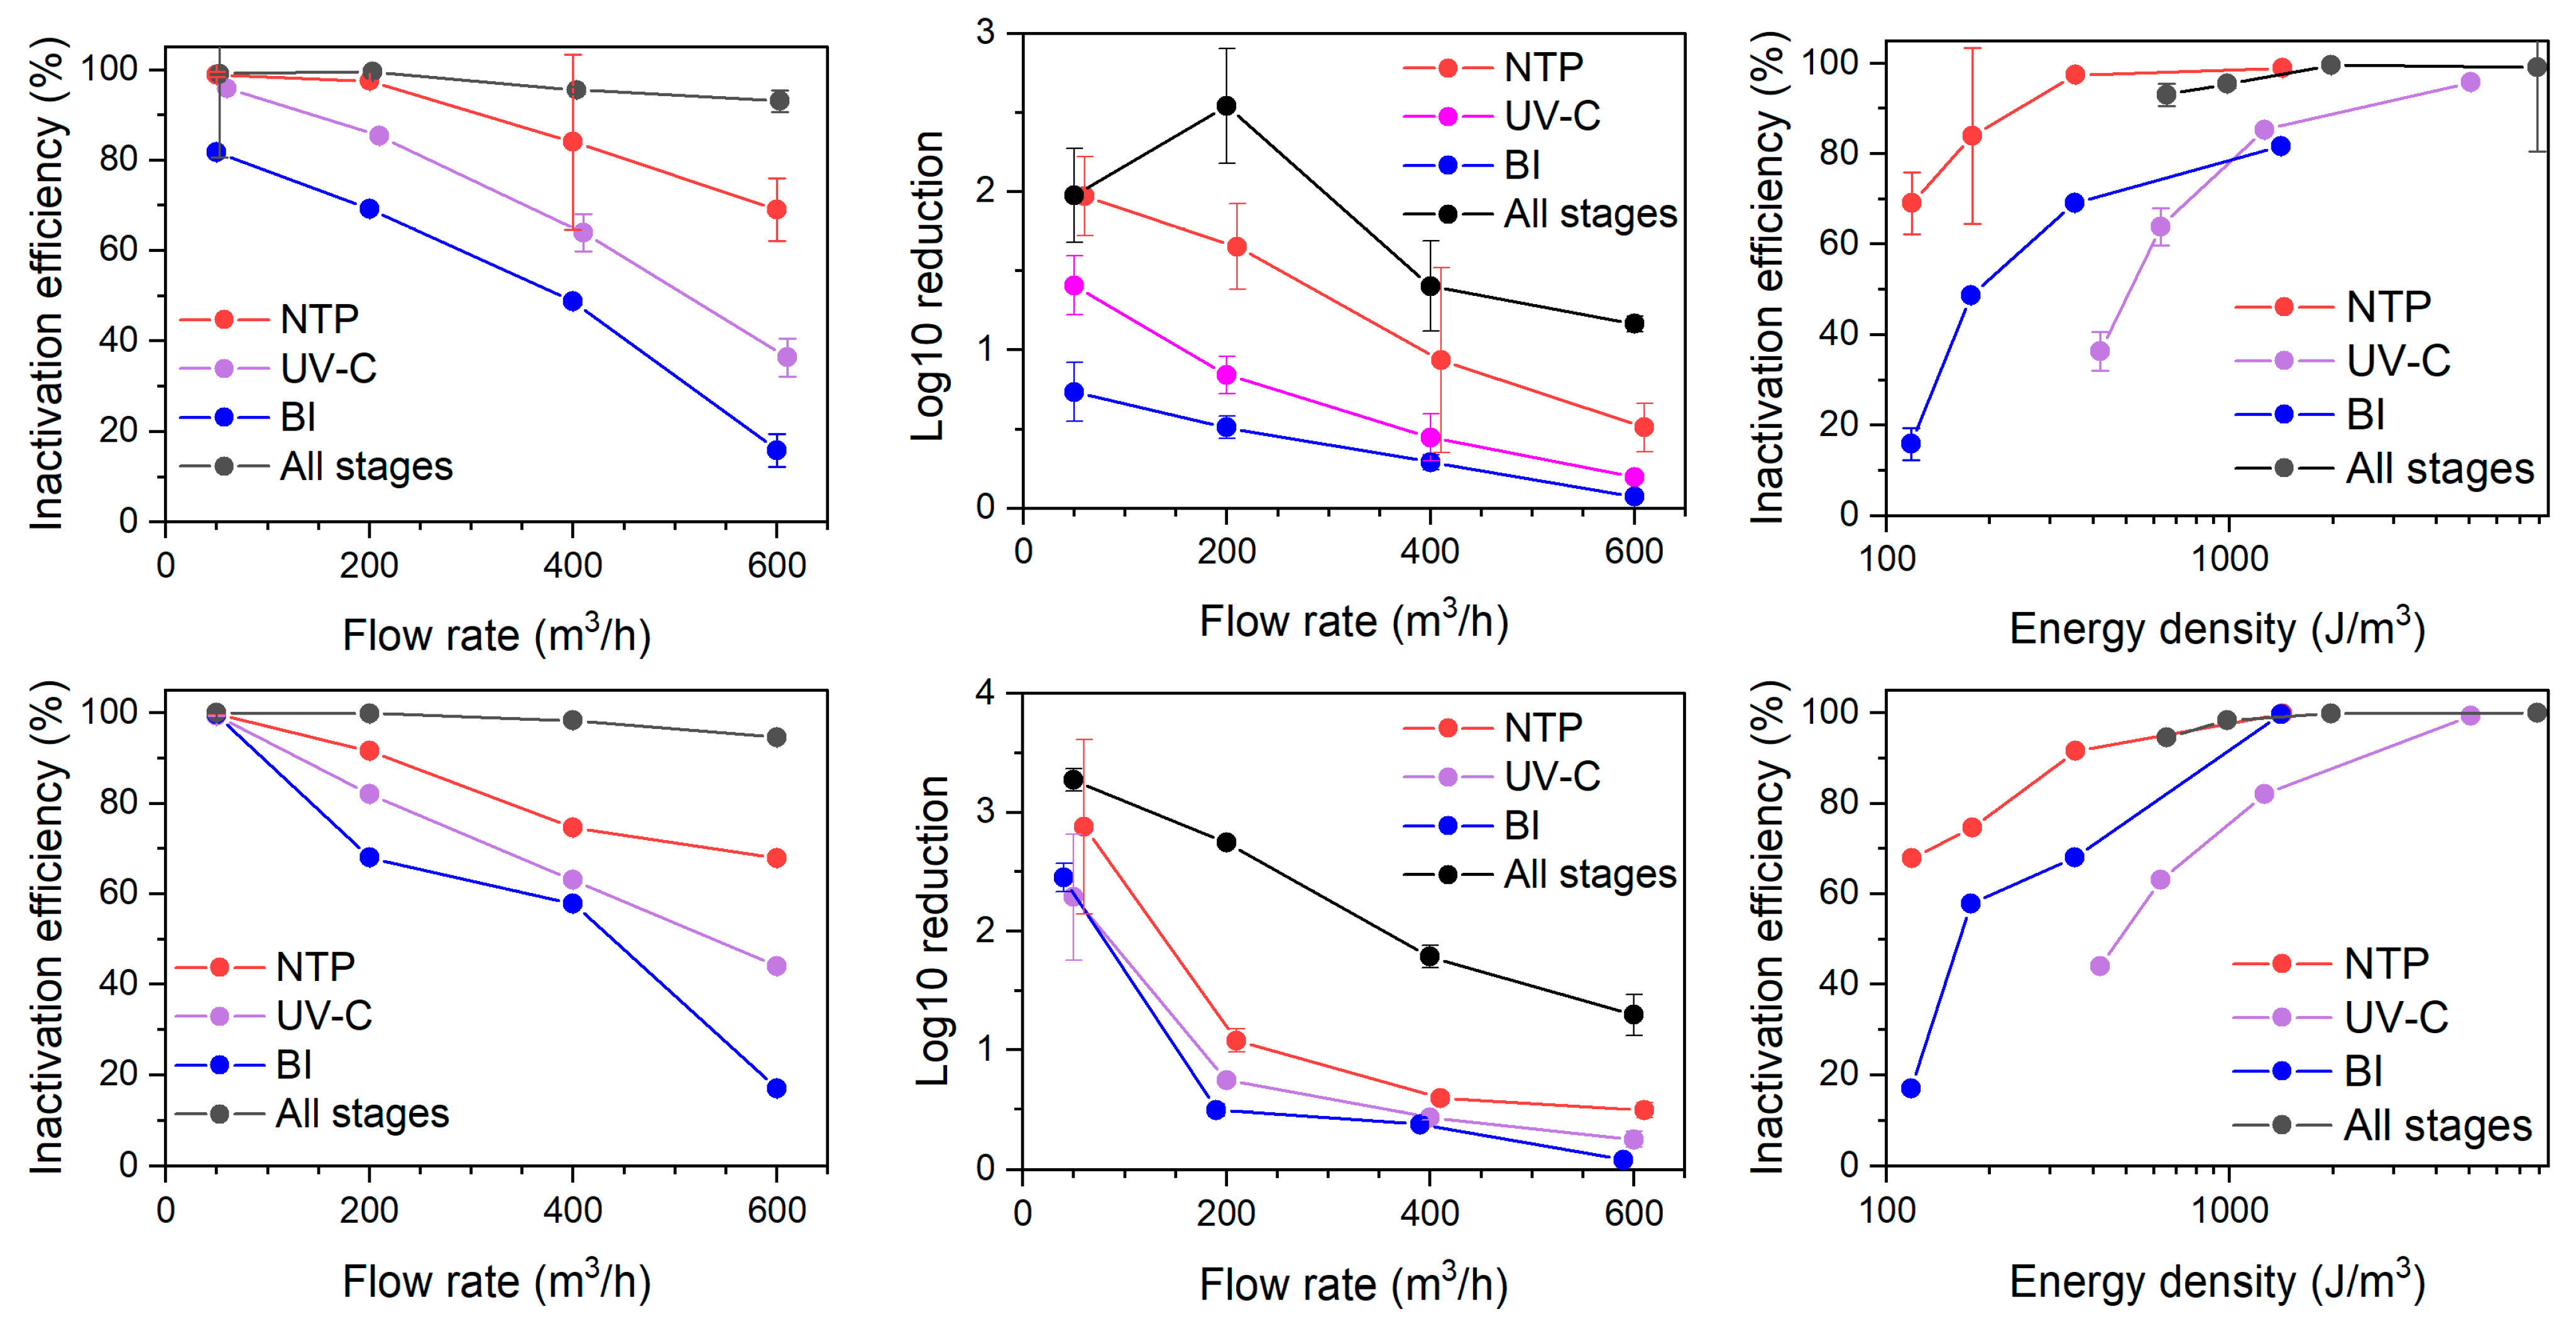
The NTP stage appeared the most efficient in the bacteria (both E. coli and L. casei) inactivation among the tested processes, reaching nearly 100% efficiency at 50 m3/h flow rate down to ca. 70% at 600 m3/h (Figure 5, upper). The differences between E. coli and L. casei were insignificant (p > 0.05 based on Mann–Whitney U test), suggesting that different type of cell wall composition did not result in different resistance to ionization-induced oxidation stress. The non-thermal plasma inactivates microorganisms by several concurrent processes. Firstly, the NTP produces UV light irradiation, which was shown to initiate the bacterial repair system triggered by DNA damage in Bacillus subtilis [37]. This mechanism is not expected to play a significant role, as the primary aim of the current system was not particle removal but rather initiating particle formation from VOCs using low-energy inputs. Thus, the UV irradiation was minimal. The reactive oxygen species (ROS) present in the NTP is another important factor, which was shown to cause membrane damage through lipid peroxidation caused by ROS and subsequent cell death [38]. The NTP may not necessarily lead to cell death, but bacteria can enter the viable but non-culturable state, where bacteria cells are still alive but are not able to grow on cultivation media [39].
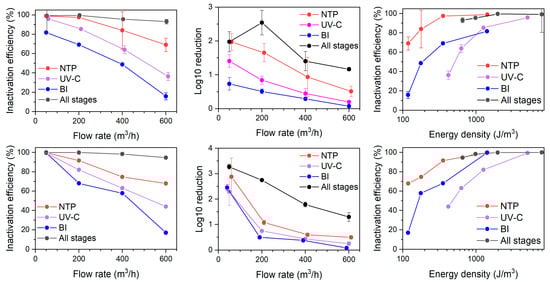
Figure 5.
The impact of flow rate and energy density on the inactivation efficiency of E. coli (upper) and L. casei (lower) with stages NTP, UV-C, and BI of air cleaner operating separately and together (All stages).
Another pathway to bacterial inactivation may be achieved via electrostatic disruption, such as physical destruction due to electrostatic pressure buildup caused by ion accumulation [40]. Electroporation, another plasma-induced mechanism, inactivates microorganisms by generating high electric field pulses. These pulses create pores in the cell membrane, destabilizing its structure. The mechanism involves a synergistic effect between the electric field and reactive species, such as oxygen, ozone, and hydroxyl radicals [41]. It must be noted that any of the ionization-related subsequent processes, such as BI or ESP, may cause electrostatic disruption or electroporation.
Aqueous-phase reactive species such as hydrogen peroxide (H2O2) and nitrate (NO3⁻) are commonly associated with non-thermal plasma in humid or liquid phase systems; however, their formation was unlikely in our experimental setup. The air relative humidity was maintained at 45 ± 5%, and no liquid water phase (e.g., condensate, films, or retained aerosols) was present. Nebulized droplets rapidly evaporated in the flow path, limiting the potential for plasma–liquid interactions. Previous studies confirm that H2O2 and NO3⁻ are primarily generated during sustained plasma contact with liquid water or aerosols [42]. Furthermore, the transfer of short-lived reactive species such as OH• into droplets is severely restricted under dry conditions due to transport limitations and rapid recombination [43]. Therefore, the observed bacterial inactivation in the NTP stage is most plausibly attributed to gas phase species, especially O3 and OH•, which are known to be highly effective under low-humidity, single-pass plasma exposure.
Table 2 compares the performance of the NTP stage for bacterial deactivation in this study a with results reported in previous studies. Bacterial inactivation in NTP systems is strongly influenced by the specific energy input (SEI) and flow rate/residence time. In low-SEI systems (0.01–0.05 J/L) and short residence times (0.04–0.14 s), bacterial reduction is generally limited, with reported inactivation efficiencies ranging from 31–70% for E. coli, 20–62% for Staphylococcus epidermidis, and negligible effects on Micrococcus luteus and Serratia marcescens [44]. This study demonstrated that a longer exposure time of 0.11–1.27 s and higher-SEI conditions (0.12–1.42 J/L) lead to significantly higher inactivation rates, reaching 67.95–99.84% for E. coli and L. casei. NTP systems incorporating ionic wind maintain shorter exposure times (0.07 s) and moderate SEI values (0.2–5.4 J/L) yet enhance bacterial inactivation, achieving 70–90% reduction in E. coli [45]. However, at increased airflow velocities (1.8–4.5 m/s), the effect of ionic wind becomes negligible, highlighting the trade-off between flow rate and residence time [46], while inactivation efficiency drops to 10–25%, despite higher O3 generation (10 ppm). Systems with extended exposure times (0.12–0.18 s) and very high SEI values (115.2–1723 J/L) consistently achieve complete bacterial inactivation [47,48].
Table 2.
Comparison of bacterial inactivation studies using the NTP.
3.3.2. The UV-C Stage
The UV-C stage emerged as the second most effective stage in bacteria inactivation, reaching 96% (E. coli) to 99% (L. casei) efficiency at a low flow rate, and diminishing to 36% to 44% at the highest flow rate (Figure 5). UV-C treatment resulted in a similar inactivation efficiency between L. casei and E. coli (p > 0.05 based on Mann–Whitney U test). Compared to the NTP stage, the efficiency drop was faster with increasing flow rate. Although UV-C is utilized in bacteria inactivating air cleaners, the configuration of UV lamps in the presented setup was not specifically designed for maximizing the dosage for bacterial inactivation.
The effectiveness of UV inactivation is well established and depends on both the wavelength and the dose of exposure metabolism. UV photons strike molecules like DNA and RNA and cause dimerization of bases, particularly thymine and cytosine, disrupting replication and transcription and preventing the microorganisms from functioning and reproducing [49].
Bacterial inactivation in single-pass UV-C systems strongly depends on the SEI. In the present study, SEI values ranged from 0.42 to 5.04 J/L, resulting in 36.4–95.9% inactivation for E. coli and 44.0–99.3% for L. casei. Compared to previous studies (Table 3), the higher SEI range in this experiment correlated with higher inactivation efficiency but required longer exposure times. Similar inactivation levels to those observed in the current study were reported by Snelling et al. [50], where Staphylococcus aureus achieved 61.1–99.998% inactivation at SEI values between 2.63 and 13.16 J/L. These results were obtained with an exposure time 4.5 times shorter than that used in the present study. When comparing similar residence times (0.21 s in the present study vs. 0.29 s in Snelling et al. [50]), the current study exhibited 17.07% lower efficiency for L. casei and 24.74% lower for E. coli, indicating a dependency on both SEI and exposure time.
Table 3.
Comparison of UV-C-irradiation-based bacterial inactivation studies.
At lower SEI values (0.04–0.08 J/L), inactivation efficiencies remained moderate to high, with reported reductions of 81–99.9% for Serratia marcescens, 98–99.8% for Pseudomonas alcaligenes, 99–99.6% for E. coli, 77–99.5% for Salmonella enterica, and 76.1–99.7% for Staphylococcus epidermidis [51]. These results were achieved using a single 10 W twin-tube mercury-based UV lamp and a relatively short exposure time (0.23–0.47 s), demonstrating the effectiveness of even low SEI when paired with appropriate UV intensity and exposure conditions.
At the highest reported SEI values (0.19–7.14 J/L), H. Zhang and Lai [52] compared two UV sources—mercury-based 254 nm and Kr-Cl excimer 222 nm lamps. This study revealed 22–68% inactivation efficiency for different bacterial species, with 49.88% lower efficiency compared to the present study at similar SEI values. However, H. Zhang and Lai’s [52] system input energy was half that of the present study, and the exposure time was 1.54 s shorter, suggesting that both residence time and total energy input influence bioaerosol inactivation efficiency.
3.3.3. BI Stage
The BI stage has resulted in the lowest bacteria inactivation efficiency among the tested technologies, ranging from 99.6% at 50 m3/h to 17.0% at 600 m3/h for L. casei and from 81.71% to 15.85% for E. coli at respective flow rates. An observable difference (Figure 5, upper) between the tested bacteria emerged at a low flow rate, potentially indicating a threshold of energy difference required for inactivation of Gram-positive vs. Gram-negative species. On the other hand, across all tested flow rates, the difference was again statistically insignificant (p > 0.05 based on Mann–Whitney U test).
The bacteria inactivation mechanism by the BI process is not clearly established [53,54] but is expected to be attributed to the exclusive or combined effects of charged particles, ions, and oxygen-containing radicals, UV-C, and localized heating events [54]. The primary aim of ionization is the agglomeration of charged particles, producing a larger agglomerate resulting in increased depositional loss rate [55].
The effectiveness of BI in bacterial inactivation is strongly influenced by exposure time. Longer exposure durations generally enhance inactivation efficiency, as observed in Lee et al. [56], where Staphylococcus epidermidis was inactivated by 85% at a 2 s exposure time. However, reducing the exposure to 0.2 s lowered efficiency to 50%, demonstrating the significant role of ion interaction time in bacterial removal. The present study supports this trend, achieving 15.9–81.7% E. coli inactivation and 17.0–99.6% for L. casei at exposure times ranging from 0.31 to 3.71 s. The extended residence time in the ionized air environment contributed to higher inactivation efficiency, aligning with previous findings.
Zhou et al. [57] also demonstrated exposure time dependence for Serratia marcescens and Staphylococcus epidermidis in an air duct system. For S. marcescens, the maximum inactivation efficiency was 31.53% at an inlet velocity of 3.0 m/s (0.3 s exposure), which decreased to 17.1% at higher velocities. Similarly, S. epidermidis showed a peak of inactivation efficiency of 12.17%, declining at increased airflow rates. These findings align with the trend observed in the present study, where prolonged exposure times correlated with increased bacterial removal.
Higher airflow velocities negatively affect bacterial inactivation efficiency by reducing exposure time and limiting ion–particle interactions. Nunayon et al. [58] demonstrated this effect for E. coli, where increasing air velocity from 3.0 to 6.5 m/s decreased inactivation efficiency from 88.5% to 44.0% at an exposure time of 0.3 s. Similarly, Zhou et al. [57] reported inactivation efficiency declines with increased airflow, further confirming that residence time in the ionized environment is a critical factor for maximizing bacterial removal.
Ion polarity also influences inactivation efficiency. Nunayon et al. [58] found that positive ionizers were 29–41% more effective than negative ionizers, with E. coli inactivation rates ranging from 44.03–88.54% for positive ionization and 35.37–62.85% for negative ionization at comparable exposure times (0.14–0.3 s). This suggests that positive ionization facilitates more effective charge transfer and oxidative stress, improving bacterial inactivation. This enhanced efficacy is attributed to the net negative charge of bacterial cell surfaces, which attracts positively charged ions and promotes stronger electrostatic interactions. These interactions increase the likelihood of cell membrane disruption and oxidative damage. In contrast, negative ions may be repelled by the similarly charged bacterial surfaces, reducing their impact.
Although BI can produce O3 as a byproduct, the studies reviewed (Table 4) indicate that O3 is not the primary factor in bacterial inactivation. The present study operated within an O3 emission range of 0.33–1.7 ppm, achieving up to 99.6% inactivation of L. casei. However, Lee et al. [56] reported 50–85% inactivation efficiency of S. epidermidis at significantly lower O3 levels (<0.025 ppm), and Nunayon et al. [58] observed up to 88.5% E. coli inactivation efficiency at an O3 concentration of only 0.0007 ppm. Similarly, Zhou et al. [57] reported 17.1–31.53% S. marcescens inactivation efficiency with 0.068 ppm O3 emission. These results confirm that ozone is not the dominant mechanism for bacterial inactivation in BI. Instead, ion-induced electrostatic disruption of bacterial membranes [56,58] and the generation of reactive species such as hydroxyl radicals that damage cellular components [56,57] contribute significantly to microbial inactivation. Thus, optimized ion generation can achieve high inactivation efficiency without excessive O3 production.
Table 4.
Comparison of ionization-based bacterial inactivation studies.
3.3.4. Combined Air Cleaner Stages
When all stages are switched on at once, inactivation efficiencies for both L. casei and E. coli achieved nearly complete inactivation at 50 m3/h (Figure 5). At 600 m3/h, the single-pass inactivation efficiency remained reasonably high at 94.6% for L. casei and 93.1% for E. coli.
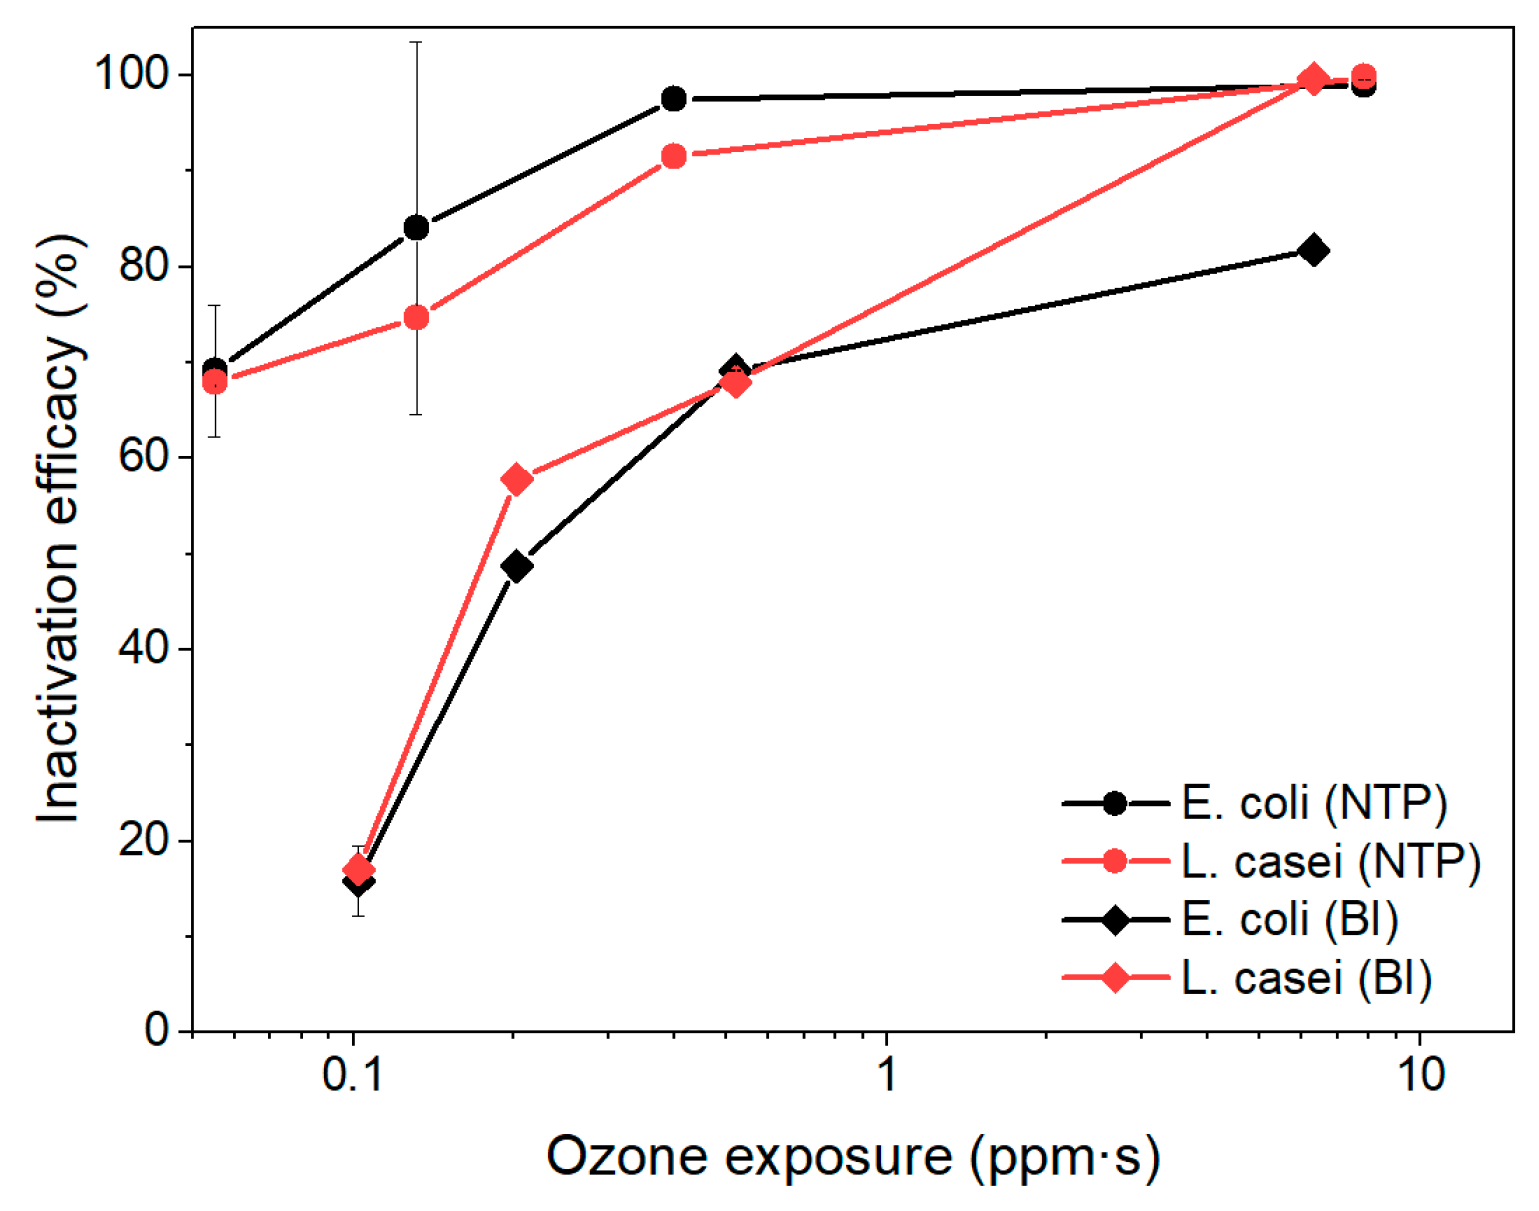
To further assess the contribution of ozone to microbial inactivation, we evaluated the relationship between cumulative ozone exposure and inactivation efficiency for the NTP and BI stages (Figure 6). The results revealed that, in both stages, bacterial inactivation generally increased with greater ozone exposure. However, L. casei exhibited higher sensitivity to ozone than E. coli, particularly under bipolar ionization, achieving >99% inactivation at 6.3 ppm·s compared to 81.7% for E. coli. At lower ozone exposure levels (<1 ppm·s), both bacterial strains showed significantly reduced inactivation efficiencies, confirming that ozone contributes meaningfully but is not solely responsible for microbial inactivation. These findings highlight the complementary roles of reactive species, ionization effects, and residence time in achieving effective bioaerosol control.
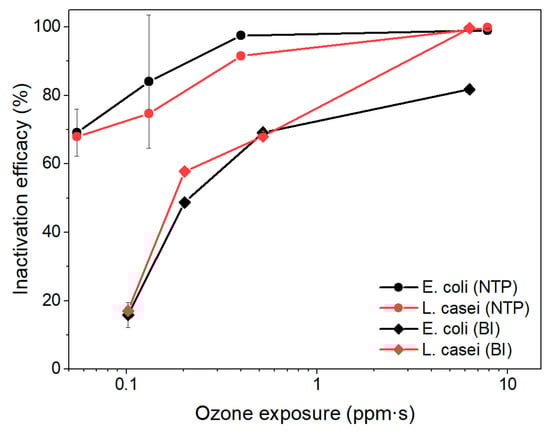
Figure 6.
The impact of ozone exposure to the inactivation efficiency of E. coli and L. casei.
An overview of earlier studies on synergetic effects of different air disinfection devices is presented in Table 5. Nunayon et al. [18] demonstrated that the combination of UV-C light and air ions significantly enhances bacterial disinfection compared to the use of either method alone. For E. coli and S. typhimurium, the combination of negative ions and UV-C light resulted in the highest disinfection efficiencies, achieving reductions of 90.8% and 76.2%, respectively. In contrast, for S. epidermidis, the pairing of positive ions with UV-C light was more effective, achieving an 82.9% disinfection efficiency. These findings emphasize the synergistic effects of air ions combined with UV-C light, with negative ions being particularly effective against Gram-negative bacteria, while positive ions perform better against Gram-positive bacteria. Similarly, Xie et al. [19] demonstrated that combining UV irradiation with microstatic electricity significantly improved air disinfection efficiency in HVAC systems. UV254 alone achieved over 99% disinfection efficiency for S. albus at high temperatures and low airflow rates, but performance declined under lower temperatures and higher airflow rates. The addition of microstatic electricity to UV254 improved disinfection, particularly for B. subtilis var. niger, increasing inactivation efficiency from 52.9% to 82% at 16 °C and 2.4 m/s airflow. The use of UV185+254 further increased efficiency to 93.1%, and this combined method also reduced energy consumption and pressure drop, providing a cost-effective solution for HVAC air disinfection. K. P. Yu et al. [20] assessed the removal of bioaerosols, including E. coli, Candida famata, and λ vir phage, using a combination of negative air ionization and photocatalytic oxidation under varying humidity conditions. The combined method was the most effective, achieving removal efficiencies of up to 90.3% for λ vir phage and 36.4% for E. coli. Negative air ionization alone was less effective, with E. coli removal rates ranging from 17.5% to 24.5% and those of Candida famata from 21.6% to 29.7%. Higher humidity improved the inactivation efficiency of both negative air ionization and photocatalytic oxidation by enhancing the production of reactive species. λ vir phage, due to its smaller size and simpler structure, had the highest removal rate and greater durability in the treatment system. Lu et al. [59] demonstrated that the combination of far-UV-C (222-nm) and negative air ions effectively inactivated aerosolized bacteria and viruses, with a significant synergistic effect for bacteria. For E. coli and S. epidermidis, the combined treatment resulted in a 37–116% increase in disinfection efficiency compared to individual treatments. In contrast, viruses such as bacteriophage P22 and Phi 6 were more susceptible to far-UV-C alone, with no notable synergistic effect when combined with negative air ions.
Table 5.
Comparison of combined technologies in bacterial inactivation studies.
After all disinfection stages, most of the remaining aerosol particles, including inactive bacteria, are expected to be collected by the ESP. The inactivation efficiency of this stage in removing particles was demonstrated in experiments using NaCl aerosol, as well as in earlier studies focused on VOC removal [15,16]. However, the addition of the ESP increased total O3 concentrations to 13.7, 2.95, 1.6, and 1.18 ppm (by 6.4, 1.21, 0.5, and 0.38 ppm) at flow rates of 50, 200, 400, and 600 m3/h, respectively. The O3 catalytic destruction unit achieved over 99% efficiency in O3 decomposition, reducing O3 levels to 0.096, 0.021, 0.011, and 0.008 ppm (191.57, 41.91, 21.95, and 15.96 µg/m3). Considering the WHO guideline value of 100 µg/m3 as the maximum allowable 8 h mean ozone concentration, and the EU limit for human health of 120 µg/m3 (maximum daily 8 h mean), the system can achieve over 99.6% bacterial inactivation efficiency for the tested microorganisms without exceeding these ozone limits.
Although NO2 concentrations were not measured in the present study, they were evaluated using the same prototype system in a previous investigation. That study demonstrated that residual NO2 levels in the treated air were consistently below 0.045 mg/m3 (0.02 ppm), significantly under the 8 h occupational exposure limit of 0.955 mg/m3 (0.5 ppm) established by SCOEL (2014) [16]. These findings suggest that, under similar low-specific-energy operating conditions (SEI < 20 J/L), the full system does not generate NOx concentrations of concern.
4. Conclusions
This study investigated the bioaerosol inactivation efficiency of a multi-stage air cleaning device across different airflow rates. L. casei and E. coli, the two tested bacterial species, were inactivated with efficiencies ranging from complete inactivation to 99.19% at a flow rate of 50 m3/h. The inactivation efficiency of the air cleaning device decreased with higher airflow rates (such as 94.6% for L. casei and 93.07 for E. coli at 600 m3/h), attributed to reduced specific energy density. The non-thermal plasma stage was the most effective, while UV-C demonstrated lower effectiveness, and bipolar ionization showed the lowest inactivation efficiency. The tested multi-stage air cleaning prototype, equipped with an ozone decomposition unit, maintained low ozone emissions, while achieving >99.6% inactivation efficiency for E. coli and L. casei. The final stage of the electrostatic precipitator captured particles including inactivated bacteria, thereby minimizing the risk of reintroducing inactive microorganisms into indoor air. This technological sequence not only provides removal of VOCs via a gas-to-particle process but also provides an efficient reduction of bioaerosol particles in indoor environments.
Author Contributions
Conceptualization, D.M.; Data curation, J.M., D.Č., E.K., M.T., T.P. and D.M.; Formal analysis, E.K. and D.M.; Investigation, J.M. and T.P.; Methodology, J.M.; Supervision, D.M.; Validation, D.Č. and M.T.; Visualization, J.M.; Writing—original draft, J.M.; Writing—review and editing, E.K. and D.M. All authors have read and agreed to the published version of the manuscript.
Funding
This research received no external funding.
Institutional Review Board Statement
Not applicable.
Informed Consent Statement
Not applicable.
Data Availability Statement
The raw data supporting the conclusions of this article will be made available by the authors on request.
Conflicts of Interest
The authors declare no conflicts of interest.
References
- Chuang, C.Y.; Hsu, Y.F.; Hung, P.C.; Dai, Y.T.; Yang, S. Evaluation of the Inactivating Ability of Carbon-Nanotube Coated Plasma Treatment on Bioaerosols for Indoor Air Cleaning. Coatings 2022, 12, 1497. [Google Scholar] [CrossRef]
- Klepeis, N.E.; Nelson, W.C.; Ott, W.R.; Robinson, J.P.; Tsang, A.M.; Switzer, P.; Behar, J.V.; Hern, S.C.; Engelmann, W.H. The National Human Activity Pattern Survey (NHAPS): A Resource for Assessing Exposure to Environmental Pollutants. J. Expo. Anal. Environ. Epidemiol. 2001, 11, 231–252. [Google Scholar] [CrossRef] [PubMed]
- Bragoszewska, E.; Bogacka, M.; Pikoń, K. Efficiency and Eco-Costs of Air Purifiers in Terms of Improving Microbiological Indoor Air Quality in Dwellings-A Case Study. Atmosphere 2019, 10, 742. [Google Scholar] [CrossRef]
- González-Martín, J.; Kraakman, N.J.R.; Pérez, C.; Lebrero, R.; Muñoz, R. A State–of–the-Art Review on Indoor Air Pollution and Strategies for Indoor Air Pollution Control. Chemosphere 2021, 262, 128376. [Google Scholar] [CrossRef]
- Luengas, A.; Barona, A.; Hort, C.; Gallastegui, G.; Platel, V.; Elias, A. A Review of Indoor Air Treatment Technologies. Rev. Environ. Sci. Biotechnol. 2015, 14, 499–522. [Google Scholar] [CrossRef]
- Ratliff, K.M.; Oudejans, L.; Archer, J.; Calfee, W.; Gilberry, J.U.; Hook, D.A.; Schoppman, W.E.; Yaga, R.W.; Brooks, L.; Ryan, S. Large-Scale Evaluation of Microorganism Inactivation by Bipolar Ionization and Photocatalytic Devices. Build. Environ. 2023, 227, 109804. [Google Scholar] [CrossRef]
- Kanesaka, I.; Katsuse, A.K.; Takahashi, H.; Kobayashi, I. Evaluation of a Bipolar Ionization Device in Inactivation of Antimicrobial-Resistant Bacteria, Yeast, Aspergillus Spp. and Human Coronavirus. J. Hosp. Infect. 2022, 126, 16–20. [Google Scholar] [CrossRef]
- Szczotko, M.; Orych, I.; Mąka, Ł.; Solecka, J. A Review of Selected Types of Indoor Air Purifiers in Terms of Microbial Air Contamination Reduction. Atmosphere 2022, 13, 800. [Google Scholar] [CrossRef]
- Schiavon, M.; Torretta, V.; Casazza, A.; Ragazzi, M. Non-Thermal Plasma as an Innovative Option for the Abatement of Volatile Organic Compounds: A Review. Water Air Soil. Pollut. 2017, 228, 388. [Google Scholar] [CrossRef]
- Mata, T.M.; Martins, A.A.; Calheiros, C.S.C.; Villanueva, F.; Alonso-Cuevilla, N.P.; Gabriel, M.F.; Silva, G.V. Indoor Air Quality: A Review of Cleaning Technologies. Environments 2022, 9, 118. [Google Scholar] [CrossRef]
- Kim, D.-K.; Kang, D.-H. UVC LED Irradiation Effectively Inactivates Aerosolized Viruses, Bacteria, and Fungi in a Chamber-Type Air Disinfection System. Appl. Environ. Microbiol. 2018, 84, e00944-18. [Google Scholar] [CrossRef]
- Watanabe, K.; Yanagi, U.; Shiraishi, Y.; Harada, K.; Ogino, F.; Asano, K. Bacterial Communities in Various Parts of Air-Conditioning Units in 17 Japanese Houses. Microorganisms 2022, 10, 2246. [Google Scholar] [CrossRef]
- Ciuzas, D.; Prasauskas, T.; Krugly, E.; Jurelionis, A.; Seduikyte, L.; Martuzevicius, D. Indoor Air Quality Management by Combined Ventilation and Air Cleaning: An Experimental Study. Aerosol Air Qual. Res. 2016, 16, 2550–2559. [Google Scholar] [CrossRef]
- Tao, S.; Zhu, Y.; Chen, C.; Liu, J.; Chen, M.; Shangguan, W. Removal of Air Pollutant by a Spike-Tubular Electrostatic Device: Multi-Stage Direct Current Corona Discharge Enhanced Electrostatic Precipitation and Oxidation Ability. Process Saf. Environ. Prot. 2022, 165, 347–356. [Google Scholar] [CrossRef]
- Krugly, E.; Pitak, O.; Ciuzas, D.; Tichonovas, M.; Stasiulaitiene, I.; Urniezaite, I.; Kliucininkas, L.; Martuzevicius, D. VOC Removal from Ventilation Air by Gas-to-Particle Conversion: Towords the Enhancement of Process Efficiency. Build. Environ. 2022, 209, 108647. [Google Scholar] [CrossRef]
- Krugly, E.; Pitak, O.; Ciuzas, D.; Tichonovas, M.; Stasiulaitiene, I.; Prasauskas, T.; Kliucininkas, L.; Martuzevicius, D. Removal of VOCs from Wood Processing Ventilation Air by Advanced Oxidation Gas-to-Particle Prototype System. Process Saf. Environ. Prot. 2022, 161, 520–527. [Google Scholar] [CrossRef]
- Ebrahimifakhar, A.; Poursadegh, M.; Hu, Y.; Yuill, D.P.; Luo, Y. A Systematic Review and Meta-Analysis of Field Studies of Portable Air Cleaners: Performance, User Behavior, and by-Product Emissions. Sci. Total Environ. 2024, 912, 168786. [Google Scholar] [CrossRef]
- Nunayon, S.S.; Zhang, H.H.; Chan, V.; Kong, R.Y.C.; Lai, A.C.K. Study of Synergistic Disinfection by UVC and Positive/Negative Air Ions for Aerosolized Escherichia Coli, Salmonella Typhimurium, and Staphylococcus Epidermidis in Ventilation Duct Flow. Indoor Air 2022, 32, e12957. [Google Scholar] [CrossRef]
- Xie, Y.; Zhu, X.; Zhang, P.; Wang, S.; Yang, J.; Li, J. Cost-Effective Instant Air Disinfection for Building Ventilation System by a Combination of UV and Micro-Static Electricity. Chem. Eng. J. 2023, 454, 140231. [Google Scholar] [CrossRef]
- Yu, K.P.; Lee, G.W.M.; Lin, S.Y.; Huang, C.P. Removal of Bioaerosols by the Combination of a Photocatalytic Filter and Negative Air Ions. J. Aerosol Sci. 2008, 39, 377–392. [Google Scholar] [CrossRef]
- Lim, S.W.Y.; Ow, S.Y.; Sutarlie, L.; Lee, Y.Y.; Suwardi, A.; Tan, C.K.I.; Cheong, W.C.D.; Loh, X.J.; Su, X. Bioaerosol Inactivation by a Cold Plasma Ionizer Coupled with an Electrostatic Precipitator. Microorganisms 2024, 12, 1923. [Google Scholar] [CrossRef]
- Cattai, F.; D’Orazio, A.; Sbardella, G. A Systematic Review on the Application of Ultraviolet Germicidal Irradiation to HVAC Systems. Energies 2023, 16, 7569. [Google Scholar] [CrossRef]
- Johnson, M.S.; Nilsson, E.J.K.; Svensson, E.A.; Langer, S. Gas-Phase Advanced Oxidation for Effective, Efficient in Situ Control of Pollution. Environ. Sci. Technol. 2014, 48, 8768–8776. [Google Scholar] [CrossRef]
- Adnew, G.A.; Meusinger, C.; Bork, N.; Gallus, M.; Kyte, M.; Rodins, V.; Rosenørn, T.; Johnson, M.S. Gas-Phase Advanced Oxidation as an Integrated Air Pollution Control Technique Abbreviations: BTEX DMEA. AIMS Environ. Sci. 2016, 3, 141–158. [Google Scholar] [CrossRef]
- Alvarenga, M.O.P.; Dias, J.M.M.; Lima, B.J.L.A.; Gomes, A.S.L.; Monteiro, G.Q.M. The Implementation of Portable Air-Cleaning Technologies in Healthcare Settings—A Scoping Review. J. Hosp. Infect. 2023, 132, 93–103. [Google Scholar] [CrossRef]
- Kurnitski, J.; Boerstra, A.; Franchimon, F.; Mazzarella, L.; Hogeling, J.; Hovorka, F.; Seppänen, O. REHVA COVID-19 Guidance Document 2020; REHVA: Brussels, Belgium, 2020. [Google Scholar]
- Zhang, H.; Ahmadi, G. Aerosol Particle Transport and Deposition in Vertical and Horizontal Turbulent Duct Flows. J. Fluid. Mech. 2000, 406, 55–80. [Google Scholar] [CrossRef]
- Wallin, O.; Malmstrom, T.G. Particle Deposition Models for Ventilation Air Ducts. HVAC R Res. 1995, 1, 194–217. [Google Scholar] [CrossRef]
- McMurry, P.H.; Rader, D.J. Aerosol Wall Losses in Electrically Charged Chambers. Aerosol Sci. Technol. 1985, 4, 249–268. [Google Scholar] [CrossRef]
- Stein, R.L.; Ryback, W.H.; Sparks, A.W. Deposition of Aerosol in a Plastic Chamber. J. Colloid Interface Sci. 1973, 42, 441–447. [Google Scholar] [CrossRef]
- Molchanov, O.; Krpec, K.; Horák, J.; Kuboňová, L.; Hopan, F. Comparison of Methods for Evaluating Particle Charges in the Electrostatic Precipitation of Fly-Ash from Small-Scale Solid Fuel Combustion. Sep. Purif. Technol. 2020, 248, 117057. [Google Scholar] [CrossRef]
- Zhang, K.; Chen, S.; Tan, L.; Xu, M.; Zhang, H.; Zhang, D. Study on Mechanism and Characteristics of Particle Charging in Electrostatic Precipitator. Proc. IOP Conf. Ser. Mater. Sci. Eng. 2019, 677, 032109. [Google Scholar] [CrossRef]
- De Oliveira, A.E.; Guerra, V.G. Electrostatic Precipitation of Nanoparticles and Submicron Particles: Review of Technological Strategies. Process Saf. Environ. Prot. 2021, 153, 422–438. [Google Scholar] [CrossRef]
- Wen, T.Y.; Krichtafovitch, I.; Mamishev, A.V. Numerical Study of Electrostatic Precipitators with Novel Particle-Trapping Mechanism. J. Aerosol Sci. 2016, 95, 95–103. [Google Scholar] [CrossRef]
- Yang, Z.; Zheng, C.; Liu, S.; Guo, Y.; Liang, C.; Wang, Y.; Hu, D.; Gao, X. A Combined Wet Electrostatic Precipitator for Efficiently Eliminating Fine Particle Penetration. Fuel Process. Technol. 2018, 180, 122–129. [Google Scholar] [CrossRef]
- Li, Z.; Liu, Y.; Xing, Y.; Tran, T.M.P.; Le, T.C.; Tsai, C.J. Novel Wire-on-Plate Electrostatic Precipitator (WOP-EP) for Controlling Fine Particle and Nanoparticle Pollution. Environ. Sci. Technol. 2015, 49, 8683–8690. [Google Scholar] [CrossRef]
- Winter, T.; Winter, J.; Polak, M.; Kusch, K.; Mäder, U.; Sietmann, R.; Ehlbeck, J.; Van Hijum, S.; Weltmann, K.D.; Hecker, M.; et al. Characterization of the Global Impact of Low Temperature Gas Plasma on Vegetative Microorganisms. Proteomics 2011, 11, 3518–3530. [Google Scholar] [CrossRef]
- Alkawareek, M.Y.; Gorman, S.P.; Graham, W.G.; Gilmore, B.F. Potential Cellular Targets and Antibacterial Efficacy of Atmospheric Pressure Non-Thermal Plasma. Int. J. Antimicrob. Agents 2014, 43, 154–160. [Google Scholar] [CrossRef]
- Patange, A.; Boehm, D.; Ziuzina, D.; Cullen, P.J.; Gilmore, B.; Bourke, P. High Voltage Atmospheric Cold Air Plasma Control of Bacterial Biofilms on Fresh Produce. Int. J. Food Microbiol. 2019, 293, 137–145. [Google Scholar] [CrossRef]
- Lunov, O.; Zablotskii, V.; Churpita, O.; Jäger, A.; Polívka, L.; Syková, E.; Dejneka, A.; Kubinová, Š. The Interplay between Biological and Physical Scenarios of Bacterial Death Induced by Non-Thermal Plasma. Biomaterials 2016, 82, 71–83. [Google Scholar] [CrossRef]
- Begum, A.; Rasel Pervez, M.; Pervez, M.R.; Begum, A.; Laroussi, M. Plasma Based Sterilization: Overview and the Stepwise Inactivation Process of Microbial by Non-Thermal Atmospheric Pressure Plasma Jet. Int. J. Eng. Technol. 2014, 14, 7–16. [Google Scholar]
- Wong, K.S.; Chew, N.S.L.; Low, M.; Tan, M.K. Plasma-Activated Water: Physicochemical Properties, Generation Techniques, and Applications. Processes 2023, 11, 2213. [Google Scholar] [CrossRef]
- Mohamed, H.; Nayak, G.; Rendine, N.; Wigdahl, B.; Krebs, F.C.; Bruggeman, P.J.; Miller, V. Non-Thermal Plasma as a Novel Strategy for Treating or Preventing Viral Infection and Associated Disease. Front. Phys. 2021, 9, 109429. [Google Scholar] [CrossRef]
- Lai, A.C.K.; Cheung, A.C.T.; Wong, M.M.L.; Li, W.S. Evaluation of Cold Plasma Inactivation Efficacy against Different Airborne Bacteria in Ventilation Duct Flow. Build. Environ. 2016, 98, 39–46. [Google Scholar] [CrossRef]
- Timmermann, E.; Prehn, F.; Schmidt, M.; Höft, H.; Brandenburg, R.; Kettlitz, M. Indoor Air Purification by Dielectric Barrier Discharge Combined with Ionic Wind: Physical and Microbiological Investigations. J. Phys. D Appl. Phys. 2018, 51, 164003. [Google Scholar] [CrossRef]
- Prehn, F.; Timmermann, E.; Kettlitz, M.; Schaufler, K.; Günther, S.; Hahn, V. Inactivation of Airborne Bacteria by Plasma Treatment and Ionic Wind for Indoor Air Cleaning. Plasma Process. Polym. 2020, 17, 2000027. [Google Scholar] [CrossRef]
- Liang, Y.; Wu, Y.; Sun, K.; Chen, Q.; Shen, F.; Zhang, J.; Yao, M.; Zhu, T.; Fang, J. Rapid Inactivation of Biological Species in the Air Using Atmospheric Pressure Nonthermal Plasma. Environ. Sci. Technol. 2012, 46, 3360–3368. [Google Scholar] [CrossRef]
- Bisag, A.; Isabelli, P.; Laurita, R.; Bucci, C.; Capelli, F.; Dirani, G.; Gherardi, M.; Laghi, G.; Paglianti, A.; Sambri, V.; et al. Cold Atmospheric Plasma Inactivation of Aerosolized Microdroplets Containing Bacteria and Purified SARS-CoV-2 RNA to Contrast Airborne Indoor Transmission. Plasma Process. Polym. 2020, 17, 2000154. [Google Scholar] [CrossRef]
- Cutler, T.D.; Zimmerman, J.J. Ultraviolet Irradiation and the Mechanisms Underlying Its Inactivation of Infectious Agents. Anim. Health Res. Rev./Conf. Res. Work. Anim. Diseases 2011, 12, 15–23. [Google Scholar] [CrossRef]
- Snelling, W.J.; Afkhami, A.; Turkington, H.L.; Carlisle, C.; Cosby, S.L.; Hamilton, J.W.J.; Ternan, N.G.; Dunlop, P.S.M. Efficacy of Single Pass UVC Air Treatment for the Inactivation of Coronavirus, MS2 Coliphage and Staphylococcus Aureus Bioaerosols. J. Aerosol Sci. 2022, 164, 106003. [Google Scholar] [CrossRef]
- Yang, Y.; Zhang, H.; Nunayon, S.S.; Chan, V.; Lai, A.C.K. Disinfection Efficacy of Ultraviolet Germicidal Irradiation on Airborne Bacteria in Ventilation Ducts. Indoor Air 2018, 28, 806–817. [Google Scholar] [CrossRef]
- Zhang, H.; Lai, A.C.K. Evaluation of Single-Pass Disinfection Performance of Far-UVC Light on Airborne Microorganisms in Duct Flows. Environ. Sci. Technol. 2022, 56, 17849–17857. [Google Scholar] [CrossRef] [PubMed]
- Liao, X.; Liu, D.; Xiang, Q.; Ahn, J.; Chen, S.; Ye, X.; Ding, T. Inactivation Mechanisms of Non-Thermal Plasma on Microbes: A Review. Food Control 2017, 75, 83–91. [Google Scholar] [CrossRef]
- Baselga, M.; Alba, J.J.; Schuhmacher, A.J. Impact of Needle-Point Bipolar Ionization System in the Reduction of Bioaerosols in Collective Transport. Sci. Total Environ. 2023, 855, 158965. [Google Scholar] [CrossRef]
- Angel, D.M.; Zulli, A.; Peccia, J. Bipolar Ionization-Mediated Airborne Virus Inactivation and Deposition Rates. Build. Environ. 2024, 262, 111794. [Google Scholar] [CrossRef]
- Lee, S.G.; Hyun, J.; Hwa Lee, S.; Hwang, J. One-Pass Antibacterial Efficacy of Bipolar Air Ions against Aerosolized Staphylococcus Epidermidis in a Duct Flow. J. Aerosol Sci. 2014, 69, 71–81. [Google Scholar] [CrossRef]
- Zhou, P.; Yang, Y.; Huang, G.; Lai, A.C.K. Numerical and Experimental Study on Airborne Disinfection by Negative Ions in Air Duct Flow. Build. Environ. 2018, 127, 204–210. [Google Scholar] [CrossRef] [PubMed]
- Nunayon, S.S.; Zhang, H.H.; Jin, X.; Lai, A.C. Experimental Evaluation of Positive and Negative Air Ions Disinfection Efficacy under Different Ventilation Duct Conditions. Build. Environ. 2019, 158, 295–301. [Google Scholar] [CrossRef]
- Lu, Y.H.; Wu, H.; Zhang, H.H.; Li, W.S.; Lai, A.C.K. Synergistic Disinfection of Aerosolized Bacteria and Bacteriophage by Far-UVC (222-Nm) and Negative Air Ions. J. Hazard. Mater. 2023, 441, 129876. [Google Scholar] [CrossRef]
Disclaimer/Publisher’s Note: The statements, opinions and data contained in all publications are solely those of the individual author(s) and contributor(s) and not of MDPI and/or the editor(s). MDPI and/or the editor(s) disclaim responsibility for any injury to people or property resulting from any ideas, methods, instructions or products referred to in the content. |
© 2025 by the authors. Licensee MDPI, Basel, Switzerland. This article is an open access article distributed under the terms and conditions of the Creative Commons Attribution (CC BY) license (https://creativecommons.org/licenses/by/4.0/).