


Abstract
Background: Surface roughness in turning operations is still verified predominantly after machining, which limits the possibility of timely corrective intervention. Methods: This study examined whether normal-direction peak-to-peak vibration displacement can serve as a practical low-frequency indicator of surface roughness during finish turning of EN AW-2011 aluminum alloy. The analysis was based on 190 synchronized displacement-roughness observation pairs obtained in one controlled experimental campaign on a CQ6230 conventional precision lathe, using a VB-8206SD displacement logger mounted radially on the tool holder and contact profilometry measurements reported as Ra and Rz. The analytical workflow included explicit quality-control safeguards for malformed rows, missing values, and obvious artefacts; in the present dataset, these checks did not indicate a failure state that would invalidate the main calculations. The workflow combined descriptive statistics, moving-average trend inspection, low-frequency FFT and STFT descriptors, Pearson correlation analysis, and ordinary least squares regression. Results: The displacement signal exhibited a mean value of 0.0446 mm with a standard deviation of 0.0256 mm and showed strong within-dataset linear relations with roughness parameters: Ra = 14.204 + 24.191 V (R2 = 0.9929, RMSE = 0.052 µm) and Rz = 63.207 + 105.253 V (R2 = 0.9905, RMSE = 0.264 µm). Conclusions: The results support setup-specific roughness-related process-state assessment using low-rate normal-direction displacement measurements. However, because the 190 records represent a time-ordered synchronized sequence rather than 190 independent cutting trials, and because no separate validation set was available, the fitted equations should be interpreted as descriptive within-setup calibration rather than as universally validated predictive models.
1. Introduction
Turning remains one of the most widely used machining processes for rotational parts because it combines productivity, geometric flexibility, and the ability to deliver a controlled surface state in a single operation. In finish turning, the generated surface is not merely a geometric consequence of feed and tool nose radius; it is also the outcome of dynamic interactions between the machine structure, the cutting edge, the workpiece, and the evolving chip formation process. For this reason, surface roughness continues to be treated as a critical output variable that links process physics with part functionality. Excessive roughness may degrade tribological behavior, sealing performance, fatigue life, and dimensional conformity, while also increasing the need for secondary finishing steps and inspection effort [1,2].
In industrial practice, roughness is still often verified after the cutting pass by profilometry or by offline quality inspection. Although such measurements are reliable, they are reactive. When a deviation is detected only after machining, the part may already be out of tolerance, and the process knowledge gained from the measurement arrives too late to correct the same cut. This is one reason why indirect monitoring methods continue to attract attention. Among them, vibration-based approaches are particularly appealing because vibration carries information about the instantaneous condition of the machine–tool–workpiece system and responds to changes in force transmission, stiffness utilization, cutting stability, and contact conditions at the tool–workpiece interface [3,4,5,6].
A large body of work has shown that vibration can be related to surface integrity, tool wear, and chatter development. Classical studies established that tool vibration influences the resulting surface profile and that the normal or radial component is especially important because it perturbs the distance between the cutting edge and the generated surface [4]. Later research expanded this line of thought using signal decomposition, statistical descriptors, and data-driven models to predict or classify surface quality from vibration measurements [5,6,7,8]. These studies are valuable, but they often rely on high-bandwidth accelerometers, multichannel data acquisition, or computationally heavy feature pipelines that are well suited to laboratory systems yet less convenient for conventional shop-floor deployment.
This distinction matters because not every production environment has access to dense sensor networks or dedicated monitoring hardware. Conventional lathes and small-batch manufacturing settings often operate with portable instruments, intermittent sampling, and limited computing infrastructure. In such environments, the central question is not whether a sophisticated model can be built under ideal conditions, but whether a simple, physically interpretable signal can provide useful process awareness without excessive instrumentation overhead. A low-cost displacement logger mounted directly on the tool holder does not resolve the full dynamic spectrum of cutting, but it may still capture slow variations in process state that are relevant to the resulting surface finish.
The present study focuses on that practical scenario. The signal of interest is normal-direction peak-to-peak displacement measured at low sampling rate during finish turning of EN AW-2011 aluminum alloy. The emphasis on one material only is deliberate. Aluminum alloys differ substantially from steels and other engineering materials in cutting behavior, force levels, chip formation, built-up edge tendency, and compliance-sensitive surface generation. A calibration obtained on aluminum should therefore not be presented as though it were material-independent. Likewise, the present dataset is limited to one setup, one sensing direction, and one acquisition chain. These constraints are not weaknesses to be hidden; they define the validity boundary of the resulting model.
The directional choice is also physically motivated. In turning, the surface is generated by the relative trajectory of the cutting edge with respect to the workpiece. Any bounded motion in the normal direction modifies the instantaneous effective depth of cut and perturbs the local imprint left on the newly formed surface. Studies on surface generation and dynamic compliance in turning have repeatedly shown that compliance normal to the cut can translate directly into surface deviations, even when the process is operated below classical chatter thresholds [9,10,11,12]. For stable finishing operations, this makes the normal direction an especially informative axis for observing roughness-related process behavior.
Another important boundary concerns frequency content. The logger used in this study records one synchronized displacement value every 2 s, corresponding to a sampling frequency of 0.5 Hz and a Nyquist limit of 0.25 Hz. Such a signal is not appropriate for diagnosing high-frequency regenerative chatter or pass-frequency phenomena in the usual machining sense. Nevertheless, the data can still be informative in a different way: they can describe slow drift, modulation, or state changes across the monitored cut. When interpreted in this low-frequency context, spectral descriptors such as FFT and STFT remain useful as summaries of observable modulation, rather than as claims about unresolved high-frequency dynamics.
Accordingly, the objective of this article is to determine whether low-rate normal-direction peak-to-peak displacement can serve as a practical indicator of the roughness parameters Ra and Rz within a controlled finish-turning setup for EN AW-2011 aluminum alloy. The work does not attempt to build a universal predictor or to compare unrelated materials. Instead, it develops a transparent within-setup calibration based on 190 synchronized records and discusses how such a simple monitoring chain can be used responsibly for roughness-related supervision in conventional turning without overstating what the sensor bandwidth can reveal. The broader computational workflow includes quality-control routines and an AI-oriented modelling layer, but the present article intentionally centers the physically interpretable calibration result rather than overextending the claim to full machine-learning validation.
2. Materials and Methods
2.1. Study Scope and Experimental Philosophy
The study was designed as a setup-specific analysis of whether a simple displacement signal could track surface roughness during finish turning. The emphasis was therefore placed on synchronized measurement, interpretability, and methodological transparency rather than on large-scale parameter screening or black-box prediction. The journal dataset consisted of 190 paired vibration and roughness observations obtained from one controlled experimental campaign in which the vibration logger and profilometric measurements were synchronized record by record. Accordingly, the 190 retained records should be read as a time-ordered sequence of matched observations from the same setup, not as 190 statistically independent cutting trials.
The intended use case is process-state assessment on a conventional lathe, where an operator or researcher may wish to infer whether the roughness level is drifting upward while the cut is underway. In such a context, the preferred model is one that is easy to audit, easy to recalibrate, and clearly bounded by its experimental conditions. For that reason, linear correlation and regression were treated as the primary analytical tools. More complex modeling strategies can be justified when multiple high-bandwidth signals are available, but with one scalar predictor sampled at low rate, transparent calibration is more defensible and easier to transfer into practice. The study therefore addresses monitoring-oriented interpretation and warning-threshold logic, not closed-loop control.
2.2. Machine Tool, Workpiece Material, Tooling, and Cutting Window
Experiments were carried out on a CQ6230 conventional precision lathe. The workpiece material was EN AW-2011 aluminum alloy, selected because it is representative of free-machining aluminum used in turned components where surface quality and dimensional repeatability are important. The tool system consisted of an SCLCR 2020K12 holder equipped with a CCGT 120404-AL insert. This combination is appropriate for finishing conditions in aluminum machining, where a sharp geometry and stable chip evacuation are required to limit surface damage and local ploughing effects. The present article intentionally reports the campaign as one controlled finish-turning setup and does not recast the sequential records as a broad factorial comparison among independent cutting regimes.
Cylindrical workpieces were prepared with consistent initial geometry (nominal diameter 40 mm, length 120 mm, chuck overhang 70 mm). Throughout the analyzed campaign, the machine-tool-sensor arrangement, tool mounting, sensing direction, and general finishing context were kept unchanged so that the measured variation could be interpreted primarily as within-setup process-state variation. For this reason, the resulting calibration should be regarded as local to the investigated configuration rather than as a transfer-ready model for other machines, materials, or cutting windows. The main experimental and analytical settings used in the study are summarized in Table 1.
Table 1.
Main experimental and analytical settings used in the study.
2.3. Vibration Measurement Chain and Roughness Metrology
Normal-direction peak-to-peak displacement was measured using a VB-8206SD portable vibration analyzer (Lutron, Coopersburg, PA, USA) mounted rigidly on the tool holder and oriented radially with respect to the workpiece. The radial orientation was chosen because it aligns the measured displacement with the direction that most directly perturbs the instantaneous gap between the cutting edge and the generated surface. In practical terms, the sensor output therefore reflects a directionally meaningful component of tool-holder motion rather than an undifferentiated vibration magnitude [4,13].
Surface texture was evaluated by contact profilometry using the roughness parameters Ra and Rz, following ISO 4288 profile-assessment practice [14] and consistent ISO 21920 [15] terminology. Ra was retained as the arithmetic mean roughness because it is widely used for process qualification and general surface assessment, while Rz was included because it is more sensitive to profile extremes and therefore offers a complementary description of the same generated surface. In the cylindrical turning tests, profilometer traces were taken parallel to the spindle axis and repeated at several circumferential positions; the reported values therefore represent mean roughness descriptors rather than single-trace outliers.
2.4. Dataset Construction and Preprocessing
The synchronized journal dataset contained 190 records. These 190 synchronized observations were used for the core calculations reported in this article. The dataset was not introduced as a collection of statistically independent trials. Rather, the broader computational workflow applies explicit quality-control safeguards for malformed or empty rows, inconsistent fields, and obvious artefactual sequences; if such problems dominate, downstream calculations are altered or restricted accordingly. In the present case, the data passed the relevant checks, and the 190-record dataset was treated as the main analysis interval used for the reported results. Under the present turning conditions, each 2 s record corresponds approximately to one local surface segment of about 0.5 mm, so the synchronized displacement-roughness pair can be interpreted as a segment-level process-state descriptor rather than as an abstract timestamp alone.
Before analysis, the decimal-comma notation present in the original logger export was converted to decimal-point notation to ensure reproducible processing in the statistical workflow. Timestamp fields were standardized, variable names were normalized, and the retained records were stored in a clean tabular structure for analysis and figure generation. No outlier removal or smoothing was applied before calculating the reported summary statistics and regression equations. The moving average shown in the figures was used only for visual trend inspection and not for model fitting.
The retained logger export from the VB-8206SD instrument (Lutron, Coopersburg, PA, USA) stores synchronized displacement and roughness pairs for each time step but does not embed full run-level metadata for broader comparative trials discussed in exploratory drafts. For that reason, the present manuscript intentionally restricts interpretation to the paired EN AW-2011 (Lutron, Coopersburg, PA, USA) turning subset and does not merge aluminum results with steel, facing, or tangential-direction variants that belong to different experimental contexts.
2.5. Signal Descriptors and Statistical Analysis
The main predictor used in the study was normal-direction peak-to-peak displacement, denoted here as V. Descriptive statistics were calculated for V, Ra, and Rz, including mean, standard deviation, minimum, maximum, and, for displacement, root-mean-square value. To visualize slow changes in process state across the monitored cut, a 15-point centered moving average was superimposed on the raw displacement sequence. Because the sampling interval was 2 s, this moving-average window corresponds to 30 s of process history and is therefore appropriate for highlighting slow drift while preserving the overall sequence structure. Inferential claims were kept deliberately restrained because the dataset is sequential and no independent validation subset was available. Because the retained observations form a sequential matched series, the reported p-values and confidence intervals are used here primarily as descriptive effect summaries and not as proof of 190 statistically independent replications.
Frequency-domain inspection was performed on the mean-removed displacement signal using a fast Fourier transform and a short-time Fourier transform. These outputs were interpreted strictly within the observable band imposed by the acquisition rate. With fs = 0.5 Hz, the Nyquist limit is 0.25 Hz and the FFT frequency resolution is approximately 0.00263 Hz for the 190-point record. The STFT used 32-point segments with overlap, which corresponds to analysis windows of approximately 64 s. These descriptors were not used to infer chatter frequencies; instead, they were treated as summaries of low-frequency modulation visible to the sensor. Linear association between displacement and roughness was quantified using Pearson correlation coefficients and ordinary least squares regression. The calibration equations were expressed as Ra = b0 + b1 V and Rz = c0 + c1 V. Confidence intervals for the correlation coefficient were obtained using Fisher’s z transformation, and model quality was summarized by the correlation coefficient r, coefficient of determination R2, root-mean-square error, and mean absolute error [16]. Residual behavior was also inspected to verify that the strong linear fit was not being driven by obvious curvature or by a small number of isolated observations. Normality of the raw variables was evaluated only as a supporting diagnostic. Because the practical aim of the study is within-setup calibration rather than inference about population means, model adequacy was judged primarily from effect size, residual structure, heteroscedasticity checks, and the physical monotonicity of the fitted relations [16].
2.6. Physical Interpretation and Validity Boundary
The physical interpretation adopted in this work is intentionally simplified but not purely geometric. In stable finish turning, the measured normal-direction motion can be viewed as a bounded displacement response x_n that is superimposed on the nominal geometric trajectory of the tool. Under low-frequency conditions, a stiffness-dominated approximation x_n approximately proportional to F_n/k is useful for qualitative reasoning, where F_n is the normal force component and k is the effective structural stiffness [9]. At the same time, the measured low-rate displacement should be understood as an integrated indicator of several slowly varying influences acting together, including compliance, local contact-state variation, chip-formation stability, and gradual change in effective load transfer. The generated surface can therefore be interpreted as the nominal feed-generated profile plus a bounded displacement contribution associated with normal-direction compliance.
This interpretation helps explain why displacement can correlate strongly with roughness, but it also clarifies what the present dataset cannot show. The measurement chain does not resolve high-frequency cutting dynamics, regenerative chatter, or spindle-synchronous signatures in the classical sense. The reported equations are therefore not chatter models and should not be interpreted as direct frequency-domain descriptions of roughness generation. They are empirical, aluminum-specific, setup-specific calibration relations valid for the 190 synchronized records analyzed under the stated machine-tool-sensor configuration. Any application beyond that boundary requires new calibration and, ideally, independent validation. For stable turning, the geometric roughness estimates can be written in simplified form as:
Ra = f2/(32·rε) and Rz ≈ f2/(8·rε)
These expressions describe the feed-generated surface under rigid-body assumptions. In real machining systems, however, the tool–workpiece assembly exhibits elastic deformation even under stable cutting conditions. The actual surface can therefore be interpreted as the superposition of the nominal geometric profile and a bounded normal-direction displacement contribution:
z_s(t) = z_g(t) + x_n(t)
Within the low-frequency conditions considered here, a stiffness-dominated approximation x(t) ≈ F_n(t)/k is sufficient for qualitative interpretation.
3. Results
3.1. Descriptive Overview of the 190-Record Subset
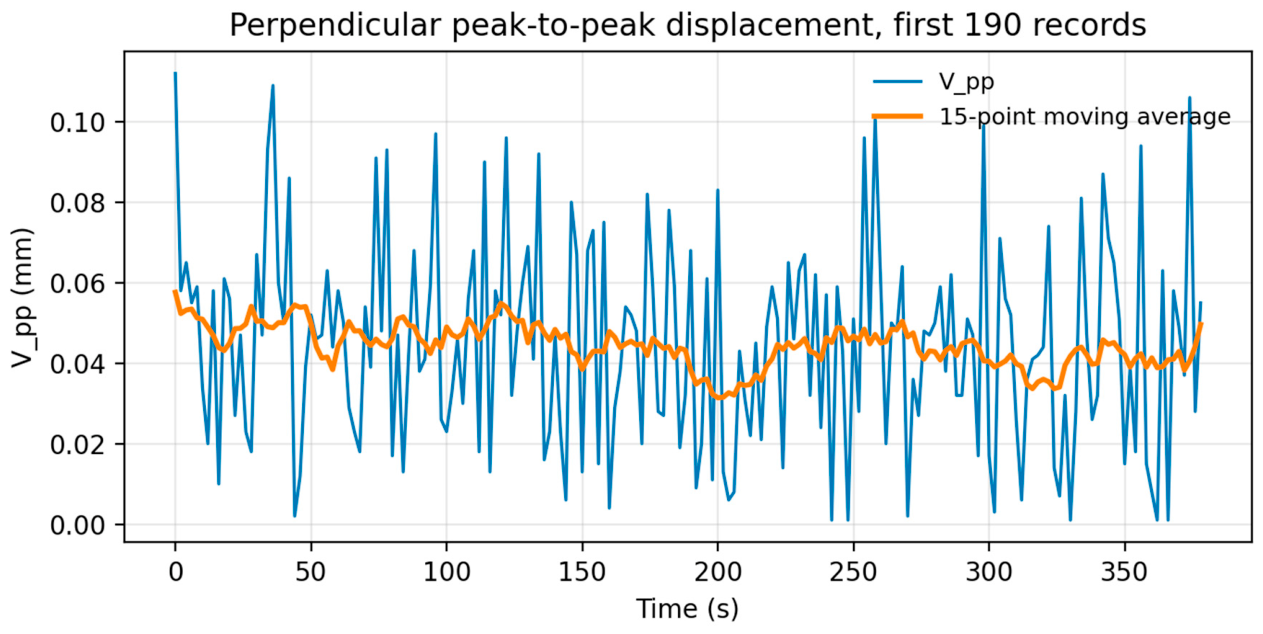
The retained subset contained 190 synchronized records covering 378 s from the first to the last timestamp. Over this interval, normal-direction peak-to-peak displacement ranged from 0.001 to 0.112 mm, with a mean of 0.0446 mm, standard deviation of 0.0256 mm, and root-mean-square value of 0.0514 mm. The corresponding roughness values ranged from 14.154 to 16.906 µm for Ra and from 63.159 to 74.961 µm for Rz. Mean values were 15.283 µm for Ra and 67.902 µm for Rz. Taken together, these statistics indicate a moderate but clearly structured spread in both the signal and the surface descriptors, which is desirable for evaluating whether the vibration variable carries predictive information.
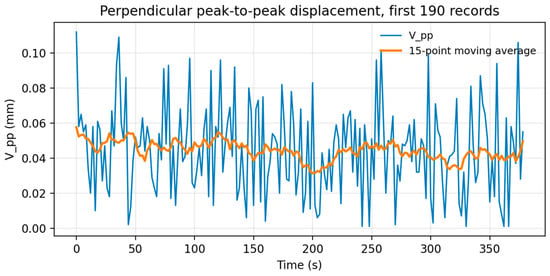
The time history of displacement is shown in Figure 1. The raw sequence contains local fluctuations throughout the monitoring interval, but the 15-point moving average remains within a comparatively narrow band and changes smoothly rather than abruptly. This pattern is consistent with a process that experiences bounded state variation rather than violent instability. In practical terms, the signal resembles a slowly modulated finish-turning response in which the effective dynamic condition of the cut evolves over tens of seconds, not milliseconds.
Figure 1.
Normal-direction peak-to-peak displacement over the analyzed 190-record subset. The thicker line denotes a 15-point centered moving average used only for trend visualization.
The descriptive behavior of Ra and Rz follows the same general logic. Their standard deviations are small relative to their mean values, yet the ranges are wide enough to separate lower-roughness and higher-roughness intervals within the monitored dataset. This is an important point because a perfectly flat roughness dataset would make any monitoring exercise trivial or meaningless. Here, the observed spread is sufficient to reveal a strong statistical mapping without extending into implausible or obviously unstable operating conditions. Descriptive statistics for the retained 190-record synchronized subset are summarized in Table 2.
Table 2.
Descriptive statistics for the retained 190-record synchronized subset.
3.2. Time-Domain Trend Behavior
Figure 1 also shows that the moving-average displacement trace does not wander randomly around a constant level; instead, it exhibits extended intervals of relatively low amplitude followed by intervals of higher amplitude. Because the averaging window corresponds to 30 s, these changes should be interpreted as low-frequency modulation of the process state. Such modulation can arise from gradual changes in effective contact conditions, compliance usage, material response, or the combined influence of changing cutting settings across the monitored sequence. The present data do not separate these mechanisms individually, but they clearly show that the process is not dynamically stationary over the full 190-record interval.
From a monitoring perspective, this behavior is valuable. A sensor signal that changes monotonically or quasi-monotonically over observable time scales is more useful for online inference than a signal dominated entirely by unresolved high-frequency content. The present displacement logger captures exactly this type of slow variation. Although it cannot diagnose chatter, it can still indicate whether the cut is spending more time in a lower-displacement or higher-displacement state, which in turn can be related to the expected roughness level through the calibrated regression equations.
The absence of extreme jumps in the sequence is also relevant for interpreting the regression results. When a linear model performs well, one possible concern is that the fit is driven by a few isolated high-amplitude points. In the present case, the time-domain plot does not support that explanation. Instead, the sequence shows repeated observations across the lower, middle, and upper parts of the displacement range, providing the regression with support over a continuous interval rather than over a sparse set of extremes.
3.3. Low-Frequency Spectral Descriptors
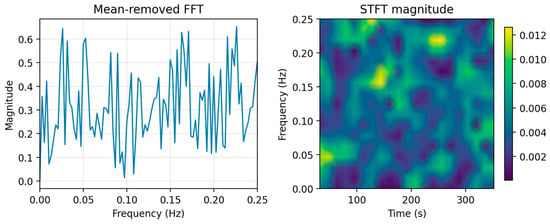
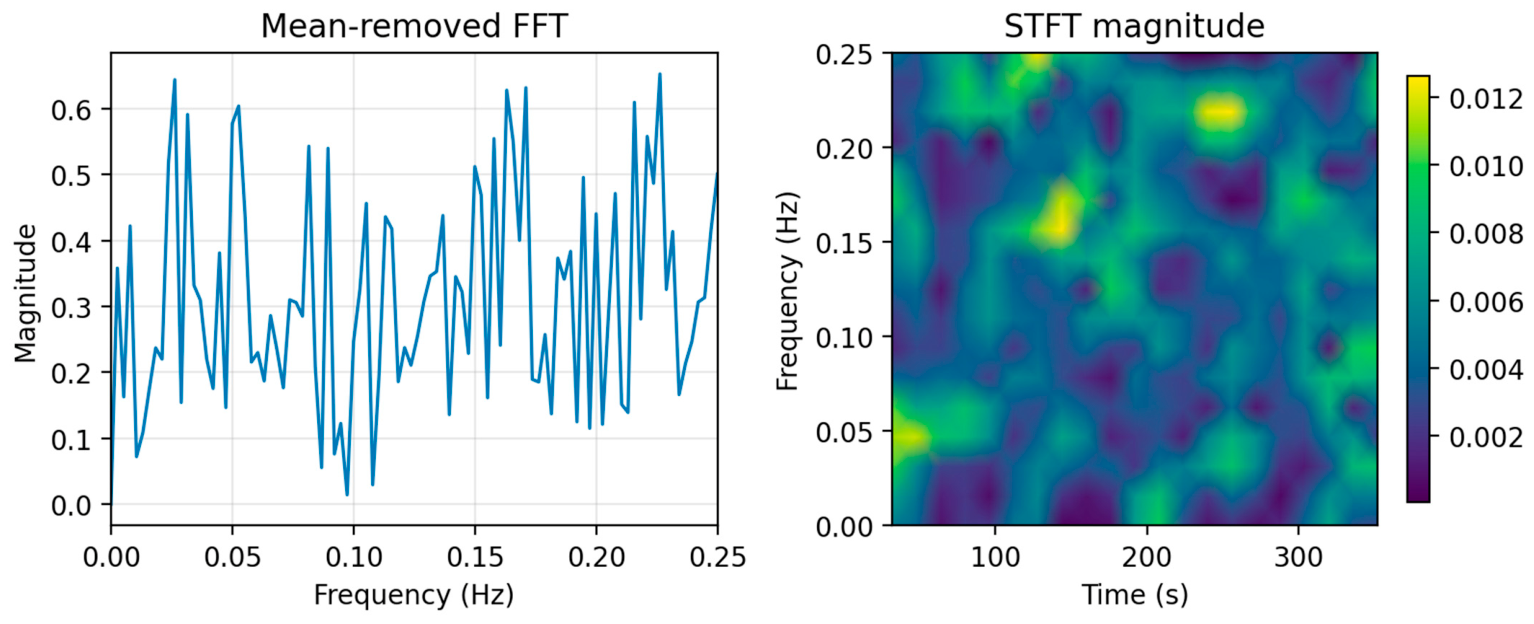
The FFT and STFT results are presented in Figure 2. Because the signal was sampled at 0.5 Hz, all observable spectral content lies below 0.25 Hz. The most visible low-frequency component in the FFT occurs near 0.0263 Hz, corresponding to a period of approximately 38 s, while additional components are present near the upper part of the observable band. These peaks are useful for describing modulation visible to the sensor, but they should not be interpreted as the dominant physical vibration modes of the cutting system. The high-frequency dynamics of the machine–tool–workpiece system remain outside the measurable range of the present instrument.
Figure 2.
Low-frequency descriptors of the mean-removed displacement signal: FFT magnitude spectrum (left) and STFT spectrogram (right). Because fs = 0.5 Hz, the observable frequency range is restricted to 0–0.25 Hz.
The STFT confirms that the low-frequency content is distributed over time rather than concentrated in a single short episode. Magnitude variations occur across multiple windows, suggesting that the monitored process evolves gradually instead of exhibiting one isolated transient. This supports the interpretation already suggested by the moving-average trace: the measured signal is better understood as a record of slow state evolution than as a direct representation of high-bandwidth cutting vibration.
These frequency-domain results are still useful scientifically because they enforce interpretive discipline. They show that low-cost monitoring can provide meaningful descriptors when the observable band is acknowledged honestly. In other words, the signal is informative, but for the right question. It is suitable for assessing slow variation linked to roughness state in this setup; it is not suitable for claiming direct observation of chatter frequencies.
3.4. Correlation and Regression Between Displacement and Roughness
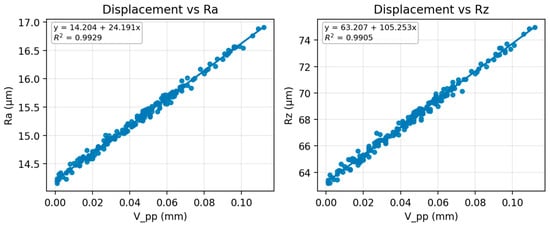
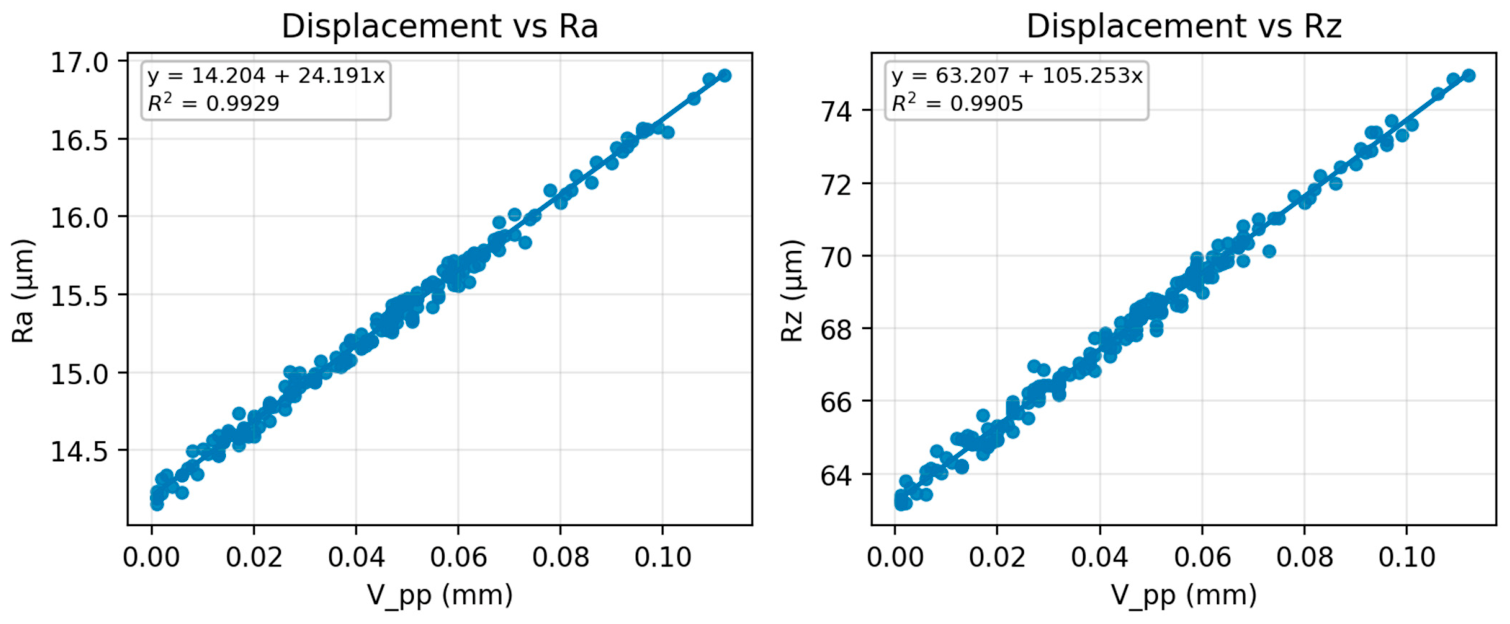
The strongest finding of the study is the linear relation between normal-direction displacement and measured roughness. Scatter plots and fitted regression lines are shown in Figure 3, while the corresponding statistical summaries are listed in Table 3. For Ra, the fitted model was Ra = 14.204 + 24.191 V. These coefficients were recalculated directly from the 190 synchronized rows used in the journal analysis and therefore replace the values that appeared in earlier exploratory drafts. The Pearson correlation coefficient was r = 0.9964 with a 95% confidence interval of 0.9953 to 0.9973, and the model achieved R2 = 0.9929, RMSE = 0.052 µm, and MAE = 0.0419 µm. These values indicate an exceptionally tight within-dataset relation; however, because the observations form a time-ordered sequence and no hold-out or cross-validation procedure was available, the fit should be interpreted as internal calibration quality rather than as external predictive proof. The unusually high R2 values are therefore most defensible as evidence of strong within-campaign calibration tightness between synchronized variables, not as stand-alone evidence of transportability to other runs, machines, or materials.
Figure 3.
Empirical within-dataset relations between normal-direction peak-to-peak displacement and the measured roughness parameters Ra and Rz for the 190-record subset.
Table 3.
Linear regression summary for displacement-based roughness calibration.
For Rz, the fitted model was Rz = 63.207 + 105.253 V. The corresponding correlation coefficient was r = 0.9952 with a 95% confidence interval of 0.9936 to 0.9964, and the model quality indicators were R2 = 0.9905, RMSE = 0.264 µm, and MAE = 0.2091 µm. The slightly larger error values relative to Ra are consistent with the fact that Rz is more sensitive to local extremes in the surface profile, but the relation remains very strong and practically monotonic across the full observed displacement range.
The slopes of the two models provide an intuitive engineering interpretation. An increase of 0.01 mm in measured peak-to-peak displacement corresponds, on average, to an increase of about 0.242 µm in Ra and about 1.053 µm in Rz within this setup. This is a useful scale because it translates the sensor reading into a tangible surface-quality consequence. It also shows that Rz is more sensitive than Ra to the same displacement increment, which is consistent with the idea that profile extremes respond more strongly to dynamic deviation than average roughness does.
The fitted relations are not only statistically strong but also visually coherent. The point clouds in Figure 3 are narrow and elongated, with no obvious sign reversal or threshold break across the observed displacement interval. This shape is exactly what would be expected if the normal-direction displacement were physically coupled to the surface-generation process through a bounded compliance mechanism. The observed monotonicity therefore strengthens the plausibility of the regression rather than merely its numerical fit.
3.5. Residual Behavior and Practical Roughness Bands
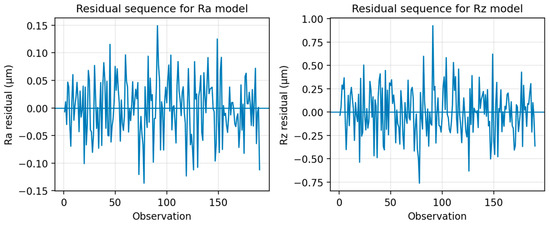
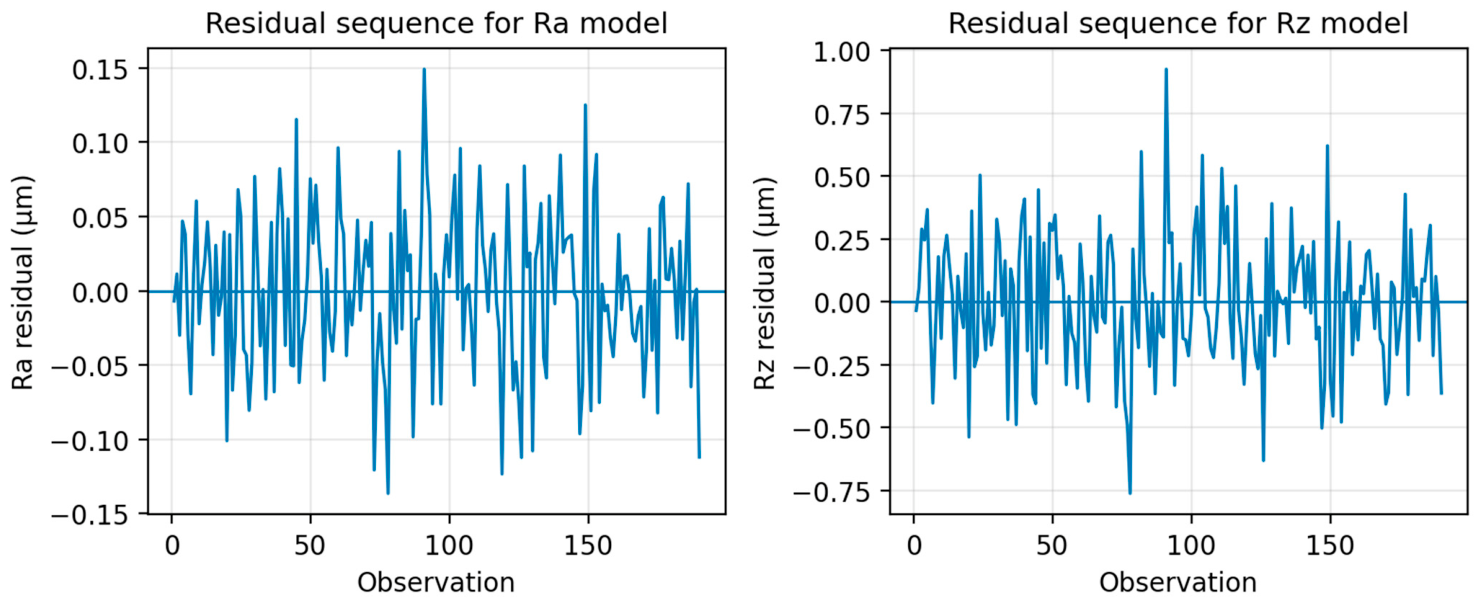
Residual sequences for the Ra and Rz models are shown in Figure 4. For Ra, residuals remained within approximately −0.137 to 0.149 µm; for Rz, they remained within approximately −0.761 to 0.925 µm. The residual traces oscillate around zero without any strong monotonic drift, which supports the adequacy of the linear form over the analyzed interval. While a fuller validation would require repeated independent experiments and external testing, the residual behavior suggests that the strong fit is not merely an artifact of obvious curvature or a few isolated observations inside the present dataset.
Figure 4.
Residual sequences for the linear roughness models fitted to the retained 190-record subset.
To make the calibration easier to interpret operationally, the dataset was also grouped into low-, medium-, and high-displacement bands based on the empirical quartile structure of V. Records in the low-displacement band were associated with mean roughness values of approximately 14.512 µm for Ra and 64.547 µm for Rz. The medium band corresponded to 15.271 µm and 67.848 µm, whereas the high band corresponded to 16.076 µm and 71.362 µm. This banded view is not a replacement for regression; rather, it translates the continuous model into a form that may be more intuitive for process supervision, as summarized in Table 4.
Table 4.
Practical displacement bands and their associated mean roughness values in the retained subset.
A second practical interpretation can be obtained by evaluating the fitted equations at representative displacement levels. For example, predicted roughness values rise from approximately Ra = 14.687 µm and Rz = 65.312 µm at V = 0.02 mm to approximately Ra = 16.623 µm and Rz = 73.732 µm at V = 0.10 mm. These predicted increments align with the observed data ranges and show that even modest changes in the measured displacement level can correspond to non-negligible changes in the generated surface quality, as shown in Table 5.
Table 5.
Predicted roughness values at representative displacement levels using the fitted equations.
Taken together, the residual analysis and band interpretation suggest that the present signal is not merely correlated with roughness in a statistical sense; it is also sufficiently stable to support simple operational rules. A practitioner could, for example, define an internal warning threshold based on displacement rather than waiting for offline roughness verification. The exact threshold would remain setup-specific, but the principle of displacement-based monitoring is clearly supported by the retained 190-record subset.
4. Discussion
4.1. Interpretation of the Main Finding
The central outcome of this study is that a low-rate, direction-specific displacement measurement retained very strong explanatory power for surface roughness within the analyzed aluminum-turning setup. This matters because it shows that monitoring usefulness does not always require high-complexity instrumentation. When the measured variable is chosen on physical grounds, even a simple signal can be informative. In the present case, the normal-direction component is not arbitrary; it is the direction most directly coupled to how the cutting edge leaves its imprint on the machined surface.
This result is consistent with the mechanics of surface generation. In finish turning, the ideal feed-generated profile is modified by dynamic displacement of the tool–workpiece system. Motion normal to the surface changes the instantaneous radial engagement and therefore perturbs the local profile height. When those perturbations remain bounded and slowly varying, their effect can appear as a monotonic change in roughness level rather than as catastrophic instability. The strong linear relations obtained here support that interpretation and align with broader arguments about dynamic compliance and surface integrity in turning [4,9,11,12].
A further implication is methodological. Many monitoring studies are motivated by the desire to maximize predictive performance, which can lead to complex feature sets and opaque models. Yet the present dataset shows that, in some practical scenarios, the most informative step may be to select the right directional signal rather than the most elaborate algorithm. The displacement variable V is easy to understand, easy to measure, and easy to recalibrate. That transparency is a strength when the goal is implementation rather than leaderboard-style model comparison.
4.2. Relation to Earlier Vibration-Based Roughness Studies
Earlier research has repeatedly demonstrated that vibration contains information relevant to roughness and tool condition [2,3,4,5,6,7,8]. Studies based on singular-spectrum analysis, Gaussian-process regression, and other advanced approaches have shown that high-quality roughness estimation can be achieved when sufficient bandwidth and modeling complexity are available [2,5,6,7]. The present work does not contradict those findings. Instead, it addresses a narrower but practically important question: what can be achieved when the sensing chain is intentionally simplified and the measurable band is very limited?
From that perspective, the study contributes a complementary result. It shows that low-frequency displacement logging, when aligned with the normal direction and combined with disciplined interpretation, can still produce a useful calibration for roughness-related process assessment. This is especially relevant for conventional turning environments where portable instrumentation is more realistic than integrated high-speed acquisition. The work therefore occupies a different point on the monitoring spectrum: less comprehensive than laboratory chatter diagnostics, but potentially more accessible for routine deployment. The value of the present result lies in methodological clarity rather than in claiming superiority over higher-bandwidth approaches.
The aluminum-specific focus is also important when comparing the present results with prior literature. Some vibration-monitoring studies address steels or other harder alloys, where the force level, thermal behavior, and dynamic response can differ substantially [17]. Even within aluminum families, free-machining grades and wrought structural grades may not exhibit identical surface-generation behavior [10,12,18]. By restricting the present analysis to EN AW-2011 and explicitly avoiding cross-material extrapolation, the article preserves interpretive clarity and avoids one of the common pitfalls of overgeneralized machining claims.
4.3. Practical Implications for Shop-Floor Monitoring
For shop-floor use, the present calibration suggests a straightforward operating logic. The sensor does not need to detect every dynamic event in the cutting zone; it only needs to reveal whether the process is spending time in a displacement regime associated with acceptable or unacceptable roughness. In this role, the regression equation acts as a translation layer between a directly measurable signal and a quality attribute that is otherwise known only after post-process inspection. That translation can support trend monitoring, process adjustment, and experimental screening on conventional equipment. In practice, a displacement threshold could be used as a warning trigger for actions such as tool inspection, feed correction, clamping review, or a corrective finishing pass, even though such interventions were not executed as a closed-loop experiment in the present study. Given the 2 s update interval, such intervention should be framed as supervisory warning logic—for example, triggering tool inspection, feed correction, clamping verification, or a corrective finishing pass—rather than as instantaneous closed-loop suppression of high-frequency instability.
A second practical advantage is that the method is computationally light. The reported workflow can be executed with basic statistical tools and does not depend on training large models or extracting hundreds of features. This lowers the barrier to replication and makes recalibration feasible whenever the machine setup changes. For small laboratories, educational workshops, or prototype production cells, such simplicity may be more valuable than squeezing a small additional performance gain from a much more complex pipeline.
At the same time, practical use requires discipline. The calibration should be treated as local to the machine, material, tool geometry, mounting condition, and process window from which it was derived. A change in insert geometry, workpiece alloy, spindle condition, or sensor clamping stiffness can alter the displacement-roughness relation. In other words, the present equations are usable, but only when they are treated as living calibration tools rather than fixed universal constants.
4.4. Limitations and Threats to Generalization
Several limitations define the present study. First, the analysis is based on 190 synchronized records from one experimental workflow. Although the within-dataset relation is exceptionally strong, the study does not include an external validation subset, repeated independent trials, or machine-to-machine transfer testing. In addition, because the retained records are sequential observations from the same campaign, temporal autocorrelation may inflate the apparent statistical strength if the fit is interpreted as though all records were independent. The current results therefore establish a transparent internal calibration, not a general predictive law.
Second, the acquisition rate is fundamentally low. This was a deliberate aspect of the study because the goal was to evaluate what could be learned from a portable low-cost logger. However, the same feature that makes the setup accessible also prevents observation of higher-frequency dynamics. The FFT and STFT outputs should therefore be read as low-frequency summaries of observable modulation only. Any attempt to reinterpret them as chatter diagnostics would exceed the evidence contained in the data.
Third, the study isolates one directional signal. This is scientifically useful because it clarifies the contribution of normal-direction displacement, but it also means that the analysis does not address whether multi-axis sensing, force measurement, acoustic emission, or higher-bandwidth accelerometry would improve robustness. Such signals may well provide better transferability across setups. The present work simply shows that they are not strictly necessary to obtain a useful roughness indicator within the local conditions studied here.
Finally, the physical interpretation used in the discussion is simplified. Real cutting dynamics involve nonlinear contact phenomena, structural mode coupling, thermal effects, and possible interactions with tool wear or local material inhomogeneity. The approximation of bounded normal displacement as a roughness-relevant compliance response is appropriate for interpreting the present data, but it should not be mistaken for a full mechanistic model of surface generation. A more complete model would need broader instrumentation, repeated trials, and explicit treatment of process-memory effects. This limitation is reinforced by the supporting diagnostics in Appendix A: the raw V, Ra, and Rz series are not perfectly normal, even though the regression residuals remain sufficiently well behaved for descriptive linear calibration.
4.5. Future Research Directions
Future work should proceed along three clearly defined lines. First, the present calibration should be validated through repeated independent campaigns on the same machine and through transfer tests on other lathes. Such work would show how stable the fitted coefficients remain over time and how strongly the displacement-roughness relation depends on structural stiffness, spindle condition, sensor mounting, and local operating conditions. This is the most important next step, because the current article intentionally reports a within-setup calibration derived from one time-ordered dataset rather than an externally validated predictive model. Second, the 190-record journal dataset should be documented more explicitly at the data-management level. In future studies, the analytical interval should be identified by an explicit index definition, run-level segmentation rule, or archived subset file so that the reported equations can be reproduced directly from the supplied materials without ambiguity. This would strengthen transparency, reproducibility, and consistency between the manuscript, the analysis script, and the deposited dataset. Third, the monitoring chain can be extended beyond the present low-rate single-variable calibration. Higher-bandwidth sensing, additional directional channels, or combined displacement-force measurements could help distinguish slow roughness-related drift from faster dynamic events. In parallel, the broader computational workflow already developed for quality control, segmentation, feature extraction, and AI-oriented modelling could be evaluated under run-wise or blocked validation using independent campaigns. Such extensions should build on the present result rather than replace it: the current findings indicate that normal-direction displacement remains a physically meaningful core variable for future roughness-related monitoring architectures.
5. Conclusions
- Within the 190 synchronized records, normal-direction peak-to-peak displacement measured on the tool holder provided a strong low-frequency indicator of surface roughness during finish turning of EN AW-2011 aluminum alloy.
- The 190 analyzed records represent a synchronized time-ordered sequence from one controlled campaign rather than 190 independent cutting trials; this distinction is essential for correct interpretation of the model strength.
- Linear calibration against measured roughness produced the equations Ra = 14.204 + 24.191 V and Rz = 63.207 + 105.253 V, with R2 values of 0.9929 and 0.9905, respectively, demonstrating very strong within-dataset relations.
- The low-rate displacement signal should be interpreted as a descriptor of slow variation in the local tool–workpiece deflection state, not as a direct measurement of chatter or roughness-generation frequencies.
- The practical value of the approach lies in its simplicity: a single low-cost, direction-specific displacement measurement can support roughness-related supervision and warning-threshold logic on a conventional lathe when the model is calibrated for the actual setup in use.
- Because no separate validation set or cross-validation procedure was available, and because temporal autocorrelation cannot be excluded, the reported equations must be treated as setup-specific descriptive calibration relations whose broader transferability remains to be demonstrated.
Author Contributions
R.J.: Conceptualization; Investigation; Data curation; Writing—original draft. R.K.: Methodology; Formal analysis; Supervision; Writing—review and editing; Correspondence. All authors have read and agreed to the published version of the manuscript.
Funding
This research received no external funding.
Institutional Review Board Statement
Not applicable.
Informed Consent Statement
Not applicable.
Data Availability Statement
The 190-record synchronized dataset used in this study is available from the corresponding author upon reasonable request. Where editorial policy permits, the corresponding Scilab analysis script and supporting source metadata can be shared together with the journal dataset.
Conflicts of Interest
The authors declare no conflicts of interest.
Abbreviations
The following abbreviations are used in this manuscript:
| Abbreviation | Meaning |
| FFT | Fast Fourier transform |
| MAE | Mean absolute error |
| R2 | Coefficient of determination |
| Ra | Arithmetic mean roughness |
| RMSE | Root-mean-square error |
| Rz | Maximum height roughness parameter |
| STFT | Short-time Fourier transform |
| V | Normal-direction peak-to-peak displacement |
| ISO | International Organization for Standardization |
| EN AW | European Norm aluminum wrought alloy designation |
Appendix A
Appendix A.1. Additional Low-Frequency Spectral Descriptors
The FFT frequency resolution of the retained 190-point record is approximately 0.00263 Hz, which corresponds to a longest resolvable period close to the monitored interval itself. Table A1 lists the strongest low-frequency FFT components observed after mean removal. These values are reported only as descriptors of modulation visible to the sensor and should not be interpreted as direct chatter frequencies or structural modal frequencies of the cutting system.
Table A1.
Strongest low-frequency FFT components observed in the retained displacement record.
Appendix A.2. Normality Test Results
Shapiro–Wilk tests indicated that the raw V, Ra, and Rz series deviate from ideal normality (V:W = 0.9758, p = 0.0022; Ra:W = 0.9783, p = 0.0047; Rz:W = 0.9769, p = 0.0031). Anderson-Darling statistics led to the same practical conclusion for all three variables (V: A2 = 0.931; Ra: A2 = 0.833; Rz: A2 = 0.881; each above the 5% critical value of 0.749). These results do not invalidate the regression analysis, because normality is not required for the predictor itself and the study is framed as a within-setup calibration. Greater weight was therefore given to residual behavior, effect size, and physical interpretability than to strict normality of the raw variables.
Appendix A.3. Residual Diagnostics
Residual analysis was performed to verify model adequacy and to check whether the very high R2 values were masking systematic drift. For the Ra model, the Durbin-Watson statistic was 1.888 and the Breusch-Pagan heteroscedasticity test returned p = 0.636. For the Rz model, the corresponding values were 2.024 and p = 0.346. Together with the visually centered residual plots in Figure 4, these diagnostics indicate no strong evidence of variance inflation or first-order residual structure severe enough to undermine the descriptive linear calibration reported in the main text.
References
- Benardos, P.G.; Vosniakos, G.-C. Predicting surface roughness in machining: A review. Int. J. Mach. Tools Manuf. 2003, 43, 833–844. [Google Scholar] [CrossRef] [Scilit]
- Felhő, C.; Namboodri, T. Statistical Analysis of Cutting Force and Vibration in Turning X5CrNi18-10 Steel. Appl. Sci. 2025, 15, 54. [Google Scholar] [CrossRef] [Scilit]
- Dimla, D.E., Sr. Sensor signals for tool-wear monitoring in metal cutting operations—A review of methods. Int. J. Mach. Tools Manuf. 2000, 40, 1073–1098. [Google Scholar] [CrossRef] [Scilit]
- Sata, T.; Li, M.; Takata, S.; Hiraoka, H.; Li, C.Q.; Xing, X.G.; Xiao, X.G. Tool vibration and its influence on surface roughness in turning. Wear 1975, 35, 149–157. [Google Scholar] [CrossRef] [Scilit]
- Garcia Plaza, E.; Nunez Lopez, P.J. Surface roughness monitoring by singular spectrum analysis of vibration signals. Mech. Syst. Signal Process. 2017, 84, 516–530. [Google Scholar] [CrossRef] [Scilit]
- Chen, J.; Lin, J.; Zhang, M.; Lin, Q. Predicting surface roughness in turning complex-structured workpieces using vibration-signal-based Gaussian process regression. Sensors 2024, 24, 2117. [Google Scholar] [CrossRef] [Scilit]
- Asiltürk, İ.; Kuntoğlu, M.; Binali, R.; Akkuş, H.; Salur, E. A Comprehensive Analysis of Surface Roughness, Vibration, and Acoustic Emissions Based on Machine Learning during Hard Turning of AISI 4140 Steel. Metals 2023, 13, 437. [Google Scholar] [CrossRef] [Scilit]
- Abellán-Nebot, J.V.; Vila Pastor, C.; Siller, H.R. A Review of the Factors Influencing Surface Roughness in Machining and Their Impact on Sustainability. Sustainability 2024, 16, 1917. [Google Scholar] [CrossRef] [Scilit]
- Altintas, Y. Manufacturing Automation: Metal Cutting Mechanics, Machine Tool Vibrations, and CNC Design, 2nd ed.; Cambridge University Press: Cambridge, UK, 2012. [Google Scholar]
- Cheung, C.F.; Lee, W.B. A Theoretical and Experimental Investigation of Surface Roughness Formation in Ultra-Precision Diamond Turning. Int. J. Mach. Tools Manuf. 2000, 40, 979–1002. [Google Scholar] [CrossRef] [Scilit]
- Niesłony, P.; Królczyk, G.M.; Wojciechowski, S.; Chudy, R.; Żak, K.; Maruda, R.W. Surface Quality and Topographic Inspection of Variable Compliance Part after Precise Turning. Appl. Surf. Sci. 2018, 434, 91–101. [Google Scholar] [CrossRef] [Scilit]
- Cheung, C.F.; Lee, W.B. Characterisation of Nanosurface Generation in Single-Point Diamond Turning. Int. J. Mach. Tools Manuf. 2001, 41, 851–875. [Google Scholar] [CrossRef] [Scilit]
- VB-8206SD. User Manual: Portable Vibration Analyzer VB-8206SD; Manufacturer Documentation; Lutron: Coopersburg, PA, USA, 2020. [Google Scholar]
- ISO 4288:1996; Geometrical Product Specifications (GPS)-Surface Texture: Profile Method-Rules and Procedures for the Assessment of Surface Texture. International Organization for Standardization: Geneva, Switzerland, 1996.
- ISO 21920-1:2021; Geometrical Product Specifications (GPS)—Surface Texture: Profile. Part 1: Indication of Surface Texture. International Organization for Standardization: Geneva, Switzerland, 2021.
- Montgomery, D.C.; Runger, G.C.; Hubele, N.F. Engineering Statistics, 5th ed.; John Wiley & Sons: Hoboken, NJ, USA, 2012. [Google Scholar]
- Bhuiyan, M.S.H.; Choudhury, I.A. Investigation of tool wear and surface finish by analyzing vibration signals in turning Assab-705 steel. Mach. Sci. Technol. 2015, 19, 236–261. [Google Scholar] [CrossRef] [Scilit]
- Dudzik, K.; Labuda, W. The influence of the machining parameters of AW-7020 aluminum alloy shafts on the surface roughness, cutting forces, and acoustic emission signal. Materials 2025, 18, 1992. [Google Scholar] [CrossRef] [Scilit] [PubMed]

Disclaimer/Publisher’s Note: The statements, opinions and data contained in all publications are solely those of the individual author(s) and contributor(s) and not of MDPI and/or the editor(s). MDPI and/or the editor(s) disclaim responsibility for any injury to people or property resulting from any ideas, methods, instructions or products referred to in the content. |
© 2026 by the authors. Licensee MDPI, Basel, Switzerland. This article is an open access article distributed under the terms and conditions of the Creative Commons Attribution (CC BY) license.