


Highlights
What are the main findings?
- UAV remote sensing can be used throughout maize growth, from seedling emergence to maturity, to assess stand establishment, canopy development, water and nutrient status, pests and diseases, lodging, and yield variation.
- Routine field use of UAV remote sensing is still constrained by inconsistent data acquisition, poor model transfer across sites and seasons, difficulty in separating stresses with similar symptoms, and weak links between monitoring products and machinery operations.
What are the implications of the main findings?
- UAV surveys should be designed around maize growth stage and the decision at hand, rather than around the highest available resolution or the most complex sensor package.
- Further progress will depend on practical workflows that convert UAV observations into field-ready prescriptions and use operation records, crop response, yield, and economic outcomes to determine whether an intervention was effective.
Abstract
Unmanned aerial vehicle (UAV) remote sensing can reveal spatial variability in maize, but its value depends on whether observations support timely and reliable management. This structured critical review synthesizes UAV applications from stand establishment and canopy development to water and nutrient assessment, stress monitoring, yield prediction, and decision support. The evidence corpus comprised 82 sources, including 51 core maize–UAV studies, evaluated by growth stage, validation strength, and operational endpoint. RGB, multispectral, hyperspectral, thermal, and three-dimensional methods provide complementary information for plant counting, canopy traits, treatment-related water and nitrogen responses, visible stress mapping, and within-experiment yield variation. Most evidence, however, comes from experimental or site-specific settings. Independent testing across sites, years, cultivars, and production environments remains uncommon, as do physiological confirmation of interacting stresses and translation of diagnostic maps into machinery-ready operations. UAV sensing should therefore be viewed as complementary to satellite observations and field scouting, with its advantage determined by target, scale, timing, and decision requirements. Future research should prioritize phenology-aware acquisition, independent field validation, uncertainty relative to management thresholds, interoperable prescription and machinery data, and closed-loop evaluation of input use, crop response, yield, and economic return. These steps are needed to move from high-resolution mapping toward reproducible precision management in maize.
1. Introduction
Maize is a major source of food and feed, as well as an important raw material for industry and biomass production, and it remains central to global food security and livestock production [1]. Producers are increasingly expected to maintain yields while using water, fertilizer, and pesticides more efficiently amid greater climate variability and rising input costs. Field scouting provides direct observations, but limited coverage and slow turnaround make it difficult to characterize within-field variation across large production fields.
The information needed for management also changes with crop development. Emergence, plant density, gaps, and spatial uniformity characterize stand establishment. From jointing through tasseling and silking, canopy structure, leaf area, biomass, and crop water and nitrogen status become more informative. During grain filling and maturation, stress progression, lodging, senescence, and yield formation take precedence. Monitoring must therefore be aligned with phenology and completed while corrective action is still possible.
Recent reviews cover UAV multispectral methods in precision agriculture [2], applications across gramineous crop stages and traits [3], maize crop protection [4], and the broader sensing-to-intervention pipeline [5]. A maize-specific synthesis is still needed to relate evidence to phenology, distinguish experimental plots from production fields, separate trait estimation and anomaly detection from causal diagnosis, and assess progression to executable management and post-operation validation. A seasonal framework also reveals when an accurate model has limited practical value because its output arrives too late, operates at the wrong scale, or does not support a specific action.
UAV, satellite, and manual observations serve different purposes. UAV imagery resolves plants, rows, lesions, and small management zones; satellites provide broader, repeated coverage with less field deployment; and scouting supplies direct observations needed to confirm many remotely detected anomalies. Few maize studies have compared these approaches under the same conditions using common measures of accuracy, coverage, labor, cost, usable observation windows, and decision turnaround. Their relative value should therefore be judged for a defined target, field scale, resolution, and deadline rather than through general claims of superiority.
UAV applications occupy distinct evidence levels. Trait estimation derives variables such as plant count, height, LAI, SPAD proxy, temperature, or yield. Anomaly detection locates departures from a reference canopy, whereas causal diagnosis attributes them to a limiting process using physiological, environmental, management, and field evidence. Prescription generation then specifies spatial units, rates, timing, and equipment constraints. Intervention validation uses as-applied records, crop response, yield, inputs, and economics to test execution and benefit. Evidence at one level does not establish the next.
Maize applications span the growing season. RGB imagery supports plant and leaf detection [6,7]; RGB and multispectral data have been used to estimate leaf nitrogen and LAI [8,9,10]; and multispectral observations can map treatment-related water-status differences [11]. High-resolution imagery and learning methods delineate disease symptoms or injury [12,13,14], while multi-temporal and multi-source features improve yield prediction within experiments [15,16,17]. Coupling hyperspectral observations with radiative-transfer simulations can strengthen physiological interpretation and extrapolation diagnostics [18], although independent site-year evidence remains limited.
This review has three objectives: (a) synthesize how UAV observations support stand assessment, canopy-trait retrieval, water and nutrient diagnosis, stress monitoring, yield prediction, and field decisions across maize development; (b) critically compare sensors, flight design, analytical methods, validation, uncertainty, and decision value; and (c) identify the requirements for transferable workflows linking UAV products to agronomic thresholds, machinery execution, and feedback evaluation. Figure 1 presents this seasonal, decision-oriented structure.
Figure 1.
Phenology- and decision-level framework for UAV remote sensing in precision maize production. Maize studies have demonstrated links from acquisition to plant/trait estimation, treatment-related stress mapping, and within-experiment yield prediction. Links from anomaly maps to independently confirmed causal diagnosis, machinery-ready prescriptions, executed operations, and agronomic–economic feedback remain predominantly prospective.
This article was designed as a structured critical review, not as a systematic review or meta-analysis. The search therefore sought a broad, representative evidence base for comparison across maize growth stages, applications, validation levels, and operational endpoints rather than an exhaustive bibliometric census. Web of Science Core Collection, Scopus, and Google Scholar were searched through January 2026 using (“maize” OR “corn” OR “Zea mays”) AND (“UAV” OR “UAS” OR “unmanned aerial vehicle” OR “drone”) AND application terms covering establishment, traits, water, nitrogen, stress, yield, prescription, machinery, and decision support. Narrower combinations were used where necessary, and reference lists of recent reviews [2,3,4,5] were searched backward.
Records were screened by title and abstract and then by full text. Duplicates were identified by DOI or, when unavailable, by normalized title, first author, and year. Core studies were peer-reviewed primary research on maize that used UAV/UAS observations or directly supported a UAV-enabled application, defined an agronomic target, and reported enough detail on sensing, field design, analysis, and validation. Studies without maize, a UAV/UAS platform, a defined application, peer review, primary evidence, or adequate maize-specific design and validation information were excluded from the core corpus. Reviews, standards, radiometric-method papers, proximal or satellite studies, and non-maize examples were retained only as adjacent methodological or operational benchmarks and were not counted as maize–UAV performance evidence. Because the iterative search was not prospectively logged as a systematic-review workflow, initial, deduplicated, and screened record counts were not reconstructed retrospectively.
The final evidence corpus comprised 82 unique sources: 51 core primary maize–UAV studies, 12 adjacent empirical or comparator studies, 18 reviews or background sources, and one standard. This classification enabled this review to distinguish direct maize–UAV evidence from contextual material while retaining methodological and operational comparators needed for critical interpretation. The study-level characteristics and evidence appraisal of all 51 core primary maize–UAV studies are summarized in Supplementary Table S1.
Core studies were coded by application, crop stage, field context, sensor and scale, independent experimental unit, validation split, independent site/year/cultivar evidence, uncertainty, and furthest operational endpoint. A production field was recorded only when the maize site was explicitly described as on-farm, commercial, or operational production. Evidence was considered stronger with independent fields or site-years and, where relevant, management outcomes; moderate with multiple treatments and held-out testing within one program; and limited with record-level random splits or image-only metrics. Counts refer only to explicit reporting in the cited papers, not to all maize–UAV research.
2. UAV Remote Sensing Data Acquisition and Processing
Reliable UAV applications begin with the intended decision and the data quality needed to support it. Scouting, loss prevention, and operation planning differ in resolution, calibration, turnaround, and cost [19,20,21]. Because low-altitude maize imagery is sensitive to height, overlap, illumination, wind, attitude, and mosaicking, mission design should work backward from the agronomic output and document acquisition and quality control consistently [22].
2.1. UAV Platforms and Sensor Types
Platforms are compared here by target size and GSD, field coverage, revisit and turnaround, required radiometric or geometric accuracy, and total operating burden. Multi-rotor UAVs suit plant-level detection, breeding plots, and local stress surveys; fixed-wing or hybrid systems better cover large contiguous areas but need launch and recovery space and usually operate at coarser GSD. Comparisons should use the same field scale and product-quality requirement, not nominal endurance alone [20,23].
Sensor choice follows the same logic. RGB cameras economically resolve plants, rows, gaps, and visible injury; multispectral sensors add red-edge and near-infrared information for growth, nitrogen, and LAI [8,10]; hyperspectral and thermal systems provide richer physiological signals at higher calibration and processing cost [18,24]; and photogrammetric DSMs describe structure [25]. Added sensors are justified when independent gains at the target threshold outweigh acquisition, processing, and missing-data burdens. Most reported gains were within experiments, with little evidence of better external transfer or net operational value.
Figure 2 summarizes the main sensor types and their typical maize applications.
Figure 2.
Sensor-to-decision trade-offs for UAV maize monitoring. Each modality is linked to the primary observable, representative agronomic outputs, and characteristic operating scale; the panels emphasize complementarity rather than a performance ranking (organized from Refs. [6,8,25,26,27]). Reused panels: licensed under CC BY 4.0; cropped and reformatted.
Multi-rotor endurance can limit production-field coverage. Payload, wind, speed, overlap, and reserve requirements reduce usable battery time, while landing, battery exchange, charging, and movement between launch points add downtime. Large-field studies should report usable hectares per battery, reserve policy, batteries and charging capacity, launch access, and expected downtime. If low-altitude coverage cannot be completed within a stable illumination window, fixed-wing coverage, targeted multi-rotor flights, or satellite–UAV tasking may be more appropriate. These platform-level constraints should be considered together with sensor characteristics, because acquisition scale, payload, spatial resolution, and operational flexibility jointly determine the suitability of a UAV sensing configuration for a given maize phenotyping task. Table 1 summarizes the principal sensor/platform options, their compatible operating scales, and key acquisition trade-offs in maize–UAV applications.
Table 1.
Sensor types, compatible operating scales, and principal acquisition trade-offs in maize–UAV applications.
2.2. Data Acquisition and Flight-Parameter Design
Acquisition should follow canopy development. Seedling detection requires low altitude and fine resolution because plants are small and soil is exposed. From jointing through silking, rapid vertical growth and canopy closure demand adequate overlap for reconstruction. During grain filling and maturity, consistent multi-temporal acquisition and accurate anomaly mapping become more important as senescence, lodging risk, and canopy complexity increase.
Flight design balances target visibility, coverage, and temporal comparability. Low altitude favors seedlings, lesions, and weeds but reduces coverage and increases data volume. Quantitative multi-date spectral comparison requires stable illumination, reflectance panels or downwelling sensors, accurate registration, and consistent camera settings [24,28,29,30]. UAS guidance treats mission parameters, calibration, sampling, and processing as one measurement chain [22]; for seasonal monitoring, consistency among flights is usually more valuable than maximum resolution on one date.
For hyperspectral imaging, height, speed, and integration time must be selected together. Lower altitude improves spatial separation but reduces photons per pixel and can lower SNR; higher altitude improves coverage and sometimes radiometric stability but increases mixed pixels. Longer integration may improve SNR yet increase blur or saturation. Studies should report GSD, speed, integration time, illumination, overlap, spectral SNR or panel repeatability, and the smallest relevant target, and then verify both spectral quality and spatial separability.
Maize-specific flight thresholds are task-dependent. For V2-V5 counting, a spatial-resolution study was trained near 0.32 cm GSD and validated at about 0.30 and 0.60 cm; mismatched native 0.60 cm imagery produced rRMSE = 0.48 [31]. Another experiment found useful trait-retrieval accuracy near 80–100 m and marked deterioration at 200 m [32]. General guidance stresses overlap, geometry, and radiometric quality [22,24,28,29,30] but does not establish universal maize thresholds. As author-defined starting points, we propose 0.3–0.6 cm GSD with at least 80% forward and 70% side overlap for V2-V5 counting; 1–5 cm with 75–85% forward and 65–80% side overlap for canopy traits; and 2–10 cm for zone-level stress and yield mapping. Lesion or weed detection may need sub-centimeter pixels. These ranges require local validation for each aircraft–sensor–task combination and are not consensus standards.
2.3. Image Preprocessing and Feature Extraction
UAV imagery typically undergoes quality screening, distortion and radiometric correction, aerial triangulation, orthomosaic generation, georeferencing, and plot or field extraction. RGB applications depend on sharpness, registration, and plant boundaries; multispectral and hyperspectral workflows also require careful radiometric correction and band registration because illumination or sensor differences propagate into indices and models.
Feature extraction connects imagery with agronomic indicators. Common features include spectral reflectance, vegetation indices, color indices, texture, canopy cover, plant height, canopy height models, and temporal-change metrics. Seedling-stage studies often use RGB color features, plant edges, object-detection boxes, and row-centerline information to detect individual plants, count seedlings, and evaluate planting uniformity [6]. During vegetative growth and grain filling, red-edge and near-infrared bands are useful for chlorophyll, nitrogen, and LAI retrieval [8,10,18]. Digital surface models reconstructed from overlapping RGB images provide three-dimensional information for plant-height and canopy-structure retrieval [25].
Errors accumulate across this chain. Illumination biases reflectance; band misregistration alters edge pixels; attitude and lens errors affect geometry; uncertain terrain models shift canopy height; and boundary, registration, label, or laboratory errors constrain calibration. Products should report the principal acquisition, calibration, georeferencing, extraction, reference, model, and extrapolation uncertainties. Repeated panels or flights, checkpoints, bootstrap or ensemble predictions, perturbation tests, and sensitivity analysis can estimate their effect when analytical propagation is impractical.
2.4. Modeling Methods and Multi-Source Data Fusion
Empirical regression, machine learning, deep learning, and mechanism-guided models serve different purposes rather than a simple performance hierarchy. Empirical models are transparent but often local; machine learning captures nonlinear relations but can overfit small field datasets; and deep learning is effective for detection and segmentation but requires annotation and may offer limited agronomic explanation [6,8,10,15]. For transfer across stages or environments, crop-development or radiative-transfer constraints can reduce reliance on purely empirical relations [21].
Fusion is useful when inputs represent complementary processes. Spectral, thermal, structural, temporal, soil, weather, and management data can jointly describe crop status: high-frequency observations identify yield-sensitive windows [15], multi-source features improve within-experiment yield representation [16,17], and radiative-transfer coupling aids physiological interpretation [18]. Yet, better internal accuracy does not establish external robustness. Maize studies often report gains from added features within the same calibration domain [13,16,33,34], while Bevers et al. found that thermal and height data reduced external-year SCMV performance [35]. Broader use therefore requires gains over a simpler baseline under held-out fields, years, sites, or cultivars, together with ablation, missing-sensor, synchronization, and workload assessment.
Interpretability requires traceable inputs, response direction, spatial and phenological domain, uncertainty, and decision consequence. Transparent models show these links directly; complex models need explanations that remain stable across folds, years, and sites, supported by spatial errors, sensitivity tests, and agronomic plausibility. A model may explain spectral drivers yet remain operationally opaque if it cannot show why a zone crosses a management threshold.Accordingly, the choice of analytical method should balance predictive performance with interpretability, robustness, data requirements, and validation rigor; Table 2 summarizes the main approaches used in maize–UAV remote sensing and their practical strengths, limitations, and validation priorities.
Table 2.
Common data-analysis approaches for maize–UAV remote sensing and their practical strengths and limitations.
2.5. Evidence Appraisal and Validation Design
Sample size should be counted at the level of independent plots, fields, or flights, not pixels, tiles, augmented images, or repeated observations. Spatially and temporally correlated records placed in both training and testing sets can yield optimistic performance estimates.
Validation is stronger as test data become more independent of model development: spatially blocked or leave-block-out folds exceed random record splits, while held-out fields, sites, years, or cultivars provide stronger transfer evidence. Preprocessing, feature selection, augmentation, and tuning should remain within training folds. Appraisal should emphasize independent fields, years, sites, cultivars, treatments, and reference units rather than image-record counts.
The 51-study core corpus is concentrated in experiments. Primary sensing comprised 21 RGB/RGB-photogrammetry studies (41.2%), 19 multispectral (37.3%), four hyperspectral (7.8%), and seven multimodal or multi-source studies (13.7%). Under the conservative field-context rule, one study (2.0%) explicitly used an on-farm maize setting [36]; 50 (98.0%) were experimental or insufficiently documented to verify production use. The mixed-crop study [37] was not counted because its maize site was experimental. Only two studies (3.9%) reported independent-site or independent-year testing [31,35]; 49 (96.1%) did not. Multi-year treatment studies [38,39] add temporal evidence but are not broad geographic transfer tests. These proportions characterize this corpus, not all maize–UAV research.
Accuracy must be interpreted against decision-relevant uncertainty. R2 and RMSE alone do not show whether an output is reliable enough for action: R2 depends on reference range, and RMSE is useful only in physical units and relative to a management threshold. Bias, MAE, intervals, spatial residuals, class-specific errors, and calibration add needed context. Practical sufficiency is shown when plausible measurement and model errors do not change the resulting management decision.
3. Fine-Scale Monitoring of Seedling Establishment and Stand Structure
Stand establishment shapes later crop development and yield through sowing quality, seed vigor, soil conditions, pests, weeds, and machinery performance. Manual surveys are direct but spatially limited; centimeter-resolution UAV imagery enables repeatable plant-level detection and diagnosis before canopy closure.
Figure 3 organizes the seedling-stage workflow from UAV RGB image acquisition and individual-plant detection to gap and spacing diagnosis, Voronoi-based spatial analysis, and condition mapping.
Figure 3.
Evidence chain for maize seedling establishment: image acquisition and plant detection are converted into georeferenced counts, gaps, spacing, Voronoi occupancy, condition maps, and field-check or replanting priorities (organized from Refs. [40,41,42]). Reused panels: licensed under CC BY 4.0; cropped and reformatted.
Establishment quality is expressed through emergence, plant density, missing or duplicated plants, row continuity, spacing variation, and canopy cover. Because maize seedlings are small, bare soil remains visible, and rows are distinct, this stage is particularly suitable for individual-plant recognition and row-based spatial analysis. Performance, however, is sensitive to image resolution, illumination, soil background, weed interference, and the onset of leaf overlap.
3.1. Maize Plant Detection and Plant Counting
Seedling methods remain context-dependent. Color indices, thresholding, morphology, and connected components are efficient for separated plants under stable illumination and low weed pressure. Learned detectors better accommodate variable soil, leaves, and lighting but depend on diverse annotations and suitable GSD. Reviews and maize comparisons show that handcrafted and learned methods remain useful when matched to field complexity [23,43,44].
The required output matters more than leaderboard accuracy. Detectors such as Faster R-CNN and YOLO variants locate and count separated seedlings [6,31], while row- or neighborhood-aware models better support spacing diagnosis. Models leading in total count may not lead in spacing accuracy [42]; so, evaluation should include omissions, localization, and derived spacing stability. For leaf phenotyping, Mask R-CNN and YOLOv5 detected unfolded and newly emerged leaves, with lower accuracy for small, occluded organs [7].
Field context remains a major source of error. Detection performance varies with soil color, illumination, planting density, phenology, weed pressure, and the diversity of the annotated dataset. Because seedlings occupy few pixels, flight height and GSD strongly affect localization and omission, while leaf overlap, weeds, and shadows introduce additional confusion as the canopy develops.
Seedling performance depends on stage, GSD, image quality, and domain match. At V3-V5, Velumani et al. obtained rRMSE = 0.08 at an independent site with matched high-resolution imagery, but 0.48 with mismatched native imagery near 0.60 cm GSD [31]; by V6, overlap obscures plant centers [40]. Studies address weeds, soil, and shadows through color or morphology, row priors, labeled backgrounds, augmentation, learned detectors, and controlled acquisition [31,40,41,42,43,44,45,46,47]. Evaluation should also cover residue, curved rows, headlands, irregular geometry, and variable illumination using omission, commission, count, localization, gap, and spacing errors.
3.2. Emergence Rate, Missing Plants, Broken Rows, and Replanting Decisions
UAV imagery can record individual plant positions at field scale and, when combined with theoretical spacing, row spacing, and seeding density, can estimate missing-plant rate, duplicate-plant rate, and emergence uniformity. This spatially explicit information is more useful than plot-level emergence estimates for replanting, gap filling, and localized management.
Plant detection and stand diagnosis are different tasks. Counts estimate emergence and broad uniformity [45] but can hide clustered gaps or duplicates. Voronoi or within-row analysis converts coordinates into occupied area, missing-plant, and duplication indicators [41], which better support replanting or planter adjustment.
Reliable diagnosis also depends on row and field geometry. Estimating row direction and centerlines before computing gaps, duplicates, and spacing anomalies reduces errors near headlands, curved rows, and field edges. Expected spacing is informative when planter settings are known, whereas neighbor-based spacing is more appropriate when actual row geometry varies. These spatial descriptors can support planter calibration, cultivar evaluation, and post-disaster stand assessment.
A mapped gap does not alone justify replanting. Decisions also depend on achieved versus target stand, gap clustering, emergence delay, remaining season, affected area, expected yield recovery, and re-entry cost. These factors vary by hybrid, density, sowing date, soil, and region; so, thresholds must be defined and tested locally. Current evidence supports stand-quality mapping more strongly than automated reseeding.
3.3. Row-Structure Extraction and Plant-Spacing Uniformity Analysis
Because maize is usually planted in regular rows, row structure is clear at the seedling stage and provides a useful constraint for image analysis. Crop rows can reduce false plant detections caused by weeds and noise. Their centerlines, combined with plant positions, also allow row spacing, plant spacing, broken-row length, and spacing variation to be calculated for sowing-quality assessment and field-operation navigation.
Rows can be measured after plant detection or used as a prior. Geometric descriptors with deep networks recover early rows [46], while joint CNNs estimate rows and plants together [47]. Joint estimation reduces inconsistency but needs representative training data. Row priors are strongest in regular planting and weaker at curved rows, headlands, severe gaps, or lodged canopies.
Plant-spacing uniformity provides a direct measure of sowing quality. Wang et al. used UAV imagery and deep learning for plot-level counting and spacing-variation detection, demonstrating that plant coordinates can be converted automatically into spacing features [42]. Because spacing affects resource capture, canopy closure, interplant competition, and the spatial distribution of yield, seedling assessment needs to identify within-row gaps, duplicates, and unusually large or small intervals rather than report plant number alone.
3.4. Seedling Canopy Cover and Early Growth Assessment
Canopy cover and seedling vigor complement plant-count information because they reflect leaf expansion, stand establishment, and early growth differences. These indicators are useful for cultivar comparison, sowing-date and water–fertilizer experiments, stress evaluation, and early assessment of yield potential.
Gao et al. developed an automated method for monitoring maize seedlings in UAV RGB imagery. A seedling-center detection index, morphological processing, and dual thresholds were used to derive plant number, emergence, canopy cover, and vigor uniformity at the three- and six-leaf stages [40]. Once leaves begin to overlap, stand-level measures such as canopy area, color, texture, and inter-row cover may become more stable than plant-by-plant segmentation.
Visible-light indices separate vegetation from soil, but performance depends on stage and environment. Gao et al. found weak color cues at V3, ambiguous segmentation after V6 leaf overlap, and better results from a maize-specific seedling-center index than several generic indices [40]. ExG, ExGR, VARI, NGRDI, and GLI are most useful before closure under stable illumination. Shadows, residue, soil color, weeds, overlap, senescence, and GSD shifts require flight- or site-specific thresholds, normalization, spatial features, or learned models.
Georeferenced plants, row segments, gaps, and stand-quality zones also establish a baseline for later height, LAI, and biomass trajectories. This linkage helps separate weak establishment from deterioration after canopy closure.
For management use, canopy-cover and vigor products should be judged by the stability of the derived stand-quality zones and their relevance to subsequent field decisions, rather than by image-level accuracy alone. Table 3 summarizes representative UAV-based maize seedling and stand assessment studies, highlighting their reported performance, validation strength, and implications for field-level decision making.
Table 3.
Representative performance evidence for UAV-based maize seedling and stand assessment. Validation strength is evaluated from the information reported in the cited studies.
4. Maize Growth Monitoring and Canopy-Parameter Retrieval
After jointing, the analysis shifts from individual plants to canopy traits: height, LAI, cover, chlorophyll, and biomass. These variables describe development and inform later assessment of water, nutrients, stress, lodging, and yield.
4.1. Growth-Monitoring Indicators and Remote Sensing Representation
Growth monitoring combines morphological, physiological, and productivity-related indicators. Plant height, canopy cover, LAI, and canopy height models characterize stand structure and canopy development; SPAD, chlorophyll, leaf water content, and nitrogen-related indicators reflect physiological status; and aboveground biomass and dry-matter accumulation describe productive growth. UAV multispectral observations have been used to jointly assess multiple crop traits, including plant height, SPAD, LAI, soil moisture, leaf water content, and biomass [32]. Other studies have combined plant height, SPAD, and LAI to provide an integrated assessment of maize growth status [48]. Together, these studies illustrate the value of combining complementary indicators rather than relying on a single vegetation index.
Different indicators require different data representations. Structural traits depend primarily on photogrammetry, DSMs, or LiDAR; LAI, biomass, SPAD/chlorophyll proxies, and nitrogen-related traits use spectral, texture, and learned features; and canopy cover is commonly derived through segmentation. Spectral, structural, and temporal information can be combined when they represent complementary aspects of crop development [16,33,49,50], with their relative contribution varying across traits and growth stages.
Figure 4 links these indicator groups within a common pathway from UAV data acquisition to growth-state interpretation. Structural information supports plant-height and canopy-development assessment, spectral and texture features contribute to LAI, biomass, and physiological-trait retrieval, and multi-temporal observations provide the phenological context needed for the methods discussed in Section 4.2, Section 4.3, Section 4.4, Section 4.5 and Section 4.6.
Figure 4.
Scale- and phenology-aware retrieval of maize canopy traits. Structural, spectral–textural, hyperspectral, and temporal observations support plant height, LAI, biomass, SPAD, and growth-state interpretation, while flight altitude and observation window constrain model validity (organized from Refs. [15,25,26,32,33,36]). Reused panels: licensed under CC BY 4.0; cropped and reformatted.
4.2. Plant Height and Three-Dimensional Canopy Structure Retrieval
Manual ruler measurements provide direct plant-height references but are labor-intensive and spatially sparse, making it difficult to characterize within-field variability at high sampling density. Overlapping UAV imagery can instead be reconstructed into a digital surface model (DSM), from which a canopy-height model (CHM) is obtained by subtracting an appropriate ground elevation model. This approach enables spatially continuous estimation of maize canopy height and supports repeated assessment across plots or field areas.
Photogrammetric DSMs provide fine structural detail for plots and local field assessment [25], whereas satellite data can extend spatial or temporal coverage [51]. Their value depends on the task. Few maize studies compare UAV height, satellite estimates, and manual measurements under identical conditions using common measures of accuracy, labor, cost, coverage, and turnaround; claims of superiority should therefore remain application-specific.
Height uncertainty arises from terrain models, DSM interpolation, canopy-percentile choice, tassels, wind, occlusion, weak texture, and inconsistent manual references. Oehme et al. showed that agreement varied with stage and reference definition [25]. Validation should report the reference definition, terrain or checkpoint error, CHM rule, tassel treatment, wind, overlap, control configuration, missing surfaces, matching tolerance, and stage-specific bias or MAE, with emphasis on whether uncertainty changes the intended interpretation.
4.3. Leaf Area Index and Canopy Cover Estimation
Destructive sampling, canopy analyzers, and handheld instruments provide LAI reference measurements but do not support frequent field-scale surveys. UAV imagery extends LAI and canopy-cover assessment spatially by combining canopy spectral response with high-resolution structural information.
LAI sensor needs change with canopy development. RGB plus machine learning can work before structural complexity increases [9]; multispectral texture adds sensitivity after jointing as spectral indices begin to saturate [33]. Neither is stage-independent, and post-closure LAI is better interpreted with height, red-edge response, and phenology.
Canopy cover represents the proportion of ground area occupied by crop canopy and is easier to obtain than LAI from RGB segmentation, vegetation-index thresholds, or semantic segmentation. It is particularly useful from emergence to jointing, when the canopy is not fully closed and leaf expansion reflects stand establishment. After canopy closure, canopy cover saturates and loses sensitivity to growth differences; later-stage assessment should combine it with LAI, plant height, red-edge indices, texture, and three-dimensional structural information.
4.4. Aboveground Biomass and Dry Matter Accumulation Estimation
Aboveground biomass is conventionally measured by destructive sampling, drying, and weighing, which limits sampling frequency and spatial coverage. UAV-based approaches instead relate biomass to canopy spectra, height, cover, texture, and temporal change to provide rapid, nondestructive estimates.
Biomass models increasingly combine structure and time. Height with canopy cover represents vertical and horizontal growth and can reduce spectral saturation [49], while time-series multispectral features describe accumulation trajectories [50]. Their value depends on reliable height, consistent acquisition, ground calibration, and stage-aware modeling.
4.5. SPAD, Chlorophyll, and Canopy-Physiological-Status Monitoring
SPAD readings are optical proxies for leaf chlorophyll status, whereas laboratory chlorophyll measurements quantify pigment content; both are associated with nitrogen supply, senescence, and physiological stress. Because chlorophyll affects reflectance in the red, red-edge, and near-infrared regions, UAV multispectral and hyperspectral imagery is widely used to estimate SPAD values or chlorophyll-related traits in maize.
Multispectral and hyperspectral approaches address different sensing needs. Multispectral red-edge indices provide relatively low-cost mapping of chlorophyll variation, although their relationships vary with viewing scale, irrigation, canopy structure, and phenology [52,53]. Hyperspectral imagery resolves narrower chlorophyll-sensitive regions and can improve physiological retrieval [26], but requires more demanding calibration, band selection, and processing. Multispectral systems are therefore well suited to routine within-field monitoring, whereas hyperspectral sensing is more useful when finer spectral discrimination is required.
UAV-derived LAI, biomass, SPAD, and chlorophyll are indirect canopy estimates. Leaf rank, canopy layer, timing, footprint, LAI, leaf angle, soil fraction, illumination, and senescence all affect scaling. Before closure, cover and green indices respond strongly to expansion; near closure, NDVI-type indices saturate; after tasseling, upper-canopy reflectance may diverge from whole-plant status [26,52,53].
This vertical mismatch is important because nadir imagery mainly samples upper leaves, which differ from lower leaves in exposure, age, nitrogen allocation, and senescence. Leaf-position references, vertical-structure models, multi-angle data, and careful band selection can reduce the mismatch.
Oblique imagery and LiDAR can add layer-aware structure, although overlap, anisotropic illumination, wind, and flight time limit completeness. LiDAR samples multiple canopy depths, and hyperspectral LiDAR co-registers structure and spectra. Bi et al. reported partial least-squares R2 values above 0.60 for leaf- and plant-level maize nitrogen from hyperspectral-LiDAR point clouds [54]. Combining such geometry with spectral or thermal data and layer-specific ground truth is promising [24,25,54,55].
4.6. Multi-Temporal Growth Dynamics and Phenological Differences
The most informative remote sensing indicators and modeling windows change as maize develops. Seedling and early jointing assessments rely more heavily on plant number, canopy cover, and RGB features. From jointing through tasseling and silking, rapid changes in plant height, LAI, biomass, and red-edge indices provide the main window for canopy-trait retrieval. During grain filling and senescence, structural and spectral responses increasingly reflect late-season physiology; so, interpretation must remain stage specific.
Yang et al. showed that observation timing substantially affects within-program yield-prediction performance [15], while Li et al. combined UAV hyperspectral observations with radiative-transfer simulation across fields, treatments, and growth stages [18]. Together, these studies support phenology-aware modeling and the use of temporal context to interpret changing canopy responses.
Multi-date comparability is as important as frequency. Illumination, view geometry, exposure, sensor temperature, panel drift, atmosphere, wind, height, mosaicking, and registration can mimic crop change. Stable windows, radiometric normalization, checkpointed co-registration, common masks, and stable-target checks help separate biological from technical variation; repeated observations should be analyzed as longitudinal data.
The appropriate sensing combination likewise changes with trait and growth stage. RGB imagery supports canopy-cover and visible-structure assessment [36], multispectral and hyperspectral observations contribute physiological information [18,33], and photogrammetric DSMs provide plant-height information [25]. These products describe different components of crop development and are most informative when interpreted together with the establishment baseline, phenology, weather, and field operations. Canopy-trait retrieval therefore forms an intermediate layer between imagery and management diagnosis rather than providing a direct diagnosis by itself.
Representative quantitative results for plant height, LAI, SPAD, and altitude-dependent canopy-trait retrieval are summarized in Table 4. Together, these examples illustrate that reported performance depends not only on the target trait and sensing modality, but also on growth stage, measurement definition, and acquisition scale.
Table 4.
Representative quantitative results for maize canopy-trait retrieval and their validation limitations.
5. Water- and Nutrient-Status Assessment and Precision Regulation
Water and nutrient supply influence maize establishment, dry-matter accumulation, ear formation, grain filling, and yield stability, with sensitivity varying across growth stages. Early deficiencies can impair root development and stand uniformity; stress from jointing through tasseling may restrict leaf expansion, photosynthesis, and ear differentiation; and imbalances during grain filling can accelerate senescence. Water and nutrient assessment should therefore be interpreted in relation to crop phenology and the stage-specific processes of yield formation.
Soil sampling, plant analysis, chlorophyll meters, moisture sensors, and expert assessment provide localized observations but incompletely represent within-field variability. UAV remote sensing adds spatially continuous spectral, structural, thermal, and growth information for nitrogen-status estimation, water-stress monitoring, water–nitrogen treatment assessment, and potential site-specific management.
5.1. Agronomic Logic and Remote Sensing Requirements for Water and Nutrient Regulation
Maize water and nutrient management requires coordination among water supply, nitrogen uptake, dry-matter accumulation, and grain formation. Adequate water supports nitrogen uptake and translocation, while nitrogen management can influence crop water-use efficiency. Yang et al. examined nitrogen accumulation, allocation, and translocation under contrasting water and nitrogen regimes and showed that appropriate water–nitrogen combinations promoted plant N accumulation and its transfer to grain [56]. These interactions indicate that water and nutrient responses should be interpreted jointly rather than through a single canopy indicator.
Remote sensing locates and measures crop departures, but attribution to water, nitrogen, disease, or soil constraints needs contextual evidence. Spectral data represent greenness and red-edge response, thermal imagery reflects canopy temperature, and RGB or 3D features describe structure. Because different constraints produce similar signals, interpretation should incorporate phenology, soil, irrigation and fertilization history, and field measurements.
Management configuration can also influence both crop response and the observed UAV signal. In a two-year comparison of film-mulched shallow-buried drip and film-mulched drip irrigation, Zhu et al. [38] found that water-stress model performance varied with irrigation method, indicating that relationships developed under one management configuration may not transfer directly to another. More generally, field infrastructure and management operations can introduce spatial patterns that confound crop signals and should therefore be recorded as contextual covariates when interpreting UAV-based water and nutrient assessments.
5.2. Nitrogen-Status Retrieval
Leaf nitrogen is usually measured through destructive field sampling and laboratory analysis, which limits the speed and spatial density of nitrogen-status assessment. UAV methods estimate leaf or canopy nitrogen status from reflectance, vegetation indices, texture, and structural traits, providing a basis for spatially differentiated fertilization.
Nitrogen-retrieval methods trade information against complexity. Multispectral indices are accessible but confound nitrogen with biomass and cover; hyperspectral data add narrow-band sensitivity [57]; multisensor fusion combines RGB structure with spectral response [34]; and aerial-ground fusion adds proximal detail [58]. Added complexity requires tighter registration, synchronization, and calibration. Routine zoning may need only multispectral data, whereas richer systems are justified when they demonstrably separate nitrogen from water or structural effects [21].
Maize nitrogen retrieval commonly relies on red-edge and near-infrared information because indices such as NDRE, CIred-edge, and MTCI can remain responsive after NDVI begins to saturate. These signals are not nitrogen-specific: biomass, LAI, leaf angle, water status, soil fraction, cultivar, illumination, and phenology can alter the same spectral response. Nitrogen interpretation should therefore be conditioned on growth stage and canopy structure, supported by water and biomass information where available, and compared with measured leaf or canopy N. Treatment contrasts demonstrate sensitivity to nitrogen variation, but should not be interpreted as universal fertilizer thresholds.
5.3. Water-Stress Monitoring and Irrigation-Relevant Assessment
Water deficit is particularly damaging from jointing through grain filling, when it affects leaf expansion, stomatal conductance, photosynthesis, and kernel development. Point soil-moisture sensors characterize local conditions but not field-scale variation. UAV spectra, canopy temperature, leaf-water indices, and growth trajectories extend water-status assessment spatially and can identify zones that warrant further irrigation assessment or field verification.
Water-stress methods differ in process sensitivity and timing. Multispectral indices separate irrigation treatments under controlled conditions [38] but may respond after physiology has changed. Spatial–spectral–temporal models capture trajectories [59] at the cost of repeated observations and larger datasets. Thermal imagery is closer to transpiration but sensitive to weather and reference temperatures. Joint thermal, multispectral, and temporal interpretation better separates transient heating from persistent limitation [21].
The main difficulty is that water-stress signals are not unique. Mild deficit may first appear as higher canopy temperature or altered red-edge response, whereas wilting, yellowing, and reduced cover occur only after stress intensifies. Nitrogen deficiency, restricted roots, disease, and salinity can produce similar spectral or growth anomalies. A causal irrigation diagnosis would therefore require integration of soil moisture, meteorological evapotranspiration, canopy temperature, multispectral indices, and phenology. A useful direction is to link UAV thermal and multispectral imagery with ground soil-moisture sensors in models that connect soil water, canopy response, and irrigation decisions.
Hybrid diagnosis can embed physiological constraints rather than merely add covariates. Radiative-transfer models can constrain spectral responses to canopy and leaf properties [18]. Field experiments under contrasting water–nitrogen regimes provide complementary physiological evidence on nitrogen accumulation and translocation [56], while UAV-based fertigation studies demonstrate how remotely sensed crop status can be linked to input-management responses [39]. Machine learning can represent remaining nonlinearities through simulated augmentation, physics-informed losses, data assimilation, or staged state estimation. Causal tests require water × nitrogen × disease experiments, interventions, and held-out site-years; otherwise, models should rank plausible causes rather than present an unverified diagnosis [18,39,55,56].
Thermal metrics need an energy-balance context. Studies should report or test emissivity, vapor-pressure deficit, air temperature, radiation, wind, humidity, flight time, view angle, and calibration. Mixed soil-canopy pixels require masking or unmixing. Canopy-air differences, wet/dry references, crop-water-stress indices, or weather-normalized residuals can aid comparison, but reference construction and timing must be explicit. Without these controls, a thermal anomaly supports field checking rather than causal irrigation diagnosis.
5.4. Water–Nitrogen Coupling Responses and Multi-Temporal Monitoring
In production fields, water and nitrogen management are closely coupled, and their effects on canopy spectra, chlorophyll, leaf area, and biomass can overlap. Monitoring either factor in isolation may therefore obscure the source of growth variation. Duan et al. used UAV multispectral imagery to estimate maize nitrogen demand under different irrigation conditions and applied an NDRE sufficiency threshold to guide fertigation, illustrating how UAV observations can progress from crop-status assessment toward input-management decisions [39].
Multi-temporal monitoring is essential because the same indicator can have different meanings across growth stages. Low NDRE at jointing may reflect nitrogen deficiency or weak stand establishment; elevated canopy temperature around tasseling and silking may indicate water limitation; and rapid greenness decline during grain filling may result from senescence, nitrogen remobilization, or water stress. Water- and nutrient-status interpretation should therefore remain phenology-dependent rather than rely on uniform thresholds across the season.
Most water–nitrogen studies used controlled treatments. Multi-year designs [38,39] strengthen temporal evidence, and Duan et al. [39] provide the clearest intervention-oriented example: sensor-guided fertigation reduced N input by about 50–60%, with yield losses up to 12% in some treatments. The result shows why input savings and crop response must be evaluated together.
5.5. From Remote Sensing Monitoring to Prescription Decisions
Three complementary approaches can connect water- or nitrogen-status sensing with prescription decisions. Response experiments relate spectral indicators to economically relevant input rates but must account for non-target constraints such as waterlogging [60]. Accurate georeferencing and field registration improve spatial correspondence between sensed zones and later field operations [61], while agronomic-balance models combine sensed crop demand with soil and fertilizer supply to provide a more mechanistically grounded basis for variable-rate application than index thresholds alone [62].
A practical prescription workflow moves from indicator retrieval to zoning, rate calculation, map generation, and operation feedback. Zone size must balance sensed variation against implemented width and control accuracy. Recommendations should also consider yield targets, soil supply, management history, economics, and environmental risk rather than convert every canopy anomaly directly into an input rate.
Temporal and diagnostic context remain important when translating sensed variation into action. Within-season trajectories are more informative when interpreted together with phenology, irrigation and fertilization records, and longer-term field performance [63]. Zones supported by consistent agronomic evidence can proceed to irrigation or fertilization planning, whereas ambiguous responses should be directed to targeted scouting or further stress assessment rather than immediate treatment.
Figure 5 summarizes this transition from stage-specific water and nitrogen observations to candidate management zones and prescription decisions. The examples connect nitrogen-status maps, water-stress dynamics, sufficiency thresholds, and variable-rate concepts, illustrating how sensing outputs can be translated into implementable management units. Representative evidence for water and nutrient assessment and its progression toward management action is summarized in Table 5.
Figure 5.
Translation of UAV water and nitrogen observations into management action. Stage-specific status assessment can be combined with causal context and sufficiency thresholds to define candidate management zones and potential machinery-compatible fertigation or fertilizer prescriptions (organized from Refs. [34,38,39,62]). Reused panels: licensed under CC BY 4.0; cropped and reformatted.
Table 5.
Representative evidence for water- and nutrient-status assessment and translation to management action.
6. Pest, Disease, Weed, Lodging, and Abnormal-Stress Monitoring
Biotic stress, weeds, lodging, and other abnormalities can develop rapidly and unevenly; so, delayed detection may turn local damage into field-scale loss. UAV remote sensing can provide broad spatial coverage to locate emerging anomalies, assess severity, and prioritize scouting or intervention. The more difficult task is to distinguish among causes that produce similar canopy responses.
6.1. Objects and Technical Logic of Abnormal-Stress Monitoring
Abnormal-stress monitoring extends beyond visible lesions or damaged plants. It examines changes in canopy color, structure, height, cover, temperature, and spectral response associated with disease, insects, weeds, lodging, drought, waterlogging, nutrient deficiency, herbicide injury, and soil constraints. The analytical task is not only to detect a deviation from normal growth but also to rank plausible causes and assess management urgency.
Stress types produce partly distinctive image patterns: disease alters color and reflectance; insects damage leaves and reduce growth; weeds disrupt crop/non-crop and inter-row patterns; and lodging lowers height and changes texture, shadows, and row continuity. Raj et al. combined airborne RGB-derived LAI, height, and a health index to locate stressed maize areas [36].
These signals are rarely unique. Nitrogen deficiency, disease, and water deficit all reduce greenness; insect injury, herbicide damage, and mechanical injury all remove or deform leaf tissue; lodging, wind damage, and waterlogging all disrupt canopy structure. Discrimination consequently depends on temporal change, multiple sensor cues, field scouting, operation records, and agronomic context rather than on a single image or index.
6.2. Maize Disease Monitoring
Maize diseases damage leaf tissue, reduce photosynthetic capacity, and affect dry matter accumulation and grain filling. UAV remote sensing contributes to disease monitoring in two main ways: it uses high-resolution imagery to identify infected areas and lesion spatial distribution, and it uses multispectral, hyperspectral, or multi-source data to capture disease-induced canopy spectral changes for severity classification and spatial mapping.
Disease mapping is moving from thresholded anomalies toward lesion segmentation and multi-source severity assessment. Weak supervision reduces pixel-labeling demands [12], and multi-source imagery combines spatial and spectral evidence [13], but added sensors do not guarantee earlier detection. Presymptomatic pathogen signals remain difficult to distinguish from water or nutrient stress [21,64]. Visible-symptom segmentation is best suited to severity mapping; early warning needs temporal baselines, physiological bands, and field confirmation.
Beyond common leaf-spot diseases, UAV or other low-altitude imagery has also been used to assess viral and fungal infections. Bevers et al. combined UAV multispectral imagery with machine learning to detect maize affected by sugarcane mosaic virus, showing that viral infection can produce detectable canopy-scale spectral anomalies [35]. Radocz et al. examined corn smut with UAV multispectral imagery and compared vegetation-index responses across dates and infection treatments, demonstrating that disease-related spectral responses change over time [14]. Using RTK-geotagged RGB UAS imagery, Ahmad et al. developed GeoDLS to classify diseased, healthy, and background regions and return geolocated disease notifications; however, evaluation remained within a single research-field image set [65].
Visible disease mapping is increasingly mature, but early detection, disease separation, and transfer remain difficult. Symptoms are weak, confounded by illumination, cultivar, background, water, and nutrients, and often represented by small, imbalanced datasets. Progress will require multi-disease, multi-region, multi-stage data and methods that adapt with less annotation.
6.3. Insect Monitoring and Pest-Risk Identification
Maize–UAV studies mainly sense insect injury or infestation symptoms, not individual insects. Ground thermal and RGB imagery has been tested for fall armyworm damage, with UAV use proposed but not demonstrated [27]. Field spectral responses [66] should be termed injury or infestation-risk assessment unless insects, larvae, feeding signs, or independent sampling confirm the cause.
Spectral-yield analysis maps canopy response after fall armyworm damage [66], and paired ground RGB–thermal imagery supports damage classification with prospective UAV relevance [27]. These products prioritize scouting but are not direct insect detection. Earlier warning requires imagery combined with traps, weather-based risk models, and field counts [64].
UAV-based insect monitoring is constrained by visibility and specificity. Early injury often occurs inside the whorl or stem, beyond the view of nadir imagery. Mild damage is small relative to image resolution and can be obscured by leaf overlap or shadows. Canopy changes caused by insects also resemble those caused by disease, drought, or nutrient deficiency. Promising routes include high-resolution close-range imaging for direct damage detection and indirect pest-risk models that fuse thermal infrared, multispectral data, trapping records, weather, and field surveys for precision spraying.
6.4. Weed Recognition and Targeted Weed Control
Weed competition is most consequential during establishment and early canopy development, when it reduces access to light, water, nutrients, and space. Whole-field herbicide application and manual weeding provide limited spatial selectivity. By mapping inter-row vegetation and separating crop from non-crop cover, UAV imagery can support spot treatment, variable-rate spraying, and mechanical-weeding path planning.
Weed mapping is most reliable before canopy closure, when rows and inter-row space aid separation. RGB row methods suit dominant patches, while multispectral or deep learning methods address mixed species and backgrounds. WeedsGalore supports temporal and regional testing [67], and species maps can define treatment zones [37]. Although weed mapping is relatively well-developed [21], transfer across regions and direct field-control integration remain limited.
Weed recognition is limited by both crop-weed similarity and operational constraints. Species and dominant weed communities vary among regions, which weakens geographic transfer. Because maize and weeds are both green vegetation, RGB features are sensitive to illumination, shadow, and leaf age; red-edge and near-infrared information can improve separation but cannot eliminate ambiguity. For field use, weed maps must also align with nozzle-control accuracy, implement width, and machinery positioning. Better integration is still needed between weed localization, variable-rate spraying, and intelligent weeding equipment.
6.5. Lodging Recognition and Disaster-Loss Assessment
Lodging often occurs during the middle and late stages of maize development after strong wind or rain, particularly when cultivar resistance, stalk strength, root anchorage, or planting density is unfavorable. It disrupts canopy light and ventilation, complicates mechanical harvest, and reduces yield and grain quality. Because lodging abruptly changes canopy geometry, UAV imagery is well suited to mapping the affected area and grading structural severity.
Lodging is primarily structural: height loss, broken rows, directional texture, and altered shadows are more informative than vegetation indices alone. It affects yield-model behavior [68] and can be classified with multispectral and learning methods [69]. A pre-event baseline and rapid post-event RGB or DSM survey improve mapping for insurance and harvest planning.
Operational products should describe lodging area, direction, angle, and severity and relate them to yield loss, harvest loss, and machinery access. Multi-angle RGB, multispectral, and DSM data may improve grading, but practical value depends on rapid acquisition and a pre-event or unaffected reference; otherwise, these remain decision-support products rather than validated outcomes.
6.6. Integrated Identification of Abnormal Stress and Precision Intervention
Field stresses often co-occur and interact. Low-lying waterlogged areas may combine restricted rooting, nitrogen deficiency, disease, and lodging risk; severe weed competition can weaken establishment and reduce later yield potential; and lodged canopies during grain filling may undergo accelerated senescence and disease spread. Integrated assessment must therefore move beyond separate object classes toward diagnosis of the dominant and interacting constraints.
Integrated assessment can follow anomaly detection, interpretation, and intervention. Indices, height, texture, temperature, or temporal change locate abnormal patches; scouting, samples, input records, weather, and soil data then rank causes; and sufficiently verified results may support irrigation, fertilization, spraying, weeding, harvest adjustment, or damage assessment. Huq et al. used UAV imagery and deep learning to locate abnormal maize areas and grade severity, supporting prioritized scouting [70].
Stress products should separate anomaly detection from causal diagnosis. A useful risk layer records the suspected stress, severity, confidence, need for field verification, and remaining intervention window. Confirmed zones can support targeted spraying, weeding, irrigation, or disaster assessment, while uncertain zones require direct scouting rather than automatic treatment. Retaining event timing, severity, and intervention history also supplies explanatory variables for yield prediction and loss attribution.
Causal ground truth must be independent of the image features used for detection, using expert or laboratory disease diagnosis, pathogen assays, insect or weed surveys, measured water and nitrogen status, lodging angle, and georeferenced severity near flight time. Factorial or naturally co-occurring stresses are needed to test confusion among causes. None of the 51 core studies independently validated discrimination among water, nitrogen, disease, and other competing stresses in production fields.
Figure 6 summarizes representative remote sensing signatures and management implications for disease, insect damage, weed mapping, and lodging assessment. For stress monitoring, UAV imagery should not only locate anomalies but also help prioritize scouting, define risk zones, and inform the design of variable-rate interventions where causal confidence and implementation evidence are sufficient.
Figure 6.
From abnormal canopy cues to candidate intervention zones. Disease symptoms, insect injury, weed detections, and lodging require different outputs and ground truth; causal confidence is assessed and field verification is required before action. Panel-wise source publications are printed within the figure (organized from Refs. [35,37,66,68]). Reused panels: licensed under CC BY 4.0; cropped and reformatted.
The stress layers represented in Figure 6 also retain information needed for yield interpretation. Disease, insect injury, weed competition, and lodging affect yield through different pathways and at different stages; recording event type, timing, severity, and intervention is therefore more informative than a single late-season stress class. These records form part of the management history used in Section 7.
Stress-monitoring metrics must be read against prevalence and intervention cost. Overall accuracy can be dominated by healthy canopy, while missed early disease or weed patches carry greater agronomic cost than false alarms that trigger scouting. Pixel-level IoU, object-level precision/recall, field-level affected area, and zone-level intervention error answer different questions. Independent seasons, cultivars, and fields are particularly important because symptom appearance, background, and class balance shift rapidly. Representative quantitative results for abnormal-stress monitoring, together with their validation evidence and operational limitations, are summarized in Table 6.
Table 6.
Representative quantitative results for abnormal-stress monitoring and their operational interpretation.
7. Yield Prediction and Production Decision Support
Yield integrates establishment, canopy development, water and nutrients, stress, and operations, along with cultivar, soil, and weather. UAV yield prediction can therefore summarize seasonal evidence for spatial diagnosis and management rather than serve only as a regression from vegetation indices to final yield.
7.1. Objectives, Scale, and Remote Sensing Representation of Yield Prediction
Maize yield prediction may target research plots, whole fields, subfield spatial variability, or regional production. Models used in trials and cultivar screening emphasize differences among treatments or genotypes. In production fields, estimates must capture within-field heterogeneity well enough to support management zoning and input allocation. The fine spatial resolution of UAV imagery is particularly useful at plot and subfield scales, where it can overcome satellite limitations in small fields, irregular boundaries, and fine treatment areas.
Yield formation is cumulative: stand density sets the potential ear number; canopy development through tasseling shapes dry-matter accumulation; and water, nutrients, and stress during reproduction determine grain set and filling. Predictors include spectral indices, height, cover, texture, temperature, temporal change, and management. Hyperspectral work shows that spatial resolution and spectral configuration affect maize yield estimation; so, feature scale should match the target [71].
Evaluation should extend beyond numerical accuracy to the spatial usefulness of the resulting yield information. Predicted patterns should be agronomically plausible, identify meaningful low- and high-yield zones, and remain interpretable at the intended decision scale. A model may still support zoning or treatment comparison when the absolute yield error is moderate, provided that the relative spatial patterns needed for the intended application are stable.
The reviewed yield literature is concentrated mainly in experimental plots and within-program prediction. Its strongest current contributions are treatment comparison, identification of informative observation windows, relative yield estimation, and spatial zoning within the conditions studied, rather than demonstrated field-scale management execution.
7.2. Optimal Growth Stage and Multi-Temporal Yield Estimation
Different growth stages contribute unequally to final yield prediction. Seedling imagery mainly reflects the foundation for potential ear number; observations from jointing to tasseling and silking represent canopy development and yield potential; and grain-filling imagery captures stay-green capacity, accumulated stress, and filling conditions. Identifying informative observation windows is therefore essential for both accuracy and practical timing.
Yang et al. used high-frequency UAV data to quantify the contribution of different phenological stages to yield prediction. Observation timing significantly affected accuracy, and multi-temporal data represented the yield-formation process better than a single date [15]. Production models must nevertheless balance lead time against accuracy: very early estimates remain uncertain, whereas late estimates leave little opportunity for management adjustment. The aim is to select informative windows with useful lead time, not simply to increase the number of flights.
Multi-temporal yield estimation is most useful when remote sensing trajectories are linked to physiological development. A field zone that is weak from emergence through tasseling may represent a stable low-yield area, whereas a zone that declines only during grain filling may indicate late-season water stress, disease, or premature senescence. These mechanisms require different management responses. Time-series UAV data can therefore improve prediction and help explain how yield differences arise.
7.3. Multi-Source UAV Features and Machine Learning for Yield Estimation
Yield models increasingly combine spectral, structural, thermal, temporal, and management information. These sources describe different processes: RGB captures cover and texture; multispectral data represent greenness and red-edge response; height describes development; thermal data indicate water status; and temporal or management variables provide context. Fusion is most useful when inputs are physiologically complementary rather than correlated measures of the same canopy property.
Studies combining spectral, structural, environmental, and management variables better represented yield variation within individual experiments [16,17]. Guo et al. [16], for example, evaluated 20 treatment plots and found complementary UAV and treatment features useful for capturing yield variation. Feature value also changes with stage; so, multi-source models should follow the biological contribution of each predictor rather than simply increase predictor count.
Additional data also increase synchronization, registration, missing-data, preprocessing, and interpretation burdens. Common learning algorithms can handle heterogeneous predictors, but input quality and complementarity may matter more than algorithm choice. Baselines and ablation tests should show whether each source adds useful prediction or zoning information relative to its acquisition and processing cost.
7.4. Yield Components and Ear-Related Phenotypes for Assisted Prediction
Maize yield is determined by components such as ears per unit area, kernels per ear, and kernel weight. Conventional UAV models infer these outcomes indirectly from canopy spectra and structure. Low-altitude RGB imagery and object detection now allow reproductive phenotypes, including tassel number, morphology, and flowering progress, to be added as evidence more closely related to yield formation.
Reproductive-organ detection provides a more direct but narrower view of yield formation than canopy indices. YOLOv5-T and improved YOLOv8 models can locate maize tassels rapidly in low-altitude RGB imagery [72,73], which could support assessment of tasseling progress and breeding-related phenotypes. Their link to final yield remains indirect because tassel number does not represent kernel set, grain filling, or late stress. Occlusion, small target size, and a short observation window also limit transfer; so, tassel traits are best treated as phenological and reproductive covariates within multi-temporal models.
Direct ear phenotyping would move closer to component-level yield analysis, but field-scale extraction of ear number, position, and filling status remains difficult because ears are occluded by leaves and husks and vary in viewing angle. Until these constraints are resolved, reproductive-organ observations are better combined with stand density, canopy trajectories, and late-season stress records than used as stand-alone estimators.
7.5. Yield Spatial Patterns, Stability, and Management Zoning
Precision production depends on within-field yield distribution as well as the field mean. Variation in soil, topography, water supply, biotic stress, and management history creates stable high-yield, stable low-yield, and seasonally variable zones. Identifying these patterns supports differentiated input management, drainage and irrigation improvement, density adjustment, and longer-term soil remediation.
Management zones may be strategic or tactical. The UAV maize evidence supports within-season prediction and relative spatial patterns, while multi-year yield stability and proximal or satellite studies [63,74] are adjacent benchmarks, not proof of UAV-driven field operations. Stable zones need several yield years and soil or management history; tactical zones need a current diagnosis and an actionable window.
Distinguishing persistent constraints from temporary anomalies requires data provenance. A one-season low-yield patch may reflect disease, compaction, waterlogging, or application error, whereas repeated underperformance may indicate soil texture, topography, salinity, or nutrient-supply limitations. UAV status maps should therefore be interpreted with multi-year yield, soil, terrain, and machinery records. Zoning can remain dynamic, but revisions need to be tied to an explicit management horizon.
7.6. Prescription Map Generation and Production Decision Transformation
Yield prediction and management zoning become actionable only when they are translated into field decisions. Potential applications include variable-rate fertilization, precision irrigation, targeted crop protection, harvest scheduling, remediation of persistently low-yield areas, and adjustment of the following season’s sowing strategy. UAV-derived status or yield maps must therefore be converted into prescription units that specify where an action is required, what intervention is appropriate, and at what spatial and operational scale it should be implemented.
Adjacent studies provide useful benchmarks for translating remote sensing information into field management. Sentinel-2-based nitrogen zoning in corn [75] and Sentinel-2 combined with historical telematics in wheat [76] illustrate prescription-oriented approaches, whereas Landsat–weather scale transfer [77] provides a complementary benchmark for subfield yield mapping at management-relevant spatial scales. In maize–UAV research, Duan et al. [39] provide the clearest decision-oriented example by linking UAV-derived NDRE with treatment-level fertigation and agronomic outcomes.
Prescription generation requires reconciliation among remote sensing scale, agronomic thresholds, and machinery capability. Centimeter-scale imagery cannot be converted directly into fertilizer, spray, or irrigation commands when field equipment operates at substantially coarser widths and response intervals. Remote sensing observations therefore need to be aggregated into management units consistent with implement width, positioning accuracy, controller response, and the agronomic objective. The resulting prescription should preserve meaningful spatial heterogeneity without creating zones that are too fine for reliable field execution.
Yield-derived management zones are more informative when interpreted together with evidence accumulated earlier in the season. Links to stand establishment, canopy trajectories, water and nutrient status, stress events, and operation records help distinguish persistent field constraints from temporary anomalies. This seasonal provenance can clarify whether a low-yield zone is better addressed through soil improvement, input adjustment, crop protection, altered planting strategy, or no additional intervention. Section 8 examines the broader requirements for maintaining this information continuity through machinery execution and post-operation evaluation.
Figure 7 summarizes the pathway from UAV-derived yield information to production decisions. The examples illustrate how spatial and spectral scale, reproductive phenotypes, temporal yield stability, and management-zone definition contribute to the transformation from prediction to prescription. Representative quantitative evidence for yield prediction and decision support is summarized in Table 7.
Figure 7.
Decision chain for scale-aware yield modeling and production support. Demonstrated maize–UAV links include multi-temporal prediction and within-experiment spatial modeling; stable multi-year zoning, machinery-ready prescriptions, and execution feedback are shown as required but incompletely validated transitions. Panel-wise source publications are printed within the figure (organized from Refs. [63,71,73,75]). Reused panels: licensed under CC BY 4.0; cropped and reformatted.
Table 7.
Representative performance evidence for yield prediction and decision support.
8. Key Issues and Development Directions
Seasonal maize management links stand assessment, canopy traits, water and nutrients, abnormal stress, yield, and decisions. The main integration problem is that plant points, rasters, risk maps, prescriptions, machinery logs, and yield maps often lack shared spatial units, timestamps, or quality information. Five system-level bottlenecks recur: inconsistent data standards, limited transfer, confusion among interacting stresses, mismatch with machinery, and weak post-operation evaluation.
8.1. Data Quality, Standardization, and Interoperability
UAV data quality propagates into traits, stress assessment, and decisions. Platform, sensor, height, overlap, timing, correction, sampling, and reference methods vary widely, while illumination and geometry strongly affect spectral and thermal products. Radiometric studies show this sensitivity [30], and harmonized UAS guidance treats planning, reference data, processing, and quality reporting as one reproducible workflow [22].
Standardization must include exchanged products, not only images. Plant points, row objects, trait surfaces, stress probabilities, yield surfaces, and zones should retain common coordinates, field identifiers, phenological timestamps, units, provenance, and quality data. Geometry must also match equipment scale and control resolution. Interoperability therefore requires stable identifiers and machine-readable metadata linking UAV outputs with soil, weather, scouting, machinery, as-applied, and yield records.
Quality flags should travel with each product. Shadow, saturation, registration or mosaicking error, mixed pixels, missing data, and extrapolation should remain visible as confidence or applicability limits. A product is decision-grade when plausible errors do not change the intended action and execution can be audited at the required tolerance. Thresholds are application-specific: scouting alerts, nitrogen zones, and stand maps require different accuracy.
Minimum Information for UAV Agronomy (MIUAVA) is an author synthesis, not a consensus standard. It organizes recurring reporting needs along the UAV-to-decision workflow. Acquisition and processing fields draw on established UAS practices [22,24,28,29,30]; reference, validation, and uncertainty fields reflect phenotyping and stress-monitoring guidance and gaps in the maize corpus [22,23,55]; and provenance and interoperability elements draw on UAS integration studies [78,79]. Machinery exchange is aligned with ISO 11783-10 [80]. Maize-specific additions—phenology, decision thresholds, equipment scale, defer-action rules, traceability, and agronomic–economic feedback—remain proposed guidance.
To make these requirements explicit, we propose Minimum Information for UAV Agronomy (MIUAVA) as a reporting checklist. At minimum, a MIUAVA record should include:
- Decision scope and experimental design: intended action and threshold, target spatial and temporal scale, equipment scale, field, year, site, cultivar, treatments, and independent sampling units.
- Platform, sensor, and calibration: aircraft, sensor, lens, bands, firmware, integration or exposure settings, laboratory calibration, reference panel or downwelling-light sensor, and saturation or rejection rules.
- Flight and environment: date, time, crop stage, altitude, GSD, speed, overlap, flight and viewing geometry, sensor-to-sun geometry, wind, temperature, humidity, cloud and illumination stability, and atmospheric conditions relevant to the sensor.
- Radiometric and geometric processing: software and version, correction chain, mosaicking and resampling, coordinate reference system, RTK or ground-control configuration, checkpoints, and image-to-ground or cross-sensor registration accuracy.
- Ground reference and sampling: measurement method and uncertainty, sample counts, plot or field layout, timestamps, canopy layer, spatial matching tolerance, and treatment of spatial and temporal autocorrelation.
- Modeling and validation: preprocessing and feature selection inside resampling folds, split unit, hyperparameters, calibration domain, independent site-year or spatially blocked testing, bias, MAE or RMSE, class-specific errors, and uncertainty calibration.
- Product and quality control: units, resolution, no-data rules, coverage, blur, shadow, seam and saturation checks, quality flags, confidence intervals or probabilities, applicability limits, and the rule for deferring action when evidence is insufficient.
- Prescription and feedback: zone or rate logic, coordinate reference system, exchange format, terminal, controller, implement and FMIS compatibility, import or test–task results, as-applied records, and agronomic and economic outcome evaluation.
Where relevant, studies should state acceptance criteria for acquisition and processing, georeferencing relative to GSD and equipment tolerance, validation error relative to the decision threshold, and uncertainty calibration. Limits remain trait- and operation-specific, and failure should trigger reacquisition, deferred action, or exploratory use as appropriate. MIUAVA is intended to improve reporting and traceability, not create a technical standard; only ISO-XML task-data exchange has direct normative support here [80].
8.2. Cross-Region Generalization and Phenology-Aware Interpretation
Many maize–UAV models cover narrow combinations of region, year, cultivar, and management; so, changes in soil, weather, inputs, stresses, or phenology can alter performance. Reviews likewise report strong variation among traits, sensors, stages, and crops [23], favor complementary and process-aware interpretation [21], and show that stress signals depend on acquisition and crop context [55]. Generalization therefore depends on representative development data as well as algorithm choice.
Phenology provides an important constraint on model interpretation and transfer. The same remote sensing signal can imply different crop conditions at different stages: low canopy cover during establishment may indicate poor emergence, low NDRE after jointing may reflect nitrogen limitation or delayed development, and declining greenness during grain filling may represent normal senescence, disease, or water stress. Reviews of UAV monitoring in gramineous crops similarly show that informative observation windows shift with crop development [3]. Models intended for transfer should therefore retain explicit growth-stage information and define the conditions under which their predictions are considered applicable.
Credible transfer requires independent data from contrasting sites, years, cultivars, and management regimes, evaluated within stated applicability domains. Transfer learning and domain adaptation may reduce distribution shift but cannot remove phenological, sensor, and environmental differences. Out-of-domain predictions should carry uncertainty or applicability flags and prompt recalibration or field verification.
8.3. Multi-Stress Signal Disentanglement and Contextual Data Fusion
No single data source fully explains within-field heterogeneity. UAV imagery provides spatial detail, satellites can add temporal continuity and broader coverage, and ground sensors can record weather and soil dynamics. Machinery logs and historical yield maps add information on interventions and outcomes. Combining these sources in practice requires spatial and temporal registration, with phenological and management-event labels linking observations to field interventions. Reviews of UAV yield estimation and UAS–satellite integration show that complementary data can improve prediction and scalability, although differences in resolution, calibration, timing, and analytical method remain substantial constraints [78,81].
Context is particularly important when different stresses produce similar signals. Reduced greenness, elevated canopy temperature, or lower canopy height may arise from water deficit, nitrogen limitation, root-zone constraints, disease, insect injury, or their interaction. A defensible workflow detects the anomaly, ranks plausible causes using phenology, weather, soil, input history, and spatial context, and requests targeted field evidence when confidence is low. The maize crop-protection review similarly emphasizes connecting monitoring evidence with precise control rather than relying on image classification alone [4].
8.4. Compatibility Among Prescription Maps, Machinery Execution, and Feedback Evaluation
The 51 core studies do not demonstrate a complete machinery-interoperability workflow. Most stop at trait retrieval, stress assessment, or yield prediction, and only one reported a UAV-informed agronomic intervention [39]. The following framework is therefore a proposed route from validated products to prescription, execution, as-applied verification, and agronomic–economic feedback, informed by adjacent studies and machinery standards.
A map becomes operational only after agronomic thresholds, economics, and machinery constraints are applied. Centimeter-scale UAV products are often finer than applicator widths, control intervals, irrigation units, or positioning tolerance. Prescription generation must aggregate observations into executable units with meaningful boundaries and specify operation, rate, unit, validity, and confidence. Sensor adaptability, processing complexity, and scalability remain barriers [82].
Machinery compatibility requires geospatial and task-data consistency. Rasters should be converted to polygons or grids no finer than implement width, section-control interval, positioning accuracy, and rate-change frequency while retaining field boundary, coordinate system, operation, rate, unit, no-data rule, timestamp, version, and provenance. Shapefile or GeoPackage can be intermediate layers; ISOBUS workflows require ISO-XML task data under ISO 11783-10 [80]. Verification should include schema, topology, range, and unit checks, successful terminal/FMIS import, a test task, and return of as-applied records. File validity alone does not ensure that terminal, controller, implement, positioning, section control, and FMIS functions are compatible.
Execution closes neither the agronomic nor information loop. As-applied maps should be aligned with follow-up UAV data, ground measurements, and yield to test both delivery and crop response, using comparison areas or repeated observations where appropriate. Integrated decision-support frameworks support this linkage [79], and broader synthesis shows that value depends on reliable data flow, interpretation, and validation across the sensing-to-action chain [5]. Outcomes should include input use, crop response, yield, and economic return.
Prescription uncertainty should also influence action selection. Zones near treatment thresholds should not automatically receive the same rate as high-confidence areas; they may instead be assigned a lower-risk rate, flagged for scouting, or deferred until additional evidence is available. The prescription package should therefore retain confidence or applicability information, the decision threshold used, and relevant provenance so that post-operation analysis can distinguish sensing or model error from execution error.
8.5. Development Priorities for an Integrated Production Workflow
An integrated workflow need not use one all-encompassing model. It needs interoperable modules for monitoring, diagnosis, prescription, execution, and evaluation. Shared spatial identifiers, phenology, acquisition metadata, soil and weather context, management events, provenance, and quality information should remain attached as outputs move into machinery-compatible units and return as as-applied data, follow-up observations, ground measurements, yield, and economic outcomes. Individual studies need not implement every stage, but their products should support the next one.
The evidence audit provides a conservative baseline. Of 51 core studies, two explicitly tested independent sites or years [31,35], and one reported a UAV-informed intervention with input and yield outcomes [39]. None documented the complete path from machinery-compatible prescription through execution, as-applied reconciliation, crop response, and economics; executed replanting, stress-map intervention, and action from UAV yield maps were also absent. These counts reflect explicit reporting within this corpus only; study-level coding appears in Table S1.
Based on this audit, the ranked research priorities and measurable targets are as follows: The specific numerical targets and implementation criteria proposed below are author-defined benchmarks derived from the evidence gaps identified in this review; unless explicitly supported by cited literature, they should not be interpreted as established consensus standards.
- External validity: Transferability should be evaluated in contrasting environments rather than inferred from internal accuracy. As a practical author-defined benchmark, we propose testing across at least three contrasting site-years, including at least one production field outside the model-development environment, with complete fields or years held out where appropriate and prediction error interpreted relative to the intended decision threshold.
- Causal stress discrimination: Future studies should distinguish competing water, nutrient, biotic, and soil-related constraints using phenological context and independent physiological or laboratory evidence. Factorial or naturally co-occurring stress conditions, together with calibrated probabilities for competing causes, would provide stronger evidence than anomaly classification alone.
- Decision-grade measurement and uncertainty: Acquisition, ground reference, modeling, and product quality should be documented using the MIUAVA framework, with acceptance criteria linked to the intended agronomic decision. Practical reliability is demonstrated when plausible measurement and model errors do not alter the resulting management action.
- Machinery interoperability and closed-loop execution: Operational studies should translate validated spatial products into target-system-compatible prescriptions, verify successful import and field execution, and reconcile intended prescriptions with as-applied position and rate records. This step is necessary to distinguish analytical performance from execution performance.
- Agronomic and economic benefit: Field evaluation should quantify input use, crop response, yield, operational requirements, and economic outcomes using treated and comparison areas where appropriate. Benefits should be reported per unit area and assessed directly rather than inferred from sensing or model accuracy.
Table 8 compares application domains by task performance, validation design, evidence beyond development conditions, and progression from sensing to action. The categories indicate relative strength within the reviewed maize–UAV evidence, not full technological maturity.
Table 8.
Cross-domain synthesis of validation strength and remaining requirements for decision-grade maize–UAV applications.
9. Conclusions
This review evaluates UAV remote sensing for maize from seasonal monitoring and trait retrieval to operational decision support. Four conclusions emerge.
- (1)
- UAV remote sensing supports high-resolution maize assessment across growth stages. Evidence is comparatively stronger for plant counting, canopy structural and physiological traits, treatment-related water and nitrogen responses, and mapping of disease symptoms, insect injury, weeds, lodging, and relative yield variation. Most findings, however, come from experimental or site-specific conditions.
- (2)
- External validity is the main evidence limitation. Independent testing across sites, years, cultivars, and production settings is uncommon, and many gains from complex models or fusion remain within experiments. Remotely sensed anomalies should not be treated as causal diagnoses without independent physiological, agronomic, or field confirmation.
- (3)
- A clear gap remains between sensing and operational precision management. Most studies stop at trait estimation, anomaly mapping, treatment discrimination, or scouting. Evidence for machinery-ready prescriptions, execution, as-applied verification, and agronomic–economic feedback is scarce, and no core study completed the full cycle.
- (4)
- Priorities are multi-site and multi-year validation in production fields, phenology-aware acquisition and interpretation, independent confirmation of interacting stresses, and uncertainty assessment against management thresholds. Closed-loop trials should also test machinery-compatible prescriptions, execution accuracy, crop response, input use, yield, and economic return.
Supplementary Materials
The following supporting information can be downloaded at: https://www.mdpi.com/article/10.3390/drones10090666/s1. Table S1. Characteristics and evidence appraisal of the 51 core primary maize–UAV studies.
Author Contributions
Conceptualization, T.S., X.X. and W.G.; methodology, T.S. and C.C. (Chen Chen); investigation, T.S., C.C. (Chen Chen) and C.C. (Chun Chang); resources, X.X. and W.G.; data curation, C.C. (Chun Chang); writing—original draft preparation, T.S. and C.C. (Chen Chen); writing—review and editing, C.C. (Chun Chang), X.X. and W.G.; visualization, T.S. and C.C. (Chun Chang); supervision, X.X. and W.G.; project administration, X.X. and W.G.; funding acquisition, W.G. All authors have read and agreed to the published version of the manuscript.
Funding
This research was funded by the National Key Research and Development Program of China (grant No. 2022YFD2001600).
Data Availability Statement
No new datasets were generated or analyzed in this study. Data sharing is not applicable to this article.
Conflicts of Interest
The authors declare no conflicts of interest.
Abbreviations
The following abbreviations are used in this manuscript:
| CASI | Coverage-Adjusted Spectral Index |
| CHM | Canopy Height Model |
| CIred-edge | Red-Edge Chlorophyll Index |
| CNN | Convolutional Neural Network |
| DASs | Days After Sowing |
| DEM | Digital Elevation Model |
| DNN | Deep Neural Network |
| DSM | Digital Surface Model |
| ESRI | Environmental Systems Research Institute |
| EVI | Enhanced Vegetation Index |
| ExG | Excess Green Index |
| ExGR | Excess Green Minus Excess Red Index |
| ExR | Excess Red Index |
| F1 | F1 Score |
| FMIS | Farm Management Information System |
| GLI | Green Leaf Index |
| GNDVI | Green Normalized Difference Vegetation Index |
| GSD | Ground Sampling Distance |
| IoU | Intersection over Union |
| ISO-XML | ISO 11783-10 Task-Data Exchange Format |
| ISOBUS | ISO 11783-Based Agricultural Machinery Communication Standard |
| LAI | Leaf Area Index |
| LiDAR | Light Detection and Ranging |
| LWC | Leaf Water Content |
| MAE | Mean Absolute Error |
| mAP | Mean Average Precision |
| MIUAVA | Minimum Information for UAV Agronomy |
| MTCI | MERIS Terrestrial Chlorophyll Index |
| NDRE | Normalized Difference Red-Edge Index |
| NDVI | Normalized Difference Vegetation Index |
| NGRDI | Normalized Green-Red Difference Index |
| NIR | Near-Infrared |
| NRMSE | Normalized Root Mean Square Error |
| OA | Overall Accuracy |
| PLSR | Partial Least Squares Regression |
| PRISMA | Preferred Reporting Items for Systematic Reviews and Meta-Analyses |
| R-CNN | Region-Based Convolutional Neural Network |
| RF | Random Forest |
| RGB | Red, Green, and Blue |
| RMSE | Root Mean Square Error |
| RPD | Ratio of Performance to Deviation |
| rRMSE | Relative Root Mean Square Error |
| RTK | Real-Time Kinematic |
| SAVI | Soil-Adjusted Vegetation Index |
| SCMV | Sugarcane Mosaic Virus |
| SNR | Signal-to-Noise Ratio |
| SPAD | Soil Plant Analysis Development |
| SVM | Support Vector Machine |
| UAS | Unmanned Aerial System |
| UAV | Unmanned Aerial Vehicle |
| VARI | Visible Atmospherically Resistant Index |
| VTOL | Vertical Take-Off and Landing |
| XGBoost | Extreme Gradient Boosting |
| YOLO | You Only Look Once |
References
- Erenstein, O.; Jaleta, M.; Sonder, K.; Mottaleb, K.; Prasanna, B.M. Global maize production, consumption and trade: Trends and R&D implications. Food Secur. 2022, 14, 1295–1319. [Google Scholar] [CrossRef] [Scilit]
- Zhang, S.; Wang, X.; Lin, H.; Dong, Y.; Qiang, Z. A review of the application of UAV multispectral remote sensing technology in precision agriculture. Smart Agric. Technol. 2025, 12, 101406. [Google Scholar] [CrossRef] [Scilit]
- Li, Y.; Deng, G.; Zhao, H.; Liu, B.; Liu, C.; Qian, W.; Qiao, X. A review of UAV remote sensing technology applications in common gramineous crops. Inf. Process. Agric. 2026; in press. [CrossRef] [Scilit]
- Yan, Y.; Song, F.; Sun, J. The application of UAV technology in maize crop protection strategies: A review. Comput. Electron. Agric. 2025, 237, 110679. [Google Scholar] [CrossRef] [Scilit]
- Arsenoaia, V.N.; Topa, D.C.; Ratu, R.N.; Tenu, I. From Sensing to Intervention: A Critical Review of Agricultural Drones for Precision Agriculture, Data-Driven Decision Making, and Sustainable Intensification. Agronomy 2026, 16, 564. [Google Scholar] [CrossRef] [Scilit]
- Lu, C.; Nnadozie, E.; Camenzind, M.P.; Hu, Y.; Yu, K. Maize plant detection using UAV-based RGB imaging and YOLOv5. Front. Plant Sci. 2024, 14, 1274813. [Google Scholar] [CrossRef] [Scilit] [PubMed]
- Xu, X.; Wang, L.; Shu, M.; Liang, X.; Ghafoor, A.Z.; Liu, Y.; Ma, Y.; Zhu, J. Detection and Counting of Maize Leaves Based on Two-Stage Deep Learning with UAV-Based RGB Image. Remote Sens. 2022, 14, 5388. [Google Scholar] [CrossRef] [Scilit]
- Osco, L.P.; Junior, J.M.; Ramos, A.P.M.; Furuya, D.E.G.; Santana, D.C.; Teodoro, L.P.R.; Gonçalves, W.N.; Baio, F.H.R.; Pistori, H.; Junior, C.A.d.S.; et al. Leaf Nitrogen Concentration and Plant Height Prediction for Maize Using UAV-Based Multispectral Imagery and Machine Learning Techniques. Remote Sens. 2020, 12, 3237. [Google Scholar] [CrossRef] [Scilit]
- Du, L.; Yang, H.; Song, X.; Wei, N.; Yu, C.; Wang, W.; Zhao, Y. Estimating leaf area index of maize using UAV-based digital imagery and machine learning methods. Sci. Rep. 2022, 12, 15937. [Google Scholar] [CrossRef] [Scilit] [PubMed]
- Cheng, Q.; Xu, H.; Fei, S.; Li, Z.; Chen, Z. Estimation of Maize LAI Using Ensemble Learning and UAV Multispectral Imagery under Different Water and Fertilizer Treatments. Agriculture 2022, 12, 1267. [Google Scholar] [CrossRef] [Scilit]
- Zhang, L.; Zhang, H.; Niu, Y.; Han, W. Mapping Maize Water Stress Based on UAV Multispectral Remote Sensing. Remote Sens. 2019, 11, 605. [Google Scholar] [CrossRef] [Scilit]
- Chen, S.; Zhang, K.; Wu, S.; Tang, Z.; Zhao, Y.; Sun, Y.; Shi, Z. A Weakly Supervised Approach for Disease Segmentation of Maize Northern Leaf Blight from UAV Images. Drones 2023, 7, 173. [Google Scholar] [CrossRef] [Scilit]
- Jia, X.; Yin, D.; Bai, Y.; Yu, X.; Song, Y.; Cheng, M.; Liu, S.; Bai, Y.; Meng, L.; Liu, Y.; et al. Monitoring Maize Leaf Spot Disease Using Multi-Source UAV Imagery. Drones 2023, 7, 650. [Google Scholar] [CrossRef] [Scilit]
- Radócz, L.; Szabó, A.; Tamás, A.; Illés, Á.; Bojtor, C.; Ragán, P.; Vad, A.; Széles, A.; Harsányi, E.; Radócz, L. Investigation of the Detectability of Corn Smut Fungus (Ustilago maydis DC. Corda) Infection Based on UAV Multispectral Technology . Agronomy 2023, 13, 1499. [Google Scholar] [CrossRef] [Scilit]
- Yang, B.; Zhu, W.; Rezaei, E.E.; Li, J.; Sun, Z.; Zhang, J. The Optimal Phenological Phase of Maize for Yield Prediction with High-Frequency UAV Remote Sensing. Remote Sens. 2022, 14, 1559. [Google Scholar] [CrossRef] [Scilit]
- Guo, Y.; Zhang, X.; Chen, S.; Wang, H.; Jayavelu, S.; Cammarano, D.; Fu, Y. Integrated UAV-Based Multi-Source Data for Predicting Maize Grain Yield Using Machine Learning Approaches. Remote Sens. 2022, 14, 6290. [Google Scholar] [CrossRef] [Scilit]
- Baio, F.H.R.; Santana, D.C.; Teodoro, L.P.R.; Oliveira, I.C.; Gava, R.; Oliveira, J.L.G.; Silva Junior, C.A.; Teodoro, P.E.; Shiratsuchi, L.S. Maize Yield Prediction with Machine Learning, Spectral Variables and Irrigation Management. Remote Sens. 2023, 15, 79. [Google Scholar] [CrossRef] [Scilit]
- Li, J.; Ge, Y.; Puntel, L.A.; Heeren, D.M.; Bai, G.; Balboa, G.R.; Gamon, J.A.; Arkebauer, T.J.; Shi, Y. Integrating UAV hyperspectral data and radiative transfer model simulation to quantitatively estimate maize leaf and canopy nitrogen content. Int. J. Appl. Earth Obs. Geoinf. 2024, 129, 103817. [Google Scholar] [CrossRef] [Scilit]
- Mulla, D.J. Twenty five years of remote sensing in precision agriculture: Key advances and remaining knowledge gaps. Biosyst. Eng. 2013, 114, 358–371. [Google Scholar] [CrossRef] [Scilit]
- Hunt, E.R., Jr.; Daughtry, C.S.T. What good are unmanned aircraft systems for agricultural remote sensing and precision agriculture? Int. J. Remote Sens. 2018, 39, 5345–5376. [Google Scholar] [CrossRef] [Scilit]
- Maes, W.H.; Steppe, K. Perspectives for Remote Sensing with Unmanned Aerial Vehicles in Precision Agriculture. Trends Plant Sci. 2019, 24, 152–164. [Google Scholar] [CrossRef] [Scilit] [PubMed]
- Tmušić, G.; Manfreda, S.; Aasen, H.; James, M.R.; Gonçalves, G.; Ben-Dor, E.; Brook, A.; Polinova, M.; Arranz, J.J.; Mészáros, J.; et al. Current Practices in UAS-based Environmental Monitoring. Remote Sens. 2020, 12, 1001. [Google Scholar] [CrossRef] [Scilit]
- Yang, G.; Liu, J.; Zhao, C.; Li, Z.; Huang, Y.; Yu, H.; Xu, B.; Yang, X.; Zhu, D.; Zhang, X.; et al. Unmanned Aerial Vehicle Remote Sensing for Field-Based Crop Phenotyping: Current Status and Perspectives. Front. Plant Sci. 2017, 8, 1111. [Google Scholar] [CrossRef] [Scilit] [PubMed]
- Aasen, H.; Honkavaara, E.; Lucieer, A.; Zarco-Tejada, P.J. Quantitative Remote Sensing at Ultra-High Resolution with UAV Spectroscopy: A Review of Sensor Technology, Measurement Procedures, and Data Correction Workflows. Remote Sens. 2018, 10, 1091. [Google Scholar] [CrossRef] [Scilit]
- Oehme, L.H.; Reineke, A.J.; Weiß, T.M.; Würschum, T.; He, X.; Müller, J. Remote Sensing of Maize Plant Height at Different Growth Stages Using UAV-Based Digital Surface Models (DSM). Agronomy 2022, 12, 958. [Google Scholar] [CrossRef] [Scilit]
- Sudu, B.; Rong, G.; Guga, S.; Li, K.; Zhi, F.; Guo, Y.; Zhang, J.; Bao, Y. Retrieving SPAD Values of Summer Maize Using UAV Hyperspectral Data Based on Multiple Machine Learning Algorithm. Remote Sens. 2022, 14, 5407. [Google Scholar] [CrossRef] [Scilit]
- Prakash Sandhya, P.S.; Venkataramana, B.V.; Kumar, T.P.; Sujatha, R. Thermal and RGB Image Dataset for Detection and Management of Fall Army Worm (FAW) Infestation in Maize. Front. Agron. 2025, 7, 1629681. [Google Scholar] [CrossRef] [Scilit]
- Xue, B.; Ming, B.; Xin, J.; Yang, H.; Gao, S.; Guo, H.; Feng, D.; Nie, C.; Wang, K.; Li, S. Radiometric Correction of Multispectral Field Images Captured under Changing Ambient Light Conditions and Applications in Crop Monitoring. Drones 2023, 7, 223. [Google Scholar] [CrossRef] [Scilit]
- Shin, T.; Jeong, S.; Ko, J. Development of a Radiometric Calibration Method for Multispectral Images of Croplands Obtained with a Remote-Controlled Aerial System. Remote Sens. 2023, 15, 1408. [Google Scholar] [CrossRef] [Scilit]
- Wang, Y.; Kootstra, G.; Yang, Z.; Khan, H.A. UAV multispectral remote sensing for agriculture: A comparative study of radiometric correction methods under varying illumination conditions. Biosyst. Eng. 2024, 248, 240–254. [Google Scholar] [CrossRef] [Scilit]
- Velumani, K.; Lopez-Lozano, R.; Madec, S.; Guo, W.; Gillet, J.; Comar, A.; Baret, F. Estimates of Maize Plant Density from UAV RGB Images Using Faster-RCNN Detection Model: Impact of the Spatial Resolution. Plant Phenomics 2021, 2021, 9824843. [Google Scholar] [CrossRef] [Scilit] [PubMed]
- Li, Y.; Guo, S.; Jia, S.; Yan, Y.; Jia, H.; Zhang, W. Quantifying the Effects of UAV Flight Altitude on the Multispectral Monitoring Accuracy of Soil Moisture and Maize Phenotypic Parameters. Agronomy 2025, 15, 2137. [Google Scholar] [CrossRef] [Scilit]
- Sun, X.; Yang, Z.; Su, P.; Wei, K.; Wang, Z.; Yang, C.; Wang, C.; Qin, M.; Xiao, L.; Yang, W.; et al. Non-destructive monitoring of maize LAI by fusing UAV spectral and textural features. Front. Plant Sci. 2023, 14, 1158837. [Google Scholar] [CrossRef] [Scilit] [PubMed]
- Xu, X.; Fan, L.; Li, Z.; Meng, Y.; Feng, H.; Yang, H.; Xu, B. Estimating Leaf Nitrogen Content in Corn Based on Information Fusion of Multiple-Sensor Imagery from UAV. Remote Sens. 2021, 13, 340. [Google Scholar] [CrossRef] [Scilit]
- Bevers, N.; Ohlson, E.W.; Kc, K.; Jones, M.W.; Khanal, S. Sugarcane Mosaic Virus Detection in Maize Using UAS Multispectral Imagery. Remote Sens. 2024, 16, 3296. [Google Scholar] [CrossRef] [Scilit]
- Raj, R.; Walker, J.P.; Jagarlapudi, A. Maize On-Farm Stressed Area Identification Using Airborne RGB Images Derived Leaf Area Index and Canopy Height. Agriculture 2023, 13, 1292. [Google Scholar] [CrossRef] [Scilit]
- Mesías-Ruiz, G.A.; Borra-Serrano, I.; Dorado, J.; de Castro, A.I.; Peña, J.M. Multispecies weed mapping using deep learning on UAV imagery for SSWM in maize and tomato. Precis. Agric. 2026, 27, 9. [Google Scholar] [CrossRef] [Scilit]
- Zhu, J.; Li, S.; Wu, W.; Zhao, P.; Ao, X.; Chen, H. Methodological Study on Maize Water Stress Diagnosis Based on UAV Multispectral Data and Multi-Model Comparison. Agronomy 2025, 15, 2318. [Google Scholar] [CrossRef] [Scilit]
- Duan, J.; Rudnick, D.R.; Proctor, C.A.; Heeren, D.; Nakabuye, H.N.; Katimbo, A.; Shi, Y.; de Sousa Ferreira, V. Estimation of corn nitrogen demand under different irrigation conditions based on UAV multispectral technology. Agric. Water Manag. 2024, 304, 109075. [Google Scholar] [CrossRef] [Scilit]
- Gao, M.; Yang, F.; Wei, H.; Liu, X. Automatic Monitoring of Maize Seedling Growth Using Unmanned Aerial Vehicle-Based RGB Imagery. Remote Sens. 2023, 15, 3671. [Google Scholar] [CrossRef] [Scilit]
- Ren, L.; Li, C.; Yang, G.; Zhao, D.; Zhang, C.; Xu, B.; Feng, H.; Chen, Z.; Lin, Z.; Yang, H. The Detection of Maize Seedling Quality from UAV Images Based on Deep Learning and Voronoi Diagram Algorithms. Remote Sens. 2024, 16, 3548. [Google Scholar] [CrossRef] [Scilit]
- Wang, B.; Zhou, J.; Costa, M.; Kaeppler, S.M.; Zhang, Z. Plot-Level Maize Early Stage Stand Counting and Spacing Detection Using Advanced Deep Learning Algorithms Based on UAV Imagery. Agronomy 2023, 13, 1728. [Google Scholar] [CrossRef] [Scilit]
- Liu, S.; Yin, D.; Feng, H.; Li, Z.; Xu, X.; Shi, L.; Jin, X. Estimating maize seedling number with UAV RGB images and advanced image processing methods. Precis. Agric. 2022, 23, 1604–1632. [Google Scholar] [CrossRef] [Scilit]
- Sankaran, S.; Khot, L.R.; Zúñiga Espinoza, C.; Jarolmasjed, S.; Sathuvalli, V.R.; Vandemark, G.J.; Miklas, P.N.; Carter, A.H.; Pumphrey, M.O.; Knowles, N.R.; et al. Low-altitude, high-resolution aerial imaging systems for row and field crop phenotyping: A review. Eur. J. Agron. 2015, 70, 112–123. [Google Scholar] [CrossRef] [Scilit]
- Liu, M.; Su, W.H.; Wang, X.Q. Quantitative Evaluation of Maize Emergence Using UAV Imagery and Deep Learning. Remote Sens. 2023, 15, 1979. [Google Scholar] [CrossRef] [Scilit]
- Pang, Y.; Shi, Y.; Gao, S.; Jiang, F.; Veeranampalayam-Sivakumar, A.N.; Thompson, L.; Luck, J.; Liu, C. Improved crop row detection with deep neural network for early-season maize stand count in UAV imagery. Comput. Electron. Agric. 2020, 178, 105766. [Google Scholar] [CrossRef] [Scilit]
- Osco, L.P.; Arruda, M.d.S.d.; Gonçalves, D.N.; Dias, A.; Batistoti, J.; de Souza, M.; Gomes, F.D.G.; Ramos, A.P.M.; Jorge, L.A.d.C.; Liesenberg, V.; et al. A CNN approach to simultaneously count plants and detect plantation-rows from UAV imagery. ISPRS J. Photogramm. Remote Sens. 2021, 174, 1–17. [Google Scholar] [CrossRef] [Scilit]
- Zhao, J.; Yang, T.; Liu, F.; Ma, S.; Ma, M.; Yuan, Y. Monitoring Maize Growth Using a Model for Objective Weight Assignment Based on Multispectral Data From UAV. J. Agron. Crop Sci. 2025, 211, e70039. [Google Scholar] [CrossRef] [Scilit]
- Shu, M.; Li, Q.; Ghafoor, A.Z.; Zhu, J.; Li, B.; Ma, Y. Using the plant height and canopy coverage to estimation maize aboveground biomass with UAV digital images. Eur. J. Agron. 2023, 151, 126957. [Google Scholar] [CrossRef] [Scilit]
- Shao, G.; Han, W.; Zhang, H.; Wang, Y.; Zhang, L.; Niu, Y.; Zhang, Y.; Cao, P. Estimation of transpiration coefficient and aboveground biomass in maize using time-series UAV multispectral imagery. Crop J. 2022, 10, 1376–1385. [Google Scholar] [CrossRef] [Scilit]
- Ferraz, M.A.J.; Barboza, T.O.C.; Arantes, P.S.; Von Pinho, R.G.; dos Santos, A.F. Integrating Satellite and UAV Technologies for Maize Plant Height Estimation Using Advanced Machine Learning. AgriEngineering 2024, 6, 20–33. [Google Scholar] [CrossRef] [Scilit]
- Ji, J.; Li, N.; Cui, H.; Li, Y.; Zhao, X.; Zhang, H.; Ma, H. Study on Monitoring SPAD Values for Multispatial Spatial Vertical Scales of Summer Maize Based on UAV Multispectral Remote Sensing. Agriculture 2023, 13, 1004. [Google Scholar] [CrossRef] [Scilit]
- Ma, W.; Han, W.; Zhang, H.; Cui, X.; Zhai, X.; Zhang, L.; Shao, G.; Niu, Y.; Huang, S. UAV multispectral remote sensing for the estimation of SPAD values at various growth stages of maize under different irrigation levels. Comput. Electron. Agric. 2024, 227, 109566. [Google Scholar] [CrossRef] [Scilit]
- Bi, K.; Niu, Z.; Xiao, S.; Bai, J.; Sun, G.; Wang, J.; Han, Z.; Gao, S. Non-Destructive Monitoring of Maize Nitrogen Concentration Using a Hyperspectral LiDAR: An Evaluation from Leaf-Level to Plant-Level. Remote Sens. 2021, 13, 5025. [Google Scholar] [CrossRef] [Scilit]
- Chakhvashvili, E.; Machwitz, M.; Antala, M.; Rozenstein, O.; Prikaziuk, E.; Schlerf, M.; Naethe, P.; Wan, Q.; Komárek, J.; Klouek, T.; et al. Crop stress detection from UAVs: Best practices and lessons learned for exploiting sensor synergies. Precis. Agric. 2024, 25, 2614–2642. [Google Scholar] [CrossRef] [Scilit]
- Yang, T.; Zhao, J.; Hong, M.; Ma, M. Appropriate water and nitrogen supply regulates the dynamics of nitrogen translocation and thereby enhancing the accumulation of nitrogen in maize grains. Agric. Water Manag. 2024, 306, 109160. [Google Scholar] [CrossRef] [Scilit]
- Cheng, Q.; Wu, B.; Ye, H.; Liang, Y.; Che, Y.; Guo, A.; Wang, Z.; Tao, Z.; Li, W.; Wang, J. Inversion of maize leaf nitrogen using UAV hyperspectral imagery in breeding fields. Int. J. Agric. Biol. Eng. 2024, 17, 144–155. [Google Scholar] [CrossRef] [Scilit]
- Lu, F.; Sun, H.; Tao, L.; Wang, P. Data Integration Based on UAV Multispectra and Proximal Hyperspectra Sensing for Maize Canopy Nitrogen Estimation. Remote Sens. 2025, 17, 1411. [Google Scholar] [CrossRef] [Scilit]
- Nampally, T.; Kumar, K.; Chatterjee, S.; Pachamuthu, R.; Naik, B.; Desai, U.B. StressNet: A spatial-spectral-temporal deformable attention-based framework for water stress classification in maize. Front. Plant Sci. 2023, 14, 1241921. [Google Scholar] [CrossRef] [Scilit] [PubMed]
- Acharya, B.; Dodla, S.; Tubana, B.; Gentimis, T.; Rontani, F.; Adhikari, R.; Duron, D.; Bortolon, G.; Setiyono, T. Characterizing Optimum N Rate in Waterlogged Maize (Zea mays L.) with Unmanned Aerial Vehicle (UAV) Remote Sensing. Agronomy 2025, 15, 434. [Google Scholar] [CrossRef] [Scilit]
- Setiyono, T. Precise Positioning in Nitrogen Fertility Sensing in Maize (Zea mays L.). Sensors 2024, 24, 5322. [Google Scholar] [CrossRef] [Scilit] [PubMed]
- Zhou, P.; Ou, Y.; Yang, W.; Gu, Y.; Kong, Y.; Zhu, Y.; Jin, C.; Hao, S. Variable-Rate Fertilization for Summer Maize Using Combined Proximal Sensing Technology and the Nitrogen Balance Principle. Agriculture 2024, 14, 1180. [Google Scholar] [CrossRef] [Scilit]
- Shuai, G.; Fowler, A.; Basso, B. Within-season vegetation indices and yield stability as a predictor of spatial patterns of Maize (Zea mays L.) yields. Precis. Agric. 2024, 25, 963–982. [Google Scholar] [CrossRef] [Scilit]
- Barbedo, J.G.A. A Review on the Use of Unmanned Aerial Vehicles and Imaging Sensors for Monitoring and Assessing Plant Stresses. Drones 2019, 3, 40. [Google Scholar] [CrossRef] [Scilit]
- Ahmad, A.; Aggarwal, V.; Saraswat, D.; El Gamal, A.; Johal, G.S. GeoDLS: A Deep Learning-Based Corn Disease Tracking and Location System Using RTK Geolocated UAS Imagery. Remote Sens. 2022, 14, 4140. [Google Scholar] [CrossRef] [Scilit]
- Galindo-Gutiérrez, N.F.; Garcés-Gómez, Y.A. Effects of Silicon Application on Yield, Spectral Index, and Fall Armyworm (Spodoptera frugiperda) Infestation on Maize (Zea mays) Crop. AgriEngineering 2023, 5, 2112–2122. [Google Scholar] [CrossRef] [Scilit]
- Celikkan, E.; Kunzmann, T.; Yeskaliyev, Y.; Itzerott, S.; Klein, N.; Herold, M. WeedsGalore: A Multispectral and Multitemporal UAV-Based Dataset for Crop and Weed Segmentation in Agricultural Maize Fields. In Proceedings of the 2025 IEEE/CVF Winter Conference on Applications of Computer Vision (WACV), Tucson, AZ, USA, 28 February–4 March 2025; pp. 4767–4777. [Google Scholar] [CrossRef] [Scilit]
- Liu, Y.; Nie, C.; Zhang, Z.; Wang, Z.; Ming, B.; Xue, J.; Yang, H.; Xu, H.; Meng, L.; Cui, N.; et al. Evaluating How Lodging Affects Maize Yield Estimation Based on UAV Observations. Front. Plant Sci. 2023, 13, 979103. [Google Scholar] [CrossRef] [Scilit] [PubMed]
- Zhao, M.; Wang, D.; Yan, Q.; Li, Z.; Liu, X. UAV-Multispectral Based Maize Lodging Stress Assessment with Machine and Deep Learning Methods. Agriculture 2025, 15, 36. [Google Scholar] [CrossRef] [Scilit]
- Huq, A.; Zermas, D.; Bebis, G. Identification of Abnormality in Maize Plants from UAV Images Using Deep Learning Approaches. In Advances in Visual Computing; Bebis, G., Boyle, R., Parvin, B., Koracin, D., Feng, J., Chabra, V., Kambhamettu, C., Peters, J., Klosowski, J., Hwang, J.N., et al., Eds.; Springer: Cham, Switzerland, 2023; pp. 583–596. [Google Scholar] [CrossRef] [Scilit]
- Burglewski, N.; Srinivasagan, S.; Ketterings, Q.; van Aardt, J. Spatial and Spectral Dependencies of Maize Yield Estimation Using Remote Sensing. Sensors 2024, 24, 3958. [Google Scholar] [CrossRef] [Scilit] [PubMed]
- Gao, R.; Jin, Y.; Tian, X.; Ma, Z.; Liu, S.; Su, Z. YOLOv5-T: A precise real-time detection method for maize tassels based on UAV low altitude remote sensing images. Comput. Electron. Agric. 2024, 221, 108991. [Google Scholar] [CrossRef] [Scilit]
- Wei, J.; Wang, R.; Wei, S.; Wang, X.; Xu, S. Recognition of Maize Tassels Based on Improved YOLOv8 and Unmanned Aerial Vehicles RGB Images. Drones 2024, 8, 691. [Google Scholar] [CrossRef] [Scilit]
- Bantchina, B.B.; Qaswar, M.; Arslan, S.; Ulusoy, Y.; Gündoğdu, K.S.; Tekin, Y.; Mouazen, A.M. Corn yield prediction in site-specific management zones using proximal soil sensing, remote sensing, and machine learning approach. Comput. Electron. Agric. 2024, 225, 109329. [Google Scholar] [CrossRef] [Scilit]
- Mirzaee, S.; Nafchi, A.M. Enhancing NUE in Corn Through Optimized Sensor-Based Prescription Maps. Sensors 2025, 25, 3148. [Google Scholar] [CrossRef] [Scilit] [PubMed]
- Abdipourchenarestansofla, M.; Piepho, H.P. In season estimation of economic optimum nitrogen rate with remote sensing multispectral indices and historical telematics field-operation data. Precis. Agric. 2025, 26, 34. [Google Scholar] [CrossRef] [Scilit]
- Ma, Y.; Liang, S.Z.; Myers, D.B.; Swatantran, A.; Lobell, D.B. Subfield-level crop yield mapping without ground truth data: A scale transfer framework. Remote Sens. Environ. 2024, 315, 114427. [Google Scholar] [CrossRef] [Scilit]
- Bazrafkan, A.B.; Igathinathane, C.; Bandillo, N.; Flores, P. Optimizing integration techniques for UAS and satellite image data in precision agriculture—A review. Front. Remote Sens. 2025, 6, 1622884. [Google Scholar] [CrossRef] [Scilit]
- Xing, Y.; Liu, X.; Wang, X. Integrating UAVs, satellite remote sensing, and machine learning in precision agriculture: Pathways to sustainable food production, resource efficiency, and scalable innovation. Front. Agron. 2026, 7, 1670380. [Google Scholar] [CrossRef] [Scilit]
- ISO 11783-10:2015; Tractors and Machinery for Agriculture and Forestry—Serial Control and Communications Data Network—Part 10: Task Controller and Management Information System Data Interchange. International Organization for Standardization: Geneva, Switzerland, 2015.
- Gade, S.A.; Madolli, M.J.; García-Caparrós, P.; Ullah, H.; Cha-um, S.; Datta, A.; Himanshu, S.K. Advancements in UAV remote sensing for agricultural yield estimation: A systematic comprehensive review of platforms, sensors, and data analytics. Remote Sens. Appl. Soc. Environ. 2025, 37, 101418. [Google Scholar] [CrossRef] [Scilit]
- Yang, X.; Chen, J.; Lu, X.; Liu, H.; Liu, Y.; Bai, X.; Qian, L.; Zhang, Z. Advances in UAV Remote Sensing for Monitoring Crop Water and Nutrient Status: Modeling Methods, Influencing Factors, and Challenges. Plants 2025, 14, 2544. [Google Scholar] [CrossRef] [Scilit] [PubMed]
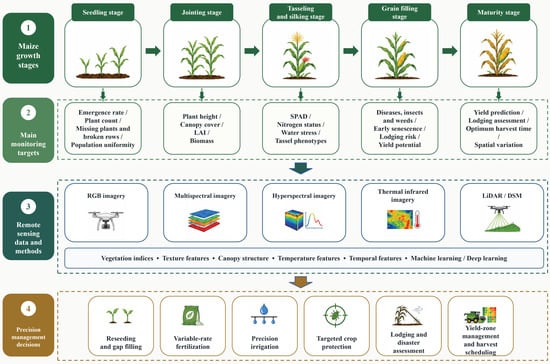
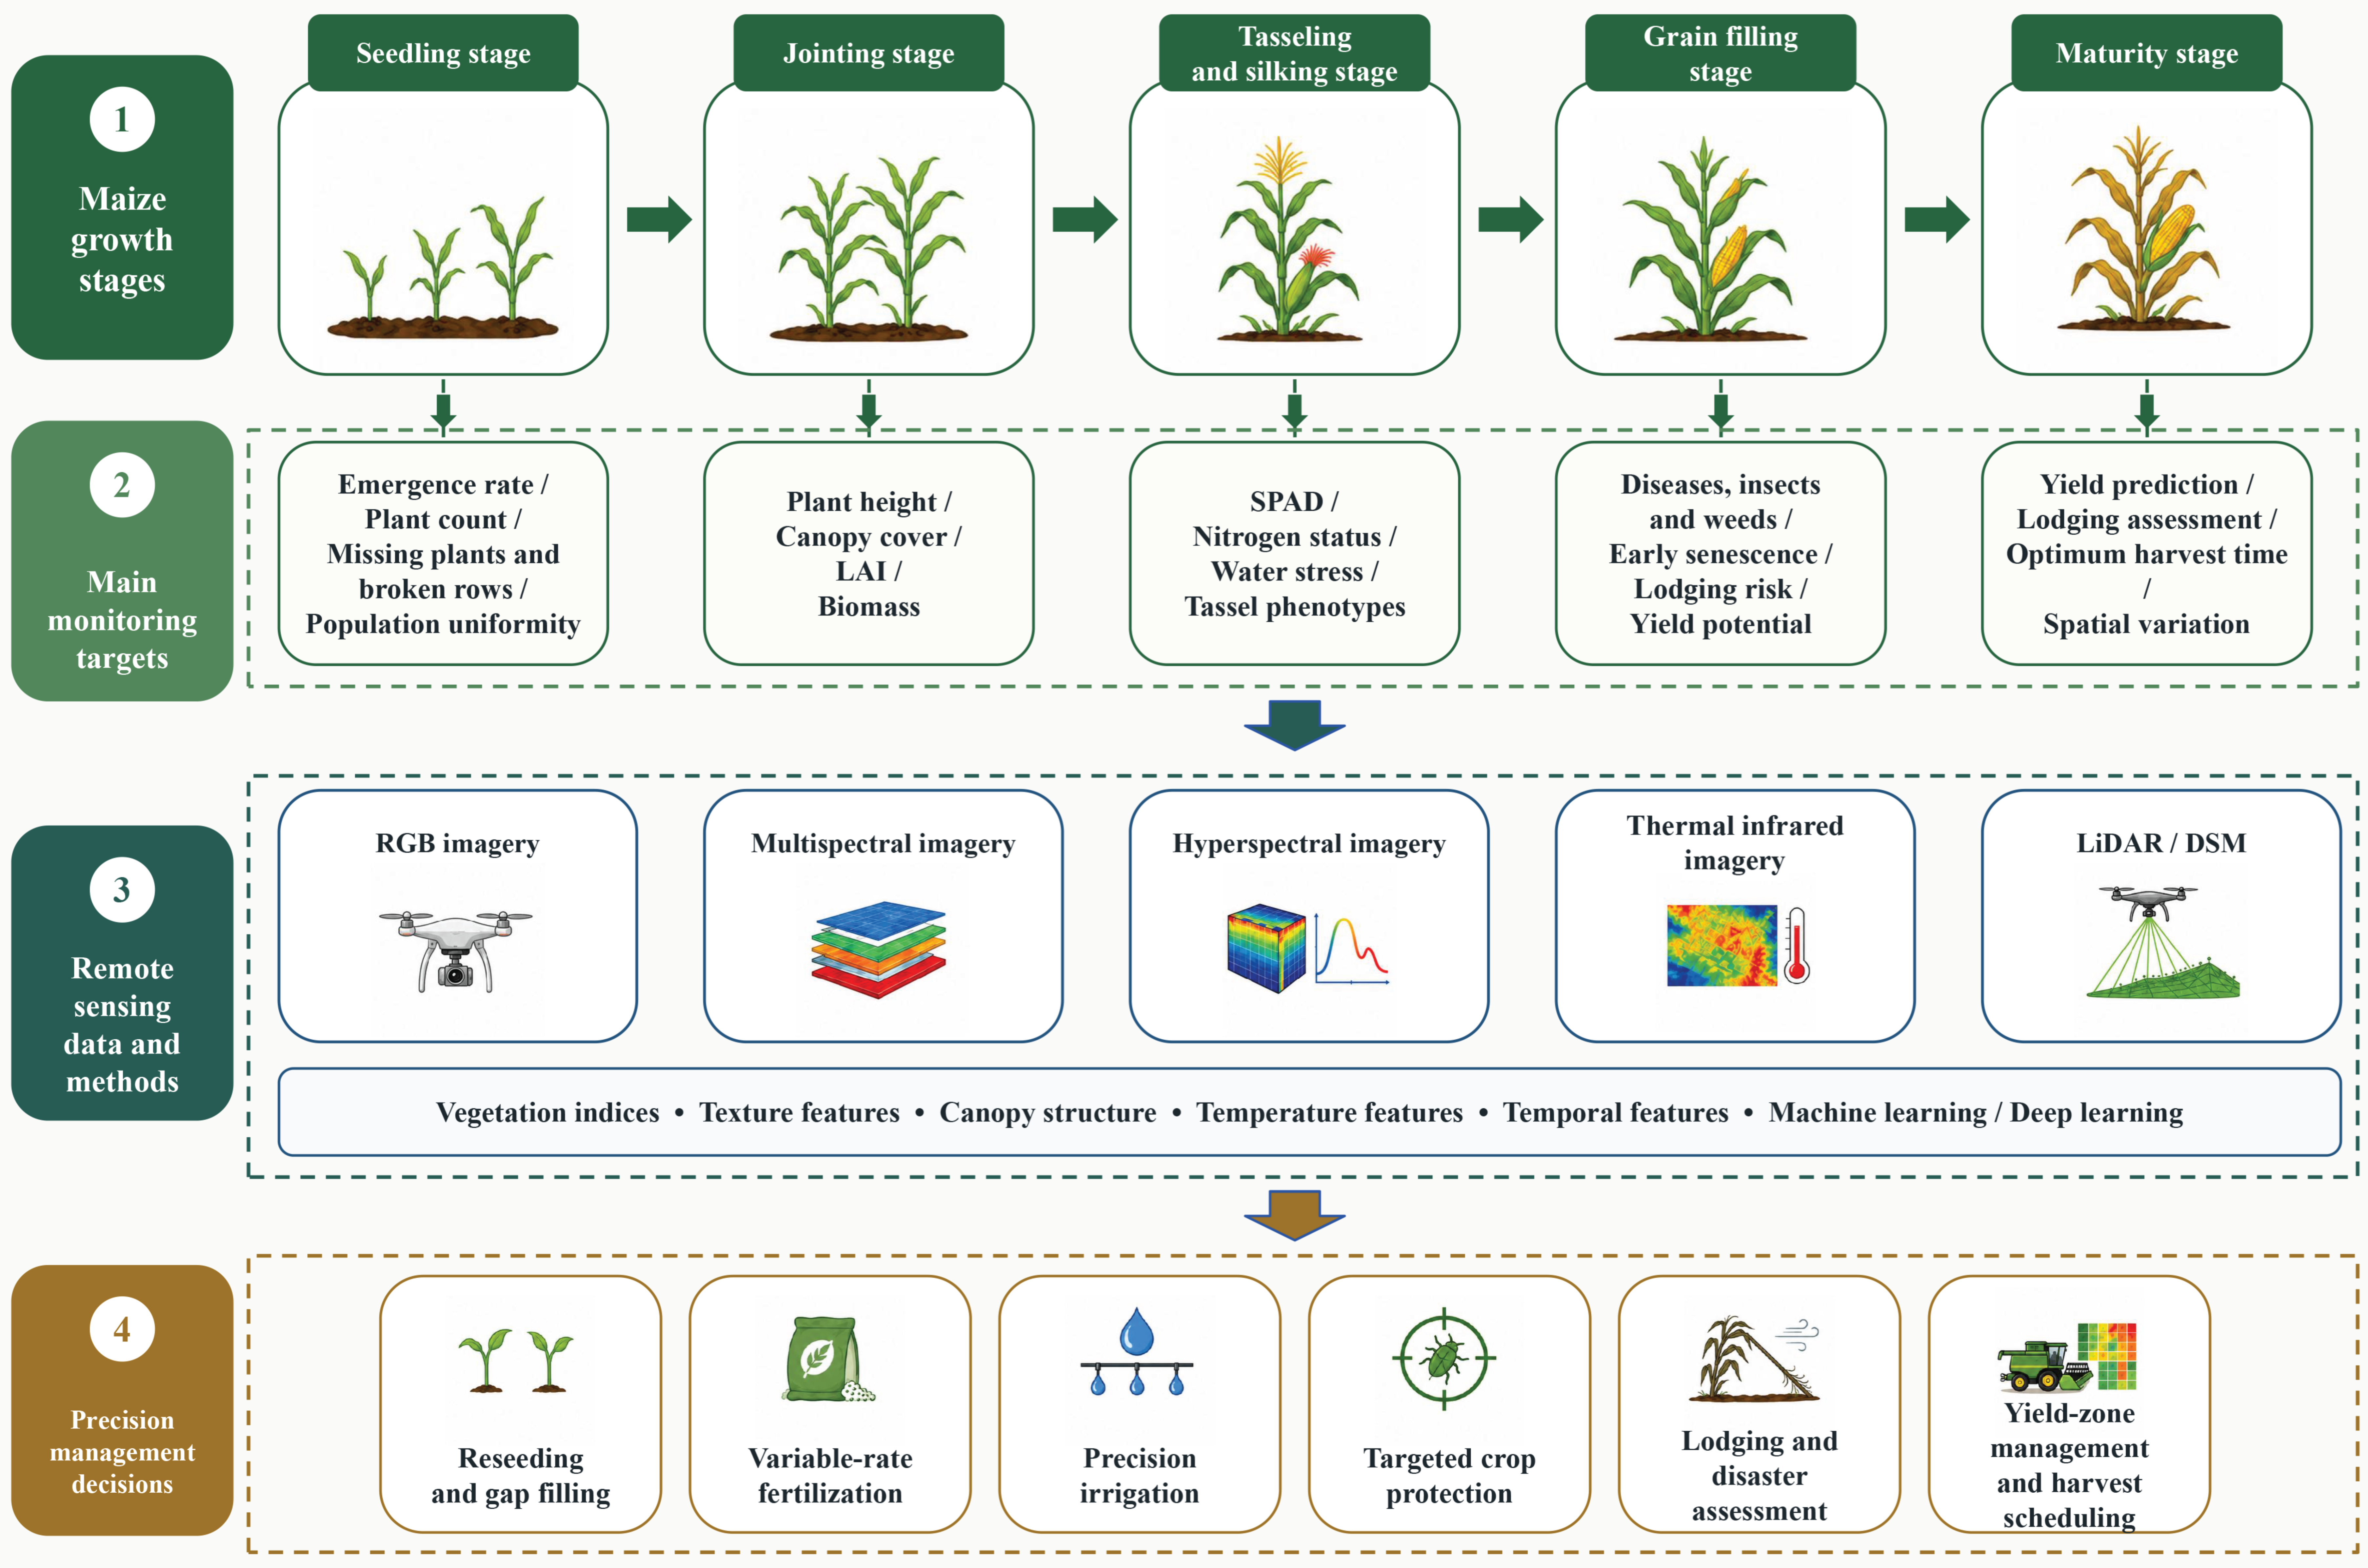
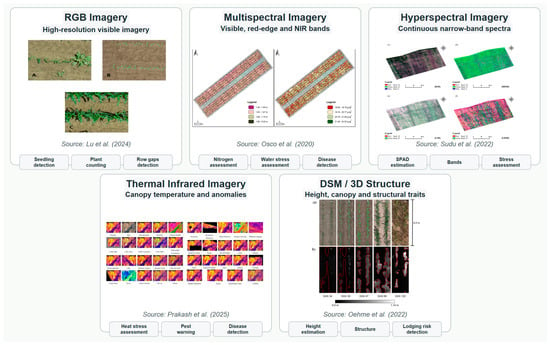
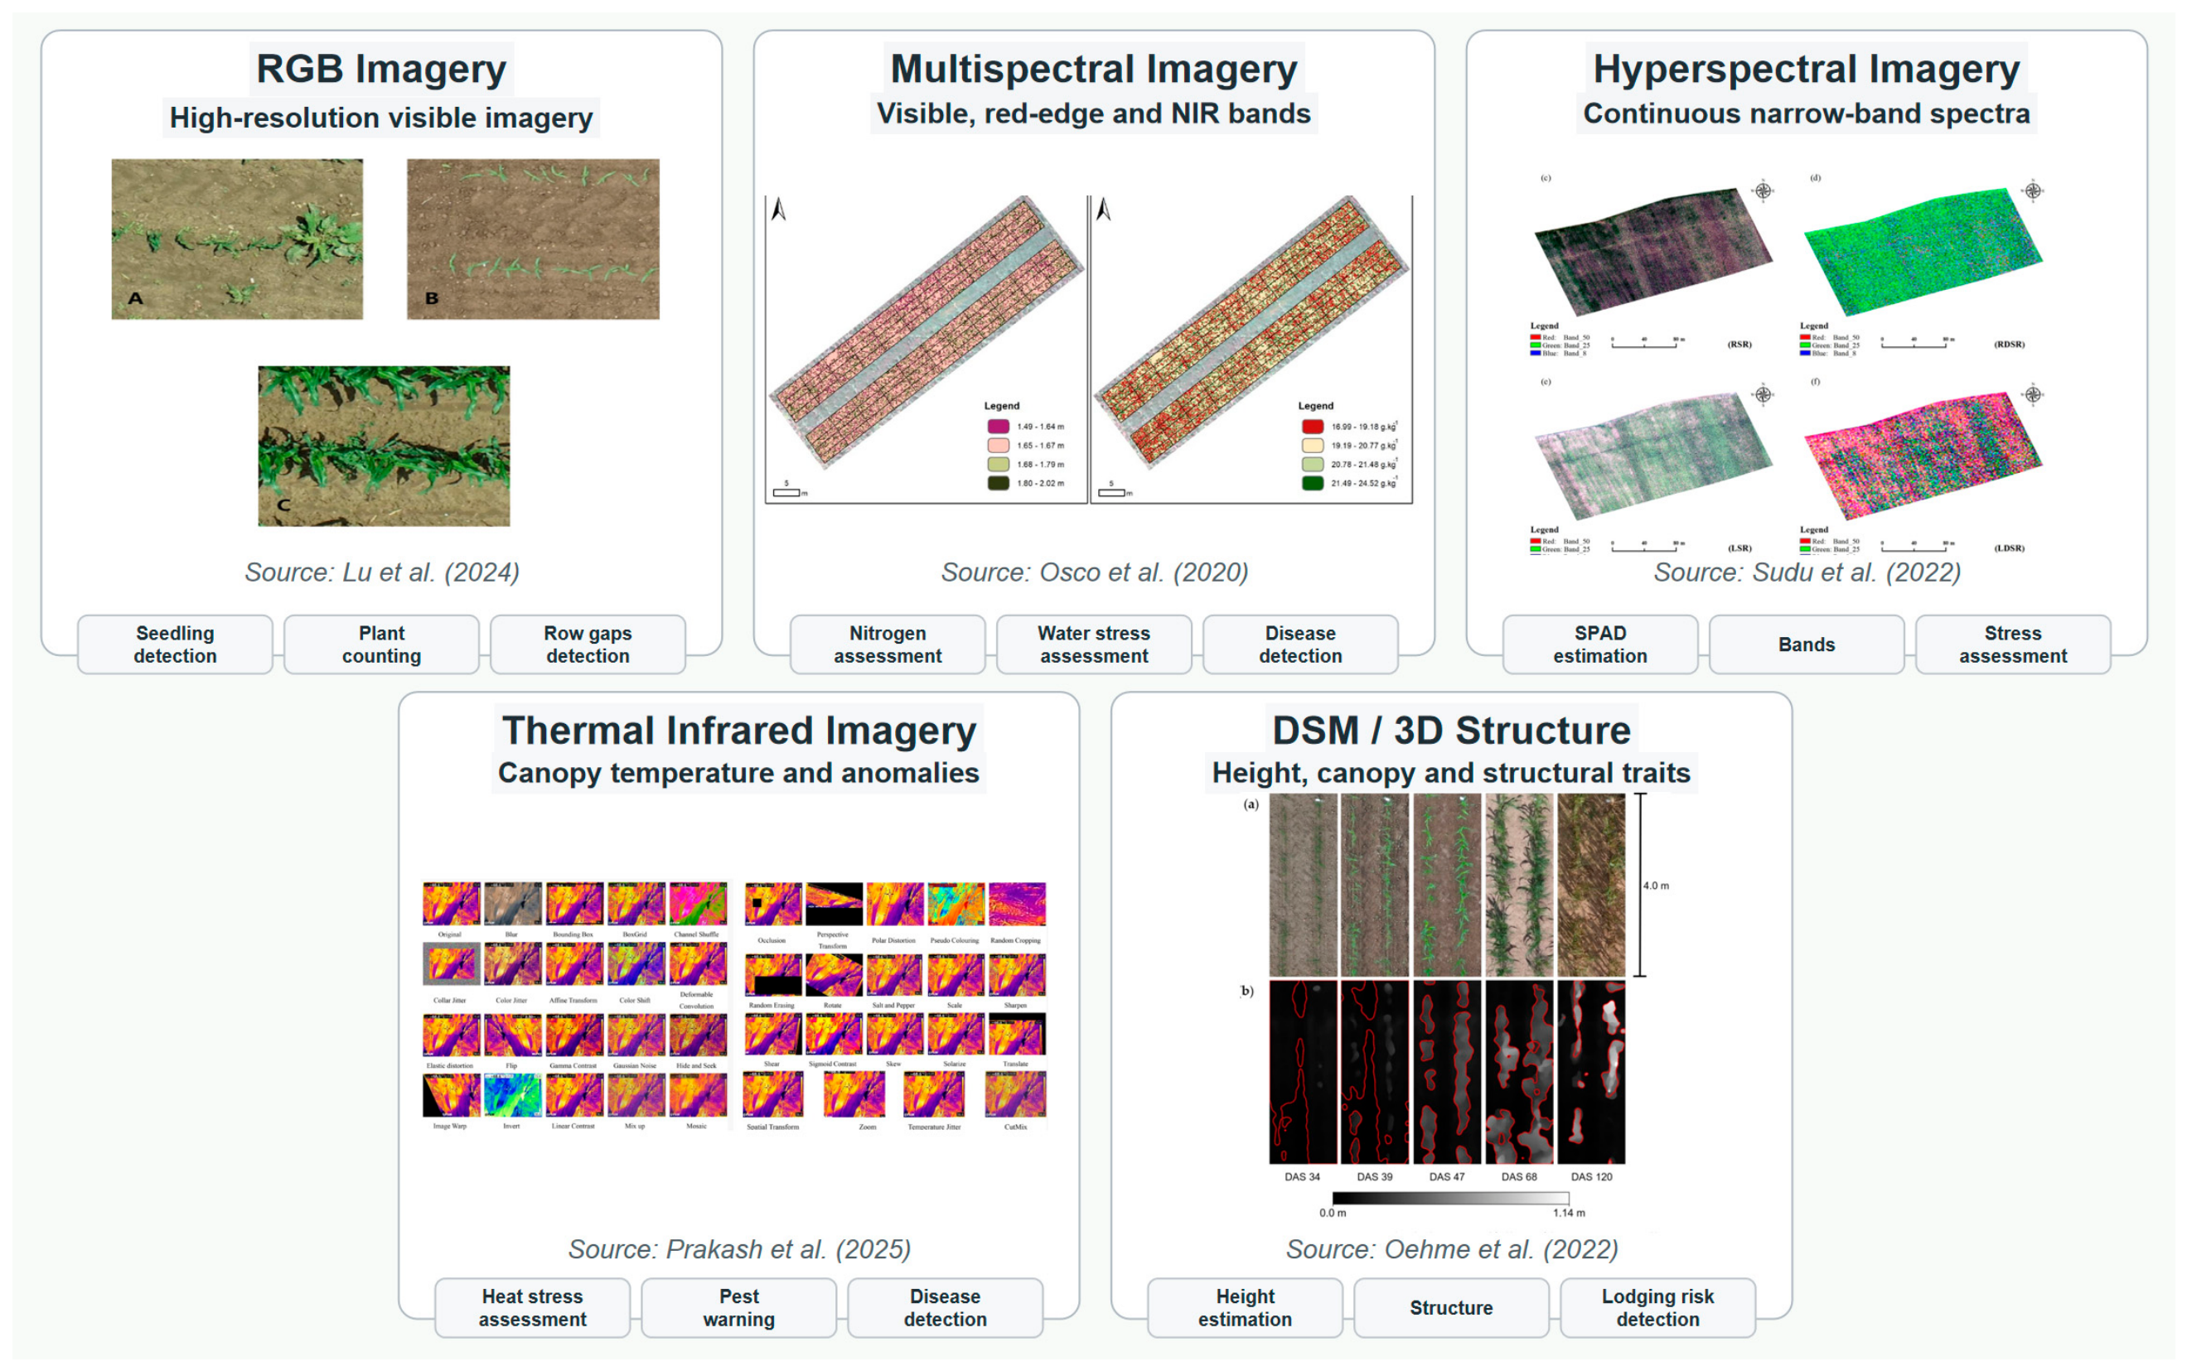
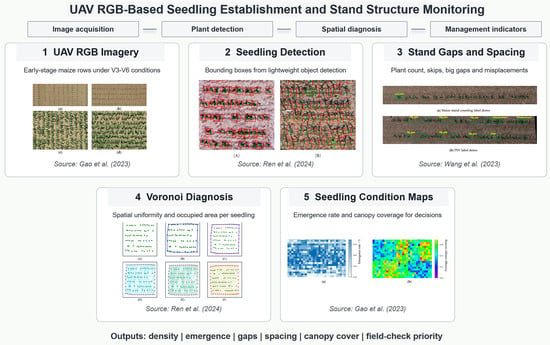
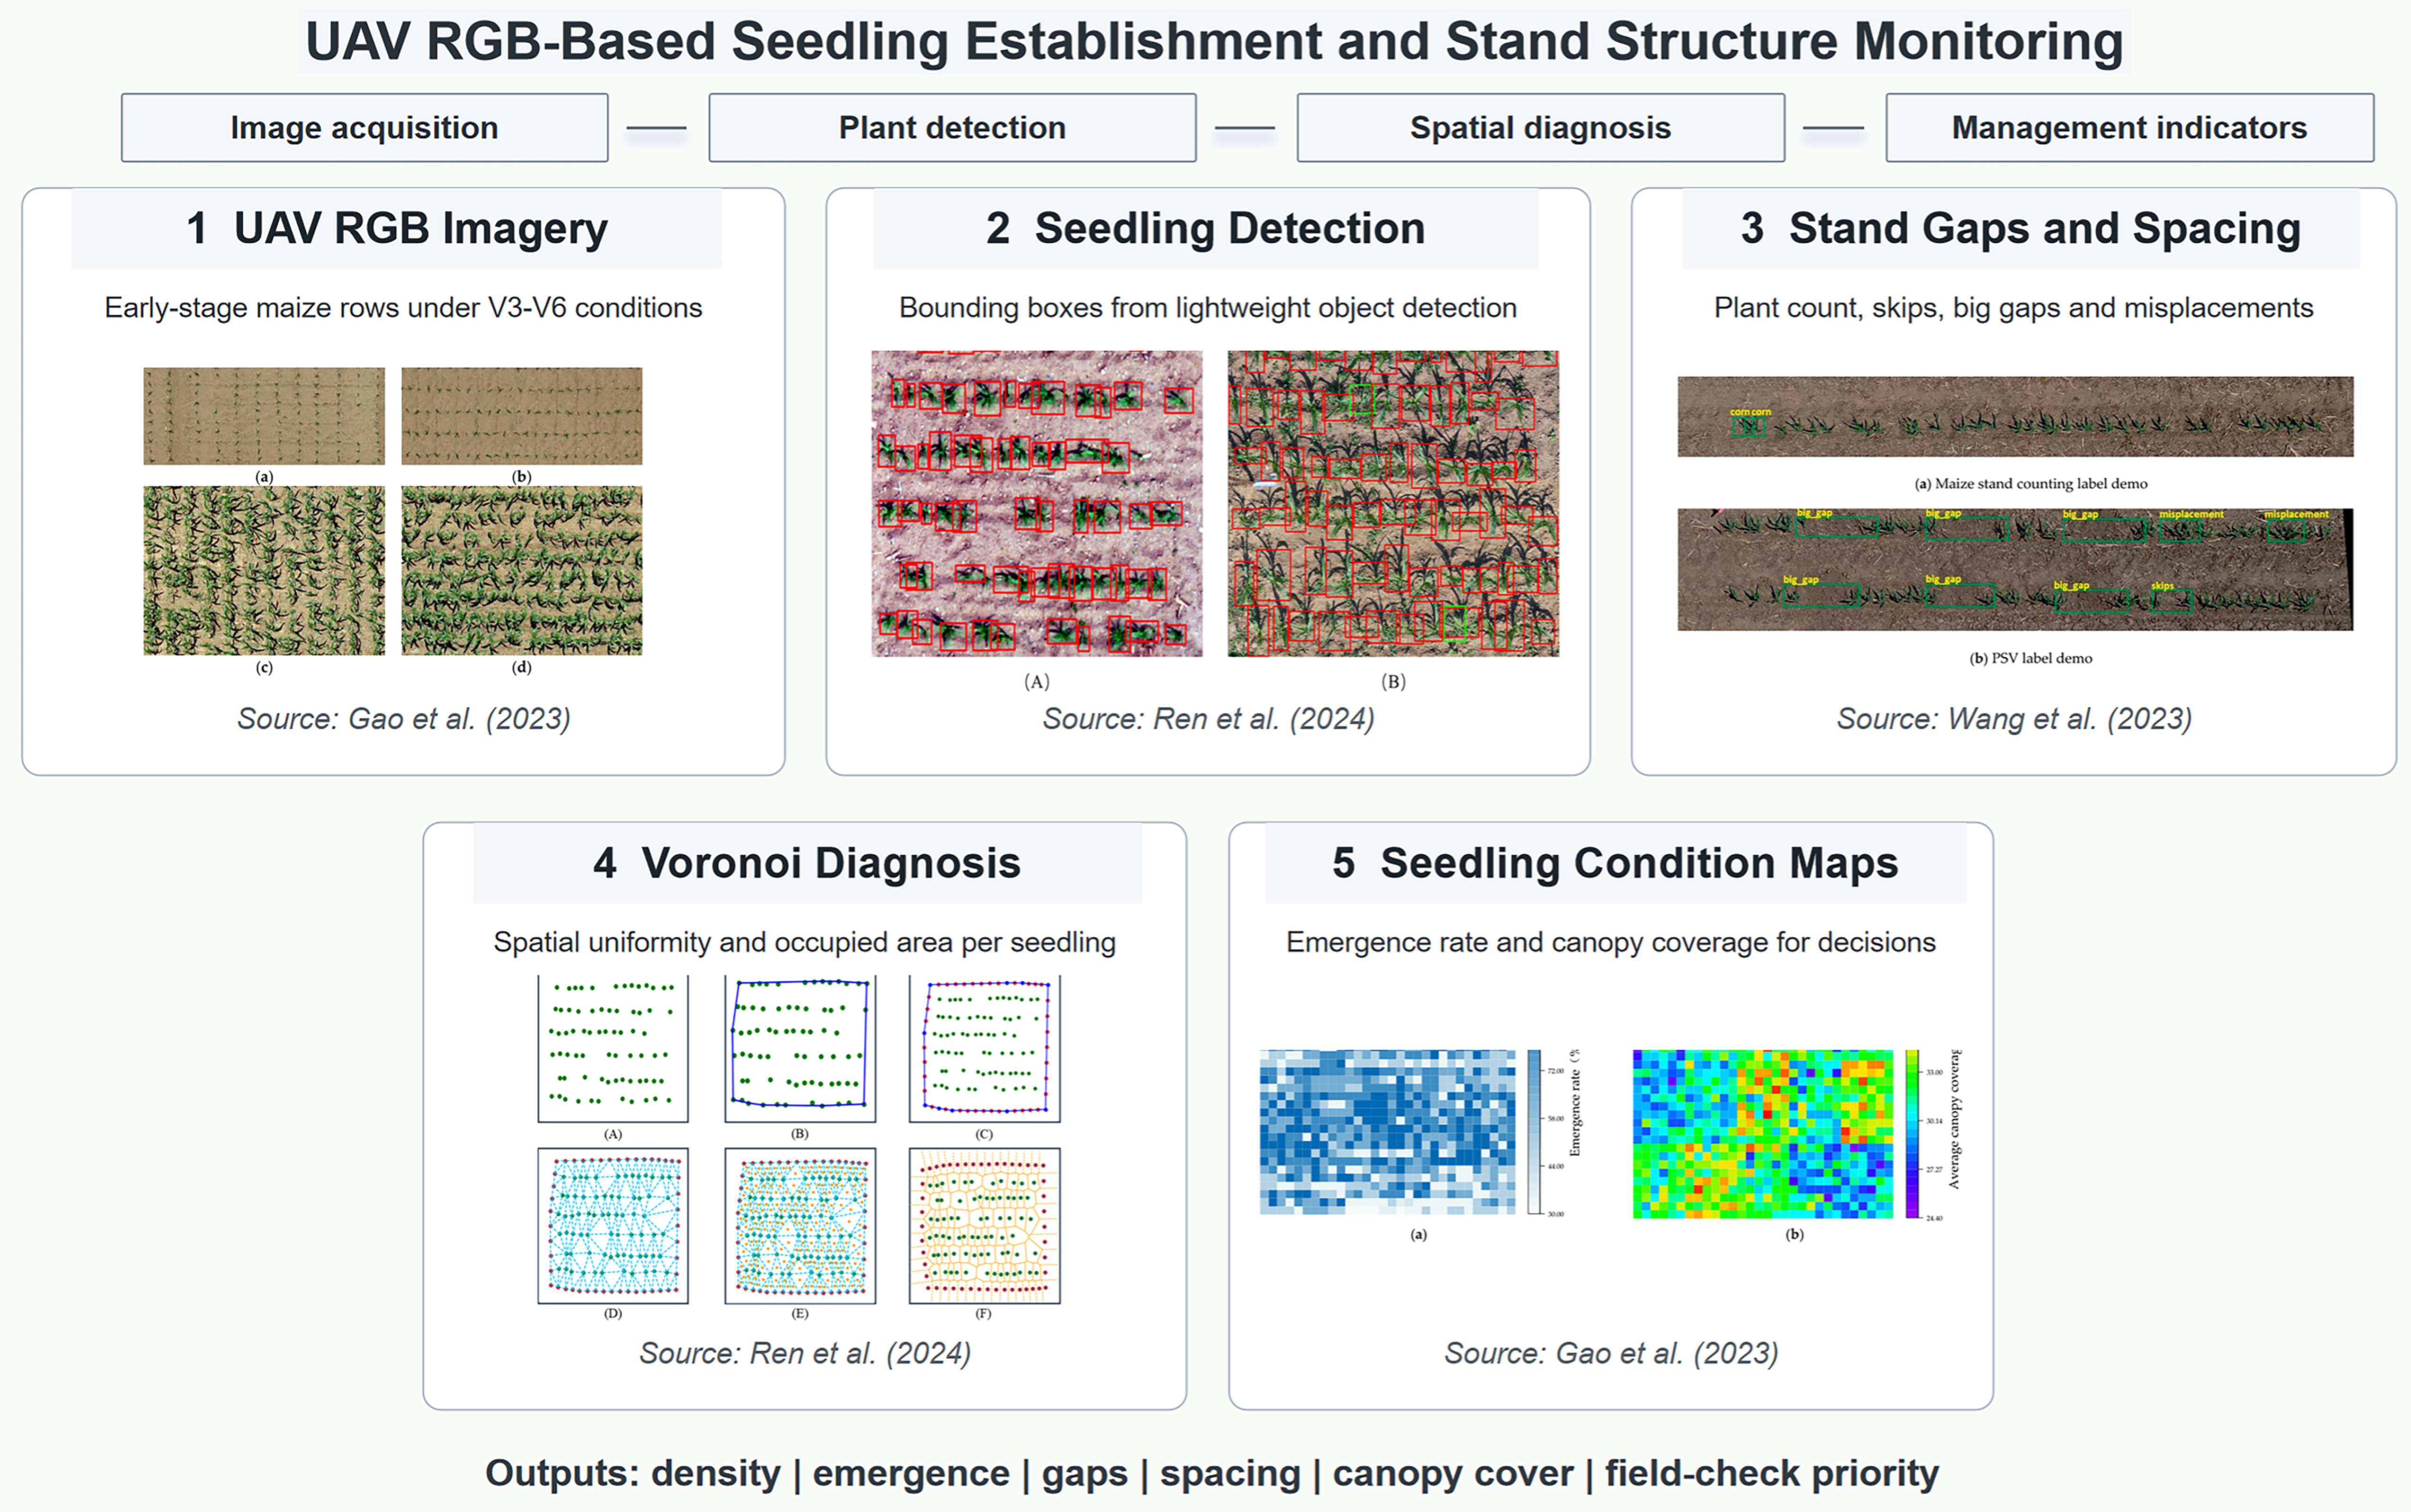
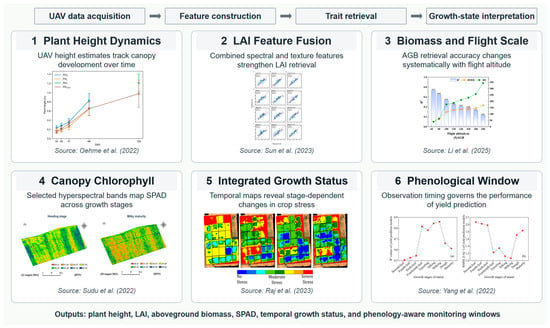
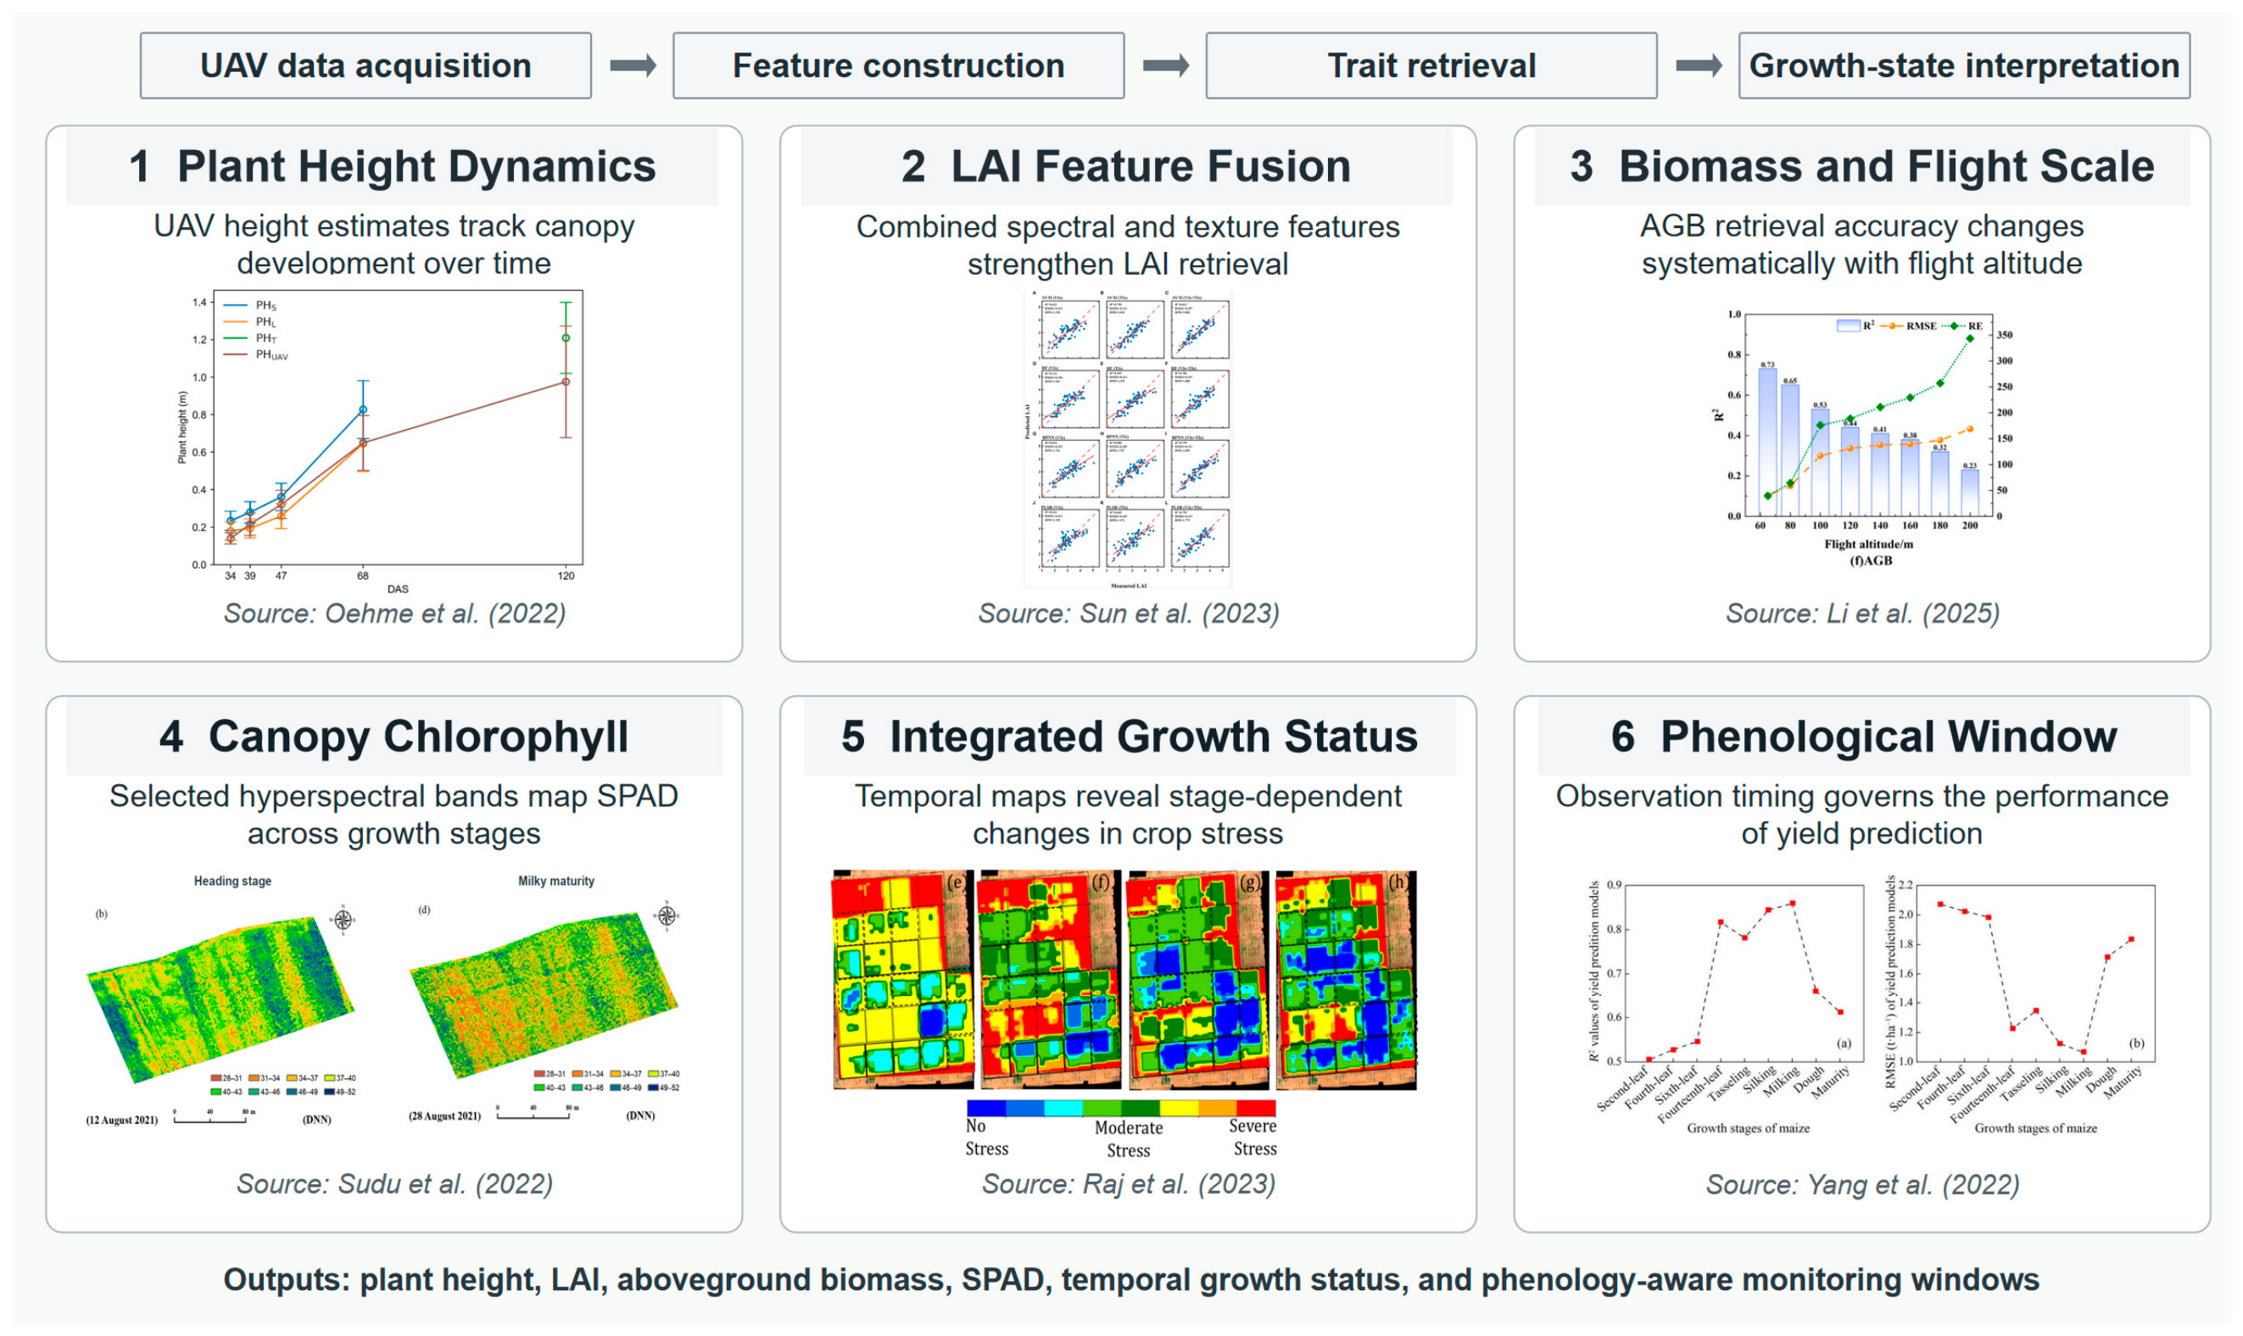
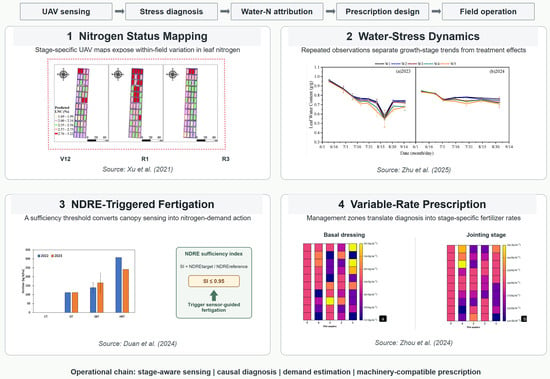
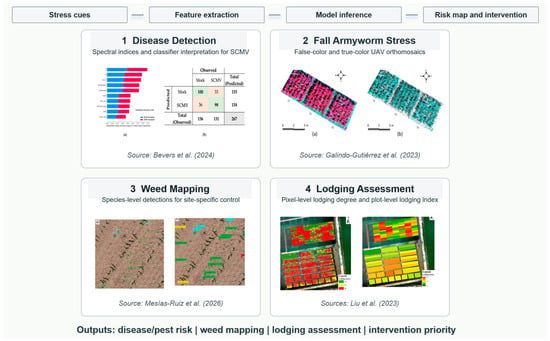
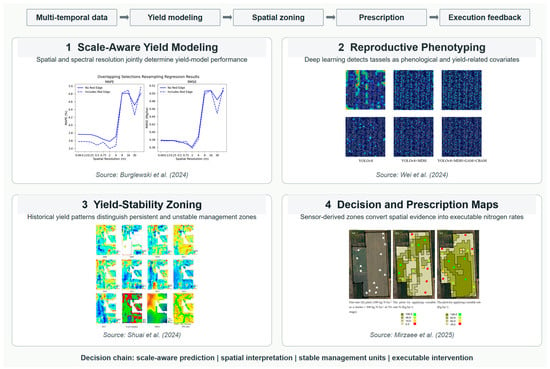
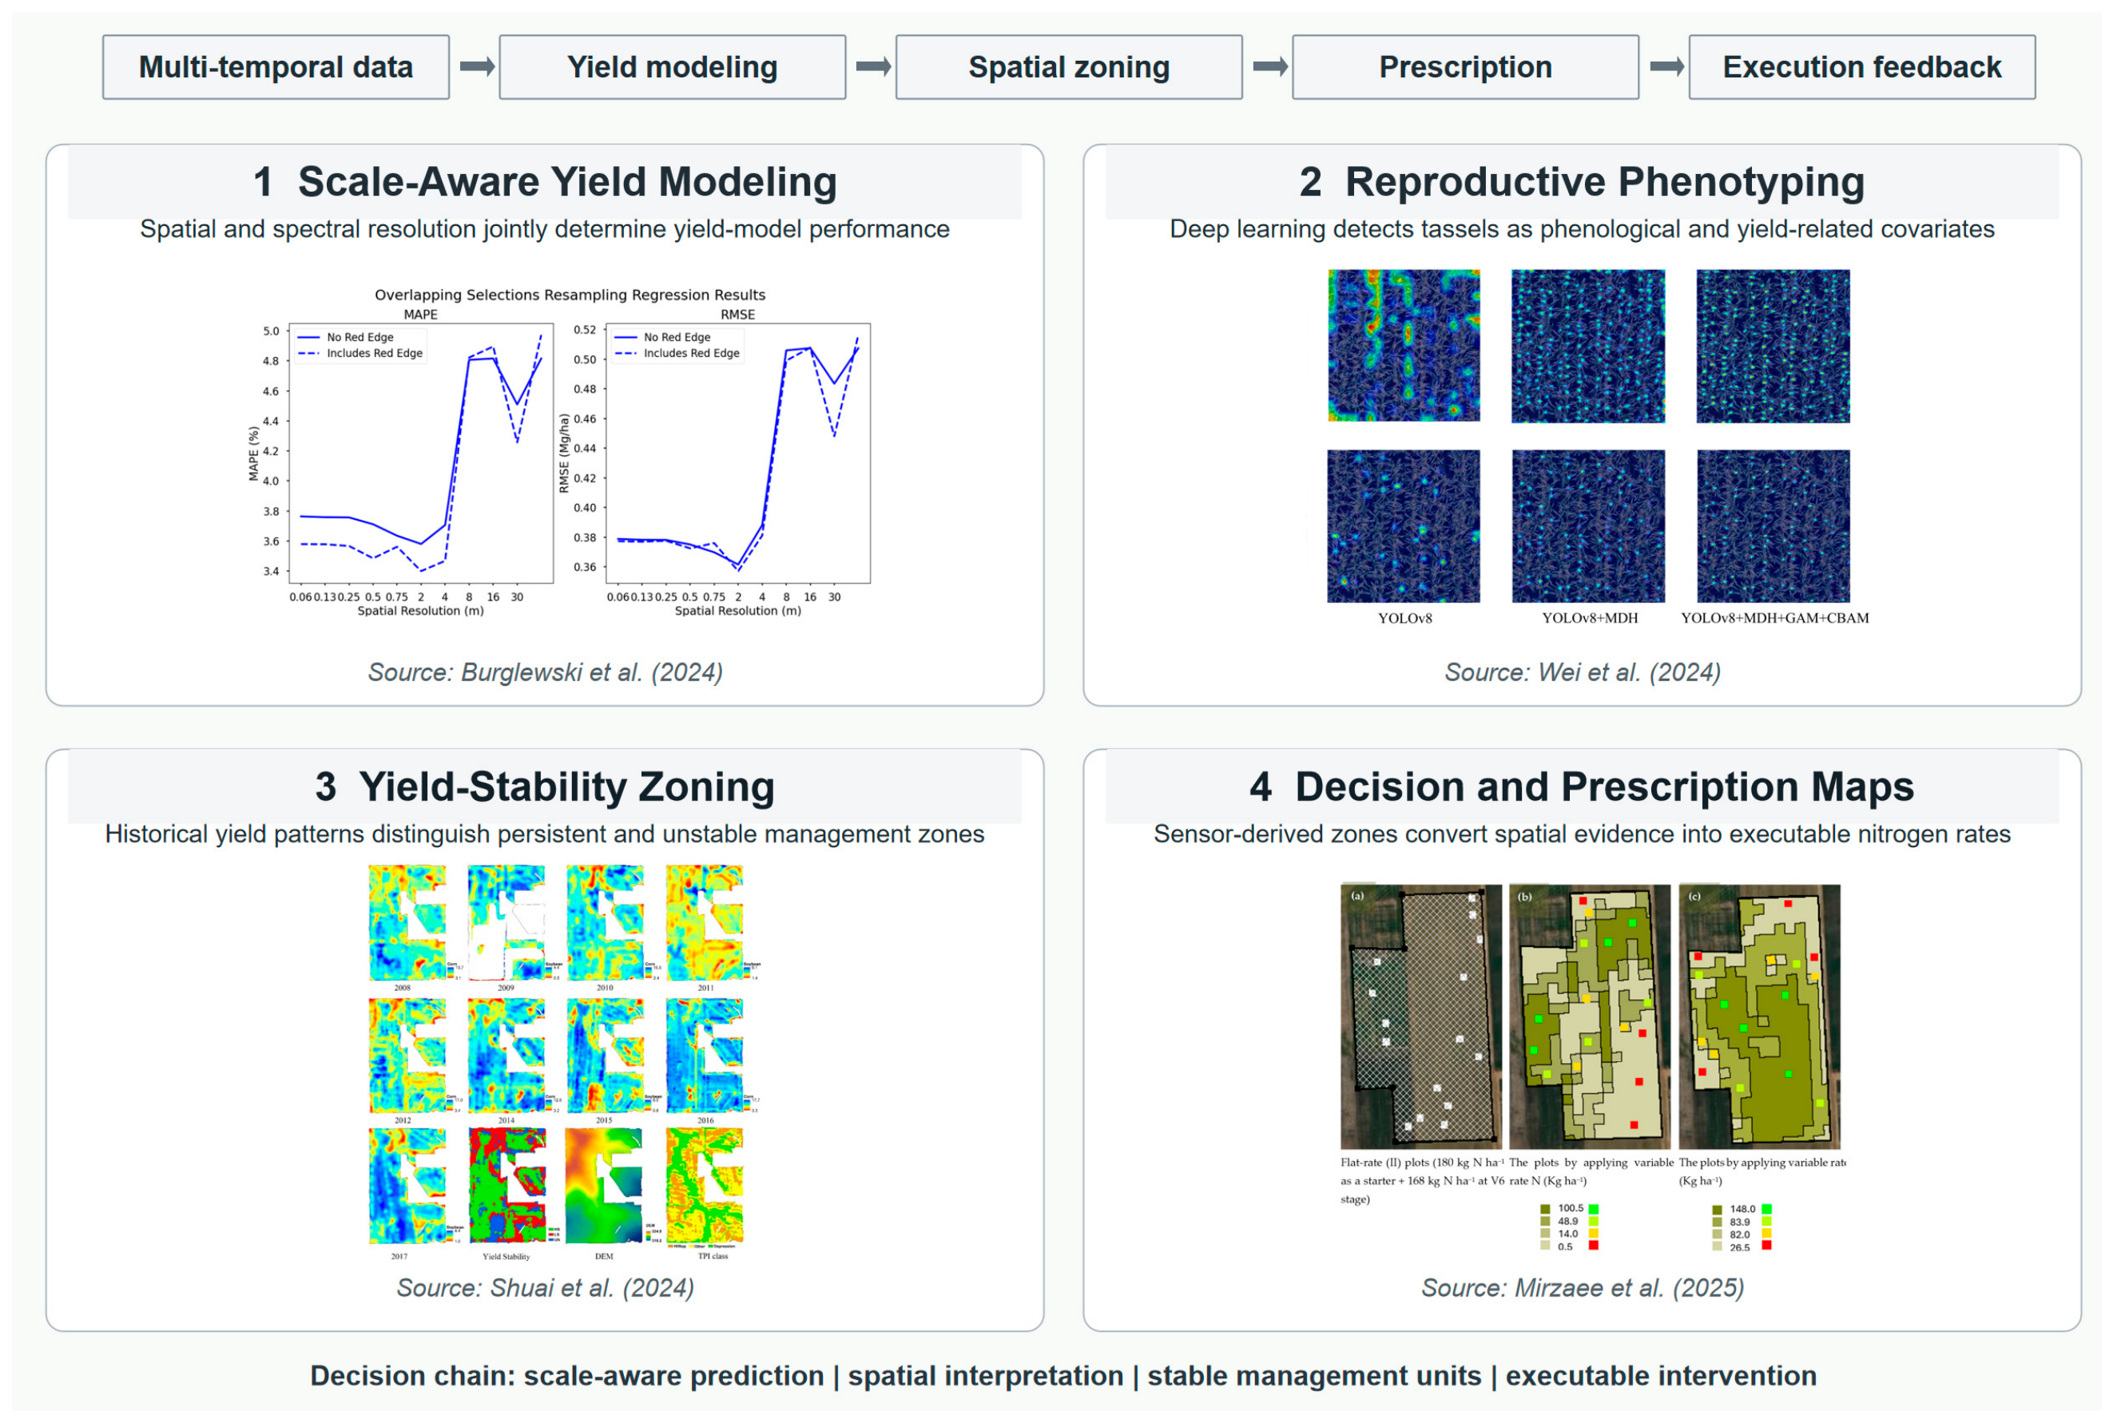

Disclaimer/Publisher’s Note: The statements, opinions and data contained in all publications are solely those of the individual author(s) and contributor(s) and not of MDPI and/or the editor(s). MDPI and/or the editor(s) disclaim responsibility for any injury to people or property resulting from any ideas, methods, instructions or products referred to in the content. |
© 2026 by the authors. Licensee MDPI, Basel, Switzerland. This article is an open access article distributed under the terms and conditions of the Creative Commons Attribution (CC BY) license.