


Highlights
What are the main findings?
- A novel out-of-distribution algorithm named PCA-HBOS is proposed to identify and filter out false-negative and false-positive samples generated by object-detection models of UAV system in low-altitude scenarios.
- The proposed algorithm can be integrated with various object-detection models, including common model series such as Faster R-CNN, RTMDet, and YOLO. Experimental results reveal that the performance of the OOD algorithm based on model network features is positively correlated with the generalization of the underlying model.
What are the implications of the main findings?
- The proposed algorithm could mitigate safety risks arising from predictive uncertainty of object-detection models in a UAV system by monitoring and filtering out erroneous and abnormal data in real time.
- The proposed algorithm not only supports model performance testing and optimization process, but also helps demystify the black-box nature of machine learning models, thereby steering the development of UAV object-detection algorithms toward greater safety and trustworthiness.
Abstract
With the rapid development of AI technology in the low-altitude field, the predictive uncertainty of ML models, particularly object-detection models, has become a key bottleneck restricting their airworthiness and safe deployment. A typical manifestation of this is that when facing test samples in open-world scenarios, object-detection models exhibit overconfidence in erroneous predictions. To address this issue, this paper proposes an anomaly-scoring algorithm for out-of-distribution (OOD) evaluation based on augmented deep network features, named PCA-HBOS. By integrating the high-dimensional semantic features extracted by deep networks, the algorithm can score sample distributions, thereby enabling the identification of both in-distribution and out-of-distribution samples. Through comparisons with mainstream OOD algorithms, the superiority of the PCA-HBOS in low-altitude scenarios is validated. Experimental results on three multi-sensor UAV detection datasets—MSDD, AOT, and AOD-4—demonstrate that, except for Faster R-CNN and YOLOv2, the PCA-HBOS achieves favorable OOD discrimination performance across multiple object-detection models. On false-negative samples, it attains optimal AUC and FPR95 values of 0.995 and 0.291, respectively, while on false-positive samples, the optimal values reach 0.960 and 0.354. Furthermore, the experiments further explore the relationship between model generalization and OOD algorithm performance. The proposed algorithm can provide methodological support for model performance testing and optimization, contributing to the development of intelligent UAV systems towards safer and more trustworthy directions.
1. Introduction
In recent years, various stages of the civil aircraft lifecycle have offered a broad application platform for Artificial Intelligence (AI) technologies, particularly represented by Machine Learning (ML) [1,2,3,4]. As a typical deep learning technique, object detection has garnered significant attention from numerous aviation safety authorities, research institutions, and leading enterprises [5,6,7]. Efforts are actively underway to develop, test, and certify autonomous landing and intelligent obstacle avoidance systems based on object-detection technologies [8,9].
Furthermore, a substantial body of academic research has focused on object-detection models [10,11,12,13]. In the domain of autonomous landing, Ye et al. [14] proposed a novel single-stage, anchor-free decoupled runway detection algorithm framework, termed YOLO-RWY. The framework incorporates modules such as enhanced data augmentation, large separable kernel attention, and a bidirectional feature pyramid network, effectively enhancing the generalization and real-time performance of the Unmanned Aerial Vehicle (UAV) runway detection model. Chen et al. [15] created the FS2020 runway dataset using the flight simulation software Flight Simulator and proposed a real-time runway detection model based on a deep convolutional neural network. The model’s effectiveness was evaluated by computing the actual error between the predicted feature lines and the ground-truth feature lines. In the field of intelligent collision avoidance, Isaac-Medina et al. [16] curated and evaluated the performance of three object-tracking frameworks and four object-detection algorithms across three UAV datasets, establishing the first publicly available multi-algorithm performance benchmark for aircraft object detection and tracking. Mediavilla et al. [17] constructed a helicopter object-detection dataset, evaluated the performance of five deep learning-based object-detection methods, and compared various data augmentation techniques to explore improvements in the accuracy and precision of detecting small aerial objects. Addressing the task of low-altitude aircraft detection and tracking, Ghosh et al. [18] introduced a cascaded detection module along with primary and secondary classification modules to construct a deep learning model, and validated the proposed model’s compliance with detect-and-avoid standards based on multiple real-flight tests.
However, it is evident that the aforementioned studies have primarily focused on algorithmic performance, without adequately addressing safety considerations. ML tasks typically operate under the assumption that training and test samples are independent and identically distributed, with models trained on a closed training set being used to predict samples in the test set [19,20,21]. This paradigm of training and testing on a finite, closed set leads to a critical vulnerability: when models are deployed in open-world scenarios (OWS) [22,23] and encounter test samples that deviate from the training distribution—known as out-of-distribution (OOD) samples—they tend to exhibit overconfidence [24]. Their predictive accuracy degrades sharply, and they may assign high-confidence scores to erroneous decisions [25]. In the safety-critical domain of aviation, such erroneous predictions could undoubtedly lead to severe consequences. Therefore, integrating OOD evaluation techniques into ML models for aviation applications is of significant importance for mitigating decision-making risks and enhancing overall safety levels.
Concurrently, in low-altitude scenarios predominantly involving UAVs, electric vertical take-off and landing (eVTOL) aircraft, helicopters, and fixed-wing aircraft [26], object-detection models encounter additional challenges, including small object sizes, long distances, dense distributions, substantial scale variations, dynamic illumination conditions, and complex backgrounds [27]. Under such conditions, models are highly susceptible to prediction errors such as false positives and missed detections due to insufficient generalization capabilities [28]. This situation creates an urgent need to enhance the performance and ensure the reliability and safety of object-detection models in low-altitude environments.
To address the issue of prediction uncertainty in deep learning models, both the Society of Automotive Engineers (SAE) and the European Union Aviation Safety Agency (EASA) have articulated technical requirements for leveraging OOD detection methods to test model performance. The SAE, in the draft of its aerospace recommended practice (ARP) ARP6983, proposes that system safety objectives should be linked with machine learning performance indicators. It suggests viewing the discrepancy between the approximate inferences of an ML model and the actual requirements as the model’s generalization error. By encoding the margin of error and the acceptable tolerance within performance indicators, it can be determined whether the ML model performs adequately. When the approximations generated by the model fall within the defined error margin, the model is considered to have met the allocated performance requirements. Furthermore, the draft emphasizes that performance testing should adequately consider the model’s generalization capability within its operational design domain (ODD) and identifies the application of OOD methods for model performance testing as a viable approach.
In parallel, EASA, in its machine learning application guidance [29], has explicitly stipulated requirements for OOD detection during the model performance testing process. Within the proposed means of compliance (MOC) for intended airworthiness, MOC IMP-10, EASA mandates that applicants should perform and document the verification of the inference model’s robustness under adverse conditions. This activity should be supported by test cases, with particular emphasis on considering two additional sets of test cases: “OOD” cases and “adversarial” cases. Consequently, the application of OOD detection techniques for testing ML model performance in AI-based civil aircraft is not only a safety imperative but also an inevitable course of action to comply with industry standards and align with sector advancements.
Currently, a substantial body of research has been conducted by scholars on the development and application of algorithms for OOD detection [30,31,32]. Zhao et al. [33] addressed the issue of pre-trained networks erroneously assigning high confidence to OOD samples during the testing phase by introducing a cross-class nearest-neighbor distribution. By synthesizing OOD samples from the nearest-neighbor distributions of in-distribution (ID) samples, their method enables the model to learn to reject predictions for OOD inputs. Fang et al. [34] investigated the generalization problem in OOD detection by studying the probably approximately correct learning theory compatible with commonly used OOD performance evaluation metrics, providing insights into the reliability of OOD data from varying distributions. Sheng et al. [35] address the long-tailed distribution commonly observed in open-world environments by proposing a dynamic dual mining framework, which optimally utilizes existing data through dual mining ID samples and auxiliary outliers, thereby effectively tackling the challenge of out-of-distribution detection under long-tailed distributions. Zhang et al. [36], addressing the trade-off between OOD detection performance and OOD generalization performance, decoupled the uncertainty learning objective from a Bayesian perspective, naturally reconciling the conflict between OOD detection and OOD generalization. These scholars have proposed improvements to existing OOD methods from various perspectives. However, to date, no prior research has been conducted on OOD methodologies specifically targeting the safety-critical aviation domain.
To address the safety risks arising from prediction uncertainties inherent in deep learning models deployed within low-altitude aircraft, this paper proposes an OOD evaluation method termed the histogram-based outlier score with principal components analysis (PCA-HBOS). This method fuses high-dimensional semantic features extracted from deep networks and employs a histogram-based outlier score to evaluate the distribution of input samples, thereby identifying anomalous out-of-distribution samples. This paper first elucidates the underlying principles of the proposed algorithm. Subsequently, it is employed to train multiple object-detection models on multiple low-altitude object-detection datasets, and their generalization performance is rigorously evaluated. Finally, the proposed OOD evaluation algorithm is applied to the false-negative (FN) and false-positive (FP) samples generated by these models to validate its feasibility and effectiveness. The main contributions of this paper are as follows:
- (1)
- Introduce PCA-HBOS, a novel and robust OOD detection method designed for real-time monitoring of FN and FP samples in low-altitude object detection. By integrating the algorithm with neuron-level features of complex deep networks, theoretical innovation is achieved, further demystifying the black-box nature of machine learning. Comprehensive evaluations of three low-altitude datasets demonstrate its superior performance against mainstream OOD detection algorithms, underscoring its practical viability for real-world distributional shifts in low-altitude scenarios.
- (2)
- Investigate the generalization performance of object-detection models with varying architectural complexities on low-altitude data, encompassing both data from the same source as the training set and data from disparate sources. This analysis provides valuable insights for evaluating model performance in low-altitude object-detection tasks.
- (3)
- By integrating PCA-HBOS with multiple deep learning models, this paper simulates and evaluates OOD performance on true-positive (TP), FN and FP samples in three low-altitude datasets. This integrated approach further enables an investigation into how OOD performance relates to model generalization. Experimental results show that the proposed algorithm achieves superior discrimination performance in various samples.
2. Materials and Methods
2.1. Datasets
The low-altitude object-detection data employed in this study are derived from three distinct sources: the multi-sensor UAV detection dataset (MSDD) [37], the airborne object tracking dataset (AOT) [38], and the airborne object detection dataset (AOD-4) [39]. Specifically, the MSDD is utilized for model training and performance benchmarking, whereas the AOD-4 and AOT are employed to assess the model’s generalization capability on heterogeneous data.
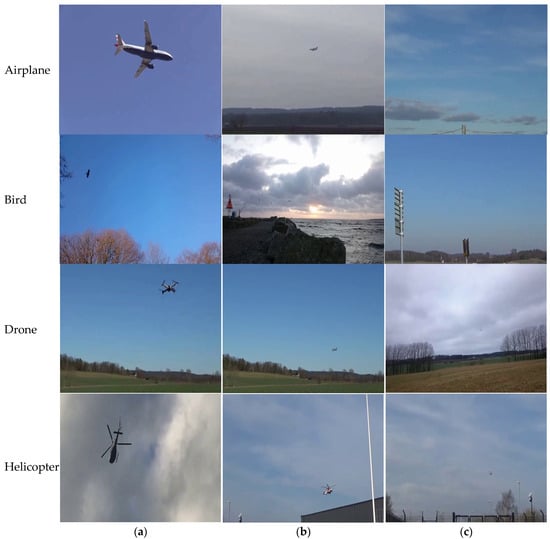
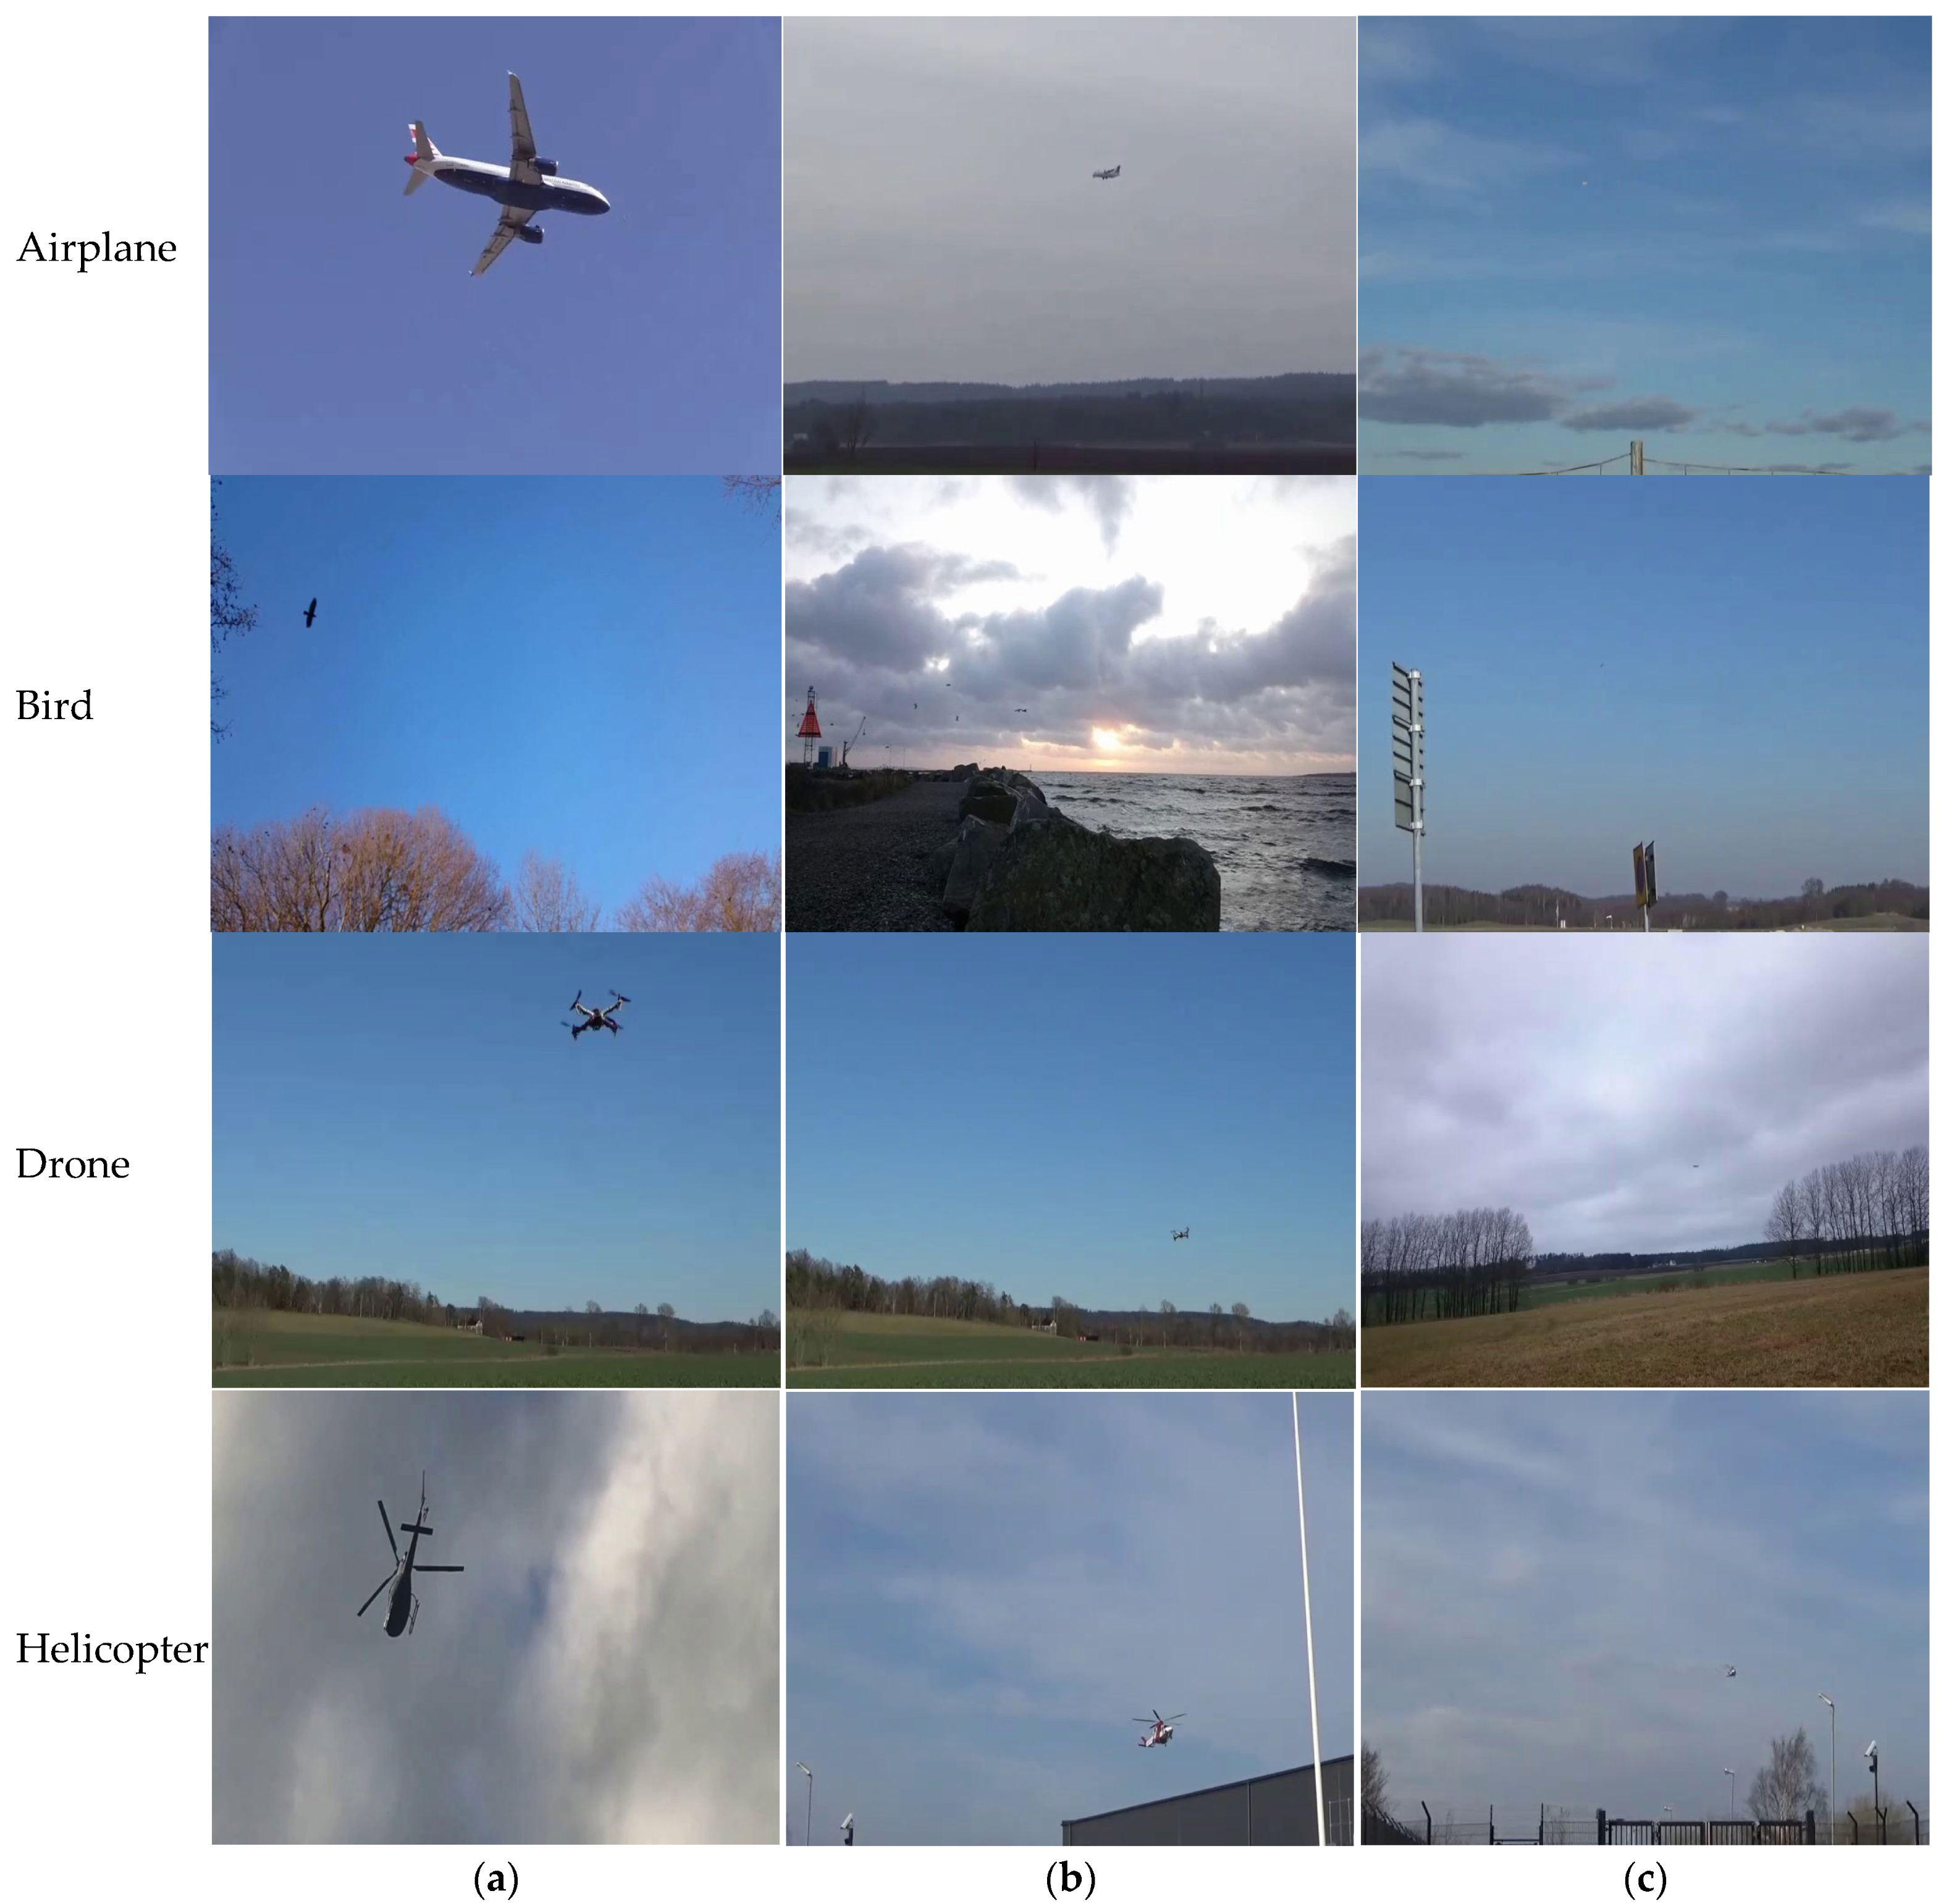
The MSDD encompasses UAVs as well as three types of low-altitude interfering objects: birds, airplanes, and helicopters. In accordance with industrial detection standards, the imagery was captured at three distance scales—close, medium, and far. The dataset comprises a total of 285 visible-light videos, containing 203,328 annotated images with a resolution of 640 × 512 pixels. From this collection, 4750 representative images were selected and randomly partitioned into training, validation, and test sets in an 8:1:4 ratio, resulting in 2923 images for training, 365 for validation, and 1462 for testing. Representative samples at different scales are illustrated in Figure 1, where the rows, from top to bottom, correspond to airplane, bird, drone, and helicopter categories, respectively, and the columns, from left to right, represent the near, medium, and far scales.
Figure 1.
Data examples at various scales in the MSDD: (a) near distance, (b) medium distance, (c) far distance. From top to bottom, the images represent the airplane, bird, drone and helicopter categories, respectively.
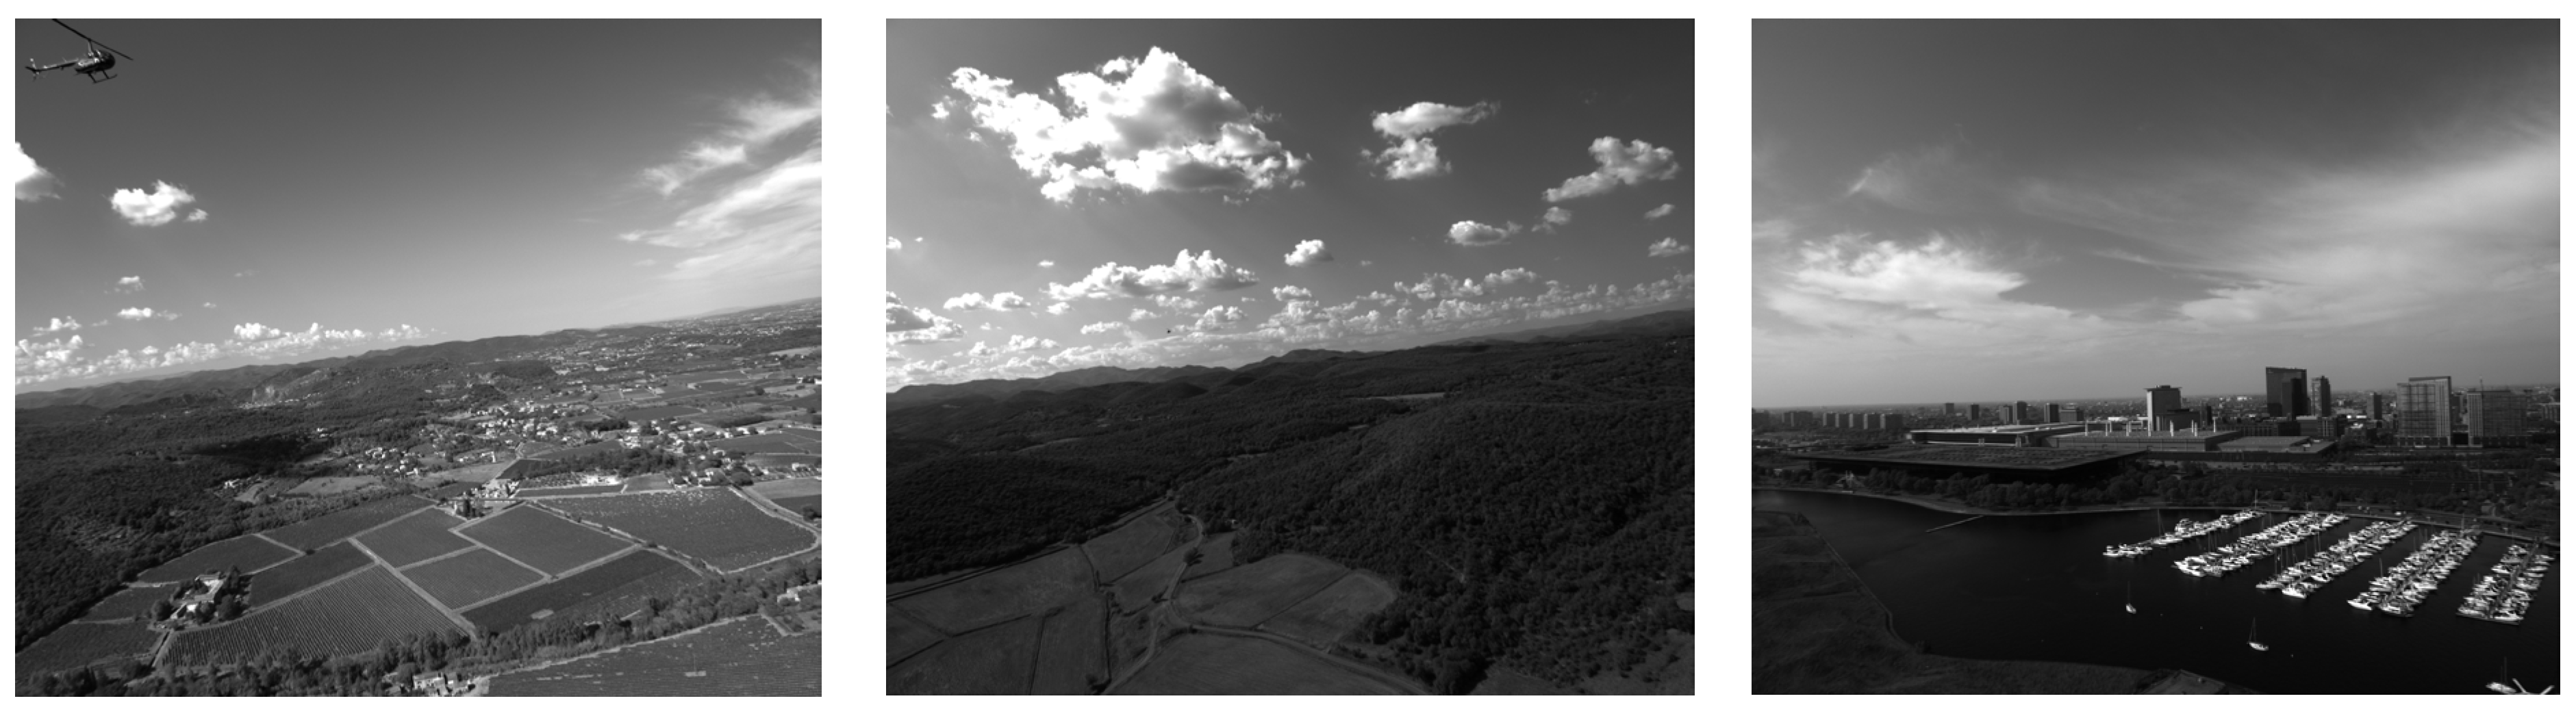
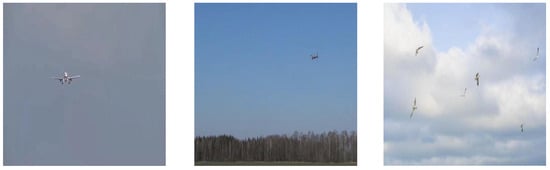
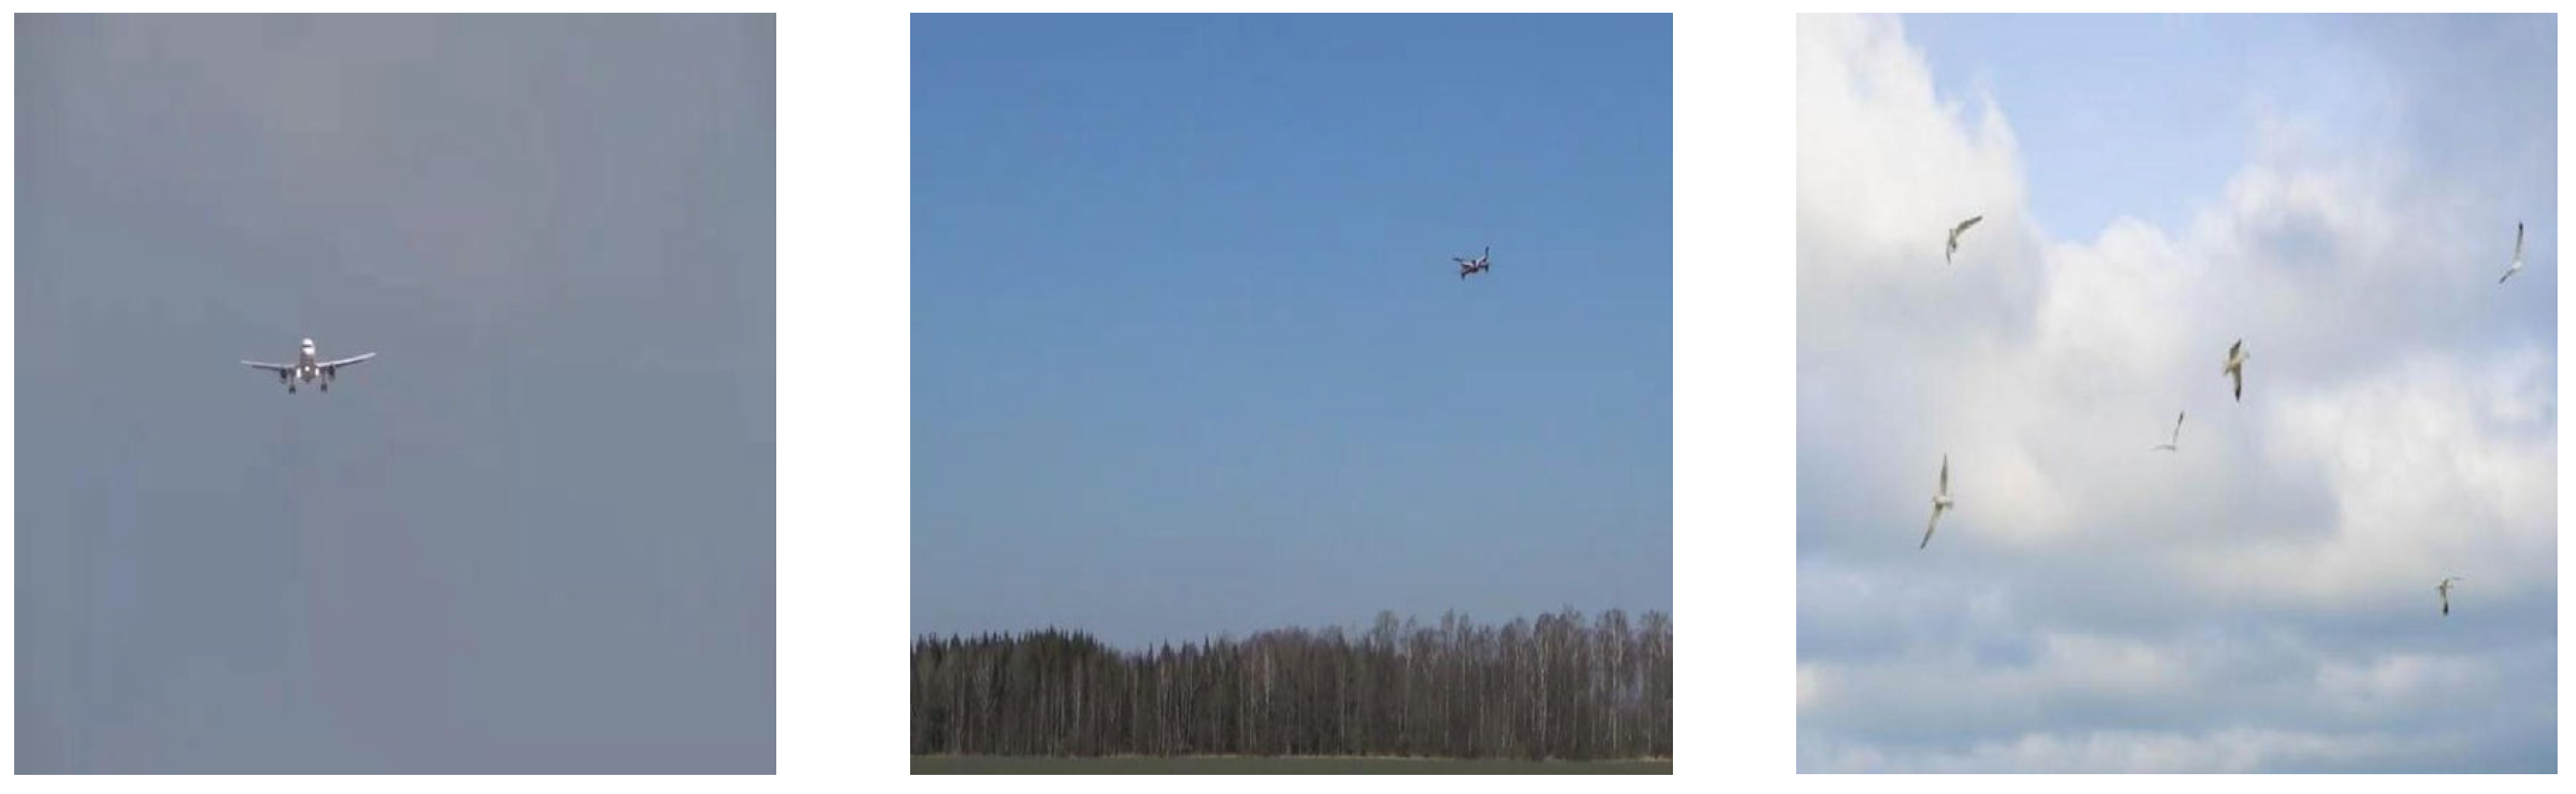
The AOT consists of 4943 flight video sequences captured by UAVs, helicopters, and other airborne platforms, totaling approximately 164 h of footage. This dataset features diverse environments, spanning both urban and natural settings, with an image resolution of 2448 × 2048 pixels. The AOD-4, in contrast, comprises 22,516 images with 31,600 annotated instances, covering four object categories: airplanes, helicopters, UAVs, and birds. It encompasses a wide variety of backgrounds, including clouds, sky, and urban scenes, as well as adverse weather conditions such as rain and snow. All images in this dataset are uniformly resized to 1024 × 1024 pixels. From each dataset, 500 images per category were selected to construct heterogeneous test sets—denoted as the AOT test set and the AOD-4 test set—for evaluating model generalization on heterogeneous data. Representative samples from both datasets are illustrated in Figure 2 and Figure 3, respectively.
Figure 2.
Data examples in the AOT dataset.
Figure 3.
Data examples in the AOD-4 dataset.
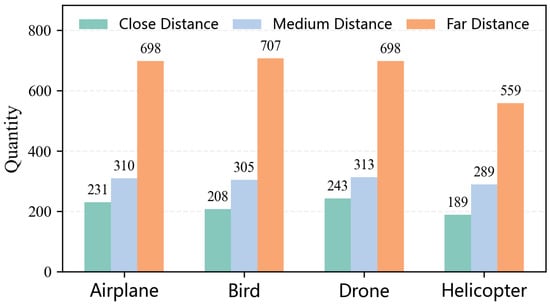
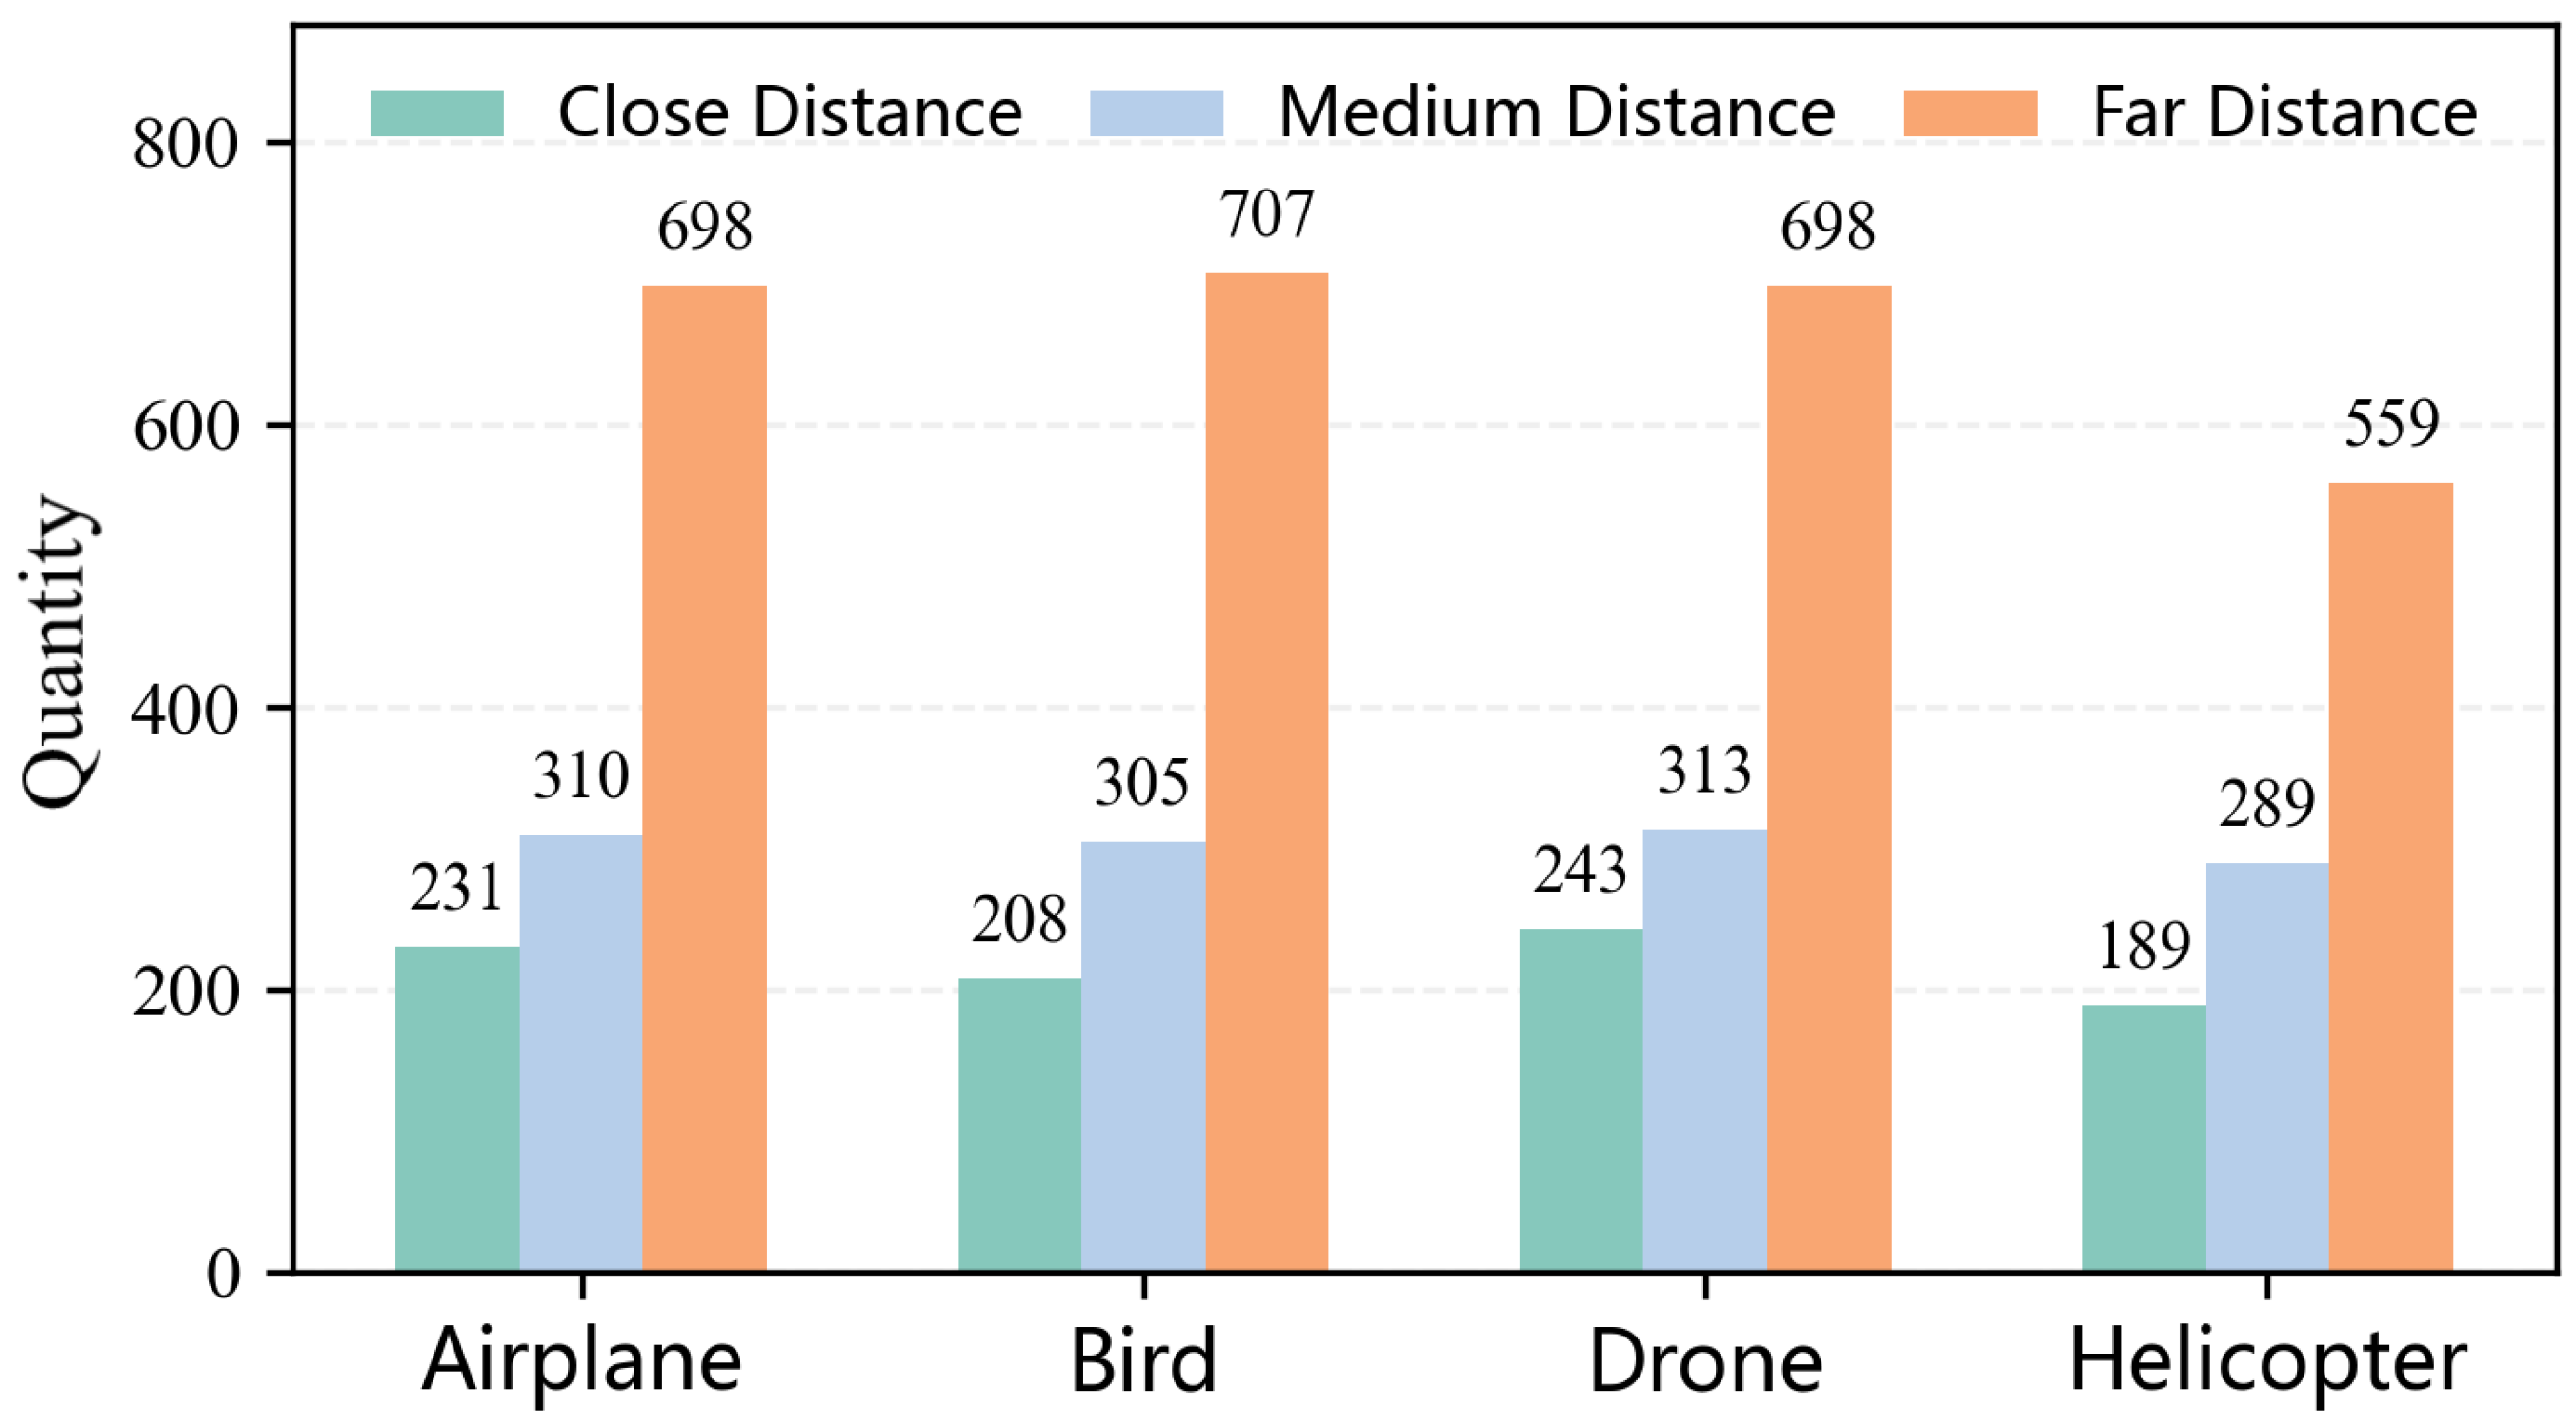
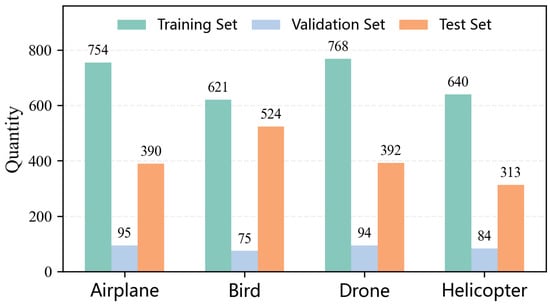
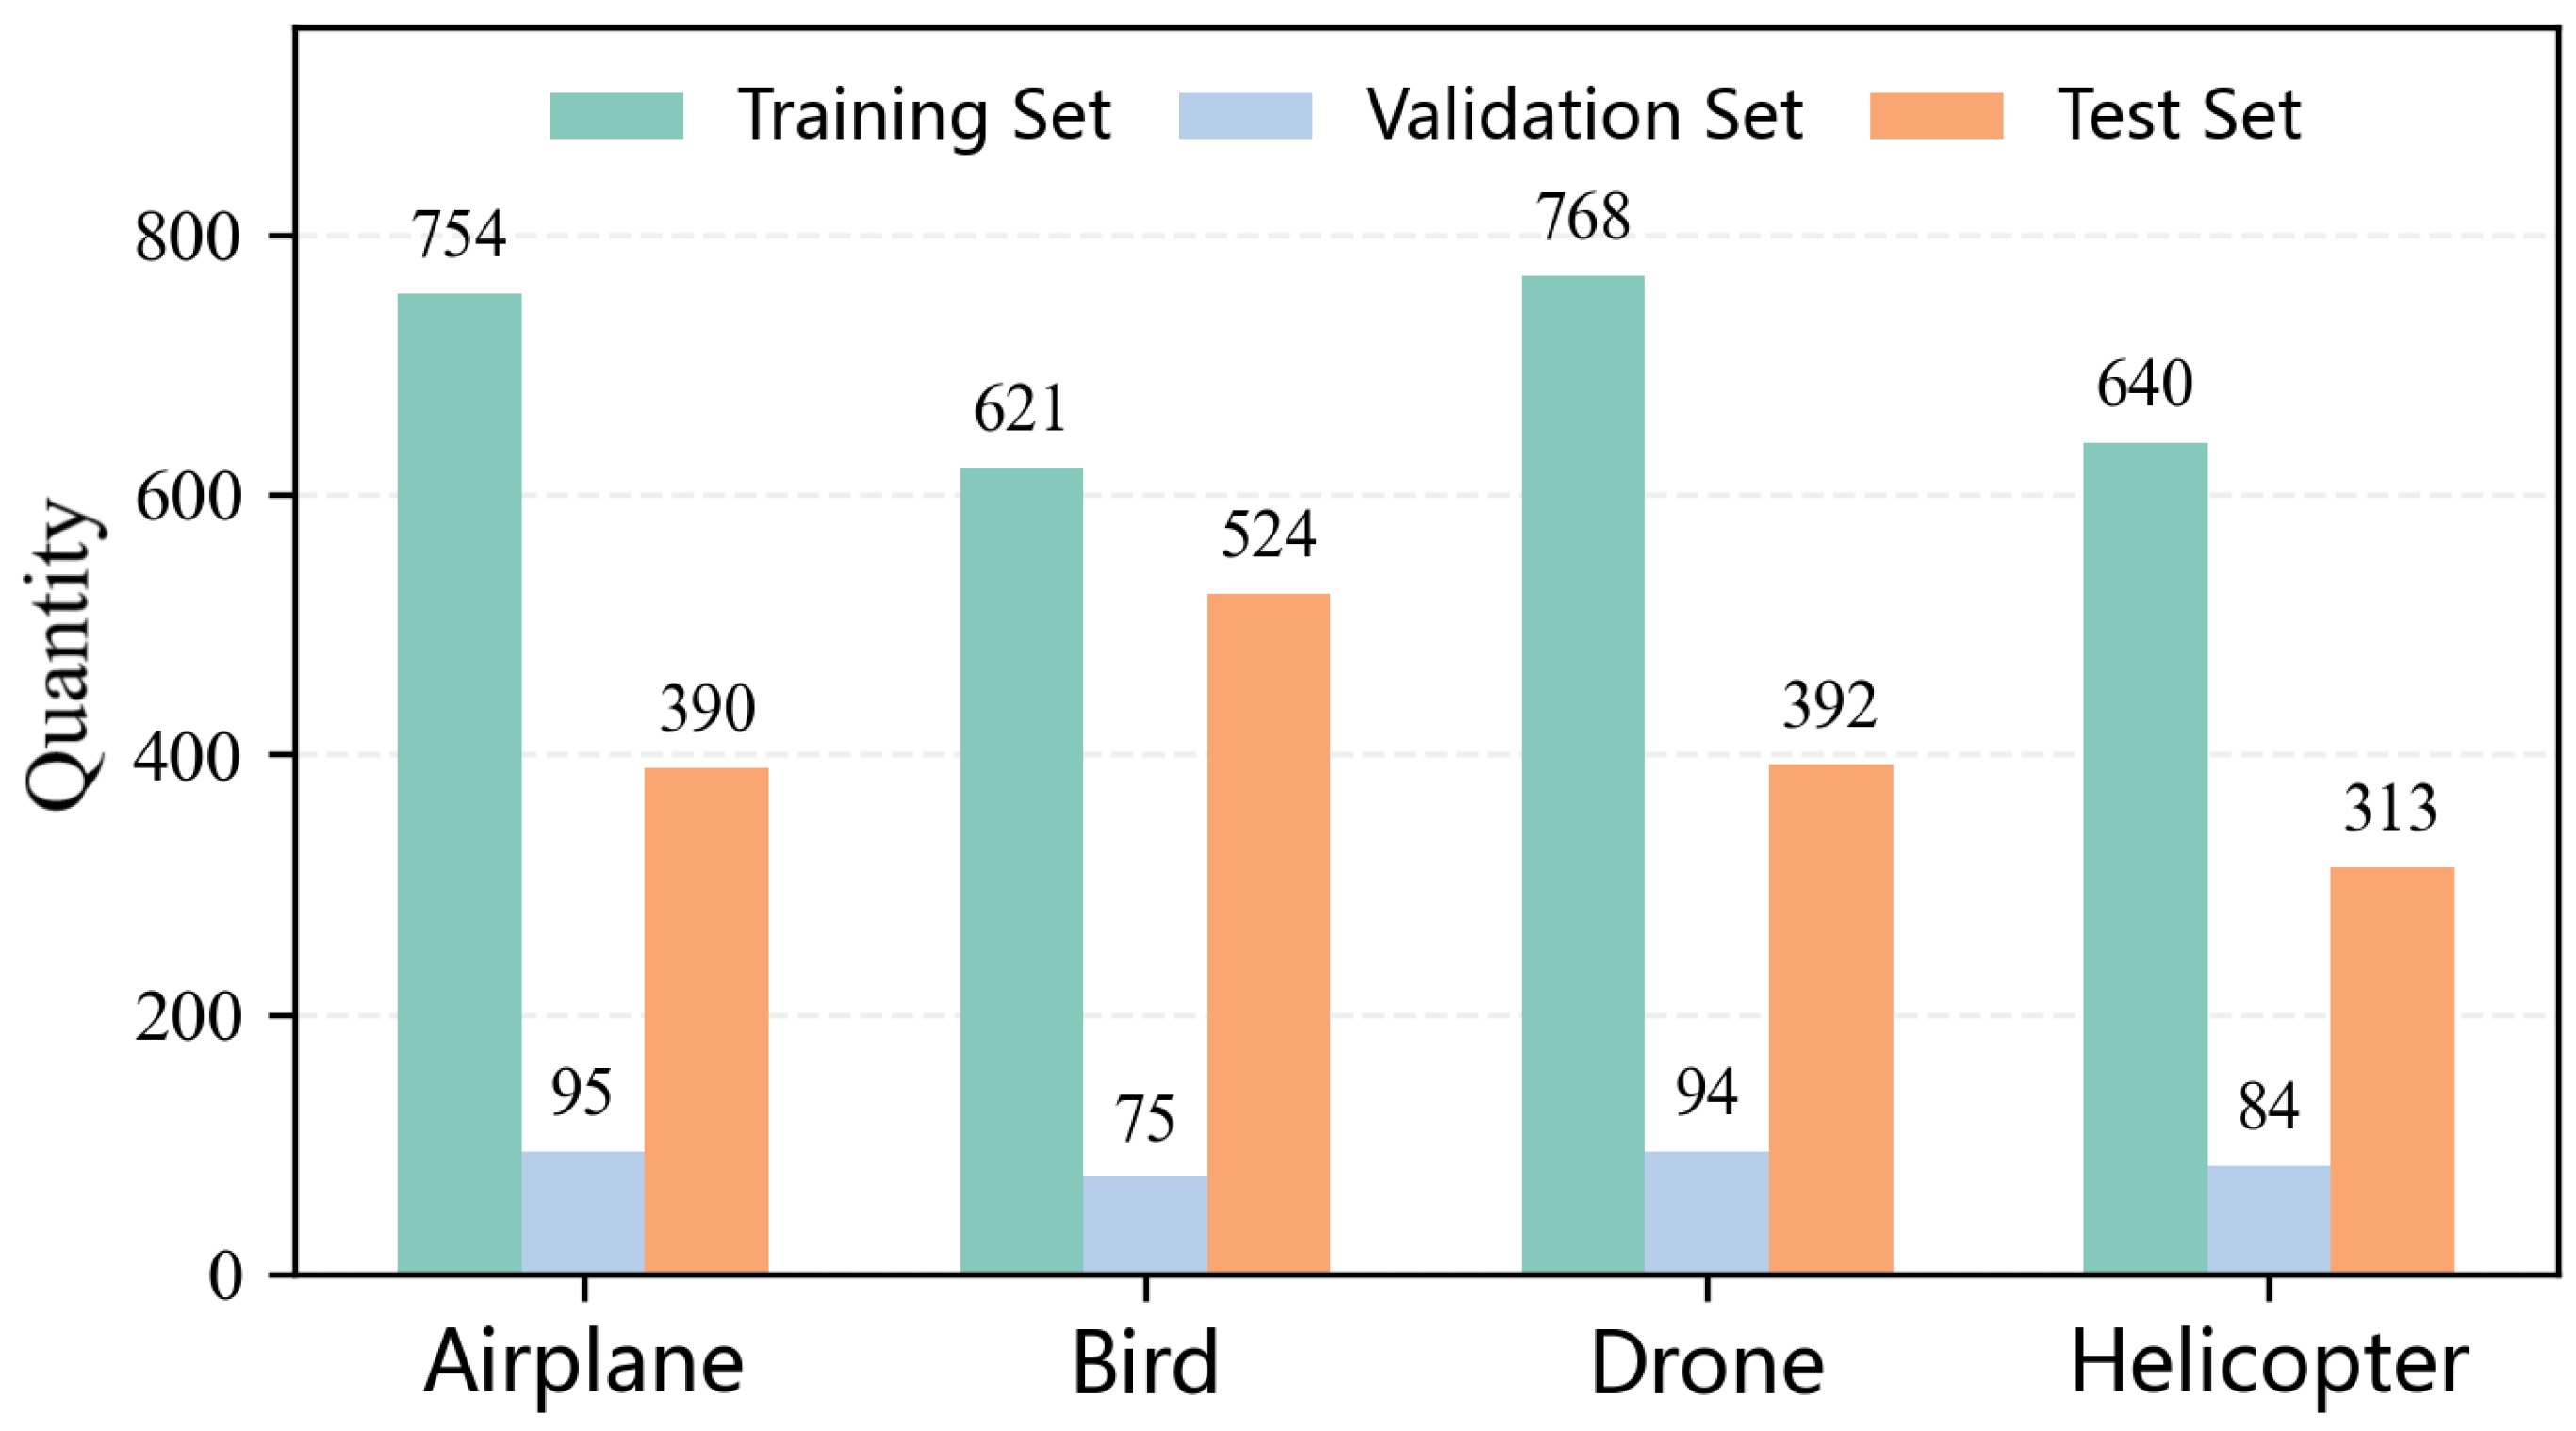
In order to better understand the distance of the data in the MSDD data source and the category distribution in the divided datasets, distance and category distribution histograms are drawn as shown in Figure 4 and Figure 5, respectively. Figure 4 indicates that the total number of images for helicopters is slightly lower than that for the other three categories. However, the proportion of images for each category across different distance scales is similar. Notably, for each object type, the proportion of far-distance images is significantly higher than that of near- and medium-distance images, providing a robust data foundation for small object detection. Figure 4 reveals the distributional differences across dataset splits: in the training set, the number of airplanes and UAVs slightly exceeds that of the other two categories; the distribution across categories in the validation set is relatively balanced; while in the test set, the number of birds is slightly higher than that of the remaining three categories.
Figure 4.
Distribution of various objects across different distances.
Figure 5.
Distribution of various objects across different datasets.
2.2. PCA-HBOS Out-of-Distribution Algorithm
To mitigate false detections arising from decision-making uncertainties, this section proposes an OOD detection algorithm based on the PCA-HBOS. The algorithm models the distribution of a dataset by constructing univariate histograms for each independent feature dimension [40]. It is characterized by its simplicity and efficiency while also avoiding potential biases arising from hyperparameter selection. The process consists of two distinct phases: the pre-calibration stage and the test stage. The foundational principles of the algorithm are as follows:
In the test stage, the algorithm computes the outlier score of an input sample based on the density estimates retrieved from constructed histograms in the pre-calibration stage. Let be the input space, where represents the number of feature dimensions, is a test sample inputted, and is the component of in the - feature dimension. represents the scalar probability density corresponding to the specific bin (i.e., its normalized height), which contains the component in the - dimension’s histogram, and denotes the final confidence distribution score, which reflects the degree of outlierness of the sample.
In the pre-calibration stage, the algorithm performs an equal-frequency binning strategy to construct histograms, using the projection values of the training set in each dimension, where denotes the -th sample. This approach is chosen to adaptively adjust the boundaries of each bin to ensure they contain an approximately equal number of training samples. Then, the number of bins is determined as according to the square-root rule, resulting in approximately samples per bin. The components of all training samples in the -th dimension are sorted in ascending order and then distributed evenly into bins. The width ( of each bin is then determined by the range of sample values it encompasses. To ensure mathematical rigor and consistent integration, the normalized height (probability density estimate) of each bin is calculated as follows. This normalization ensures that the total area of the histogram sums to unity, satisfying the requirements of a formal probability density function.
Therefore, applying the HBOS algorithm to deep learning facilitates the extraction of neuron-level features from each layer of the network. However, owing to the massive parameter count and the high-dimensional nature of neural networks, the linear HBOS algorithm often exhibits low computational efficiency and fails to adequately capture inter-feature dependencies. To address these issues, PCA is employed to extract the principal components of the network, thereby reducing the dimensionality of complex neural architectures. This approach not only enhances the speed and accuracy of the algorithm but also mitigates correlations among network features.
First, define the activation matrix of training samples after passing through the - of a network with neurons as:
where
where denote the mean value of the - dimensional feature computed over samples. By subtracting the mean feature value of corresponding dimension from each feature value , it could obtain the centered matrix . Subsequently, the covariance matrix can be further derived from , in order to preprocess dimensional features:
Next, the eigenvalue decomposition is performed on the covariance matrix. Let and () denote the sets of eigenvalues and eigenvectors of the covariance matrix respectively. For the dimensional matrix , it can be decomposed into at most mutually orthogonal directions, yielding and corresponding eigenvectors
Then, the eigenvalues are rearranged in descending order, and the smallest feature rank is sought such that:
where represents the variance cut-off between [0, 1], and the feature rank of the - network layer is used to select the first eigenvectors, thereby retaining the principal component features and constructing the principal component projection matrix
Furthermore, project the centered activation matrix onto the main features to obtain the main feature matrix for the - layer of the network:
Define the output of the training set after passing the - network layer as :
where denotes the component of the output of sample at the - dimension, and denotes the component of the output of training set at the - dimension. Subsequently, the projection of output on the principal components can be obtained:
Here, let represent the - components of the output of the training set projected onto the principal component.
Based on the , a histogram is constructed by adaptively adjusting the bin widths to create bins of approximately equal area according to Equations (3) and (4), and the normalized heights are then computed. Let be the - components of the output of the inputted data after projection. Then can be gotten by the normalized height of the bin falling of in the histogram.
Substituting into Equations (1) and (2), the confidence distribution score of the under -layer network is obtained by summing the logarithmic heights of the histogram intervals in which the sample falls within each layer. In this context, a higher interval density leads to a lower outlier score:
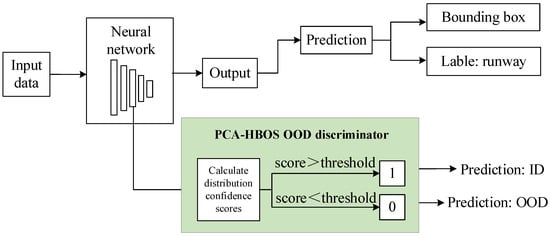
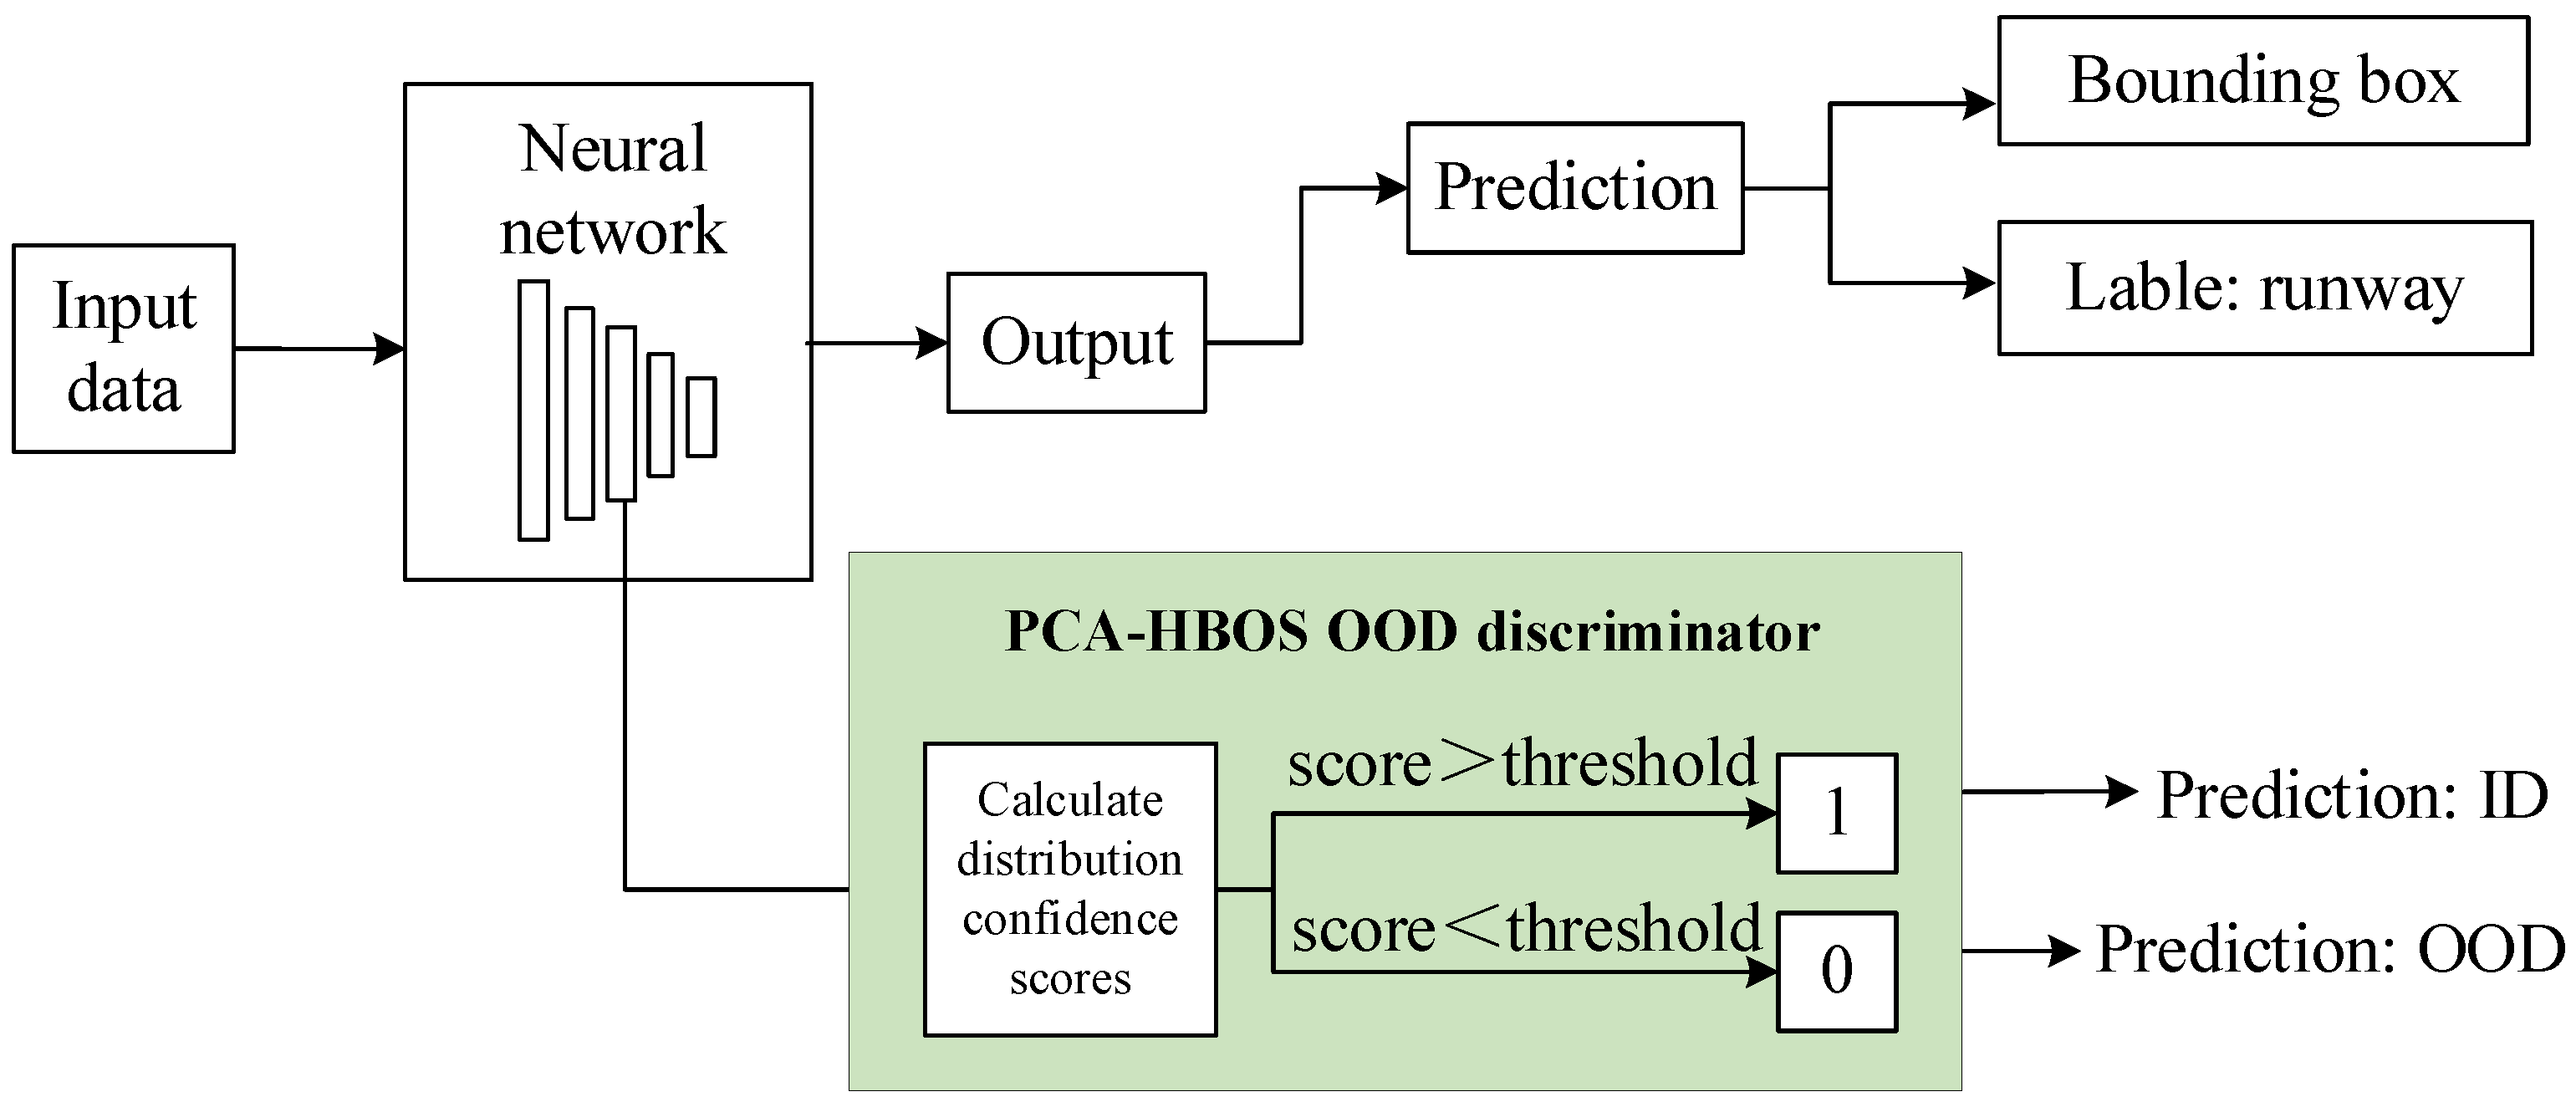
Figure 6 depicts the working the operational framework of PCA-HBOS OOD discrimination. In this framework, an OOD discriminator generates a distributional confidence score for each input sample based on the network’s output. This score is then associated with the network’s prediction and compared against a predefined threshold to decide whether the sample belongs to the ID or OOD category. Formally, the OOD classifier is defined as:
where denotes the classification threshold. When , the discriminator decides that the output is OOD data, and when , the discriminator decides that the output is ID data.
Figure 6.
PCA-HBOS algorithm discrimination process: the transparent background part is the object detection process, the green background is the OOD discriminator, which uses features in the model’s neural network to score the distribution of images.
3. Experimental Results and Analysis
This chapter primarily comprises two major experiments and their analysis: low-altitude object-detection experiments and OOD detection experiments.
In the low-altitude object-detection experiments, multiple object-detection models, including Faster R-CNN, RTMDet, and YOLO, are trained and tested on the MSDD to evaluate their performance on homologous data. Subsequently, the trained models are further assessed for generalization capability on heterologous datasets, namely AOT and AOD-4. This part provides TP, FN and FP samples for each dataset and model, which serve as a foundation for the subsequent OOD detection experiments and support the exploration of the relationship between OOD detection performance and model performance.
In the OOD detection experiments, the proposed algorithm is first compared with mainstream OOD algorithms, such as Baseline, Odin, and Energy, on three low-altitude datasets to verify its advancement. Subsequently, the proposed algorithm is applied to TP, FN, and FP samples from both homologous (MSDD) and heterologous (AOT and AOD-4) datasets to validate its ability to filter and identify false detections generated by low-altitude object-detection models. Additionally, in this part, the relationship between the performance of the OOD detection algorithm and that of the network it employs is further investigated, providing a basis for the application and performance improvement of the algorithm.
3.1. Low-Altitude Object-Detection Experiment
3.1.1. Experimental Setting and ML Model Performance Evaluation Metrics
The simulation experiments were conducted on the Windows 10 operating system using the PyTorch 2.0.1 framework within a Python 3.10 software environment. The hardware configuration included dual NVIDIA GeForce RTX 4090 GPUs, an Intel 8336C processor (operating at 2.30 GHz with a turbo frequency of 3.50 GHz), and Samsung DDR4 memory (32 GB × 16). Regarding the training strategy, the Stochastic Gradient Descent (SGD) optimizer was employed with an initial learning rate of 0.01. The models were trained for 100 epochs with a batch size of 8 and a momentum of 0.9. An early stopping mechanism was implemented, halting training if the model’s performance on the validation set did not improve for 20 consecutive epochs. To prevent model divergence, L2 regularization with a coefficient of 0.001 was also applied during training.
To comprehensively evaluate the generalization performance of the models, a range of evaluation metrics are employed in this study. For the training phase, model convergence and fitting conditions are assessed by observing the curves of relative loss , recall (R), precision (P), and mean average precision under Intersection over Union = 0.5 (mAP@0.5). For the testing phase, the generalization performance of the models on the test set is evaluated using average recall (AR), average precision (AP), F1-score, mAP@0.5, and mean average precision under Intersection over Union between 0.5 and 0.95 (mAP@0.5:0.95). Additionally, FP and FN predictions are analyzed through the confusion matrix. The calculation methods for the aforementioned metrics are presented in Table 1, where TP denotes the number of samples in which objects are correctly identified, FP represents the number of samples where image backgrounds are mistakenly detected as targets, true-negative (TN) indicates the number of samples where backgrounds are correctly identified, and FN refers to the number of samples where target regions are erroneously detected as background.
Table 1.
Performance evaluation metrics for low-altitude object-detection model and their meanings.
3.1.2. Object-Detection Experimental Results on Homologous Data
This study selects seven representative object-detection models—Faster R-CNN, RTMDet, YOLOv2, YOLOv3, YOLOv5, YOLOv8, and YOLOv9—and trains them using their corresponding baseline pre-trained networks: restnet50, the medium-scale(m) network for RTMDet, darknet19, darknet53, the large-scale (l) network for YOLOv5 and YOLOv8, and the medium-scale (m) network for YOLOv9. Among them, the Faster R-CNN, as a classic two-stage object detector [41,42], introduces a region proposal network (RPN) based on the Fast R-CNN architecture, thereby establishing a complete end-to-end unified detection pipeline [43]. In contrast, the YOLO series, as representative one-stage detectors, formulates object detection as a regression problem, directly predicting bounding boxes and class probabilities from the entire image [44,45,46]. By omitting the region proposal generation step, YOLO models achieve faster inference speeds [47]. The RTMDet, as an emerging representative of one-stage detectors, builds upon the YOLO architecture with refined designs [48,49].
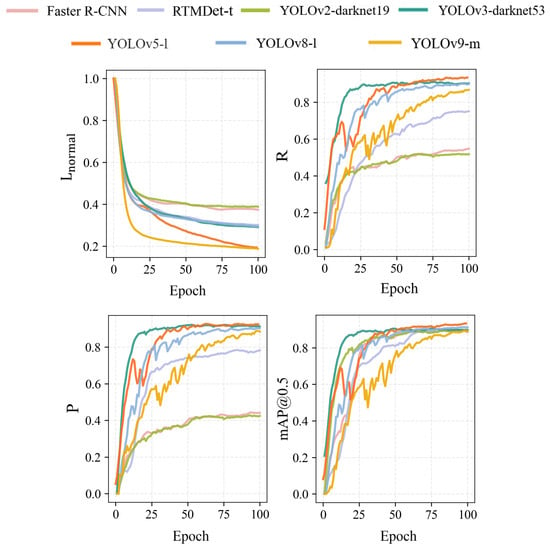
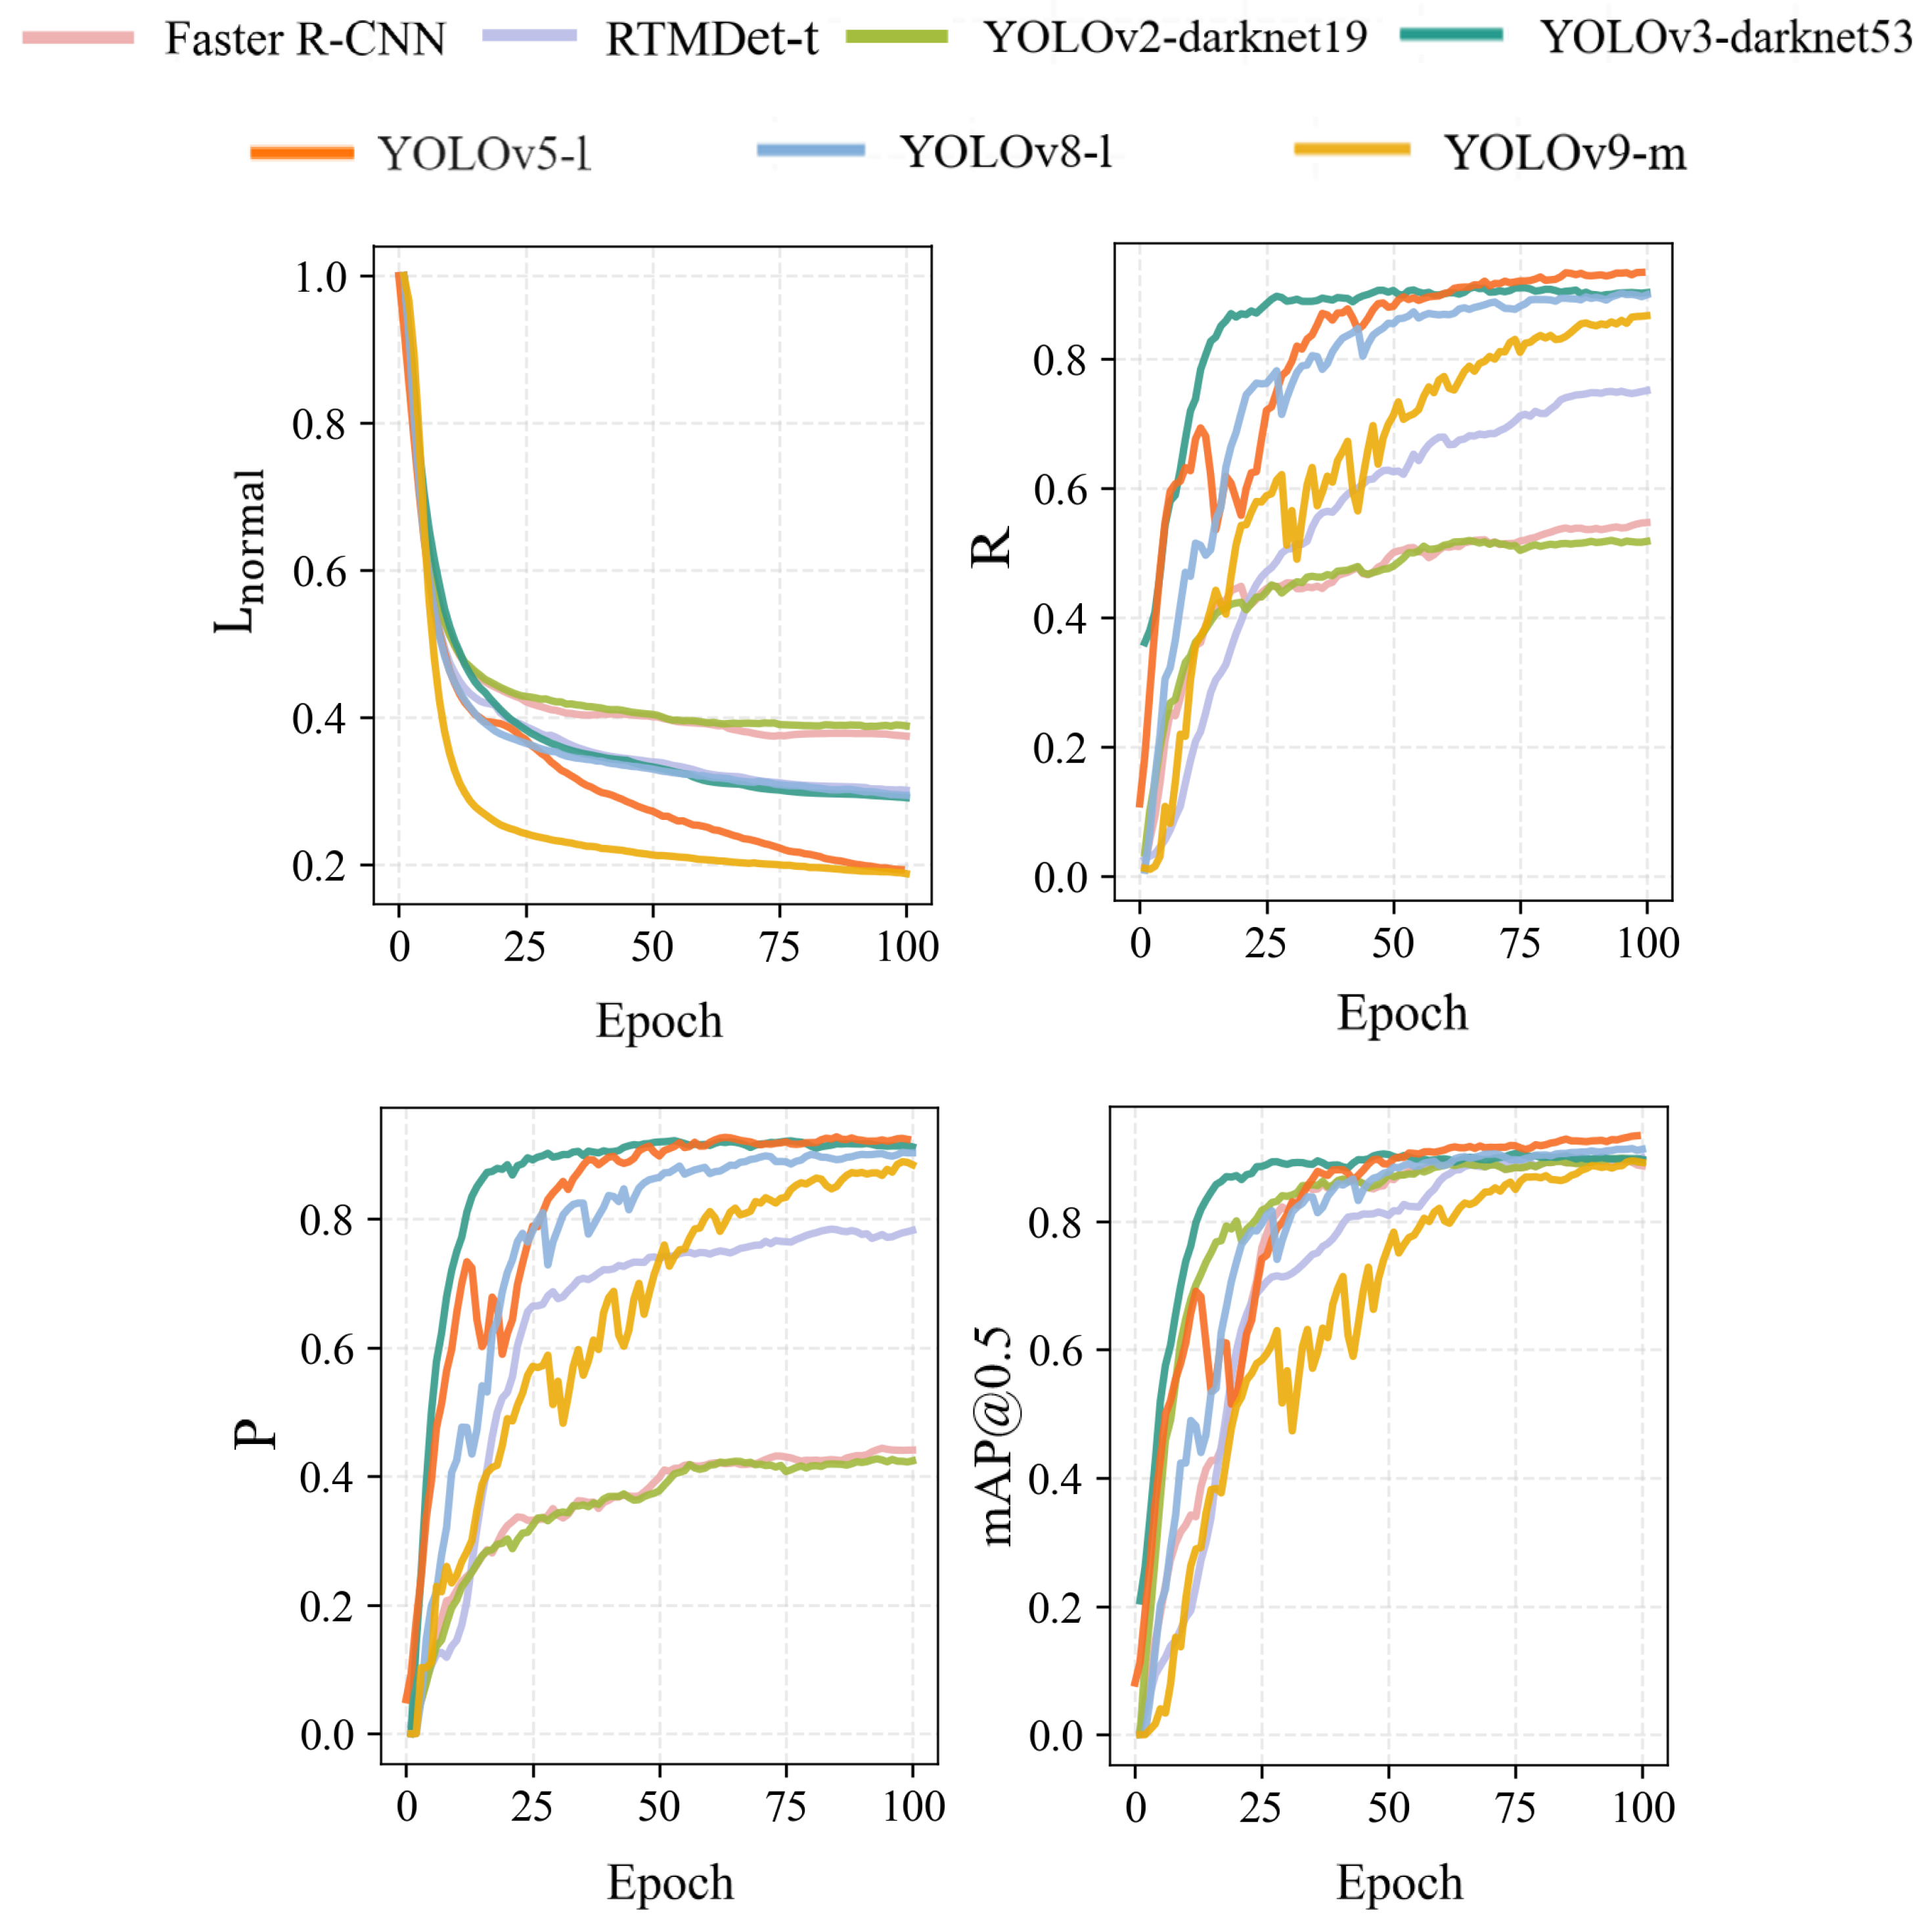
The performance metrics’ variations during the training phase, including loss curves, recall curves, and precision curves for each model, are presented in Figure 7. As illustrated, the convergence characteristics and learning capabilities vary across models during training. The relative loss for each model decreases rapidly within the first 25 epochs and stabilizes after 75 epochs, with YOLOv9-m and YOLOv5-l exhibiting the most substantial loss reduction. Meanwhile, the R, P, and mAP@0.5 curves for all models show a sharp increase during the initial learning phase, subsequently stabilizing after 75 epochs. Among the models, YOLOv5-l achieves the highest final R, P, and mAP@0.5, followed by YOLOv3-darknet53, then YOLOv8-l. Although the mAP@0.5 of YOLOv2-darknet19 is slightly higher than that of YOLOv9-m, its recall and precision are significantly lower; therefore, the overall performance of YOLOv9-m surpasses that of YOLOv2-darknet19. Additionally, RTMDet-t outperforms both YOLOv2-darknet19 and Faster R-CNN across all evaluation metrics during the training phase. Consequently, during the training phase, the YOLOv5-l model attains optimal performance, whereas YOLOv2-darknet19 and Faster R-CNN demonstrate the weakest performances.
Figure 7.
Parameter variation curve during aircraft object-detection model training.
To further validate the generalization performance of the models on homologous data, this study compares the P, R, F1-score, mAP@0.5, and mAP@0.5:0.95 metrics achieved by each algorithm on the test set, under the precondition of setting the confidence threshold to 0.25 and the non-maximum suppression (NMS) threshold to 0.45. The results are presented in Table 2, with the best values for each metric indicated in bold.
Table 2.
Low-altitude object-detection model test results on homologous data.
The results of the test experiment reveal that YOLOv9-m attains optimal performance across all metrics, demonstrating its superior generalization capability for object detection. The generalization performance of YOLOv8-l on the test set follows closely. Although the P and F1-score of YOLOv5-l are lower than those of YOLOv3-darknet53, its higher R, mAP@0.5, and mAP@0.5:0.95 metrics indicate fewer missed detections and greater detection accuracy across multiple scales compared to YOLOv3-darknet53. In comparison, the RTMDet-t model demonstrates performance metrics that are inferior to those of YOLOv3-darknet53 but still exceed those of YOLOv2-darknet19 and Faster R-CNN. In contrast to the aforementioned models, YOLOv2-darknet19 and Faster R-CNN exhibit markedly lower values across all evaluation metrics, which can be attributed to their lower network complexity and fewer learnable parameters.
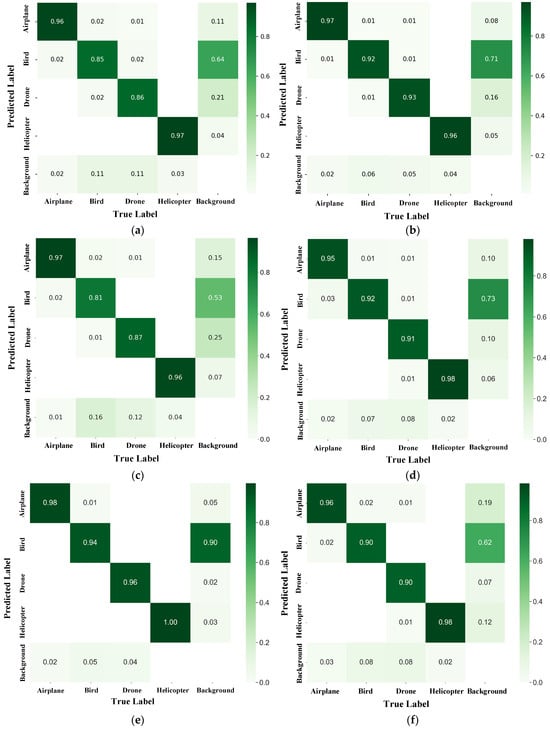
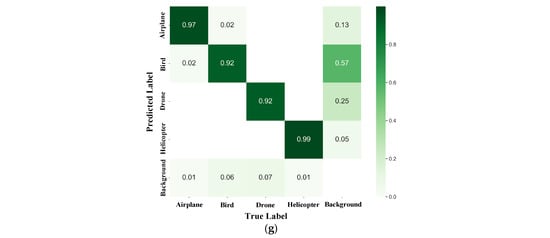
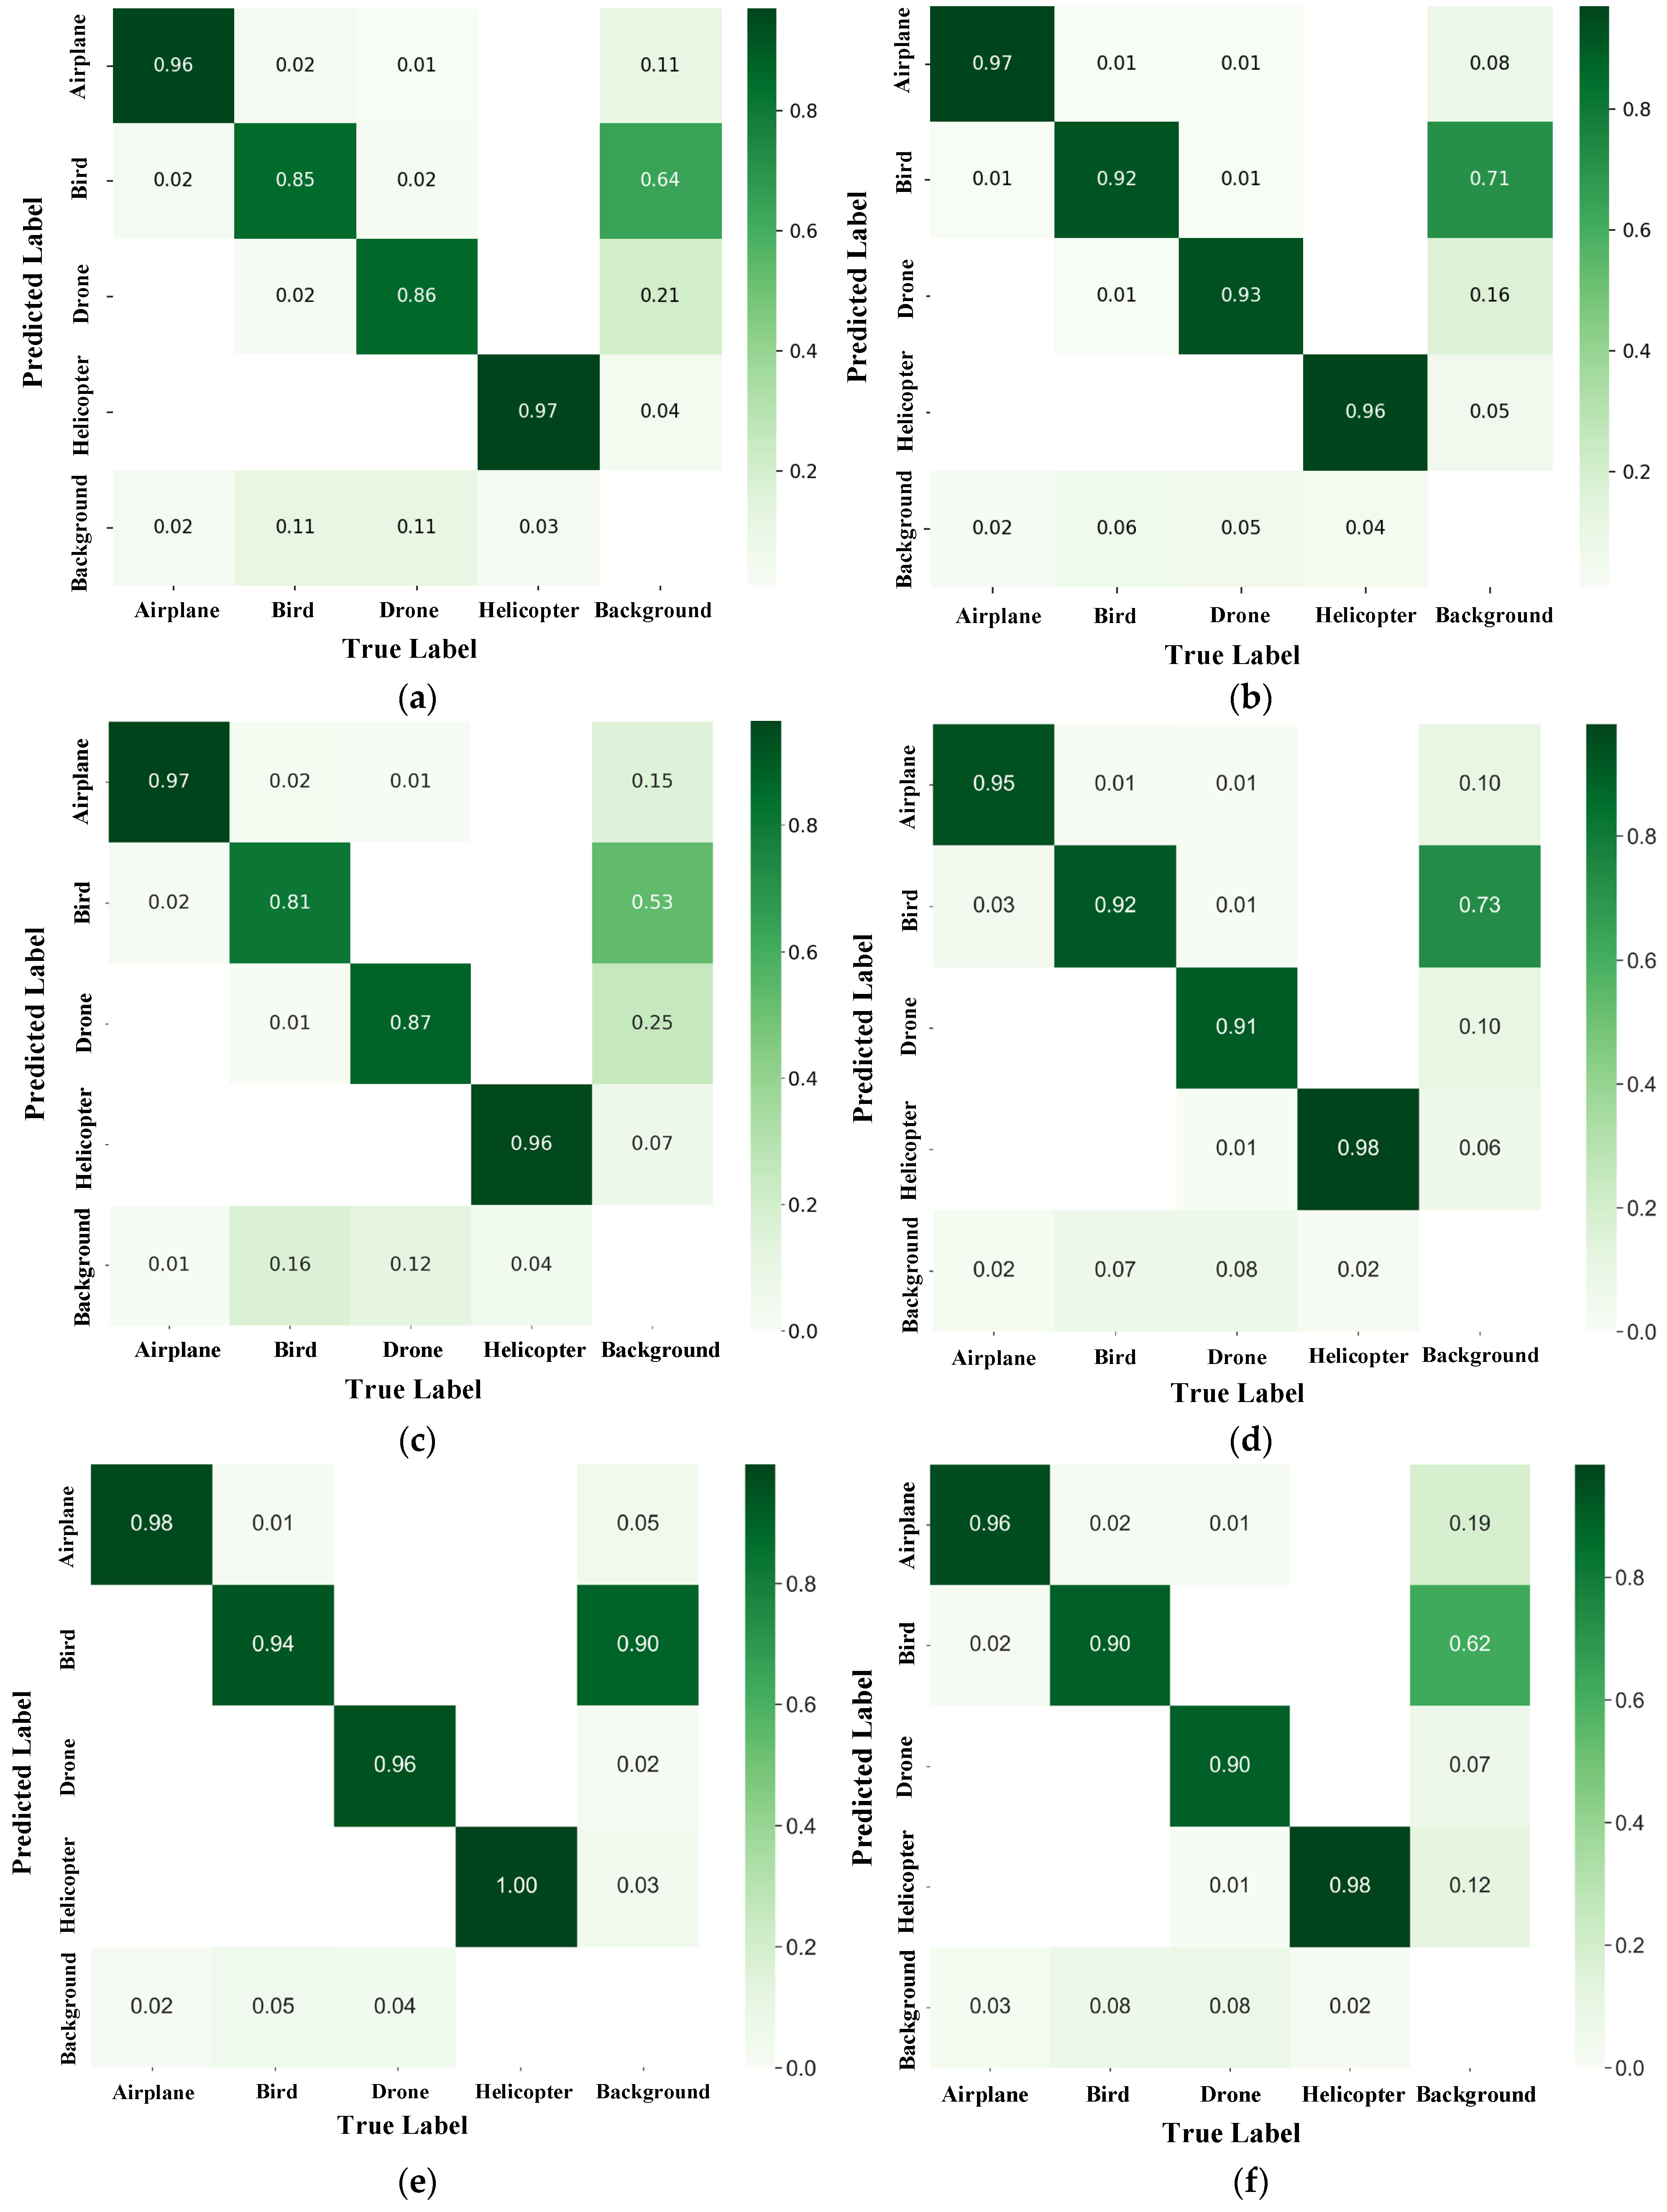
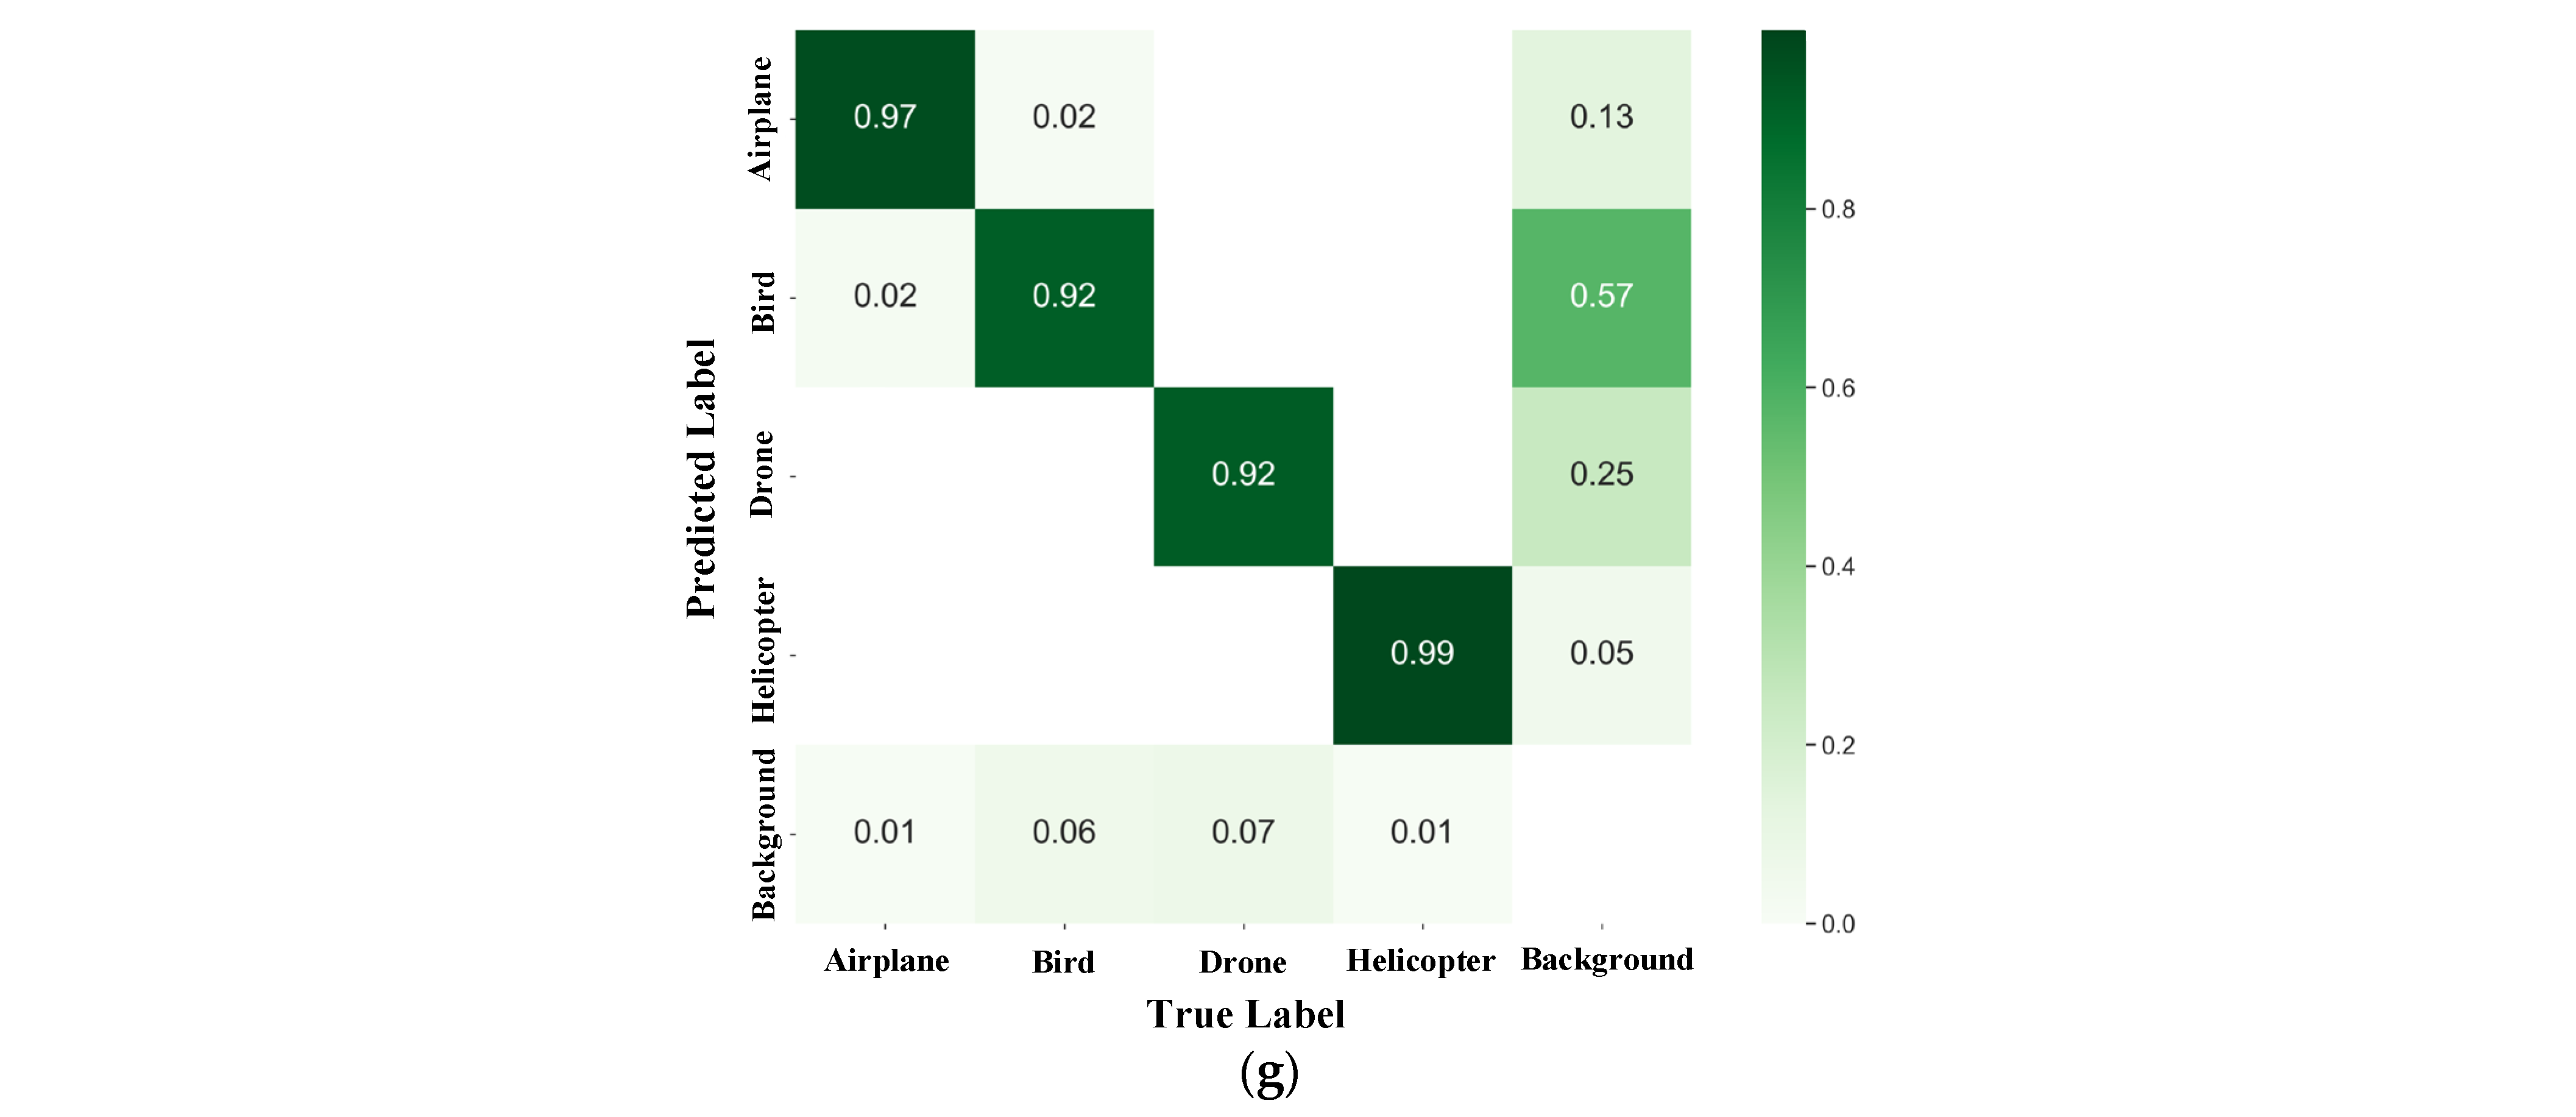
To gain insight into the specific performance of each model across different object categories, the confusion matrices for the testing phase are generated and presented in Figure 8. In these matrices, the diagonal values represent the proportion of correctly detected objects for each category by model. The values in the last row indicate the model’s false-negative rate (FNR) for each category, reflecting the extent of missed detections. The values in the last column denote the false-positive rate (FPR) for the background being mistakenly detected as objects, indicating the proportion of false detections attributable to background errors relative to the total number of false detections. In contrast, the entries in the remaining regions represent the FPR for objects being misclassified as other categories.
Figure 8.
Confusion matrix of each model on the MSDD test set: (a) Faster R-CNN, (b) RTMDet-t, (c) YOLOv2-darknet19, (d) YOLOv3-darknet53, (e) YOLOv5-l, (f) YOLOv8-l, (g) YOLOv9-m.
Analysis of the diagonal entries across the matrices reveals that, overall, the models achieve higher prediction accuracy for the airplane and helicopter categories compared to birds and drones. A further examination of the last column values shows that the FPR for birds is significantly higher than that for the other categories, suggesting that the models are more prone to false detections when processing bird objects, which are typically smaller in size. Further analysis of the FP samples indicates that these are predominantly images featuring extremely small objects at far distances. Concurrently, a comparison of the values in the last row demonstrates that the rate of missed detections for birds is also higher than for other categories. Analysis of the FN samples similarly reveals that these are mostly extremely small-scale samples captured at far distances. These findings collectively indicate that the models are susceptible to both false detections and missed detections when dealing with small-scale objects.
3.1.3. Generalization Analysis on Heterologous Data
In real scenarios, low-altitude data in open-world settings often exhibit distributions and characteristics that differ from those of the training data, thereby posing challenges for practical object detection. To further assess the detection capabilities of the models when confronted with low-altitude images that differ in source, background, and pixel characteristics from the training data, generalization tests on heterologous data are conducted using the trained models on the AOT and AOD-4 datasets. The test results are presented in Table 3, with the optimal values for each metric indicated in bold.
Table 3.
Low-altitude object-detection model test results on heterologous data.
A comparison of the model performance metrics on the AOT dataset reveals that the YOLOv5-l model achieves the optimal values across all three metrics: P, R, and mAP@0.5. Subsequently, the performance of the YOLOv8-l, YOLOv9-m, YOLOv3-darknet53, RTMDet-t, Faster R-CNN, and YOLOv2-darknet19 models gradually decreases, exhibiting a descending order of model performance. In contrast, on the AOD-4 dataset, the YOLOv5-l model also attains the optimal values across the three metrics, followed closely by the YOLOv8-l and YOLOv9-m models, which demonstrate slightly inferior performance. Notably, while the P of the YOLOv9-m model marginally exceeds that of YOLOv8-l, its R and mAP@0.5 are slightly lower, indicating that the two models exhibit similar overall performance. On the AOD-4 dataset, the aforementioned three models achieve P values exceeding 0.6, R values above 0.4, and mAP@0.5 values surpassing 0.35, with all metrics significantly outperforming the corresponding values of other models, such as YOLOv3-darknet53. Based on the above analysis, the YOLOv5-l, YOLOv8-l, and YOLOv9-m models demonstrate relatively robust generalization performance when confronted with heterologous data that substantially differ from the training data. In contrast, models such as YOLOv3-darknet53, YOLOv2-darknet19, RTMDet-t, and Faster R-CNN exhibit weaker generalization capabilities.
Further comparison of the performance of the same models across different datasets indicates that all metrics obtained on the AOD-4 dataset are significantly higher than those on the AOT dataset. This suggests that the models, as a whole, achieve superior generalization performance on AOD-4, which can be attributed to the higher similarity between the AOD-4 data and the training data, whereas the distributional discrepancy between the AOT data and the training data is more pronounced.
Meanwhile, a comparison of P and R values for the same dataset and model reveals that R values are consistently significantly lower than p values, indicating a higher incidence of FN and pronounced missed detections across models. This phenomenon can be attributed to the prevalence of small objects within the dataset.
3.2. OOD Performance Comparative Experiment
3.2.1. OOD Parameter Evaluation Metrics
In OOD evaluation, the area under the receiver operating characteristic curve (AUC) and the false-positive rate at 95% true-positive rate (FPR95) are commonly employed as performance metrics. Their calculation methods and implications are presented in Table 4, where denotes the area under the curve calculated when treating the -th class as the positive (i.e., ID) class and all other classes as the negative (i.e., OOD) class.
Table 4.
Performance evaluation metrics for OOD discrimination and their meanings.
3.2.2. Results of Variance Cut-Off Parameter Investigation
According to the derivations in Section 2.2, a smaller variance cut-off value results in the extraction of more principal components from the network, thereby retaining more network features, whereas a larger value leads to fewer principal components and thus fewer retained features. Therefore, to investigate the impact of the variance cut-off on the algorithm’s feature extraction performance, this part selected several representative values within the interval [0.0005, 0.01] and examined the algorithm’s behavior under different . The backbone and neck network of the YOLOv8-l model trained in Section 3.1.2 was adopted as the algorithm network. Tests were conducted on the TP, FP, and FN samples from the MSDD under this model. The test results are shown in Table 5.
Table 5.
Comparative results of different variance cut-off values.
As shown in Table 5, as more network features are considered and the network principal components become more complex, the AUC value under the FN and the FP samples gradually increases, while the FPR95 value gradually decreases. This indicates that the OOD discrimination performance for FN and FP samples steadily improves, meaning that the algorithm becomes more effective at identifying FN and FP samples as OOD. However, the algorithm’s AUC value on the TP samples gradually increases, and the FPR95 value decreases, suggesting that, as the algorithm’s sensitivity improves, the probability of misclassifying TP samples as OOD also increases. When the cut-off value is 0.001, the algorithm’s performance reaches its optimal balance.
From this, it can be concluded that both overly simple and overly complex network features are detrimental to the performance of the PCA-HBOS algorithm. With too few network features, the algorithm struggles to distinguish OOD data, and with too many network features, the algorithm may learn irrelevant features, increasing the risk of misclassifying ID data as OOD. Therefore, in the following OOD experiments, the procedure is carried out under the condition that the variance cut-off value is set to 0.001.
3.2.3. OOD Algorithm Comparative Results and Analysis
To evaluate the effectiveness and reliability of the proposed OOD discrimination algorithm in feature extraction and overall performance evaluation, this section conducts comparative experiments with several mainstream OOD detection methods, including Baseline [57], Odin [58], and Energy [59]. The experiment employs the backbone and neck network of the YOLOv8-l model trained in Section 3.1.2 as the OOD detection network. Comparative experiments are conducted on the TP, FN, and FP samples generated by this model. The corresponding OOD test results are presented in Table 6, with the optimal values for each metric indicated in bold.
Table 6.
Comparative results of different OOD algorithms.
In this experiment, the OOD algorithm is designed to distinguish between runtime false detections and correctly detected samples. Therefore, the algorithm is considered to perform optimally when TP samples are identified as ID, while FN and FP samples are identified as OOD.
Comparing the metric values of different algorithms on the same dataset reveals that the proposed algorithm achieves the best performance results on TP, FN, and FP samples within the MSDD. On the AOT dataset, it attains optimal metrics for FN and FP samples, while on the AOD-4 dataset, it achieves optimal results for the FPR95 metric on TP samples, the AUC metric on FN samples, and both metrics on FP samples. Overall, the proposed algorithm demonstrates superior overall performance across the three datasets compared to other algorithms.
An examination of the metrics for TP samples on the same dataset indicates that, aside from Baseline, all algorithms exhibit comparable performance on TP samples. The AUC values on the MSDD and AOD-4 test sets are approximately 0.5, with FPR95 values exceeding 0.85. In contrast, on the AOT dataset, the AUC values for all algorithms are above 0.7, and FPR95 values exceed 0.6. This suggests that all algorithms readily classify TP samples from MSDD and AOD-4 as ID, whereas TP samples from AOT, which exhibit greater divergence from the training data, are more challenging to distinguish.
Further comparison of the metrics for FN and FP samples on the same dataset shows that, with the exception of Baseline, all algorithms achieve AUC values greater than 0.7 and FPR95 values below 0.65 on the MSDD and AOD-4 datasets. This indicates that the algorithms effectively distinguish FN and FP samples from the ID training set on these datasets. However, on the AOT dataset, where TP, FN, and FP samples all yield relatively high AUC values, the algorithms tend to classify the entire AOT dataset as OOD, making it difficult to differentiate FN and FP samples from TP samples and the ID training set.
3.3. OOD Discriminative Experiment Under Different Models
3.3.1. OOD Discriminative Results on Homologous Data
In this section, focusing on the MSDD homologous test dataset, the proposed algorithm is applied to various detection models to verify its multi-model applicability and investigate the relationship between the algorithm and the model networks on homologous data.
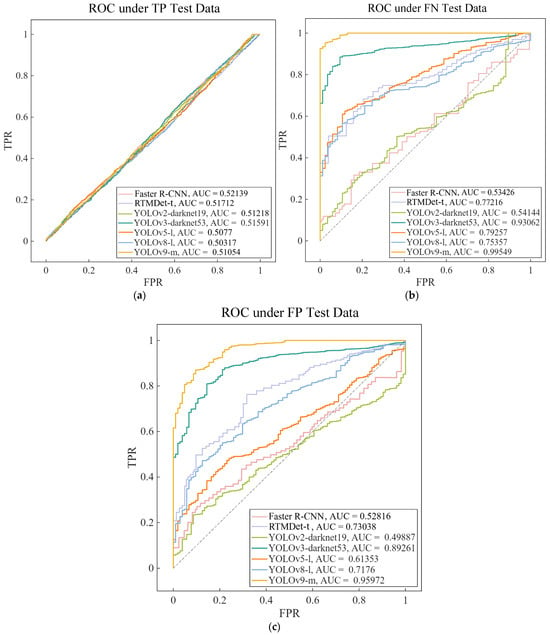
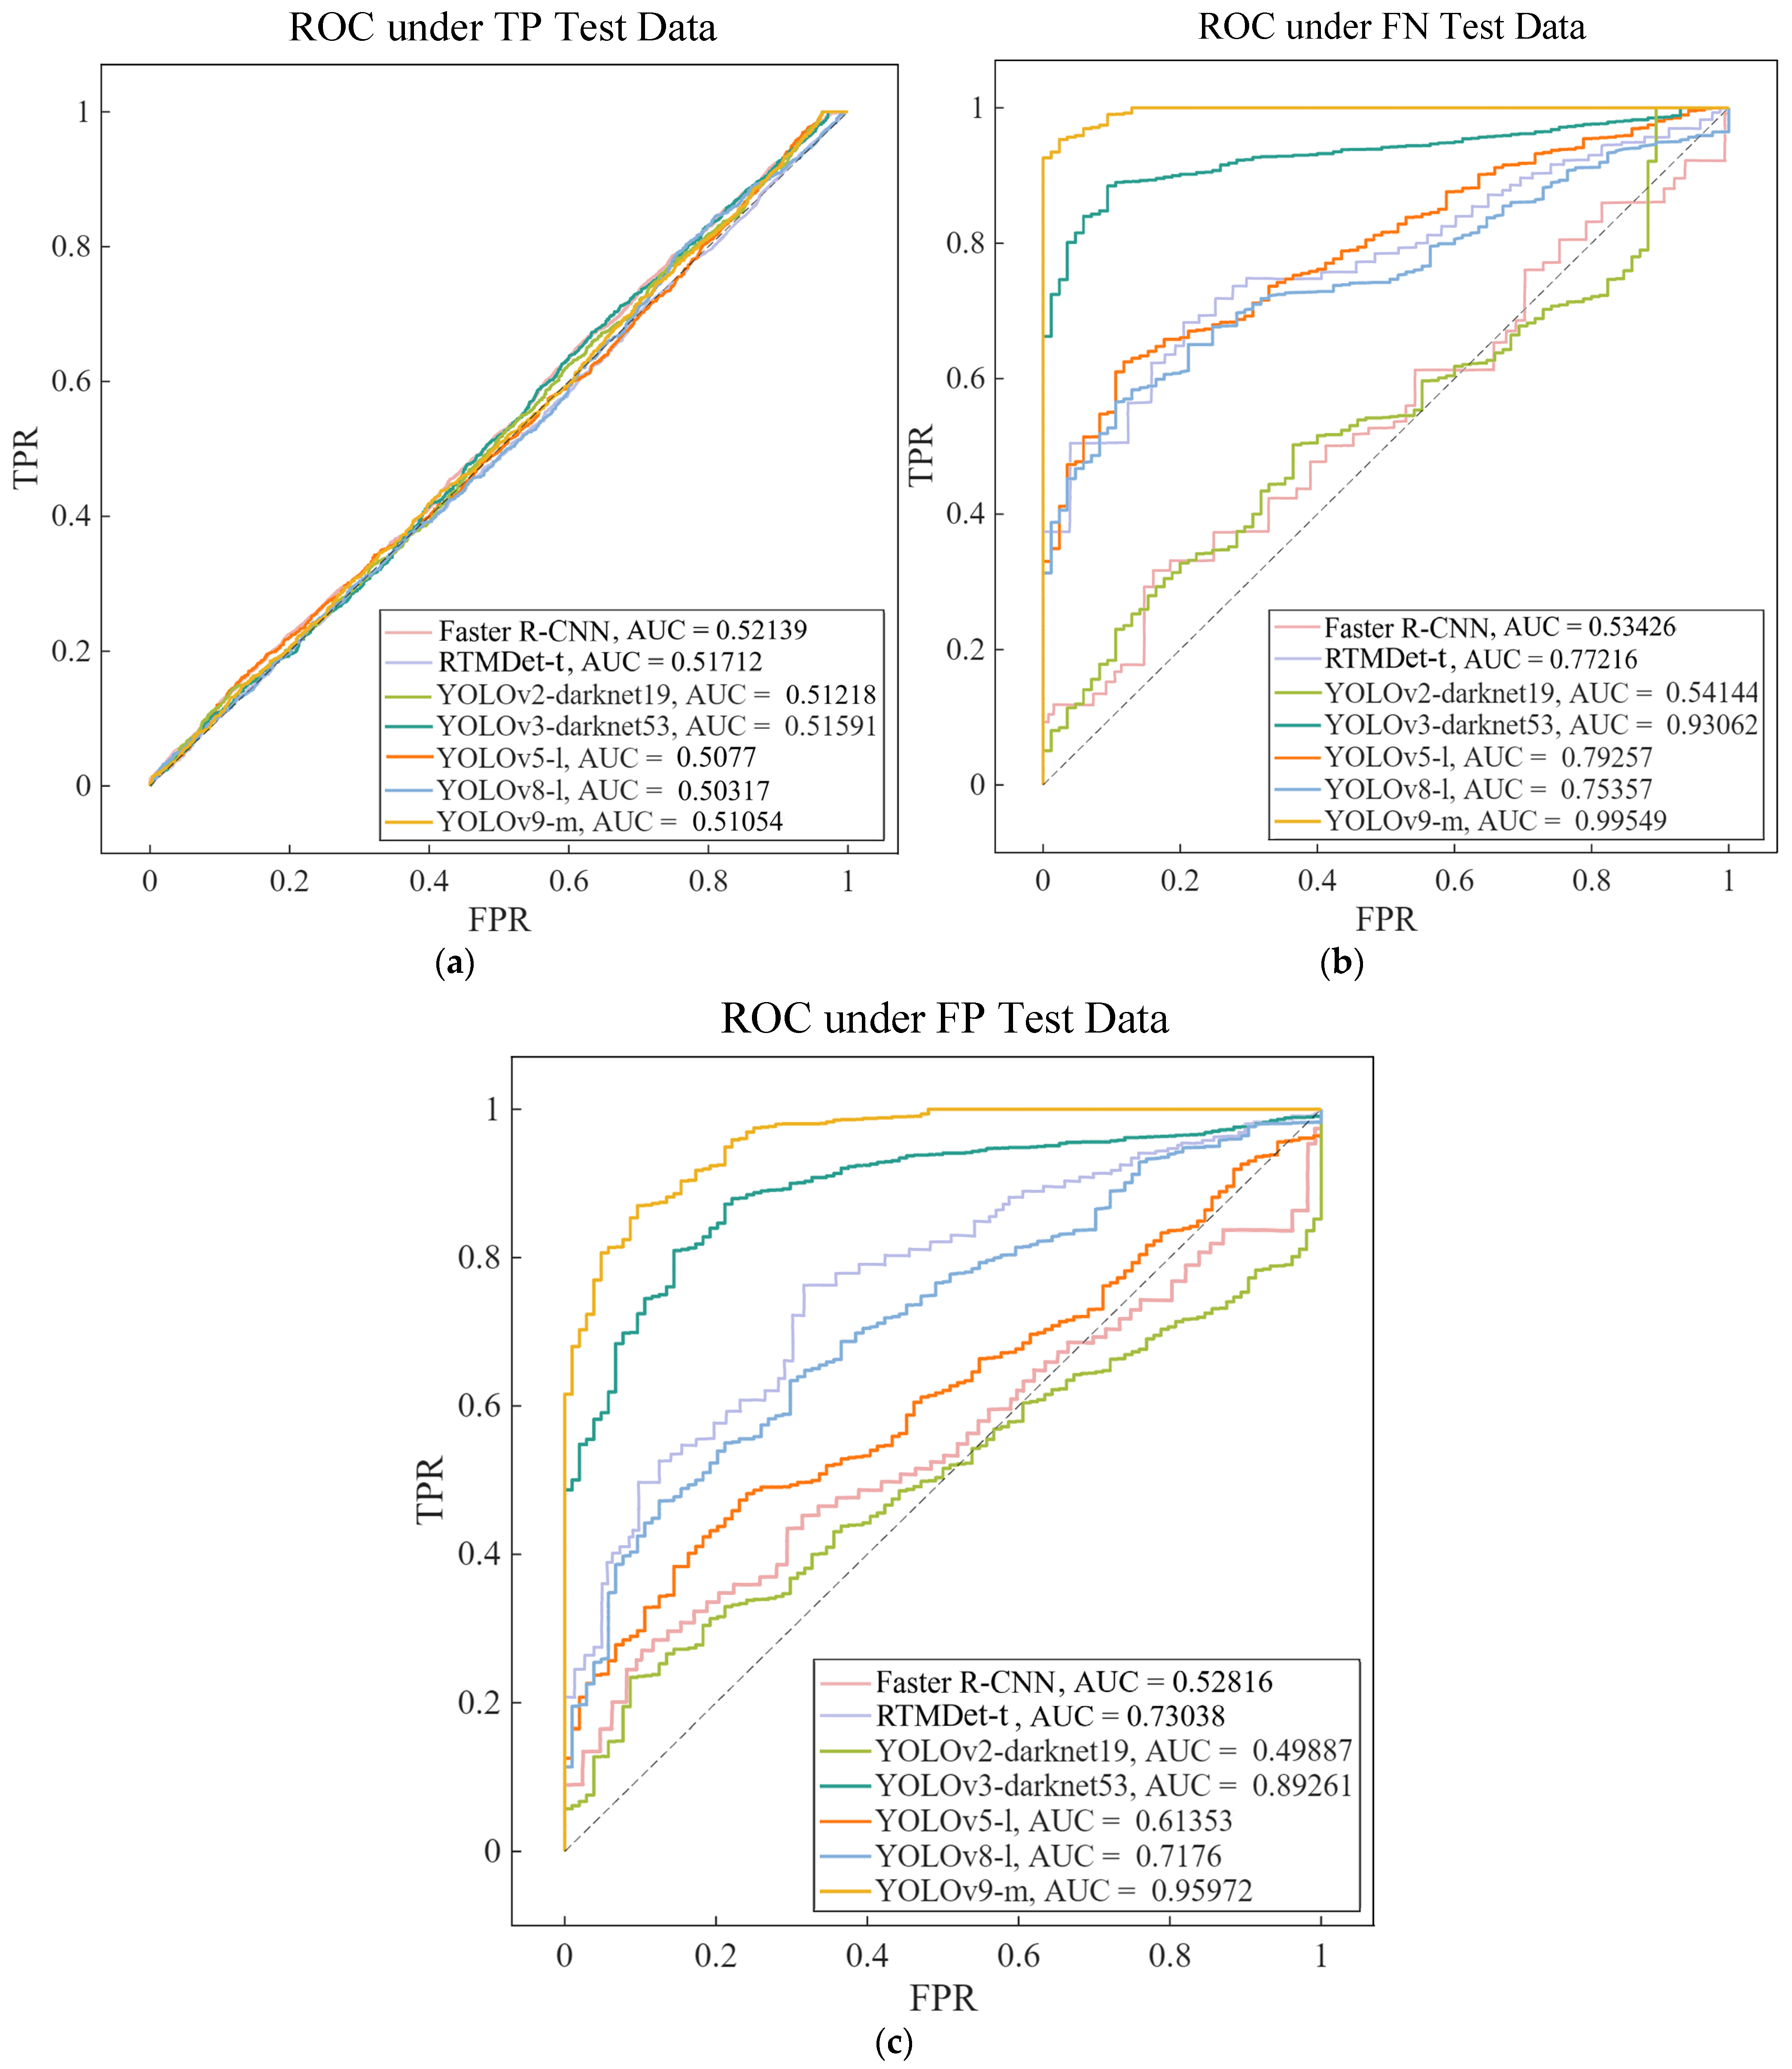
Based on the object-detection results detailed in Section 3.1.2, a more granular partitioning of the MSDD test set was performed. Specifically, 89 image samples with a high frequency of missed detections were compiled into an FN test set, 103 image samples with a high frequency of false detections were compiled into an FP test set, and the remaining samples were compiled into a TP test set. The proposed OOD evaluation algorithm was then applied to these three test sets separately to validate its discriminative performance on different detection outcomes. The experiment is carried out based on the backbone and neck networks under each model. The resulting receiver operating characteristic curves (ROC) for the three datasets are presented in Figure 9.
Figure 9.
Receiver operating characteristic curves for various types of MSDD test data: (a) TP samples, (b) FN samples, (c) FP samples. The closer the curve in the figure is to the top left corner, the better the algorithm’s discrimination performance.
As illustrated in Figure 9a, the AUC values of the algorithms for TP data across different models are approximately 0.5, indicating that the overall separability of such data is relatively low, and their features are not easily distinguishable from the training set, thereby confirming their nature as ID data. Figure 9b reveals variations in the discriminative capability of the algorithms for FN test samples across different models. Specifically, the YOLOv9-m and YOLOv3-darknet53 models achieve AUC values exceeding 0.9, with their curves approaching the top-left corner, demonstrating that the algorithms under these models exhibit the best overall discriminative performance for FN data, effectively distinguishing such samples from the in-distribution training set. This is followed by the YOLOv5-l, RTMDet-t, and YOLOv8-l models, which show moderate discriminative performance, whereas the YOLOv2-darknet19 and Faster R-CNN models perform poorly, with AUC values of only 0.541 and 0.534, respectively. This suggests that the network features of these two models lack distinctiveness or are insufficient, thereby hindering the algorithm’s ability to differentiate between data types. Further analysis of Figure 9c indicates that the algorithm achieves the best discriminative performance for FP samples under the YOLOv9-m model, followed by the YOLOv3-darknet53 model. The RTMDet-t and YOLOv8-l models exhibit moderate performance, with YOLOv5-l trailing slightly, while the YOLOv2-darknet19 and Faster R-CNN models again demonstrate the poorest discriminative ability for FP samples in the MSDD.
Additionally, a comparison of the AUC values for the same models between Figure 9b,c reveals that, under the same model network, the algorithm performs better in discriminating FN samples than FP samples. This discrepancy can be attributed to the higher proportion of small objects in FN samples, which exhibit less distinct features, thereby making them easier for the algorithm to distinguish from the training data. In contrast, FP samples contain a greater number of easily confusable features, rendering them more challenging for the algorithm to differentiate.
The aggregated performance metrics of the algorithm across different models and test datasets are presented in Table 7, with the optimal values for each metric under different models indicated in bold. A comparison of the FPR95 values for the same model across different datasets reveals that the algorithm’s FPR95 is generally highest on the TP samples and generally lowest on the FN samples. This further indicates that the algorithm readily distinguishes TP samples, which are characterized by features similar to the training data, and FN samples, which exhibit feature distributions markedly different from the training data. However, it is prone to erroneous decisions when processing FP samples, which contain a higher proportion of confounding features.
Table 7.
Results of OOD discrimination for MSDD test data under different models.
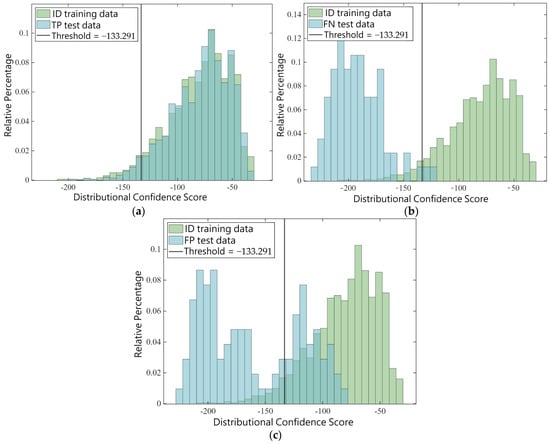
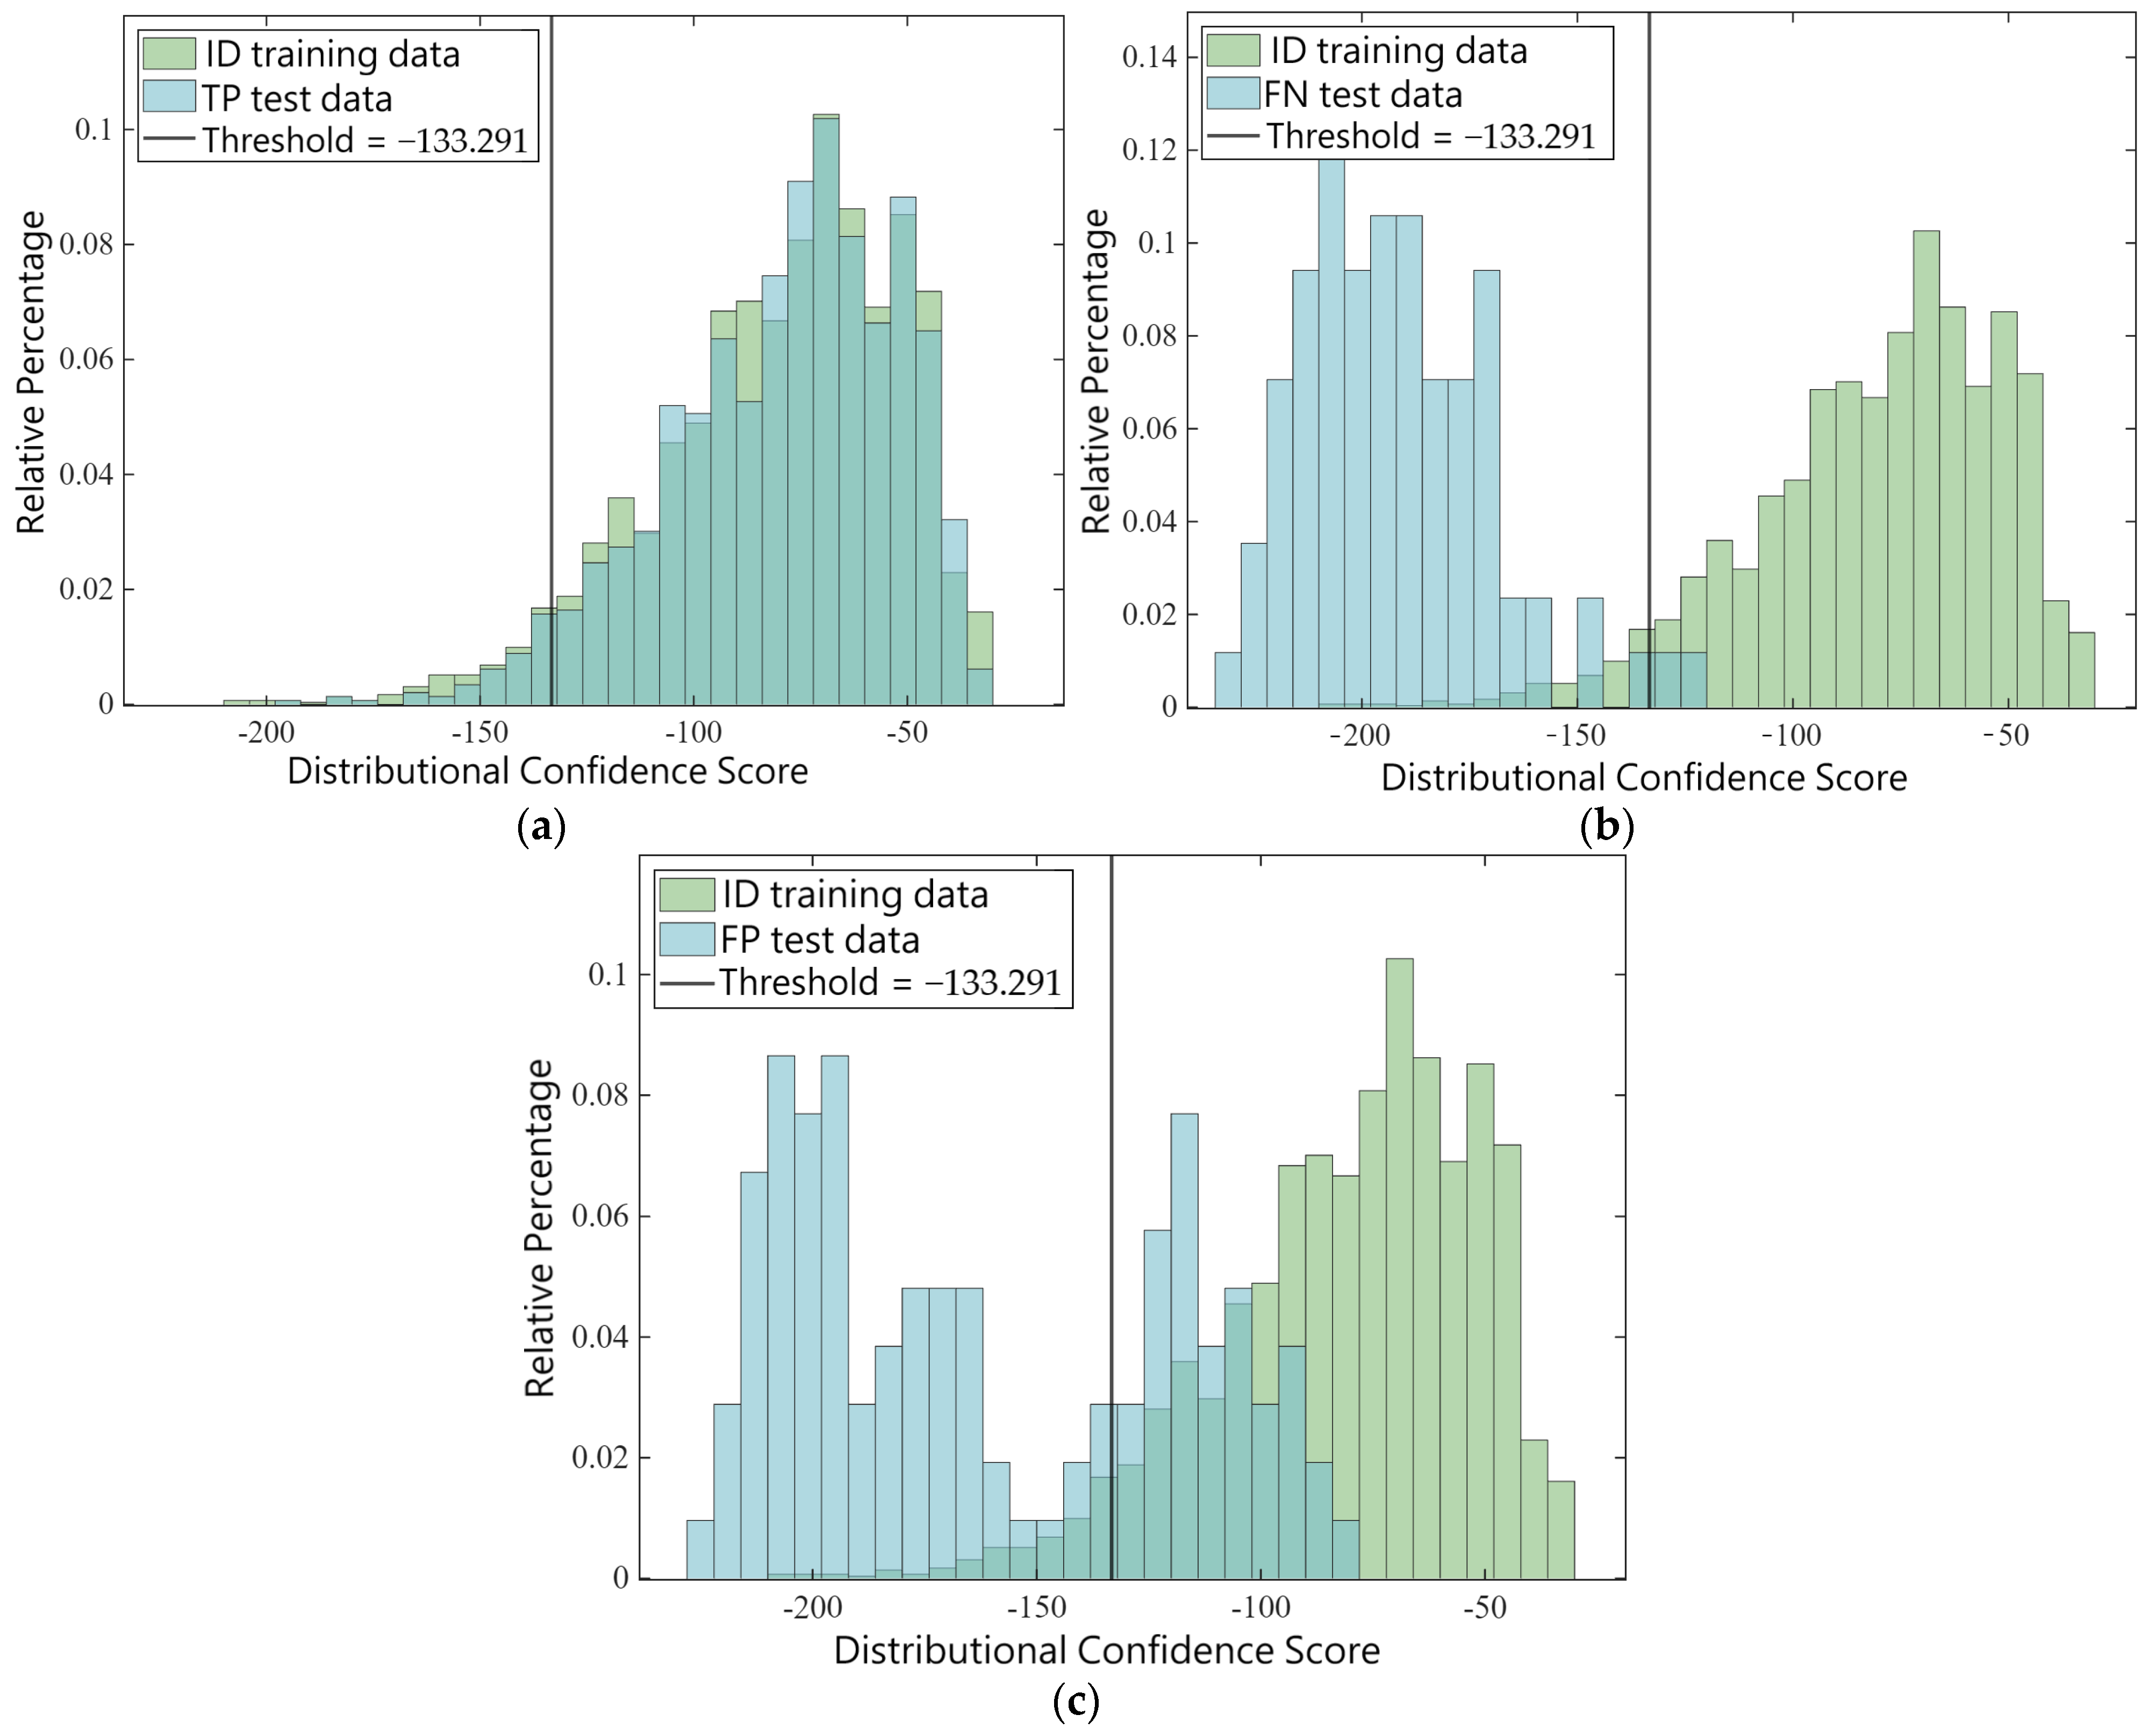
Furthermore, using the YOLOv8-l model as an illustrative example, the histogram of confidence score distributions for samples across different test datasets is presented in Figure 10. To facilitate data comparison, data points with an actual confidence score of -inf are represented by random numbers following a normal distribution within the interval [−400, −150]. Analysis of the figures reveals that, in Figure 10a, the score distribution of the training set data closely resembles that of the true-positive test samples, with the algorithm classifying the majority of these as ID data. In contrast, Figure 10b shows a distinct difference between the score distribution of the training set data and that of the false-negative samples. The generated score threshold of −133.291 effectively distinguishes the majority of FN samples. However, in Figure 10c, the scores of the FP samples partially overlap with the training set data distribution. This overlap makes it challenging for a threshold to reliably differentiate them from the training data, consequently leading to a certain degree of misclassification.
Figure 10.
Histogram of data distribution confidence scores on the MSDD test set: (a) TP samples, (b) FN samples, (c) FP samples.
To address the issue of overlap between FP samples and training data, we foresee several promising directions for improvement. First, incorporating non-linear dimensionality reduction techniques (e.g., kernel PCA or autoencoders) could better preserve anomaly-relevant structures. Second, instead of using a single global threshold, an adaptive decision boundary that varies with local data density may improve separability. Third, ensemble strategies that combine multiple histogram-based models with different binning strategies or feature subspaces could reduce the variance of score estimates. These approaches represent feasible future research directions, which warrant further in-depth and rigorous investigation.
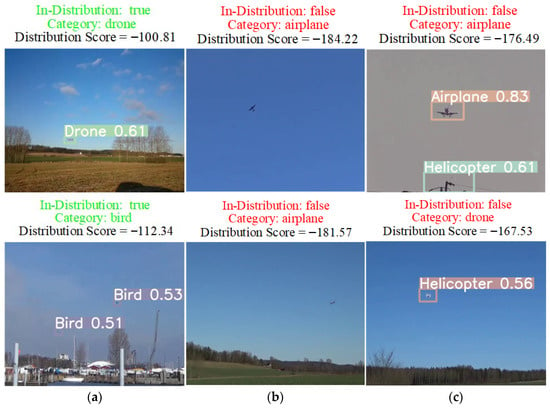
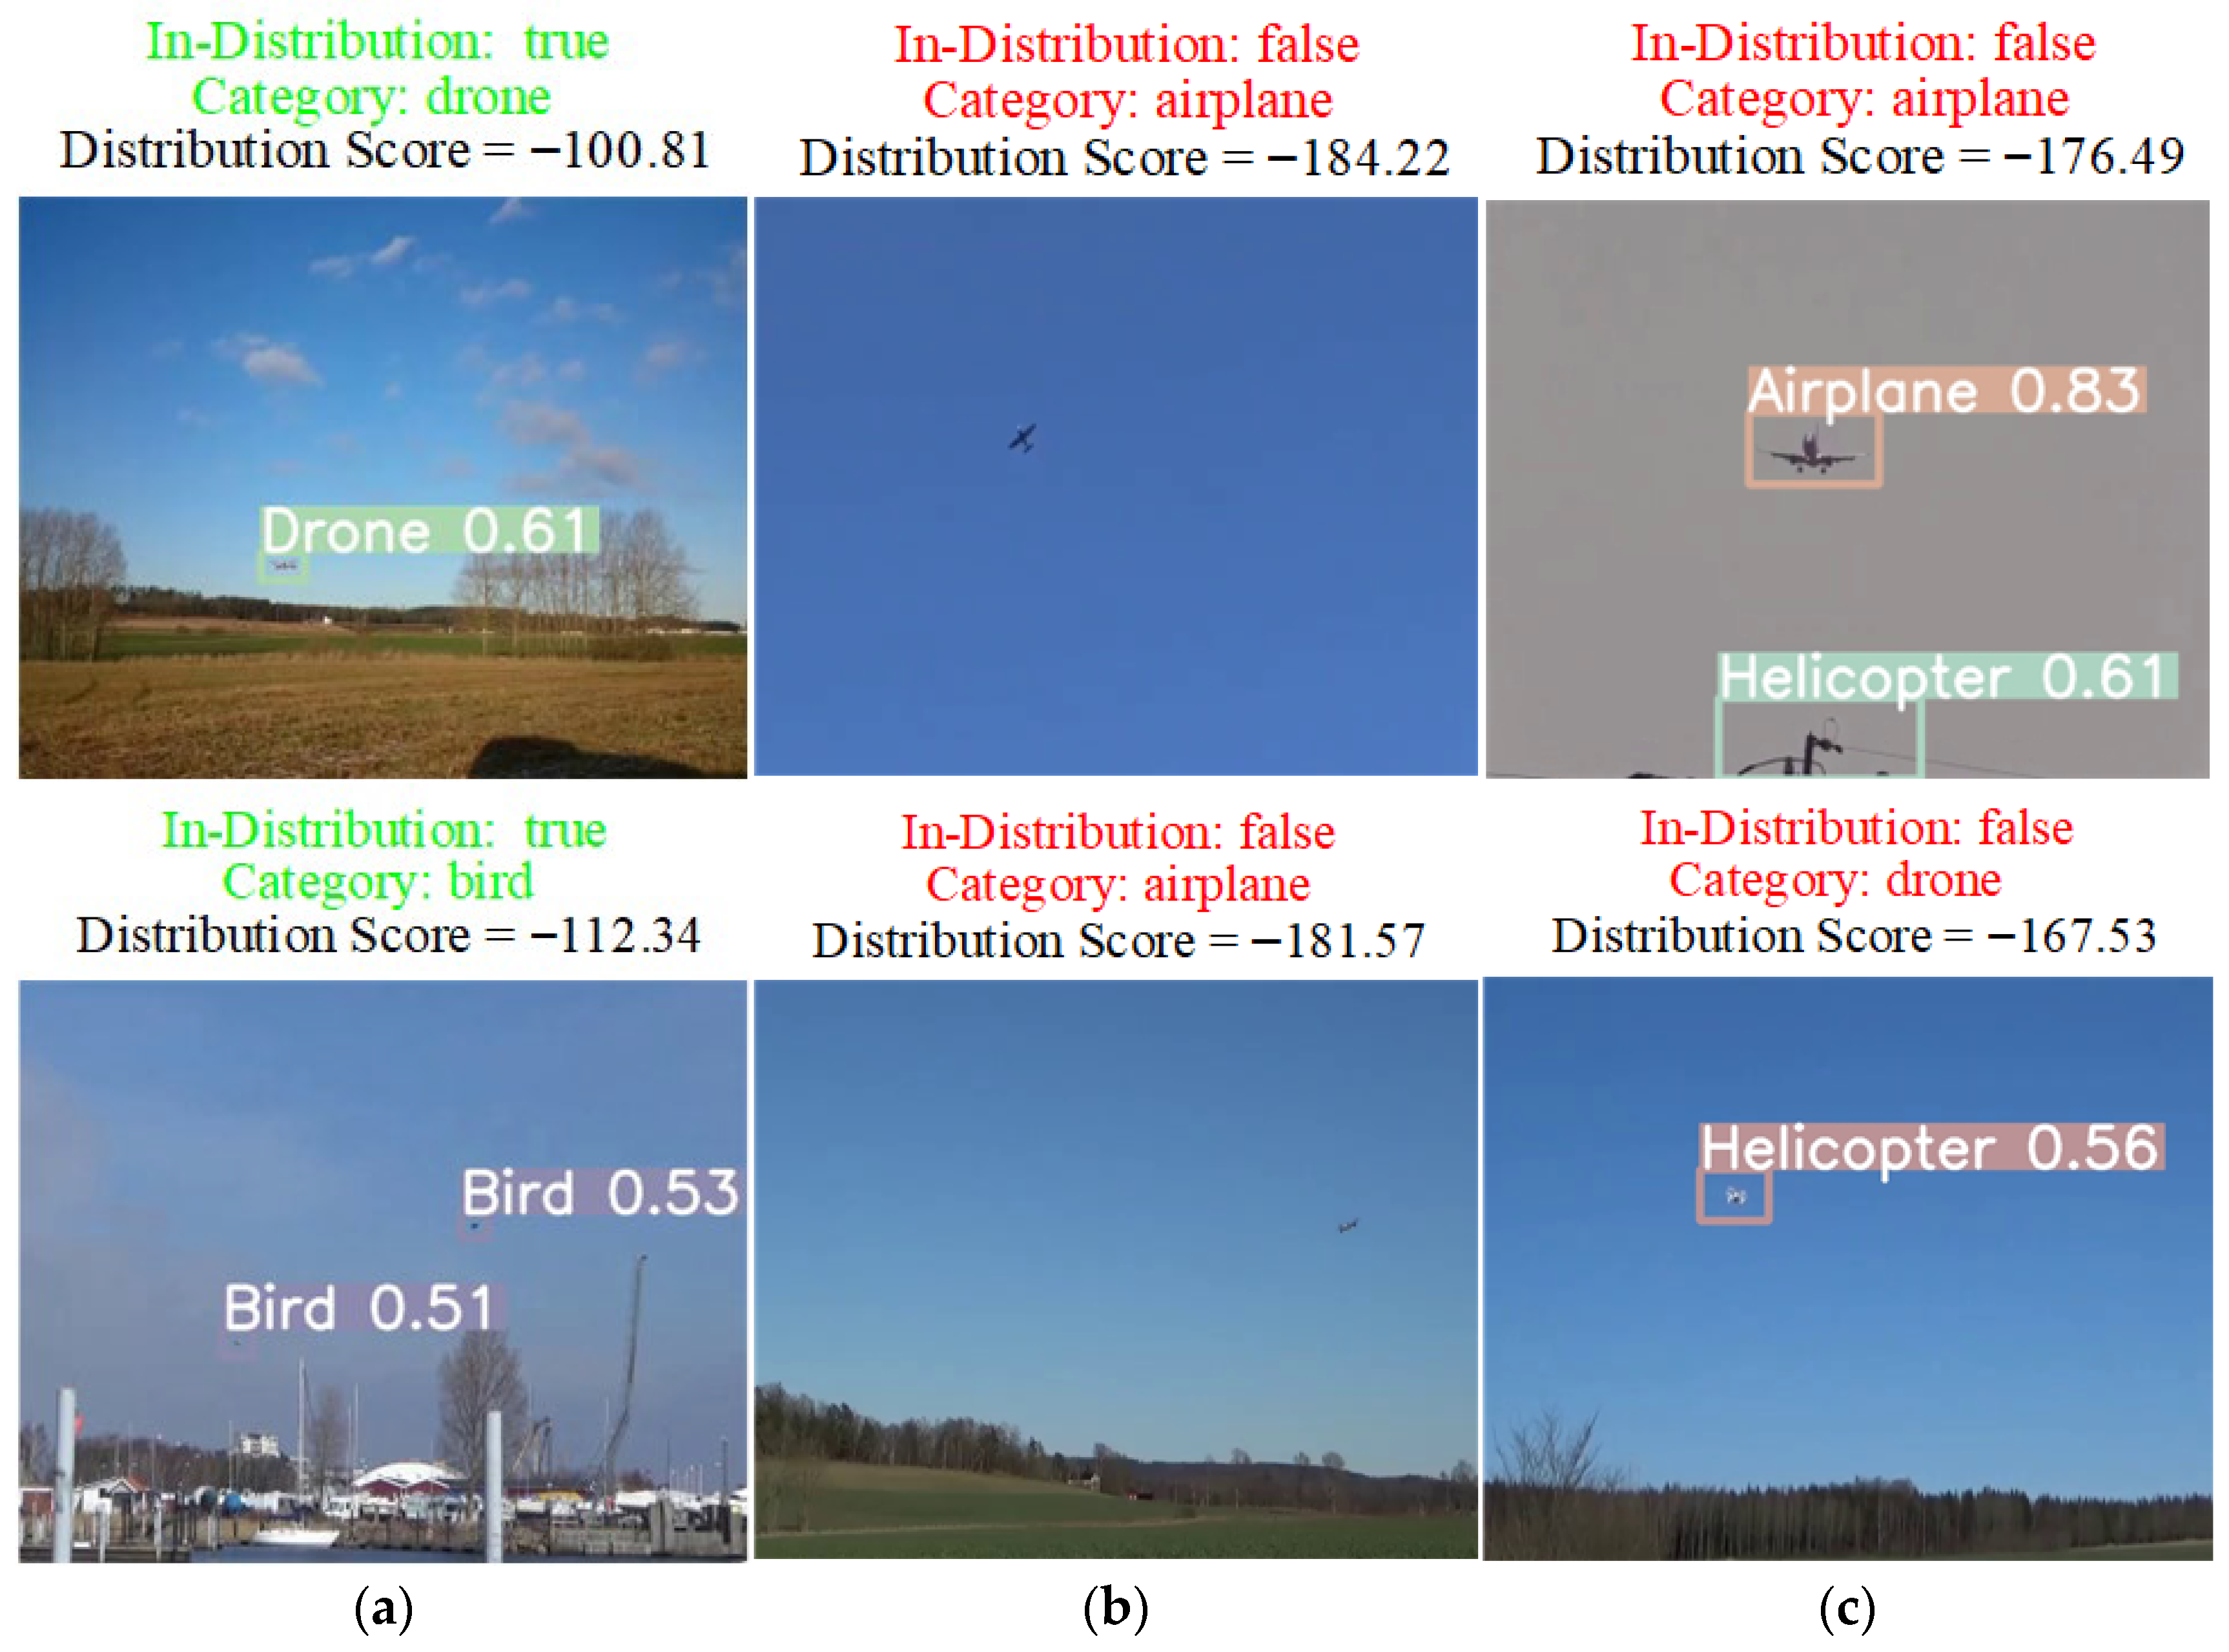
Based on the YOLOv8-l model, the OOD detection results obtained by the PCA-HBOS algorithm for TP, FN and FP samples in the MSDD are presented in Figure 11. In Figure 11a, the YOLOv8-l model correctly localizes and labels the drone and bird objects, while the OOD algorithm classifies the TP samples as ID. In Figure 11b, the model fails to detect the object, and the OOD algorithm identifies the image as OOD. In Figure 11c, the model falsely detects a telegraph pole as a helicopter, and detects a small drone as an airplane and a helicopter. In these cases, the OOD algorithm correctly classifies the falsely detected images as OOD.
Figure 11.
Results of OOD discrimination output on the MSDD test set: (a) TP samples, (b) FN samples, (c) FP samples.
3.3.2. OOD Discriminative Results Under Heterogeneous Data
Focusing on the heterologous AOT and AOD-4 datasets, the proposed algorithm is applied to various detection models to further investigate its relationship with the model networks on heterologous data. Based on the object-detection results detailed in Section 3.1.3, a more granular partitioning of the test set was also performed as stated in Section 3.3.1. Specifically, in the AOT dataset, 969 image samples with a high frequency of missed detections were compiled into an FN test set, 133 image samples with a high frequency of false detections were compiled into an FP test set, and the remaining samples were compiled into a TP test set. In the AOD-4 dataset, 422 image samples with a high frequency of missed detections were compiled into an FN test set, 83 image samples with a high frequency of false detections were compiled into an FP test set, and the remaining samples were compiled into a TP test set. The experiment is carried out based on the backbone and neck networks under each model. The results are shown in Table 8, where the optimal values for each indicator and each dataset under different models are highlighted in bold.
Table 8.
Results of OOD discrimination for AOT and AOD-4 data under different models.
Examining the optimal metric values across different sample types on the AOT dataset reveals that the optimal AUC and FPR95 for TP samples are achieved with the Faster R-CNN model. For FN samples, the optimal AUC, as well as the optimal AUC and FPR95 for FP samples, are obtained with the YOLOv5-l model, while the optimal FPR95 for FN samples is achieved with the YOLOv8-l model. On the AOD-4 dataset, the optimal AUC and FPR95 for TP samples are attained with the YOLOv3-darknet53 model, whereas the optimal AUC and FPR95 for both FN and FP samples are achieved with the YOLOv5-l model. These observations indicate that the proposed OOD algorithm achieves the best overall discriminative performance across various sample types on heterologous datasets when applied with the YOLOv5-l model.
In conjunction with the model generalization performance discussed in Section 3.1.3, it is inferred that this outcome may be related to the generalization capability of the YOLOv5-l model. Specifically, because the YOLOv5-l model fits the features of the training data well, the algorithm based on its network features can more readily distinguish ID training samples from OOD FN and FP samples. Furthermore, a comparison of the metrics for FN and FP samples on the same dataset across different object-detection models shows that the metrics achieved by the YOLOv9-m and YOLOv8-l models are only marginally inferior to those of YOLOv5-l, followed by YOLOv3-darknet53, RTMDet-t, YOLOv2-darknet19, and finally Faster R-CNN, which exhibits the weakest performance. This ranking of performance is consistent with the model performance ranking presented in Section 3.1.3. Thus, it can be concluded that there is a positive correlation between the performance of the OOD algorithm and the actual generalization performance of the underlying model.
Comparing the metrics of different models on TP samples within the same dataset reveals that, with the exception of the Faster R-CNN model, all models achieve AUC values above 0.7 and FPR95 values around 0.6 on the AOT dataset. This indicates that the algorithm is prone to misclassifying TP samples from the AOT dataset as OOD data, a phenomenon that can be attributed to the substantial disparity between the intrinsic characteristics of the AOT dataset and those of the training set. In contrast, for TP samples from the AOD-4 dataset, the AUC values across models are approximately 0.53, with FPR95 values around 0.6, suggesting that the algorithm readily classifies these TP samples as ID. This further implies that, compared to the AOT dataset, the AOD-4 dataset exhibits higher feature similarity to the MSDD training set.
Comparing the metrics of different models on FN and FP samples within the same dataset reveals that, on the AOT dataset, all models achieve AUC values exceeding 0.7 (reaching as high as above 0.9) and FPR95 values below 0.55. This indicates that the algorithm can effectively distinguish FN and FP samples from ID samples on the AOT dataset. Similarly, on the AOD-4 dataset, all models attain AUC values above 0.6 (reaching as high as above 0.8) and FPR95 values below 0.55, suggesting that the algorithm also readily differentiates FN and FP samples from ID samples on the AOD-4 dataset.
A further comparison of the same metrics between FN and FP samples reveals that, for the same model, the AUC values for FN samples are generally slightly higher than those for FP samples, while the FPR95 values for FN samples are generally marginally lower. This indicates that, compared to FP samples, the algorithm can more readily distinguish FN samples from ID samples.
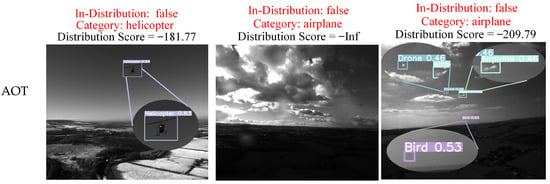
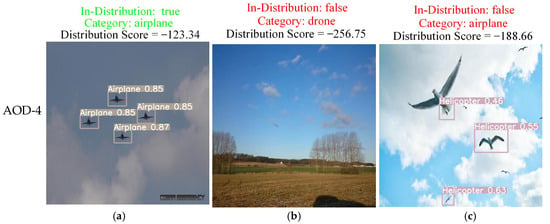
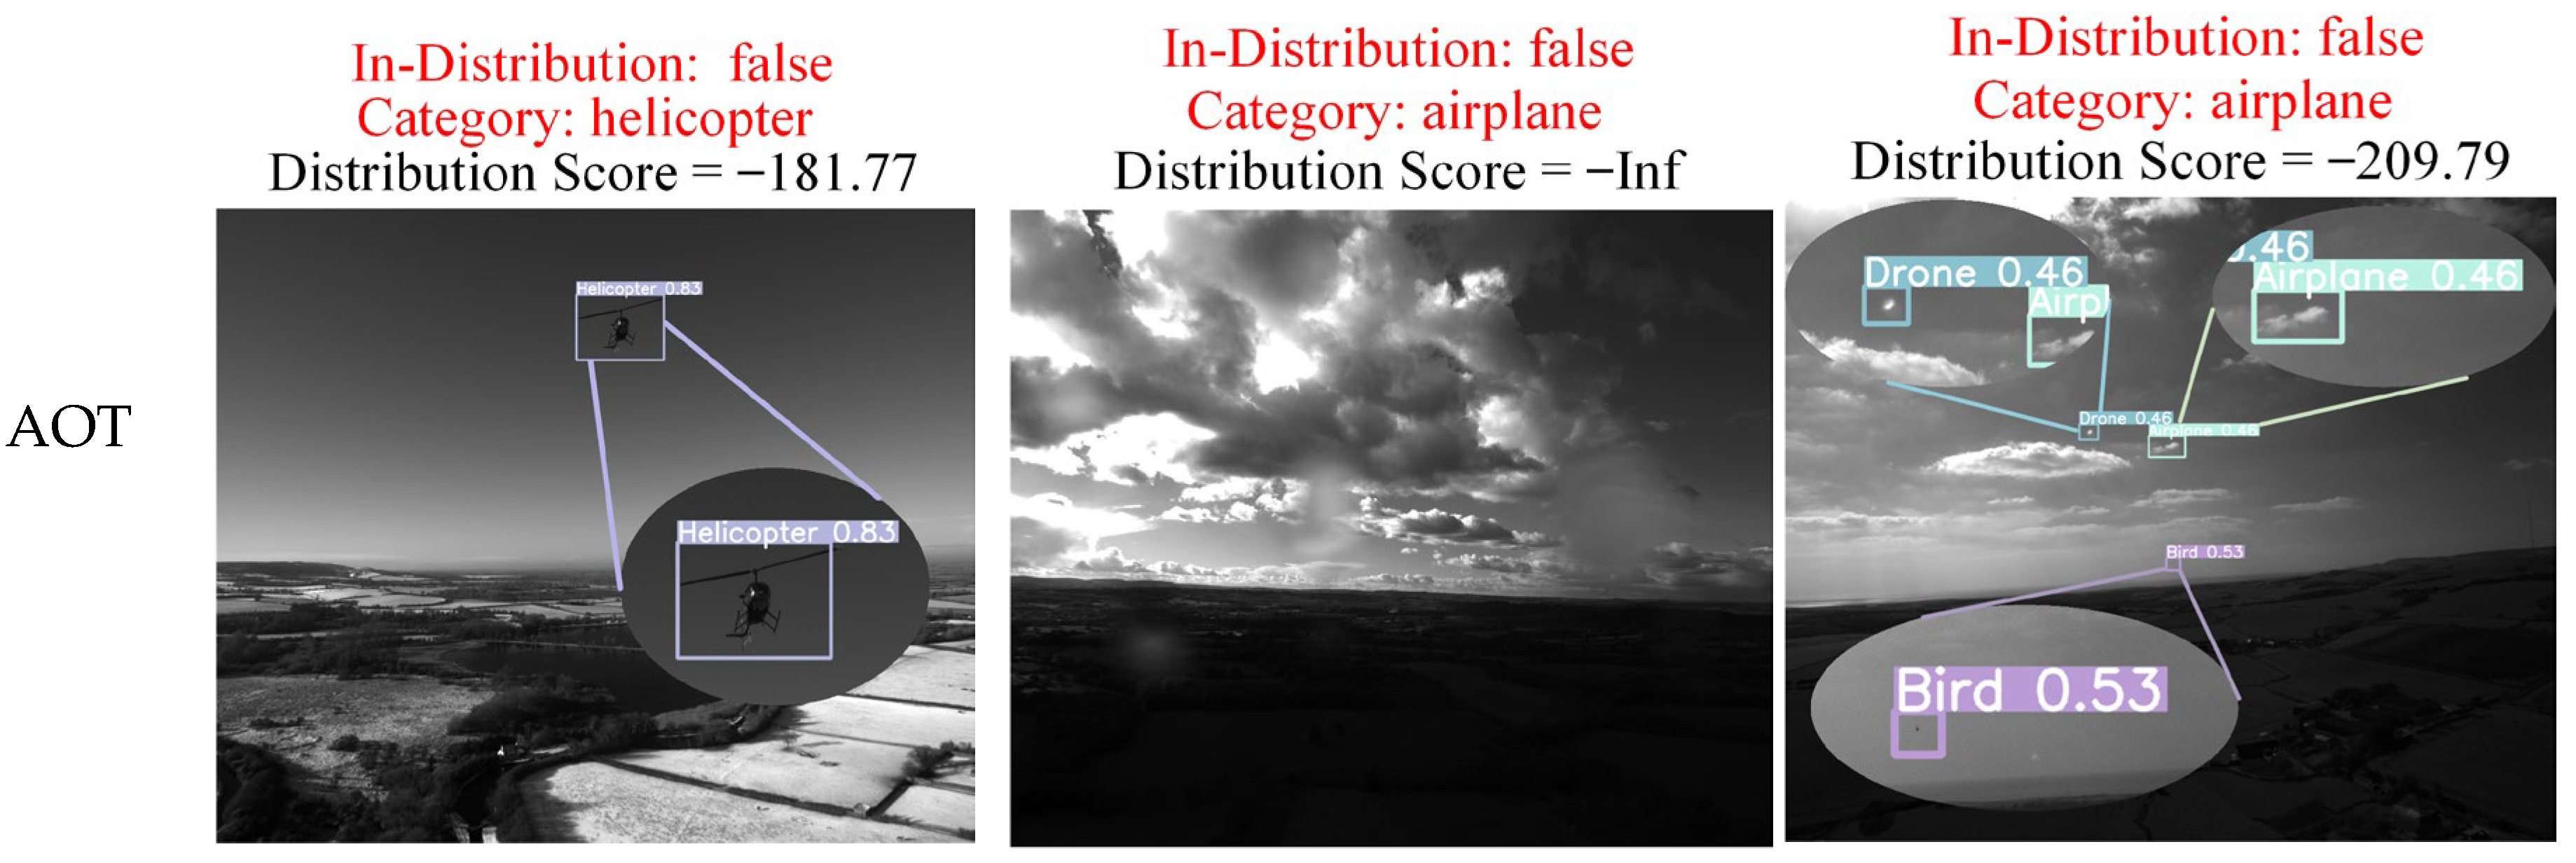
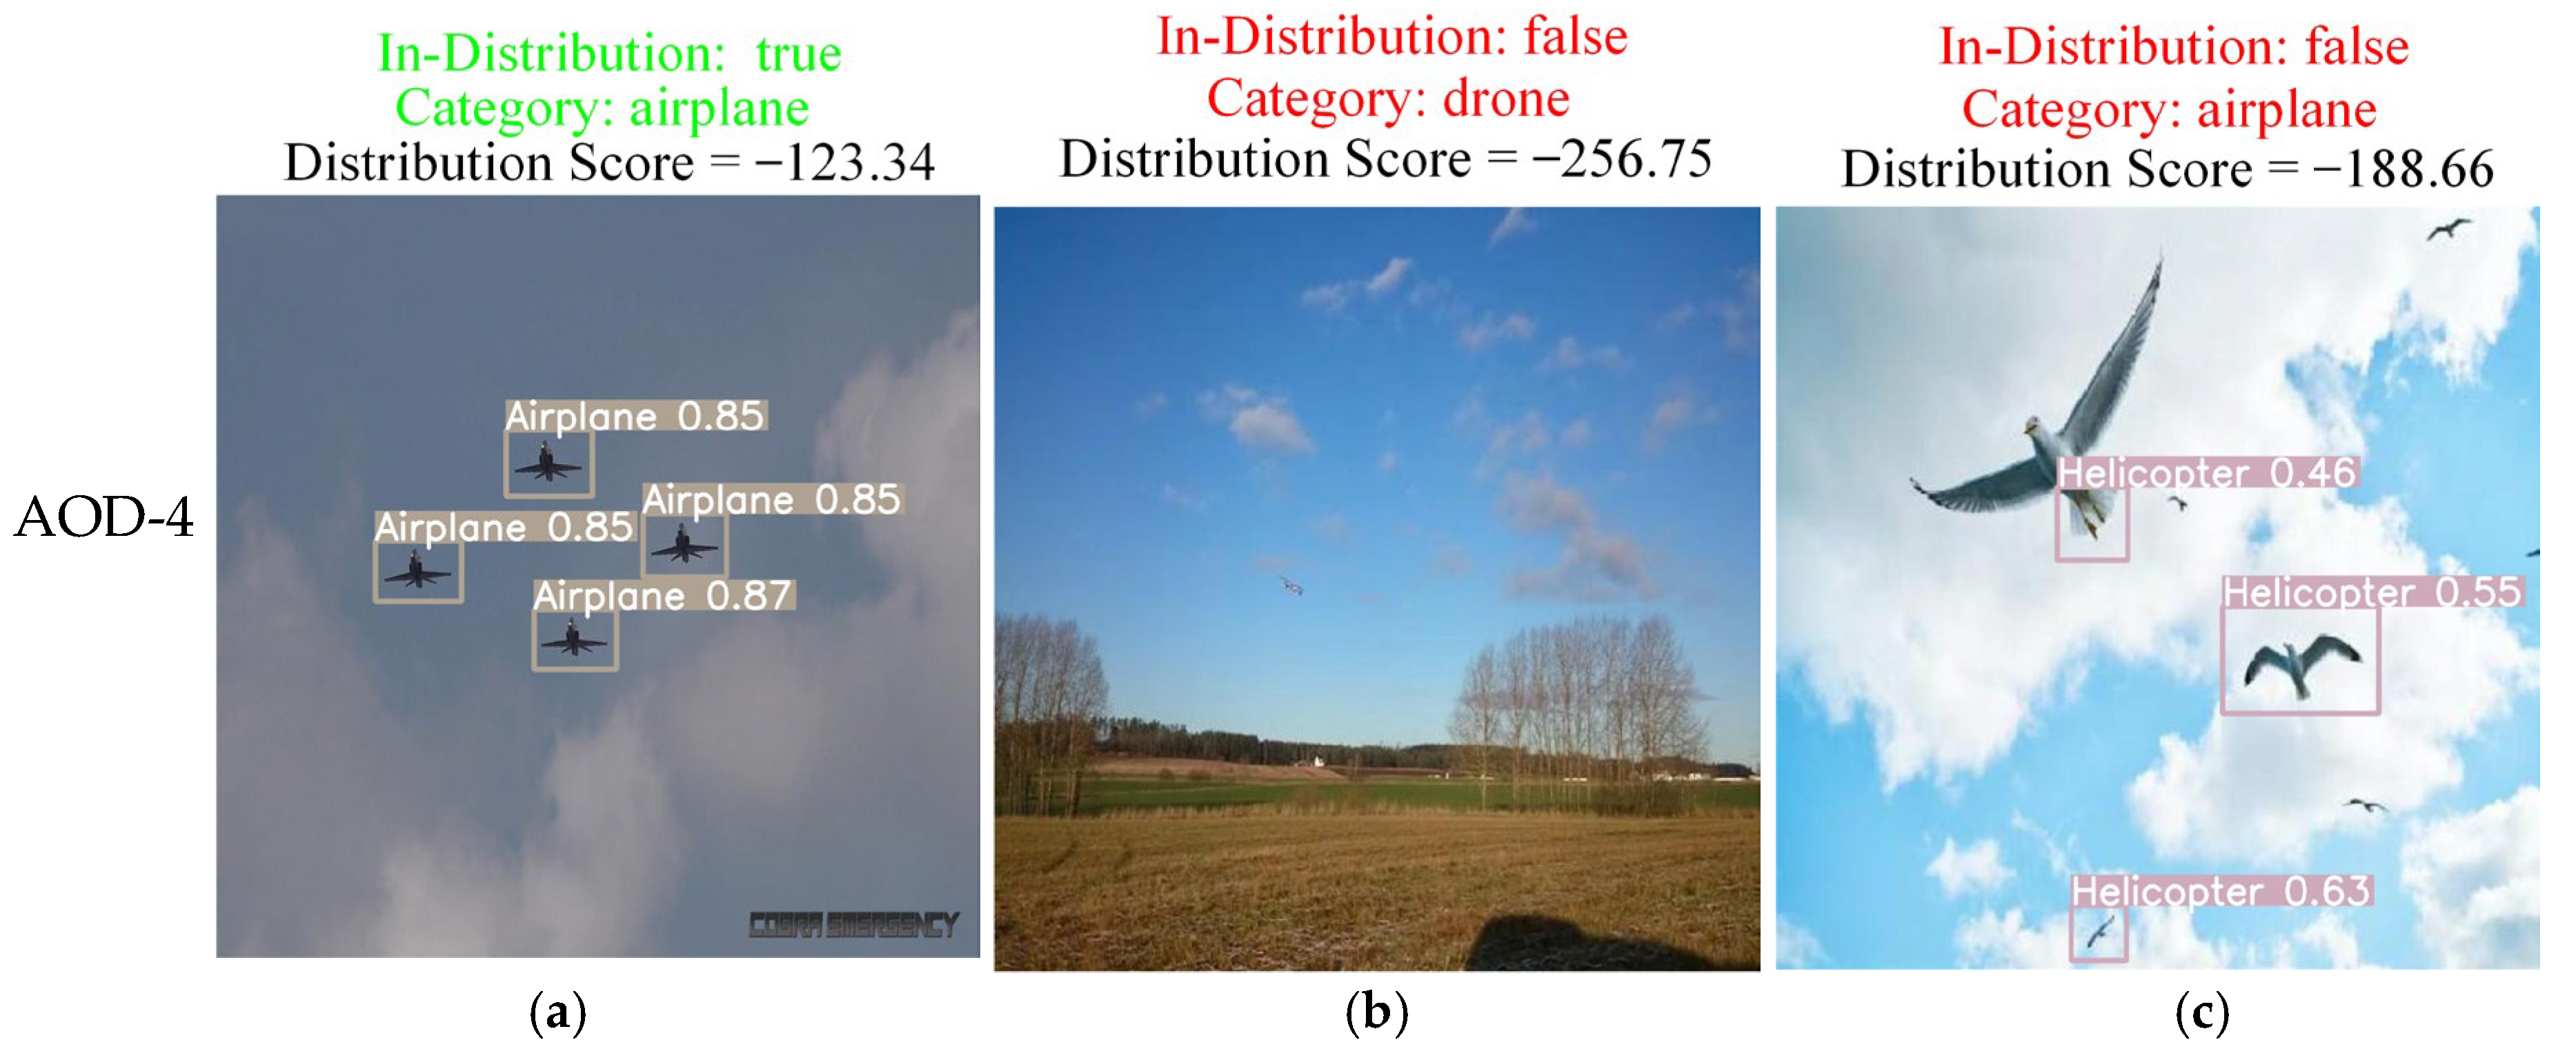
Based on the YOLOv8-l model, the OOD detection results obtained by the PCA-HBOS algorithm for TP, FN and FP samples in the AOT and AOD-4 datasets are presented in Figure 12. As illustrated in Figure 12a, the model correctly identifies and labels the helicopter and aircraft objects. However, due to the substantial distributional discrepancy between the AOT data and the training set, the algorithm still classifies this image as OOD. In Figure 12b, the model misses the extremely small aircraft object in the AOT dataset and the UAV object in the AOD-4 dataset; the OOD algorithm identifies these images as OOD. Notably, the distribution score for the extremely small aircraft image in AOT approaches negative infinity, indicating a pronounced divergence from the training set. In Figure 12c, the model produces false detections for an aircraft in the AOT dataset and a bird in the AOD-4 dataset, with the OOD algorithm classifying both as OOD.
Figure 12.
Results of OOD discrimination output on the AOT and AOD-4 datasets: (a) TP samples, (b) FN samples, (c) FP samples. The images in the first row come from the AOT dataset, and the images in the second row come from the AOD-4 dataset.
4. Conclusions
To address the challenges of degraded model generalization performance, as well as false detections and missed detections caused by distant small objects and variations in image backgrounds and pixel characteristics in low-altitude object detection, this paper proposes an OOD detection method, PCA-HBOS.
From a theoretical perspective, the proposed algorithm extracts high-dimensional semantic features from a trained deep learning model network to score input data, thereby amplifying feature disparities between ID training data and OOD data.
From the experimental perspective, through comparative experiments with other OOD algorithms on three low-altitude datasets, namely MSDD, AOT, and AOD-4, this paper validates the superiority of the proposed algorithm over mainstream OOD methods. Furthermore, by conducting multi-model OOD detection experiments on TP, FN, and FP samples from the MSDD, AOT, and AOD-4 datasets, the paper verifies the discriminative performance of the proposed algorithm against false detections and missed detections generated by object-detection models, thereby demonstrating its practical utility in low-altitude detection scenarios.
Additionally, the experiments further explore the relationship between model generalization performance and OOD algorithm performance. By applying the proposed algorithm to multiple models across various series, including Faster R-CNN, RTMDet-t, YOLOv5, and YOLOv8, this paper validates its multi-model applicability. The experimental results indicate a strong positive correlation between the discriminative performance of the OOD algorithm and the generalization performance of the underlying model.
While this paper has conducted preliminary investigations into model generalization performance and OOD algorithms in low-altitude scenarios, numerous issues remain to be addressed in future research. First, the robustness of the proposed algorithm when handling FN and FP samples still requires further improvement, as the current algorithm occasionally misclassifies FN and FP samples as ID, making it difficult to completely distinguish them from TP samples. Second, when confronted with data that exhibit substantial distributional disparities from the training set (e.g., the AOT dataset in this study), the algorithm tends to classify the entire dataset as OOD, posing a challenge to accurately identifying TP samples and differentiating them from OOD data. Third, the proposed algorithm’s performance still needs to be improved when dealing with highly nonlinear image features. Finally, this paper only provides a preliminary exploration of OOD algorithm performance based on baseline object-detection models, and the discussion does not extend to the application and performance of OOD algorithms in models specifically designed for small object detection or dense object detection. It is plausible that, under such specialized model architectures, the algorithm’s capability to address missed detections and false detections of small objects could be further improved. This also charts the course for subsequent work.
Author Contributions
Methodology, X.S. and J.L.; Writing—original draft preparation, X.S. and J.L.; Writing—review and editing, X.C. and L.D.; Data curation, X.S.; Project administration, G.Y.; Formal analysis, X.S. and X.C.; Supervision, L.D. and J.L. All authors have read and agreed to the published version of the manuscript.
Funding
This work was funded by the National Natural Science Foundation of China, grant number #52576050; the National Social Science Fund of China, grant number #2025-SKJJ-B-016.
Data Availability Statement
All data involved in this paper are available for researchers and have been made publicly accessible alongside the article. For further inquiries, please contact the authors.
Conflicts of Interest
The authors declare that the research was conducted in the absence of any commercial or financial relationships that could be construed as a potential conflict of interest.
References
- Christensen, J.M.; Zaeske, W.; Beck, J.; Friedrich, S.; Stefani, T.; Girija, A. Towards certifiable AI in aviation: A framework for neural network assurance using advanced visualization and safety nets. In Proceedings of the 2024 AIAA DATC/IEEE 43rd Digital Avionics Systems Conference, San Diego, CA, USA, 29 September–3 October 2024; pp. 1–9. [Google Scholar]
- Wang, X.; Wang, S.; Liang, X.X.; Zhao, D.W.; Huang, J.C.; Xu, X. Deep reinforcement learning: A survey. IEEE Trans. Neural Netw. Learn. Syst. 2024, 35, 5064–5078. [Google Scholar] [CrossRef] [Scilit] [PubMed]
- Liu, X.; Wang, D.; Lin, S.-B. Construction of deep RELU nets for spatially sparse learning. IEEE Trans. Neural Netw. Learn. Syst. 2023, 34, 7746–7760. [Google Scholar] [CrossRef] [Scilit] [PubMed]
- Xiao, A.; Huang, J.; Guan, D.; Zhang, X.; Lu, S.; Shao, L. Unsupervised point cloud representation learning with deep neural networks: A survey. IEEE Trans. Pattern Anal. Mach. Intell. 2023, 45, 11321–11339. [Google Scholar] [CrossRef] [Scilit]
- Chen, Z.C.; Yang, J.; Li, F.; Feng, Z.C.; Chen, L.F.; Jia, L.M. Foreign object detection method for railway catenary based on a scarce image generation model and lightweight perception architecture. IEEE Trans. Circuits Syst. Video Technol. 2026, 36, 1377–1391. [Google Scholar] [CrossRef] [Scilit]
- Yang, J.X.; Jia, N.; Liu, X.H.; Fan, R.; Sun, Y.G.; Zhao, W.D. Zone-YOLO: Vision-language object detection using zone prompt. IEEE Trans. Intell. Transp. Syst. 2025, 26, 17510–17521. [Google Scholar] [CrossRef] [Scilit]
- Jia, N.; Yang, J.X.; Liu, X.H.; Sun, Y.G. F-YOLO: Delving into fuzzy yolo for improved traffic object detection. IEEE Trans. Fuzzy Syst. 2026, 34, 440–452. [Google Scholar] [CrossRef] [Scilit]
- Chang, X.C.; Wang, J.Y.; Li, K.; Zhang, X.H.; Tang, Q. Research on multi-UAV autonomous obstacle avoidance algorithm integrating improved dynamic window approach and ORCA. Sci. Rep. 2025, 15, 14646. [Google Scholar] [CrossRef] [Scilit]
- Acubed. Airbus Validates Computer Vision-Based Technologies to Increase Safety Through Automation. Available online: https://acubed.airbus.com/blog/wayfinder/airbus-validates-computer-vision-based-technologies-to-increase-safety-through-automation (accessed on 16 March 2026).
- Zhang, Z.; Zhao, Q.; Li, X.H.; Wang, C.; Zhu, G.Q.; Zhang, Y. CA-YOLO: Cross attention empowered yolo for biomimetic localization. IEEE Trans. Circuits Syst. Video Technol. 2026, 36, 175–189. [Google Scholar] [CrossRef] [Scilit]
- Shuai, Z.H.; Yu, T.; Zhang, B.; Ren, C.F.; Wang, L.S.; Jiang, X.M. YOLO-light: Automatic lightweight you-only-look-once generation in different scenarios through neuroevolution. IEEE Trans. Evol. Comput. 2025. Available online: https://ieeexplore.ieee.org/document/11190055 (accessed on 16 March 2026).
- Qian, X.L.; Zhang, B.H.; He, Z.Y.; Wang, W.; Yao, X.W.; Cheng, G. IPS-YOLO: Iterative pseudo-fully supervised training of yolo for weakly supervised object detection in remote sensing images. IEEE Trans. Geosci. Remote Sens. 2025, 63, 5630414. [Google Scholar] [CrossRef] [Scilit]
- Geng, H.T.; Liu, Z.Y.; Wang, Y.R.; Fang, L. SDFC-YOLO: A yolo-based model with selective dynamic feature compensation for pavement distress detection. IEEE Trans. Intell. Transp. Syst. 2025, 26, 6556–6569. [Google Scholar] [CrossRef] [Scilit]
- Li, Y.; Xia, Y.; Zheng, G.; Guo, X.; Li, Q. YOLO-RWY: A Novel Runway Detection Model for Vision-Based Autonomous Landing of Fixed-Wing Unmanned Aerial Vehicles. Drones 2024, 8, 571. [Google Scholar] [CrossRef] [Scilit]
- Chen, M.Q.; Hu, Y.Z. An image-based runway detection method for fixed-wing aircraft based on deep neural network. IET Image Process. 2024, 18, 1939–1949. [Google Scholar] [CrossRef] [Scilit]
- Isaac-Medina, B.K.S.; Poyser, M.; Organisciak, D.; Willcocks, C.G.; Breckon, T.P.; Shum, H.P.H. Unmanned aerial vehicle visual detection and tracking using deep neural networks: A performance benchmark. In Proceedings of the 2021 IEEE/CVF International Conference on Computer Vision (ICCV), Montreal, QC, Canada, 11 October–17 October 2021; pp. 1223–1232. [Google Scholar]
- Mediavilla, C.; Nans, L.; Marez, D.; Parameswaran, S. Detecting aerial objects: Drones, birds, and helicopters. In Artificial Intelligence and Machine Learning in Defense Applications III; SPIE: Bellingham, WA, USA, 2021; p. 118700J. [Google Scholar] [CrossRef] [Scilit]
- Ghosh, S.; Patrikar, J.; Moon, B.; Hamidi, M.M.; Scherer, S. AirTrack: Onboard deep learning framework for long-range aircraft detection and tracking. In Proceedings of the 2023 IEEE International Conference on Robotics and Automation (ICAR 2023), London, UK, 29 May–2 June 2023; pp. 1277–1283. [Google Scholar]
- Gupta, A.; Narayan, S.; Joseph, K.J.; Khan, S.; Khan, F.S.; Shah, M.S. OW-DETR: Open-world Detection Transformer. In Proceedings of the 2022 IEEE/CVF Conference on Computer Vision and Pattern Recognition (CVPR 2022), New Orleans, LA, USA, 18–24 June 2022; pp. 9225–9234. [Google Scholar]
- Moreno-torres, J.G.; Raeder, T.; Alaiz-rodríguez, R.; Chawla, N.V.; Herrera, F. A unifying view on dataset shift in classification. Pattern Recognit. 2012, 45, 521–530. [Google Scholar] [CrossRef] [Scilit]
- Geng, C.X.; Huang, S.J.; Chen, S.C. Recent advances in open set recognition: A Survey. IEEE Trans. Pattern Anal. Mach. Intell. 2020, 43, 3614–3631. [Google Scholar] [CrossRef] [Scilit] [PubMed]
- Cima, G.; Cluzeau, J.M.; Henriquel, X.; Rebender, G.; Soudain, G.; van Dijk, L.; Gronskiy, A.; Haber, D.; Perret-Gentil, C.; Polak, R. Concepts of Design Assurance for Neural Networks (CoDANN); Technical Report; European Union Aviation Safety Agency (EASA): Cologne, Germany, 2020; Available online: https://www.easa.europa.eu/en/document-library/general-publications/concepts-design-assurance-neural-networks-codann#group-easa-downloads (accessed on 16 March 2026).
- Sastry, C.S.; Oore, S. Detecting out-of-distribution examples with gram matrices. In Proceedings of the 37th International Conference on Machine Learning (ICML 2020), Vienna, Austria, 13–18 July 2020; Volume 787, pp. 8491–8501. [Google Scholar]
- Long, X.M.; Zhang, J.; Shan, S.G.; Chen, X.L. Rethinking the Evaluation of Out-of-Distribution Detection: A Sorites Paradox. In Proceedings of the 38th Conference on Neural Information Processing Systems (NeurIPS 2024), Vancouver, BC, Canada, 9–15 December 2024. [Google Scholar]
- Zhang, H.; Li, A.; Guo, J.; Guo, Y. Hybrid models for open set recognition. In Proceedings of the 16th European Conference on Computer Vision (ECCV 2020), Glasgow, UK, 23–28 August 2020; pp. 102–117. [Google Scholar]
- Xiao, J.; Li, W. Analysis of Airworthiness requirements for commercial aircraft avionics system design in low altitude economy. Eng. Proc. 2024, 80, 6. [Google Scholar] [CrossRef] [Scilit]
- Arsenos, A.; Petrongonas, E.; Filippopoulos, O.; Skliros, C.; Kollias, D.; Kollias, S. NEFELI: A deep-learning detection and tracking pipeline for enhancing autonomy in advanced air mobility. Aerosp. Sci. Technol. 2024, 155, 109613. [Google Scholar] [CrossRef] [Scilit]
- Wu, X.; Li, W.; Hong, D.F.; Tao, R.; Du, Q. Deep Learning for Unmanned Aerial Vehicle-Based Object Detection and Tracking: A survey. IEEE Geosci. Remote Sens. Mag. 2022, 10, 91–124. [Google Scholar] [CrossRef] [Scilit]
- EASA. Machine Learning Application Approval (MLEAP); European Union Aviation Safety Agency: Cologne, Germany, 2021; Available online: https://www.easa.europa.eu/en/research-projects/machine-learning-application-approval (accessed on 16 March 2026).
- Tamang, L.; Bouadjenek, M.R.; Dazeley, R.; Aryal, S. Handling out-of-distribution data: A survey. IEEE Trans. Knowl. Data Eng. 2025, 37, 5948–5966. [Google Scholar] [CrossRef] [Scilit]
- Zhang, Y.F.; Pan, J.L.; Liu, W.W.; Chen, Z.B.; Li, K.L.; Wang, J. Kullback-leibler divergence-based out-of-distribution detection with flow-based generative models. IEEE Trans. Knowl. Data Eng. 2024, 36, 1683–1697. [Google Scholar] [CrossRef] [Scilit]
- Ma, X.S.; Wu, J.; Zou, X.; Liu, W. A unified decision rule for generalized out-of-distribution detection. IEEE Trans. Pattern Anal. Mach. Intell. 2026, 48, 3544–3555. [Google Scholar] [CrossRef] [Scilit]
- Zhao, Z.L.; Cao, L.B.; Lin, K.Y. Out-of-distribution detection by cross-class vicinity distribution of in-distribution data. IEEE Trans. Neural NetWork. Learn. Syst. 2024, 35, 13777–13788. [Google Scholar] [CrossRef] [Scilit] [PubMed]
- Fang, Z.; Li, Y.X.; Liu, F.; Han, B.; Lu, J. On the learnability of out-of-distribution detection. J. Mach. Learn. Res. 2024, 25, 1–83. [Google Scholar]
- Sheng, B.; Pan, D.; Li, X. Dynamic dual mining framework for long-tailed out-of-distribution detection. Appl. Intell. 2025, 55, 783. [Google Scholar] [CrossRef] [Scilit]
- Zhang, Q.Y.; Feng, Q.X.; Zhou, J.T.Y.; Bian, Y.T.; Hu, Q.H.; Zhang, C.Q. The Best of Both Worlds: On the Dilemma of Out-of-distribution Detection. In Proceedings of the 38th Conference on Neural Information Processing Systems (NeurIPS 2024), Vancouver, BC, Canada, 9–15 December 2024. [Google Scholar]
- Svanström, F.; Alonso-fernandez, F.; Englund, C. A dataset for multi-sensor drone detection. Data Brief 2021, 39, 107521. [Google Scholar] [CrossRef] [Scilit]
- Amazon. Airborne Object Tracking Challenges. Available online: https://www.aicrowd.com/challenges/airborne-object-tracking-challenge (accessed on 16 March 2026).
- Soni, V.; Shah, D.; Joshi, J.; Gite, S.; Pradhan, B.; Alamri, A. Introducing AOD 4: A dataset for air borne object detection. Data Brief. 2024, 56, 110801. [Google Scholar] [CrossRef] [Scilit] [PubMed]
- Paulauskas, N.; Baskys, A. Application of histogram-based outlier scores to detect computer network anomalies. Electronics 2019, 8, 1251. [Google Scholar] [CrossRef] [Scilit]
- Chen, M.Q.; Yu, L.J.; Zhi, C.; Sun, R.J.; Zhu, S.W.; Gao, Z.Y.; Ke, Z.X.; Zhu, M.Q.; Zhang, Y.M. Improved faster R-CNN for fabric defect detection based on Gabor filter with Genetic Algorithm optimization. Comput. Ind. 2022, 134, 103551. [Google Scholar] [CrossRef] [Scilit]
- Zeng, L.C.; Sun, B.; Zhu, D.Q. Underwater target detection based on Faster R-CNN and adversarial occlusion network? Eng. Appl. Artif. Intell. 2021, 100, 104190. [Google Scholar] [CrossRef] [Scilit]
- Ding, X.T.; Li, Q.D.; Cheng, Y.Q.; Wang, J.B.; Bian, W.X.; Jie, B. Local keypoint-based Faster R-CNN. Appl. Intell. 2020, 50, 3007–3022. [Google Scholar] [CrossRef] [Scilit]
- Sapkota, R.; Flores-calero, M.; Qureshi, R.; Badgujar, C.; Nepal, U.; Poulose, A.; Zeno, P. YOLO advances to its genesis: A decadal and comprehensive review of the You Only Look Once (YOLO) series. Artif. Intell. Rev. 2025, 58, 274. [Google Scholar] [CrossRef] [Scilit]
- Zhang, Y.; Ye, M.; Zhu, G.Y.; Liu, Y.; Guo, P.Y.; Yan, J.H. FFCA-YOLO for Small Object Detection in Remote Sensing Images. IEEE Trans. Geosci. Remote Sens. 2024, 62, 5611215. [Google Scholar] [CrossRef] [Scilit]
- Xu, D.; Wu, Y. MRFF-YOLO: A Multi-Receptive Fields Fusion Network for Remote Sensing Target Detection. Remote Sens. 2020, 12, 3118. [Google Scholar] [CrossRef] [Scilit]
- Zhou, J.R.; Chen, M.Y.; Zhang, M.; Zhang, Z.; Zhang, Y.; Wang, M.J. Improved YOLOv8 for multi-colored apple fruit instance segmentation and 3D localization. Artif. Intell. Agric. 2026, 16, 381–396. [Google Scholar] [CrossRef] [Scilit]
- Wang, H.; Qin, Q.R.; Chen, L.; Li, Y.C.; Cai, Y.F. RTMDet-MGG: A Multi-Task Model With Global Guidance. IEEE Trans. Intell. Transp. Syst. 2024, 25, 16791–16804. [Google Scholar] [CrossRef] [Scilit]
- Wang, H.; Qin, Q.R.; Chen, L.; Li, Y.C.; Cai, Y.F. RTMDet-R: A Robust Instance Segmentation Network for Complex Traffic Scenarios. IEEE Trans. Intell. Transp. Syst. 2025, 26, 8834–8847. [Google Scholar] [CrossRef] [Scilit]
- Open MMLab. MMDetection. Available online: https://github.com/open-mmlab/mmdetection/ (accessed on 16 March 2026).
- Lyu, C.; Zhang, W.; Huang, H.; Zhou, Y.; Wang, Y.; Liu, Y.; Zhang, S.; Chen, K. RTMDet: An Empirical Study of Designing Real-Time Object Detectors. In Proceedings of the 2022 IEEE/CVF Conference on Computer Vision and Pattern Recognition (CVPR 2022), New Orleans, LA, USA, 21–24 June 2022. [Google Scholar]
- Redmon, J.; Farhadi, A. YOLO9000: Better, faster, stronger. In Proceedings of the 2017 IEEE/CVF Conference on Computer Vision and Pattern Recognition (CVPR 2017), Honolulu, HI, USA, 21–26 July 2017; pp. 7263–7271. [Google Scholar]
- Redmon, J.; Farhadi, A. YOLOv3: An Incremental Improvement. arXiv 2018, arXiv:1804.02767. [Google Scholar] [CrossRef] [Scilit]
- Ultralytics. YOLOv5. Available online: https://github.com/ultralytics/yolov5 (accessed on 16 March 2026).
- Jocher, G.; Chaurasia, A.; Qiu, J. YOLO by Ultralytics. 2023. Available online: https://github.com/ultralytics/ultralytics (accessed on 16 March 2026).
- Wang, C.Y.; Yeh, I.; Liao, H.Y. YOLOv9: Learning What You Want to Learn Using Programmable Gradient Information. arXiv 2024, arXiv:2402.13616. [Google Scholar] [CrossRef] [Scilit]
- Hendrycks, D.; Gimpel, K. A Baseline for Detecting Misclassified and Out-of-Distribution Examples in Neural Networks. In Proceedings of the 5th International Conference on Learning Representations (ICLR 2017), Toulon, France, 24–26 April 2017. [Google Scholar]
- Liang, S.; Li, Y.; Srikant, R. Enhancing the Reliability of Out-of-distribution Image Detection in Neural Networks. In Proceedings of the 6th International Conference on Learning Representations (ICLR 2018), Vancouver, BC, Canada, 30 April–3 May 2018. [Google Scholar]
- Liu, W.; Wang, X.; Owens, J.; Li, Y. Energy-based Out-of-distribution Detection. In Proceedings of the 34th International Conference on Neural Information Processing System (NeurIPS 2020), Vancouver, BC, Canada, 6–12 December 2020; pp. 21464–21475. [Google Scholar]


Disclaimer/Publisher’s Note: The statements, opinions and data contained in all publications are solely those of the individual author(s) and contributor(s) and not of MDPI and/or the editor(s). MDPI and/or the editor(s) disclaim responsibility for any injury to people or property resulting from any ideas, methods, instructions or products referred to in the content. |
© 2026 by the authors. Licensee MDPI, Basel, Switzerland. This article is an open access article distributed under the terms and conditions of the Creative Commons Attribution (CC BY) license.