


Highlights
What are the main findings?
- We propose an environment-aware cooperative UAV swarm surveillance framework that jointly optimizes visual coverage and recognition accuracy in dynamic urban environments.
- By integrating spatiotemporal density prediction with multi-agent reinforcement learning, the proposed method consistently outperforms representative baseline methods in simulation.
What are the implications of the main findings?
- The results suggest that predictive environmental awareness can significantly improve decentralized UAV swarm coordination for aerial video surveillance.
- The proposed framework provides a practical approach for smart-city surveillance applications that require balancing wide-area monitoring with reliable visual analytics.
Abstract
UAV swarms provide a flexible sensing platform for smart-city crowd surveillance, but cooperative aerial monitoring remains challenging due to dynamic pedestrian distributions, partial observability, and the trade-off between visual coverage and recognition accuracy. In particular, flying at higher altitudes increases the field of view but reduces recognition accuracy, while low-altitude flight improves visual quality at the cost of limited coverage. To address these challenges, this paper proposes an environment-aware cooperative navigation framework that integrates spatiotemporal density prediction with multi-agent reinforcement learning. The surveillance area is modeled as a spatiotemporal graph, where sparse and partial UAV observations are used to predict future pedestrian-density maps and confidence intervals. The predicted density and uncertainty, together with empirical recognition error, UAV position, flight height, battery state, and historical observations, are incorporated into MARL-based policy learning. The learned policy enables UAVs to cooperatively adjust movement and altitude decisions under the centralized training and decentralized execution paradigm. Extensive simulations in UAV-based crowd surveillance environments demonstrate that the proposed framework achieves a more favorable coverage–error trade-off than representative heuristic, prediction-based, single-agent reinforcement learning, and multi-agent reinforcement learning baselines. The results show that prediction-aware and accuracy-aware cooperation improves pedestrian-level surveillance performance under dynamic and partially observable crowd distributions.
1. Introduction
Crowd surveillance in urban environments—monitoring pedestrian flows, detecting crowd anomalies, and ensuring public safety—is a critical application that demands continuous, wide-area, and accurate visual monitoring. Traditional fixed-infrastructure approaches, such as CCTV networks, are constrained by static viewpoints and limited spatial coverage, making them ill-suited for monitoring dynamically shifting crowd distributions. Unmanned Aerial Vehicles (UAVs) have emerged as a compelling alternative, offering high mobility, flexible deployment, and adaptive viewpoints for crowd surveillance [1,2]. By forming a cooperative swarm, multiple UAVs can collaboratively monitor large urban areas and respond to spatiotemporally varying crowd densities in real time.
However, effective UAV-based crowd surveillance faces two fundamental challenges. First, crowd distributions are highly dynamic: pedestrian densities vary across space and time, and individual UAVs can only observe a limited portion of the environment at any moment, resulting in partial observability of the crowd state. Second, there is an inherent trade-off between surveillance coverage and recognition accuracy. As illustrated in Figure 1, UAVs flying at higher altitudes can cover larger areas but with reduced image resolution and lower recognition accuracy, while lower altitudes improve recognition at the cost of a smaller field of view. These two challenges are tightly coupled in crowd surveillance—dense crowd regions demand both frequent revisits and high recognition accuracy, yet no single UAV can simultaneously maximize coverage and accuracy across the entire area. Therefore, the UAV swarm must infer future crowd distributions from sparse observations and coordinate navigation and altitude decisions to collectively balance coverage and accuracy.
Figure 1.
Recognition accuracy and coverage area at different UAV flight heights. A higher flight height enlarges the field of view but reduces recognition accuracy. The reported accuracy values are obtained from calibration experiments in the simulated UAV surveillance environment.
Despite the practical importance of crowd surveillance, existing UAV-based studies have not fully addressed this density-aware and accuracy-aware surveillance setting. UAV crowd monitoring and target-allocation methods mainly focus on target assignment, visiting-sequence planning, or multimodal data collection [3,4], and usually treat coverage as geometric visibility rather than pedestrian-level effective recognition. MARL-based UAV navigation methods have been studied for target tracking, cooperative search, communication coverage, and energy-related objectives [5,6,7], but they generally focus on discrete targets or geometric regions instead of continuously varying pedestrian densities. Spatiotemporal prediction and graph-based methods can infer missing or future states from sparse observations [8,9], but they are often used as standalone prediction models or policy encoders, rather than as prediction-aware environmental modules for closed-loop UAV swarm navigation. Therefore, existing methods do not jointly consider future density prediction, prediction uncertainty, flight-height-dependent recognition error, and cooperative movement and altitude decisions, making them insufficient for balancing coverage and recognition accuracy in dynamic crowd surveillance.
In this paper, we address these gaps by focusing specifically on crowd surveillance as the target application. We study how to maximize visual coverage and recognition accuracy of pedestrians in dynamic urban environments using a cooperative UAV swarm. The mobility and density variations of pedestrians introduce environmental uncertainty that affects UAV navigation decisions. To address this, we utilize spatiotemporal graphs to predict pedestrian crowd density from sparse and partial UAV observations, and employ MARL to learn a cooperative navigation policy that enables the UAV swarm to balance coverage and accuracy across the monitored area. The main contributions of this paper are summarized as follows:
- We formulate cooperative UAV swarm surveillance as a density-aware aerial video monitoring problem that jointly optimizes pedestrian-level visual coverage and recognition accuracy. Different from conventional area-coverage or target-tracking formulations, our formulation explicitly models the coupling between UAV flight height, field of view, pedestrian density, and recognition error.
- We design a spatiotemporal graph-based density prediction module to infer future crowd-density distributions from sparse and partial UAV observations. The module further estimates prediction uncertainty through confidence intervals, enabling the UAV swarm to incorporate environmental uncertainty into navigation decisions.
- We develop a MARL-based cooperative navigation framework that integrates predicted density maps, prediction uncertainty, empirical recognition error, UAV position, flight height, and battery state into policy learning. The learned policy enables UAVs to cooperatively adjust both movement directions and flight heights to balance coverage and recognition accuracy.
- We construct a UAV-based aerial surveillance simulation environment and conduct extensive experiments under different time intervals, UAV numbers, flight-height settings, MARL algorithms, and ablation configurations. The results demonstrate that the proposed method achieves a more favorable coverage-error trade-off than representative heuristic, prediction-based, single-agent RL, and MARL baselines.
2. Related Work
This section reviews existing studies on UAV-based video surveillance and crowd monitoring, MARL-based cooperative UAV navigation, and spatiotemporal prediction in autonomous systems.
2.1. UAV-Based Video Surveillance and Crowd Monitoring
UAVs have become an important sensing platform for urban video surveillance due to their high mobility, flexible deployment, and adaptive viewpoints. Compared with fixed surveillance cameras, UAVs can actively adjust their positions to monitor regions of interest from different perspectives, making them suitable for public safety monitoring, traffic observation, and crowd surveillance. Recent drone-view perception studies have provided useful datasets and algorithms for aerial object detection, tracking, and counting. For example, DroneCrowd provides a drone-view benchmark for crowd detection, tracking, and counting [2]. UAVDT further shows that UAV-view perception is affected by factors such as flight altitude, camera view, occlusion, object scale, and camera motion [10]. These studies indicate that UAV-based surveillance is not only a path-planning problem, but also a visual analytics problem where the quality of collected visual information directly affects surveillance effectiveness.
Crowd monitoring is a more specific and challenging UAV surveillance task because pedestrian distributions are highly dynamic and only partially observable from individual UAVs. Existing studies have explored UAV-based crowd detection, human detection, and multi-UAV crowd monitoring. Papaioannidis et al. [11] investigated visual human crowd detection for autonomous UAV safety. De Moraes and De Freitas [3] developed a multi-UAV crowd-monitoring system that allocates moving individuals among UAVs using auction mechanisms. Jiang et al. [4] proposed an air–sky–ground framework for ultralarge-scale crowd monitoring with multimodal data collection. More recently, Tan et al. [12] studied edge-assisted multi-drone crowd anomaly detection and considered viewpoint-related factors in video analytics task assignment.
Although these studies advance UAV-based crowd perception and monitoring, many of them still treat coverage as a geometric or binary concept, i.e., whether a region or target is inside the camera view. This abstraction is insufficient for aerial video surveillance, because a covered region is useful only when the pedestrians in that region can be recognized with acceptable accuracy. In particular, UAV flight height introduces a fundamental coverage–accuracy trade-off: a higher altitude enlarges the field of view but reduces image resolution and recognition accuracy, whereas a lower altitude improves recognition quality but limits the covered area. Existing crowd monitoring and aerial perception studies rarely model the coupling among pedestrian density, UAV flight height, field of view, and recognition error, which limits their ability to support density-aware and accuracy-aware surveillance decisions.
2.2. MARL-Based Cooperative UAV Navigation
Reinforcement Learning (RL) and MARL have been widely adopted for UAV navigation in dynamic and uncertain environments. Existing studies have applied learning-based UAV control to diverse tasks, including age-of-information optimization [13], mobile edge computing [7], target tracking [5], mobile crowdsensing [14], collision avoidance [15], and partially observable communication coverage [16]. These studies show that RL-based methods can improve UAV adaptability when explicit planning models are difficult to obtain.
Several recent works are closely related to UAV-based ground surveillance, target search, and target tracking. Bany Salameh et al. [17] formulated autonomous UAV-based multi-target detection as an MDP and used RL to improve detection performance under battery constraints. Hou et al. [18] proposed a MARL-based UAV swarm method for cooperative target search in large-scale unknown environments by combining local and global information. Xia et al. [19] developed a MARL-aided UAV swarm framework for cooperative target tracking based on historical and current target states. Wei et al. [20] further studied MAPPO-based UAV swarm dynamic target search in three-dimensional scenarios. In addition, some studies have constructed task-oriented simulation environments for UAV surveillance and search. For example, Arranz et al. [21] developed a Unity/ML-Agents-based UAV swarming system for ground surveillance, and Kong et al. [22] built an AirSim-based high-fidelity 3D environment for multi-UAV cooperative target search. Recent transformer-based MARL methods, such as T-MARL [23], have been used to improve the scalability of multi-UAV area coverage by encoding variable UAV and PoI information. However, they mainly focus on communication-oriented coverage and do not consider pedestrian-level visual coverage, height-dependent recognition error, or prediction uncertainty in crowd surveillance.
Although these works improve UAV autonomy in search, detection, tracking, and surveillance simulation, their objectives mainly focus on target discovery, search efficiency, tracking success, collision avoidance, or energy consumption. Crowd-oriented aerial video surveillance has different requirements: UAVs must continuously monitor spatially and temporally varying pedestrian densities rather than a few discrete targets. Moreover, the value of a UAV decision depends not only on whether a region is visited, but also on whether pedestrians can be accurately recognized from the selected flight height. Existing MARL-based UAV search and tracking methods seldom incorporate future pedestrian-density prediction, prediction uncertainty, and flight-height-dependent recognition error into policy learning, making it difficult to jointly balance wide-area coverage and high-fidelity recognition.
2.3. Spatiotemporal Prediction in Autonomous Systems
Spatiotemporal prediction is important for autonomous systems operating in dynamic environments where observations are distributed over both space and time. Spatiotemporal graph neural networks provide a natural modeling tool for such systems by representing spatial regions, sensors, or locations as graph nodes and learning temporal dependencies over graph-structured data. This is highly relevant to UAV surveillance because each UAV can only observe a limited field of view, and the observed regions change continuously as UAVs move.
Prediction under sparse and partial observations has attracted increasing attention. In urban sensing, DroneSense adopts a sparse sensing paradigm to infer the states of unvisited locations from a small number of selected points of interest [8]. More generally, Marisca et al. [24] studied missing-data reconstruction from spatiotemporal graphs with sparse observations. Roth and Liebig [25] investigated forecasting unobserved node states using spatiotemporal graph neural networks. Hu et al. [26] proposed graph neural processes for spatiotemporal extrapolation and uncertainty-aware prediction. These studies show that spatiotemporal graph models can infer missing or future states from limited observations, which is valuable for autonomous systems under partial observability.
Nevertheless, most existing spatiotemporal prediction methods are used as standalone forecasting or imputation models. They usually focus on reconstructing missing values or forecasting future states, while the prediction results are not directly coupled with multi-agent control decisions in a closed-loop surveillance process. Moreover, these methods generally do not consider UAV-specific sensing factors, such as altitude-dependent field of view, empirical recognition errors of aerial video analytics models, and uncertainty caused by sparse aerial observations.
Overall, existing studies have advanced UAV-based crowd perception, cooperative UAV navigation, and spatiotemporal prediction from different perspectives. Nevertheless, our work differs from them in three key aspects. First, unlike UAV-based crowd monitoring and target-allocation methods [3,4], we do not treat coverage as only geometric visibility, but define pedestrian-level effective coverage and model the coupling among density, flight height, field of view, and recognition error. Second, unlike MARL-based UAV search and tracking methods [18,19,20], our goal is not discrete target discovery or tracking, but continuous density-aware crowd surveillance under partial observability. The learned policy therefore incorporates predicted density, prediction uncertainty, empirical recognition error, UAV state, and altitude decisions. Third, unlike standalone spatiotemporal graph prediction methods [24,25,26] or general graph-based RL methods, the graph module in our framework is not used only for forecasting or as a policy/communication encoder. Existing graph-RL methods usually use graphs to aggregate raw observations from agents, targets, regions, or communication links before action selection, whereas our spatiotemporal graph module is used for environment inference: it predicts future pedestrian-density maps and uncertainty from sparse UAV observations, and provides the prediction results as decision-support information for MARL. Therefore, the proposed framework cannot be directly replaced by existing graph-based RL or density-prediction-plus-navigation methods, because they do not jointly address density-aware prediction, uncertainty-aware cooperation, and height-dependent recognition accuracy in UAV-based crowd surveillance.
3. Problem Definition
This section presents the problem definition for cooperative UAV swarm navigation for video surveillance.
3.1. Main Notation
We illustrate the system overview in Figure 2. The UAV swarm for video surveillance consists of a set of UAVs denoted by , where is the number of UAVs. The set of available control actions for each UAV, , includes moving forward (), moving backward (), moving left (), moving right (), ascending (), descending (), hovering (), and charging (). Each UAV has a camera that captures ground imagery and analyzes video content in real time using a DNN model. The UAVs cooperatively monitor a specified area to detect pedestrians on the ground. The surveillance area is divided into a set of equal-sized regions denoted by , where is the number of regions. The densities of pedestrians in different regions change spatially and temporally due to the mobility of pedestrians. The number of pedestrians in region at time slot t is denoted as .
Figure 2.
The system overview of cooperative UAV swarm navigation for aerial video surveillance. The central communication node is used for observation synchronization and density-prediction information sharing, rather than centralized action control. During execution, each UAV selects its action using its local actor network under the CTDE framework.
We assume that the UAVs can fly at a set of discrete height levels denoted by . For each height level , the camera FoV of a UAV can cover regions. The current height level of UAV u at time slot t is denoted as . Typically, a higher height level allows a UAV to cover more regions but leads to lower recognition accuracy. Ground conditions, such as buildings, trees, and occlusions, may further affect recognition accuracy, causing UAVs to exhibit different recognition performance across regions even at the same height level. We denote the calibrated average recognition accuracy for region at height level as , and define the corresponding empirical recognition error as
In practice, can be obtained through an offline calibration process before deployment. Specifically, UAV-view images are collected at different height levels and representative regions, and the onboard visual analytics model is evaluated by comparing the detected pedestrian numbers with manually labeled ground truth, fixed-camera observations, or high-confidence low-altitude UAV observations. For each region–height pair, the average recognition accuracy is computed from the calibration samples, and the empirical recognition error is derived as . During deployment, this calibrated error profile can be further updated using overlapping observations from multiple UAVs or periodically verified samples.
We consider a discrete-time system, where time is denoted by . At each time slot t, each UAV makes control decisions for navigation. We assume that the speeds of the UAVs for horizontal and vertical movement are fixed. The UAVs can move regions horizontally or levels vertically within a time slot. The UAVs capture video frames for video analytics at each time slot to detect pedestrians on the ground. The varying densities of pedestrians in different regions result in various levels of importance to the UAVs, influencing the navigation decisions of the UAV swarms. The UAV swarm navigates the surveillance area to optimize the following performance metrics.
3.2. Performance Metrics
We consider two performance metrics in UAV-based video surveillance: coverage rate and error rate. Due to the changes in the environment, we assume that the information captured by a UAV remains valid for an interval of H time slots. The cooperative UAV swarm video surveillance aims to maximize the coverage rate while minimizing the error rate within the specified interval. In this work, visual coverage refers to pedestrian-level effective coverage rather than only geometric area coverage. A pedestrian is considered visually covered when they appear within the field of view of at least one UAV and can be recognized by the onboard visual analytics model. Recognition accuracy denotes the reliability of the visual analytics model in detecting and recognizing pedestrians from UAV-view images, which depends on the UAV flight height and the observed region.
Definition 1
(Coverage Rate). The coverage rate is defined as the percentage of well-recognized pedestrians by the UAV swarm within the past valid H time slots, relative to the total number of unique pedestrians appearing in the surveillance area.
We assume that the number of unique pedestrians appearing in the whole surveillance area during the past H time slots at time slot t is . The number of unique pedestrians that have been well-recognized by the UAV swarm at time slot is . The coverage ratio of the UAV swarm at time slot t is
Definition 2
(Error Rate). The error rate is the ratio of unrecognized or wrongly recognized pedestrian by the UAV swarm within their coverage area during a valid time horizon to the actual number of pedestrian in the UAVs’ coverage area.
The error rate indicates the percentage of pedestrians captured by the UAV swarm’s cameras that were not successfully recognized. We denote the actual number of unique pedestrians within the coverage of the UAV swarm at time slot as . The error rate at time slot t is calculated as
4. Method
This section presents the method for learning the optimal policy of UAV swarm navigation for video surveillance.
4.1. Model Overview
We design a cooperative UAV swarm navigation framework that integrates spatiotemporal density prediction with MARL-based decision-making. As shown in Figure 3a, the framework consists of a density prediction module and an actor–critic MARL module. The prediction module estimates the next-slot crowd-density map and its confidence interval from sparse UAV observations, and these outputs are used as environmental cues for policy learning.
Figure 3.
Overview of the proposed prediction-aware UAV swarm crowd surveillance framework. (a) Actor–critic architecture. The actor outputs legal actions from local observations, UAV states, historical observations, empirical recognition errors, and prediction cues, while the critic uses global information only during centralized training. (b) Closed-loop workflow. UAVs collect observations, synchronize records, predict density and uncertainty, construct MARL states, execute actions, and receive rewards. Arrows denote data flows and workflow sequences; colors distinguish modules and data types.
The overall workflow follows a closed-loop perception–prediction–decision process, as shown in Figure 3b. UAVs collect sparse observations, update historical records, predict future density and uncertainty, construct MARL states, select legal movement or altitude actions, and then receive new observations and rewards after environment updates.
We adopt the CTDE paradigm. The centralized critic is used only during training, while each UAV selects actions using its local actor network during execution. The central communication node is used only for observation synchronization and prediction-result sharing, rather than centralized action control.
4.2. Density Map Prediction Under Partial Observation
At each time slot, each UAV observes only a limited portion of the surveillance area due to its restricted camera FoV, so the UAV swarm obtains sparse and partial observations of the global pedestrian density distribution. Since high-density regions usually require more frequent and accurate monitoring, future crowd-density information is important for cooperative navigation. To infer such information under partial observation, we design a density prediction module based on the Spatiotemporal Point Inference Network (SPIN) [24]. Given historical observations from time slot to time slot t, the module predicts the global pedestrian density map and its uncertainty at the next time slot . The predicted density map and uncertainty are then incorporated into the MARL state for cooperative UAV navigation.
The embedded inputs of the prediction module are
where , , and denote historical sparse density observations, empirical recognition-error sequences, and spatiotemporal covariates, respectively. The observation mask and adjacency matrix A are used as auxiliary variables for valid-observation selection and spatial aggregation, rather than as independent embedding branches.
Let denote the set of regions covered by UAV u at time slot . For each region , the observation mask is defined as
The mask vector at time slot is denoted by
The sparse density observation vector at time slot is denoted by
If region b is observed by at least one UAV, is set as the corresponding pedestrian counting result. If multiple UAVs observe the same region, the observation with the smallest empirical recognition error is used, since the best-quality observation can be selected for video analytics. If region b is not observed, is set to 0 as a placeholder. The mask therefore enables the prediction model to distinguish an actual zero-density observation from a zero-filled unobserved region.
The empirical recognition-error sequence is derived from the calibrated region-height error profile defined in Section 3.1. If region b is covered by UAV u at height level , its empirical observation error is given by . If multiple UAVs cover the same region, the smallest empirical error is used. For uncovered regions, the error is set to a maximum value to indicate unobservability. Thus, the empirical recognition-error vector at time slot is defined as
The vector represents the reliability of the sparse density observations under different regions, height levels, and visual conditions.
The spatiotemporal covariates provide positional and temporal information for each region. We denote the covariate matrix at time slot as
where is the covariate feature of region b at time slot , and is the feature dimension. In our implementation, includes the normalized spatial coordinate of region b and the temporal encoding of time slot .
The graph adjacency matrix represents the spatial dependency among surveillance regions. It is constructed according to the static spatial layout of the monitored area. Let be the Euclidean distance between the centers of regions i and j, and let be a predefined neighborhood threshold. The unnormalized edge weight is defined as
where controls the distance decay. The adjacency matrix is then row-normalized as
For a given surveillance map, is fixed during training and execution. The graph structure is not dynamically updated; instead, time-varying information is represented by the observation sequence , the empirical error sequence , the covariate sequence , and the mask sequence .
Figure 4 shows the architecture of the improved SPIN-based density prediction module. Compared with the original SPIN model, we make two task-specific modifications for UAV-based aerial surveillance. First, we introduce an empirical recognition-error embedding branch to explicitly model the reliability of UAV observations, which is affected by region-specific visual conditions and UAV flight height. Second, we adopt quantile regression at the output layer, so that the model can provide both a point estimate of the future density map and a confidence interval that reflects uncertainty. These two modifications allow the prediction module to better support downstream UAV navigation decisions under partial observability and recognition errors.
Figure 4.
Improved SPIN-based density prediction module. Sparse observations, covariates, and empirical errors are embedded and processed with mask-guided and graph-based aggregation to output multi-quantile next-slot density predictions.
The three input branches are first projected into the same hidden space and fused as
where , , and denote the sparse-observation embedding function, empirical recognition-error embedding function, and covariate embedding function, respectively. The fused representation is then processed by the spatiotemporal point inference network:
where STCA denotes the spatiotemporal cross-attention module and TSA denotes the temporal self-attention module. The STCA module uses to select valid historical observations and uses to aggregate information from spatially related regions. The TSA module further captures temporal dependencies of each region across the historical window.
The encoded representation is fed into an MLP to generate multi-quantile density predictions:
The 0.5-quantile output is used as the predicted density map:
The 0.1- and 0.9-quantile outputs are used to construct the confidence interval of the predicted density:
For region b, the interval represents the confidence range of the predicted future pedestrian number. A wider interval indicates lower prediction confidence and higher prediction uncertainty, which usually occurs when the region has sparse historical observations or large empirical recognition errors.
During training, the simulator provides the complete ground-truth density map as supervision. However, the complete map is used only as the training target and is not provided to the prediction model as input. Following the imputation setting, the prediction loss is computed on the unobserved or masked regions, so that the model is encouraged to infer missing pedestrian densities rather than simply reproduce the observed values. Let denote the binary indicator of whether region b is unobserved or masked at the target time slot . For a ground-truth value , a quantile prediction , and a quantile level , the quantile loss is defined as
The masked multi-quantile prediction loss is then defined as
where is the ground-truth pedestrian number of region b at time slot . This masked loss encourages the model to infer the next-slot pedestrian density of unobserved or masked regions from sparse historical observations, empirical recognition errors, spatiotemporal covariates, and spatial dependencies. During execution, the complete ground-truth density map is not required; the trained model directly predicts and from online UAV observations.
The outputs of the density prediction module are used by the subsequent MARL-based navigation module. The predicted density map provides prior information about potential high-density regions, while the confidence interval indicates the reliability of the prediction. By incorporating both terms into the UAV state, the learned policy can make decisions based not only on current local observations but also on future crowd-density estimates and their uncertainty.
4.3. Cooperative UAV Swarm Navigation by MARL
In this work, we formulate the cooperative UAV navigation problem as a MARL problem, where each UAV is modeled as an agent. At each time slot t, UAV u observes its local state and selects an action . The joint action of all UAVs affects the shared surveillance environment, and all UAVs are optimized according to the same team reward. We adopt the CTDE framework: the critic uses the global state during training, while each UAV selects actions based only on its local state and the shared actor network during execution. The problem of cooperative UAV swarm navigation for video surveillance can be modeled as a Decentralized Partially Observable Markov Decision Process (Dec-POMDP), where each UAV acts as an agent that collaborates with others. Each UAV only partially observes the environment and makes navigation decisions based on local information. The state, action, and reward are specified as follows.
4.3.1. State
At each time slot, different UAVs observe different parts of the environment. The local state of UAV at time slot t is denoted as . The actor for each agent determines the control action based on the local state, which includes the following components:
- UAV Position (): The position of UAV u includes its horizontal coordinate and height level, which are used for positioning and collision avoidance. The spatial coordinate of UAV u is denoted as , and its current height level is denoted as . Thus, the UAV position is represented as .
- Object Density in FoV (): The object density in the FoV of UAV u refers to the number of pedestrians in each region covered by the UAV at the end of time slot . We use a fixed-size vector where each element represents the observed number of pedestrians in a region within the UAV’s FoV. The number of regions covered by the FoV changes with the height level. If the number of regions within the FoV is smaller than the fixed vector size, the remaining entries are padded with zeros.
- Total Object Number (): the total number of pedestrian within the FoV of UAV u at the end of time slot .
- Empirical Recognition Error in FoV (): the empirical recognition-error vector for regions within the FoV of UAV u at its current height level . Each element is obtained from the calibrated region-height error profile . If multiple UAVs cover the same region, the smallest empirical error is used for that region.
- UAV ID (): the ID of UAV u represented by one-hot encoding.
- Remaining Battery Life (): the remaining flight time of UAV u.
- Density Map Prediction ( and ): the predicted number of pedestrians in each region for the next time slot and the corresponding confidence interval generated by the spatiotemporal graph model.
- Historical Observation (): the most recent observed number of pedestrians in each region by UAV u. Each region is updated based on the latest available observation.
4.3.2. Action
At each time slot t, each UAV selects one high-level control action from the discrete action set according to its local state . The action space used in the MARL policy is the same as that defined in Section 3.1:
where , , , and denote moving forward, moving backward, moving left, and moving right, respectively; and denote ascending and descending; denotes hovering; and denotes charging. The four horizontal movement actions move the UAV to the corresponding adjacent grid cell in the surveillance area, while the ascending and descending actions change the UAV flight height by one discrete height level.
The feasible action set of UAV u at time slot t is denoted by . It is determined by the high-level feasibility constraints of the discrete navigation model, including the surveillance boundary, allowable flight-height range, battery constraint, charging-location constraint, predefined building/obstacle constraints, and potential inter-UAV collision constraints between UAVs. Before action sampling, infeasible actions are masked out, and the policy distribution is renormalized over . The UAV then selects its action from the legal action set. This action-masking mechanism avoids invalid high-level movements during training and execution.
4.3.3. Reward
We use a shared reward function, which is the sum of the rewards of all UAVs during a time slot, to foster collaboration and enhance overall performance. The reward for the UAV swarm considers two factors: coverage rate and error rate. The coverage rate reward incentivizes UAVs to conduct intensive surveillance over dense areas, capturing more pedestrians within the valid H time slots. The error rate penalty encourages UAVs to adjust their flight height, enhancing surveillance accuracy in regions with higher densities and keeping a balance between coverage and accuracy. The total reward for the UAV swarm during time slot t, , is calculated as a weighted sum of these two components,
where is the tuning weight of these two components. The reward weight controls the trade-off between coverage maximization and recognition-error reduction. A smaller encourages wider coverage but may increase recognition error, while a larger penalizes recognition errors more strongly but may reduce coverage. In this work, we set as the default value based on the sensitivity study in Section 5.1.3, where it provides a balanced coverage-error trade-off.
4.4. Training Algorithm
The cooperative navigation policy is trained using MAPPO [27] under the CTDE framework. MAPPO is used as the policy optimization backbone, while the main contribution of this work lies in the density-aware and accuracy-aware MARL formulation rather than modifying the MAPPO objective. Specifically, the policy learns from predicted density, prediction uncertainty, empirical recognition error, UAV state, and flight-height information, and is optimized by the coverage–accuracy-aware reward (Equation (20)).
To reduce the training instability caused by simultaneously learning density prediction and navigation policies, we adopt a two-stage training strategy. In the first stage, the spatiotemporal prediction network is pre-trained offline using historical simulation data, so that it can provide stable next-slot density estimation before policy learning. In the second stage, the cooperative navigation policy is trained with MAPPO. During this stage, the prediction network is used as a state-augmentation module that provides and for the MARL policy. This design avoids drastic changes in both the prediction module and the policy network at the same time, thereby improving training stability.
At each time slot t, UAV u constructs its local state according to Section 4.3.1. The shared actor network takes as input and outputs a categorical distribution over the discrete action space . During training, the global state is constructed by aggregating the local states and observation information from all UAVs, together with the predicted density map and confidence interval. The centralized critic network takes as input and estimates the state value. During execution, the critic is removed, and each UAV selects its action only according to its own local state and the shared actor network.
The PPO importance sampling ratio for UAV u is defined as
where is used to denote the policy ratio, avoiding conflict with , which denotes the remaining battery life in the UAV state. The actor network is updated by maximizing the clipped surrogate objective:
where is the advantage estimate computed by Generalized Advantage Estimation (GAE), is the PPO clipping parameter, is the entropy coefficient, and denotes the policy entropy. The entropy term encourages exploration during training.
The critic network is updated by minimizing the value estimation error:
where is the discounted cumulative return computed from the shared team reward. Since all UAVs optimize the same surveillance objective, a shared team reward is used to encourage cooperative behavior. Parameter sharing is adopted among all UAV actors, which improves training efficiency and allows the learned policy to scale to different numbers of UAVs.
We use action masking to improve feasibility during training and execution. Before sampling, actions that violate surveillance boundaries, flight-height limits, battery or charging constraints, obstacle constraints, or potential inter-UAV collision constraints are masked out, and the policy distribution is renormalized over legal actions.
We also adopt a discrete-time high-level navigation model. At each time slot, a UAV moves to an adjacent grid cell or height level and then collects observations. Intermediate frames during the short transition are not separately used for MARL state updates, so that observation, density prediction, and action decision remain synchronized at the time-slot level.
The complete training procedure is summarized in Algorithm 1. The algorithm first pre-trains the density prediction network and then trains the MAPPO policy using the predicted density map and confidence interval as part of the UAV state.
| Algorithm 1 Cooperative UAV Swarm Navigation for Crowd Surveillance | |
| Require: | Surveillance environment, number of UAVs , number of training episodes , prediction window length T, prediction network , actor network , critic network , effective time window H |
| Ensure: | Trained actor and critic parameters and |
| |
4.5. Network Architecture and Hyperparameters
The actor and critic networks follow the same backbone structure but use different inputs and output heads. The actor network takes the local state of UAV u as input and outputs a probability distribution over the discrete action space. The critic network takes the global state as input and outputs a scalar state-value estimate. Both networks consist of an MLP encoder, a gated recurrent unit (GRU), and an MLP output module. The MLP encoder maps the input state into a hidden representation with a hidden dimension of 128, the GRU captures short-term temporal dependencies caused by UAV movement and crowd dynamics, and the final MLP maps the hidden feature to either action probabilities or a state-value estimate. The actor parameters are shared by all UAVs to improve training efficiency and scalability, while the UAV identity encoding in enables the shared policy to distinguish different UAVs.
The spatiotemporal prediction network follows the architecture described in Section 4.2. It takes the historical sparse density observations, empirical recognition-error sequence, and spatiotemporal covariates as embedded inputs, and uses the observation mask and graph adjacency matrix as auxiliary variables for attention aggregation. In our implementation, the prediction network contains spatiotemporal inference layers with a hidden dimension of . The embedding functions and projection MLPs in the prediction network are implemented as two-layer MLPs with 32 hidden units and ReLU activation functions. The prediction network is trained using Adam with a learning rate of . A cosine learning-rate scheduler is adopted with a warm-up of 12 steps and restarts every 100 epochs. The maximum number of pre-training epochs is set to 300, with early stopping on the validation set using a patience of 40 epochs. Each epoch contains 300 mini-batches, and the mini-batch size is set to 8.
For MAPPO training, the maximum number of training steps is set to approximately , and the maximum number of time slots in each episode is 500. The learning rates of both the actor and critic networks are set to . The discount factor is , and the GAE parameter is . The PPO clipping parameter is set to . The entropy coefficient is set to to encourage policy exploration during training. The reward weight is set to according to the sensitivity analysis reported in Section 5.1.3, where this setting provides a balanced trade-off between coverage maximization and recognition-error reduction. Unless otherwise specified, the same hyperparameter settings are used for all learning-based methods to ensure a fair comparison.
5. Performance Evaluation
5.1. Experimental Setting
The experiments are conducted in a simulation environment because the proposed task requires closed-loop UAV swarm interaction, including controllable UAV actions, flight-height changes, battery states, crowd-density observations, and online reward feedback. The simulation environment also provides complete and time-synchronized ground truth, including full pedestrian-density maps, region-level pedestrian numbers, and coverage/recognition status over time, which are difficult to obtain in real-world UAV surveillance, especially for regions outside UAV fields of view. Public UAV-view datasets such as VisDrone [28] and DroneCrowd [2] are valuable for evaluating aerial detection, tracking, and counting, but they are offline perception datasets and do not provide controllable multi-UAV actions, altitude-changing trajectories, online reward feedback, or future environment states after UAV decisions. We acknowledge that the current simulation experiments cannot fully verify real-world applicability and generalization capability. Therefore, the results should be viewed as controlled closed-loop validation, while future work will further evaluate the framework using digital-twin environments, hardware-in-the-loop tests, real UAV platforms, and public UAV-view datasets for perception-level calibration and domain adaptation.
We implement a simulator for UAV-based video surveillance with Unreal Engine 5. We consider a pedestrian-street scenario and use pedestrians as the target objects for detection and counting. Figure 5 illustrates the map of the surveillance area and the camera view from a UAV in the simulator. The size of the surveillance area is 465 m × 392 m, and the number of pedestrians in the surveillance area is time-varying, ranging from 4500 to 5100.
Figure 5.
Simulation environment.
To simulate real-world pedestrian movement, the pedestrians in the simulator will select POIs to visit based on certain probabilities. In our simulation environment, the surveillance area is divided into regions. The horizontal flight speed of the UAV is set to 6 m/s, and the vertical speed is set to 3 m/s. The duration of a time slot is 3 s, during which the UAV can move one grid horizontally or change one level in height. The penalty weight for error rate is set as 4. In addition to the original surveillance map, we further construct a larger surveillance scenario with a physical size of , which is discretized into regions. This larger scenario is used to examine whether the proposed framework can be applied beyond the original map. Compared with the original setting, it contains more surveillance regions and a more dispersed pedestrian distribution, making density prediction and cooperative UAV navigation more challenging. The same UAV motion model, flight-height levels, recognition-error calibration procedure, baseline methods, and evaluation metrics are used for both maps. For the density prediction module, training samples are generated from multiple simulated crowd scenarios with different random seeds, rather than from a single fixed crowd trajectory. This setting improves the diversity of the training data and reduces the dependence of the prediction model on one specific pedestrian evolution pattern. We adopt the Crowd Localization Transformer (CLTR) [29] for pedestrian detection and counting. CLTR is highly effective in crowd localization, as it predicts head positions with precision, making it especially suitable for UAV-based scenarios that typically involve a top-down camera view. The UAV heights can be set at 18 m, 27 m, 36 m, and 45 m, corresponding to coverage areas of 36 m × 36 m, 54 m × 54 m, 72 m × 72 m, and 90 m × 90 m, respectively. To ensure a fair comparison, all methods are evaluated under the same simulation environment, pedestrian generation process, UAV motion constraints, candidate flight heights, camera FoV model, recognition-error calibration, and evaluation metrics. Unless otherwise specified, the default setting uses four UAVs and a valid time interval of time slots. All methods share the same legal action space defined in Section 3.1, including horizontal movement, ascending, descending, hovering, and charging; the difference among methods lies only in how actions are selected. For RW and RRW, UAVs randomly select legal actions, including altitude-changing actions. For FP and RS, the UAVs follow fixed-position or scanning strategies, and the corresponding fixed-height settings are evaluated consistently. For PED, UAVs are scheduled according to the predicted density map. For learning-based baselines, the same local observation and reward definitions are used as in our method, while the learning paradigm differs between single-agent and multi-agent settings. To account for stochasticity in pedestrian movement, UAV initialization, policy training, and policy execution, each experiment is repeated over multiple independent runs with different random seeds. The reported results are presented as mean ± standard deviation. In all figures, error bars denote one standard deviation across independent runs. This protocol allows us to quantify the variability of different methods and provides a more reliable basis for comparing their performance trends.
5.1.1. Evaluation Metrics
We evaluate the performance of UAV-based video surveillance using two key metrics: coverage rate and error rate. The coverage rate measures the UAV swarm’s effectiveness in monitoring and detecting pedestrians across specified time intervals in the surveillance area, while the error rate assesses the accuracy of the swarm in correctly identifying pedestrians within the FoV of UAV cameras.
5.1.2. Baseline Methods
We compare the proposed method with three groups of baselines to evaluate different aspects of the framework: heuristic navigation methods, prediction-based navigation methods, and learning-based methods.
The heuristic navigation methods include the following baselines.
- Random Walk (RW): Each UAV randomly selects its actions and navigates within the surveillance area.
- Regional Random Walk (RRW): The surveillance area is divided into equal-sized regions, with each UAV randomly navigating within its assigned region.
- Fixed Position (FP): The UAVs are evenly distributed at predetermined locations within the surveillance area.
- Regional Scanning (RS): The surveillance area is divided into several equal-sized regions, each assigned to one UAV. Each UAV scans the blocks within its assigned region in sequence.
The prediction-based baseline is defined as follows.
- Prediction-based Method (PED): The spatiotemporal network is adopted to predict the density map, scheduling the UAVs to areas with the highest density.
The learning-based baselines include both single-agent RL methods and multi-agent RL methods.
- Single-Agent RL Methods (DQN, PPO): Each UAV is modeled as an independent agent, and the RL algorithm makes sequential decisions for each UAV by transforming the multi-agent task into a series of single-agent tasks. The algorithms for learning the policy include DQN [30] and PPO [31].
- Multi-Agent RL Methods (MADDPG, IPPO, MAPPO, T-MARL): To evaluate MARL-based cooperative navigation, we compare MAPPO with MADDPG, IPPO, and T-MARL. All MARL algorithms use the same density prediction module, state representation, action space, reward function, UAV motion constraints, and evaluation metrics. This controlled comparison helps evaluate the effects of different MARL optimization algorithms and a recent transformer-based policy encoder under the same density-aware surveillance formulation.
For a fair comparison, all methods are evaluated under the same simulation environment, UAV number, flight-height levels, motion constraints, battery setting, camera FoV model, recognition-error calibration, legal action space, and evaluation metrics. RW and RRW randomly select legal actions, including horizontal movement, ascending, descending, hovering, and charging; therefore, their flight heights change randomly during execution. For FP and PED, we report the best-performing fixed-height setting among the candidate height levels, which provides stronger baseline results. For RS, besides the best-performing result used in the main comparison, we also present its results under different fixed heights (18 m, 27 m, 36 m, and 45 m) to analyze the sensitivity of the scanning strategy to the coverage–accuracy trade-off. To account for stochasticity in pedestrian movement, UAV initialization, policy training, and policy execution, each experiment is repeated over multiple independent runs with different random seeds, and the reported results are presented as mean ± standard deviation.
It should be noted that general graph-based RL methods are not treated as directly comparable baselines in this section. In most graph-RL or graph-MARL methods, graphs are mainly used as policy or communication encoders to aggregate raw observations before action selection. In contrast, the graph module in our framework is used for spatiotemporal environment inference, predicting future density maps and uncertainty from sparse UAV observations. Therefore, our baseline design focuses on comparing heuristic navigation, density-prediction-guided navigation, single-agent RL, and different MARL optimizers under the same surveillance formulation.
5.1.3. Performance Comparison
To evaluate the performance of various methods across different valid time intervals H, we measure the coverage rate and error rate using intervals set at H = 5 (15 s), H = 10 (30 s), H = 15 (45 s), and H = 20 (60 s). The reported results are obtained from multiple independent runs in the same simulation scenario, rather than from a single run. In each run, the random seed affects pedestrian movement, UAV initialization, and stochastic action selection. Unless otherwise specified, each method is evaluated over 5 independent runs, and the results are reported as mean ± standard deviation. This repeated-run protocol is used to reduce the influence of randomness and provide a more reliable comparison among different navigation strategies. Figure 6 illustrates the coverage rate and error rate for each method under different valid intervals.
Figure 6.
Coverage and error rates on the original surveillance map under different valid intervals. Error bars denote one standard deviation.
As shown in Figure 6, the coverage rate of all methods increases over time. This is because longer valid intervals account for a larger coverage area in the past, which affects the coverage rate. Our method can consistently outperform the other baselines under different intervals, particularly at H = 20 (60 s), where its coverage rate exceeds 0.4. RW, RRW, and FP demonstrate lower coverage rates and higher error rates, reflecting their limitations in effectively managing complex navigation tasks. RS achieves acceptable coverage and error rates, with performance only slightly surpassed by PED among the baseline methods. This is because RS regularly scans each region in the surveillance area in sequence. PED outperforms other heuristic methods in coverage rate across various valid intervals, with performance gains increasing as the interval lengthens. This indicates that integrating density map prediction for navigation can significantly enhance overall performance.
The performance of single-agent algorithms, such as DQN and PPO, falls between that of heuristic methods and our proposed method. As the valid time intervals increase, DQN and PPO exhibit only marginal performance improvements, though their error rates remain lower than those of most heuristic methods. This is because each UAV learns its policy independently, without collaboration among the UAVs, and it cannot maximize the overall performance of the UAV swarm. Experimental results indicate that with larger valid time intervals, our method achieves a higher coverage ratio. It outperforms baseline methods in both coverage and error rates, demonstrating the effectiveness of using MARL for UAV swarm navigation in video surveillance.
Figure 7 reports the performance comparison on the larger surveillance map. Compared with the original setting, the absolute coverage rates decrease because the monitored area contains more regions and the pedestrians are more spatially dispersed. Nevertheless, the proposed method still achieves the best coverage-error trade-off under all valid time intervals. For example, when , our method achieves a coverage rate of , which is higher than the best baseline result of . Meanwhile, our method obtains an error rate of , which is lower than the best baseline error rate of . These results show that the proposed framework is not tied to the original surveillance map and remains effective in a larger surveillance scenario.
Figure 7.
Coverage and error rates on the larger surveillance map under different valid intervals. Error bars denote one standard deviation.
Table 1 reports the sensitivity analysis of the reward weight under the setting of with 4 UAVs. The results show that increasing gradually reduces the error rate but also slightly decreases the coverage rate. The performance is stable within a moderate range, and achieves a balanced trade-off between coverage and recognition error. Therefore, we use as the default setting in the remaining experiments.
Table 1.
Sensitivity of coverage and error rates to the reward weight under with 4 UAVs on the original 25 × 25 surveillance map.
5.1.4. Comparison of MARL Algorithms
Table 2 and Table 3 compare MADDPG, IPPO, MAPPO, and T-MARL under different valid time intervals and different UAV numbers. MADDPG, IPPO, and MAPPO are used to compare different MARL optimization algorithms, while T-MARL is included as a recent transformer-based MARL baseline with a Transformer-based policy encoder for multi-UAV coordination. All MARL algorithms use the same density prediction module, state representation, action space, reward function, UAV motion constraints, and evaluation metrics. MAPPO achieves higher coverage rates in most settings while maintaining comparable error rates. T-MARL achieves slightly better performance than MADDPG and IPPO in most settings, but it is still generally inferior to MAPPO. These results indicate that MAPPO provides a more favorable coverage-error trade-off for cooperative UAV swarm navigation under the proposed density-aware and accuracy-aware surveillance formulation.
Table 2.
Coverage and error rates of different MARL algorithms under valid time intervals H = 5, 10, 15, and 20 with 4 UAVs on the original 25 × 25 surveillance map.
Table 3.
Coverage and error rates of different MARL algorithms under different UAV swarm sizes with H = 10 on the original 25 × 25 surveillance map.
5.1.5. RS with Different Fixed Heights
Table 4 reports the coverage rates of RS under different fixed flight heights. The results show that the performance of RS is sensitive to the selected height. Although RS-27m achieves the best coverage among the fixed-height RS variants, it is still clearly outperformed by the proposed dynamic-height method. This demonstrates that adaptive height adjustment is beneficial for balancing field-of-view coverage and recognition quality under changing crowd distributions.
Table 4.
Coverage rates of regional scanning with different fixed flight heights under valid time intervals H = 5, 10, 15, and 20 on the original 25 × 25 surveillance map.
5.1.6. Impact of UAV Number
We evaluate the impact of varying UAV numbers on performance by evaluating coverage and error rates in swarms of 3 to 6 UAVs. As shown in Figure 8 and Figure 9, all methods improve coverage rate with more UAVs, but error rate trends varied. This is because a larger UAV swarm can cover more areas; however, the error rate is not directly affected by the number of UAVs.
Figure 8.
Coverage rate under different numbers of UAVs.
Figure 9.
Error rate under different numbers of UAVs.
RW and RRW show minimal coverage gains and continue to exhibit high error rates, highlighting their limitations in UAV swarm navigation. RS significantly outperforms these methods by increasing coverage rate while maintaining lower error rates, indicating more stable performance. FP improves coverage with additional UAVs but faces higher error rates in complex environments due to its inability to dynamically adjust flight height. PED shows substantial increases in both coverage and error rates, demonstrating strong adaptability and scalability, closely matching the performance of our method. Single-agent RL methods like PPO and DQN improve coverage rates but show limited scalability as the UAV number increases, with error rates initially rising and then declining, highlighting challenges in larger-scale deployment due to the lack of UAV cooperation. Although the error rate of PPO is slightly lower than that of our method, its coverage rate is significantly lower. Our method can improve coverage rates as UAV numbers increase and consistently achieve superior performance, with error rates decreasing as UAVs are added. This demonstrates that our method can enhance swarm cooperation with more UAVs.
5.1.7. Dense Region Valid Visit Count
To validate our method’s effectiveness, we present the valid visit count of dense regions during the specified time interval (H = 10) in Figure 10. A region is considered dense if the pedestrian number exceeds 25. If a UAV visits a dense region during a time slot and the error rate is below 0.3, it is considered a valid visit. A valid visit is defined as a UAV visit to a dense region with the error rate lower than 0.3. This threshold is selected according to the calibration results of recognition accuracy at different UAV flight heights. The calibrated recognition accuracies at 18 m, 27 m, and 36 m are 94.2%, 85.7%, and 59.5%, corresponding to empirical recognition errors of 0.058, 0.143, and 0.405, respectively. Therefore, an error threshold of 0.3 requires the recognition accuracy to be at least 70%, which excludes observations with clearly degraded recognition quality at high altitude. This threshold is used only for the valid-visit evaluation and is not involved in policy training.
Figure 10.
Dense region visit count during the specified interval.
The dense-region threshold is selected based on the empirical distribution of region-level pedestrian counts in the simulated surveillance environment. According to our statistical analysis, regions with no less than 25 pedestrians approximately correspond to the top 5% high-density regions in the map, which can represent clear crowd-gathering areas with high surveillance demand. A smaller threshold would include more regions as dense regions, while a larger threshold would focus on more crowded regions. We also checked nearby threshold values and observed that the relative performance trend among different methods remains stable, indicating that the conclusion is not sensitive to this specific threshold. As shown in Figure 10, our method achieves a much higher visit count compared with baselines, which also increases with the number of UAVs. This demonstrates that our method is environmentally aware and effectively coordinates UAV swarms to monitor dense regions more intensively and accurately.
5.1.8. Ablation Study
We conduct an ablation study to analyze the contribution of the two configurable environmental inputs introduced in Section 4: the predicted density map and the confidence interval. In the full model, both the predicted density map and the confidence interval are included in the augmented MARL state. To isolate their effects, we construct three ablation variants. In w/o confidence interval, the predicted density map is kept, but the confidence interval is removed from the MARL state. In w/o density map, the confidence interval is kept, but the predicted density map is removed from the MARL state. In w/o all predictions, both the predicted density map and the confidence interval are removed, so the UAVs rely only on local observations, historical observations, empirical recognition errors, and UAV states. For all variants, the action space, reward function, UAV constraints, training algorithm, and other network settings are kept unchanged.
The ablation study is conducted under the setting of H = 10 with 4 UAVs. Each variant is evaluated over 5 independent runs with different random seeds, and the results are reported as mean ± standard deviation in Table 5.
Table 5.
Ablation study of prediction-related inputs under with 4 UAVs on the original surveillance map. The 95% confidence intervals are computed from five independent runs using the Student’s t interval.
Table 5 shows that the full model achieves the best overall performance, with the highest coverage rate and the lowest error rate. This result indicates that the predicted density map and confidence interval provide complementary decision-support information for UAV swarm navigation.
The predicted density map mainly affects where UAVs should move. It provides future crowd-distribution information and helps UAVs move toward potential high-density regions before these regions are directly observed. When the predicted density map is removed, UAVs rely more on local and historical observations and may respond more slowly to density changes in dense regions. As a result, the error rate increases from 26.37% to 27.65%. This suggests that density prediction helps UAVs allocate surveillance resources to regions with higher future monitoring demand.
The confidence interval mainly affects how UAVs make decisions under prediction uncertainty. A wider interval indicates lower prediction confidence, which usually occurs in sparsely observed regions or regions with larger observation errors. By incorporating this uncertainty information, UAVs can better distinguish reliable high-density predictions from uncertain regions. When the confidence interval is removed, the coverage rate decreases from 29.68% to 28.28%, showing that uncertainty information helps improve cooperative coverage planning under partial observability.
When both prediction-related inputs are removed, UAVs cannot use either future density information or uncertainty information. They therefore obtain the lowest coverage rate, 27.36%. This result further confirms that prediction-aware environmental information is important for cooperative UAV navigation in dynamic and partially observable crowd surveillance.
To further examine the reliability of these trends, we report approximate 95% confidence intervals in Table 5. For coverage rate, the confidence interval of the full model does not overlap with that of w/o all predictions, showing a clear improvement from using prediction-related inputs. The interval of w/o confidence interval only slightly overlaps with that of the full model, suggesting a relatively stable positive effect of uncertainty information. The interval of w/o density map overlaps with that of the full model, so its coverage difference is interpreted as a performance trend rather than a statistically clear improvement. For error rate, the confidence intervals of different variants overlap, so we interpret the error-rate changes as trends rather than overclaiming statistical significance. Overall, the ablation results indicate that the predicted density map and confidence interval jointly improve density-aware and uncertainty-aware UAV swarm surveillance.
5.1.9. Evaluation on Energy Consumption and Computational Cost
To further evaluate deployment-related efficiency, we report energy consumption, convergence behavior, and inference latency under the representative setting of with 4 UAVs on the original surveillance map. Although coverage rate and error rate are the primary metrics for the proposed surveillance task, energy consumption and computational cost are also important for practical UAV deployment.
Energy consumption is measured in battery units according to the battery model used in the simulation environment, where a fully charged UAV has 100 battery units. For one episode, we report the average cumulative per-UAV battery consumption of the UAV swarm, which is defined as
where denotes the battery units consumed by UAV u at time slot t. This metric first accumulates the positive battery consumption of each UAV during one episode and then averages it over all UAVs in the swarm. Therefore, it measures cumulative energy usage rather than the final remaining battery level. If a UAV performs charging during an episode, the cumulative consumption may exceed 100 battery units, while charging replenishment is not counted as negative consumption. Table 6 reports the average cumulative per-UAV battery consumption of different methods. The proposed method consumes less battery than most active navigation methods and maintains energy usage comparable to the energy-efficient baselines. Together with the coverage and error-rate results reported above, this indicates that the performance improvement of the proposed method is not obtained by simply consuming more battery, but by making more effective cooperative navigation decisions.
Table 6.
Average cumulative per-UAV battery consumption per episode under H = 10 with 4 UAVs on the original 25 × 25 surveillance map.
For convergence behavior, we evaluate the learning-based methods using the average training reward curve. As shown in Figure 11, the proposed method achieves a more stable reward improvement and reaches a higher reward level than the learning-based baselines. This is mainly due to the combination of MAPPO-based centralized training and the prediction-enhanced state representation. The centralized critic improves cooperative policy optimization during training, while the prediction-enhanced state provides additional environmental information under partial observation.
Figure 11.
Training reward curves of learning-based methods under with 4 UAVs.
We further measure the inference latency of the proposed method to evaluate its online computational cost. Inference latency is measured as the average wall-clock time for one online decision step, including density prediction, state construction, and actor action inference and selection. As shown in Table 7, the total latency of the proposed method is ms per decision step on average. The density prediction module accounts for the major computational cost because it performs spatiotemporal attention-based inference over sparse historical observations. Nevertheless, the total latency is still much shorter than the duration of one decision time slot in the considered discrete-time surveillance setting. Therefore, the proposed method remains feasible for online decision making.
Table 7.
Inference latency breakdown of the proposed method under with 4 UAVs.
6. Conclusions
In this paper, we studied cooperative UAV swarm navigation for crowd surveillance, with the goal of improving pedestrian-level visual coverage while reducing recognition errors in dynamic urban environments. Motivated by the practical importance of crowd surveillance in scenarios such as pedestrian streets and large-scale public gatherings, we proposed an environment-aware cooperative navigation framework that integrates spatiotemporal graph-based density prediction with MARL-based cooperative navigation. The density prediction module estimates future pedestrian crowd distributions from sparse and partial UAV observations and provides uncertainty information via confidence intervals, while the MARL policy enables UAVs to cooperatively adjust their positions and flight heights according to the predicted crowd state. Experimental results on both the original and the larger surveillance maps demonstrate that the proposed method achieves a more favorable coverage-error trade-off than representative heuristic, prediction-based, single-agent RL, and MARL baselines.
This work has several limitations that point to future research directions. First, this work focuses on high-level cooperative navigation and does not model low-level obstacle avoidance, which is treated as a separate layer of the UAV control stack and is outside the scope of this paper; incorporating safety-constrained motion planning and dynamic obstacle avoidance for real-world deployment is an important direction for future work. Second, the current evaluation is conducted in simulation, and further real-world validation is needed to assess its applicability and generalization capability. Although simulation enables controlled closed-loop evaluation, it cannot fully capture practical deployment factors such as communication latency, packet loss, GPS or localization errors, sensor noise, adverse weather conditions, and hardware constraints. These factors may affect observation synchronization, FoV-to-region mapping, density-prediction reliability, recognition accuracy, and multi-UAV coordination. In future work, we will extend the framework with latency-aware information sharing, robust localization, sensor fusion, online recognition-error calibration, and safety-constrained coordination, and further evaluate it in digital-twin environments, hardware-in-the-loop tests, and real UAV platforms. Third, this paper focuses on pedestrian-oriented crowd surveillance, and extending the framework to multiple object categories would require type-specific density prediction, recognition-error modeling, and priority-aware reward design, which we leave for future investigation. Finally, communication efficiency, energy consumption, and onboard inference latency will also be considered to support practical deployment of cooperative UAV swarm crowd surveillance systems.
Author Contributions
Conceptualization, Y.L., W.W. and Y.H.; methodology, Y.L.; software, Y.L. and Z.F.; validation, Z.F., X.X. and D.T.; formal analysis, Y.L. and G.G.; investigation, D.T. and G.G.; resources, W.W. and Y.H.; data curation, Z.F.; writing—original draft preparation, Y.L.; writing—review and editing, Y.L., W.W. and Y.H.; visualization, Y.L. and X.X.; supervision, W.W. and Y.H.; project administration, W.W. and Y.H. All authors have read and agreed to the published version of the manuscript.
Funding
This research received no external funding.
Data Availability Statement
The original contributions presented in this study are included in the article. Further inquiries can be directed to the corresponding authors.
Conflicts of Interest
Xueyong Xu is employed by North Information Control Research Academy Group Co., Ltd. The authors declare that the research was conducted in the absence of any commercial or financial relationships that could be construed as a potential conflict of interest.
References
- Aloqaily, M.; Hussain, R.; Khalaf, D.; Slehat, D.; Oracevic, A. On the role of futuristic technologies in securing UAV-supported autonomous vehicles. IEEE Consum. Electron. Mag. 2022, 11, 93–105. [Google Scholar] [CrossRef] [Scilit]
- Wen, L.; Du, D.; Zhu, P.; Hu, Q.; Wang, Q.; Bo, L.; Lyu, S. Detection, Tracking, and Counting Meets Drones in Crowds: A Benchmark. In Proceedings of the 2021 IEEE/CVF Conference on Computer Vision and Pattern Recognition (CVPR), Nashville, TN, USA, 20–25 June 2021; pp. 7812–7821. [Google Scholar] [CrossRef] [Scilit]
- De Moraes, R.S.; De Freitas, E.P. Multi-UAV based crowd monitoring system. IEEE Trans. Aerosp. Electron. Syst. 2020, 56, 1332–1345. [Google Scholar] [CrossRef] [Scilit]
- Jiang, Y.; Miao, Y.; Alzahrani, B.; Barnawi, A.; Alotaibi, R.; Hu, L. Ultra large-scale crowd monitoring system architecture and design issues. IEEE Internet Things J. 2021, 8, 10356–10366. [Google Scholar] [CrossRef] [Scilit]
- Moon, J.; Papaioannou, S.; Laoudias, C.; Kolios, P.; Kim, S. Deep reinforcement learning multi-UAV trajectory control for target tracking. IEEE Internet Things J. 2021, 8, 15441–15455. [Google Scholar] [CrossRef] [Scilit]
- Bilal, H.; Aslam, M.S.; Tian, Y.; Ullah, I.; Ayouni, S.; Vasilakos, A.V. A Consumer Electronics-Enhanced UAV System for Agricultural Farm Tracking with Fuzzy SMO and Actuator Fault Detection Control Algorithms. IEEE Trans. Consum. Electron. 2025, 71, 6910–6923. [Google Scholar] [CrossRef] [Scilit]
- Wang, L.; Wang, K.; Pan, C.; Xu, W.; Aslam, N.; Hanzo, L. Multi-agent deep reinforcement learning-based trajectory planning for multi-UAV assisted mobile edge computing. IEEE Trans. Cogn. Commun. Netw. 2020, 7, 73–84. [Google Scholar]
- Zhao, D.; Cao, M.; Ding, L.; Han, Q.; Xing, Y.; Ma, H. Dronesense: Leveraging drones for sustainable urban-scale sensing of open parking spaces. In Proceedings of the IEEE INFOCOM 2022-IEEE Conference on Computer Communications, London, UK, 2–5 May 2022; pp. 1769–1778. [Google Scholar]
- Kanzaki, A.; Ito, T. An efficient data gathering method in UAV-collaborative sensing. In Proceedings of the 2024 IEEE International Conference on Consumer Electronics (ICCE), Las Vegas, NV, USA, 6–8 January 2024; pp. 1–6. [Google Scholar]
- Du, D.; Qi, Y.; Yu, H.; Yang, Y.; Duan, K.; Li, G.; Zhang, W.; Huang, Q.; Tian, Q. The unmanned aerial vehicle benchmark: Object detection and tracking. In Proceedings of the European Conference on Computer Vision (ECCV), Munich, Germany, 8–14 September 2018; pp. 370–386. [Google Scholar]
- Papaioannidis, C.; Mademlis, I.; Pitas, I. Autonomous UAV safety by visual human crowd detection using multi-task deep neural networks. In Proceedings of the 2021 IEEE International Conference on Robotics and Automation (ICRA), Xi’an, China, 30 May–5 June 2021; pp. 11074–11080. [Google Scholar]
- Tan, Y.; Li, Q.; Peng, J.; Yuan, Z.; Jiang, Y. Air-cad: Edge-assisted multi-drone network for real-time crowd anomaly detection. In Proceedings of the ACM Web Conference 2024, Singapore, 13–17 May 2024; Association for Computing Machinery: New York, NY, USA, 2024; pp. 2817–2825. [Google Scholar]
- Hu, J.; Zhang, H.; Song, L.; Schober, R.; Poor, H.V. Cooperative internet of UAVs: Distributed trajectory design by multi-agent deep reinforcement learning. IEEE Trans. Commun. 2020, 68, 6807–6821. [Google Scholar] [CrossRef] [Scilit]
- Dai, Z.; Liu, C.H.; Ye, Y.; Han, R.; Yuan, Y.; Wang, G.; Tang, J. AoI-minimal UAV crowdsensing by model-based graph convolutional reinforcement learning. In Proceedings of the IEEE INFOCOM 2022—IEEE Conference on Computer Communications, London, UK, 2–5 May 2022; pp. 1029–1038. [Google Scholar]
- Wang, D.; Fan, T.; Han, T.; Pan, J. A two-stage reinforcement learning approach for multi-UAV collision avoidance under imperfect sensing. IEEE Robot. Autom. Lett. 2020, 5, 3098–3105. [Google Scholar] [CrossRef] [Scilit]
- Ye, Z.; Wang, K.; Chen, Y.; Jiang, X.; Song, G. Multi-UAV navigation for partially observable communication coverage by graph reinforcement learning. IEEE Trans. Mob. Comput. 2023, 22, 4056–4069. [Google Scholar] [CrossRef] [Scilit]
- Bany Salameh, H.; Hussienat, A.; Alhafnawi, M.; Al-Ajlouni, A. Autonomous uav-based surveillance system for multi-target detection using reinforcement learning. Clust. Comput. 2024, 27, 9381–9394. [Google Scholar] [CrossRef] [Scilit]
- Hou, Y.; Zhao, J.; Zhang, R.; Cheng, X.; Yang, L. UAV swarm cooperative target search: A multi-agent reinforcement learning approach. IEEE Trans. Intell. Veh. 2024, 9, 568–578. [Google Scholar] [CrossRef] [Scilit]
- Xia, Z.; Du, J.; Wang, J.; Jiang, C.; Ren, Y.; Li, G.; Han, Z. Multi-agent reinforcement learning aided intelligent UAV swarm for target tracking. IEEE Trans. Veh. Technol. 2022, 71, 931–945. [Google Scholar] [CrossRef] [Scilit]
- Wei, D.; Zhang, L.; Liu, Q.; Chen, H.; Huang, J. UAV swarm cooperative dynamic target search: A MAPPO-based discrete optimal control method. Drones 2024, 8, 214. [Google Scholar] [CrossRef] [Scilit]
- Arranz, R.; Carramiñana, D.; Miguel, G.d.; Besada, J.A.; Bernardos, A.M. Application of deep reinforcement learning to UAV swarming for ground surveillance. Sensors 2023, 23, 8766. [Google Scholar] [CrossRef] [Scilit] [PubMed]
- Kong, X.; Yang, J.; Chai, X.; Zhou, Y. An advantage duPLEX dueling multi-agent Q-learning algorithm for multi-UAV cooperative target search in unknown environments. Simul. Model. Pract. Theory 2025, 142, 103118. [Google Scholar] [CrossRef] [Scilit]
- Chen, D.; Qi, Q.; Fu, Q.; Wang, J.; Liao, J.; Han, Z. Transformer-based reinforcement learning for scalable multi-UAV area coverage. IEEE Trans. Intell. Transp. Syst. 2024, 25, 10062–10077. [Google Scholar] [CrossRef] [Scilit]
- Marisca, I.; Cini, A.; Alippi, C. Learning to reconstruct missing data from spatiotemporal graphs with sparse observations. Adv. Neural Inf. Process. Syst. 2022, 35, 32069–32082. [Google Scholar] [CrossRef] [Scilit]
- Roth, A.; Liebig, T. Forecasting unobserved node states with spatio-temporal graph neural networks. In Proceedings of the 2022 IEEE International Conference on Data Mining Workshops (ICDMW), Orlando, FL, USA, 28 November–1 December 2022; pp. 740–747. [Google Scholar]
- Hu, J.; Liang, Y.; Fan, Z.; Chen, H.; Zheng, Y.; Zimmermann, R. Graph neural processes for spatio-temporal extrapolation. In Proceedings of the 29th ACM SIGKDD Conference on Knowledge Discovery and Data Mining, Long Beach, CA, USA, 6–10 August 2023; pp. 752–763. [Google Scholar]
- Yu, C.; Velu, A.; Vinitsky, E.; Gao, J.; Wang, Y.; Bayen, A.; Wu, Y. The surprising effectiveness of ppo in cooperative multi-agent games. Adv. Neural Inf. Process. Syst. 2022, 35, 24611–24624. [Google Scholar] [CrossRef] [Scilit]
- Du, D.; Zhu, P.; Wen, L.; Bian, X.; Lin, H.; Hu, Q.; Peng, T.; Zheng, J.; Wang, X.; Zhang, Y.; et al. VisDrone-DET2019: The Vision Meets Drone Object Detection in Image Challenge Results. In Proceedings of the 2019 IEEE/CVF International Conference on Computer Vision Workshop (ICCVW), Seoul, Republic of Korea, 27–28 October 2019; pp. 213–226. [Google Scholar] [CrossRef] [Scilit]
- Liang, D.; Xu, W.; Bai, X. An end-to-end transformer model for crowd localization. In European Conference on Computer Vision, Tel Aviv, Israel, 23–27 October 2022; Springer: Cham, Switzerland, 2022; pp. 38–54. [Google Scholar]
- Mnih, V.; Kavukcuoglu, K.; Silver, D.; Graves, A.; Antonoglou, I.; Wierstra, D.; Riedmiller, M. Playing atari with deep reinforcement learning. arXiv 2013, arXiv:1312.5602. [Google Scholar]
- Schulman, J.; Wolski, F.; Dhariwal, P.; Radford, A.; Klimov, O. Proximal policy optimization algorithms. arXiv 2017, arXiv:1707.06347. [Google Scholar]
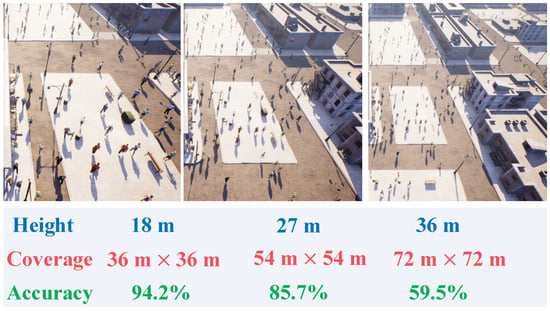
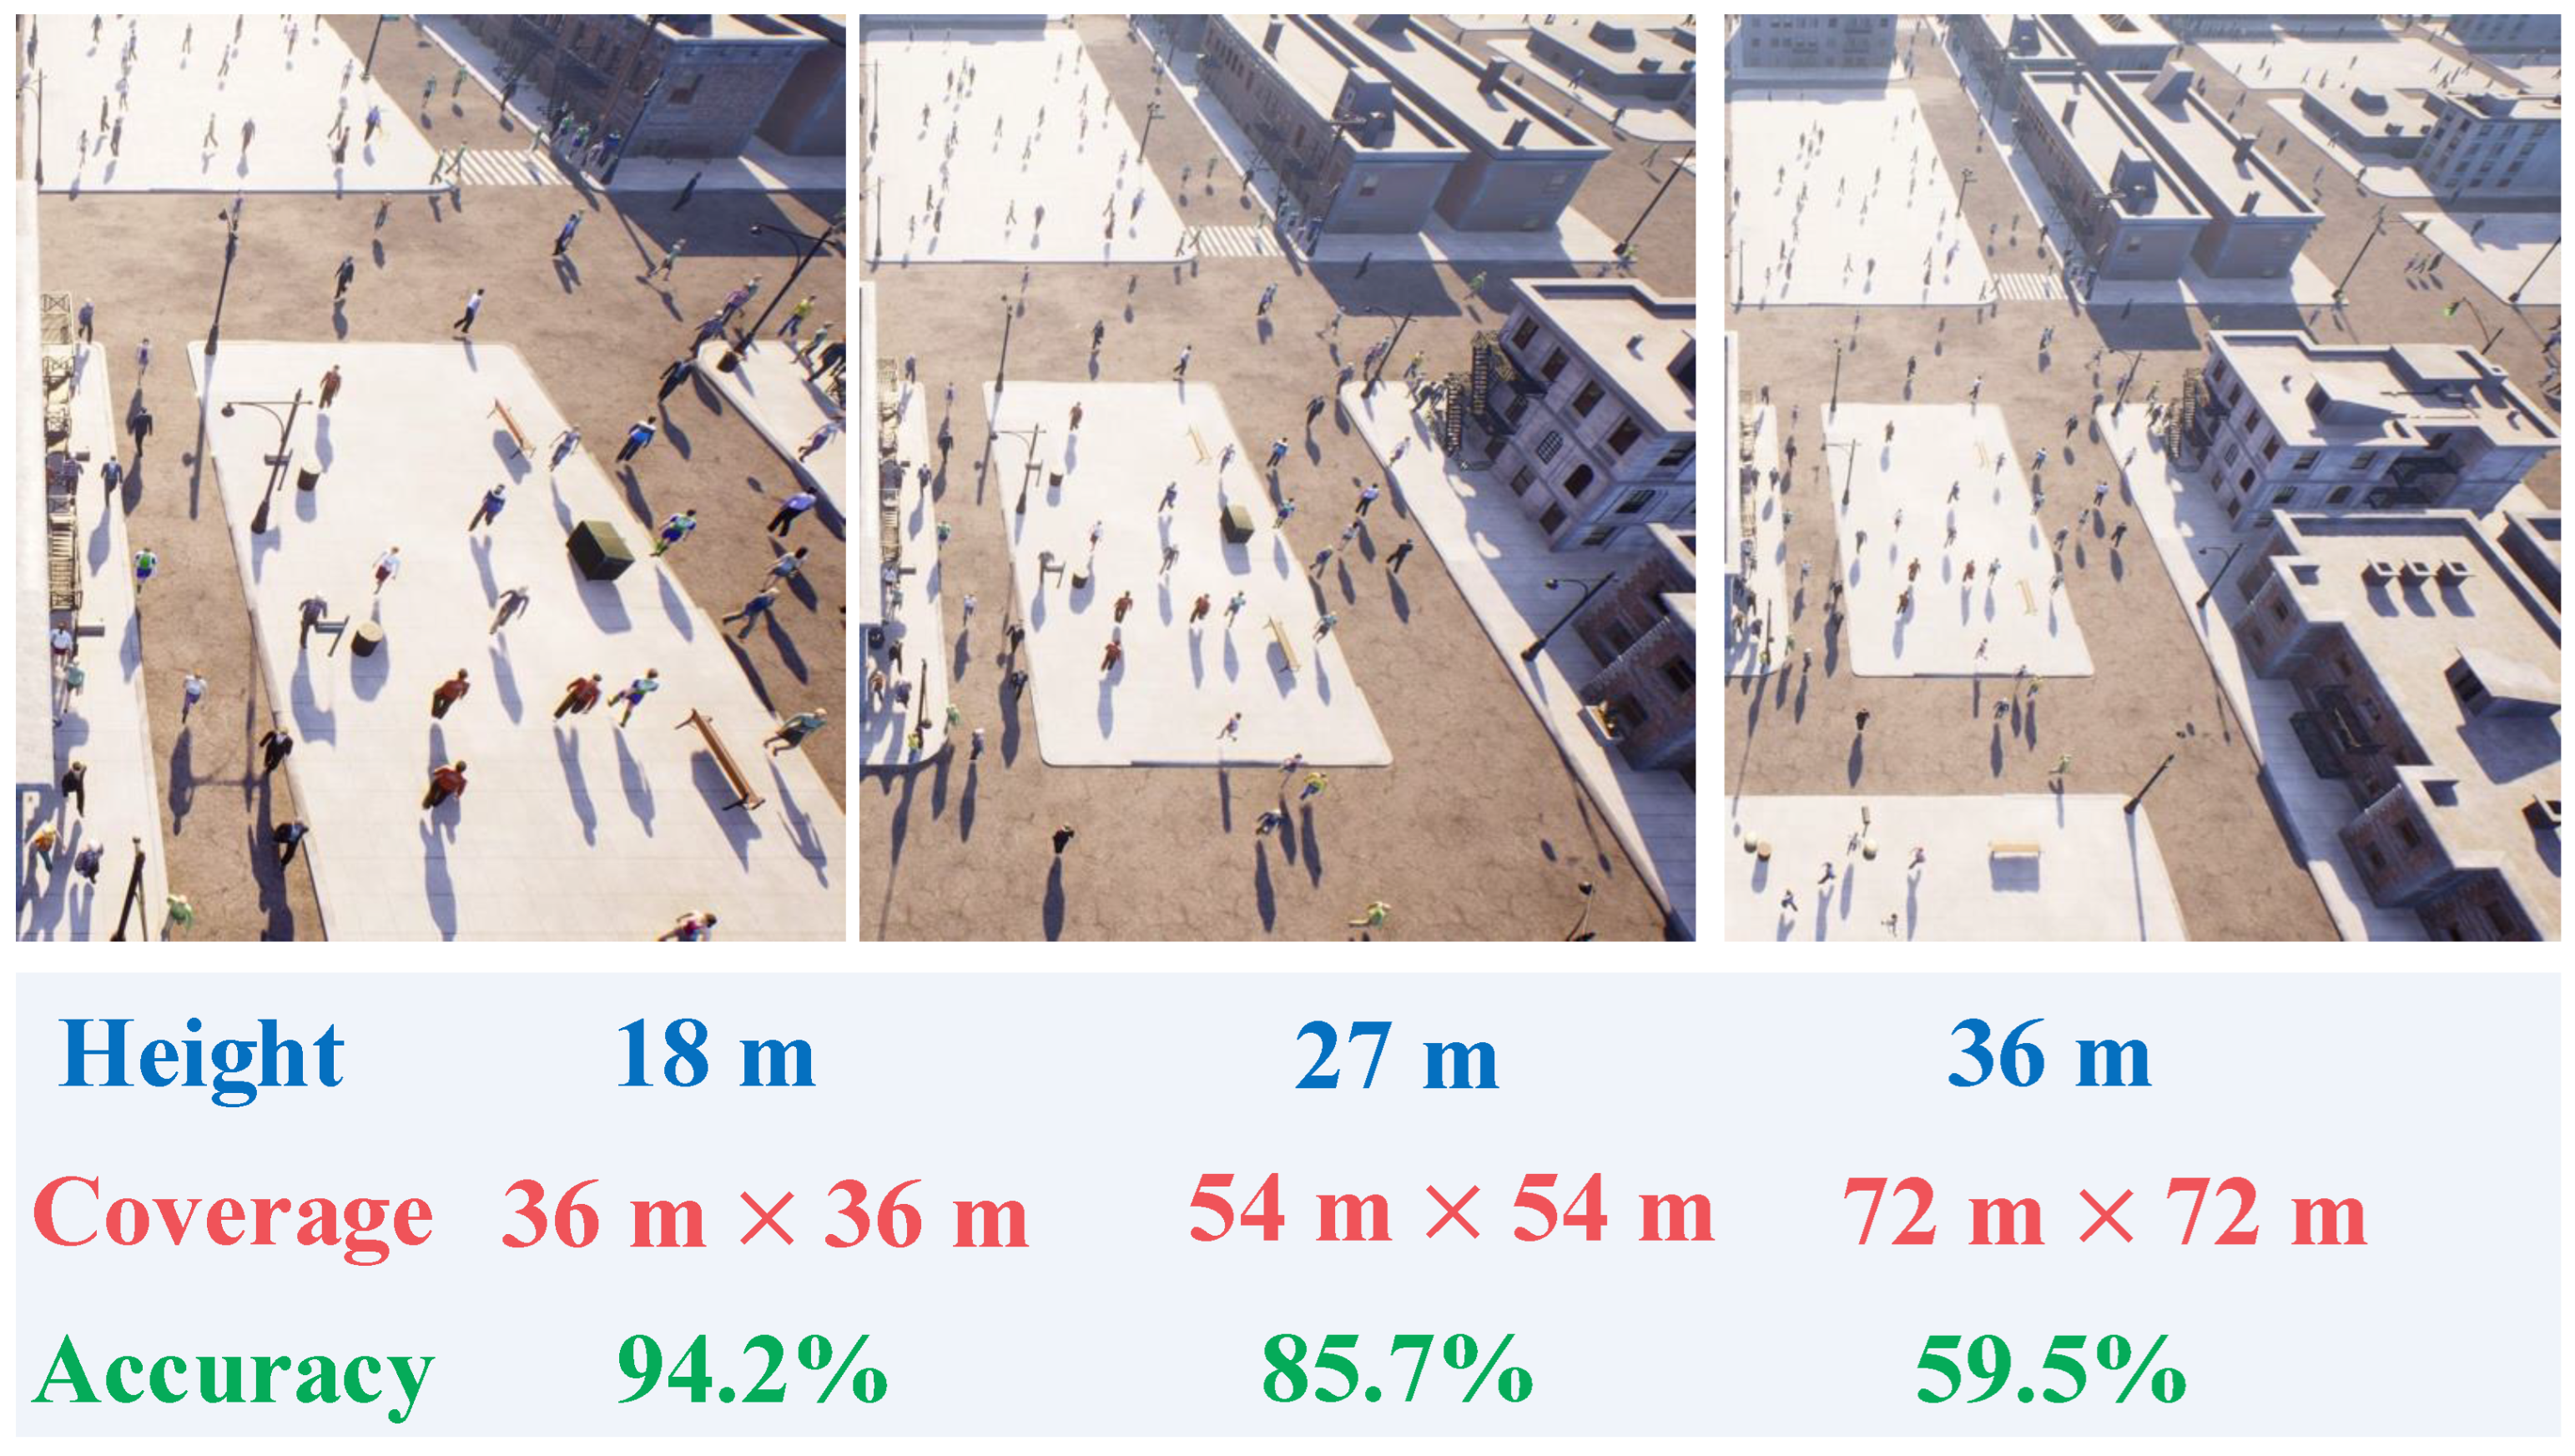
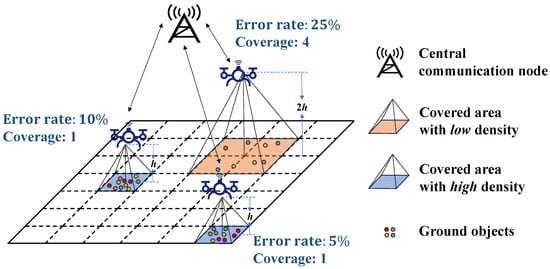
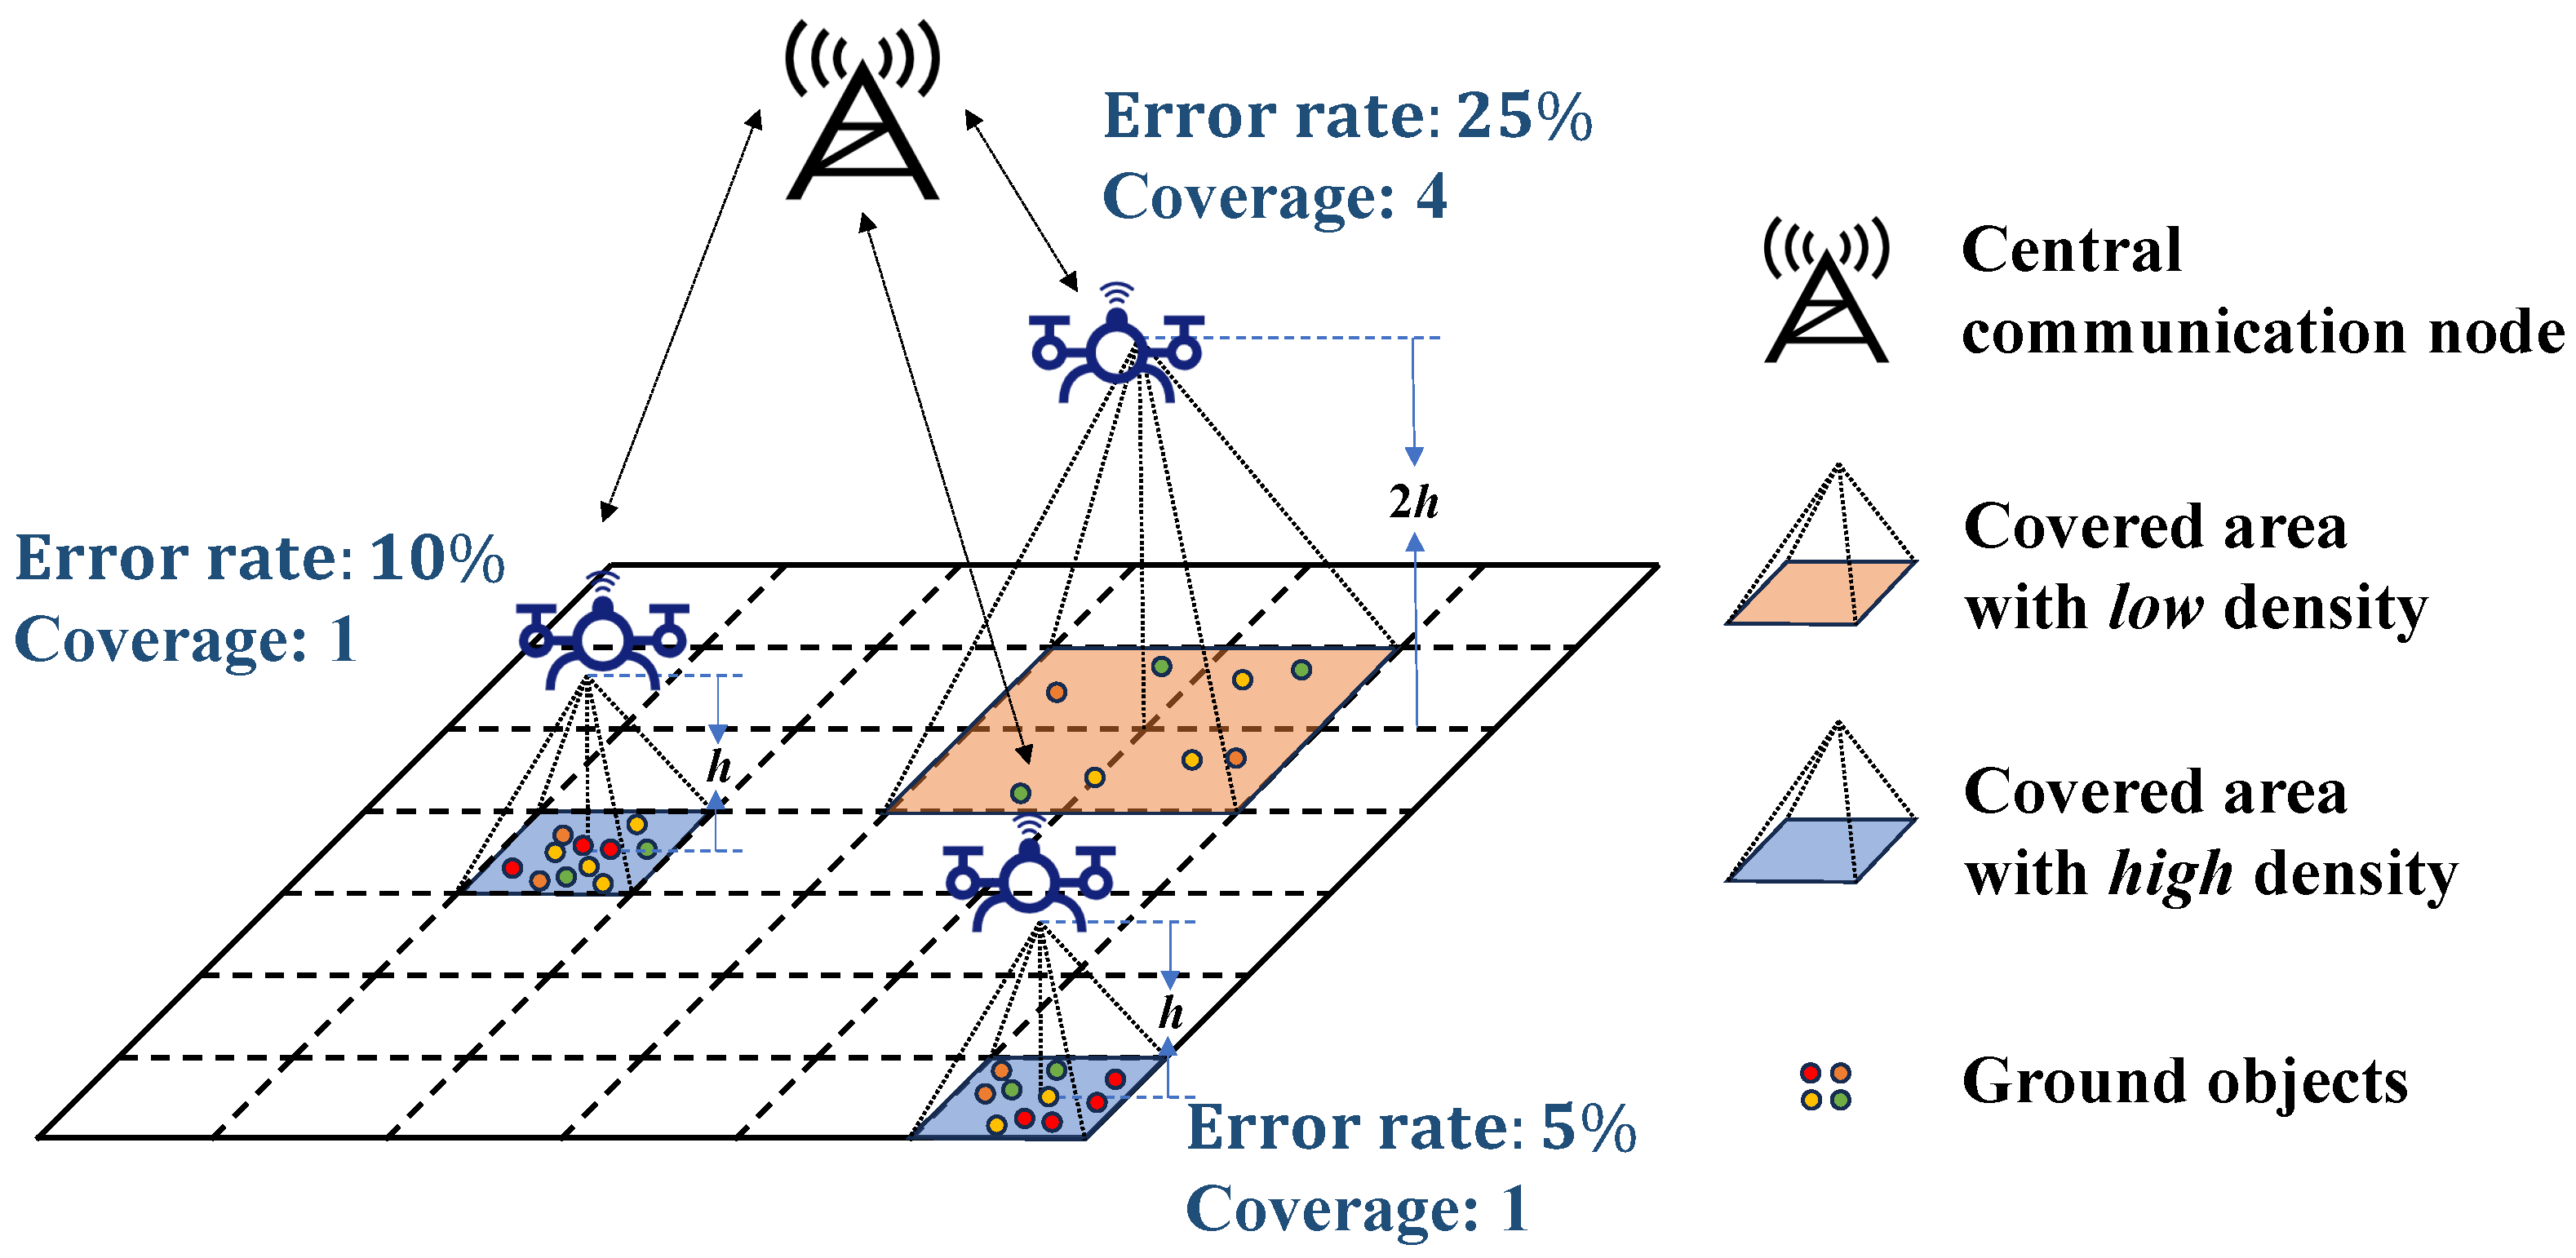
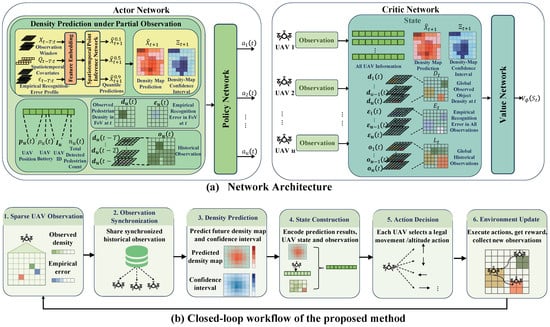
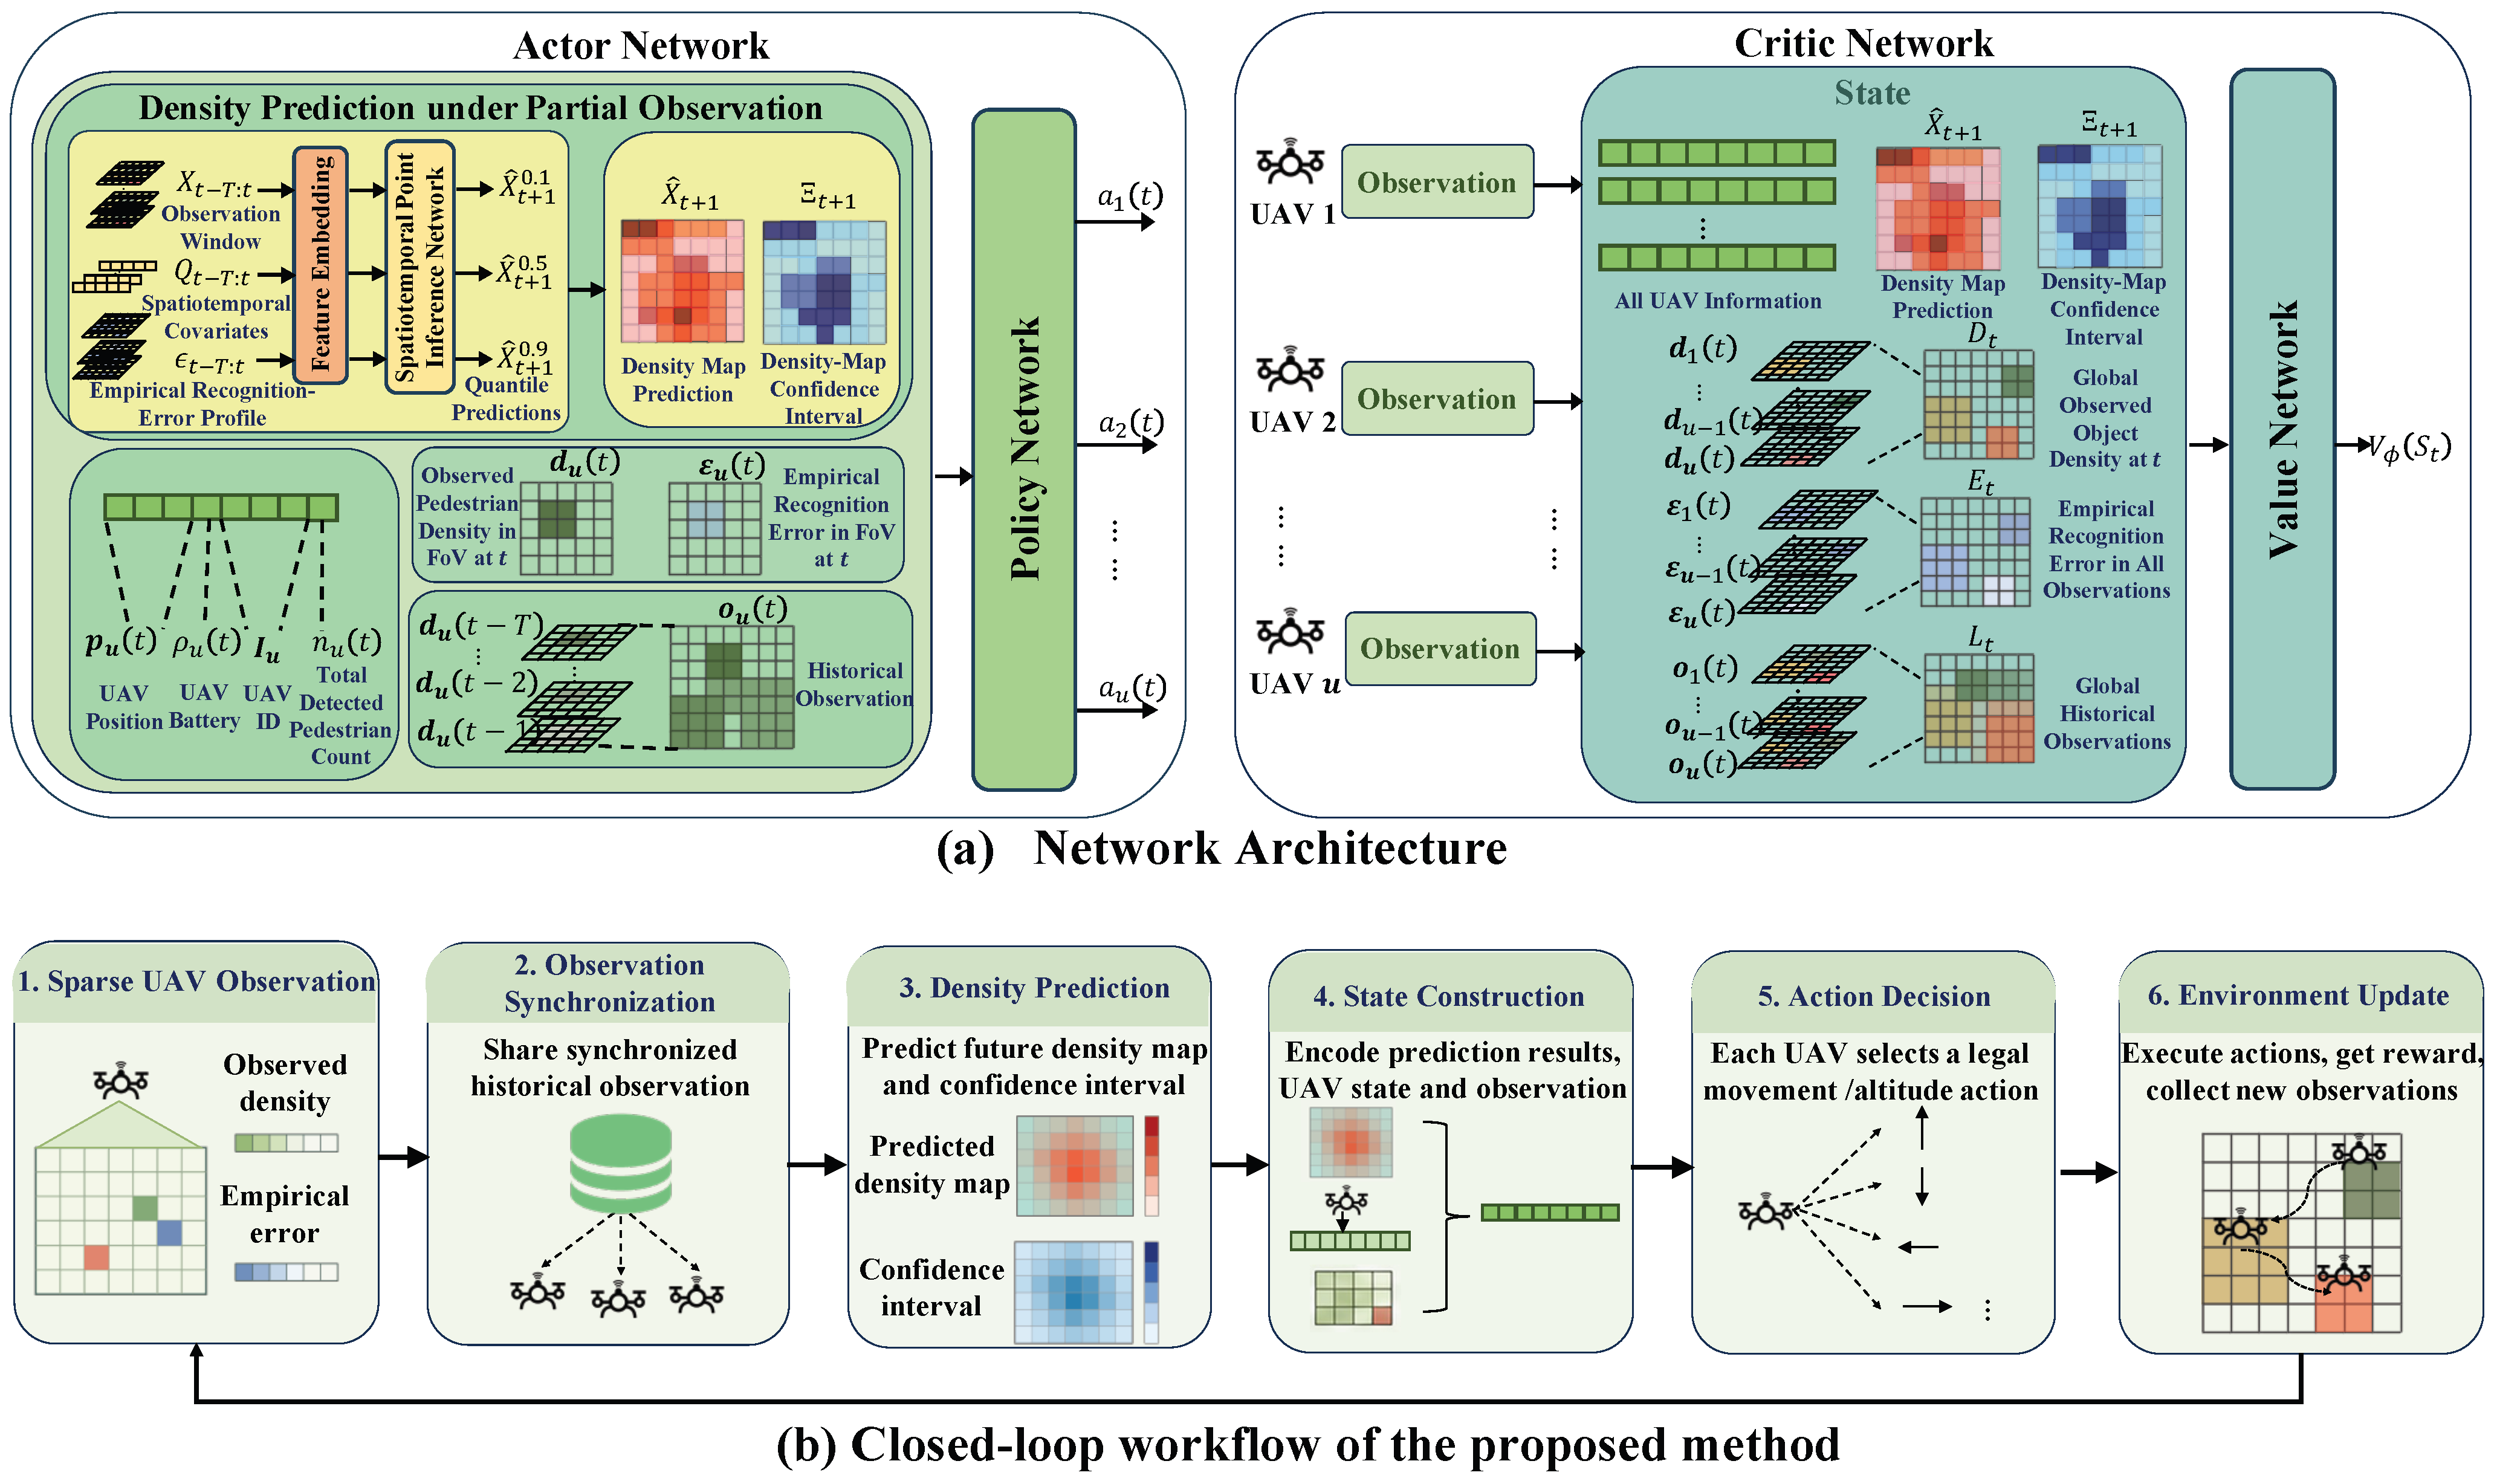
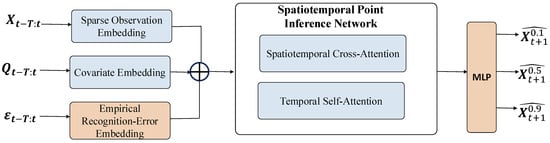
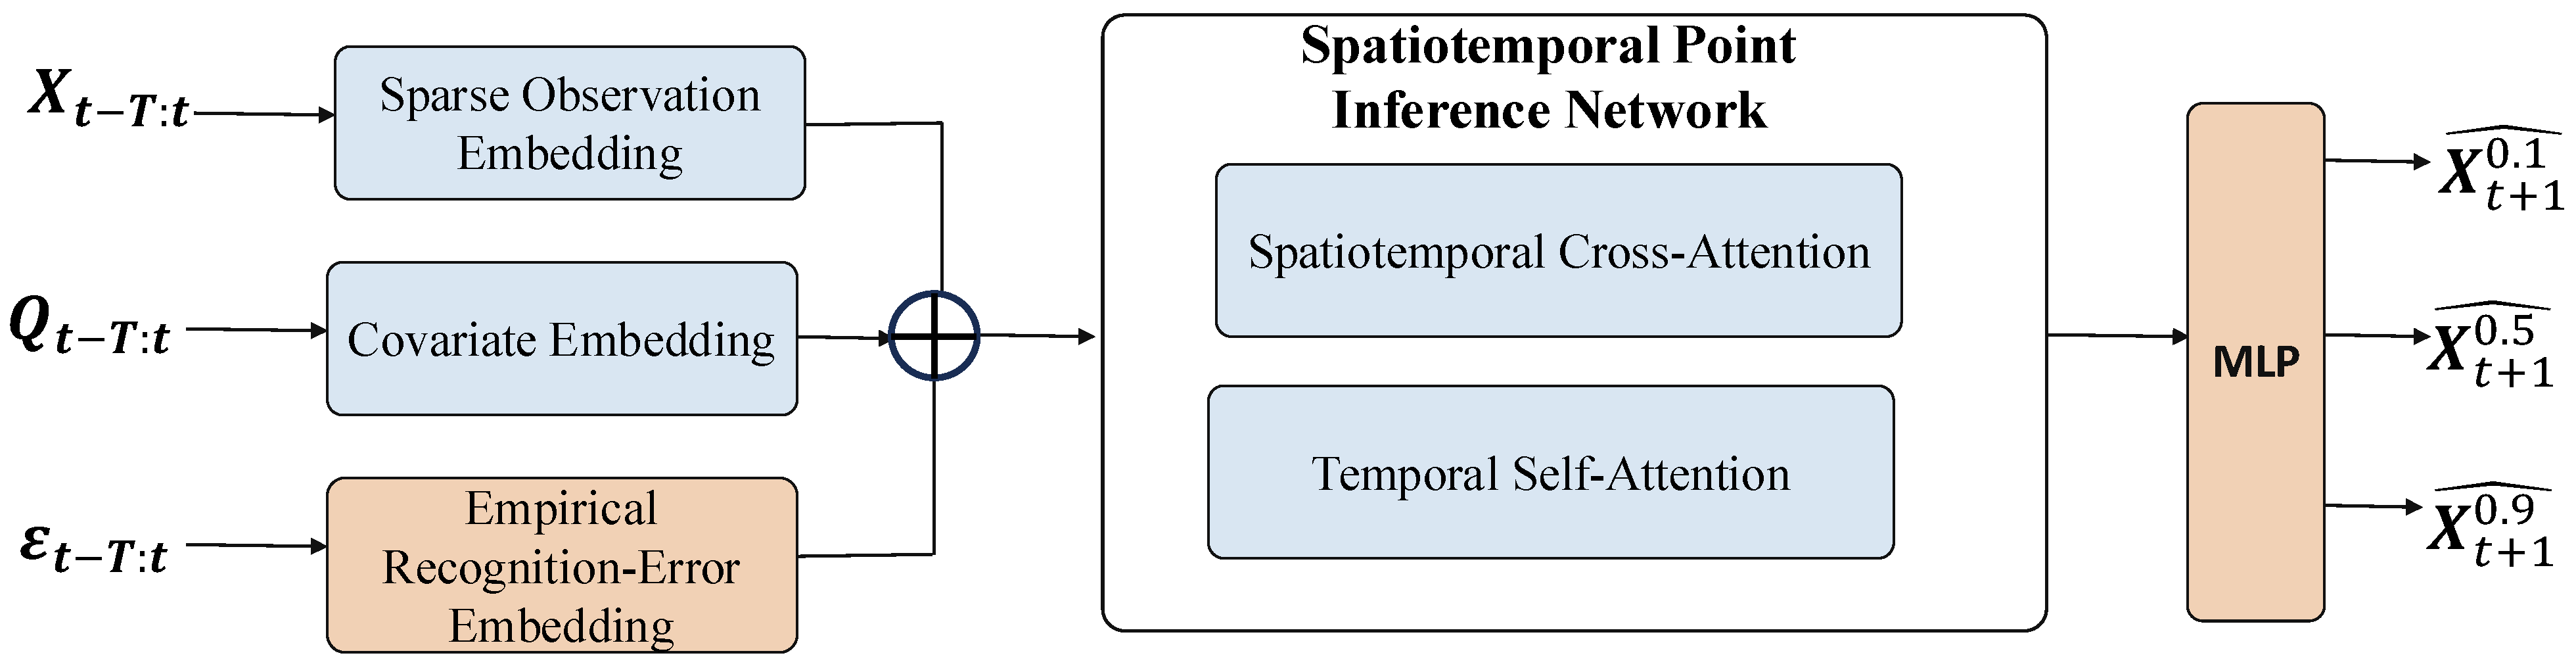
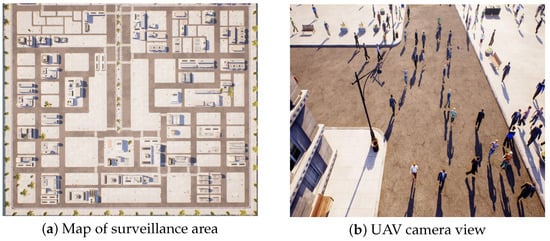
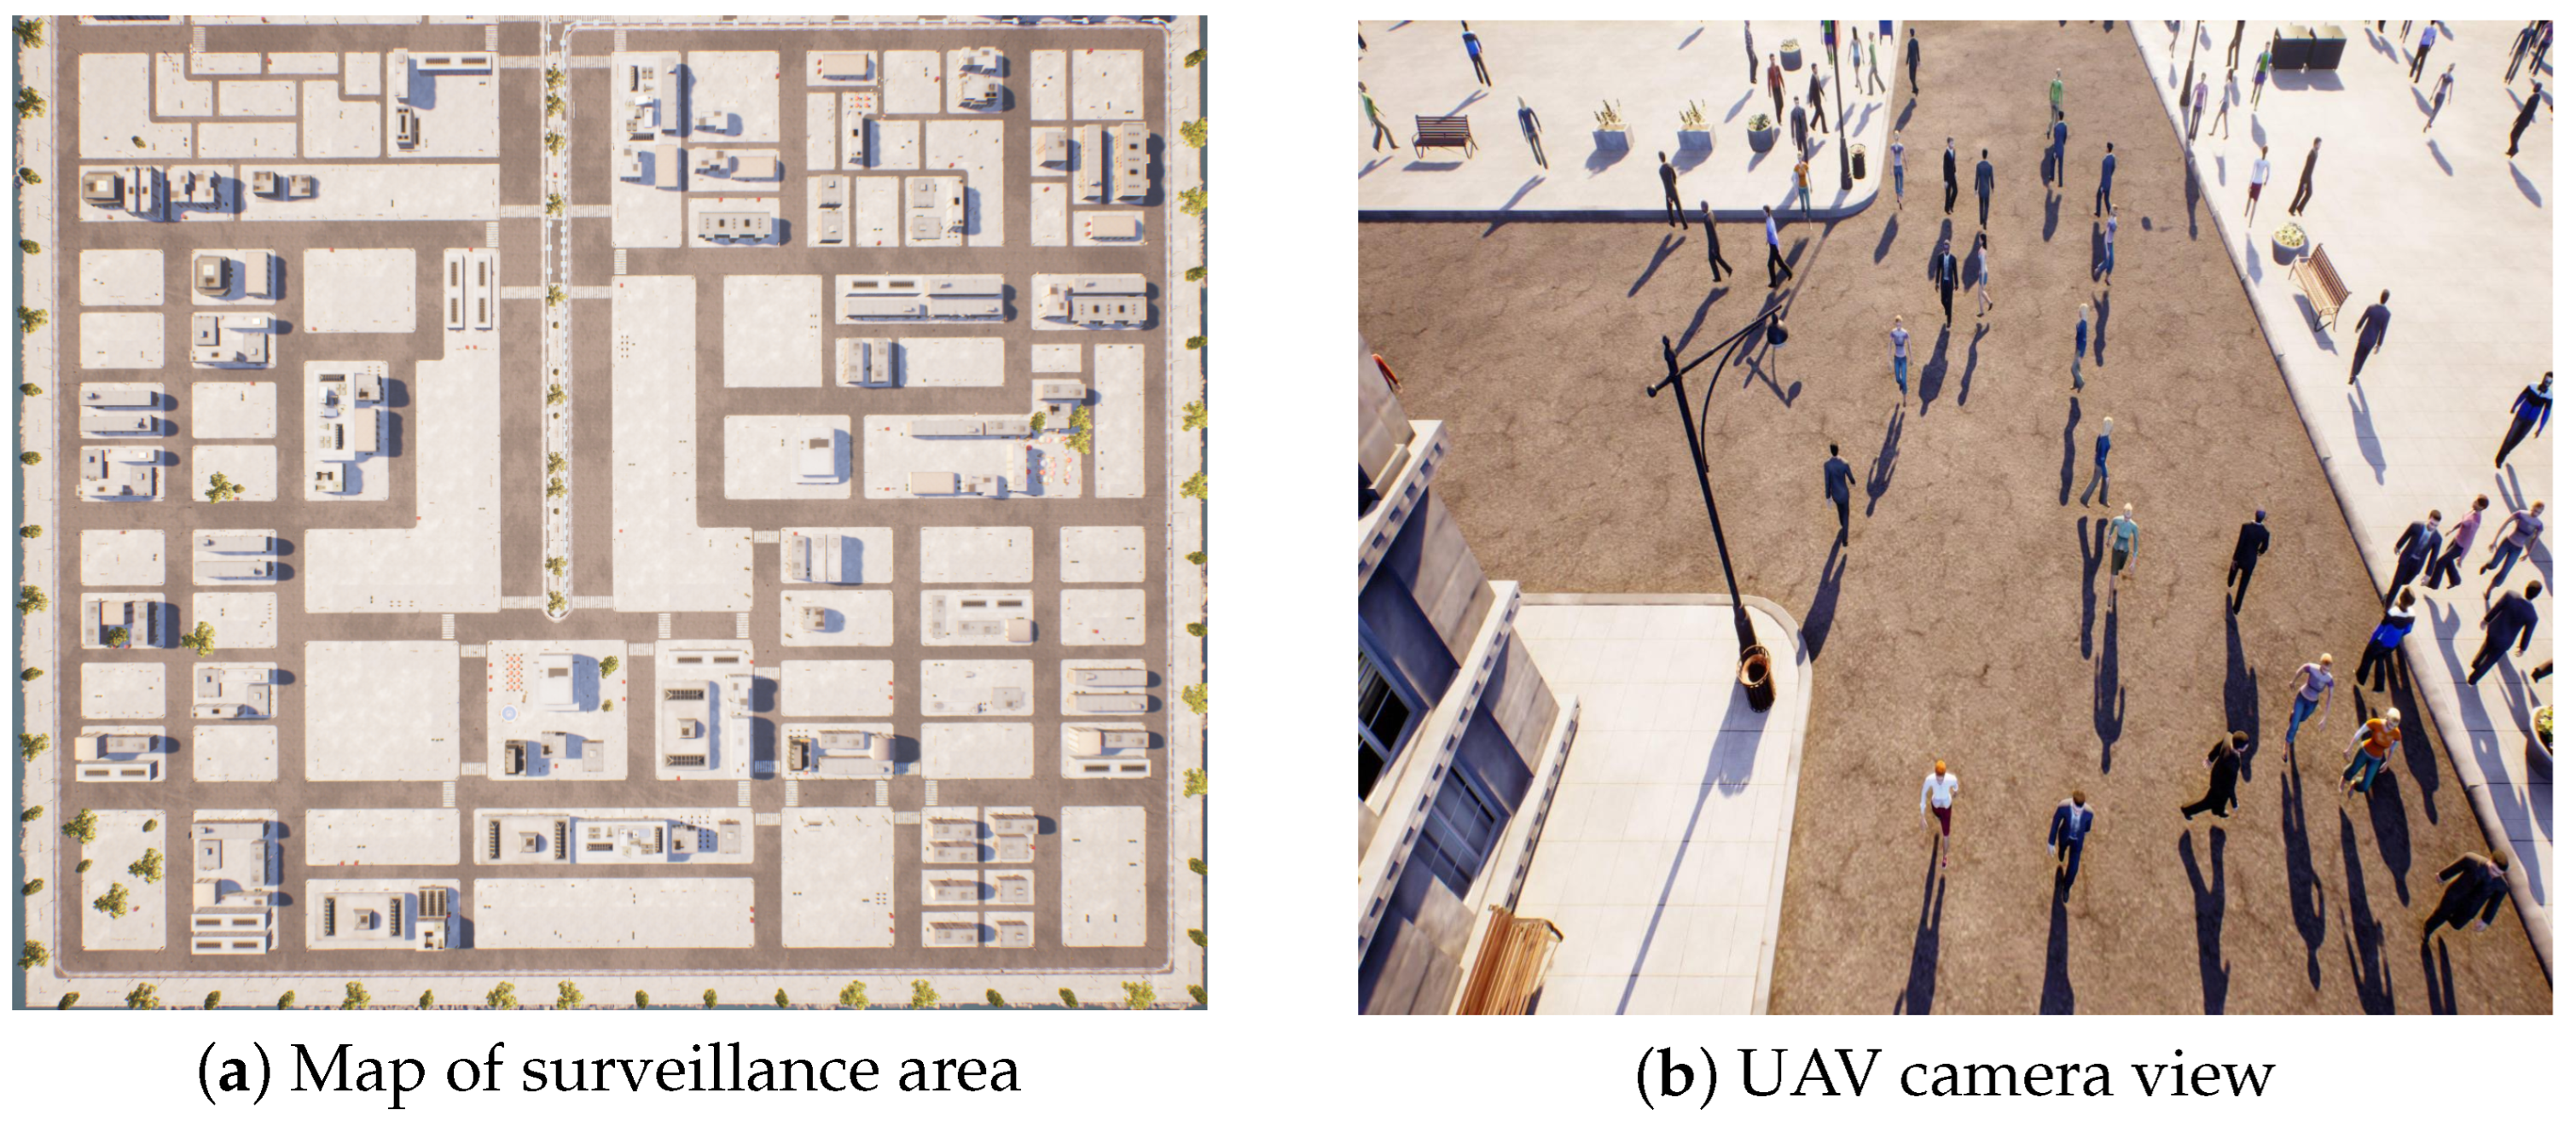
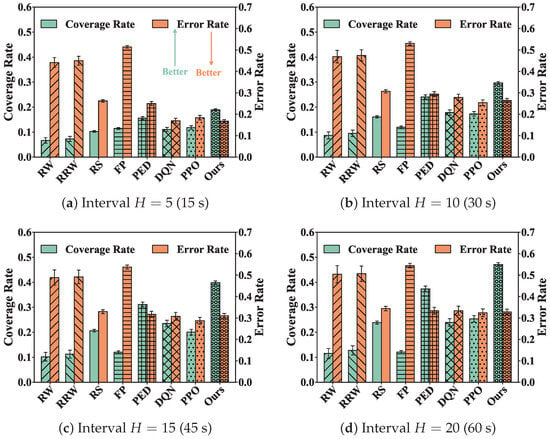
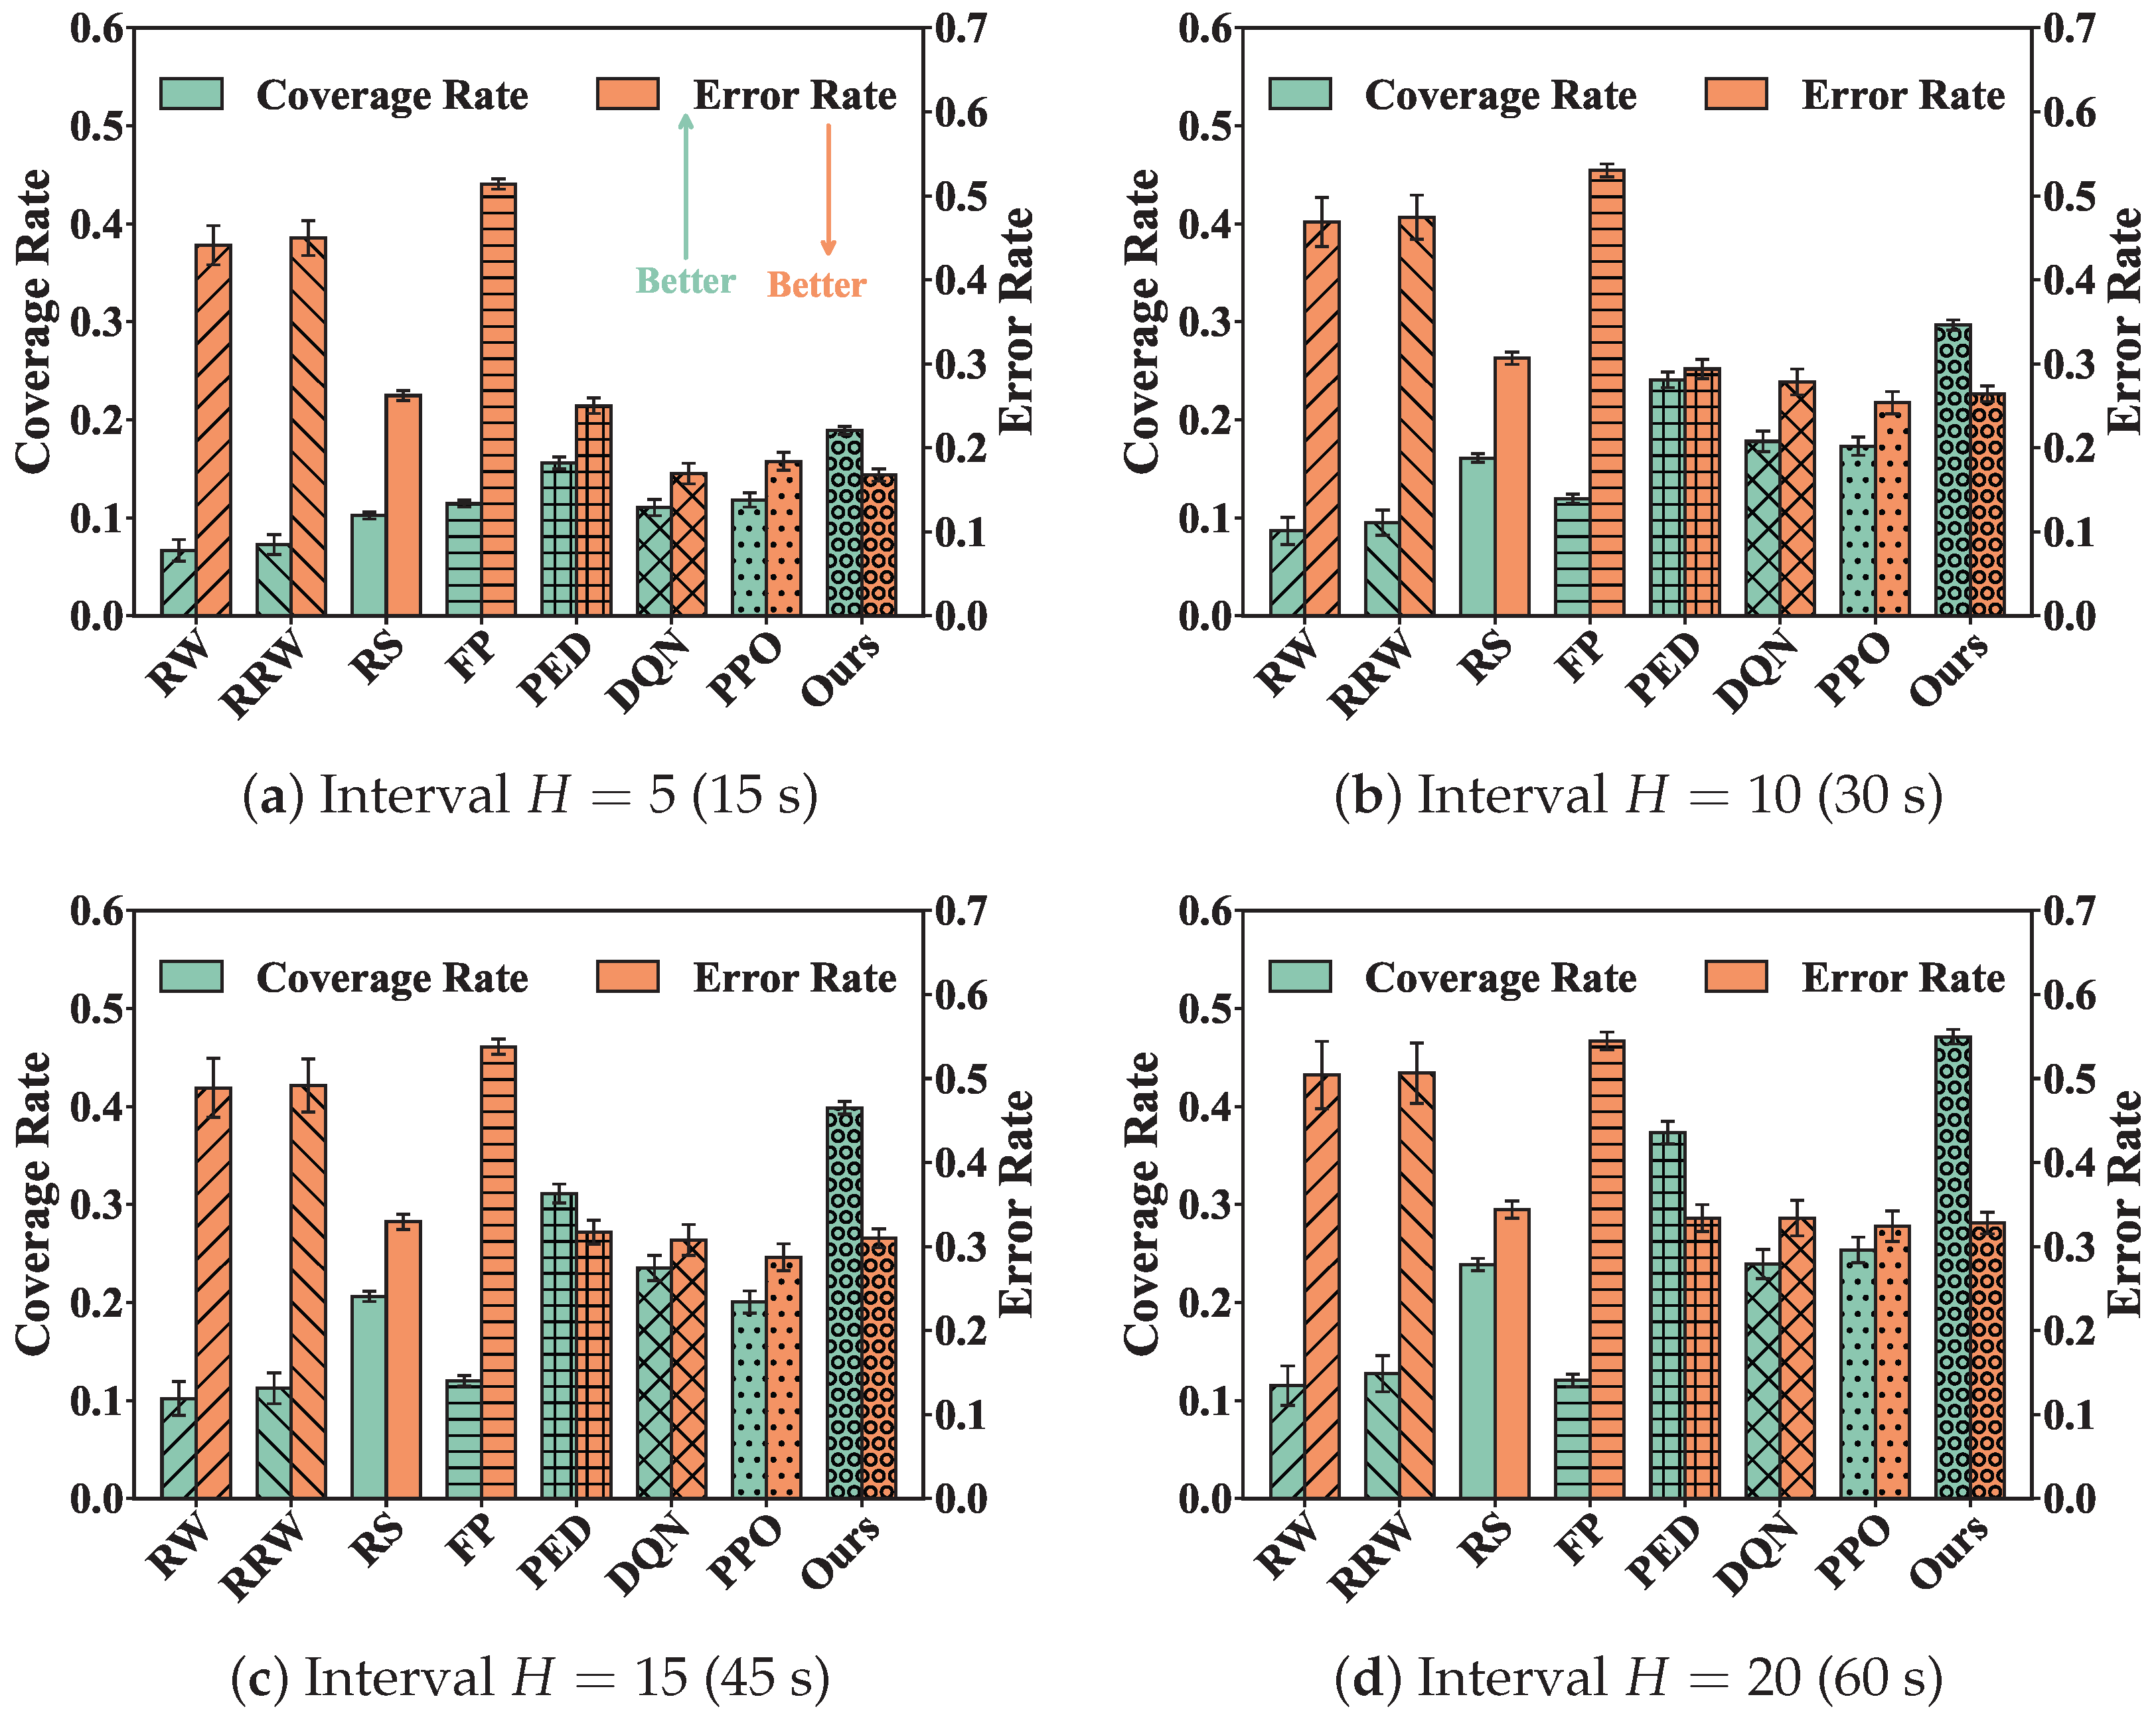
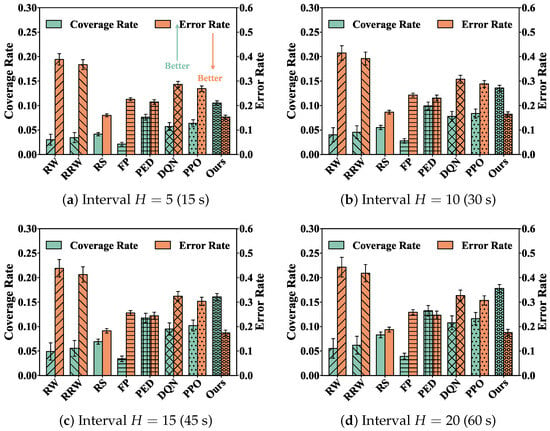
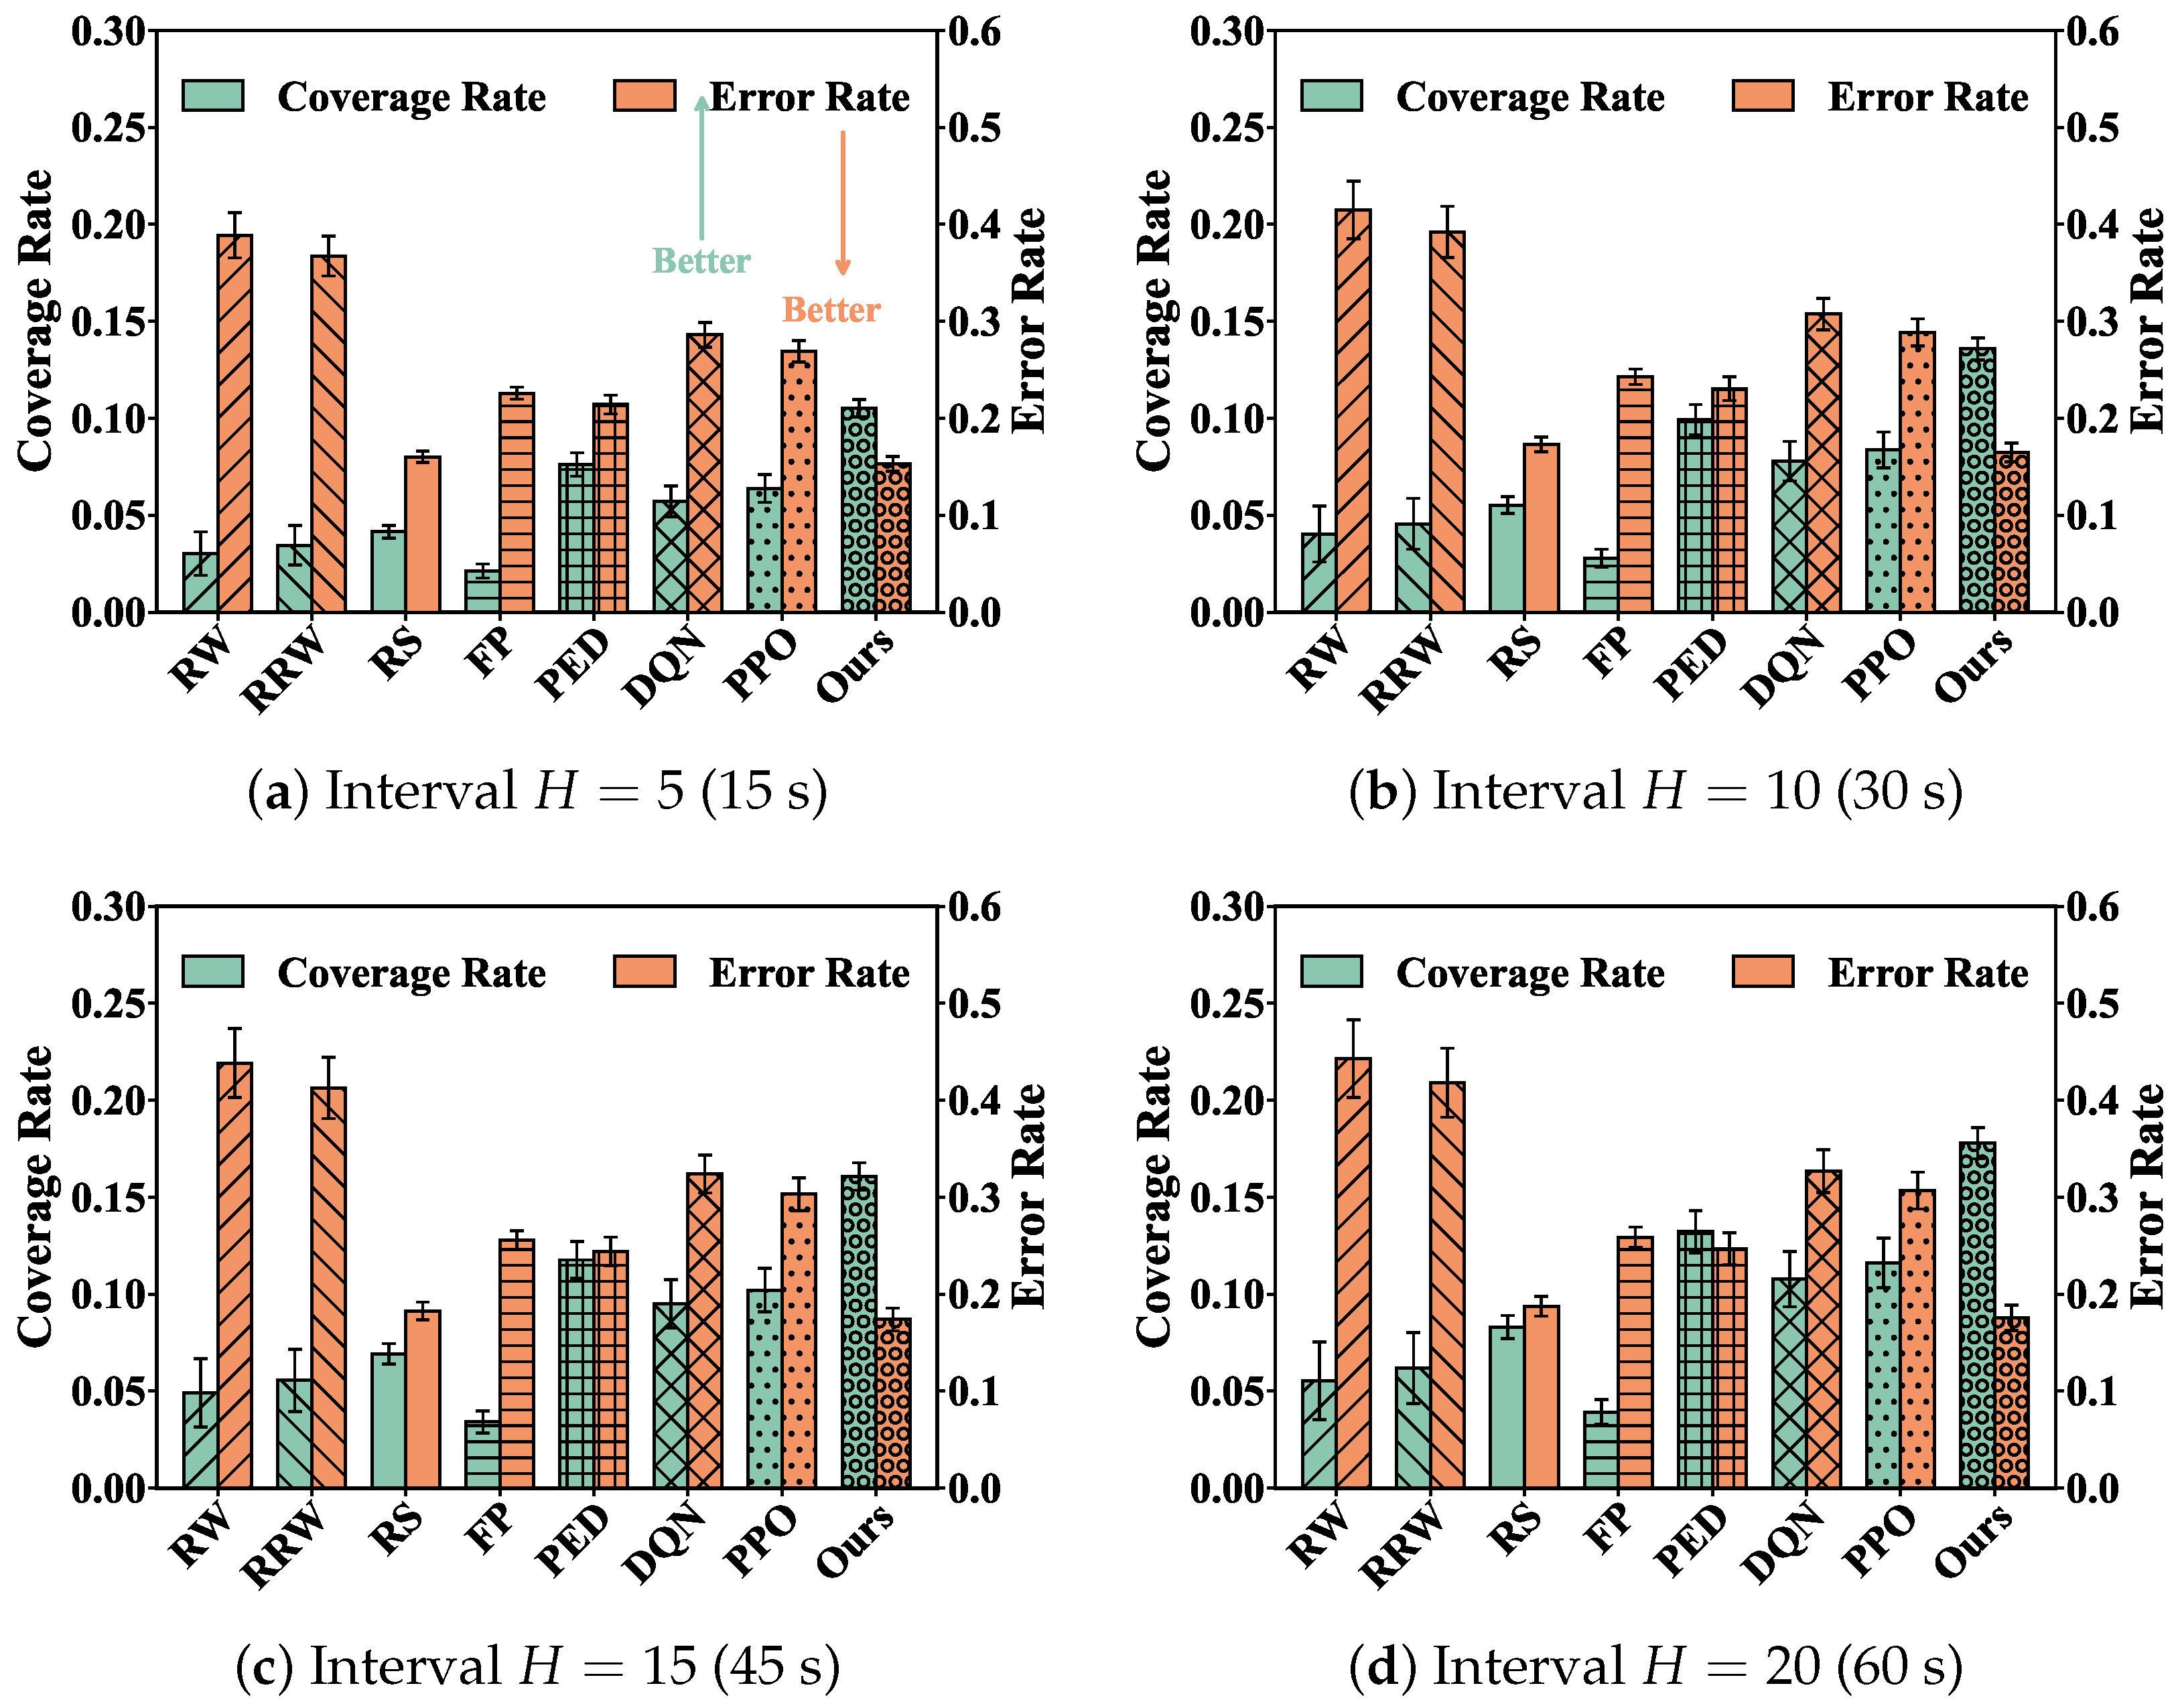
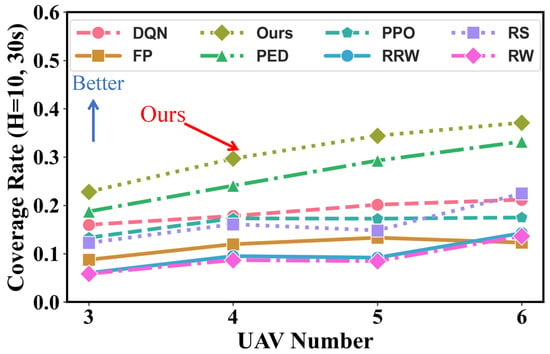
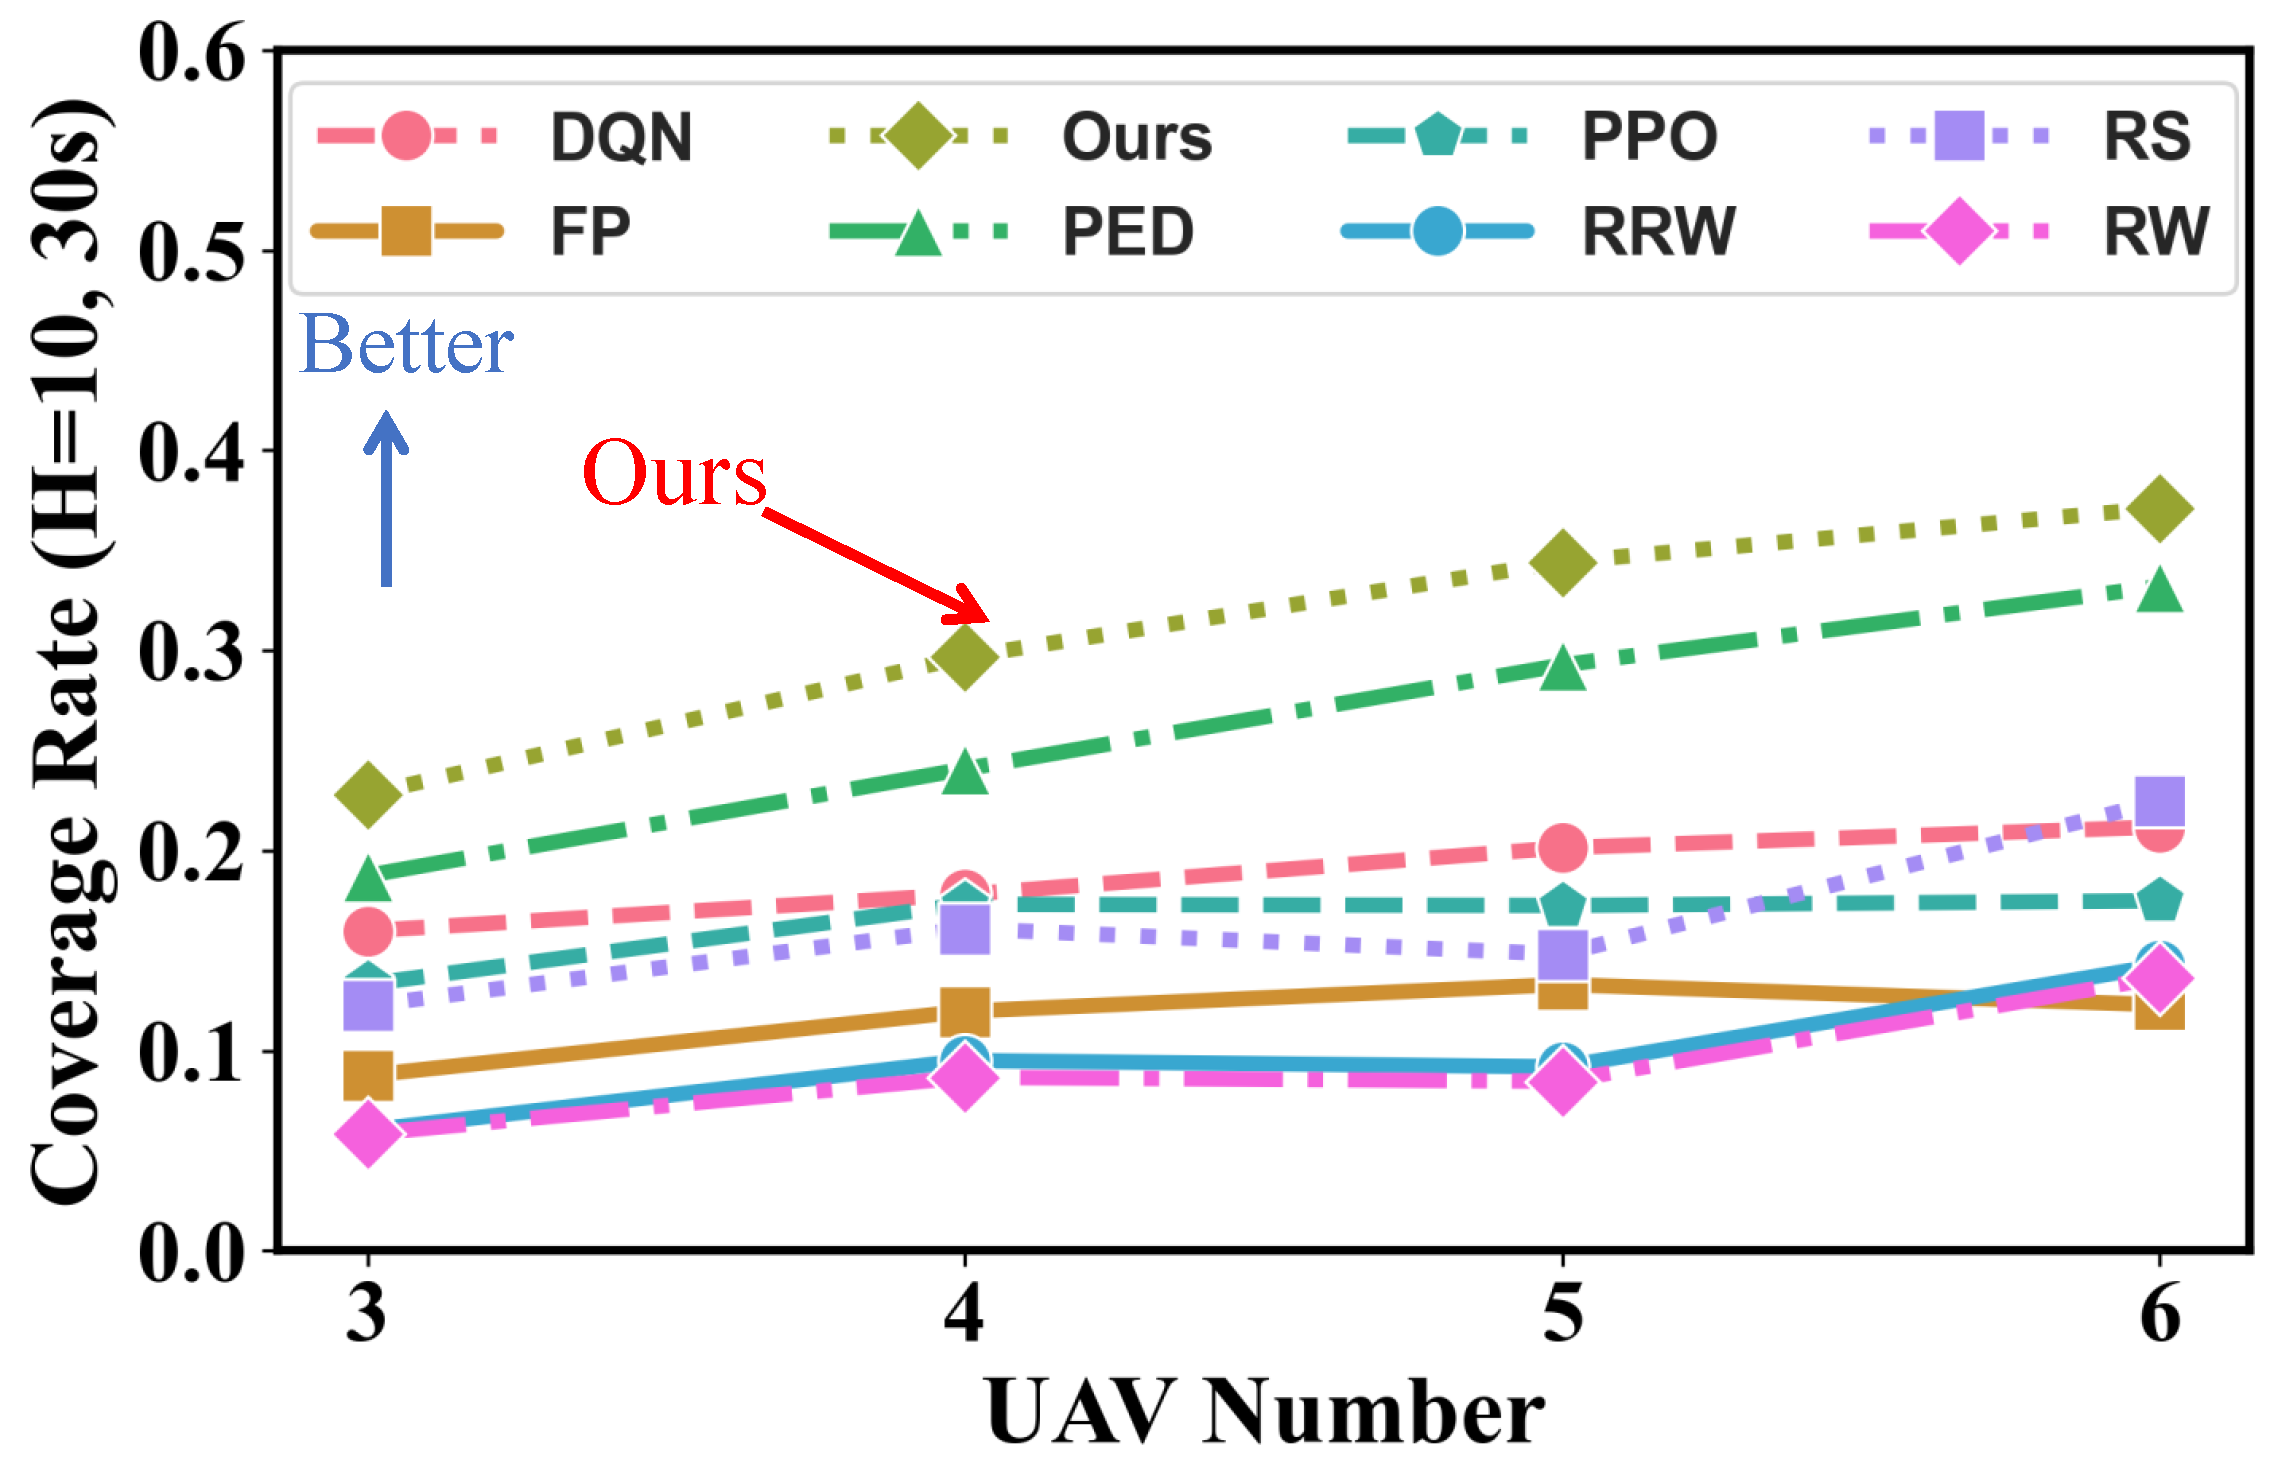
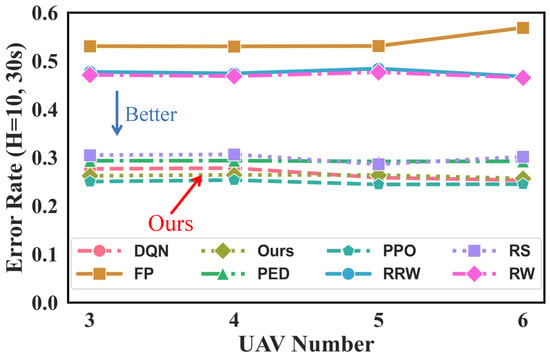
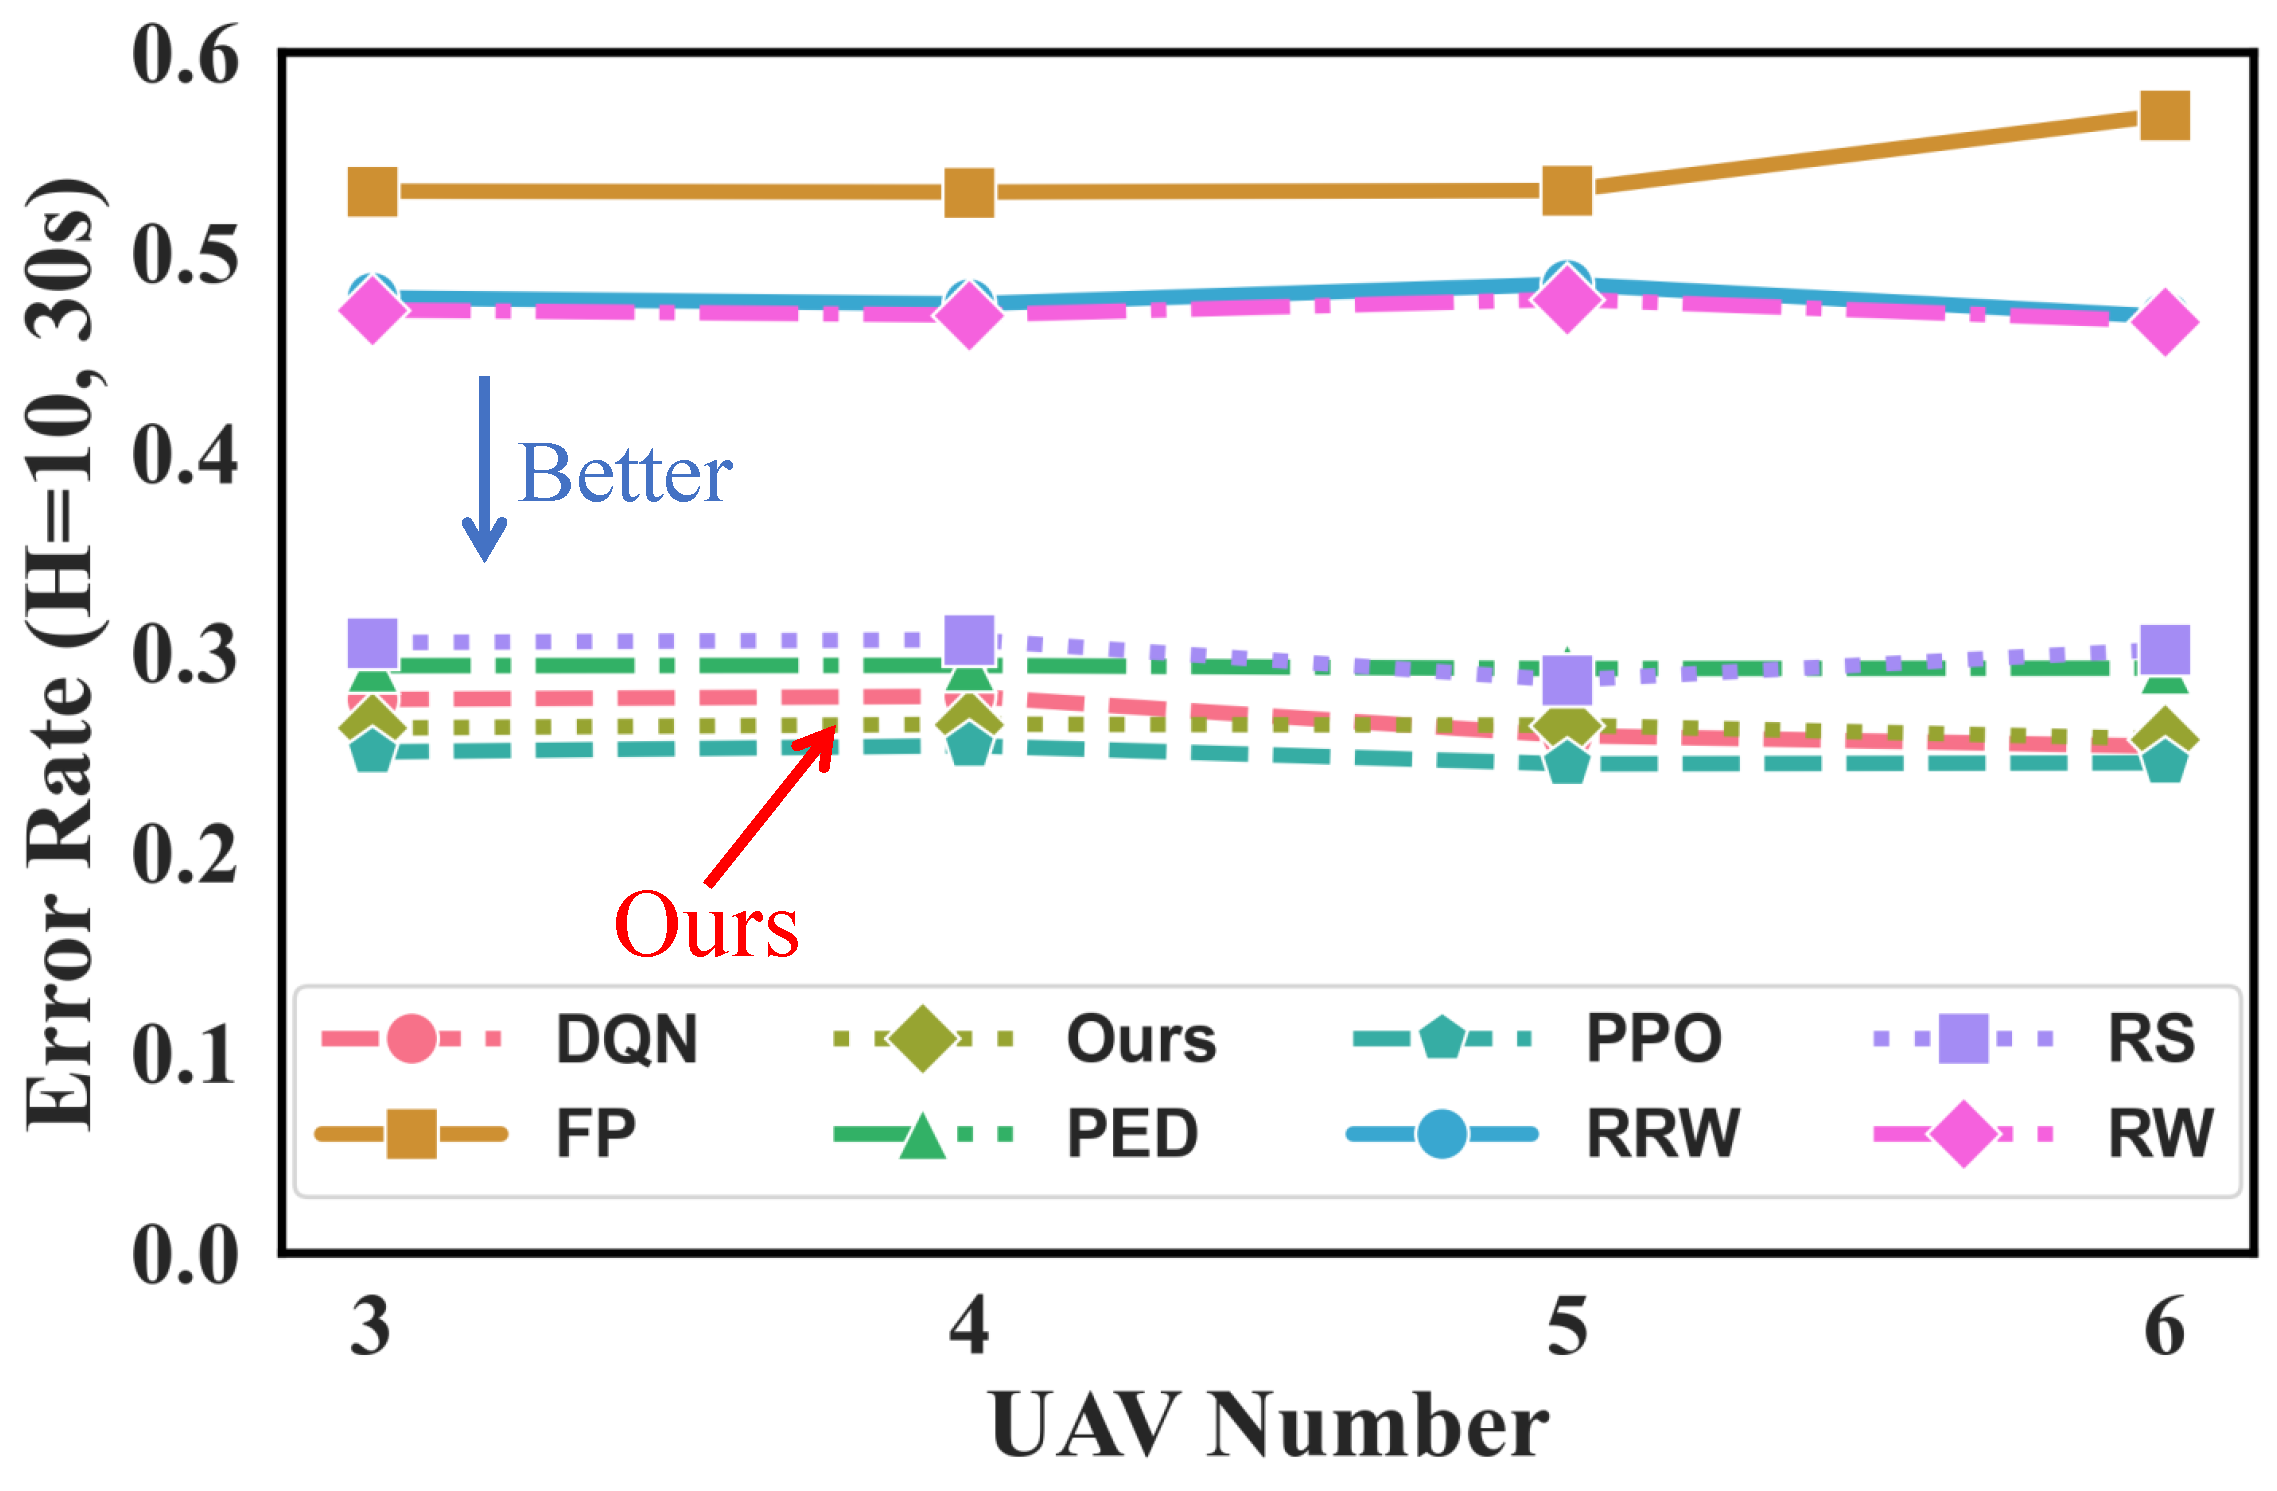
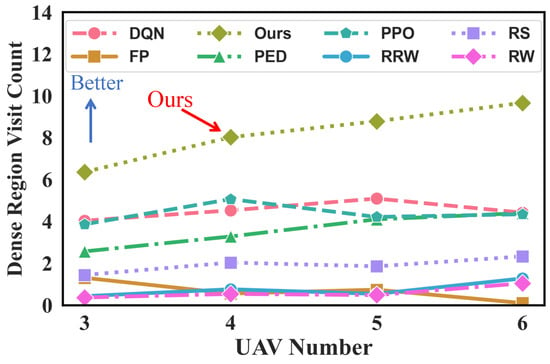
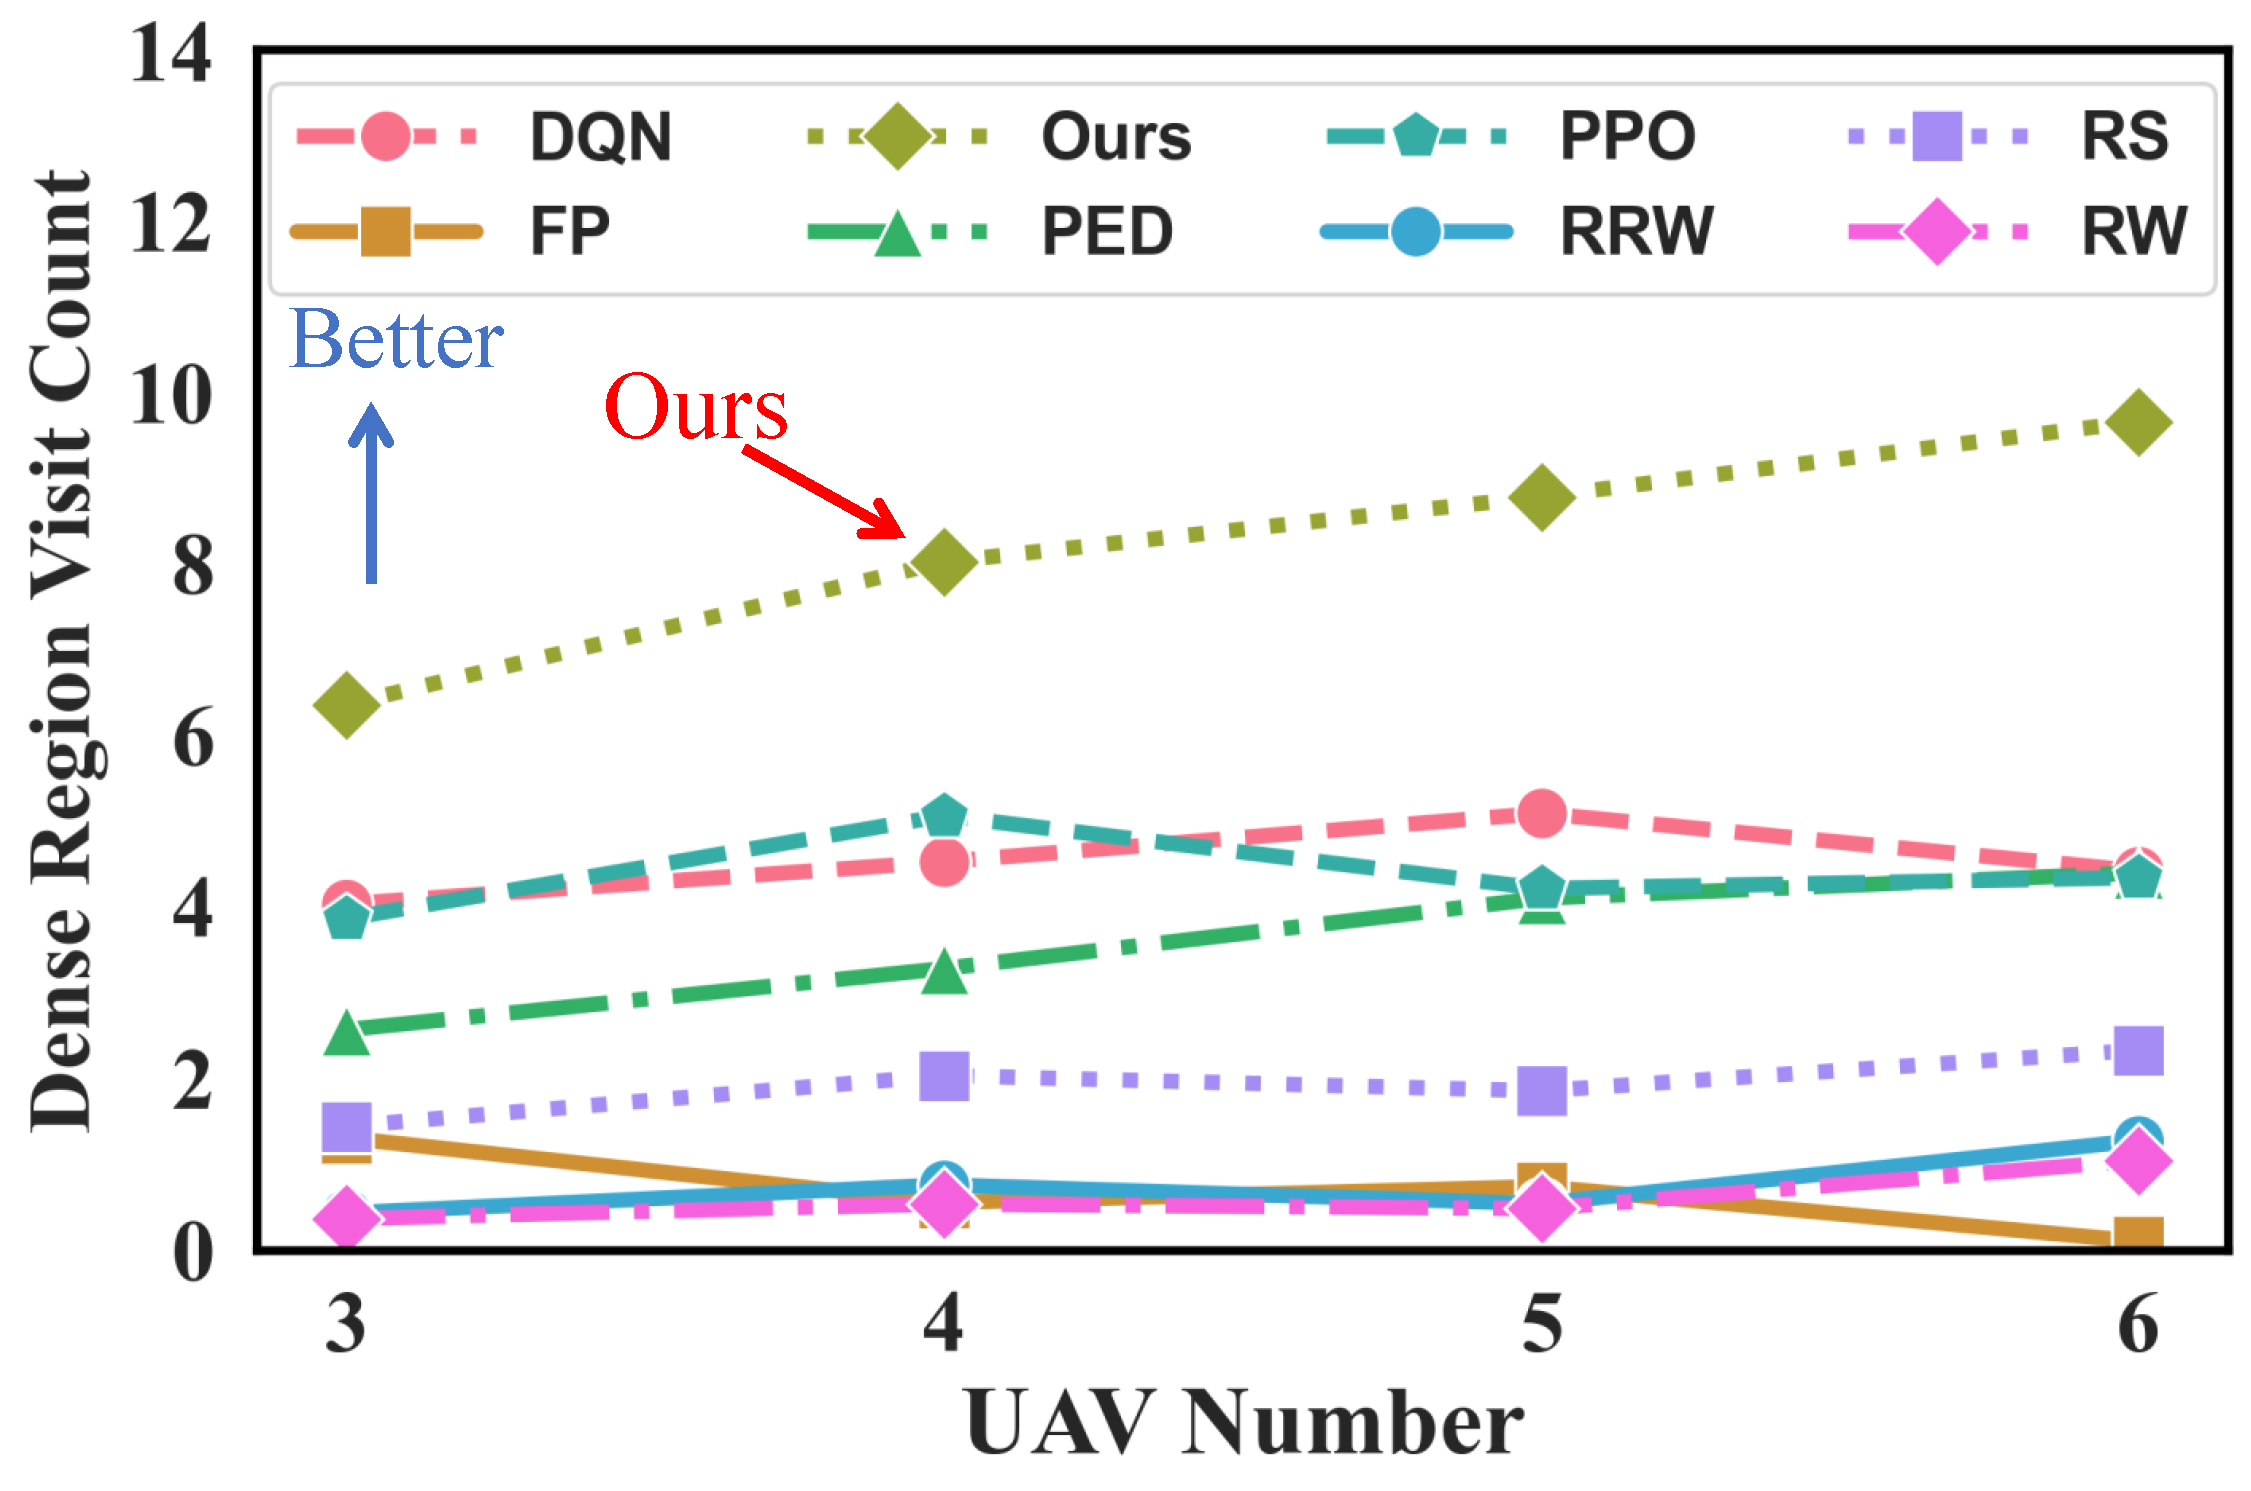
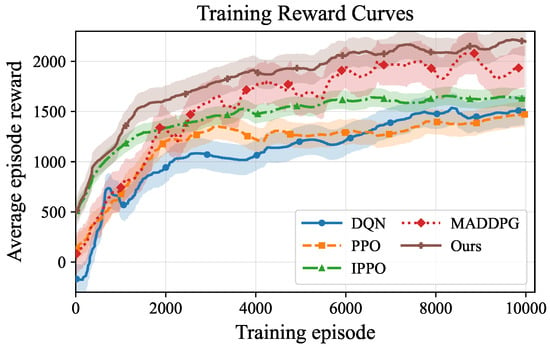
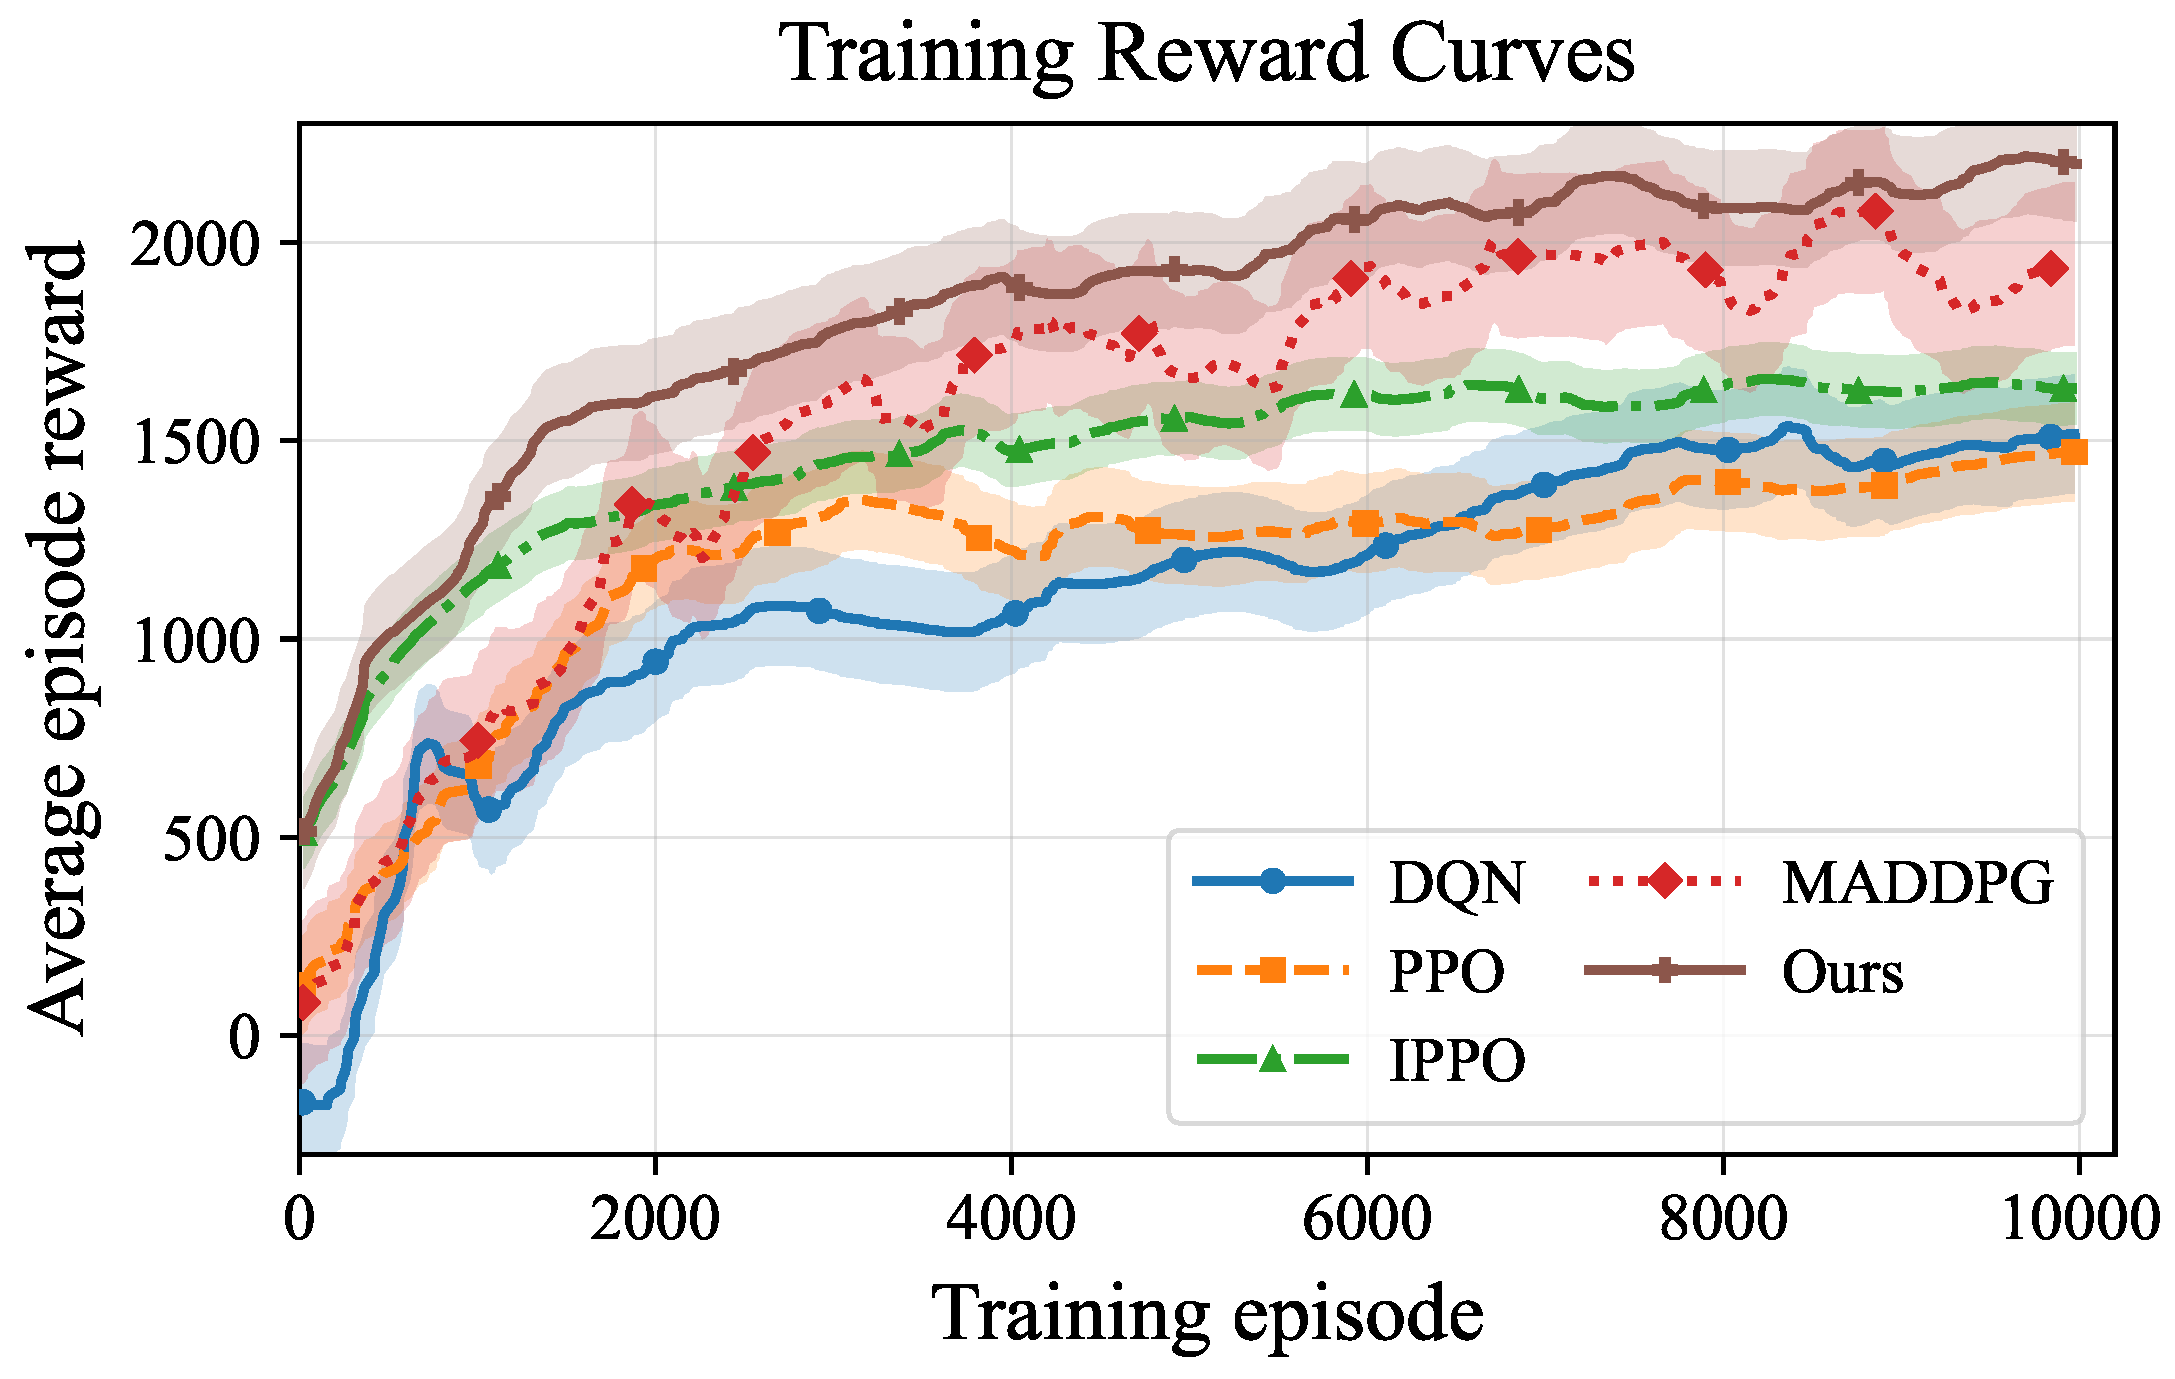

Disclaimer/Publisher’s Note: The statements, opinions and data contained in all publications are solely those of the individual author(s) and contributor(s) and not of MDPI and/or the editor(s). MDPI and/or the editor(s) disclaim responsibility for any injury to people or property resulting from any ideas, methods, instructions or products referred to in the content. |
© 2026 by the authors. Licensee MDPI, Basel, Switzerland. This article is an open access article distributed under the terms and conditions of the Creative Commons Attribution (CC BY) license.