


Highlights
What are the main findings?
- An unmanned aerial vehicle (UAV) channel measurement system is developed, which is capable of simultaneous air-to-air (A2A) and air-to-ground (A2G) channel measurement.
- Measured statistical characteristics demonstrate the different propagation behaviors of A2A and A2G channels and we found that previous understandings of A2A and A2G channels, in particular at low altitude, should be re-examined.
What are the implications of the main findings?
- The successful verification of the simultaneous channel sounder establishes a reliable experimental platform for future research. Unlike separate measurements, this system captures A2A and A2G links under identical flight trajectories and environmental conditions, ensuring data consistency and eliminating temporal environmental variations for comparative analysis.
- The application case results highlight the necessity of re-examining low-altitude channel modeling. The measured distinct propagation behaviors imply that A2A and A2G channels require separate parameter considerations even under the same framework, a task that can be effectively supported by extensive campaigns using the developed system in the future.
Abstract
Air-to-air (A2A) and air-to-ground (A2G) communication links are typical link types for unmanned aerial vehicle (UAV) communication networks, where radio propagation channels are fundamental for the design and optimization of corresponding communication systems. In this paper, a UAV channel measurement system based on two unmanned aerial vehicles (UAVs) is developed, which is capable of simultaneous A2A and A2G measurements. This system adopts an integrated hardware and signal processing architecture that ensures time and frequency synchronization among multiple aerial and ground nodes. Several data postprocessing steps, including the back-to-back calibration, sliding-correlation-based channel impulse response (CIR) extraction, and constant false alarm rate (CFAR)-based multi-path extraction, are performed to achieve accurate channel data. A channel emulator is used to validate the accuracy of the developed system. Finally, the developed channel measurement system is applied to conduct field channel measurements in a campus scenario. Measured channel characteristics, including path loss (PL), shadow fading (SF), Rician K-factor, root mean square delay spread (RMS-DS), and small-scale fading (SSF) are analyzed, which reveal distinct propagation behaviors between the A2A and A2G channels. These results provide valuable experimental insights and channel measurement data for modeling UAV channels.
1. Introduction
Due to the flexible deployment and cost-effectiveness of unmanned aerial vehicles (UAVs), UAV communications have become a key enabler for the rapidly expanding low-altitude (LA) economy and for future B5G/6G space–air–ground integrated networks [1,2]. By further leveraging their controllable three-dimensional mobility and favorable line-of-sight (LoS) conditions, UAV-based networks are flexible for on-demand services while introducing highly dynamic networking and propagation environments [3,4]. Radio propagation channels are fundamental for UAV communication system design and network optimization, which stimulates growing interests in UAV channel modeling and sounding techniques [5,6]. However, the UAV network involves two different types of propagation channels, i.e., the air-to-ground (A2G) and air-to-air (A2A) channels, which are considered to have different characteristics [7,8]. Therefore, it is crucial to conduct measurement campaigns and comparative analysis of A2A and A2G channels for a deeper understanding of their differences in propagation characteristics, and support more reliable and adaptive UAV communication systems.
Recently, A2G or A2A channel measurements have gained more and more attention [9]. For example, the authors in [10,11,12] carried out comprehensive A2G channel measurement campaigns using fixed-wing UAVs across diverse scenarios such as agricultural fields, suburban landscapes, mountainous terrains, deserts, and port areas. The authors in [13] conducted A2G channel measurements in a hilly terrain at 2.585 GHz and 3.5 GHz, considering multiple UAV flight paths. Their work examined essential channel metrics such as path loss (PL), shadow fading (SF), Rician K-factor, root mean square delay spread (RMS-DS), and temporal autocorrelation, contributing to a better understanding of A2G propagation characteristics in complex environments. The authors in [14] presented a fixed-wing-UAV-assisted wideband A2G channel sounder and conducted field measurements at 2.7 GHz with UAV altitudes up to 700 m in a rural LoS environment. They extracted large- and small-scale channel statistics, and especially analyzed the SF spatial autocorrelation, showing that SF is well modeled by a Gamma distribution and its autocorrelation exhibits an exponential–sinusoidal behavior, while the small-scale fading (SSF) follows a Rician law with a distance- and altitude-dependent K-factor model. The authors in [15] conducted multi-frequency LA A2G channel measurements for UAV vertical flights at 1, 4, 12, and 24 GHz with heights up to 24 m in a semi-urban campus environment. They extracted PL/SF and their spatial correlation, proposed an exponential–sinusoidal SF autocorrelation model, and found that the SSF is best characterized by a log-logistic distribution across the measured bands.
In contrast to the research on A2G channels, studies on A2A channels remain limited [9]. The authors in [16] introduced a novel A2A channel model and evaluated its statistical properties through analysis and experimental validation based on a developed A2A channel measurement platform. In [17], the authors conducted a measurement campaign at 5.8 GHz using a low-cost and light-weight software-defined radio-based channel measurement system and estimated the path loss exponent (PLE) of LoS drone communications. The authors in [18] performed A2A channel measurements at 1420 MHz in an urban scenario and calibrated a ray-tracing simulator using the extracted MPC delays and powers. Based on extensive RT under pitch-up, cruise, and pitch-down attitudes, they developed an attitude-dependent A2A model. Due to limited A2A channel measurements, comprehensive comparisons between A2A and A2G channels remain rare. In particular, simultaneous A2A and A2G measurements at the same time within the same LA scenario are still lacking, which makes it difficult to analyze the difference in A2A and A2G channels.
To fill this gap, this paper aims to develop an UAV channel measurement system that can measure the A2A and A2G channels simultaneously. The main contributions and novelties are summarized as follows:
- An UAV channel measurement system including two aerial nodes and one ground node is developed, which supports both the A2A and A2G channel sounding links. By utilizing this system, we can obtain A2A and A2G channel measurement data simultaneously to avoid the effect of the time factor on the measured channel.
- Several hardware-based channel data postprocessing algorithms are proposed, including sliding-correlation-based channel impulse response (CIR) extraction, back-to-back (B2B) calibration for system response removal, and constant false alarm rate (CFAR) detection for MPC extraction. Moreover, a real-time framing and data transfer scheme is designed to transfer the data back from the aerial platform to the ground station during measurement.
- Channel measurement campaigns are conducted in an LA scenario. Statistical characteristics of the A2G and A2A channels, including the PL, SF, RMS-DS, Rician K-factor, and SSF, are compared and analyzed to highlight their differences.
The rest of this paper is organized as follows. Section 2 presents the system setups of the proposed channel measurement channel system. Section 3 presents channel data postprocessing procedures as well as the characterization of key channel metrics. Section 4 presents the results of validation measurements and field channel measurements. Finally, conclusions are drawn in Section 5.
2. Developed Channel Measurement System
2.1. System Setups
An overview of the developed channel measurement system is presented in Figure 1. It consists of three main components: an aerial transmitter (TX), an aerial receiver (RX), and a ground RX (also serving as the ground station). The details of each component are listed below:
- Aerial TX. The aerial TX has a light-weight, modular hardware configuration, which is carried by a six-wing drone (SY400-10, World Wing Aviation Technology, Beijing, China). It includes a custom-developed Field-Programmable Gate Array (FPGA)-based signal processing board, a GPS module, a high-power amplifier (HPA, ZHL-2W-63-S+, Mini-Circuits, Brooklyn, NY, USA), and a lithium battery (PB240B1, TalentCell, Shenzhen, China) for power supply. The sounding signal is amplified by an HPA and radiated through an omnidirectional antenna (Ant Ext 617-3900 SMA, Pulse Electronics, San Diego, CA, USA).
- Aerial RX. The aerial RX has the same hardware structure as the aerial TX. One difference is that the aerial RX consists of an extra low-noise amplifier (LNA, ZRL-3500+, Mini-Circuits, Brooklyn, NY, USA) integrated omnidirectional antenna to receive the sounding signal. Moreover, another omnidirectional antenna is installed on the aerial RX, which is used for transferring data, such as the channel data and GPS data, to the ground station.
- Ground RX. The ground RX is configured as a ground channel measurement node with a portable signal processing module and a laptop for data acquisition and storage, powered by an external supply (Explorer 1800 Plus, Jackery, Shenzhen, China). It employs two omnidirectional antennas. One antenna is dedicated to receiving the sounding signal from the aerial TX, and the other data-link antenna is dedicated to receiving the data frames from the aerial RX.
Figure 1.
(a) Photograph and (b) block diagram of the developed channel measurement system.
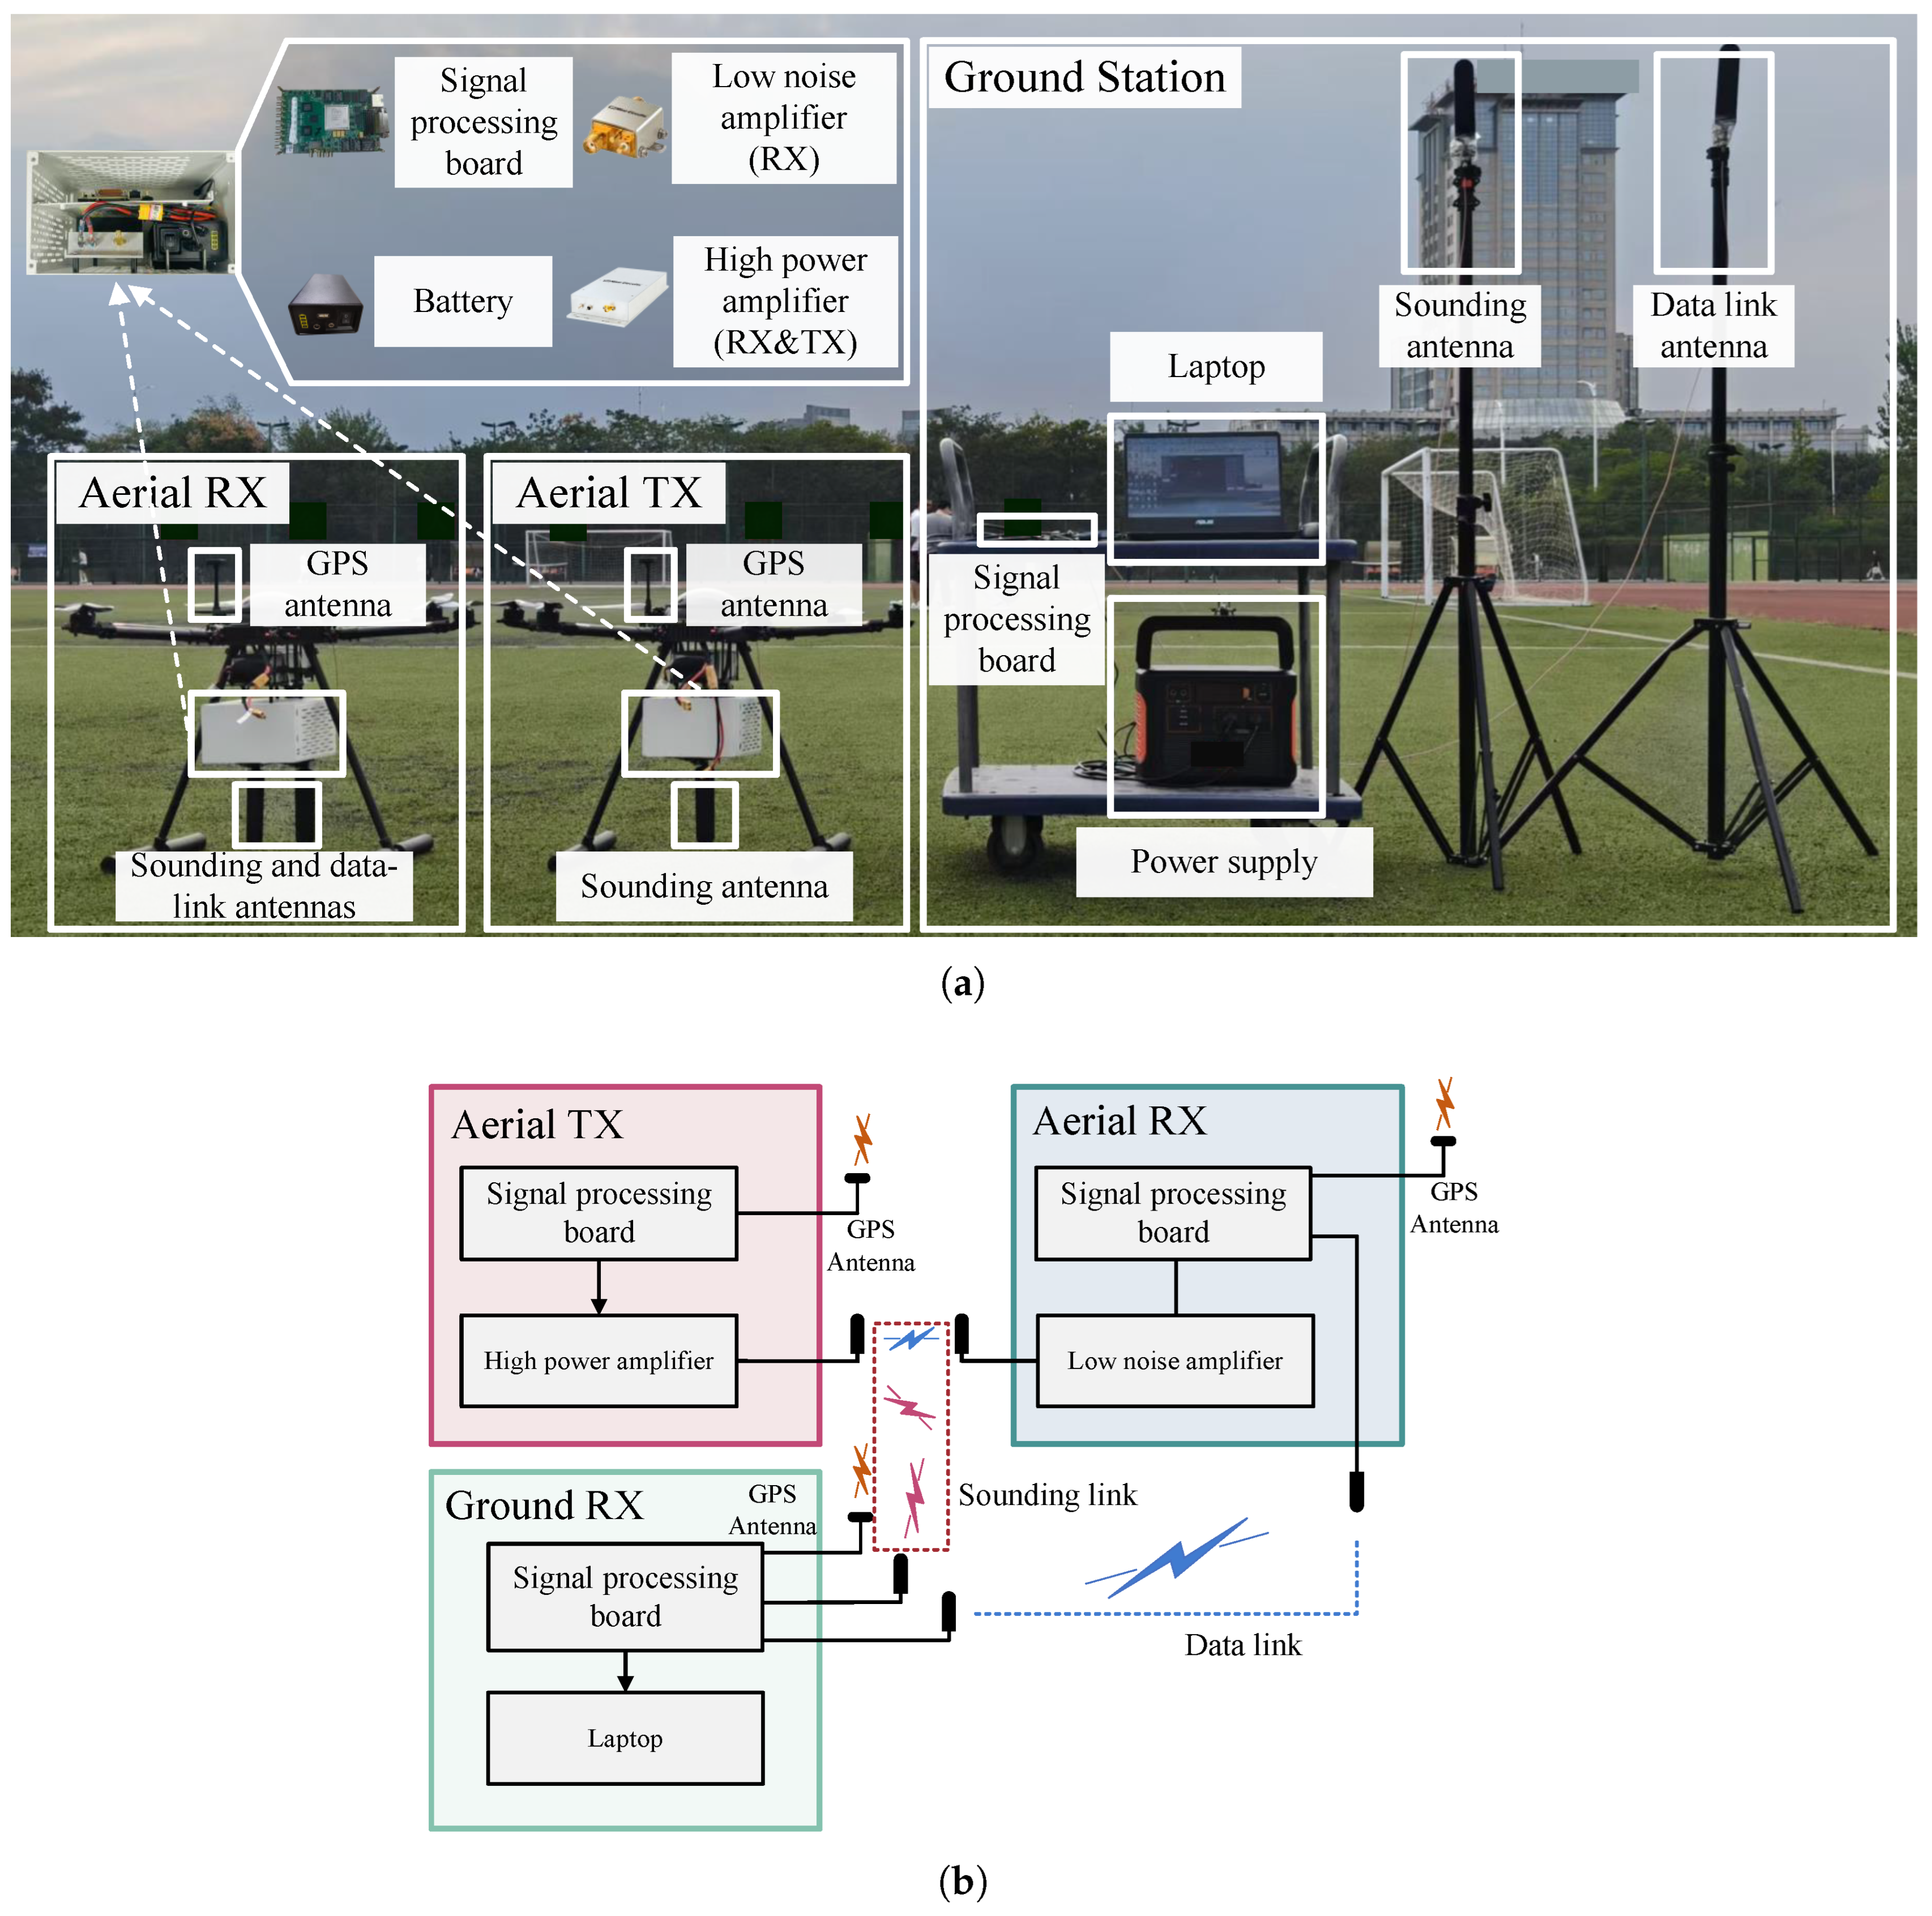
The system adopts an integrated cooperative measurement architecture, enabling synchronized channel sounding and data acquisition across both links. All three nodes are equipped with a GPS module, which provides high-accuracy latitude and longitude data and pulse-per-second (PPS) signals to synchronize the system clocks and align timestamps across nodes. Moreover, all nodes employ identical custom-designed signal processing modules and operate within the same frequency band to ensure the consistency and comparability of the measured data. Some of the system parameters are summarized in Table 1.
Table 1.
Summary of the system parameters.
2.2. System Workflows
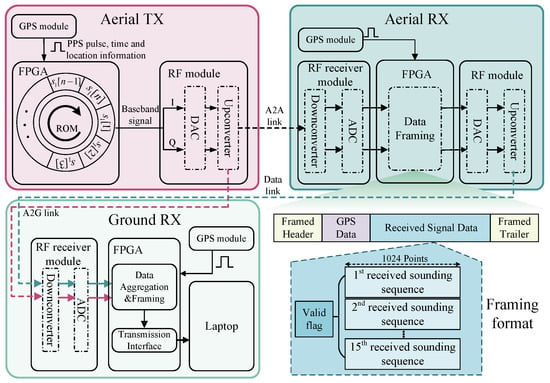
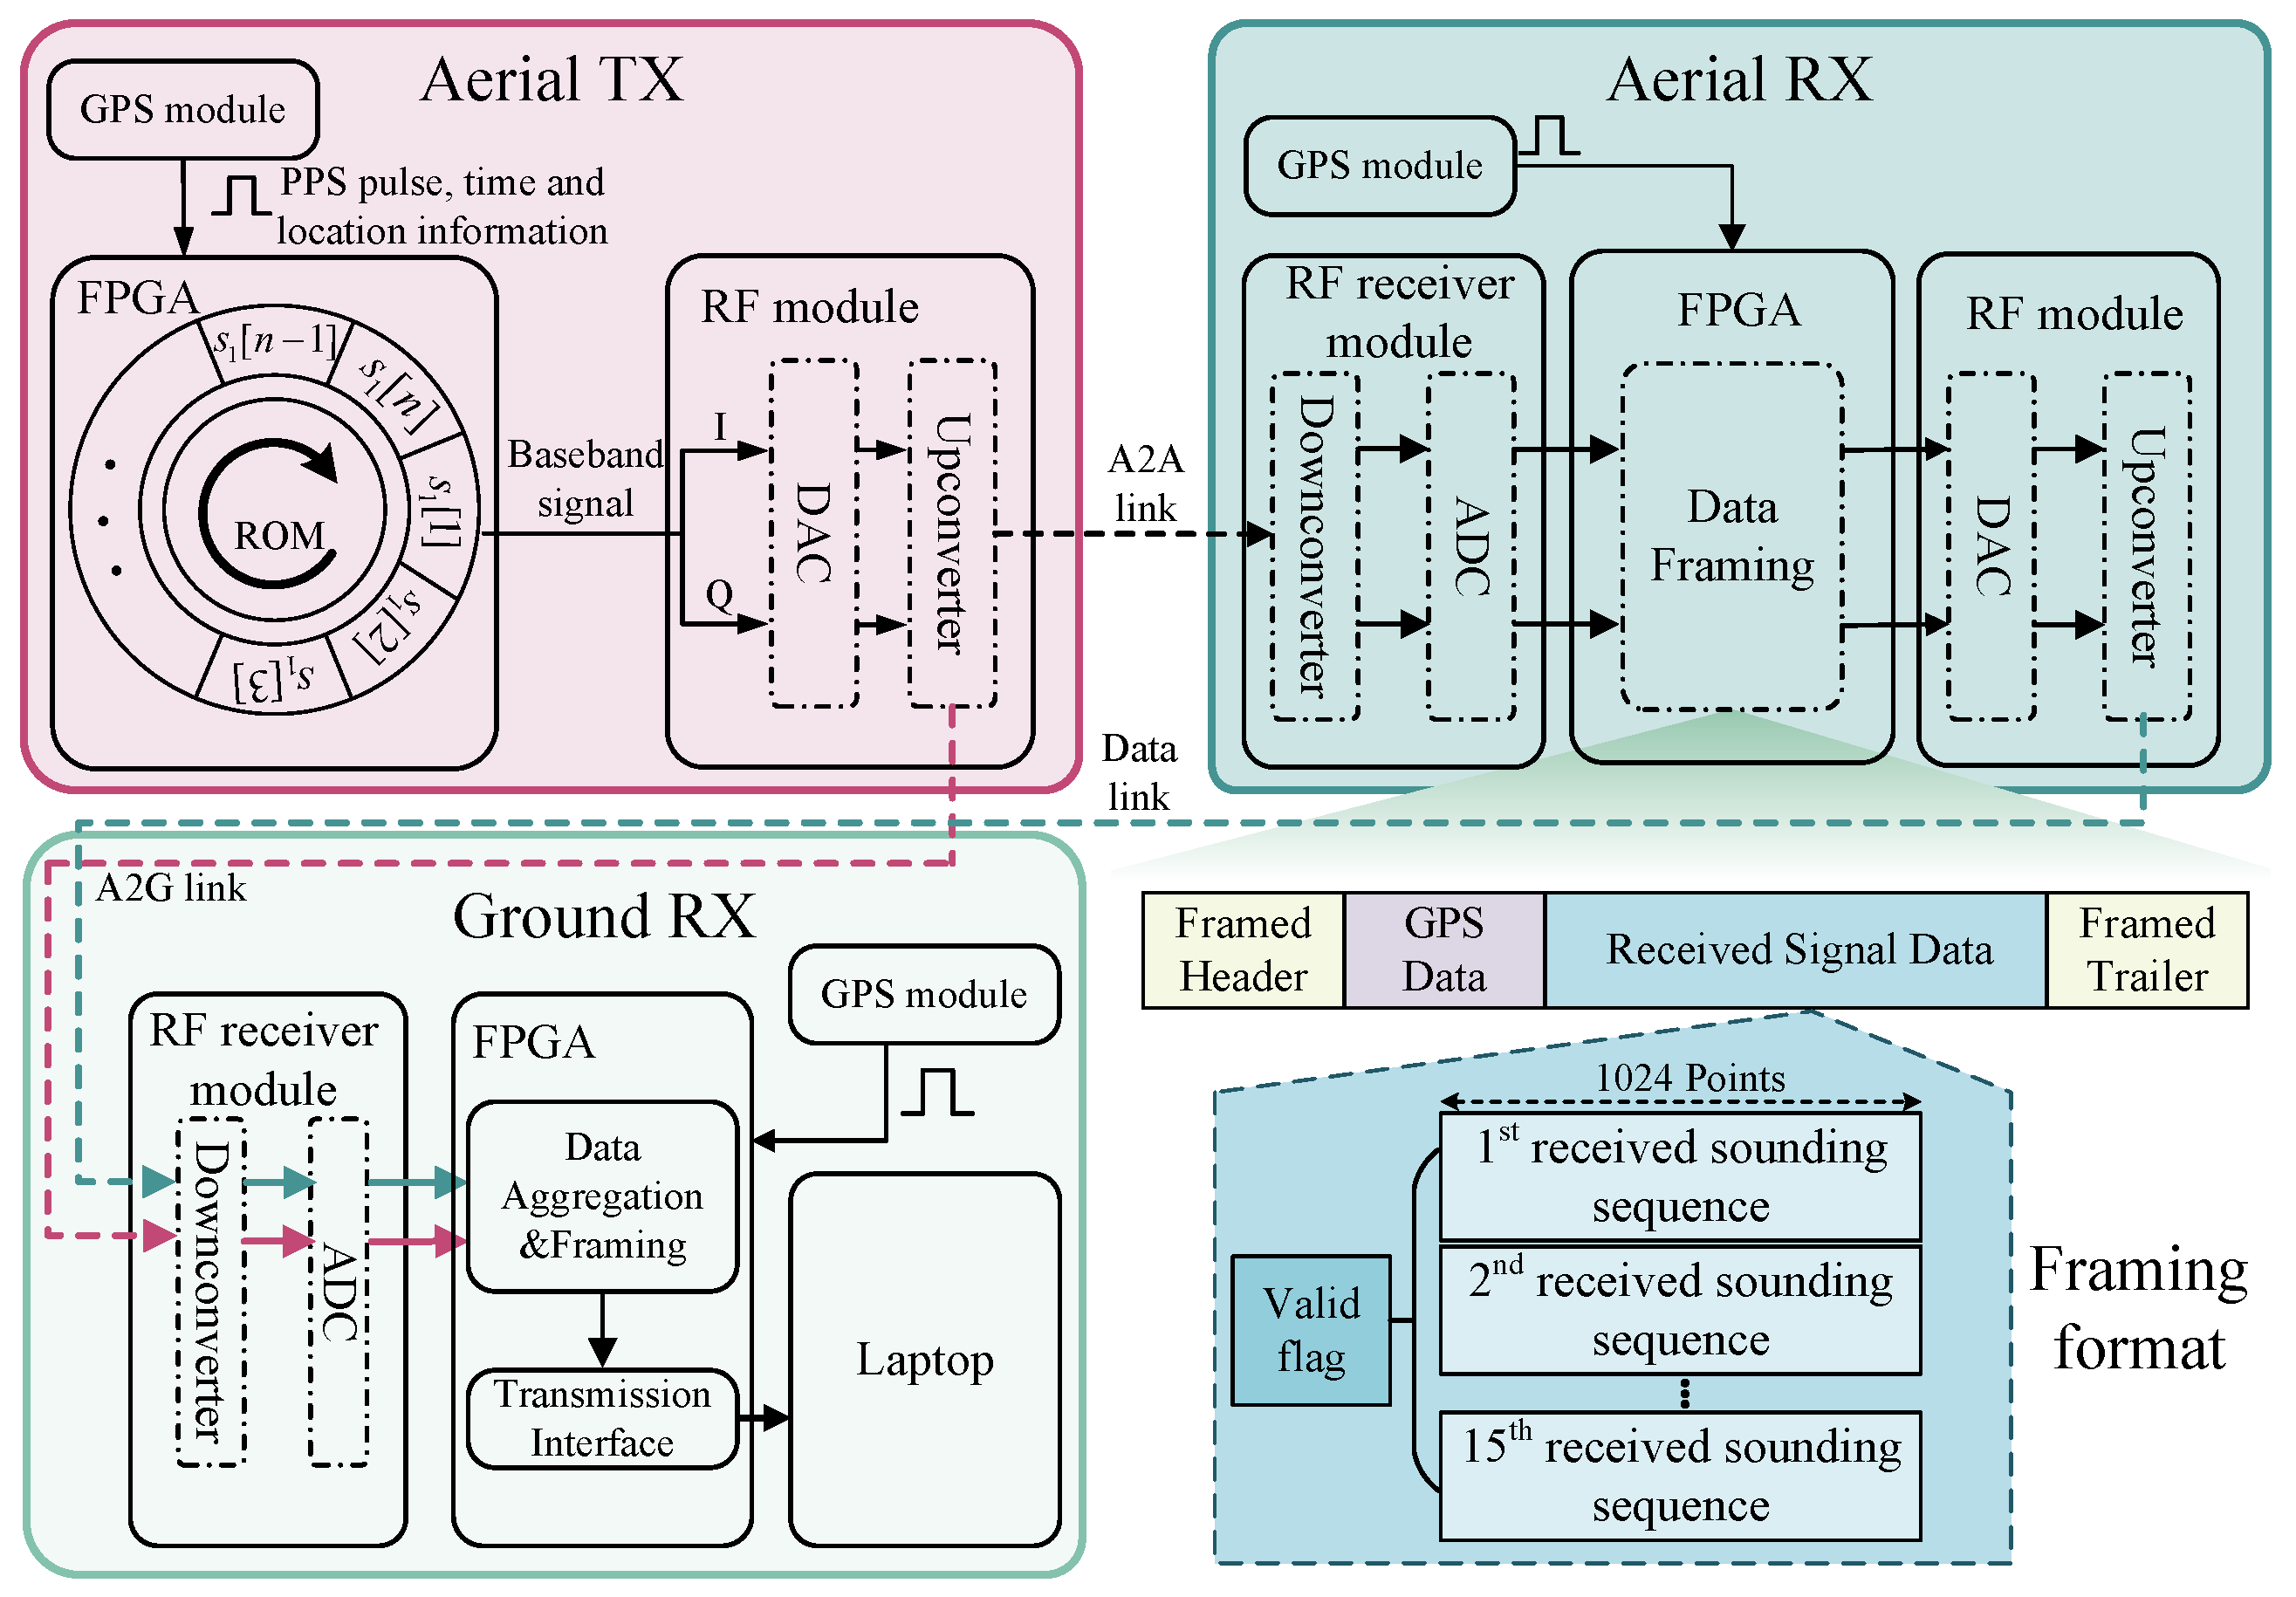
Figure 2 illustrates the complete workflow implemented in the channel measurement system. During the measurement campaign, the aerial TX periodically transmits preloaded channel sounding sequences, which undergo digital-to-analog conversion, frequency up-conversion, and RF amplification before being radiated into the air. The signals are simultaneously received by the aerial RX and the ground station, forming the A2A and A2G measurement links, respectively. At the receiver side, the incoming signals are first subjected to RF down-conversion and analog-to-digital conversion to obtain the baseband waveforms. To address the limitation of onboard data storage and enable real-time data collection for the A2A link, the aerial RX adopts a real-time frame-based data relay scheme, in which the digitized waveforms are labeled using GPS timestamps, packed, and then transmitted to the ground station. The ground station will store all the data frames via an Ethernet link and perform further data postprocessing.
Figure 2.
Workflow of the developed channel measurement system.
The developed channel measurement system enables fully synchronized channel sounding among aerial and ground nodes, effectively addressing key challenges in UAV-based channel measurement systems, such as payload, size, weight, time synchronization, and data transmission and storage. By integrating both A2A and A2G measurement capabilities into a single system, it ensures that data from both links are captured simultaneously and accurately, without the need for separate measurement campaigns, which significantly improves measurement efficiency, reduces the overall complexity of the experimental setup, and ensures consistent data for both A2A and A2G channels.
3. Data Postprocessing and Statistical Channel Properties
3.1. Raw CIR and Valid Multi-Path Extraction
The measurement approach adopted in this paper is based on time-domain techniques. Specifically, the sliding correlation method is employed, whereby the received signal is correlated with a local sounding sequence to obtain the delay profile within each sounding period. Since sliding correlation requires a periodic sounding sequence with high autocorrelation properties, the Zadoff–Chu (ZC) sequence is adopted due to several advantageous features, including constant envelope, flat spectral density, and low generation complexity. The ZC sequence can be expressed as
where , is the length of the sequence, and is relatively prime to . Raw CIR snapshots extracted via the sliding correlation can be expressed as
where represents the CIR snapshot at time instant t, is the received signal, denotes the locally stored ZC sequence, and ⊗ denotes the correlation operation. Based on the mathematical relationship between convolution and correlation operations, the correlation between two sequences can be equivalently expressed as
In practical measurement systems, the estimated CIR obtained from correlation inherently includes not only the wireless propagation channel but also the distortion introduced by the system hardware components, such as filters, amplifiers, cables, and converters. These components contribute to the overall system frequency response, which may affect both the amplitude and phase of the measured CIR. To ensure that the extracted CIRs accurately reflect the true propagation environment, it is necessary to eliminate the influence of the system response through a calibration procedure. In this paper, a back-to-back (B2B) calibration measurement is performed prior to the field experiments. The transmitter and receiver are directly connected through the RF front-end using the same RF cable with proper attenuation to prevent saturation. The measured impulse response of the B2B calibration measurement is denoted as . The CIR after removing the system impulse response can be expressed as
where denotes the frequency-domain representation of the raw CIR obtained through the Fast Fourier Transform (FFT) operation, and represents the system response measured from the B2B calibration after applying FFT. denotes the inverse FFT.
The raw measured CIR contains both noise and valid MPCs. To decrease the data size and increase the data processing efficiency, it is necessary to separate the valid MPCs from background noise and spurious peaks. A straightforward approach is to apply a constant threshold determined from the average noise floor. In this method, the detection threshold is typically set 20–30 dB below the strongest path. However, this approach assumes a stationary noise level and often leads to the misidentification of false MPCs or the omission of weak but valid components, especially in low-SNR or non-stationary environments. To address these limitations, the CFAR detection method is adopted in this paper. The CFAR adaptively adjusts the detection threshold for each CIR snapshot based on the local noise statistics. The dynamic threshold for the t-th snapshot can be expressed as
where , is the sliding window, and is the length of the guard cell. is the threshold factor, where is the probability of false alarm. The valid MPCs can be extracted as
where and denote the delay and power of the i-th detected path, respectively, and is the sampling interval. Alternatively, this can be expressed using a peak detection operator as
3.2. Statistical Channel Properties
This section focuses on the calculation of different channel characteristics based on the measurement data. The PL characterizes the power attenuation experienced by a signal during propagation, caused by a combination of factors such as free-space propagation, multi-path fading, and obstruction by physical objects. It is a typical large-scale fading characteristic. To calculate the PL, the SSF needs to be removed from the CIR snapshot. Thus, we obtain the averaged CIR by averaging CIR snapshots within a sliding window. Let denote the i-th snapshot CIR for calculating the m-th averaged CIR. The window-averaged CIR is given by
where W is number of CIR snapshots used for averaging, which can be determined by the wavelength [15]. According to the valid MPCs from the averaged CIR, the measured PL can be calculated as
where is the number of the valid MPCs, and is the power of the l-th valid MPC in the m-th CIR.
To illustrate the temporal evolution of the PL and establish a basis for the subsequent SF analysis, the measured PLs are modeled by the close-in (CI) reference PL model. In this model, the free-space PL at a reference distance serves as the anchor, while the PLE characterizes the rate of attenuation with distance. The CI model can be expressed as
where is the free space PL at the reference distance , and n is the PLE. represents the SF, which is a random variable following the zero-mean normal distribution with a standard deviation of in dB.
The Rician K-factor is defined as the ratio of the power of the strongest path to the sum of the powers of all other MPCs. It serves as an important metric for evaluating the strength of the dominant component in the received signal and is widely used to assess the stability of the wireless channel, which can be expressed as
where denotes the power gain of the dominant path, while represents the total power gain of the remaining MPCs. A LoS scenario normally has a high K-factor, implying a more stable propagation environment.
The RMS-DS characterizes the temporal dispersion of MPCs and serves as a key parameter for evaluating the frequency selectivity of the channel. It indicates the channel’s coherence bandwidth, which is an important reference for managing the inter-symbol interference. It can be expressed as
where denotes the propagation delay associated with the l-th MPC.
To extract the SSF from the measurement, a sliding window with a spatial length of several wavelengths is applied to the received signal waveform, where the PL needs to be removed. The SSF can be calculated as
where is the sample of the received signal with in the m-th slice of the received signal.
4. Measurement Results and Analysis
4.1. System Validation
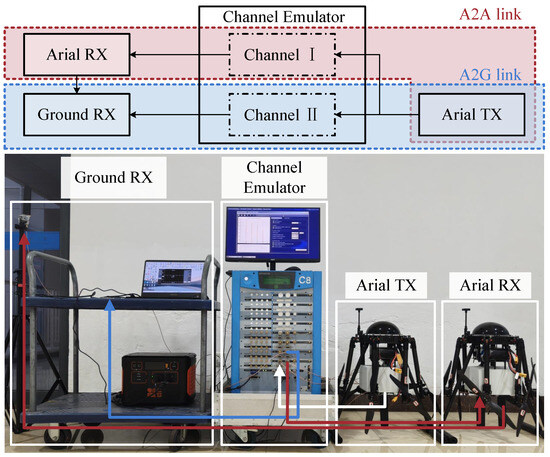
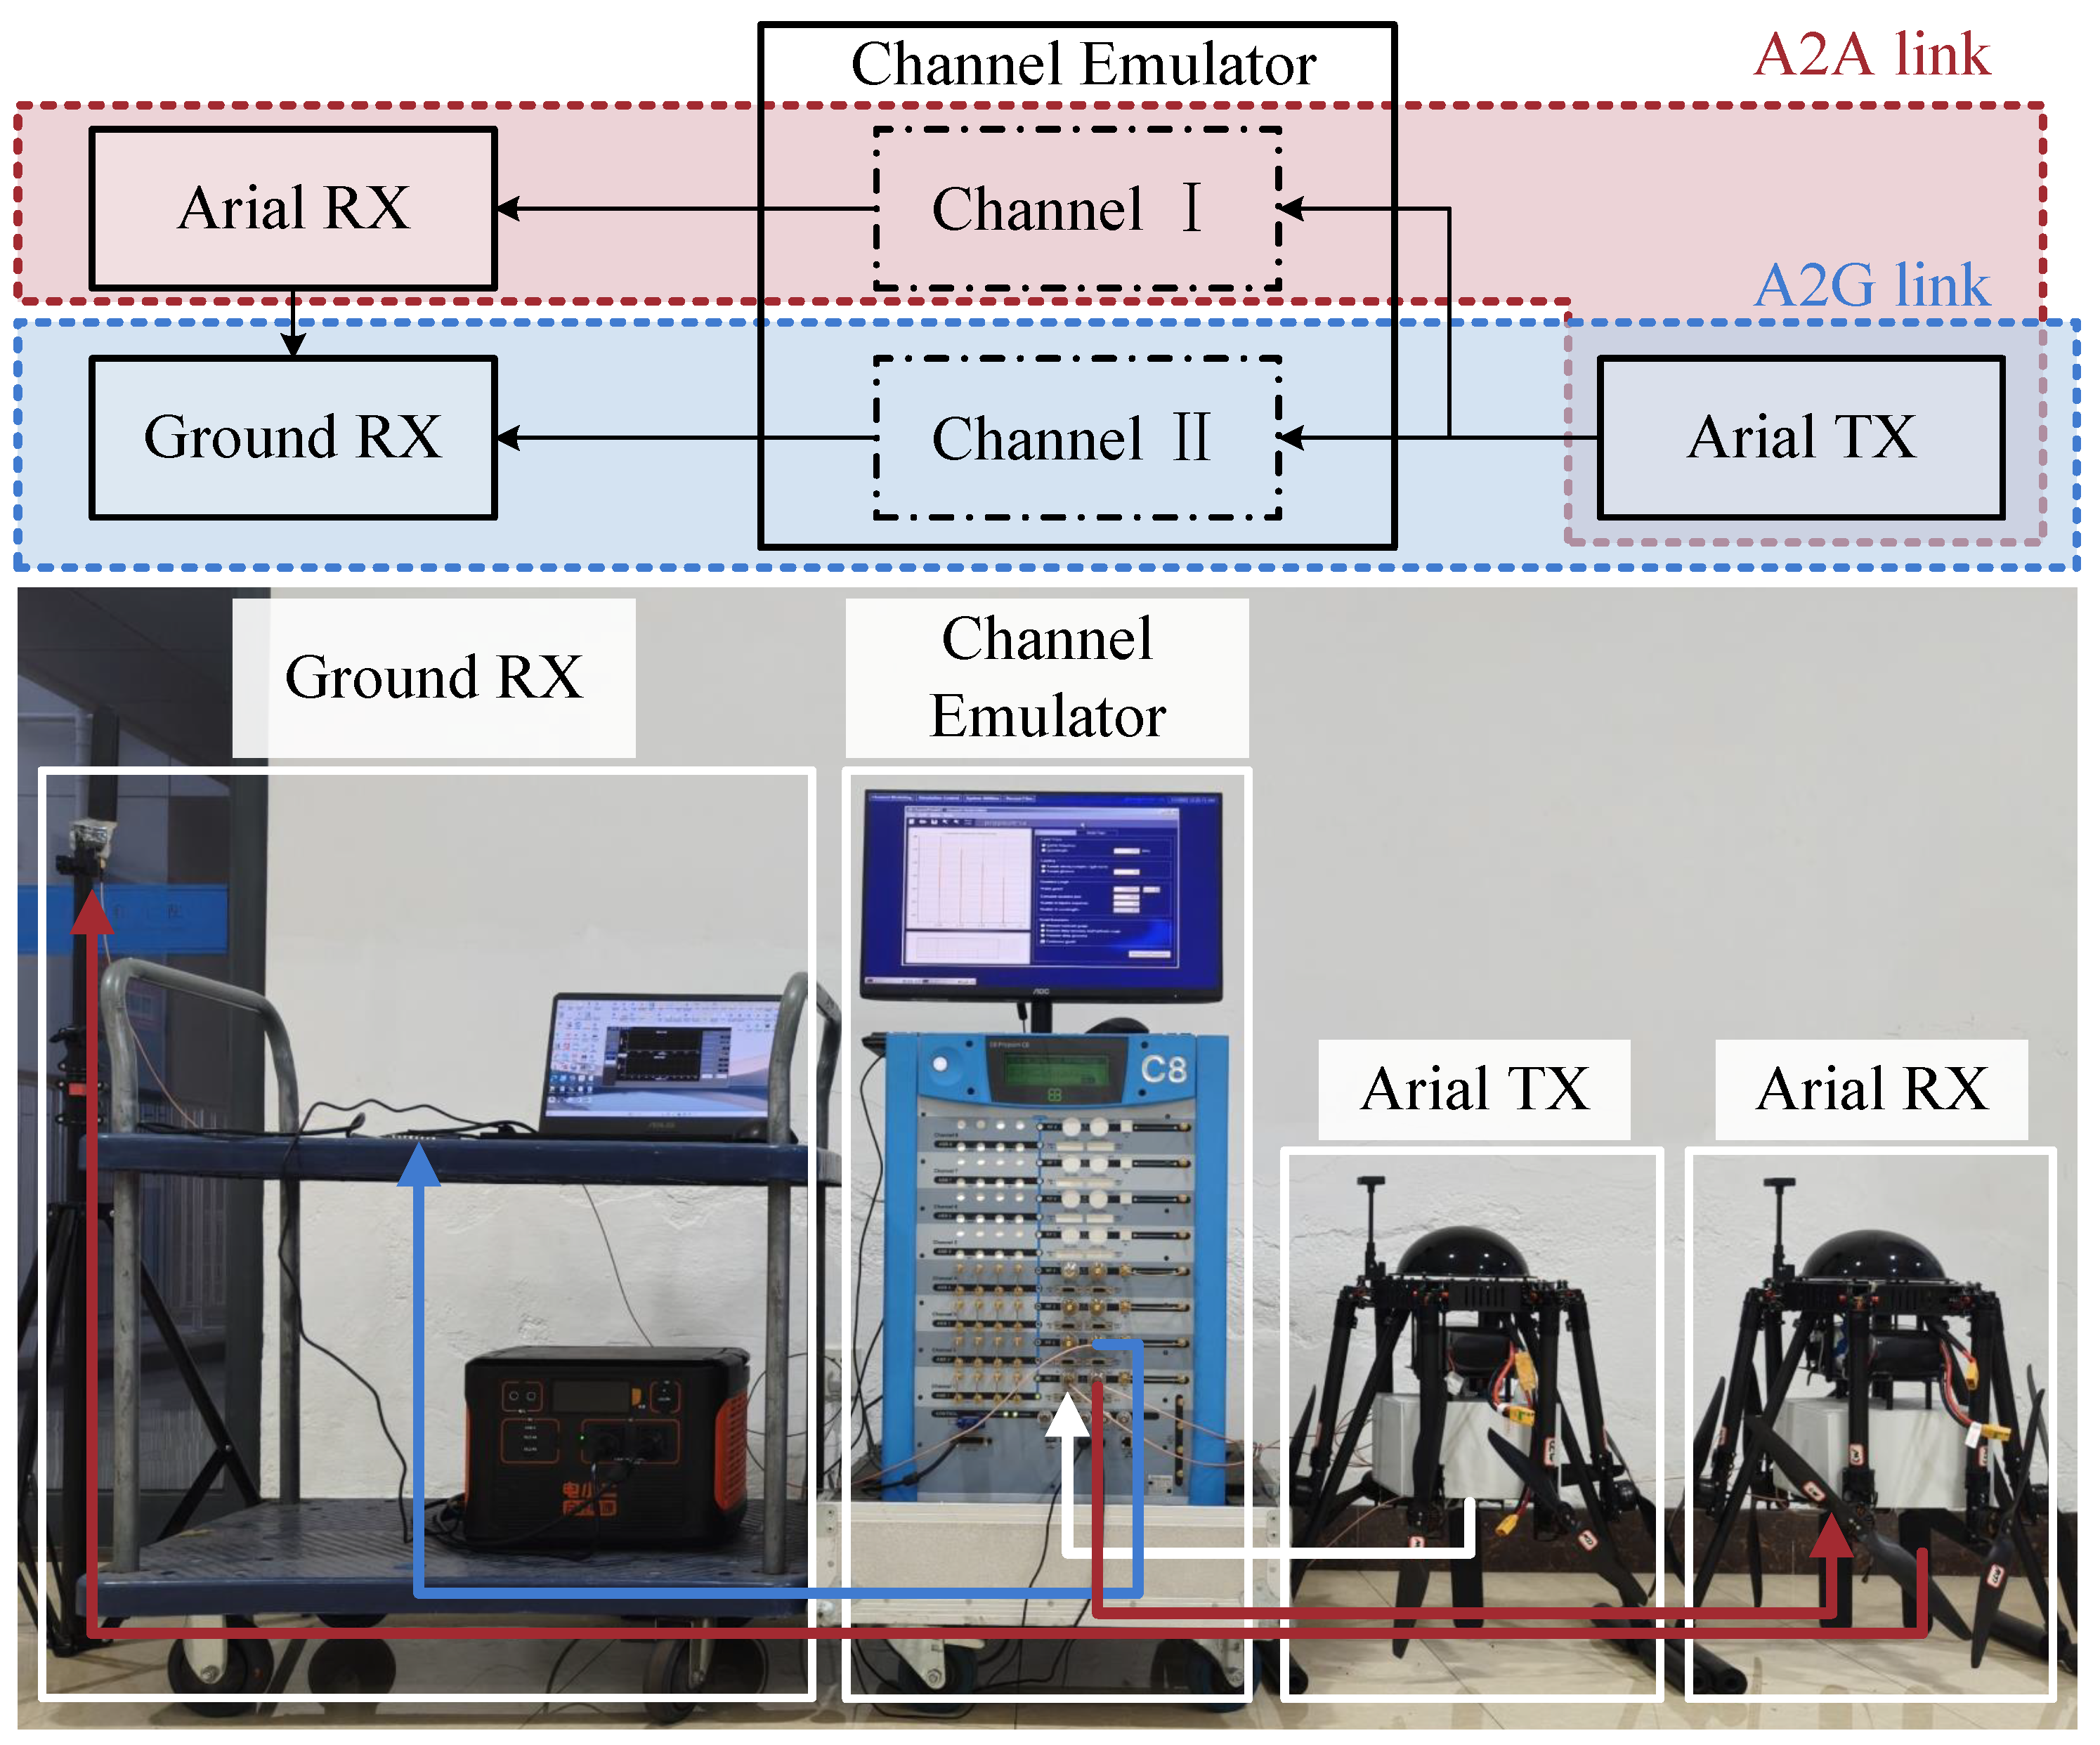
To validate the effectiveness and accuracy of the developed channel measurement system, a verification experiment is conducted by using a channel emulator. The channel emulator is capable of constructing channels with precisely controlled path delays and path gains, allowing quantitative evaluation of the accuracy of the measurement system. As shown in Figure 3, the verification setup replicates the actual measurement configuration, including the aerial TX, aerial RX, and ground RX, which are all connected to the channel emulator through RF cables. Two independent channels are configured in the emulator to emulate the A2A and A2G links, respectively, corresponding to Channel I and Channel II. The predefined parameters for each channel, including the path index, path delay, and path gain, are listed in Table 2.
Figure 3.
Verification of the channel measurement system using a channel emulator.
Table 2.
Predefined channel parameters in the channel emulator.
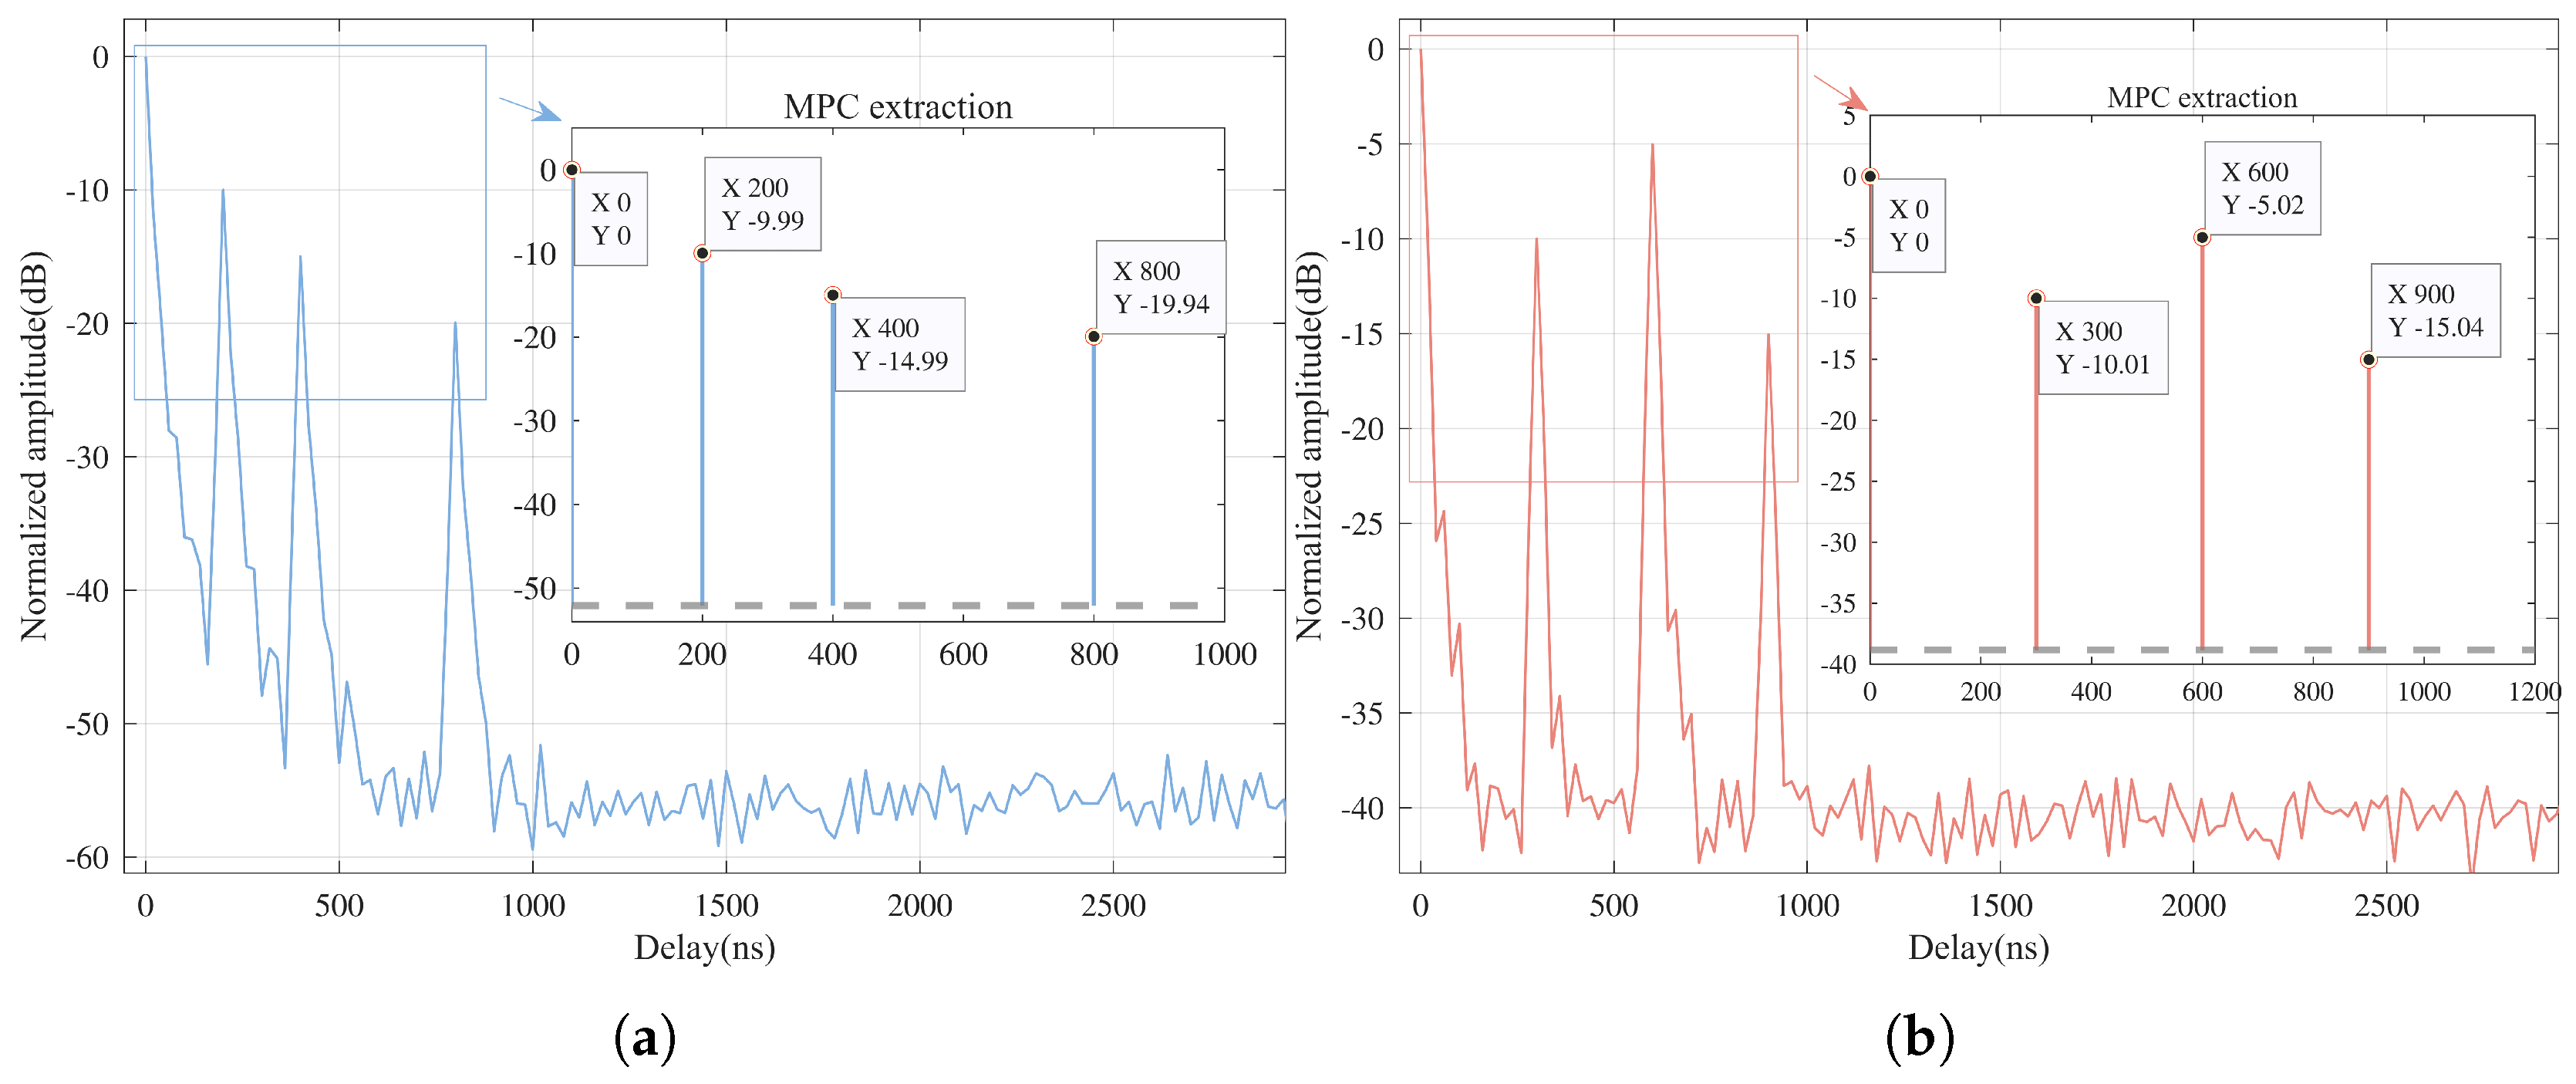
The measured CIRs for both links are shown in Figure 4a,b. The results indicate that the MPCs extracted from the measured CIRs align closely with the parameters defined in the channel emulator. For the A2A link, the extracted paths exhibit delays of 200 ns, 400 ns, and 800 ns with corresponding gains of −9.99 dB, −14.99 dB, and −19.94 dB, respectively. Similarly, for the A2G link, the extracted delays of 300 ns, 600 ns, and 900 ns with gains of −10.01 dB, −5.02 dB, and −15.04 dB match well with the predefined channel parameters. These results verify that the developed channel measurement system accurately captures the multi-path structure of the propagation channel. The consistency between the measured CIRs and the emulator-defined channels confirms the system’s capability for reliable and precise A2A and A2G channel measurements.
Figure 4.
Measured channel impulse responses (CIRs) for (a) air-to-air (A2A) measurement link and (b) air-to-ground (A2G) measurement link.
4.2. Measurement Campaign
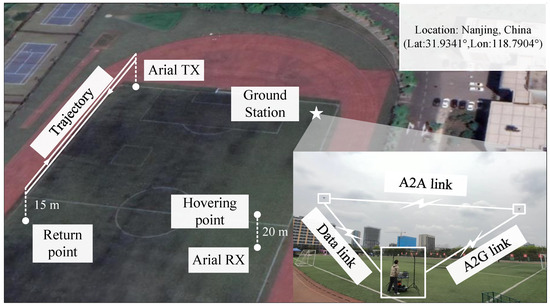
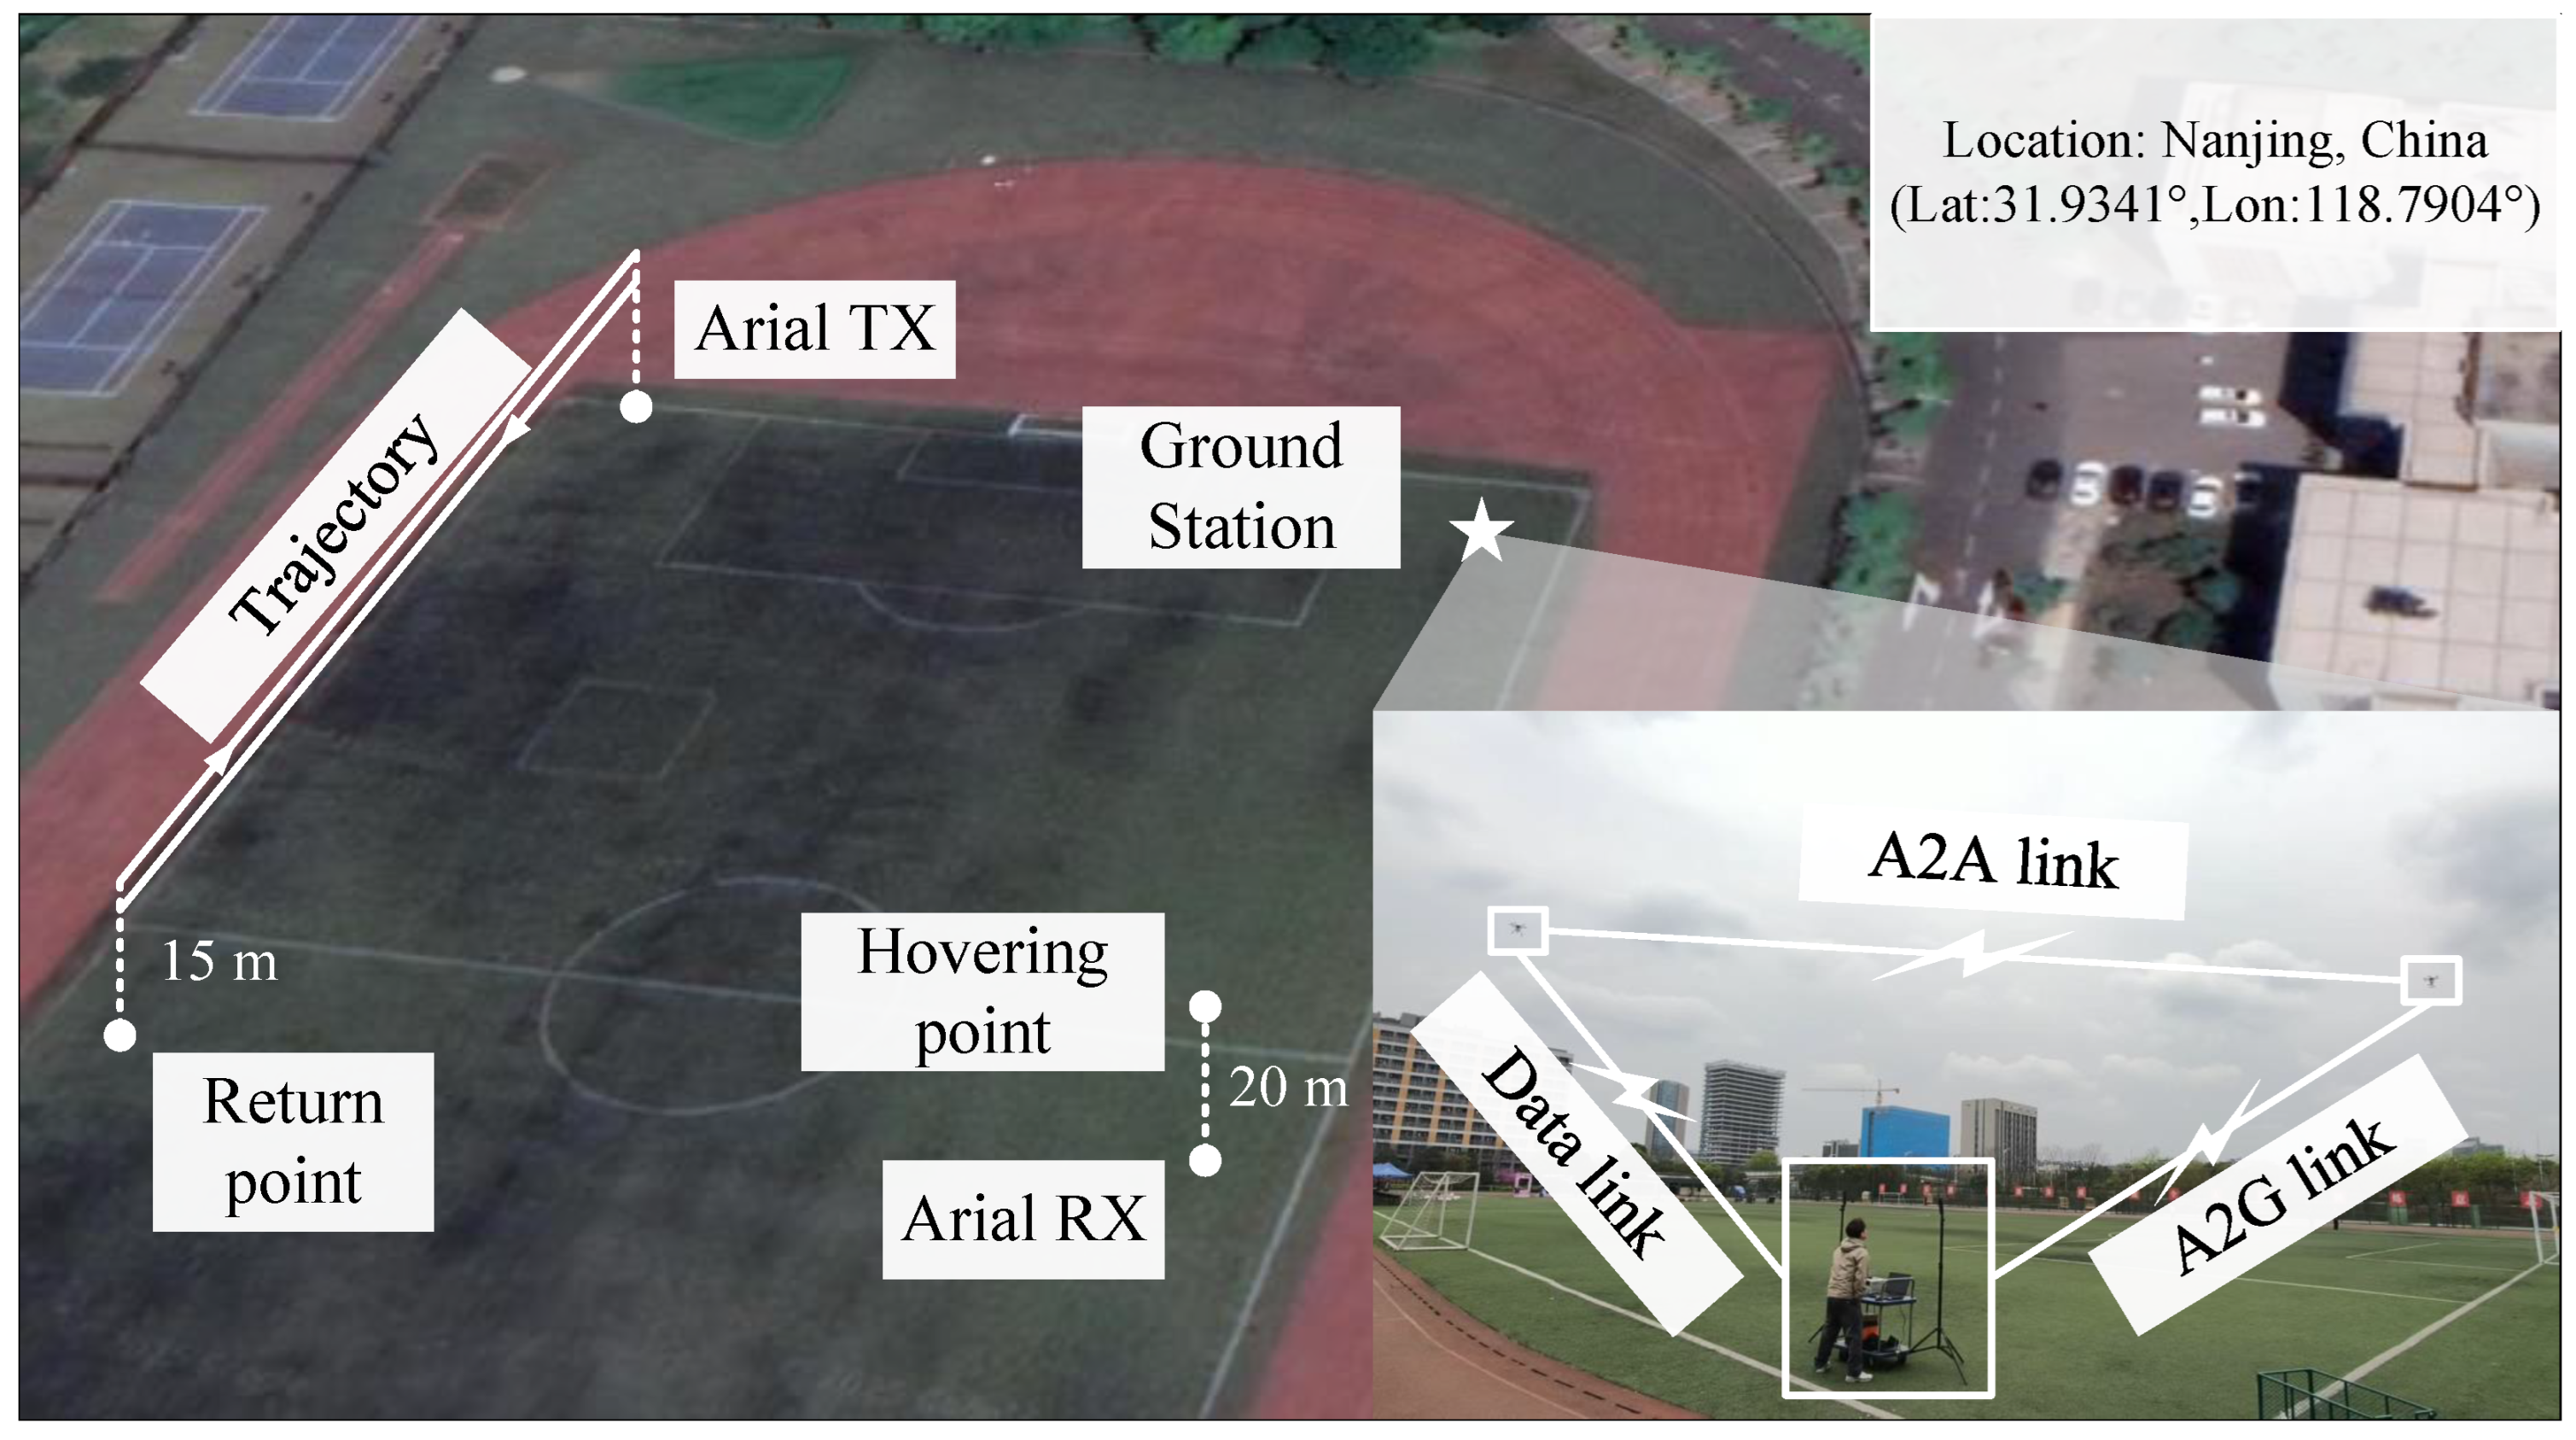
The measurement campaign is conducted in a campus scenario with the GPS information (Lat:31.9341°, Lon:118.7904°), as shown in Figure 5. The measurement site was located within a standard athletic field surrounded by typical urban environmental features that introduce diverse scatterers. To the west of the site lies an urban expressway, introducing potential interference from moving vehicles. The eastern and southern sides are bordered by dense urban surroundings with typical building heights around 25 m, providing rich sources of shadowing and multi-path reflections. In contrast, the northern side is relatively open, enabling dominant LoS propagation.
Figure 5.
Measurement scenario.
During the measurement campaign, the aerial TX flew following a straight trajectory along the edge of the field at a constant altitude of approximately 15 m, while the aerial RX hovered steadily above the opposite side of the field at an altitude of 20 m, maintaining a continuous LoS connection with both the aerial TX and the ground RX. This configuration enabled synchronized A2A and A2G measurements under identical environmental and temporal conditions, ensuring data consistency and cross-link comparability. The carrier frequency of the sounding signal is 3.2 GHz. This frequency is selected adjacent to a typical 5G band of 3.6 GHz. However, due to significant interference from active commercial 5G base stations observed during preliminary spectral scanning at 3.6 GHz, the 3.2 GHz band is utilized to avoid interference and ensure measurement accuracy. The bandwidth of the system is 50 MHz and the sequence length is 1024. All devices are synchronized through GPS PPS signals, ensuring precise timing alignment across the three nodes during the measurement.
4.3. Measurement Result Analysis
It is worth noting that propagation channel characteristics can vary significantly under different antenna polarizations [19,20]. The results presented in this work are specific to the vertical polarization (VP) configuration.
To gain deeper insight into the channel characteristics of LA communications under different link types, simultaneous A2G and A2A measurement channels are compared and analyzed, including PL, SF, K-factor, RMS-DS and SSF.
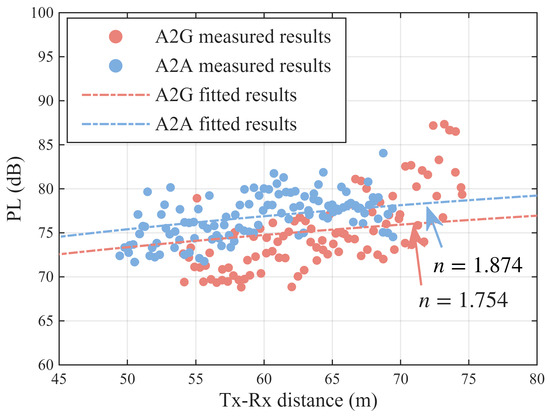
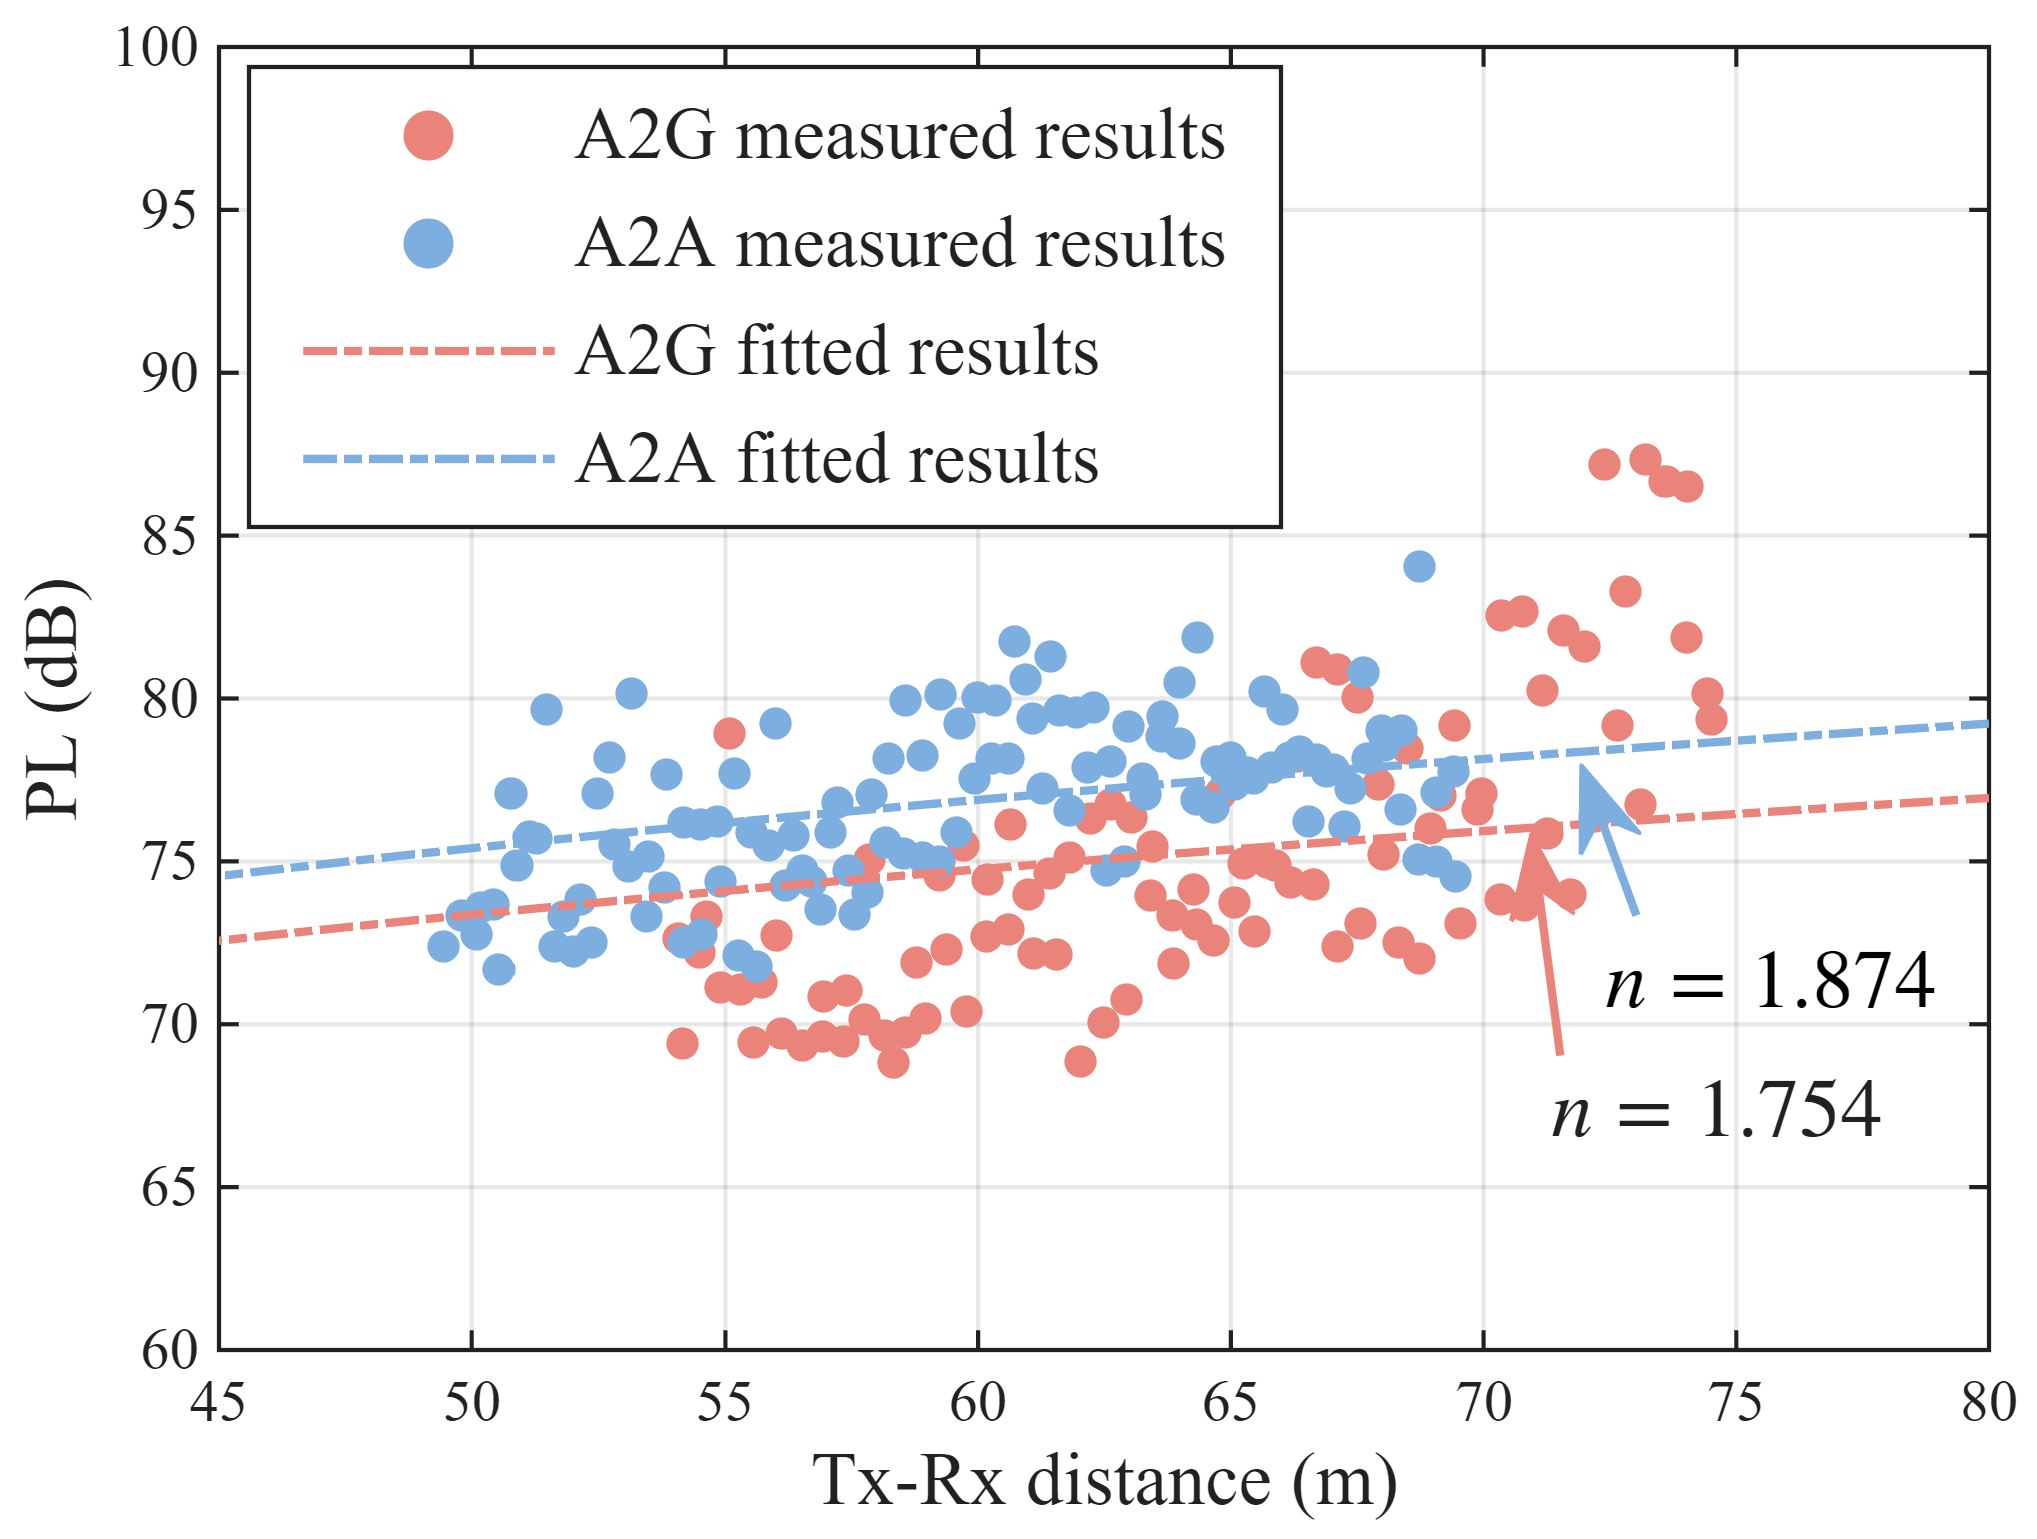
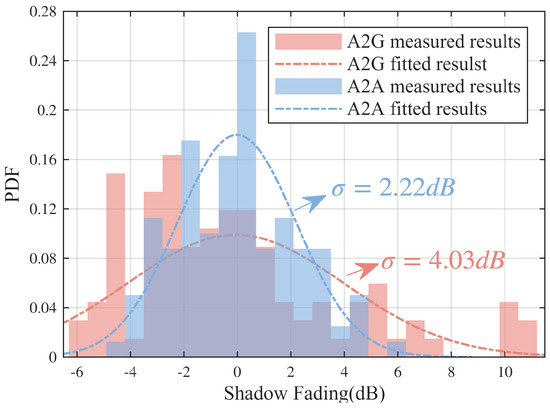
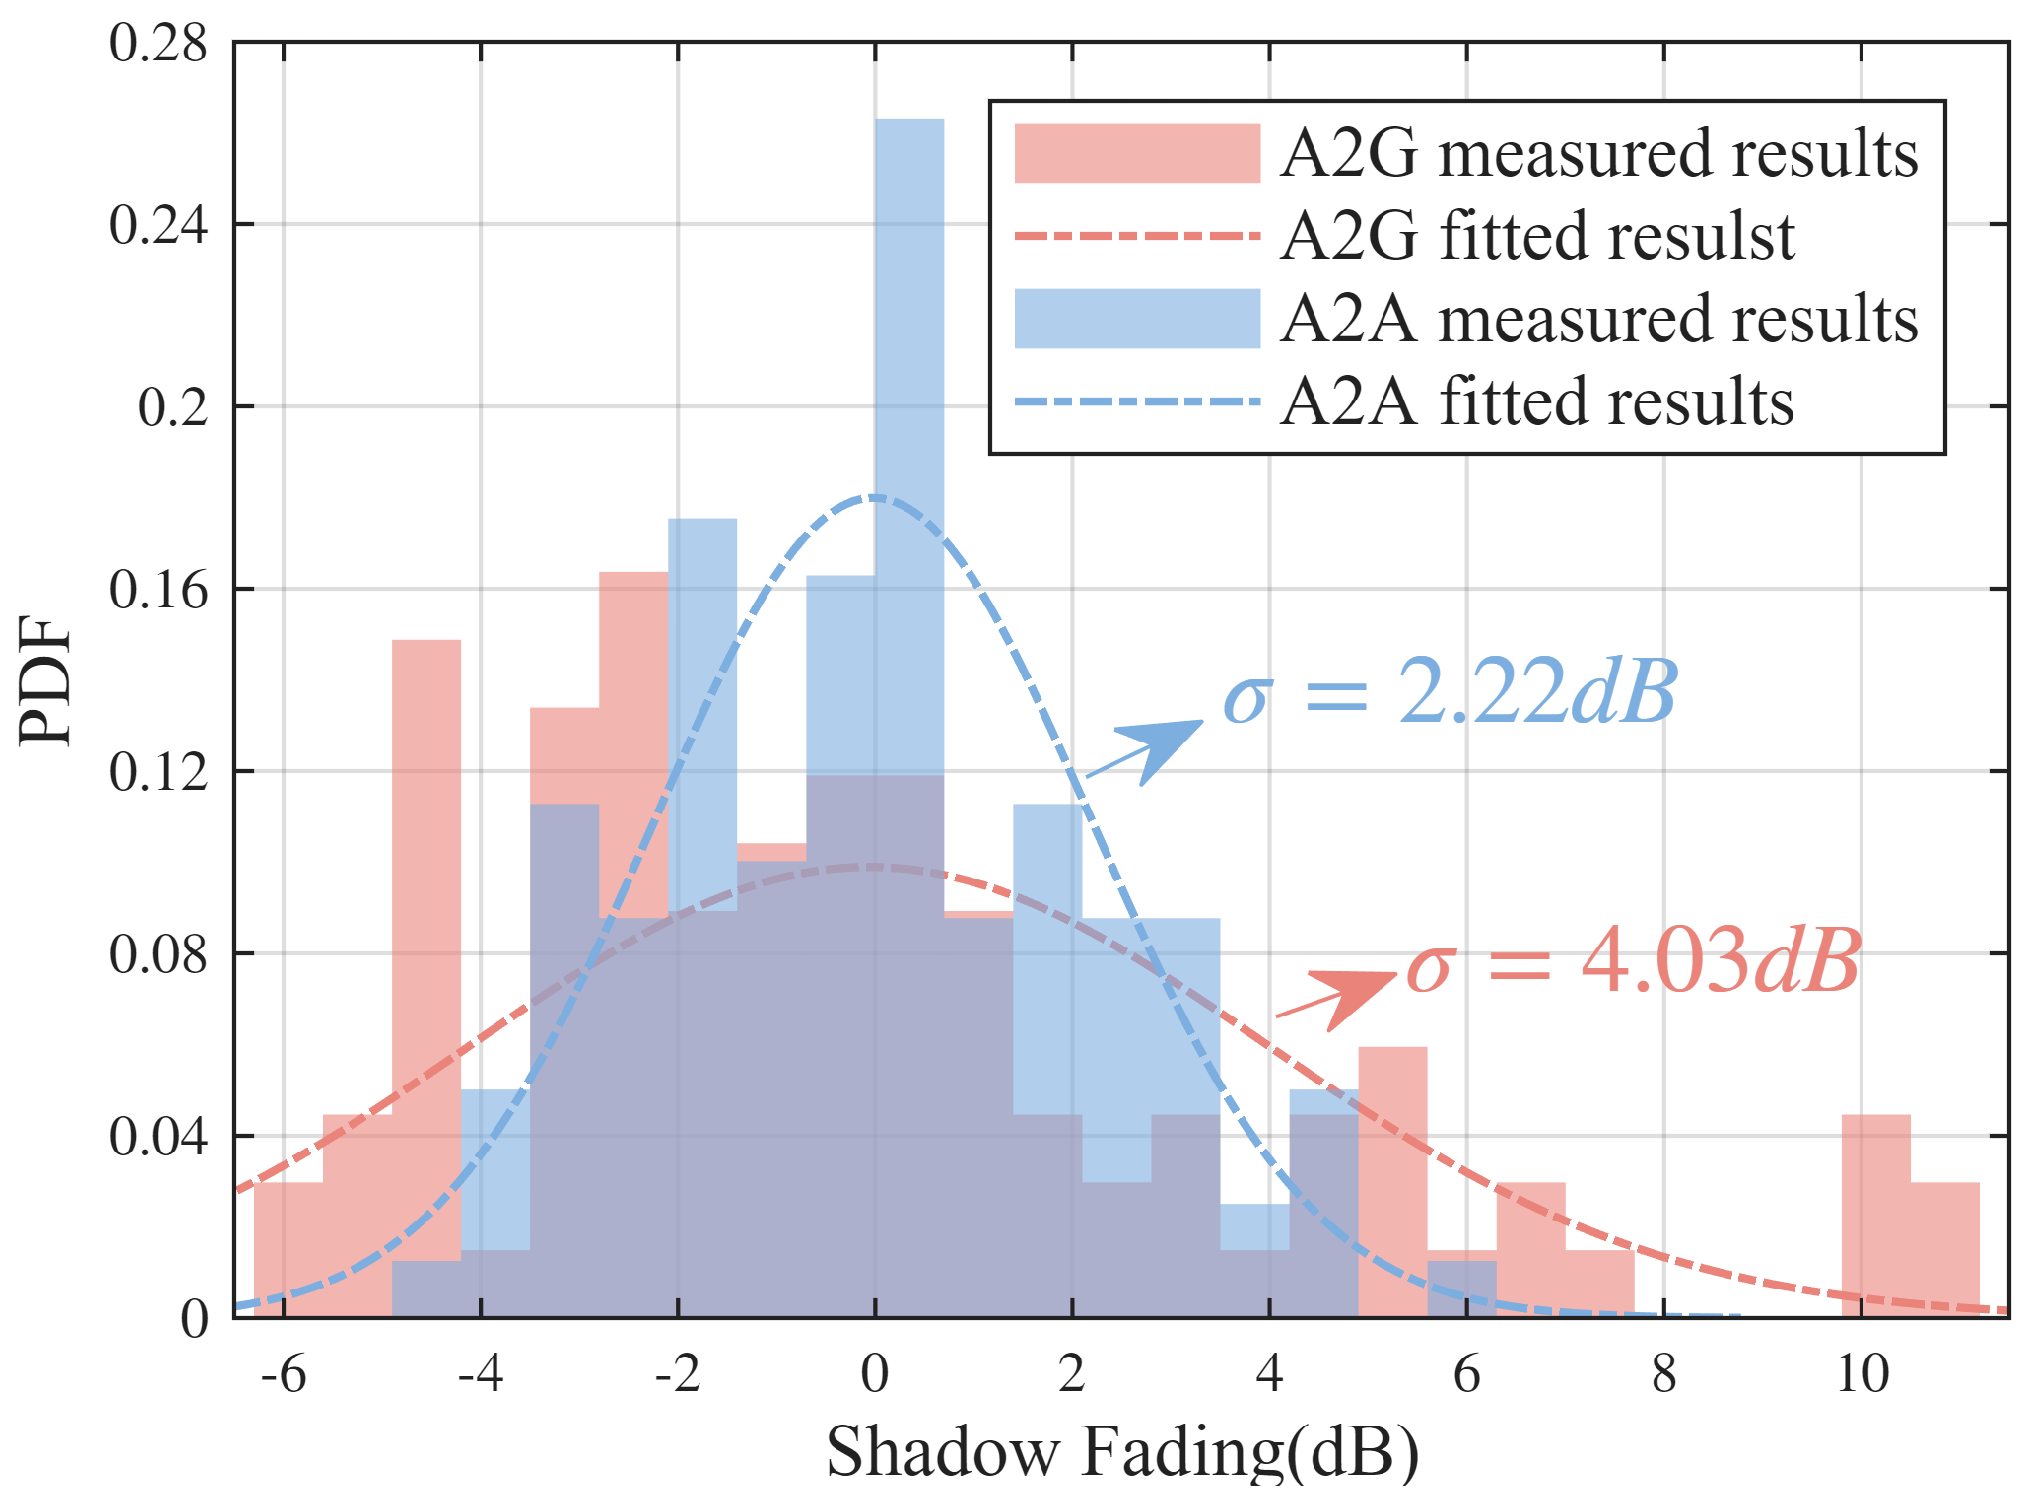
Figure 6 presents the measured and fitted PLs. The fitted PLEs are 1.874 for the A2A measurement link and 1.754 for the A2G measurement link. This difference can be explained by the fact that, at low flight altitudes where both links maintain LoS conditions, the A2G channel usually experiences more MPCs generated by rich reflections and scattering than the A2A, which contribute extra received power and thus lead to a smaller PLE. As shown in Figure 7, the standard deviations of SF are 2.2 dB for A2A measurement link and 4.0 dB for A2G measurement link, respectively. The larger SF variance of the A2G link is mainly caused by the complex ground environment, where buildings and other scatterers lead to stronger large-scale power fluctuations. In contrast, the A2A link operates within a less cluttered propagation environment, resulting in smaller SF variations.
Figure 6.
Measured and fitted path loss (PL).
Figure 7.
Measured and fitted shadow fading (SF).
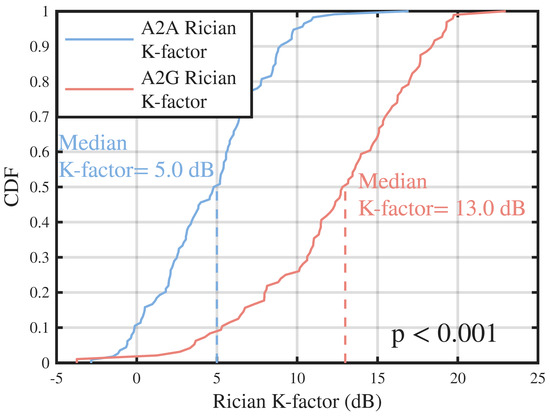
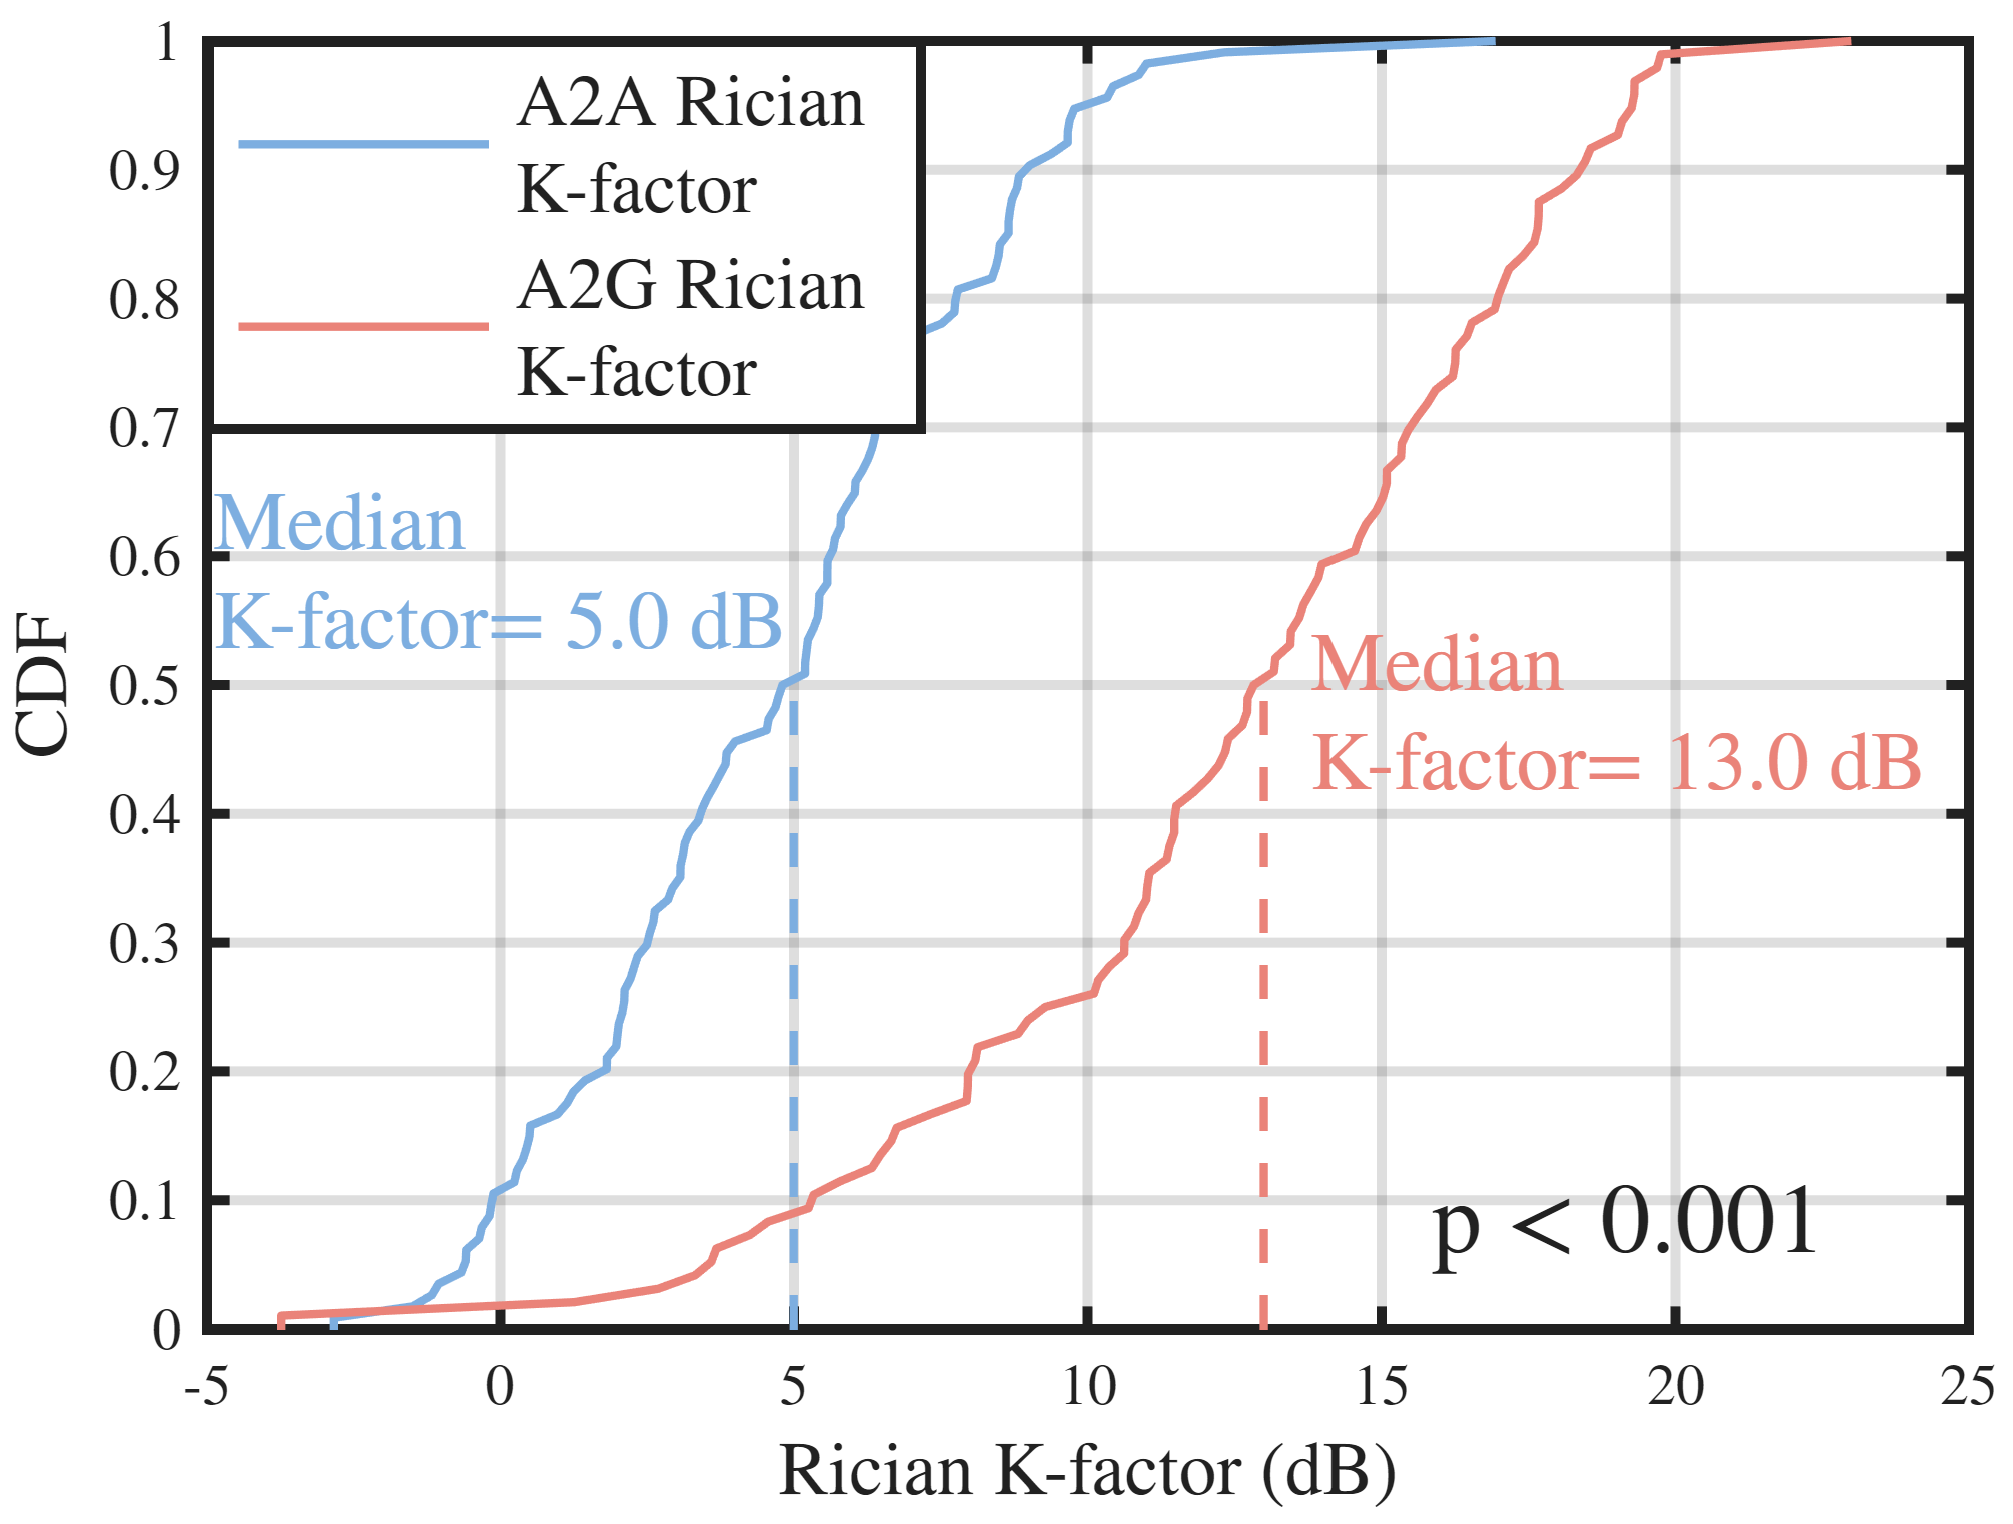
The cumulative distribution functions (CDFs) of the Rician K-factor for the A2A and A2G channels are shown in Figure 8. The A2A link exhibits a smaller median K-factor of 5 dB, whereas the A2G link reaches 13 dB. This result provides a new understanding of K-factor for A2G and A2A channels under low-altitude scenarios. This is because the A2A channel is more probably to experience a strong ground reflection due to the geometrical relationship between two aerial nodes and the ground. It will increase the summed power of the other MPCs besides the LoS path, which makes the LoS path power less dominant. For the A2G channel, the antenna of the ground station is very close to the ground. It is not easy to form a reflection path in this case. Even though there is a ground reflection path, it will be very close to the LoS path, so that they will be merged into one path in the measurement result because of limited delay resolution of a realistic communication system. The results do not mean the A2A has a poorer channel as it is due to the definition of the K-factor calculation. In a LoS condition, both the A2A and A2G channels have the same strong LoS path under the same TX-RX distance. Note that the results would be valuable for cluster-based UAV channel modeling.
Figure 8.
Measured Rician K-factor cumulative distribution function (CDF).
To substantiate this observation physically, we performed a geometric analysis based on the flight altitudes shown in Figure 5 and the system’s delay resolution. The path difference between the reflected path and the LoS path can be calculated as
where D is the horizontal distance, and , are the heights of the transmitter and receiver. For the A2A link, where and , even at a horizontal distance of , the path difference is , which is larger than the system’s delay resolution . For the A2G link, where and the path difference drops to , which is smaller than the system’s delay resolution.
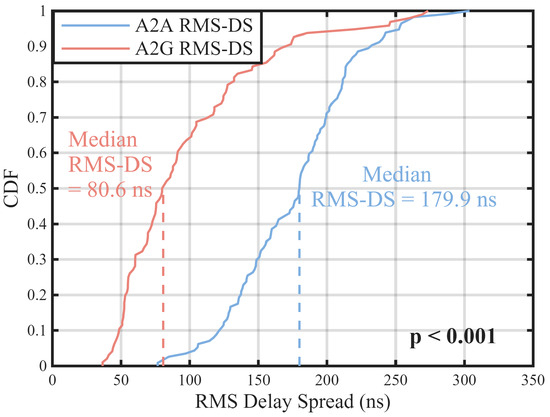
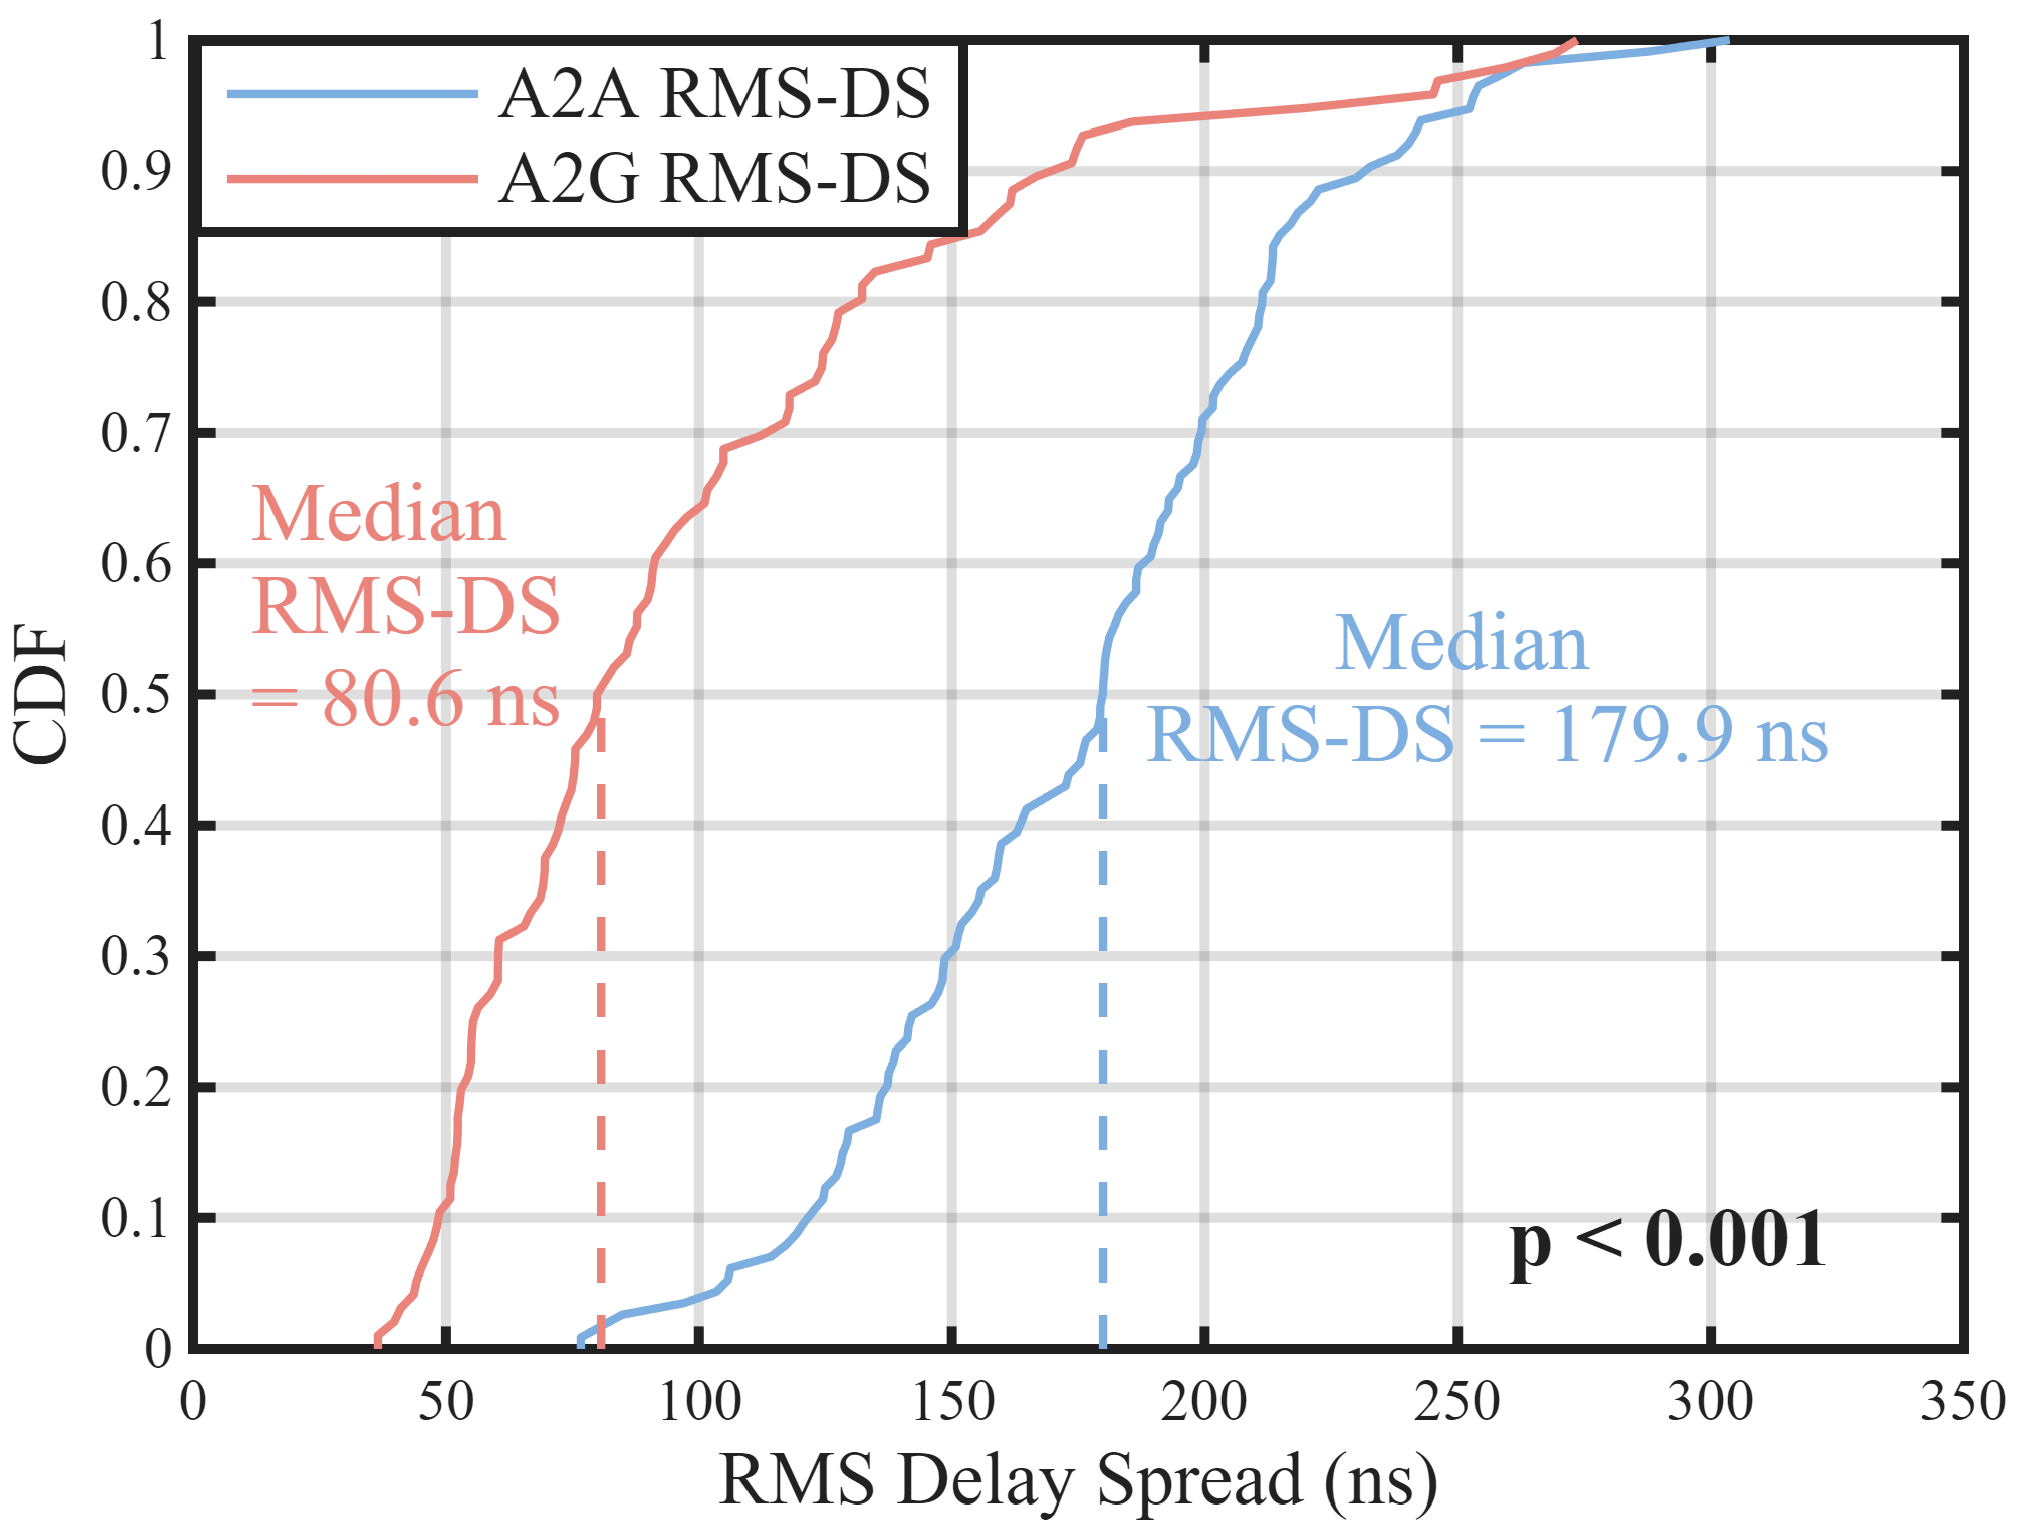
Figure 9 presents the CDFs of the RMS-DS for the A2A and A2G channels. The A2A link shows a larger median RMS-DS of 179.9 ns, compared with 80.6 ns for the A2G link, indicating stronger multi-path dispersion in the A2A channel. The value of the A2A channel is larger is because the A2A channel normally has a longer ground reflection path than the A2G channel. Moreover, the A2G channel has weaker MPCs, where most of the received power is concentrated in the LoS and close ground reflection path (they are merged together in the measurement result), resulting in a smaller delay spread.
Figure 9.
Measured Rician root mean delay spread (RMS-DS) CDF.
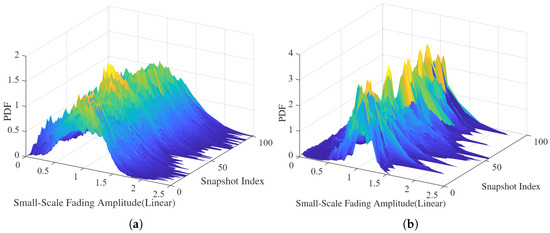
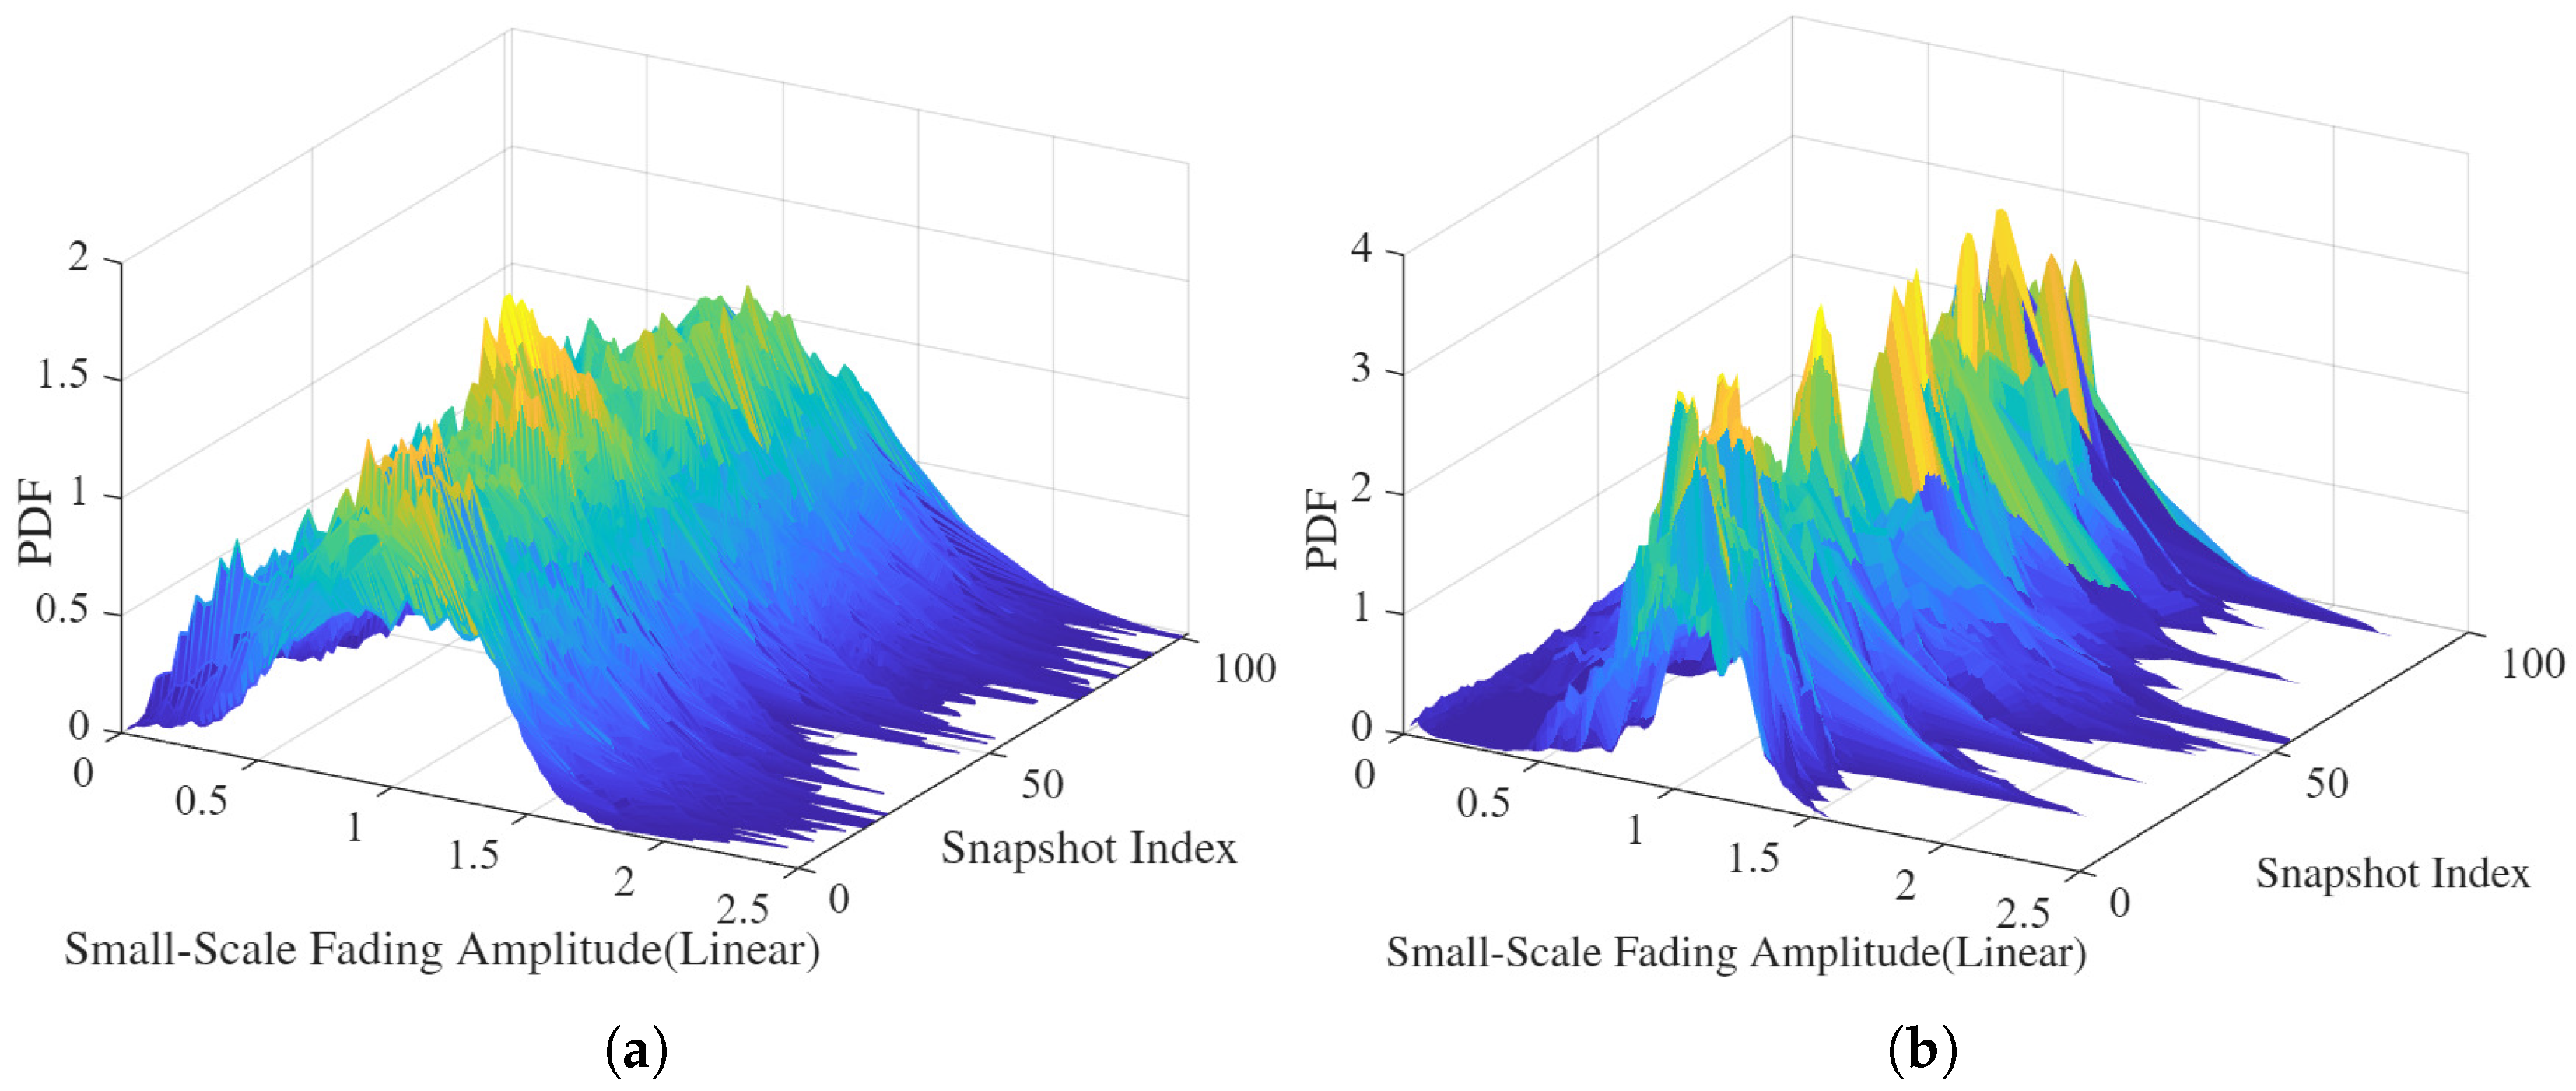
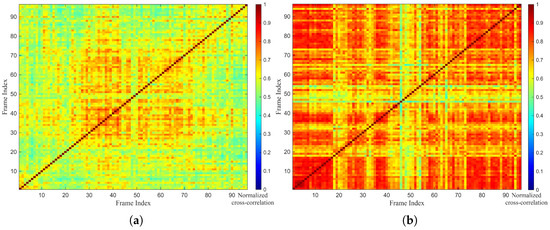
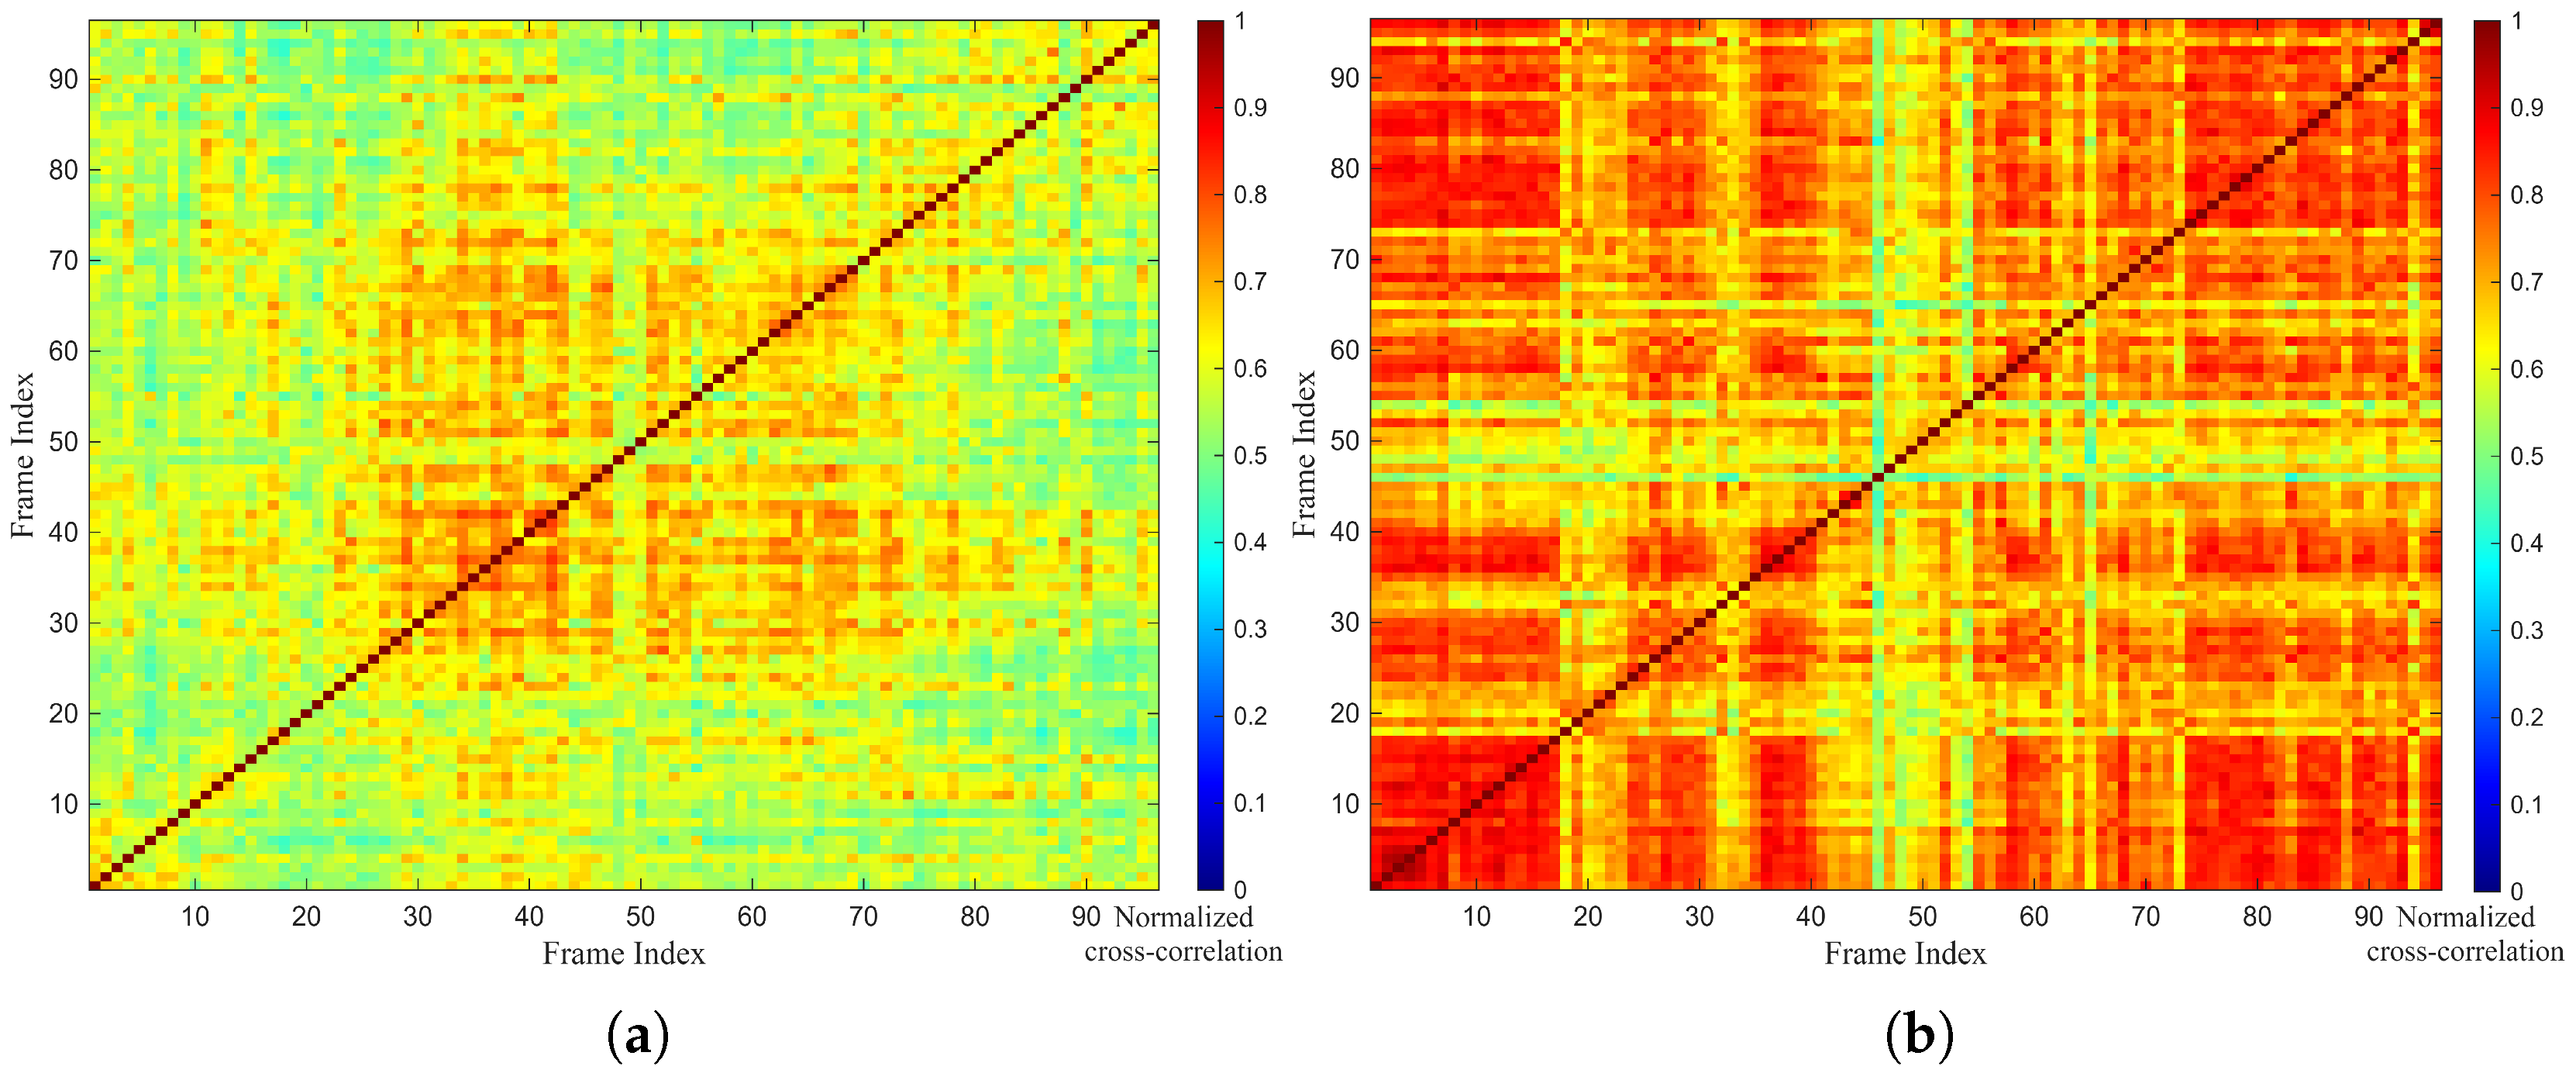
Figure 10 shows the time-variant probability density functions (PDFs) of the SSF amplitudes for the A2A and A2G channels. Visually, the A2A link appears to maintain a relatively consistent distribution shape over time. To quantify the stationarity, we calculate the frame-to-frame maximum normalized cross-correlation matrices of the SSF, as presented in Figure 11. The results reveal that the A2G link exhibits higher stationarity than the A2A link, indicated by the sustained high correlation coefficients. This suggests that the structure of the multipath components in the A2G link remains relatively stable. In contrast, the A2A link shows lower cross-correlation and rapid decorrelation. This could be caused by airframe shadowing effects, since the A2A link is more easily blocked by the airframe due to the similar heights of the drones.
Figure 10.
Measured time-variant small-scale fading (SSF). (a) A2A measurement link. (b) A2G measurement link.
Figure 11.
Normalized cross-correlations of (a) the A2A link and (b) the A2G link.
5. Conclusions
In this work, a novel channel measurement system capable of simultaneous A2A and A2G sounding was designed and verified. The primary contribution lies in the integrated hardware and signal-processing architecture that ensures strict time and frequency synchronization among aerial and ground nodes via GPS-PPS signals. Unlike traditional measurement campaigns that characterize links separately, this system enables the acquisition of aligned data streams, eliminating temporal environmental variations and providing a rigorous platform for the fair comparative analysis of A2A and A2G links. A back-to-back calibration and channel-emulator-based verification further confirmed the accuracy and reliability of the developed system for extracting CIRs.
Based on the validated system, a measurement campaign was conducted in a typical campus environment, revealing distinct propagation mechanisms with significant implications for system design. Under a relatively uniform aerial environment, the A2A channel exhibits richer multi-path dispersion and more stationary fading behavior. The implication is that A2A links may benefit from spatial diversity techniques to exploit the rich multipath, while the channel stability simplifies channel estimation overhead. In contrast, the A2G channel is shaped by the complex near-ground environment, exhibiting stronger shadowing variability and pronounced non-stationarity. Notably, due to the limited delay resolution, the strong ground-reflected paths in the A2G link tend to merge with the LoS component, resulting in a main-path-dominated structure. This suggests that A2G link design must prioritize robustness against rapid temporal fluctuations and shadowing caused by near-ground clutter, requiring adaptive transmission strategies.
The proposed cooperative measurement framework provides a validated foundation for the accurate modeling of UAV channels. While the current measurement campaign serves as a proof-of-concept in a specific low-altitude campus scenario, it demonstrates the system’s capability to resolve fine-grained channel differences. The simultaneous acquisition of A2A and A2G channel states provides unique insights for practical UAV networking. By capturing the joint states of these links, the system enables fine-grained modeling of channel behaviors. From a UAV communication system design perspective, this is essential for developing precise adaptive transmission strategies, effective diversity techniques, and robust Command and Control (C2) protocols. Future work will leverage this verified platform to conduct extensive measurement campaigns across diverse environments and multiple frequency bands. These expanded datasets will be instrumental in deriving more comprehensive and generalizable empirical models to support future aerial network deployment and standardization.
Author Contributions
Conceptualization, H.X. (Hanwen Xu) and H.X. (Hua Xie); methodology, H.X. (Hanwen Xu) and K.M.; software, N.M. and H.L.; validation, B.H., Z.M.; formal analysis, H.X. (Hanwen Xu) and K.M.; investigation, K.M.; resources, Q.Z.; data curation, H.X. (Hanwen Xu), N.M. and H.L.; writing—original draft preparation, H.X. (Hanwen Xu); writing—review and editing, H.X. (Hanwen Xu) and K.M.; visualization, H.X. (Hanwen Xu); supervision, H.X. (Hua Xie); project administration, Q.Z., X.C. and H.X. (Hua Xie); funding acquisition, Q.Z., X.C. and H.X. (Hua Xie). All authors have read and agreed to the published version of the manuscript.
Funding
This work was supported in part by the National Natural Science Foundation of China under Grant No. 62271250 and No. 62431014, and in part by Shenzhen Longhua Science and Technology Innovation Special Funding Project (Industrial Sci-Tech Innovation Center of Low-Altitude Intelligent Networking).
Data Availability Statement
The datasets collected and generated in this study are available upon request to the corresponding author.
Acknowledgments
We would like to express our sincere thanks to all the editors, reviewers and staff who participated in the review of this article.
Conflicts of Interest
The authors declare no conflicts of interest.
References
- Zeng, Y.; Lyu, J.; Zhang, R. Accessing from the sky: A tutorial on UAV communications for 5G and beyond. Proc. IEEE 2019, 107, 2327–2375. [Google Scholar] [CrossRef] [Scilit]
- Ma, Z.; Liang, Y.; Zhu, Q.; Zheng, J.; Lian, Z.; Zeng, L.; Fu, C.; Peng, Y.; Ai, B. Hybrid-RIS-Assisted Cellular ISAC Networks for UAV-Enabled Low-Altitude Economy via Deep Reinforcement Learning with Mixture-of-Experts. IEEE Trans. Cognit. Commun. Netw. 2026, 12, 3875–3888. [Google Scholar] [CrossRef] [Scilit]
- Mozaffari, M.; Saad, W.; Bennis, M.; Debbah, M. A tutorial on UAVs for wireless networks: Applications, challenges, and open problems. IEEE Commun. Surveys Tuts. 2019, 21, 2334–2360. [Google Scholar] [CrossRef] [Scilit]
- Shakhatreh, H.; Sawalmeh, A.H.; Al-Fuqaha, A.; Dou, Z.; Almajali, E.; Khalil, I.; Othman, N.S.; Khreishah, A.; Guizani, M. Unmanned Aerial Vehicles (UAVs): A Survey on Civil Applications and Key Research Challenges. IEEE Access 2019, 7, 48572–48634. [Google Scholar] [CrossRef] [Scilit]
- Cheng, X.; Li, Y.; Bai, L. UAV Communication Channel Measurement, Modeling, and Application. J. Commun. Inf. Netw. 2019, 4, 33–43. [Google Scholar] [CrossRef] [Scilit]
- Wang, C.-X.; Huang, J.; Wang, H.; Gao, X.; You, X.; Hao, Y. 6G Wireless Channel Measurements and Models: Trends and Challenges. IEEE Veh. Technol. Mag. 2020, 15, 22–32. [Google Scholar] [CrossRef] [Scilit]
- Yan, C.; Fu, L.; Zhang, J.; Wang, J. A Comprehensive Survey on UAV Communication Channel Modeling. IEEE Access 2019, 7, 107769–107792. [Google Scholar] [CrossRef] [Scilit]
- Erdemir, U.; Kaplan, B.; Hökelek, İ.; Görçin, A.; Çırpan, H.A. Measurement-based Channel Characterization for A2A and A2G Wireless Drone Communication Systems. In Proceedings of the 2023 IEEE 97th Vehicular Technology Conference (VTC2023-Spring), Florence, Italy, 16–19 April 2023; IEEE: Piscataway, NJ, USA, 2023; pp. 1–6. [Google Scholar]
- Mao, K.; Zhu, Q.; Wang, C.X.; Ye, X.; Gomez-Ponce, J.; Cai, X.; Miao, Y.; Cui, Z.; Wu, Q.; Fan, W. A Survey on Channel Sounding Technologies and Measurements for UAV-Assisted Communications. IEEE Trans. Instrum. Meas. 2024, 73, 1–24. [Google Scholar] [CrossRef] [Scilit]
- Matolak, D.W.; Sun, R. Air-Ground Channel Characterization for Unmanned Aircraft Systems—Part I: Methods, Measurements, and Models for Over-Water Settings. IEEE Trans. Veh. Technol. 2016, 66, 26–44. [Google Scholar] [CrossRef] [Scilit]
- Sun, R.; Matolak, D.W. Air-Ground Channel Characterization for Unmanned Aircraft Systems Part II: Hilly and Mountainous Settings. IEEE Trans. Veh. Technol. 2016, 66, 1913–1925. [Google Scholar]
- Matolak, D.W.; Sun, R. Air–Ground Channel Characterization for Unmanned Aircraft Systems—Part III: The Suburban and Near-Urban Environments. IEEE Trans. Veh. Technol. 2017, 66, 6607–6618. [Google Scholar] [CrossRef] [Scilit]
- Yu, C.; Liu, Y.; Chang, H.; Zhang, J.; Zhang, M.; Poechmueller, P.; Wang, C. AG channel measurements and characteristics analysis in hilly scenarios for 6G UAV communications. China Commun. 2022, 19, 32–46. [Google Scholar] [CrossRef] [Scilit]
- Lyu, Y.; Wang, W.; Chen, P. Fixed-Wing UAV-Based Air-to-Ground Channel Measurement and Modeling at 2.7 GHz in a Rural Environment. IEEE Trans. Antennas Propag. 2025, 73, 2038–2052. [Google Scholar] [CrossRef] [Scilit]
- Cui, Z.; Briso-Rodriguez, C.; Guan, K.; Zhong, Z.; Quitin, F. Multi-Frequency Air-to-Ground Channel Measurements and Analysis for UAV Communication Systems. IEEE Access 2020, 8, 110565–110574. [Google Scholar] [CrossRef] [Scilit]
- Hua, B.; Han, L.; Deng, Q.; Zhu, Q.; Li, H.; Qu, Y.; Briso-Rodríguez, C.; Mao, K. AAV Air-to-Air Channel: Statistical Properties and Experimental Verification. IEEE Internet Things J. 2025, 12, 25790–25803. [Google Scholar] [CrossRef] [Scilit]
- Ede, B.; Kaplan, B.; Kahraman, I.; Keşir, S.; Yarkan, S.; Ekti, A.R.; Baykaş, T.; Görçin, A.; Çırpan, H.A. Measurement-Based Large Scale Statistical Modeling of Air–to–Air Wireless UAV Channels via Novel Time–Frequency Analysis. IEEE Wirel. Commun. Lett. 2022, 11, 136–140. [Google Scholar] [CrossRef] [Scilit]
- An, H.; Guan, K.; Li, W.; Zhang, J.; He, D.; Zhu, F.; Chen, L. Measurement and ray-tracing for UAV air-to-air channel modeling. In Proceedings of the 2022 IEEE 5th International Conference on Electronic Information and Communication Technology (ICEICT), Hefei, China, 21–23 August 2022; IEEE: Piscataway, NJ, USA, 2022; pp. 415–420. [Google Scholar]
- Badi, M.; Wensowitch, J.; Rajan, D.; Camp, J. Experimentally Analyzing Diverse Antenna Placements and Orientations for UAV Communications. IEEE Trans. Veh. Technol. 2020, 69, 14989–15004. [Google Scholar] [CrossRef] [Scilit]
- Khawaja, W.; Ozdemir, O.; Erden, F.; Guvenc, I.; Matolak, D.W. Ultra-Wideband Air-to-Ground Propagation Channel Characterization in an Open Area. IEEE Trans. Aerosp. Electron. Syst. 2020, 56, 4533–4555. [Google Scholar] [CrossRef] [Scilit] [PubMed]

Disclaimer/Publisher’s Note: The statements, opinions and data contained in all publications are solely those of the individual author(s) and contributor(s) and not of MDPI and/or the editor(s). MDPI and/or the editor(s) disclaim responsibility for any injury to people or property resulting from any ideas, methods, instructions or products referred to in the content. |
© 2026 by the authors. Licensee MDPI, Basel, Switzerland. This article is an open access article distributed under the terms and conditions of the Creative Commons Attribution (CC BY) license.