1. Introduction
Nearly 70% of Europe’s population resides in urban areas, a figure projected to rise steadily in the coming decades (OECD, 2020) [
1]. As urbanization accelerates, cities are becoming the epicentres of complex, multidimensional challenges (OECD, 2023) [
2]. Increasingly, the urban scale is recognized as critical to enabling the twin transition—the digital and green transformation—by contributing to environmental protection and safeguarding public health in the face of climate-related threats such as floods, heatwaves, droughts and other extreme events (Bianchi, 2024; JRC) [
3]. One illustrative example of these converging pressures is the rising frequency and severity of urban heatwaves, which have major social, economic and environmental impacts (Abunyewah et al., 2025) [
4].
In this context, the integration of geospatial technologies—particularly Earth Observation (EO) satellite data—into urban planning and climate adaptation strategies represents both a significant opportunity and a persistent challenge in digital urban governance across Europe. EO data are increasingly recognized as strategic tools for monitoring environmental change, supporting the implementation of the sustainable development goals (SDGs) (UNOOSA 2019) [
5] and operationalising a wide range of EU policy frameworks. According to the European Commission’s Knowledge Centre on Earth Observation (KCEO), EO services can support up to 28 EU policy areas, spanning climate action, disaster risk management, agriculture and urban development [
6]. The value of EO data is particularly evident at the local and regional levels, where climate-related challenges are concentrated (OECD 2023 [
2]) and where planning, monitoring and implementation capacities often remain limited. EO and complementary geospatial technologies, including remote sensing, can substantially enhance local climate adaptation, risk assessment and urban resilience strategies (M. Dowell et al. 2025) [
7].
1.1. Copernicus Services and EO Integration in Urban Governance
Among the EU’s flagship initiatives, the Copernicus programme [
8] provides a suite of EO services directly relevant to local and regional authorities (LRAs). As highlighted in the EUSPA Market Report (2024) [
9], the Copernicus Land Monitoring Service (CLMS), particularly its Urban Atlas, supports land use classification, green infrastructure mapping and cultural heritage monitoring. The Copernicus Emergency Management Service (CEMS) offers near-real-time data for disaster response, including floods and landslides. CAMS (Copernicus Atmosphere Monitoring Service) and C3S (Copernicus Climate Change Service) provide critical information on air quality and climate trends—such as urban heat—supporting early warning and adaptation planning.
These services are powered by data from the Sentinel satellite missions, which combine radar and optical sensors to support a wide range of urban applications. For instance, Sentinel-1 enables ground displacement monitoring via InSAR techniques, supporting infrastructure surveillance (e.g., roads, tunnels, bridges); Sentinel-2 supports land cover and green space mapping; Sentinel-3 provides land surface temperature (LST) data; and Sentinel-5P offers atmospheric composition measurements relevant to urban air quality.
EO data are not only used for static urban planning but are also increasingly integrated into urban digital twin systems. These systems support real-time simulations and predictive modelling of urban processes. Villani et al. (2025) [
10] document the use of Copernicus data in a digital twin framework to improve urban resilience in Venice. Similarly, Sugita et al. (2025) [
11] explore EO satellite integration to improve Japan’s energy transition, and Gerasopoulos et al. (2022) [
12] highlight EO’s contribution to developing smart solutions to face environmental urban pressures in European cities.
Ensuring widespread EO uptake among local and regional authorities (LRAs) is thus essential for reinforcing the mainstreaming of space-based innovation in urban governance.
Despite multiple EU-supported initiatives—such as Destination Earth [
13], Urban Atlas [
14], Horizon Europe [
15], LIFE+ [
16] and Interreg [
17]—which promote EO-based experimentation and capacity-building, EO adoption by cities remains limited (Copernicus Sentinel Data Access Report, 2023 [
18], EARSC, 2024 [
19]; Filippi 2025 [
20]). Despite the overlap in scope between EO data and technologies and sustainable urban policies, there has been weak engagement between urban planners and the EO community (Gerasopoulos et al. 2022) [
12]. Consequently, there is a need to further strengthen the connection between these two communities.
Additionally, the specific perspectives of local public end-users, including their practical needs, organizational challenges and perceived barriers, are still underexplored in both the academic and policy literature (OECD, 2023 [
21], Dowell et al. EC JRC 2025 [
7]).
Recent contributions, such as Diaz-Sarachaga (2025) [
22], have highlighted the lack of empirical research assessing the actual contribution of urban digital infrastructures—such as Urban Digital Twins (UDTs)—to urban governance. This underscores the need for further investigation into the role of emerging technologies, including Earth Observation (EO) data, which are increasingly integrated into UDT systems.
1.2. Research Objective and Questions
This article builds upon and extends two prior studies on the adoption and use of EO data and services by LRAs in Italy. Together, these studies enabled a multi-level analysis that integrates two complementary theoretical frameworks: the Technology–Organization–Environment (TOE) model (Tornatzky & Fleischer, 1990 [
23]) and the Technology Affordances and Constraints Theory (TACT) (Majchrzak & Markus, 2013 [
24]).
The foundational work (Filippi 2025) [
20], based on a national survey of 109 Italian LRAs, identified a series of technological, organizational and environmental factors influencing EO adoption. The second, based on qualitative research conducted within the author’s doctoral thesis (Filippi, in preparation), involved in-depth interviews with seven Italian LRAs and explored the perceived affordances and constraints associated with EO integration in local governance (stemming from TACT).
The current article utilizes an exploratory approach to test the analytical applicability of this integrated framework at the European level. Specifically, it investigates whether and to what extent the enabling factors, constraints and affordances identified in the Italian context occur within a targeted sample of European LRAs already involved in EU-funded projects.
To this end, the study addresses the following research questions:
RQ1: Among the LRAs in the sample that are already involved in EO, urban innovation or climate-related EU-funded projects, what are the main technological, organizational and environmental factors influencing the adoption and use of EO satellite data?
RQ2: What are the key affordances and constraints perceived in the use of EO satellite data and services?
RQ3: How do the perceived technological affordances and constraints of EO satellite data vary across different levels of adoption among LRAs in the sample, and what factors condition this variation?
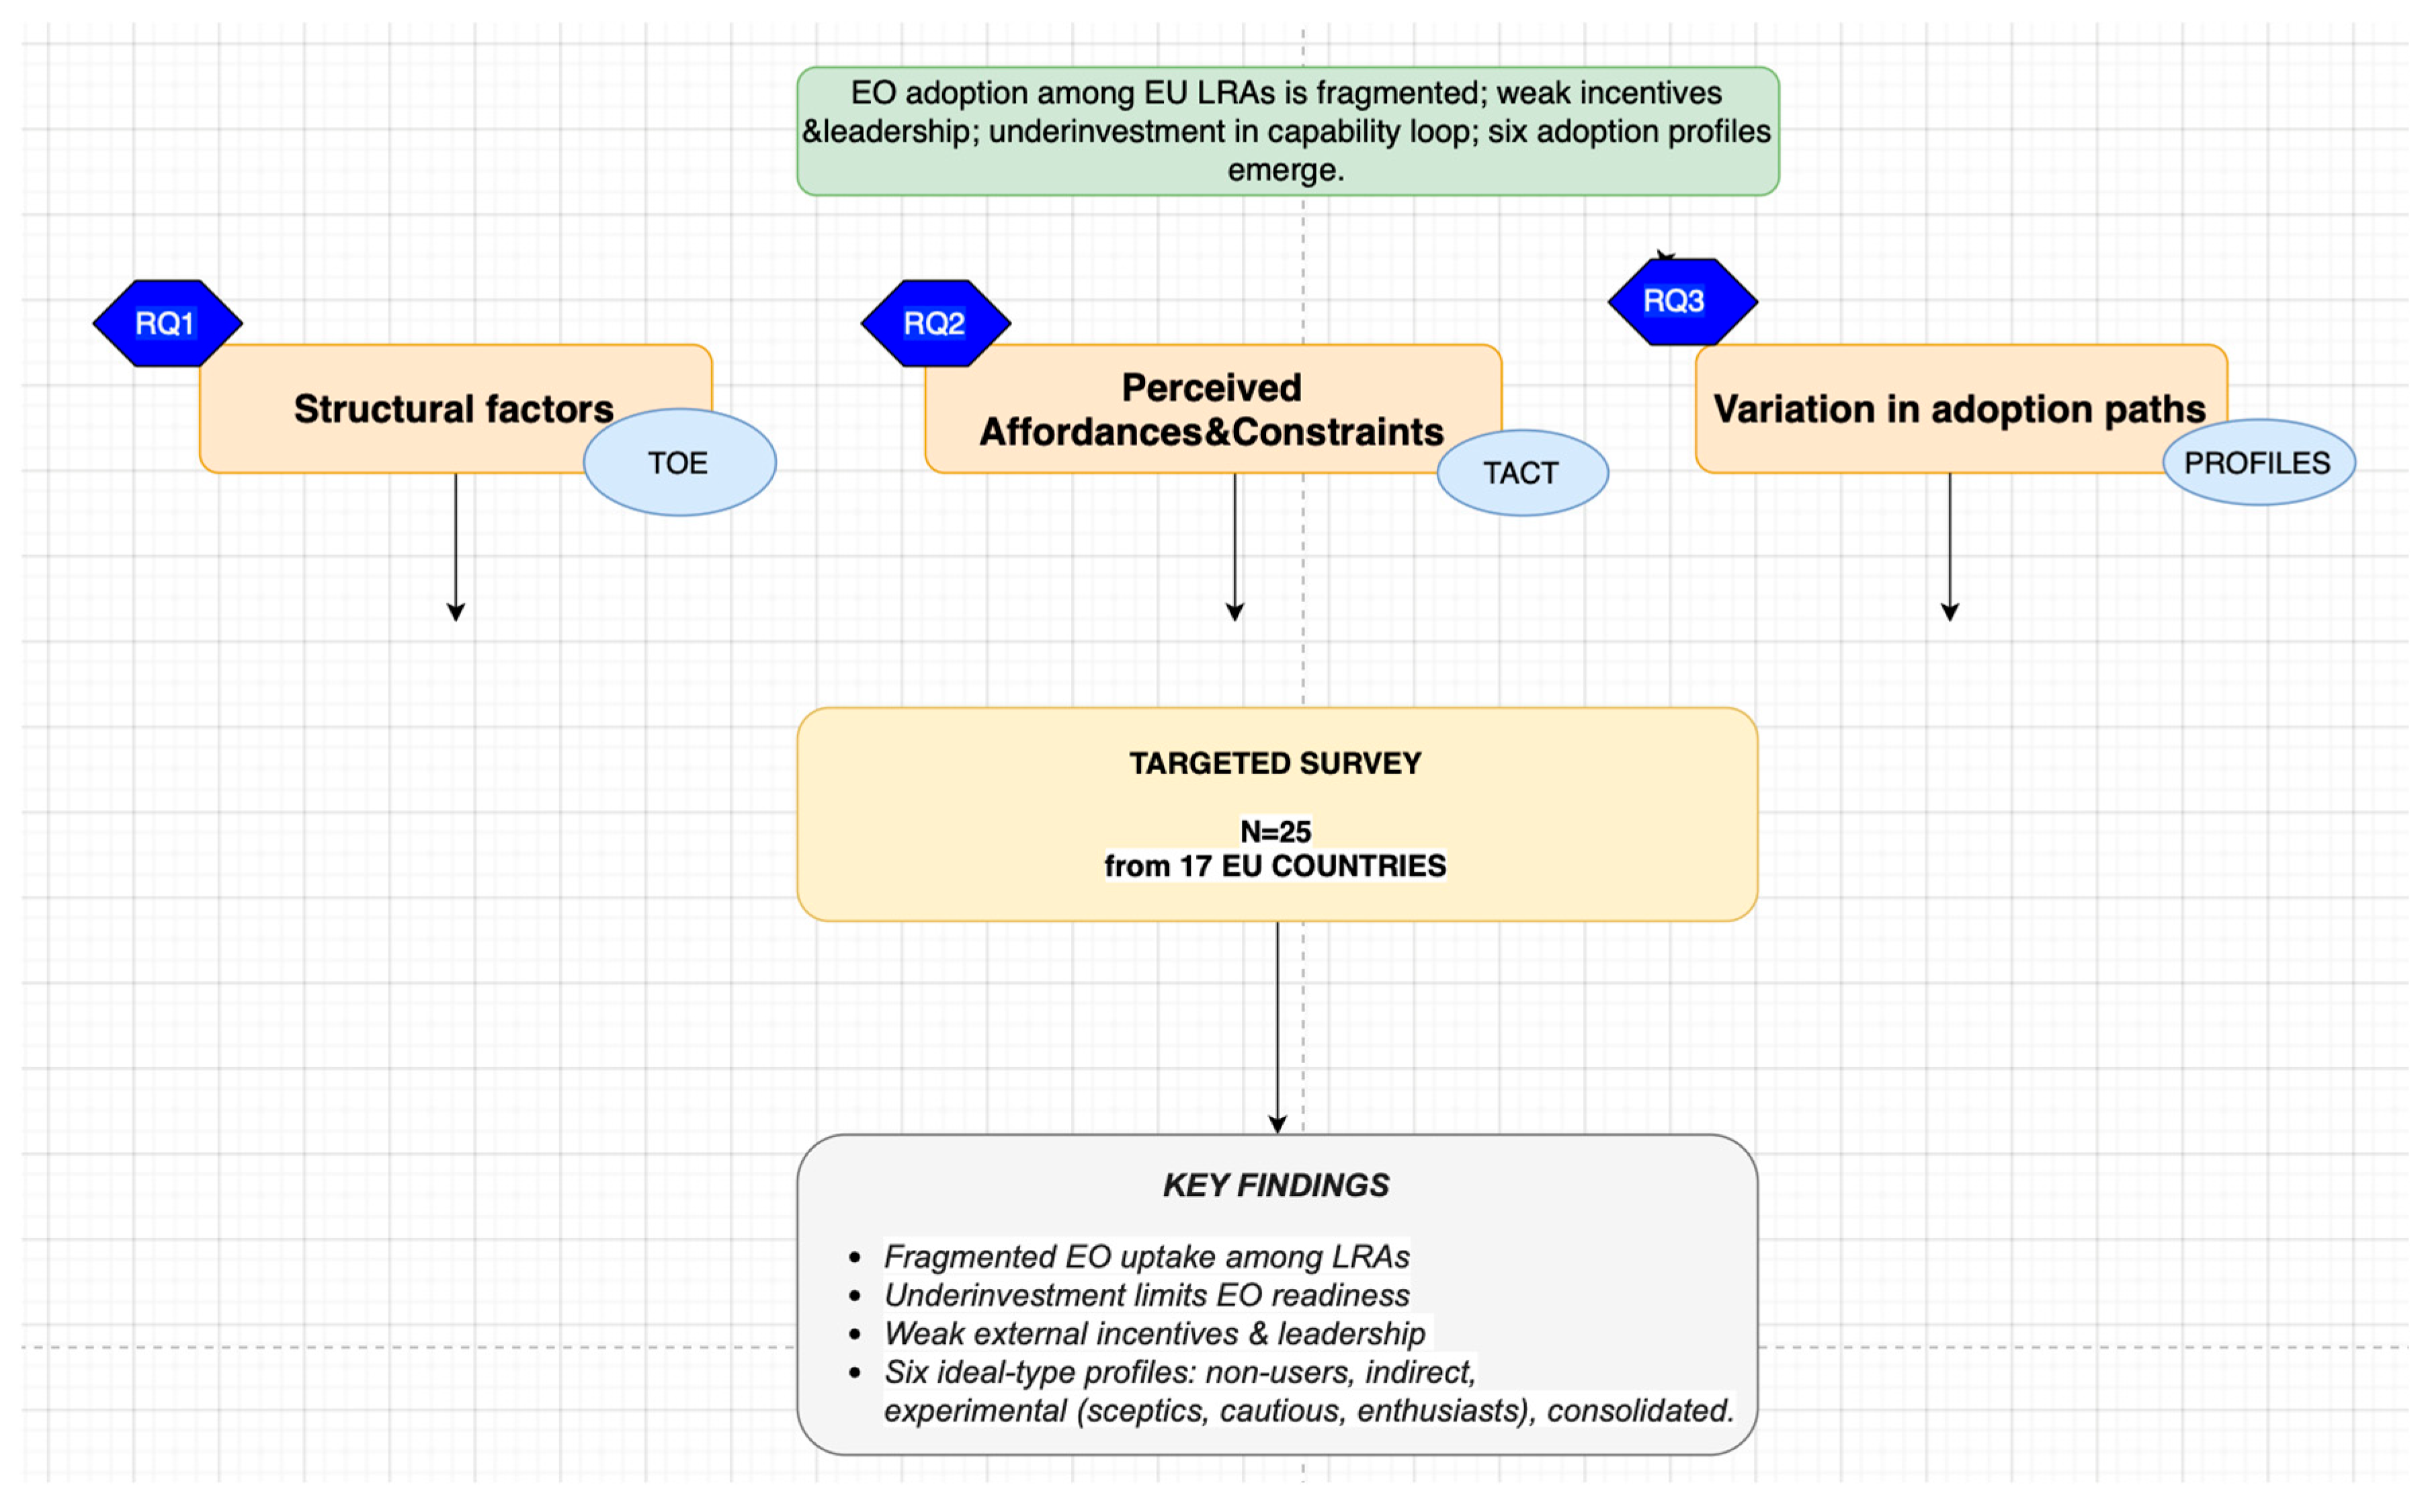
The logic of the research design is represented in
Figure 1.
This article contributes to the scientific debate in three ways:
It offers an exploratory operationalization of TACT in the sub-national public sector, applied to satellite data adoption, a relatively underexplored field. It allows for a preliminary analytical cross-national testing of the TOE framework in the context of geospatial and EO technologies within a purposively selected sample of sub-national authorities. The article also provides a potentially replicable, validated instrument to capture both organizational readiness and perception-based barriers, useful for both researchers and EO policy communities (e.g., ESA, Copernicus User Forum).
For this purpose, the article is structured as follows: The first section describes the Methodology, including the theoretical framework for the survey design, data collection and analysis techniques, as well as the limitations. The Results section is dedicated to the description of the results from the survey, while the Discussion section offers a contextualization of the results with a comparison to previous studies and a reflection on its policy implications. The Conclusions section synthesizes the key findings, reiterates the paper’s original contribution and offers a comprehensive set of policy implications.
2. Materials and Methods
2.1. Purposes
A qualitative, theory-informed methodological approach based on multiple case studies (Yin, 2017) [
25] was adopted for the design of this research. This approach is particularly well suited to the objectives of the article, as it allows for analytical generalization to theoretical propositions, building upon prior empirical findings in the Italian context [
12].
The multiple-cases design allows for comparability, enabling the analysis of variation within the European sample and between this sample and previous studies focused on Italian LRAs. Furthermore, this approach is especially effective in answering the types of questions posed by this article, namely the “What” (What factors enable or hinder EO satellite data uptake?) and “How” (How is the use of EO data perceived? And how does this perception vary across LRAs”), corresponding to research questions RQ1, RQ2 and RQ3. This methodological design is also appropriate given the small and specialized population under investigation (European LRAs involved in the use of EO satellite data) and the limited sample size derived through purposive strategies. In such a context, statistical generalization is neither feasible nor intended; instead, the article aims at analytical generalization, seeking to identify recurrent patterns and theoretically meaningful insights.
Analytic generalization is considered a suited approach to generalize from specific particulars to broader theoretical constructs (Polit and Beck 2010) [
26].
Finally, considering the acknowledged knowledge gap in the literature regarding EO data adoption in sub-national public authorities, and the article’s aim to test the applicability of a theoretical model in a new context, the research assumes an exploratory character (Swedberg, 2020 [
27]).
2.2. Survey Design and Variables
To address the three research questions outlined in the introduction, a structured survey was designed and administered to a selected sample of European local and regional authorities (LRAs). Constructs and perceptual items used in the survey design are based in two national studies previously developed and validated by the authors [
20] [Filippi, in preparation], adapted for the European context. The survey is theoretically grounded in two complementary frameworks to enable a multi-level analysis of the adoption process: the structural context (meso-level) and the user perception (micro-level). This approach has also been used in studies of AI adoption in public organizations (Maragno et al. 2023) [
28].
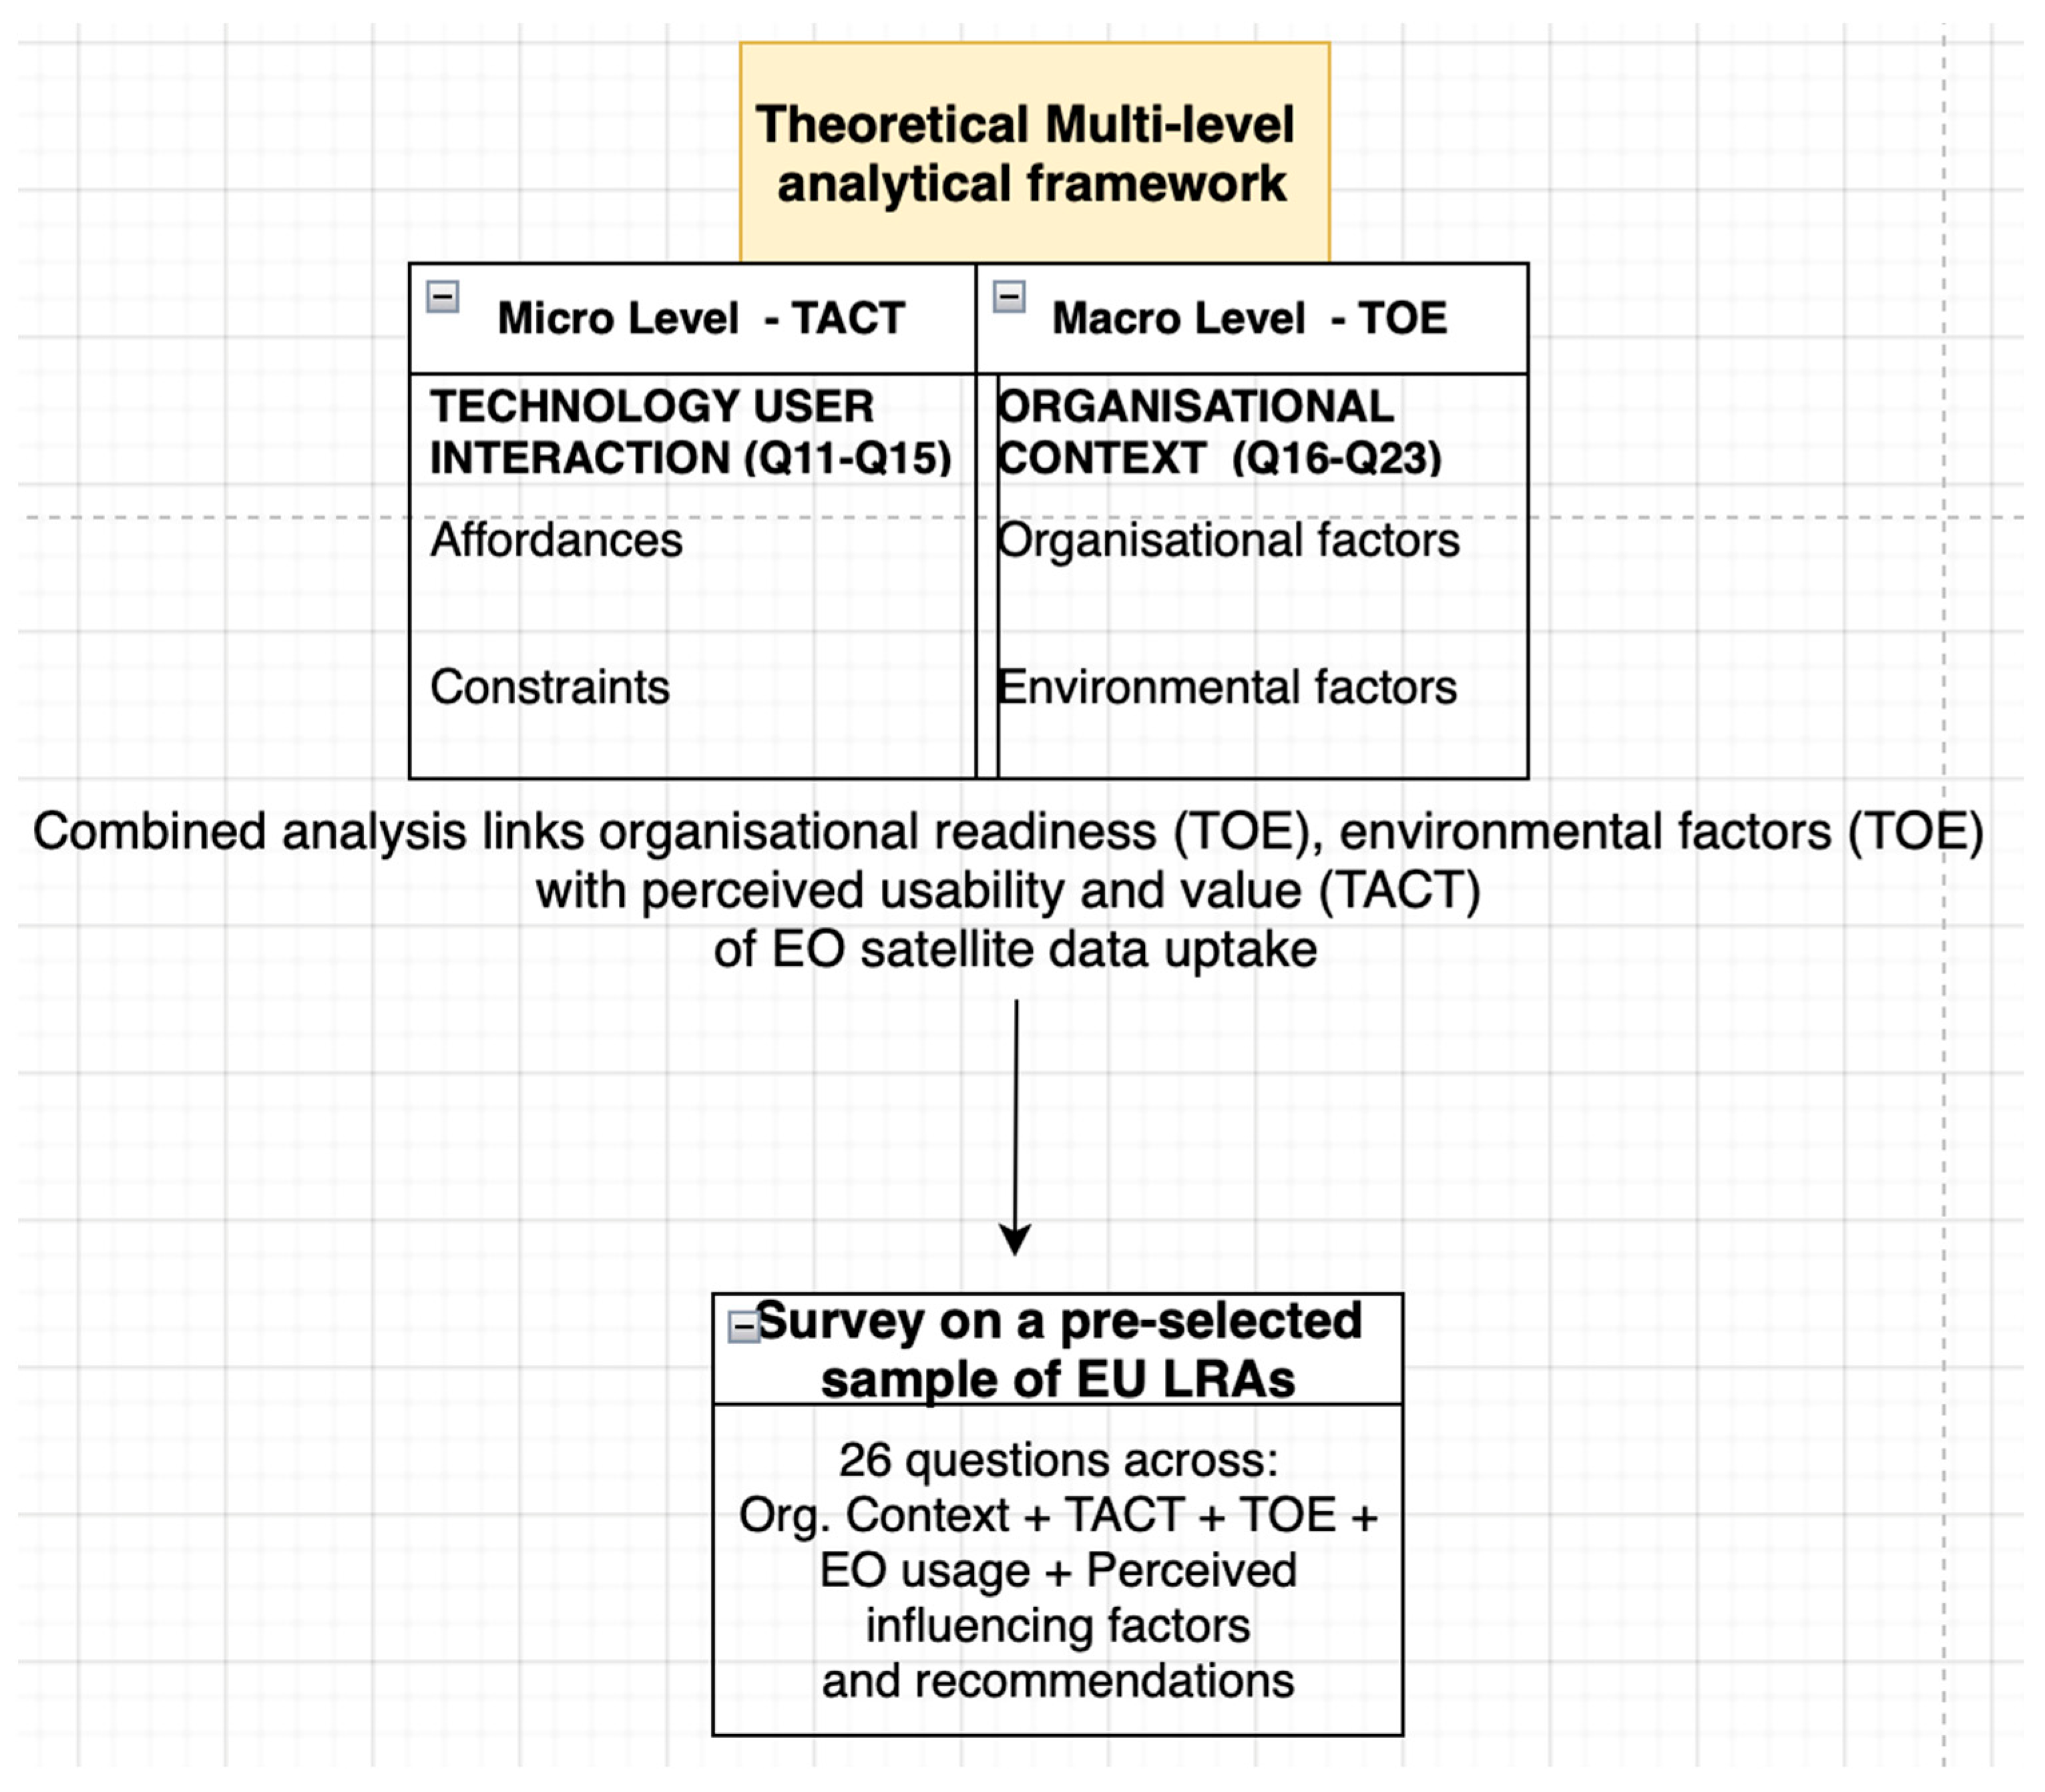
As shown in
Figure 2 main objective of the survey is to verify the analytical generalization of this integrated framework, previously identified in two foundational studies conducted by the authors in the Italian context, at the European level.
The survey comprises five main sections and captures a total of 28 variables (two questions include multiple variables). While two sections are directly linked to the theoretical models, three additional sections were introduced to enrich the knowledge of the context. The five sections are as follows:
Background and Organizational Characteristics (Q1–Q5);
EO Adoption and Usage Patterns (Q6–Q10);
Technology Affordances and Constraints (TACT) (Q11–Q15);
Technology–Organization–Environmental Influential Factors (TOE) (Q16–Q23);
Perceived Influencing Factors and Peer-to-Peer Recommendations (Q24–Q26).
2.3. The Integration of TOE and TACT
Integrating TACT and TOE enabled the exploration of EO satellite data adoption from two distinct yet complementary perspectives, providing analytical coherence across macro-structural factors and micro-user experience. The TOE framework offers a structural and contextual perspective, explaining how technological, organizational and environmental factors influence LRAs’ readiness to adopt EO satellite data. It highlights systemic factors such as leadership awareness, internal expertise, training availability, regulatory incentives, inter-organizational collaboration and funding opportunities, which can influence adoption dynamics. In contrast, TACT focuses on the interaction between individuals and technology, exploring how local public officials perceive EO data and the affordances (action possibilities) and constraints (limitations) they perceive in it. In TACT, the concept of affordances is understood as “an action potential, that is, to what an individual or organization with a particular purpose can do with a technology or information system” [
24].
2.3.1. Operalization of Theoretical Constructs
The survey design mapped each item systematically to the underlying theoretical constructs, ensuring that data collection was fully theory-driven. The TACT framework was applied to explore how technology interacts with users’ capacity to realize its potential within specific institutional contexts.
The survey aimed to capture the perceptions of local public officials regarding the utility, usability, integration potential and limitations of Earth Observation (EO) satellite technologies. To ensure conceptual validity, the perception-based items were derived from qualitative evidence collected in a prior author’s doctoral qualitative study based on seven in-depth interviews into two different Italian regional contexts.
Each item was measured on a five-point Likert scale (1 = strongly disagree; 5 = strongly agree). The resulting items were grouped as follows:
Q11: Contribution of EO data to decision-making support;
Q12: Adequacy of spatial and temporal resolution for operational needs;
Q13: Level of integration of EO data into existing GIS and planning systems;
Q14: Data ownership and reliance on commercial providers;
Q15: Relative cost-effectiveness of EO services compared with traditional data sources.
Together, these items capture how EO satellite data can enable or restrict LRAs’ ability to improve decision-making and service delivery.
2.3.2. Technology–Organization–Theory
As the technological dimension (including perceived utility and adequacy) was primarily explored through TACT, the TOE framework was employed to investigate the influence of the remaining two dimensions: organizational and environmental contexts on EO data adoption. This approach enabled a multi-level analysis of an organization’s readiness, internal capacity and external conditions.
The questions and statements used to operationalize the TOE dimensions were derived from the author’s prior research [
20] of Italian local and regional authorities (LRAs) using a large-scale survey of 109 cases. These variables assess how organizational settings and external pressures shape the adoption and use of EO satellite data:
Organizational Factors (Q16–Q19): Internal readiness and capacity, including leadership awareness, internal expertise, training opportunities and trust in EO data.
Environmental Factors (Q20–Q23): External drivers and barriers, including regulatory incentives, perceived value of structural exchange with peer authorities, inter-organizational cooperation and access to external funding.
As shown in
Appendix A, the survey consists of a total of 26 questions, covering a range of item types, including 5-point Likert scales, single-choice, multiple-choice and ranked-choice formats. An optional open-ended question was also included to allow respondents to share additional reflections or context-specific insights.
2.4. Target Population and Sampling Strategy
Given the article’s objective of investigating the adoption and use of EO satellite data by local and regional authorities (LRAs), the target population consists of public entities at the sub-national level, including municipalities, metropolitan cities, regional governments and regional or municipal agencies. Special attention was given to selecting authorities that use EO data, preferably through direct access to satellite-based services and platforms. Due to the absence of a publicly available dataset on EO data organizations’ users among LRAs at the EU level, a purpose-driven identification strategy was adopted. A sampling frame based on the following criteria has been developed and applied to LRAs: involvement in EU-funded projects explicitly focused on EO satellite data management (e.g., Copernicus uptake, remote sensing integration); participation in projects related to policy domains where EO data are likely to be relevant, such as climate adaptation and mitigation, urban planning, smart cities and digital innovation. To identify eligible LRAs, a systematic search was conducted through official sources such as the European Commission’s tenders and project portals, and specialized platforms including the following:
Climate-ADAPT [
29],
Climate-Neutral Cities [
30],
Covenant of Mayors [
31],
Portico—European Urban Initiative [
32],
URBACT [
33],
Eurisy Copernicus4Cities [
34],
NEREUS Copernicus4Regions [
35] and
ESA Stakeholders Engagement Facility [
36], among others. This process led to the development of a database of 45 LRAs with a potential direct involvement in EO-related actions. In some cases, project coordinators, such as the Veneto Region and partners in projects like CityCLIM [
37], provided support in disseminating the survey to relevant institutional contacts. In total, 45 LRAs represented by 50 individuals were contacted.
2.5. Data Collection
The survey was administered by Limesurvey software version 6.4. and it was distributed in English. Responses from those not using EO were routed to a shorter version (approx. 1 min); full participation took 10–12 min. Survey distribution began in April 2025 until June 2025, and it was conducted through direct e-mail outreach to 50 individuals from the 45 pre-identified local and regional authorities (LRAs), as well as through institutional contacts with project coordinators involved in EO-related EU projects (e.g., Satsdisfaction Interreg Project) [
26].
A total of 54 unique starts (opened/started) were recorded (LimeSurvey allowed multiple attempts by the same person until a questionnaire was submitted as complete), referring to unique sessions rather than unique individuals. Of these starts, 25 surveys from 17 EU Member States were fully completed, yielding an invitation-based completion rate (25/50) of 50.0%. Notably, Italian LRAs were deliberately excluded to avoid overlap with the author’s prior national-level study and to ensure the European focus of the present analysis. Given the research’s qualitative, exploratory design, the size of this sample is considered appropriate, as it is not seeking to be statistically representative. For in-depth, theory-informed case studies involving a specialized population like European LRAs using EO satellite data, smaller sample sizes are commonly employed to achieve theoretical saturation and rich, contextual insights. This approach aligns with recommendations from qualitative methodology (Guest, Bunce, & Johnson, 2006 [
38]).
2.6. Data Analysis Method
Given the limited size of the preselected sample, the data analysis primarily relied on descriptive and exploratory statistical techniques. Descriptive statistics, including absolute and relative frequencies, means, medians and standard deviations, were used to summarize response patterns across key variables, such as EO data adoption levels, perceived affordances, barriers and enabling factors.
To identify potential relationships and preliminary institutional patterns, cross-tabulations were conducted (i.e., EO adoption level × perceived value of EO satellite data, EO adoption × type of organization). These analyses aimed to provide indicative insights into possible associations rather than to establish causal or statistically generalizable relationships.
Given the size and the non-probabilistic nature of the sample, inferential statistical models were not applied, as the limited representativeness and statistical power would not have supported meaningful estimation. The analytical focus was therefore placed on identifying descriptive trends and exploratory configurations, consistent with the objective of analytical rather than statistical generalization.
Qualitative clustering and case profiling were used to enable both intra- and inter-case comparison across the sample. Given the limited number of cases (N = 25), which constrains the potential for statistical generalization, and considering the exploratory nature of the research, we adopted a qualitative, in-depth analysis strategy grounded in dimensionality reduction and case synthesis. We also considered alternative clustering methods such as k-means and PCA (principal component analysis), but ultimately did not apply them due to the small sample size (N = 25) and the exploratory, interpretive nature of the study.
To enable both intra- and inter-case comparison, a qualitative clustering procedure was applied. The resulting profiles are to be understood as Weberian ideal types [
39], interpretive constructs designed to highlight recurrent patterns and meaningful variations within a small, non-representative sample, rather than as statistically validated clusters. Their purpose is explanatory and heuristic, offering an analytical framework for interpreting the diverse trajectories of EO data adoption among European local and regional authorities (LRAs).
Following a manual interpretive analysis, we extracted three components that align with key theoretical and empirical constructs.
A qualitative clustering of the cases was subsequently conducted. For each component, a synthetic index score was calculated by averaging equally weighted items (1–5 Likert scale). The indices and their constituent variables are represented in the Table below (
Table 1).
As shown in
Table 1, the clustering approach followed a two-step logic:
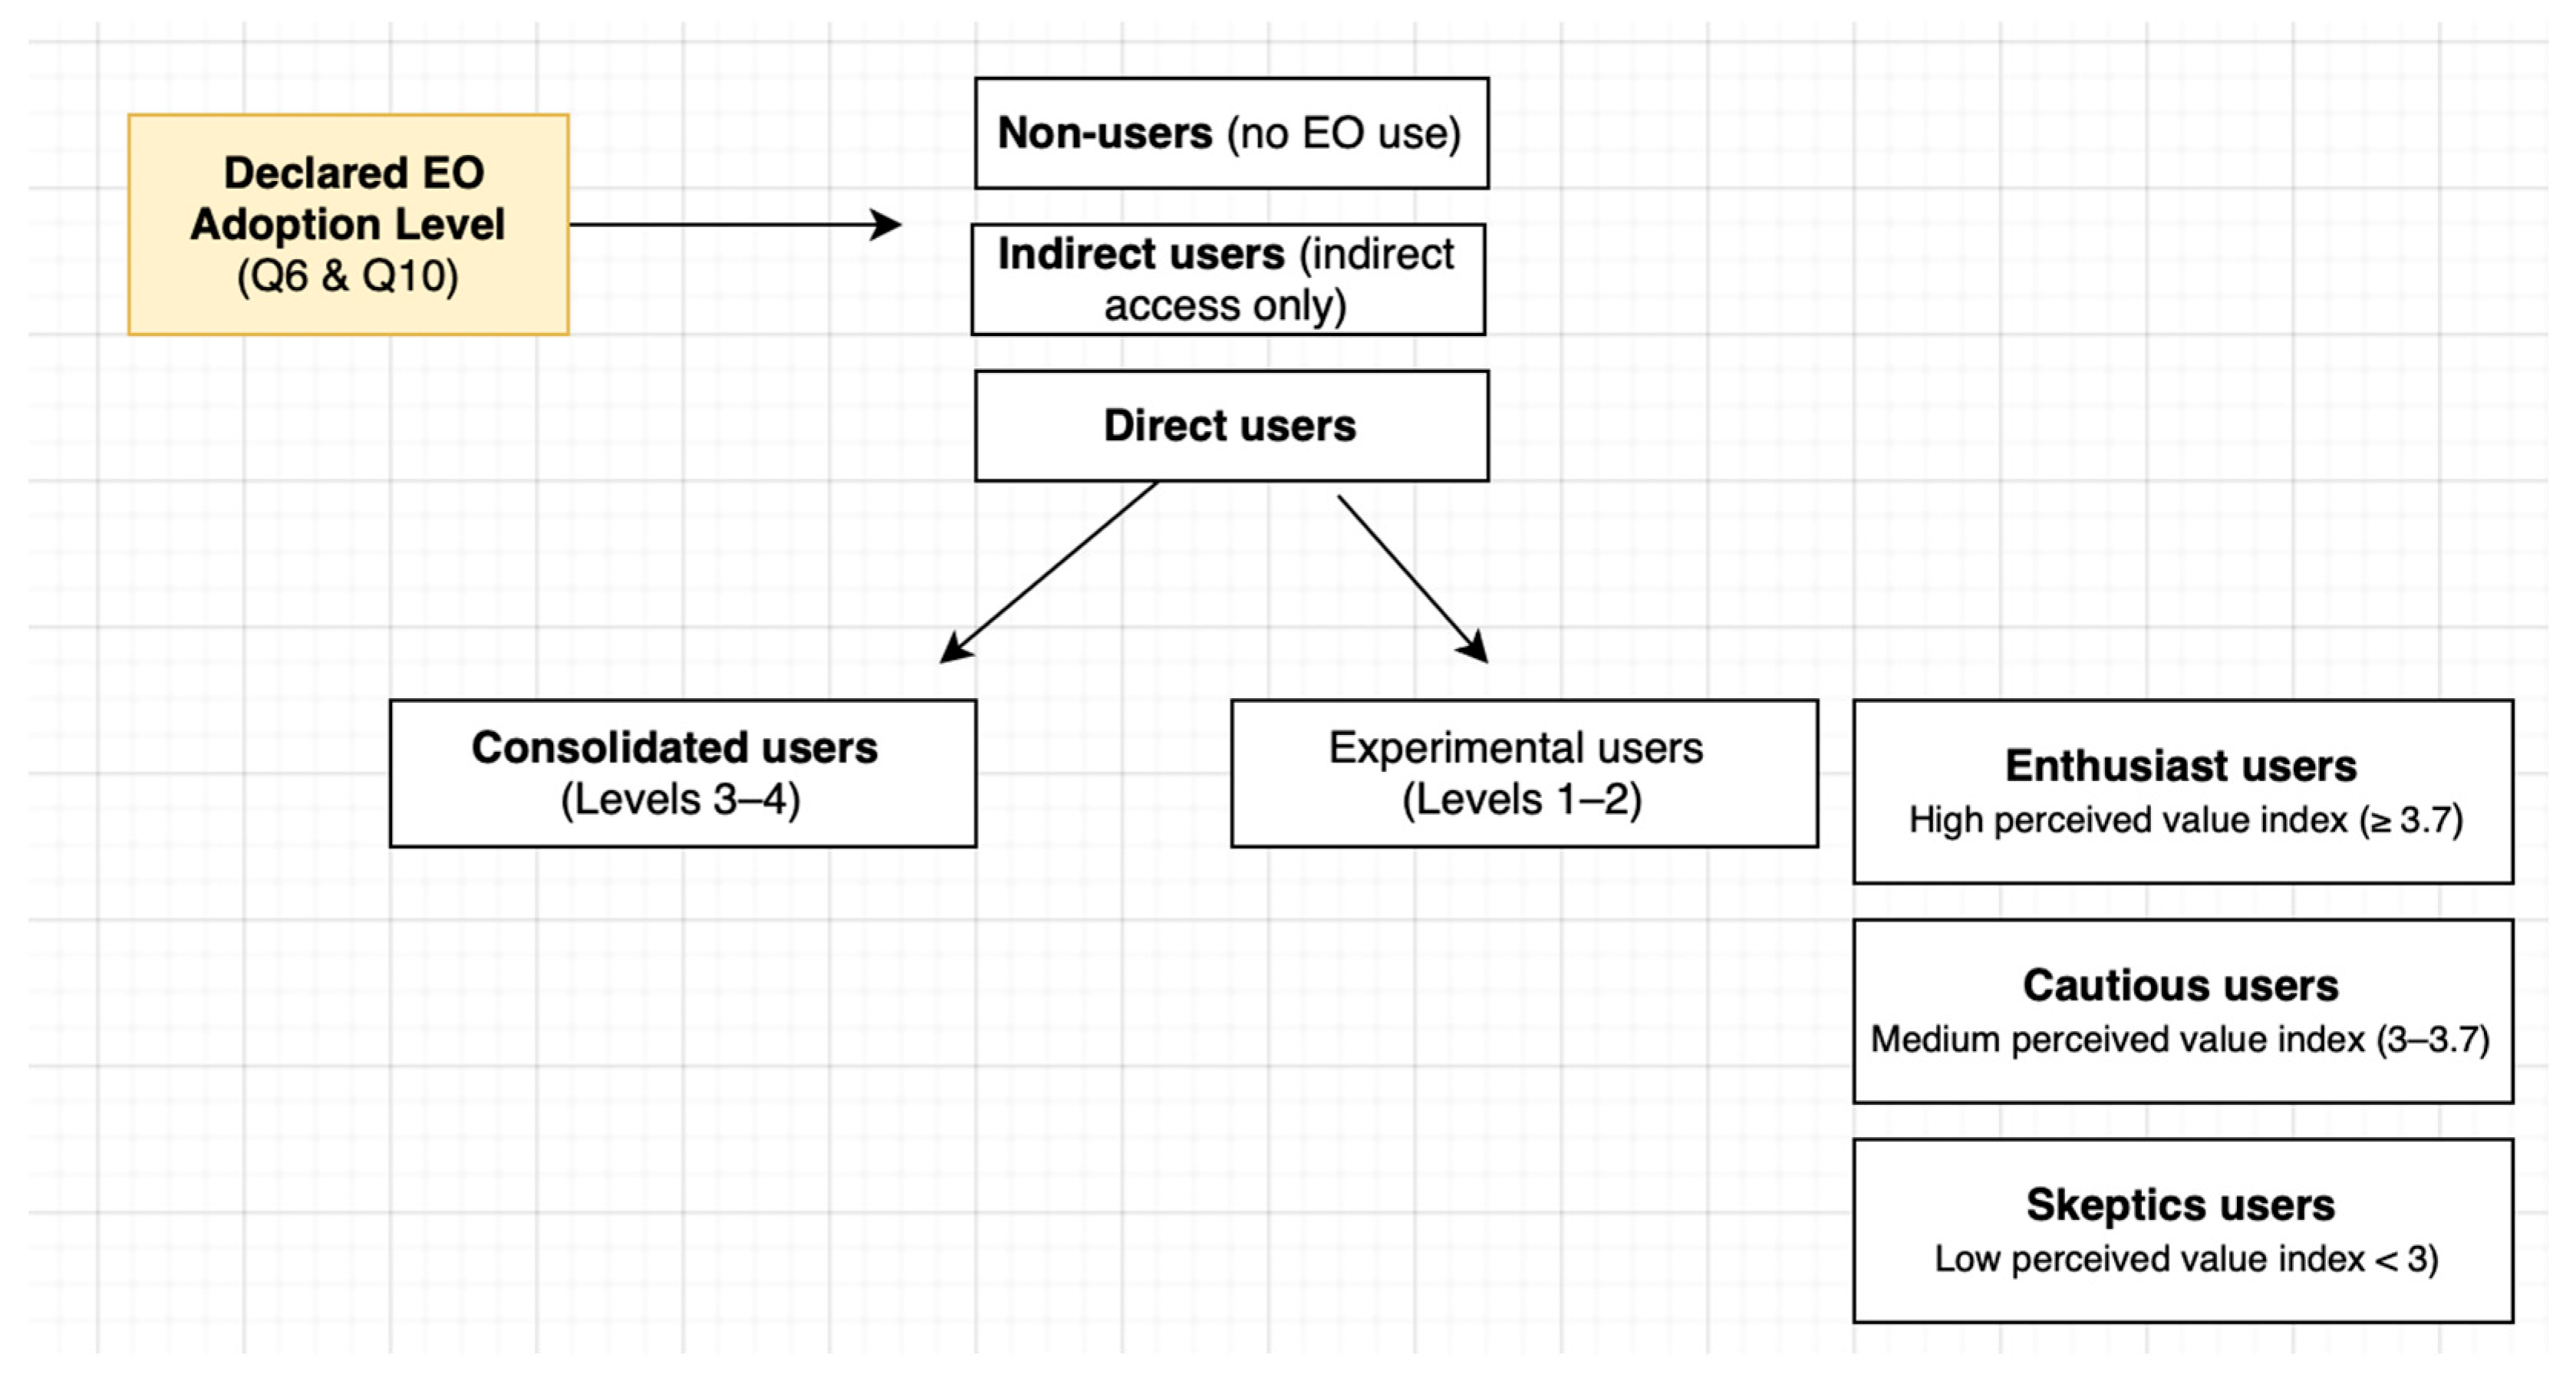
Step 1—Declared Level of EO Adoption (Q.6 and Q.10):
This variable was used to define three macro-groups: Non-users: No EO data used; Indirect users only: Organizations that benefit from EO data but do not process it internally; Proven/proficient users: Those with declared levels of adoption 3 or 4 (on a scale of 0–4).
Step 2—Perceived Value among Experimental Users (Q.10, Q.11, Q.12 and Q.15):
Among those with only an experimental use of EO (levels 1–2), further clustering was performed qualitatively, based on perceived EO value. The chosen decision-tree logic is represented in
Figure 3.
More specifically, as represented in
Figure 3, we used the following thresholds in the “Perceived Value” to identify the three subgroups: “Sceptics” (score ≤ 3.0), “Cautious users” (score > 3.0 and <3.7) and “Enthusiasts” (score ≥ 3.7).
Based on this typology, five ideal-type profiles were constructed as summarized below:
Not-users;
Indirect users only;
Consolidated users;
Experimental users—Sceptics;
Experimental users—Enthusiasts;
Experimental users—Cautious.
It is acknowledged that the “EO Perceived Value” index is both an analytical variable and a basis used for subgroup differentiation among experimental users. However, in line with the article’s interpretive design, such overlap is consistent with ideal-type construction logic, where typologies are developed to synthesize and illustrate key variations within the data, rather than to isolate independent clusters statistically. Also, to avoid over-reliance on this variable, additional dimensions (e.g., barriers, drivers, leadership awareness and readiness) were used to differentiate the profiles further and support robust interpretive synthesis. In keeping with the study’s exploratory and inductive design, the research does not seek statistical generalization but instead offers a grounded analytical framework for understanding diverse trajectories of EO adoption among European LRAs. Statistical analysis has been conducted using SPSS Statistics v.29.02.0.
2.7. Limitations
This study presents some limitations that should be acknowledged. The most significant is the small sample size (N = 25) on a pre-selected population. This limits the possibility of conducting granular statistical analyses, for example, correlating EO adoption patterns with specific variables such as type of organization or country of origin. While sufficient for qualitative, exploratory purposes, this limits the generalizability of findings to the broader population of European LRAs. Given the purposive sampling strategy, the findings might mostly reflect the experiences of organizations that are more motivated or better resourced and are already engaged in EU innovation. Furthermore, the sample underrepresents regional-level authorities and is based on self-reported survey data, which introduces potential bias. These constraints are acknowledged when interpreting the results.
3. Results
3.1. Sample Overview
Survey distribution lasted approximately three months, from April 2025 until June 2025. During this period, 50 individuals representing 45 distinct local and regional authorities (LRAs) across the EU were contacted via personalized emails. A total of 54 responses to the survey were received, of which 25 surveys were fully completed, yielding a completion rate of 50% among those initially contacted. Notably, Italian LRAs were deliberately excluded to avoid overlap with the author’s prior national-level study and to ensure the European focus of the present analysis.
Geographical Provenience, Type of Organization, Size of the Organization, Departments, Unit autonomy.
Geographic Distribution. Respondents represent 17 EU countries, with Germany contributing three cases, Austria, Belgium, Greece, Ireland and Portugal each contributing two cases, and the remaining countries each contributing one case. Despite the relatively small sample size, more than 60% of the EU Countries are represented, with a balanced geographical coverage.
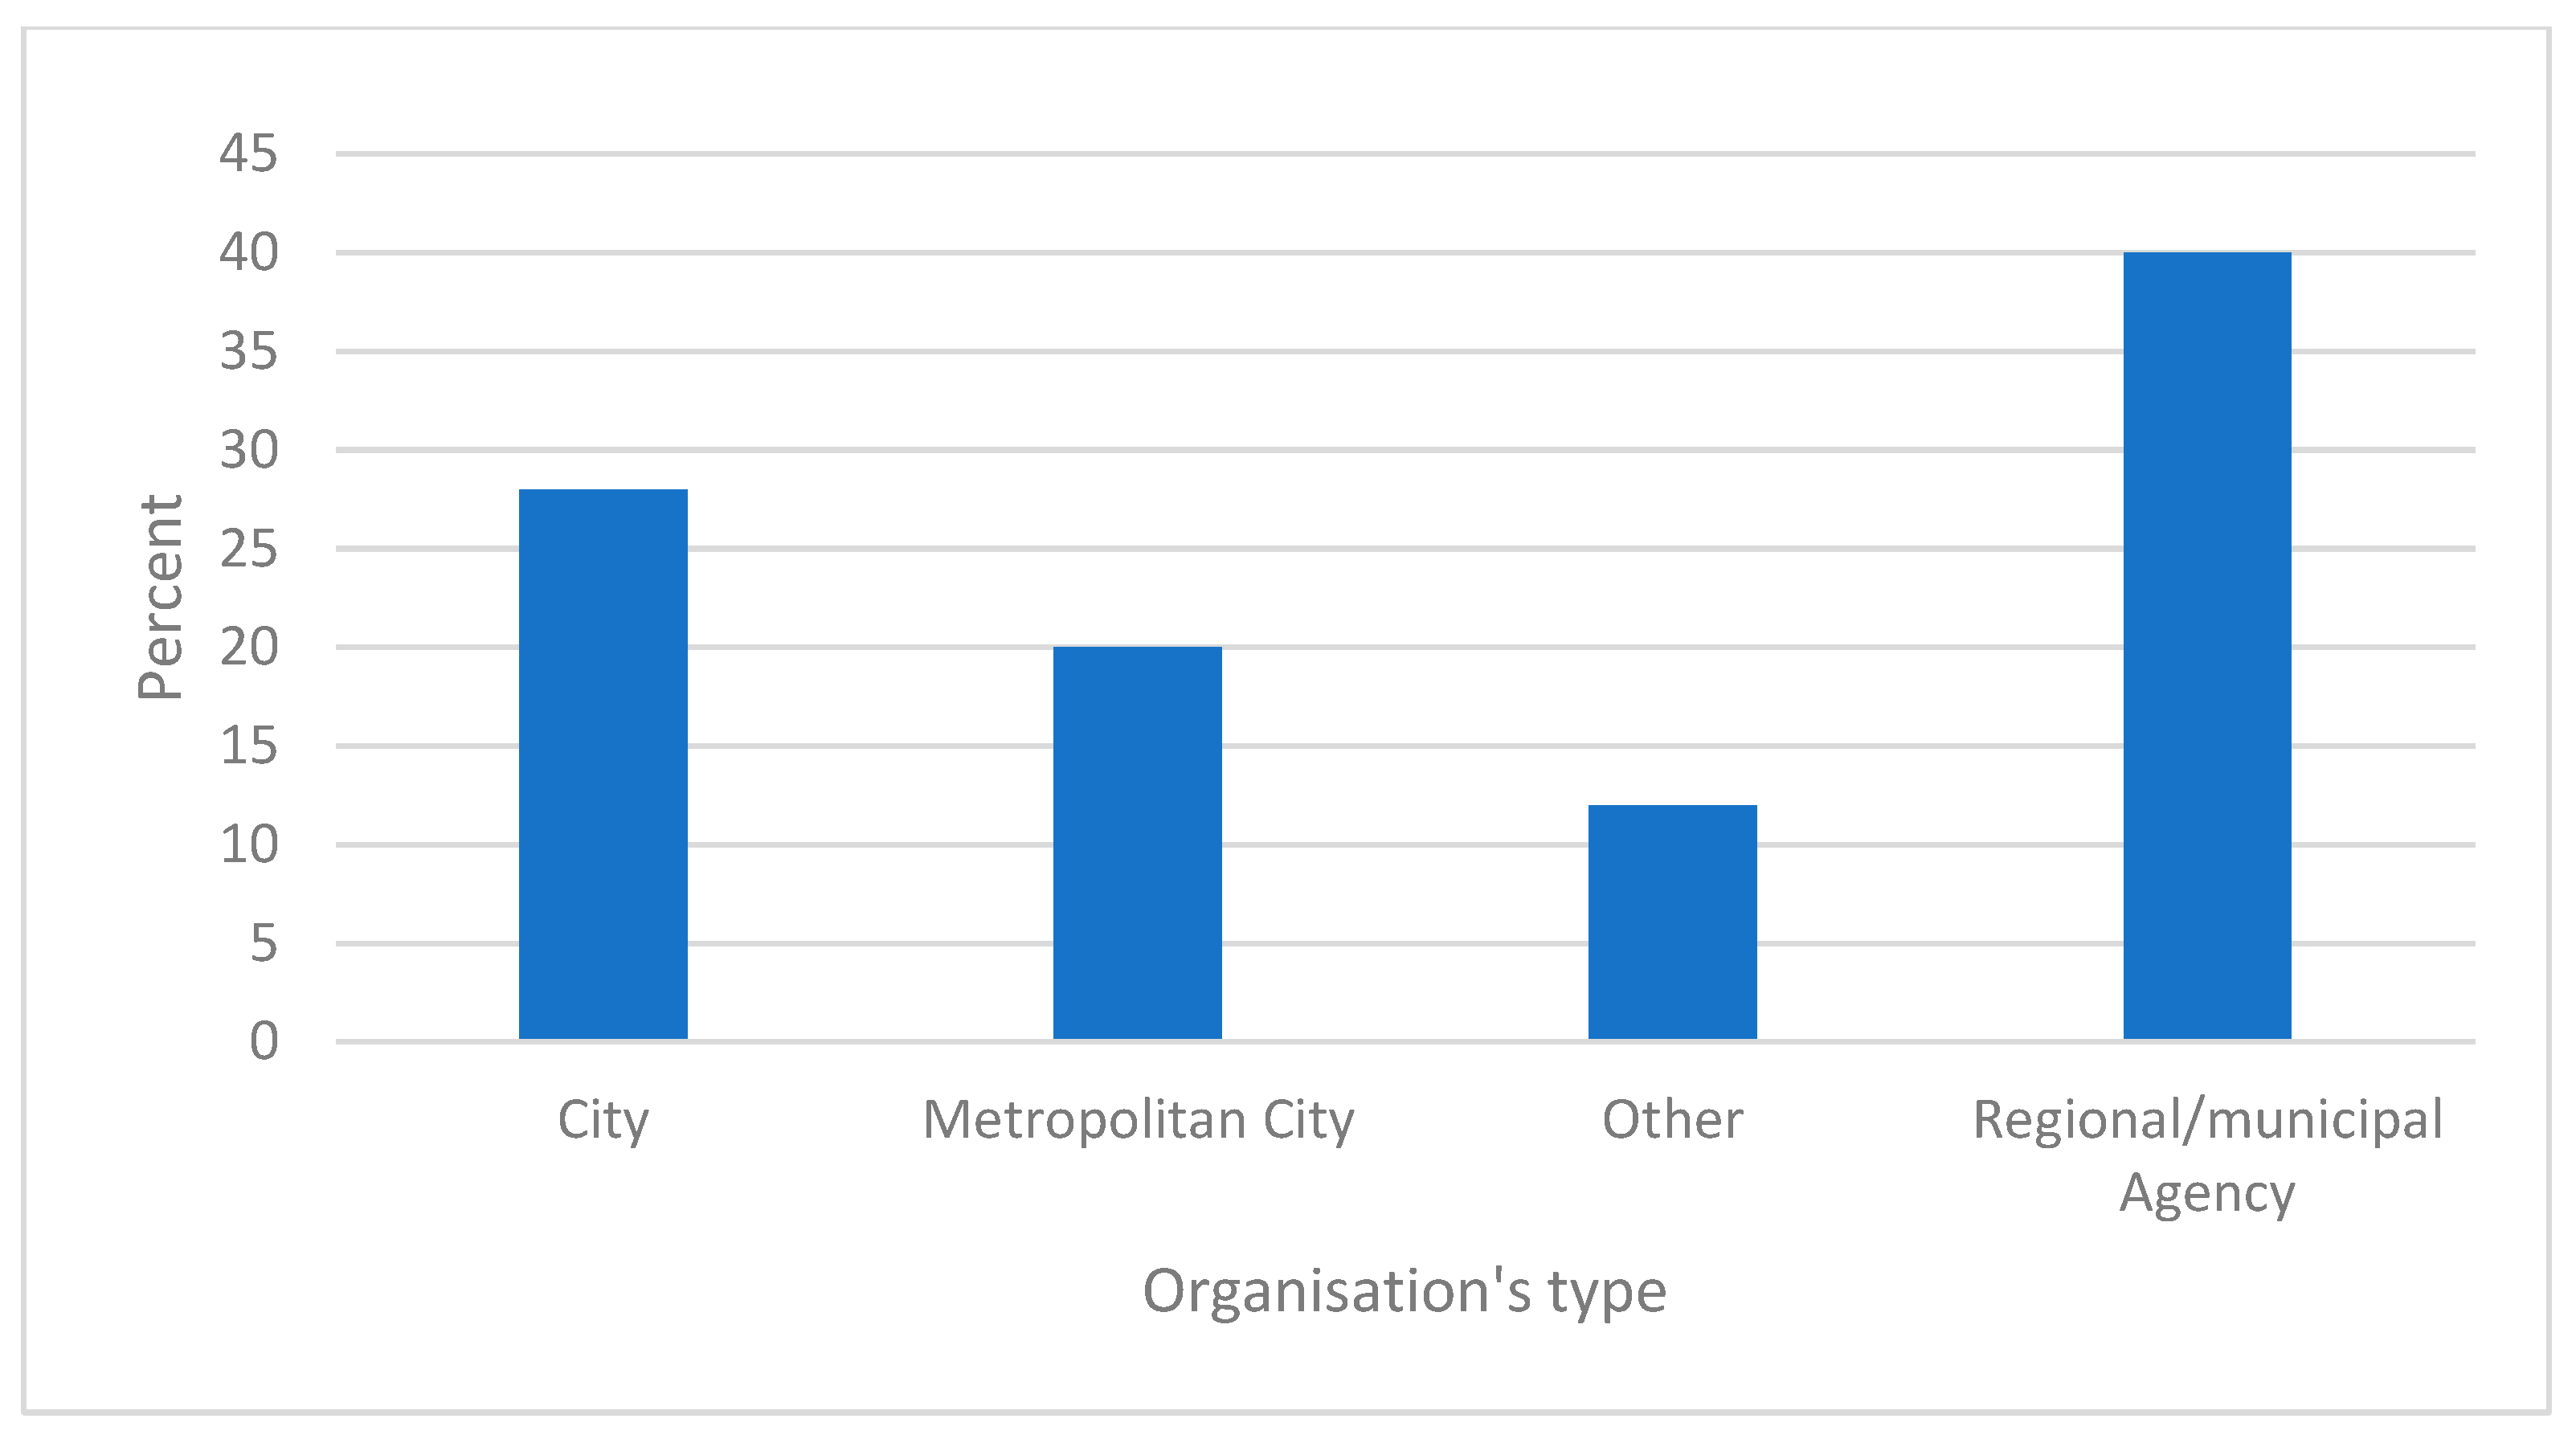
Organizational Type and Size. The sample is heterogeneous both in terms of the type and the size of the organizations represented. Specifically, as shown in
Figure 4, the most relevant group is represented by regional or municipal public agencies at 40% (N = 10), while 28% of respondents (N = 7) are affiliated with cities, and an equal proportion (20%, N = 5) with metropolitan cities. The remaining 12% (N = 3) are associated with other institutions, such as province-level entities.
In terms of departments, a partial concentration in the environmental sector must be observed, with 48% of the respondents belonging to it, followed by the urban planning department at 12%, while GIS/Informative territorial system and general direction are 4% each. Also, almost one third, 32%, declared themselves to belong to other departments not mentioned in the list, indicating some cross-sectoral uptake but also a concentration within traditional environmental functions.
Regarding organizational size, the sample appears diversified, with a clear predominance of medium-sized organizations. As shown in
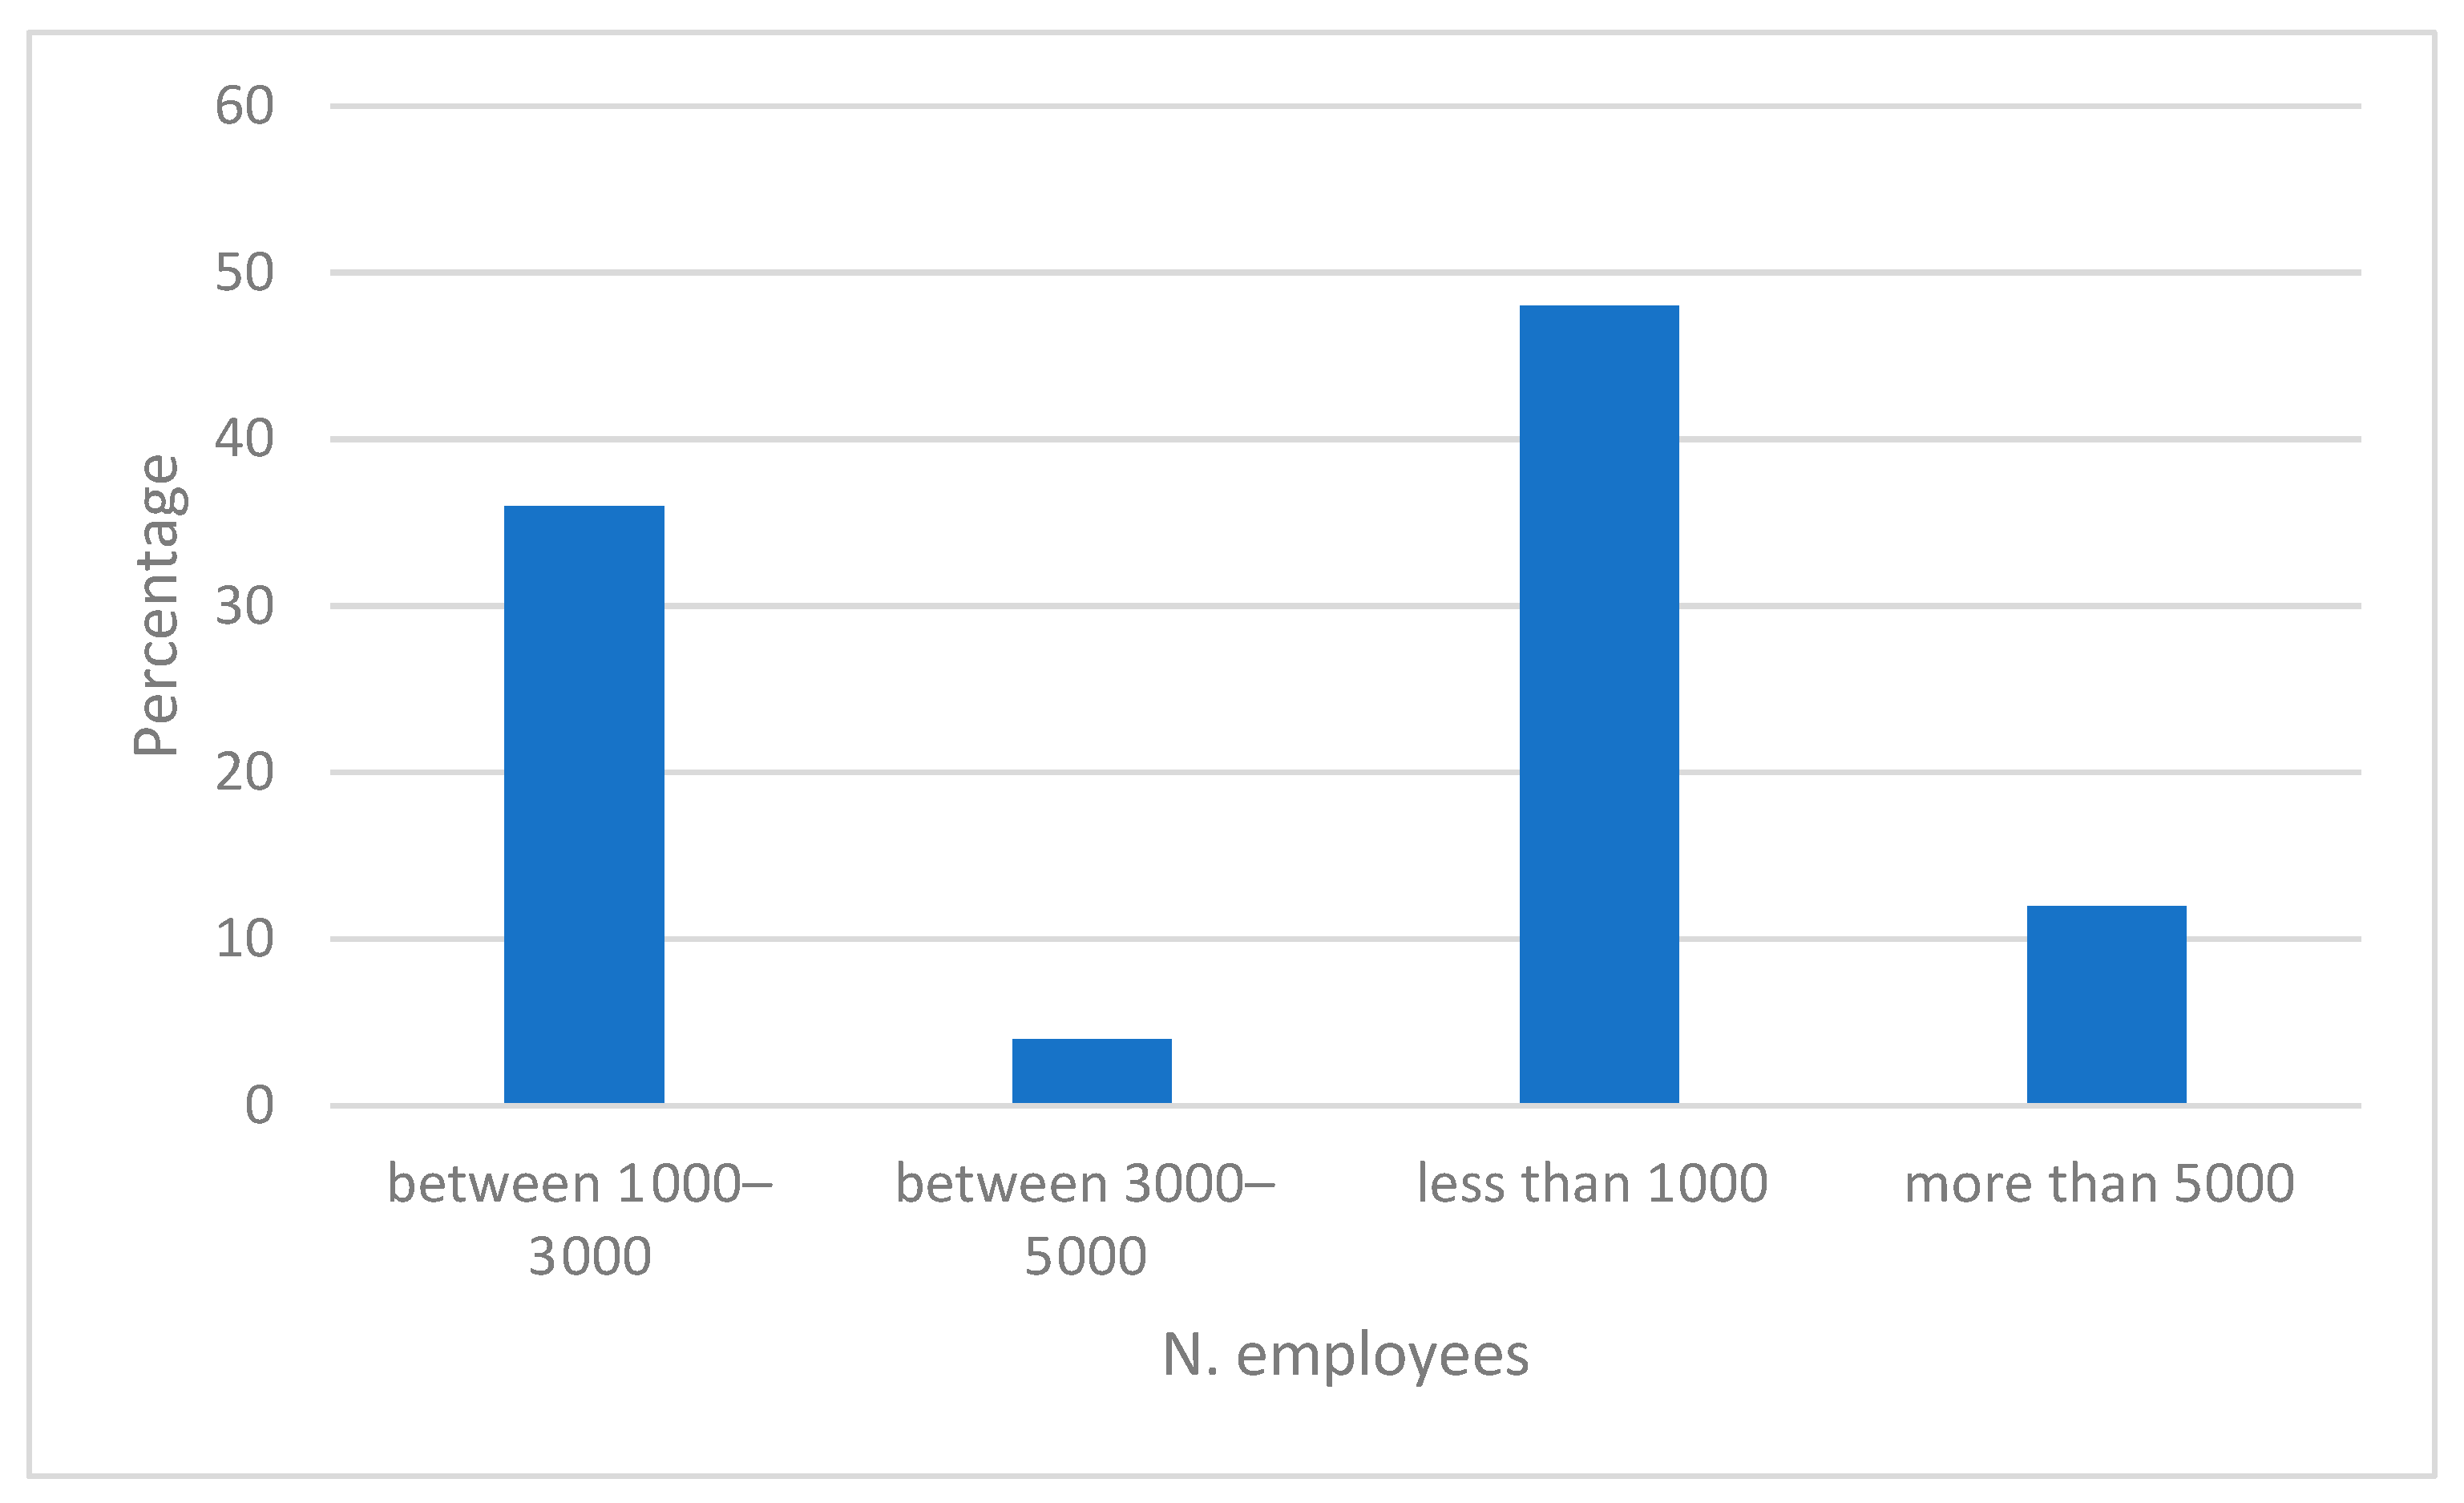
Figure 5, more than half of the respondents work in organizations with up to 3000 employees: 48% (N = 12) of respondents indicated that their organization employs fewer than 1000 people, while 36% (N = 9) reported working in organizations with 1000 to 3000 employees. In contrast, 4% (N = 1) are from an organization with 3000 to 5000 employees, and 12% (N = 3) of respondents indicated that their organization has more than 5000 employees.
Finally, the perceived level of autonomy of the respondents’ units was assessed on a 5-point scale. The mean autonomy score is 3.56 (S.D. = 1.08), indicating a moderate level of operational independence across the organizations surveyed. The level of autonomy could be relevant for interpreting the capacity of departments to independently experiment with or adopt EO solutions, especially in the absence of centralized strategic mandates.
3.2. EO Data Usage and Adoption Patterns (Q6–Q10)
As shown in
Table 2, among the 25 respondents, 16% (N = 4) reported either not using Earth Observation (EO) satellite data (N = 2) or being unaware of whether their organization uses it (N = 2). An additional 28% (N = 7) indicated indirect use of EO data—primarily through platforms such as Google Earth—without structured access to EO datasets or dedicated services. By contrast, 56% (N = 14) of respondents reported direct use of EO satellite data. This group includes representatives from all organizational types in the sample (cities, metropolitan cities, regional and municipal agencies), suggesting no strong association—at this stage—between organizational type and likelihood of EO adoption.
Indeed, disaggregating the adoption rate by type of organization reveals relatively limited variation:
Cities: 57% adoption, metropolitan cities: 60%, regional/municipal agencies: 50%, other (e.g., province-level organizations): 66%.
This further supports the observation that EO adoption in this sample is not strongly determined by organizational type but likely reflects other enabling or constraining factors explored in subsequent sections.
Among the 14 respondents who reported direct use (N = 14), the degree of EO adoption was assessed using a four-level scale, ranging from experimental to institutionalized use: “We have tested EO data experimentally, but usage is not regular (Level 1)”; “We use EO data occasionally for specific projects or reports (Level 2)”; “EO data is regularly used in our workflows, but not yet institutionalized (Level 3)”; “EO data is fully integrated into our operational processes and decision-making (Level 4)”.
As shown in
Table 3, routine or institutionalized EO usage is not common across the sample. Indeed, there is only one reported regular use in workflows and another one institutionalized use (level 3 and level 4, respectively). In contrast, five respondents reported experimental use (level 1), while seven reported occasional use for specific projects or reports (level 2).
As
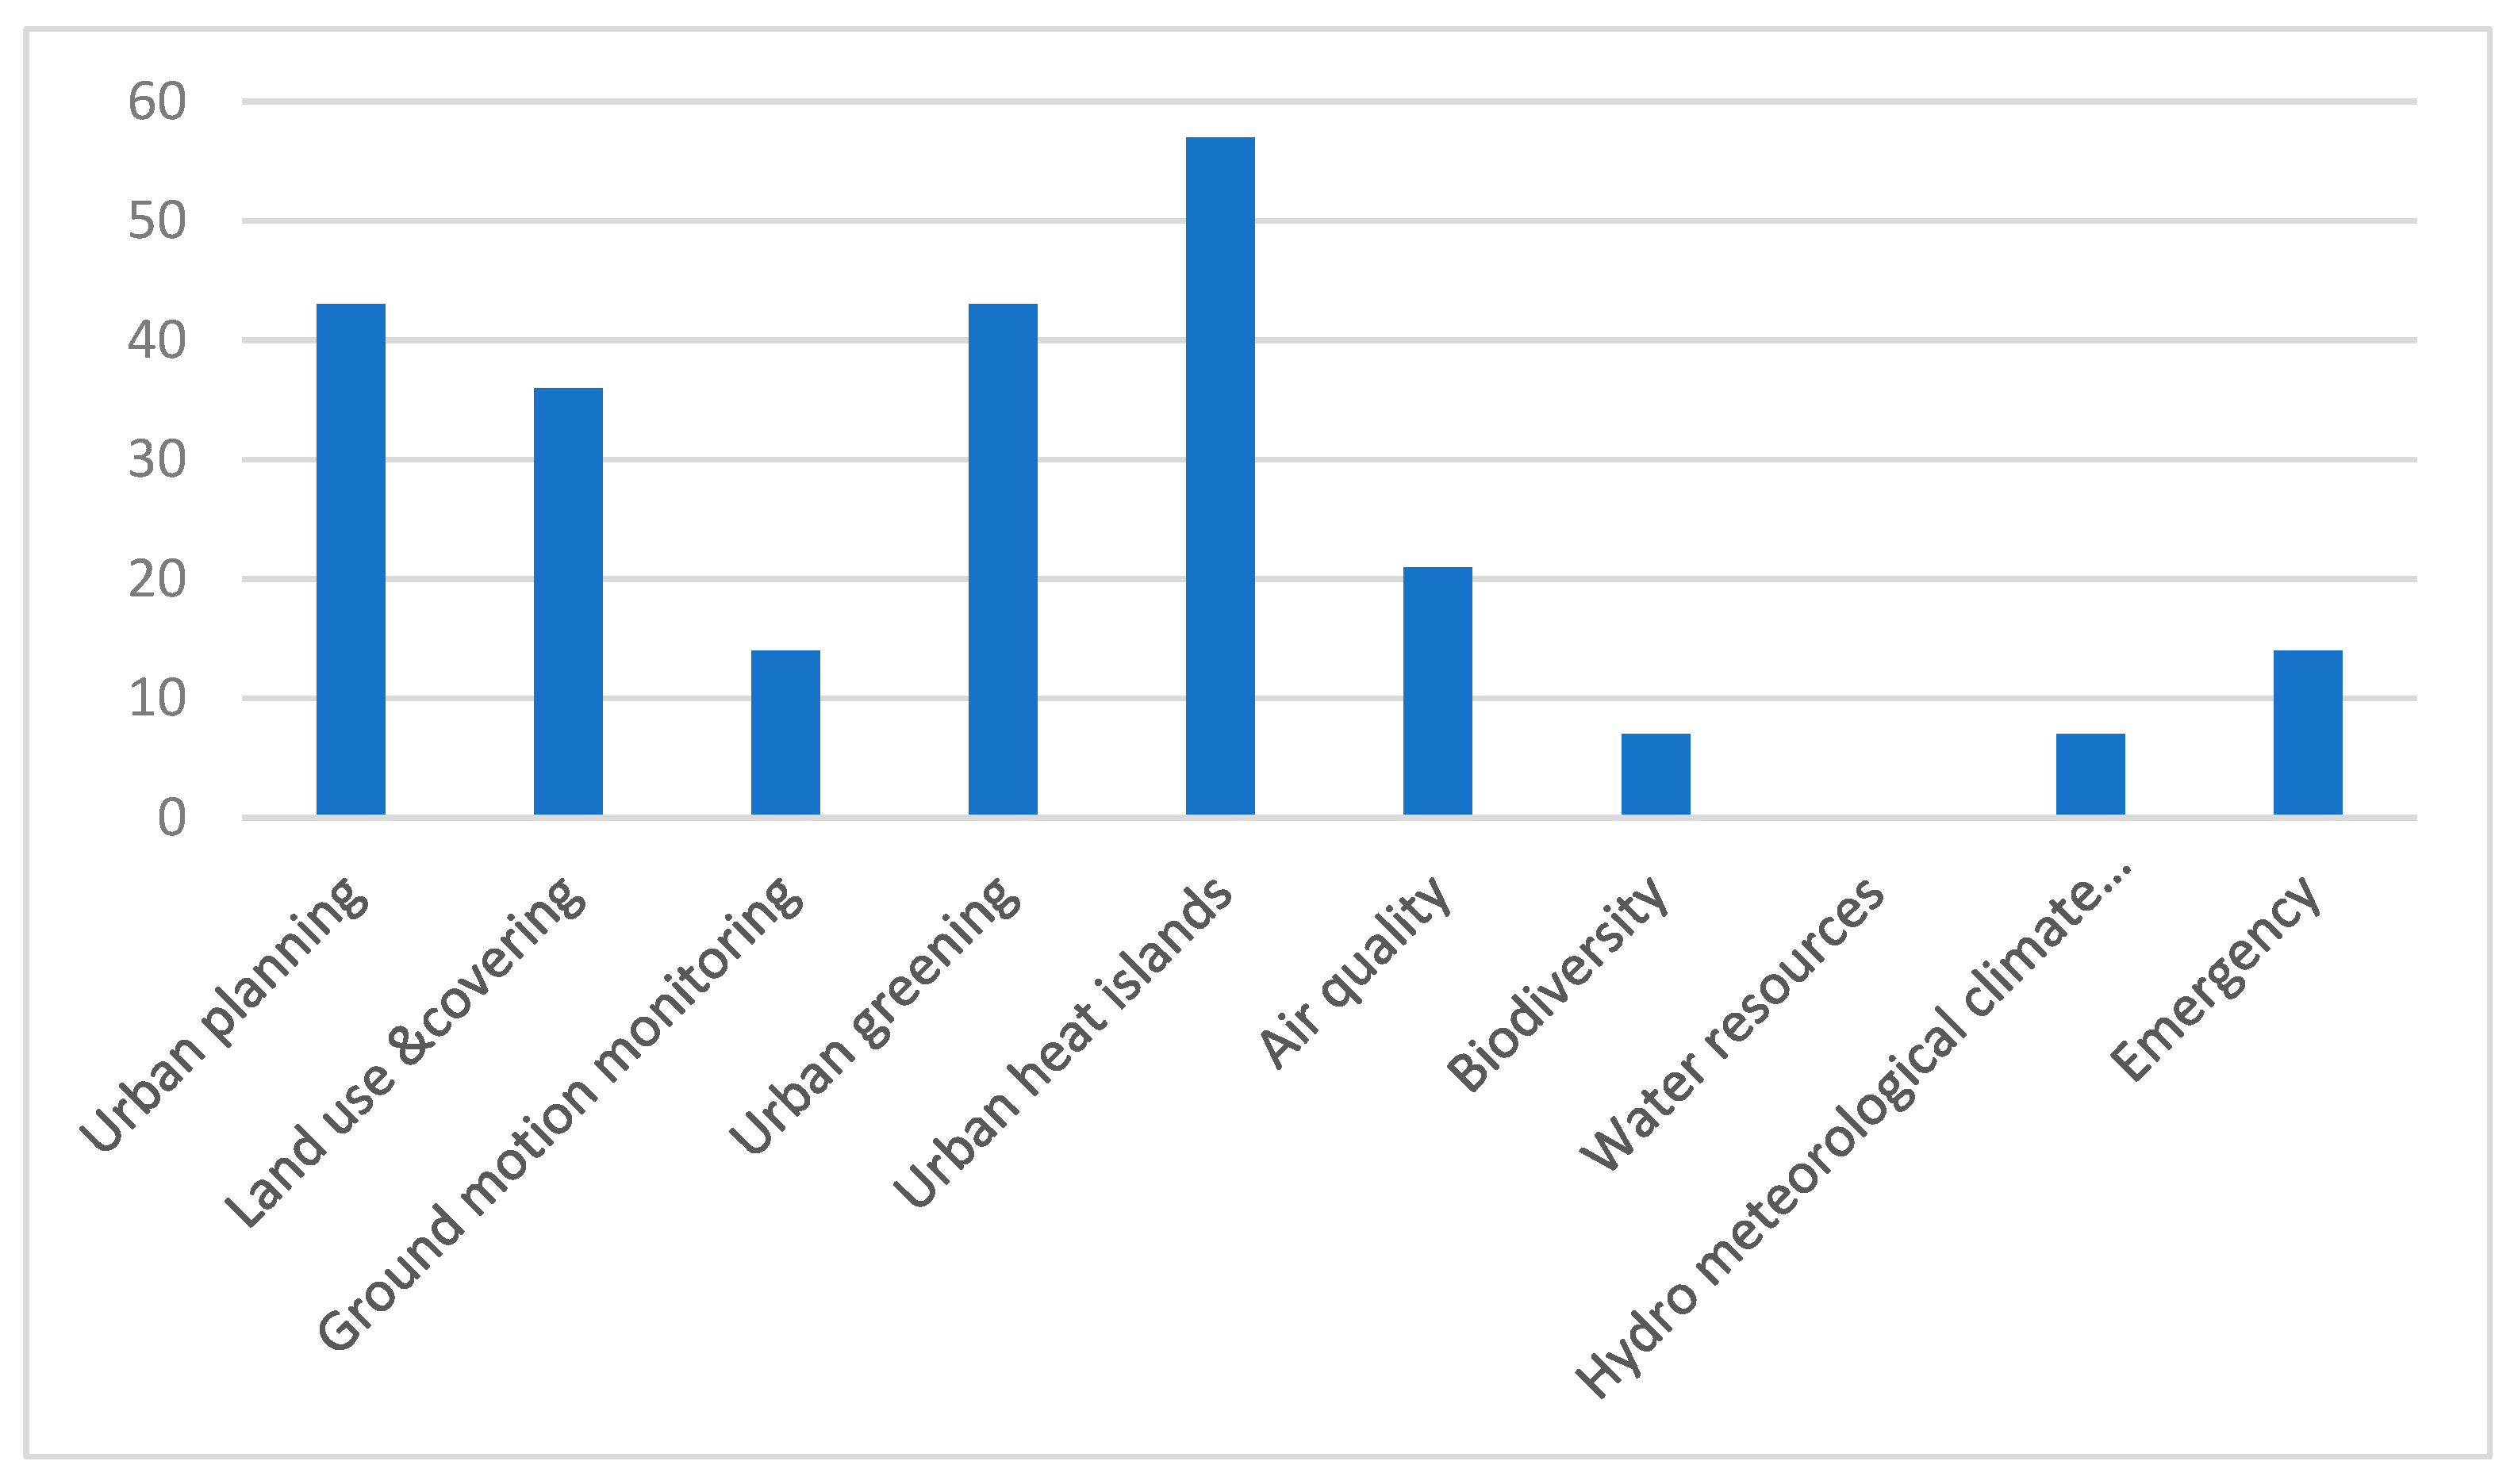
Figure 6 shows, in terms of thematic domains of application, EO satellite data was most frequently used for addressing urban heat islands 57% (N = 8), followed by urban planning and urban greening 43% (each N = 6) and land use and land cover 36% (N = 5). Less frequent domains include air quality 21% (N = 3), 14% emergency (N = 2) and ground motion (N = 2) and single mentions for biodiversity and hydro-meteorological monitoring (N = 1 each, 7%). This thematic focus is likely influenced by the urban-centric nature of the respondents’ organizations and the specific projects in which they are engaged. Notably, regional-level authorities are underrepresented in the respondent sample, which may modify thematic priorities.
As shown in
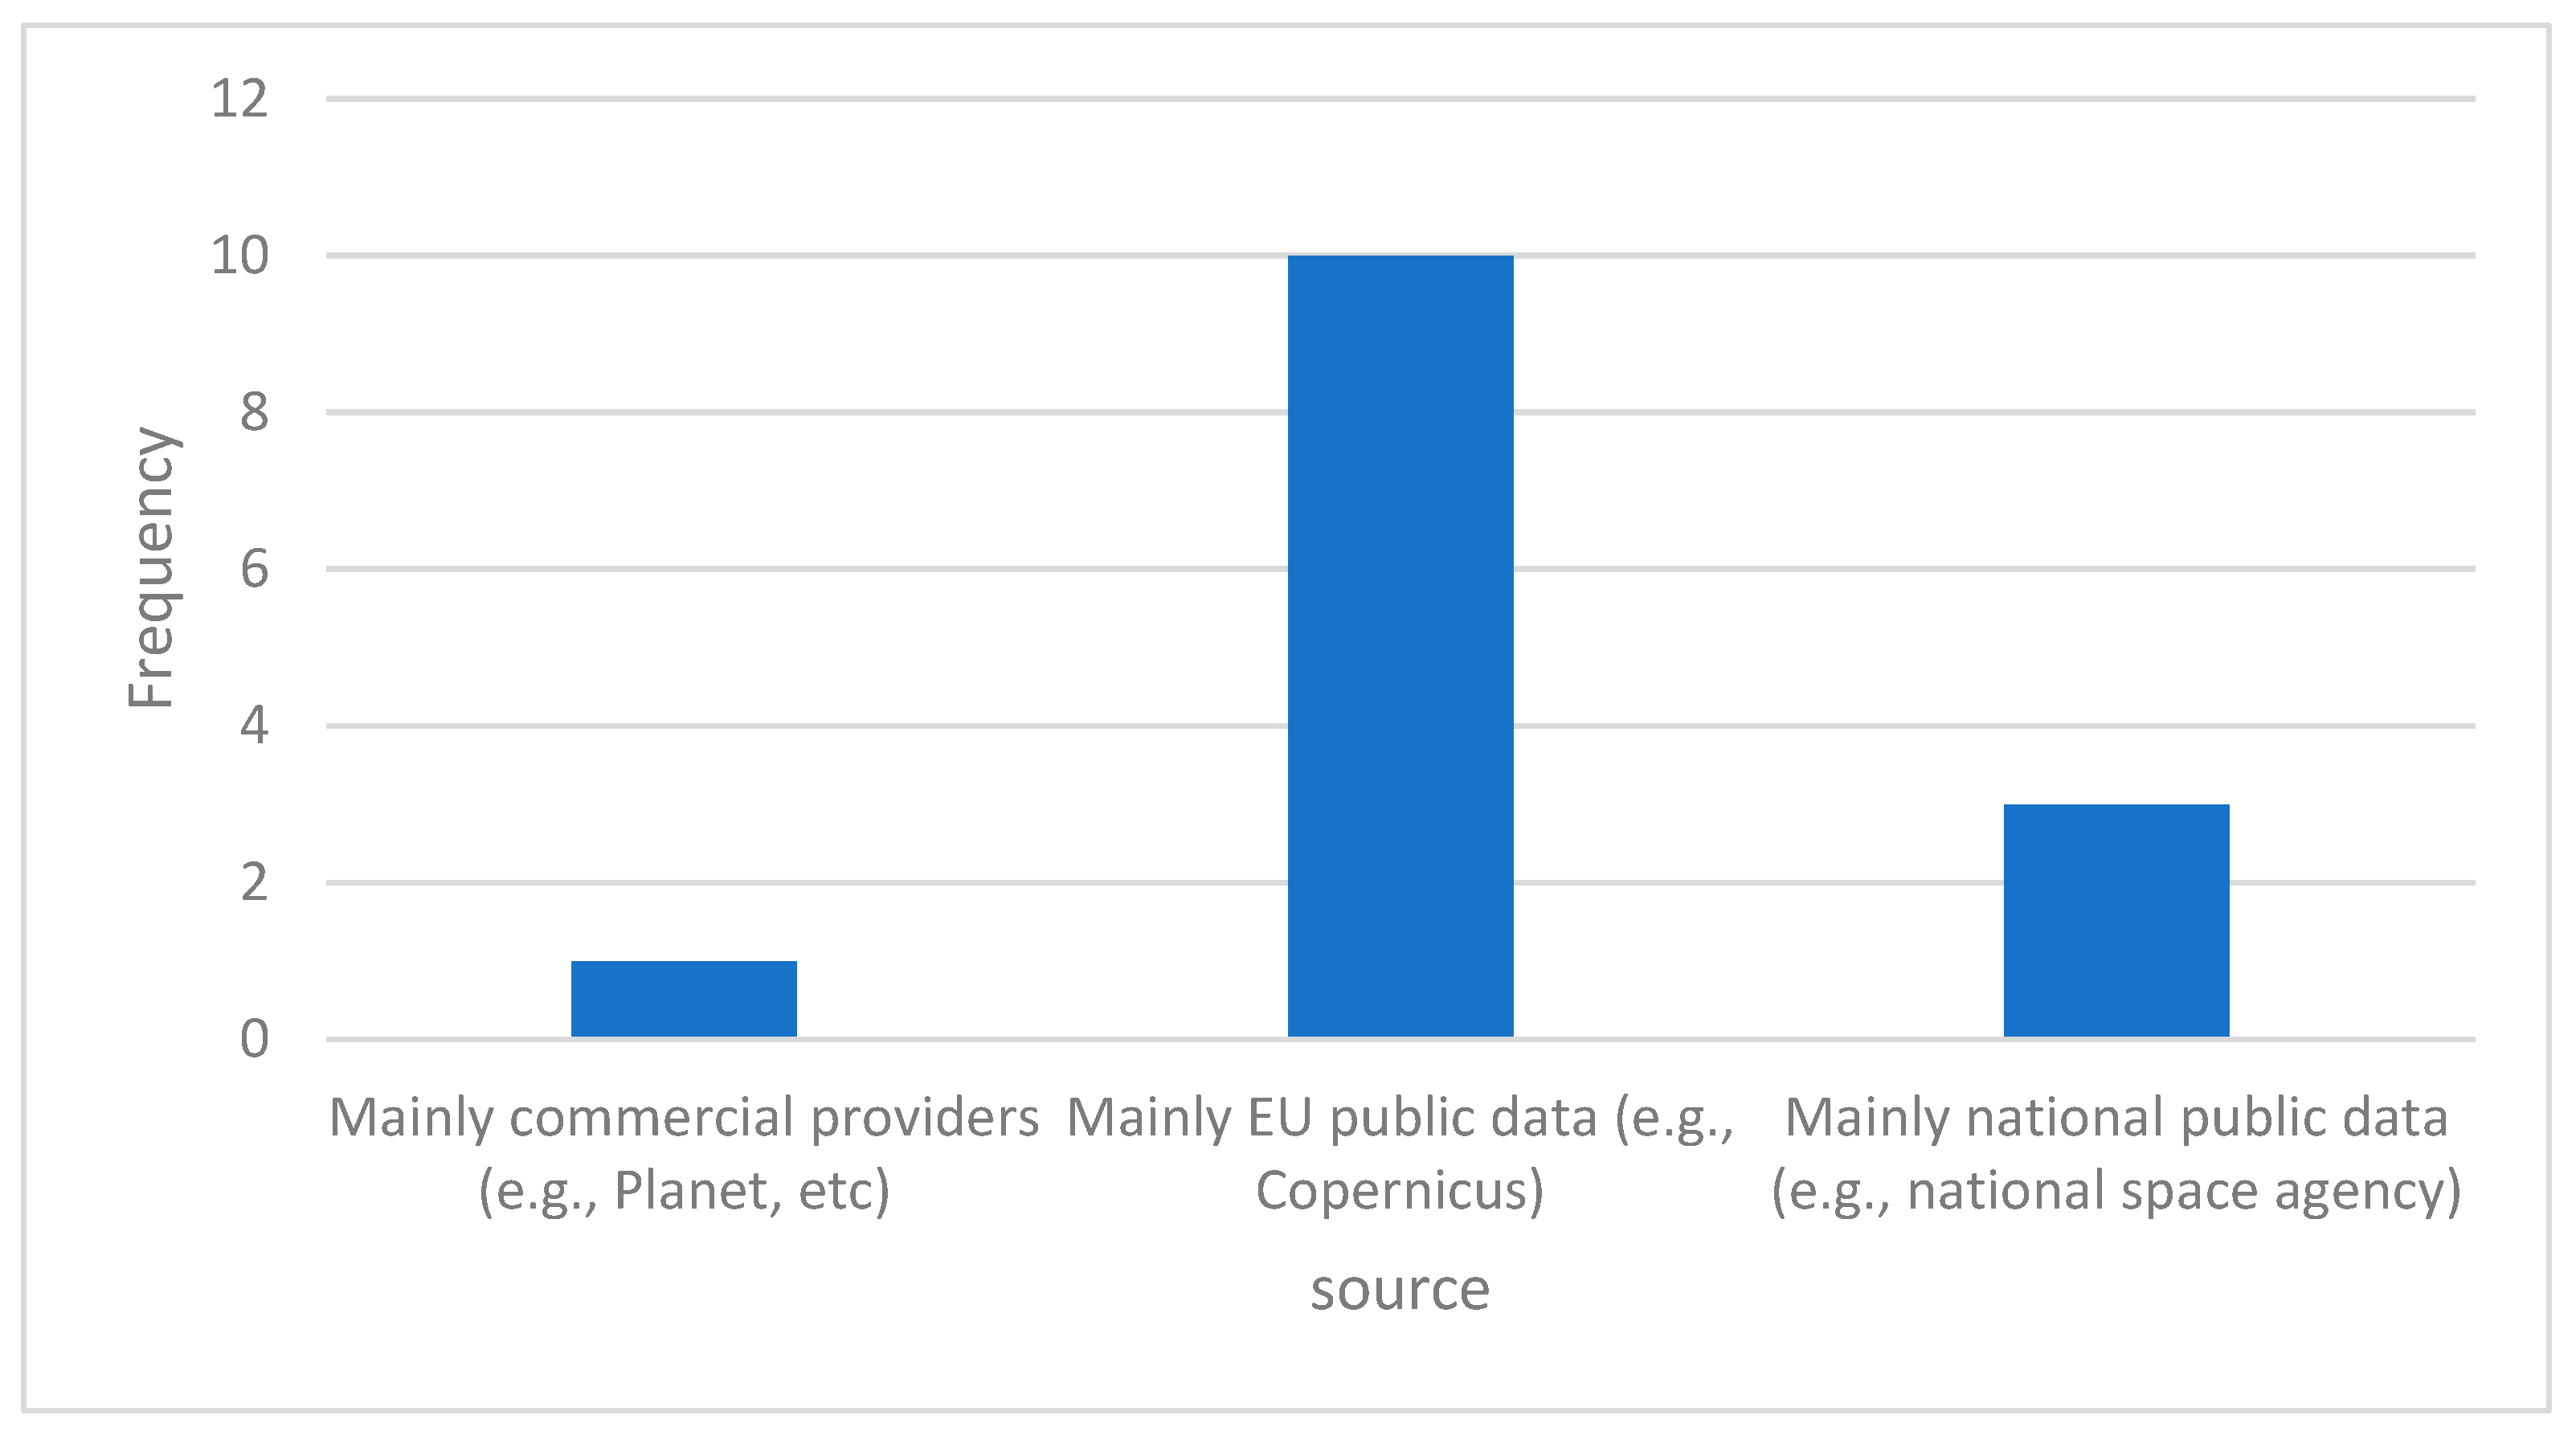
Figure 7 the primary source of EO data across the sample is the Copernicus programme, cited by 10 users corresponding to 71% of respondents. On the other hand, three organizations (21%) primarily use a national satellite constellation or services, and only one user (a Dutch org.) mentioned commercial satellite data as the main source.
Finally, regarding the purposes of EO satellite use, monitoring activities (N = 8) are the most relevant activity, closely followed by planning activities (N = 6). It is worth mentioning that no respondents reported using EO data for law-making or forecasting systems.
3.3. Technology Affordances and Constraints Perceptions
This section was completed only by the 14 respondents who reported direct use of Earth Observation (EO) satellite data within their organizations. To explore perceived technological affordances and constraints, participants were asked to indicate their level of agreement with the following five statements using a 5-point Likert scale (1 = strongly disagree, 5 = strongly agree):
EO data significantly improves the quality of our decision-making
The spatial and temporal resolution of EO data meets our operational and knowledge needs.
Integrating EO data with existing systems (GIS, planning tools) is manageable.
Commercial satellite data can be effective, but there are issues of ownership and cost.
EO satellite data are generally cost-effective compared to other remote sensing tools (e.g., field surveys, drones)
As shown in
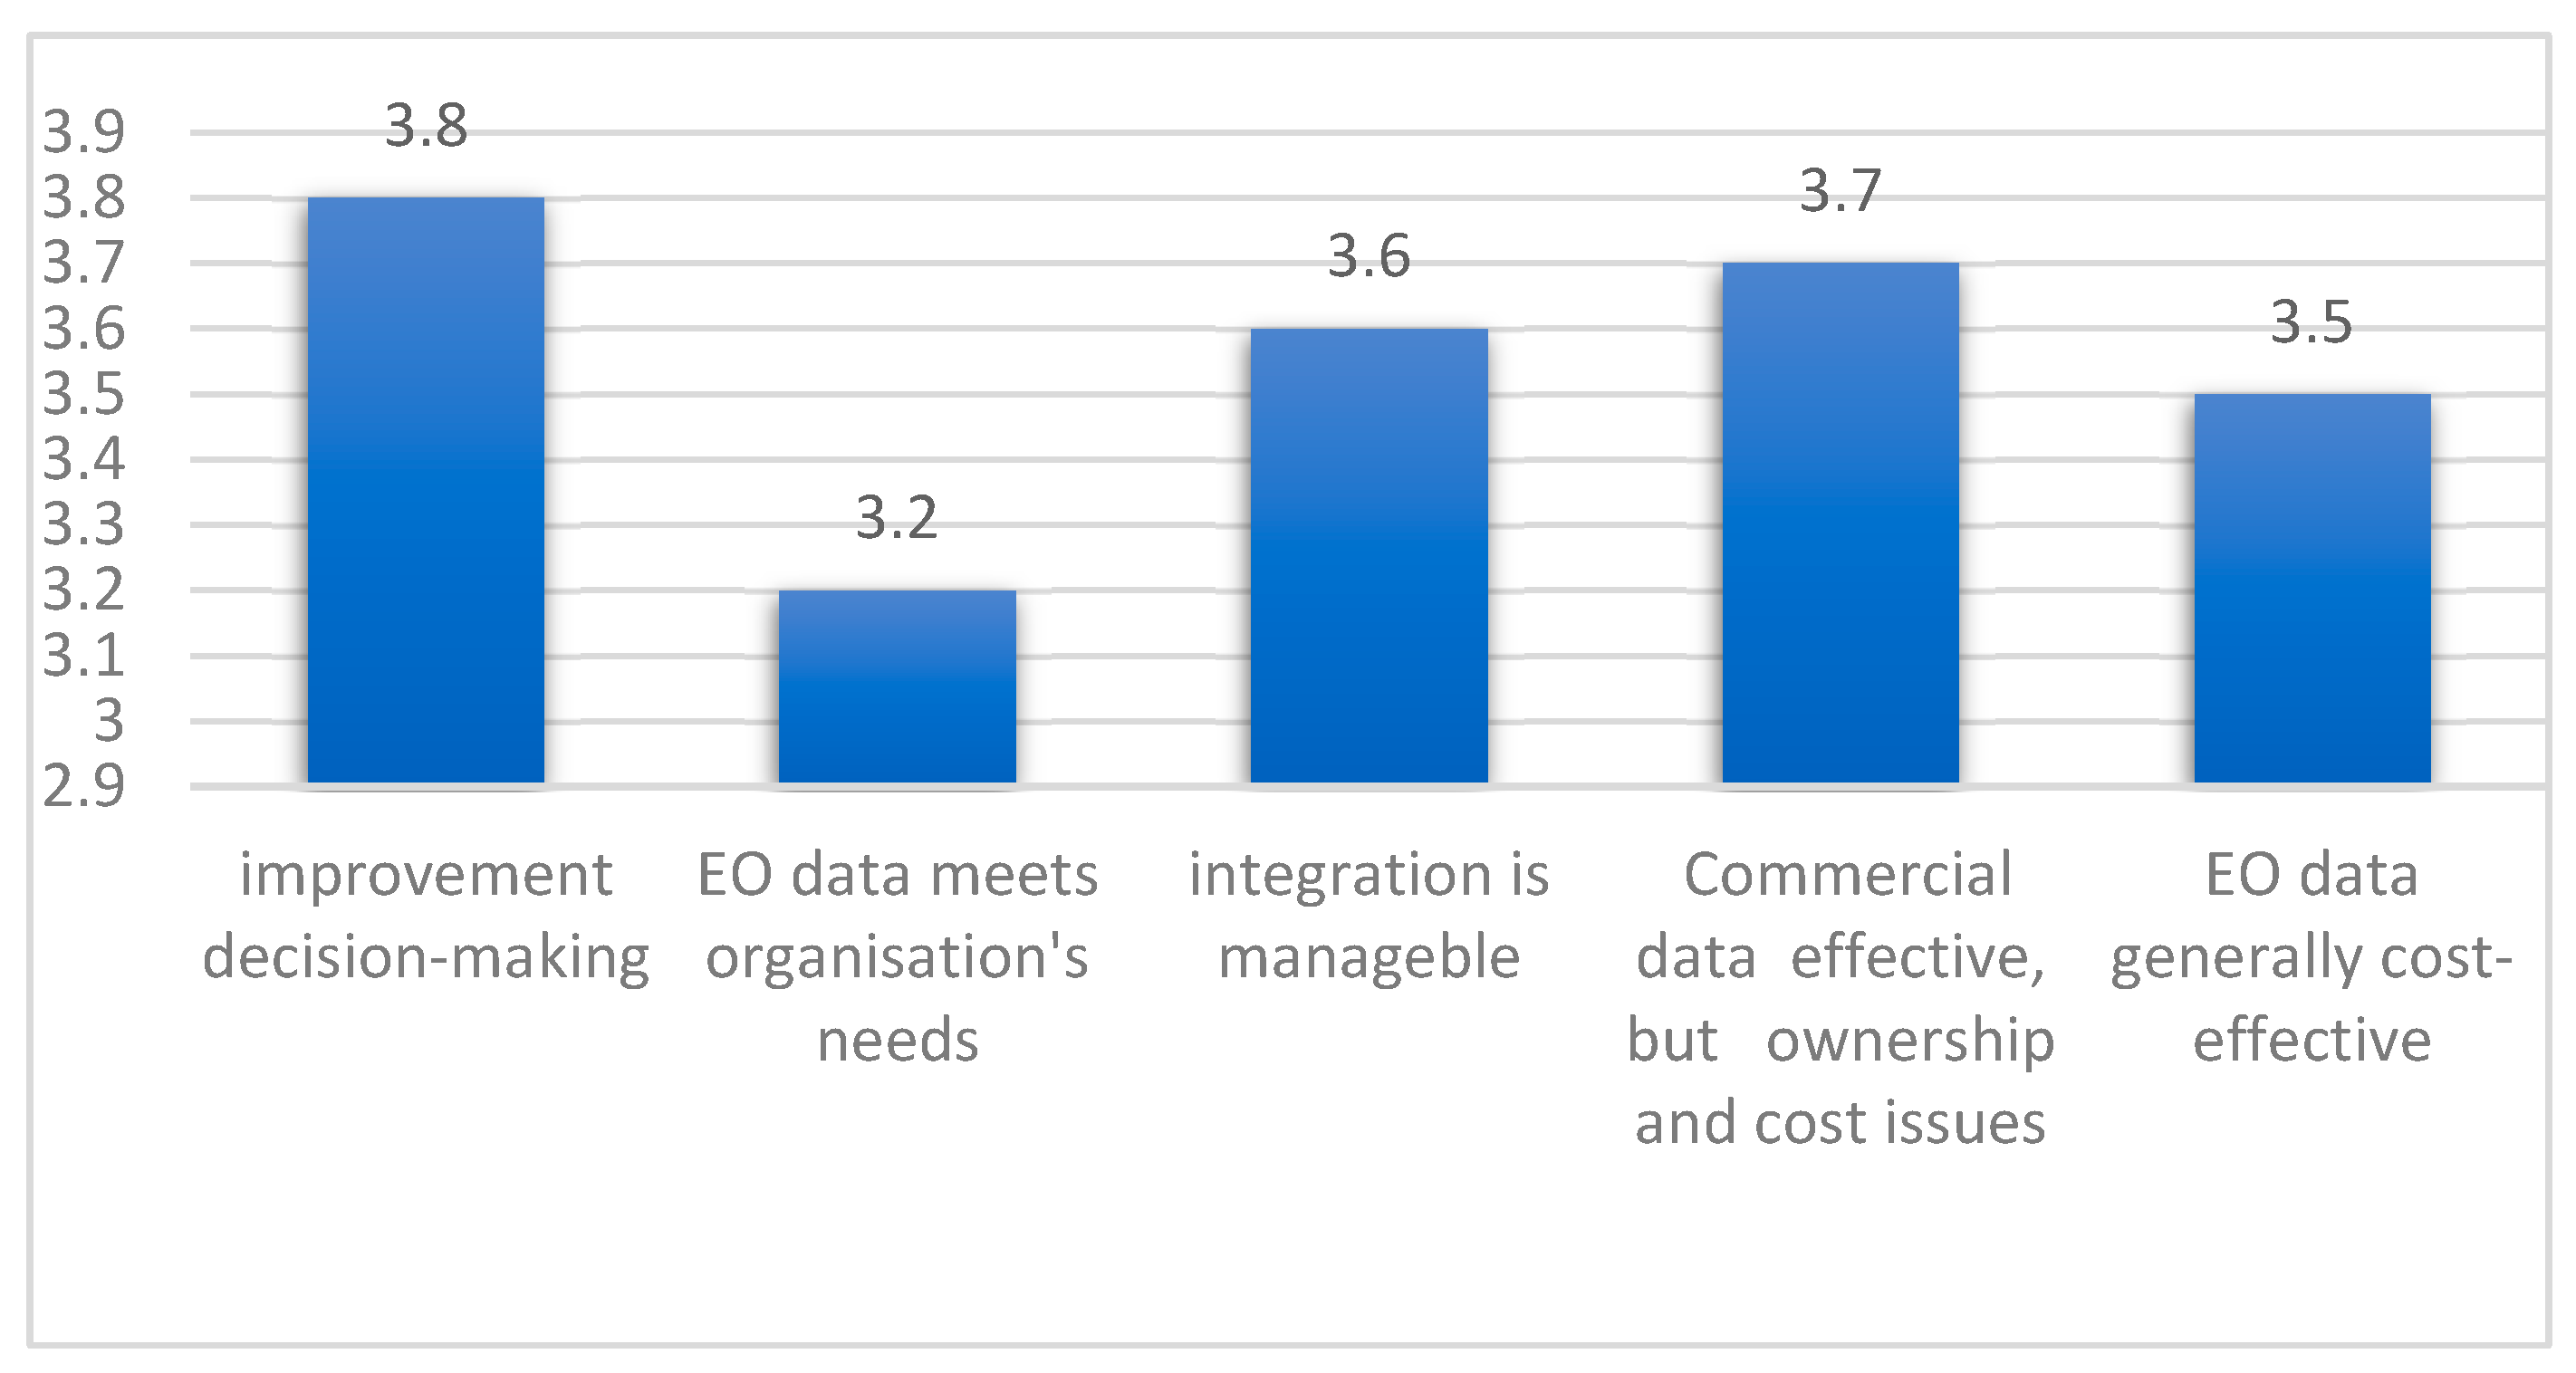
Figure 8, across the five items, respondents expressed moderate to moderately high levels of agreement, suggesting a generally favourable perception of EO technologies, albeit with some reservations. Specifically, the perceived value of EO data in enhancing decision-making yielded a mean score of 3.86 (median = 4), indicating a cautiously positive view. Similar levels of agreement were observed for data integration with existing systems (mean = 3.86, median = 4) and cost-effectiveness relative to alternative data sources (mean = 3.71, median = 4). The item addressing commercial EO data—which focused on ownership and cost-related barriers—also received a relatively high mean score (mean = 3.64, median = 3.5), reflecting respondents’ recognition of its utility despite notable constraints. Notably, the lowest mean score (mean = 3.5, with a median value = 3) was associated with the statement concerning the adequacy of EO data in meeting the organizations’ operational and knowledge needs. Given that a score of 3 typically indicates a neutral stance, this result points to ambivalence or cautious optimism. While respondents do not explicitly question the relevance of EO data, they refrain from affirming its current capacity to address institutional requirements fully. No statistically significant patterns were observed in the responses when analyzed by organization type (e.g., cities, regional agencies), suggesting that perceptions of EO technologies are relatively consistent across different institutional settings.
3.4. Influential Factors Perceived
This section explores the internal and external conditions that may influence the adoption of Earth Observation (EO) satellite data. The sample for this section is N = 21 respondents, consisting of all the respondents to the survey, including those using EO only indirectly, except for those not using EO satellite data or not aware of it (N = 4). Respondents were asked to rate their level of agreement with a series of statements using a 5-point Likert scale (1 = strongly disagree; 5 = strongly agree).
Organizational factors
“In my organization, the high-level management is not fully aware of the use or potential of EO technologies”
“Our staff receive regular training in EO technologies and satellite data”
“We have adequate internal expertise to process and use EO data and services effectively”
“The level of trust in data is high in my organization. There is a generally good data culture”
As shown in
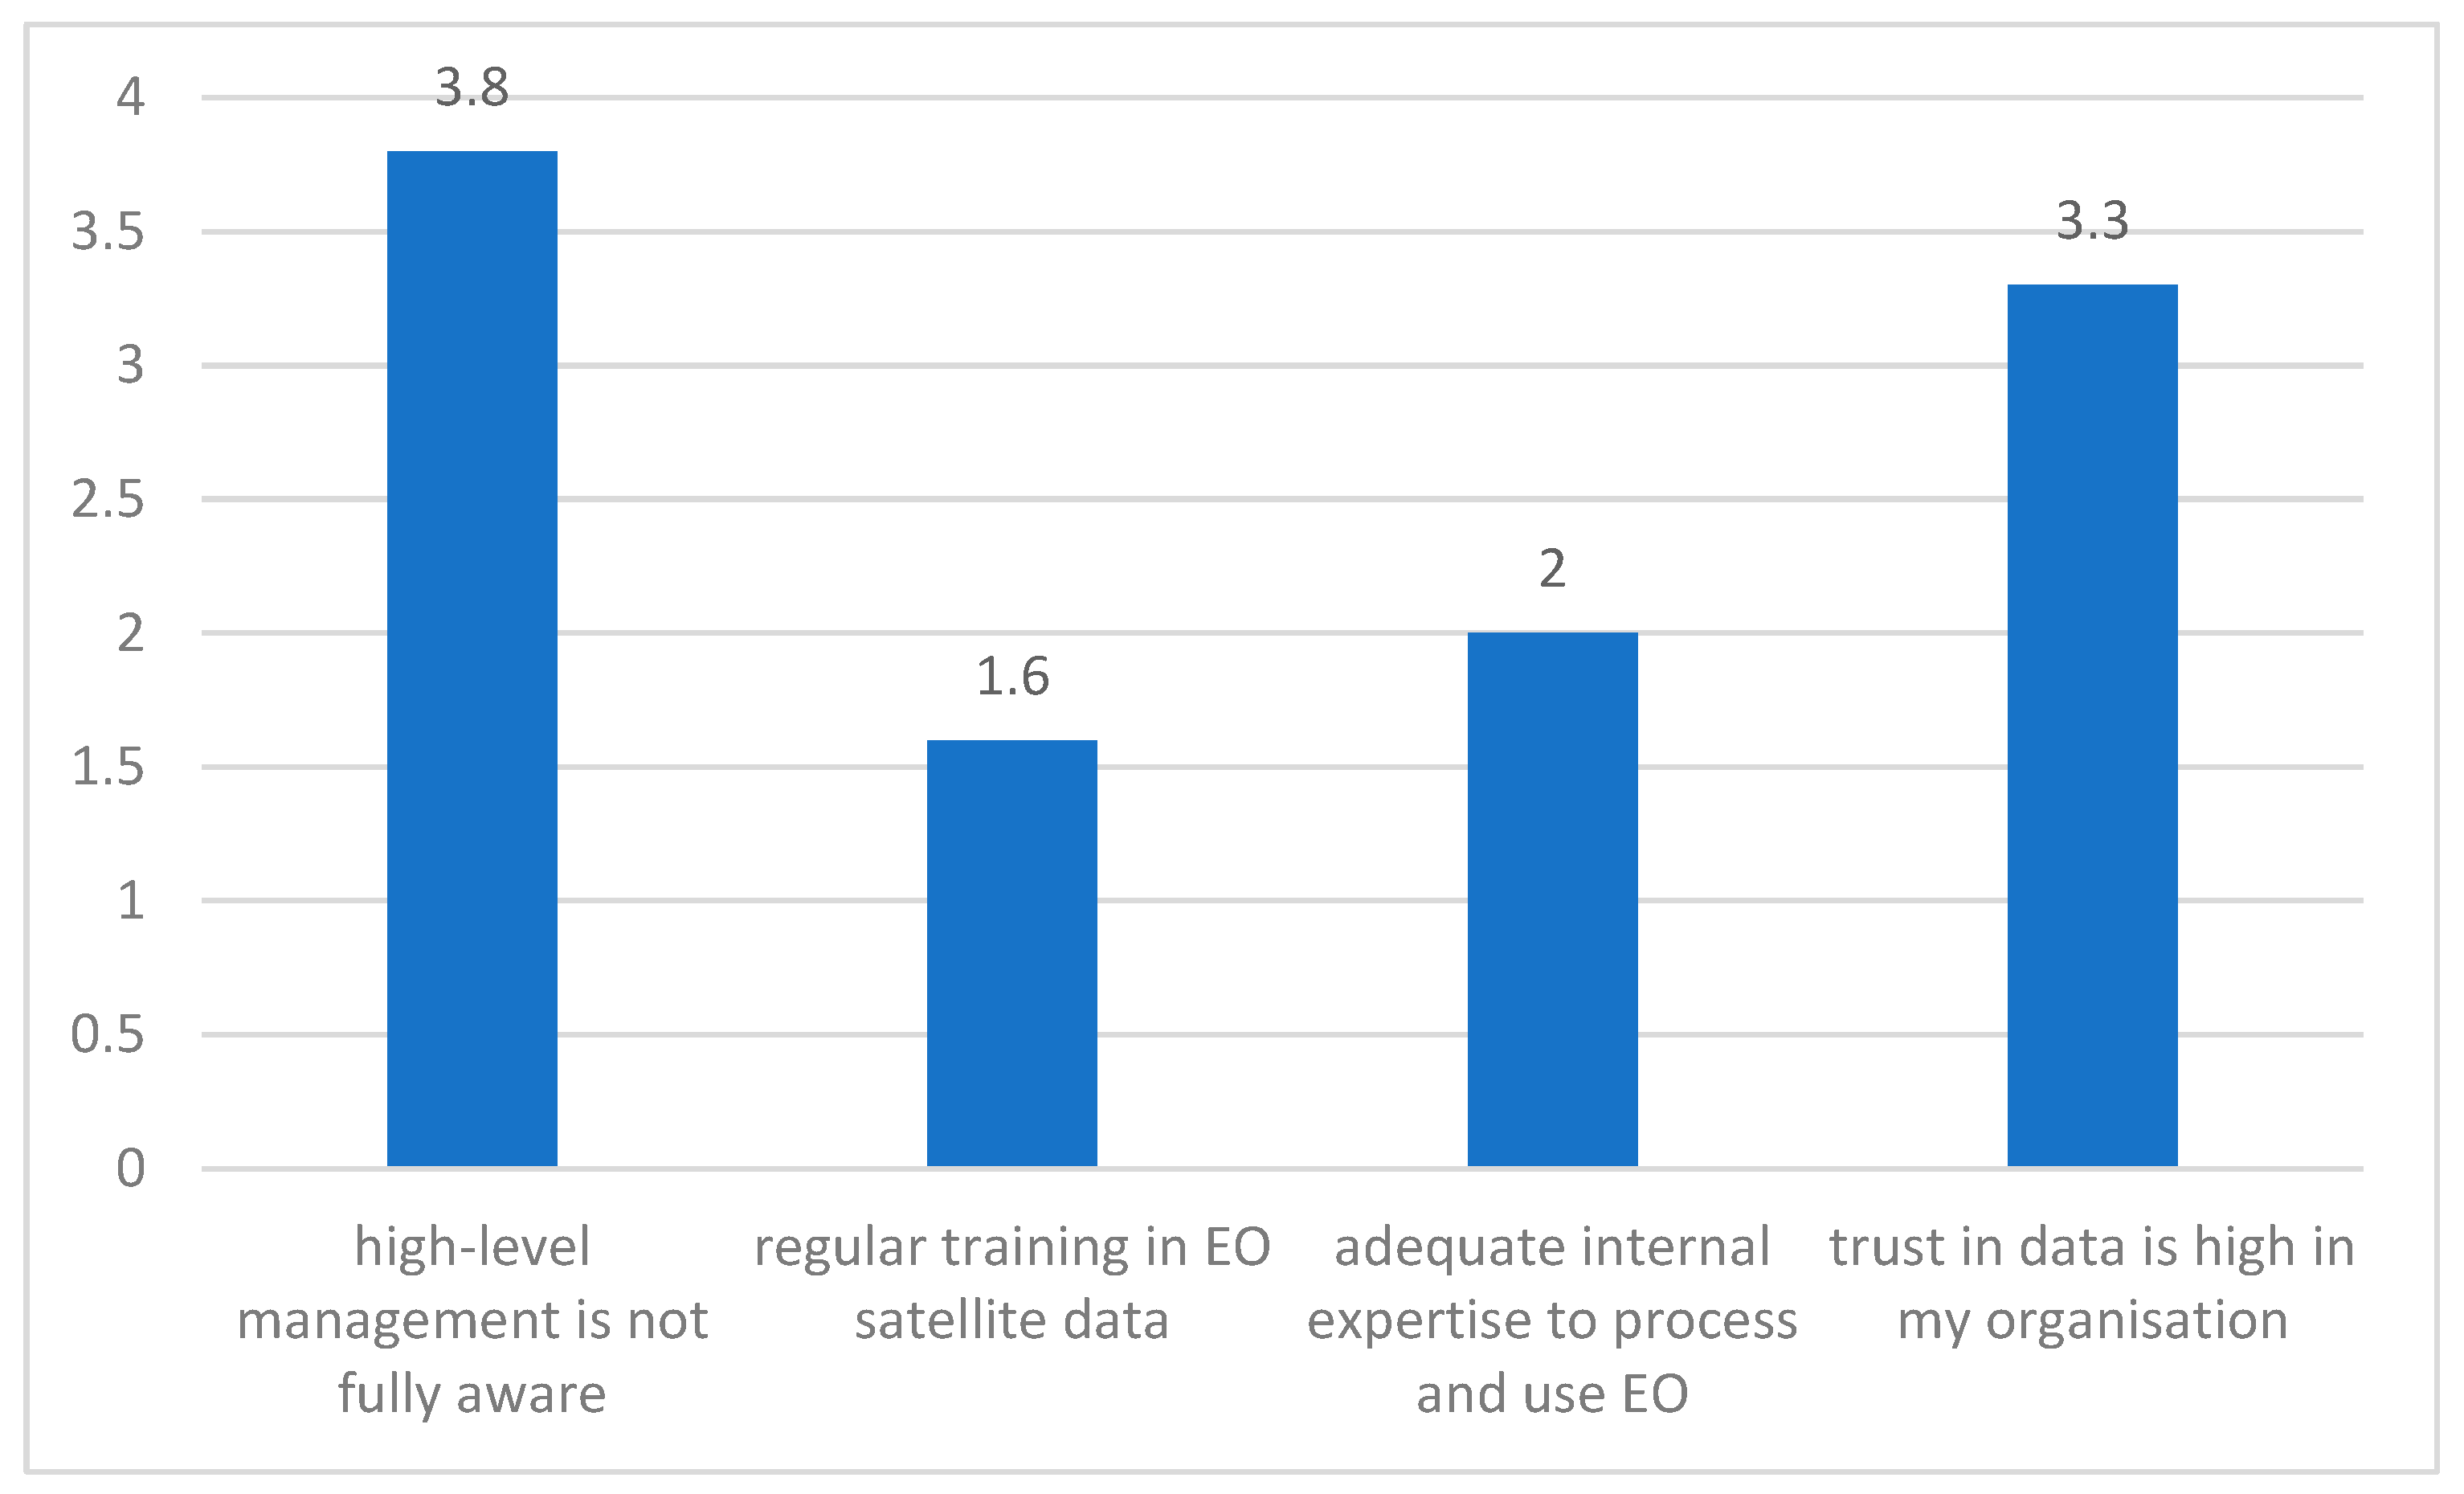
Figure 9, the responses indicate a widely perceived lack of awareness among high-level management regarding EO technologies’ potential (mean = 3.8, median = 4), highlighting a potential leadership-level barrier to adoption. More critically, there is strong evidence of structural weaknesses in organizational capacity, particularly in terms of training provision (mean = 1.6, median = 1) and internal technical expertise (mean = 2, median = 2). These results suggest that most organizations lack the skills and knowledge required to process and exploit EO data autonomously. On a more positive note, respondents reported moderate agreement regarding the existence of a general data culture and trust in data (mean = 3.3, median = 3), which could serve as a partial enabling factor for future investments in EO-related competencies.
Environmental factors
To assess environmental factors, respondents were asked whether their organization is
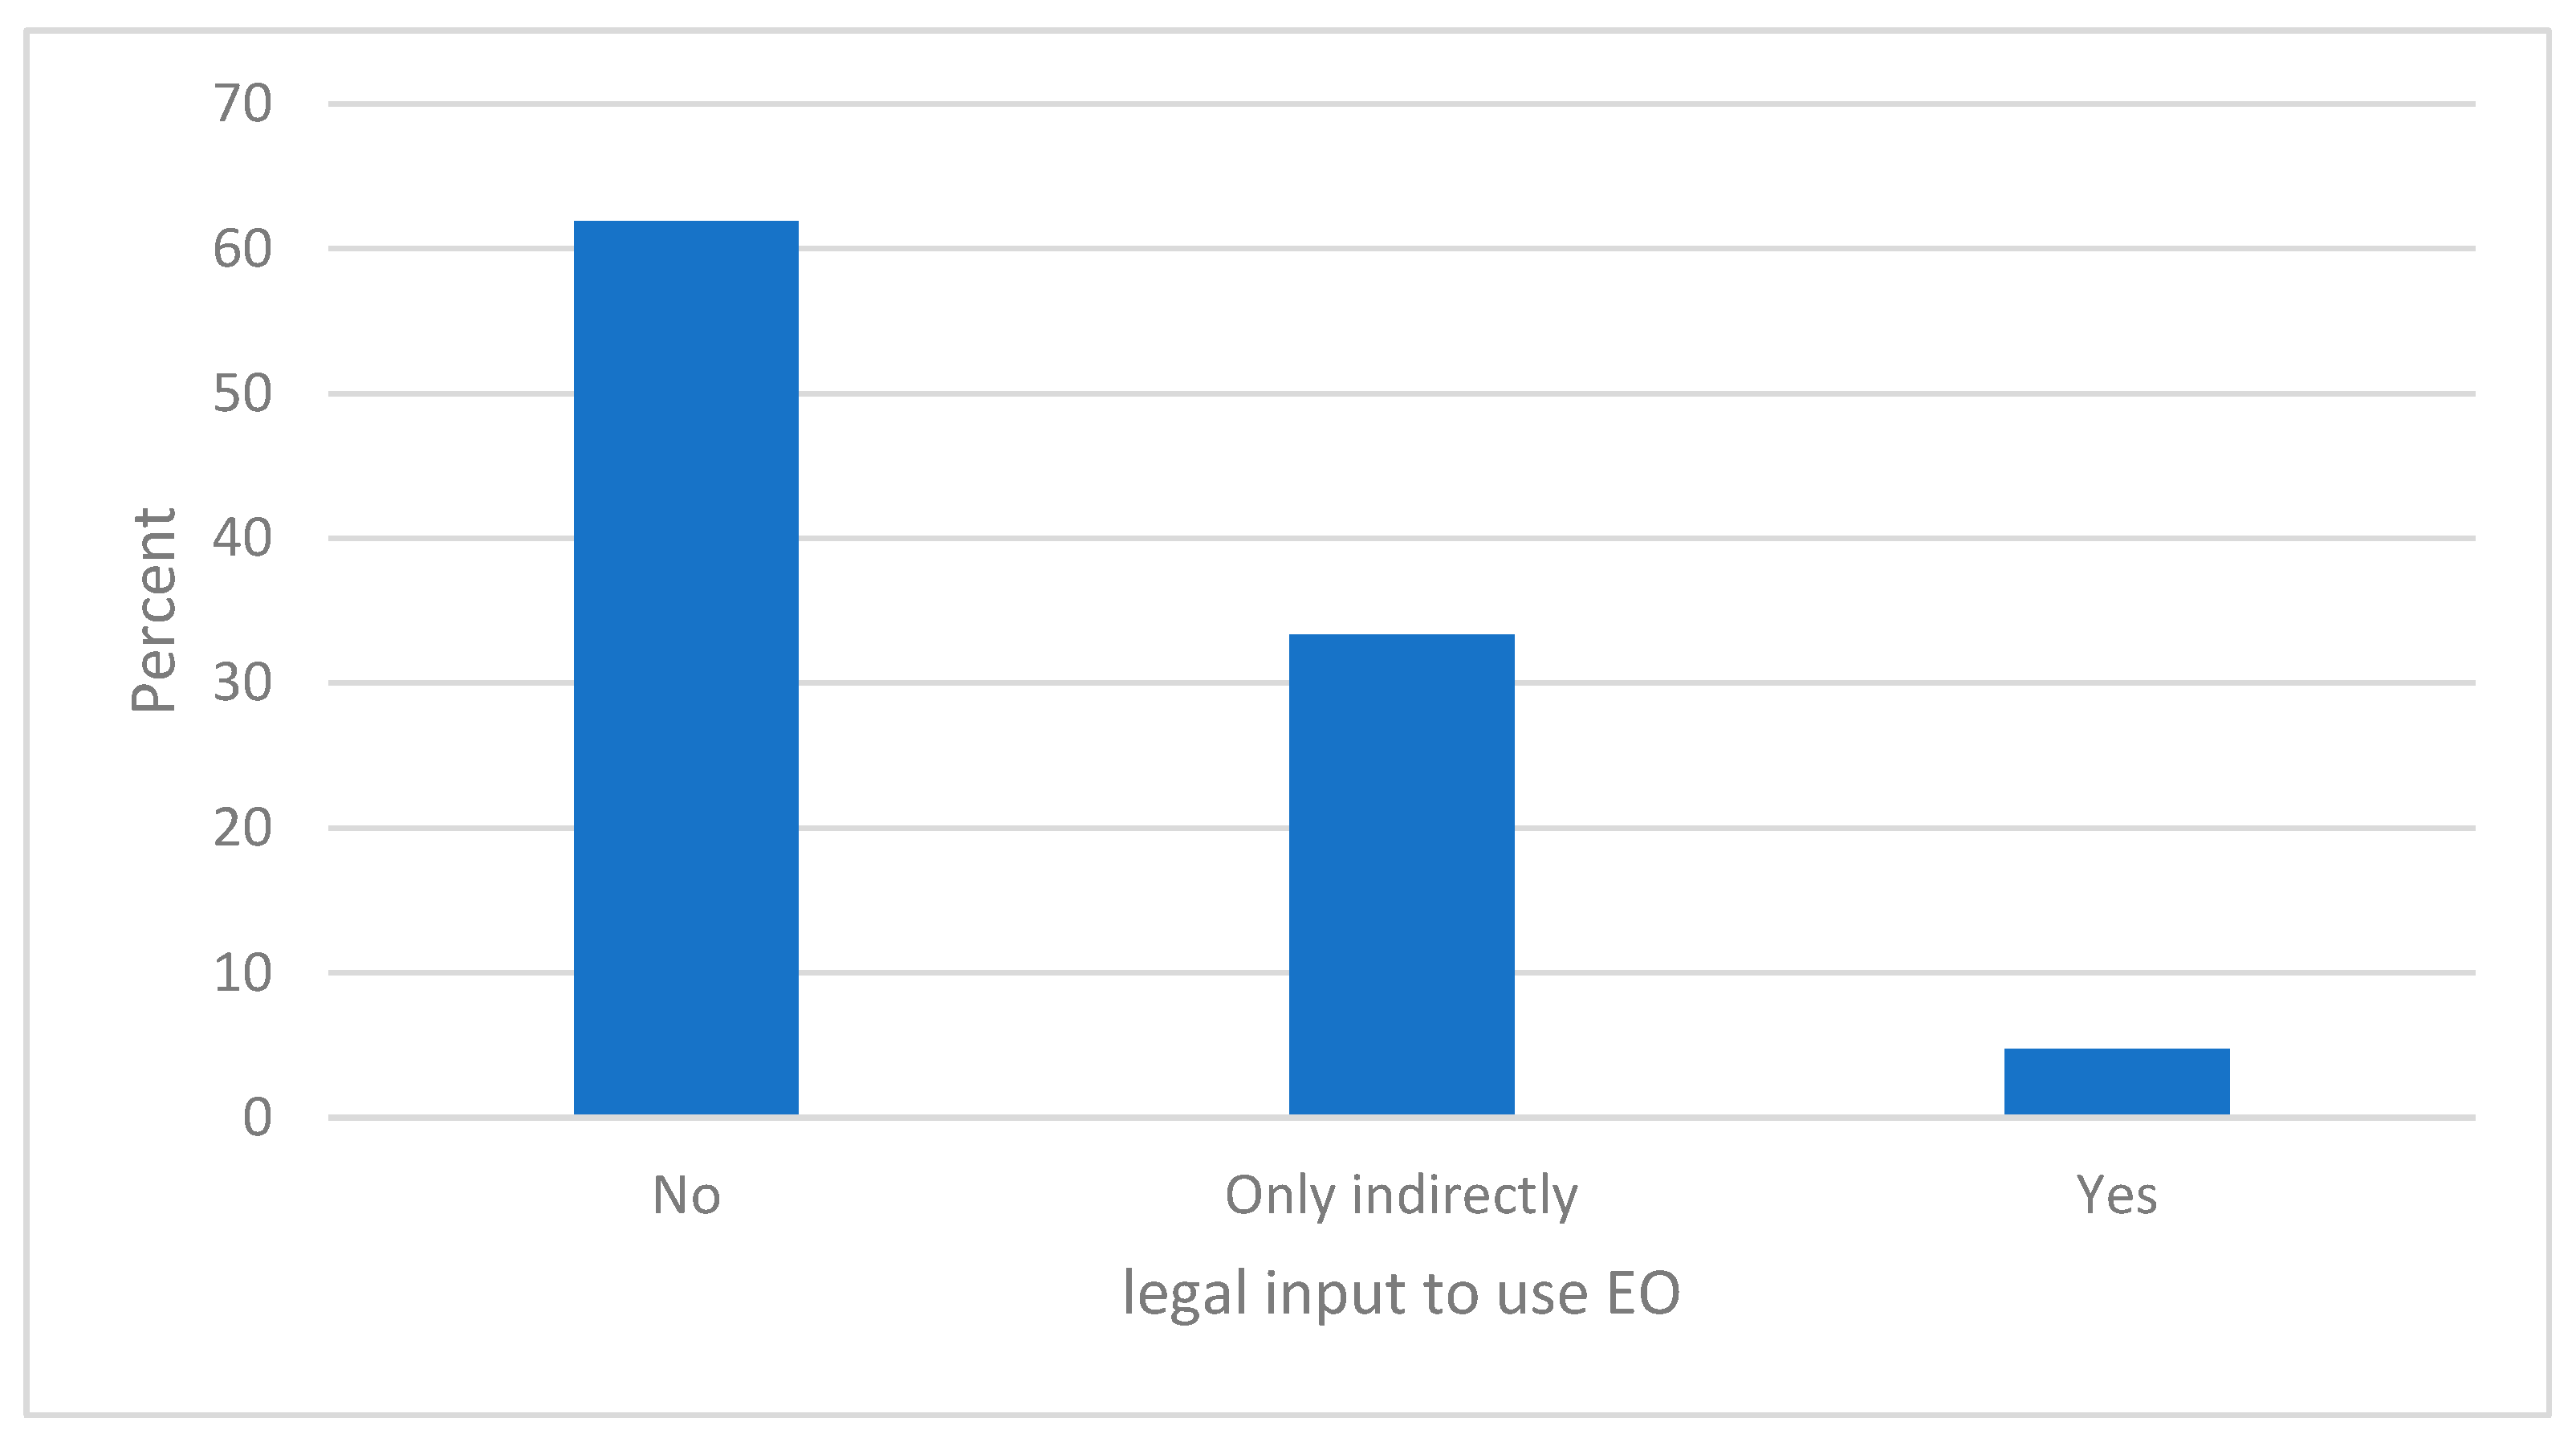
required or encouraged by laws or regulations to use EO satellite data. As shown in
Figure 10, the majority of the respondents, 62% (N = 13), answered “No” and 33% (N = 7) selected “Only indirectly”. In comparison, only 5% (N = 1) reported a clear regulatory mandate. These findings indicate that external institutional pressure is currently minimal. Notably, no specific correlation pattern has been identified depending on the type of organizations or with the respect to the actual use of EO data.
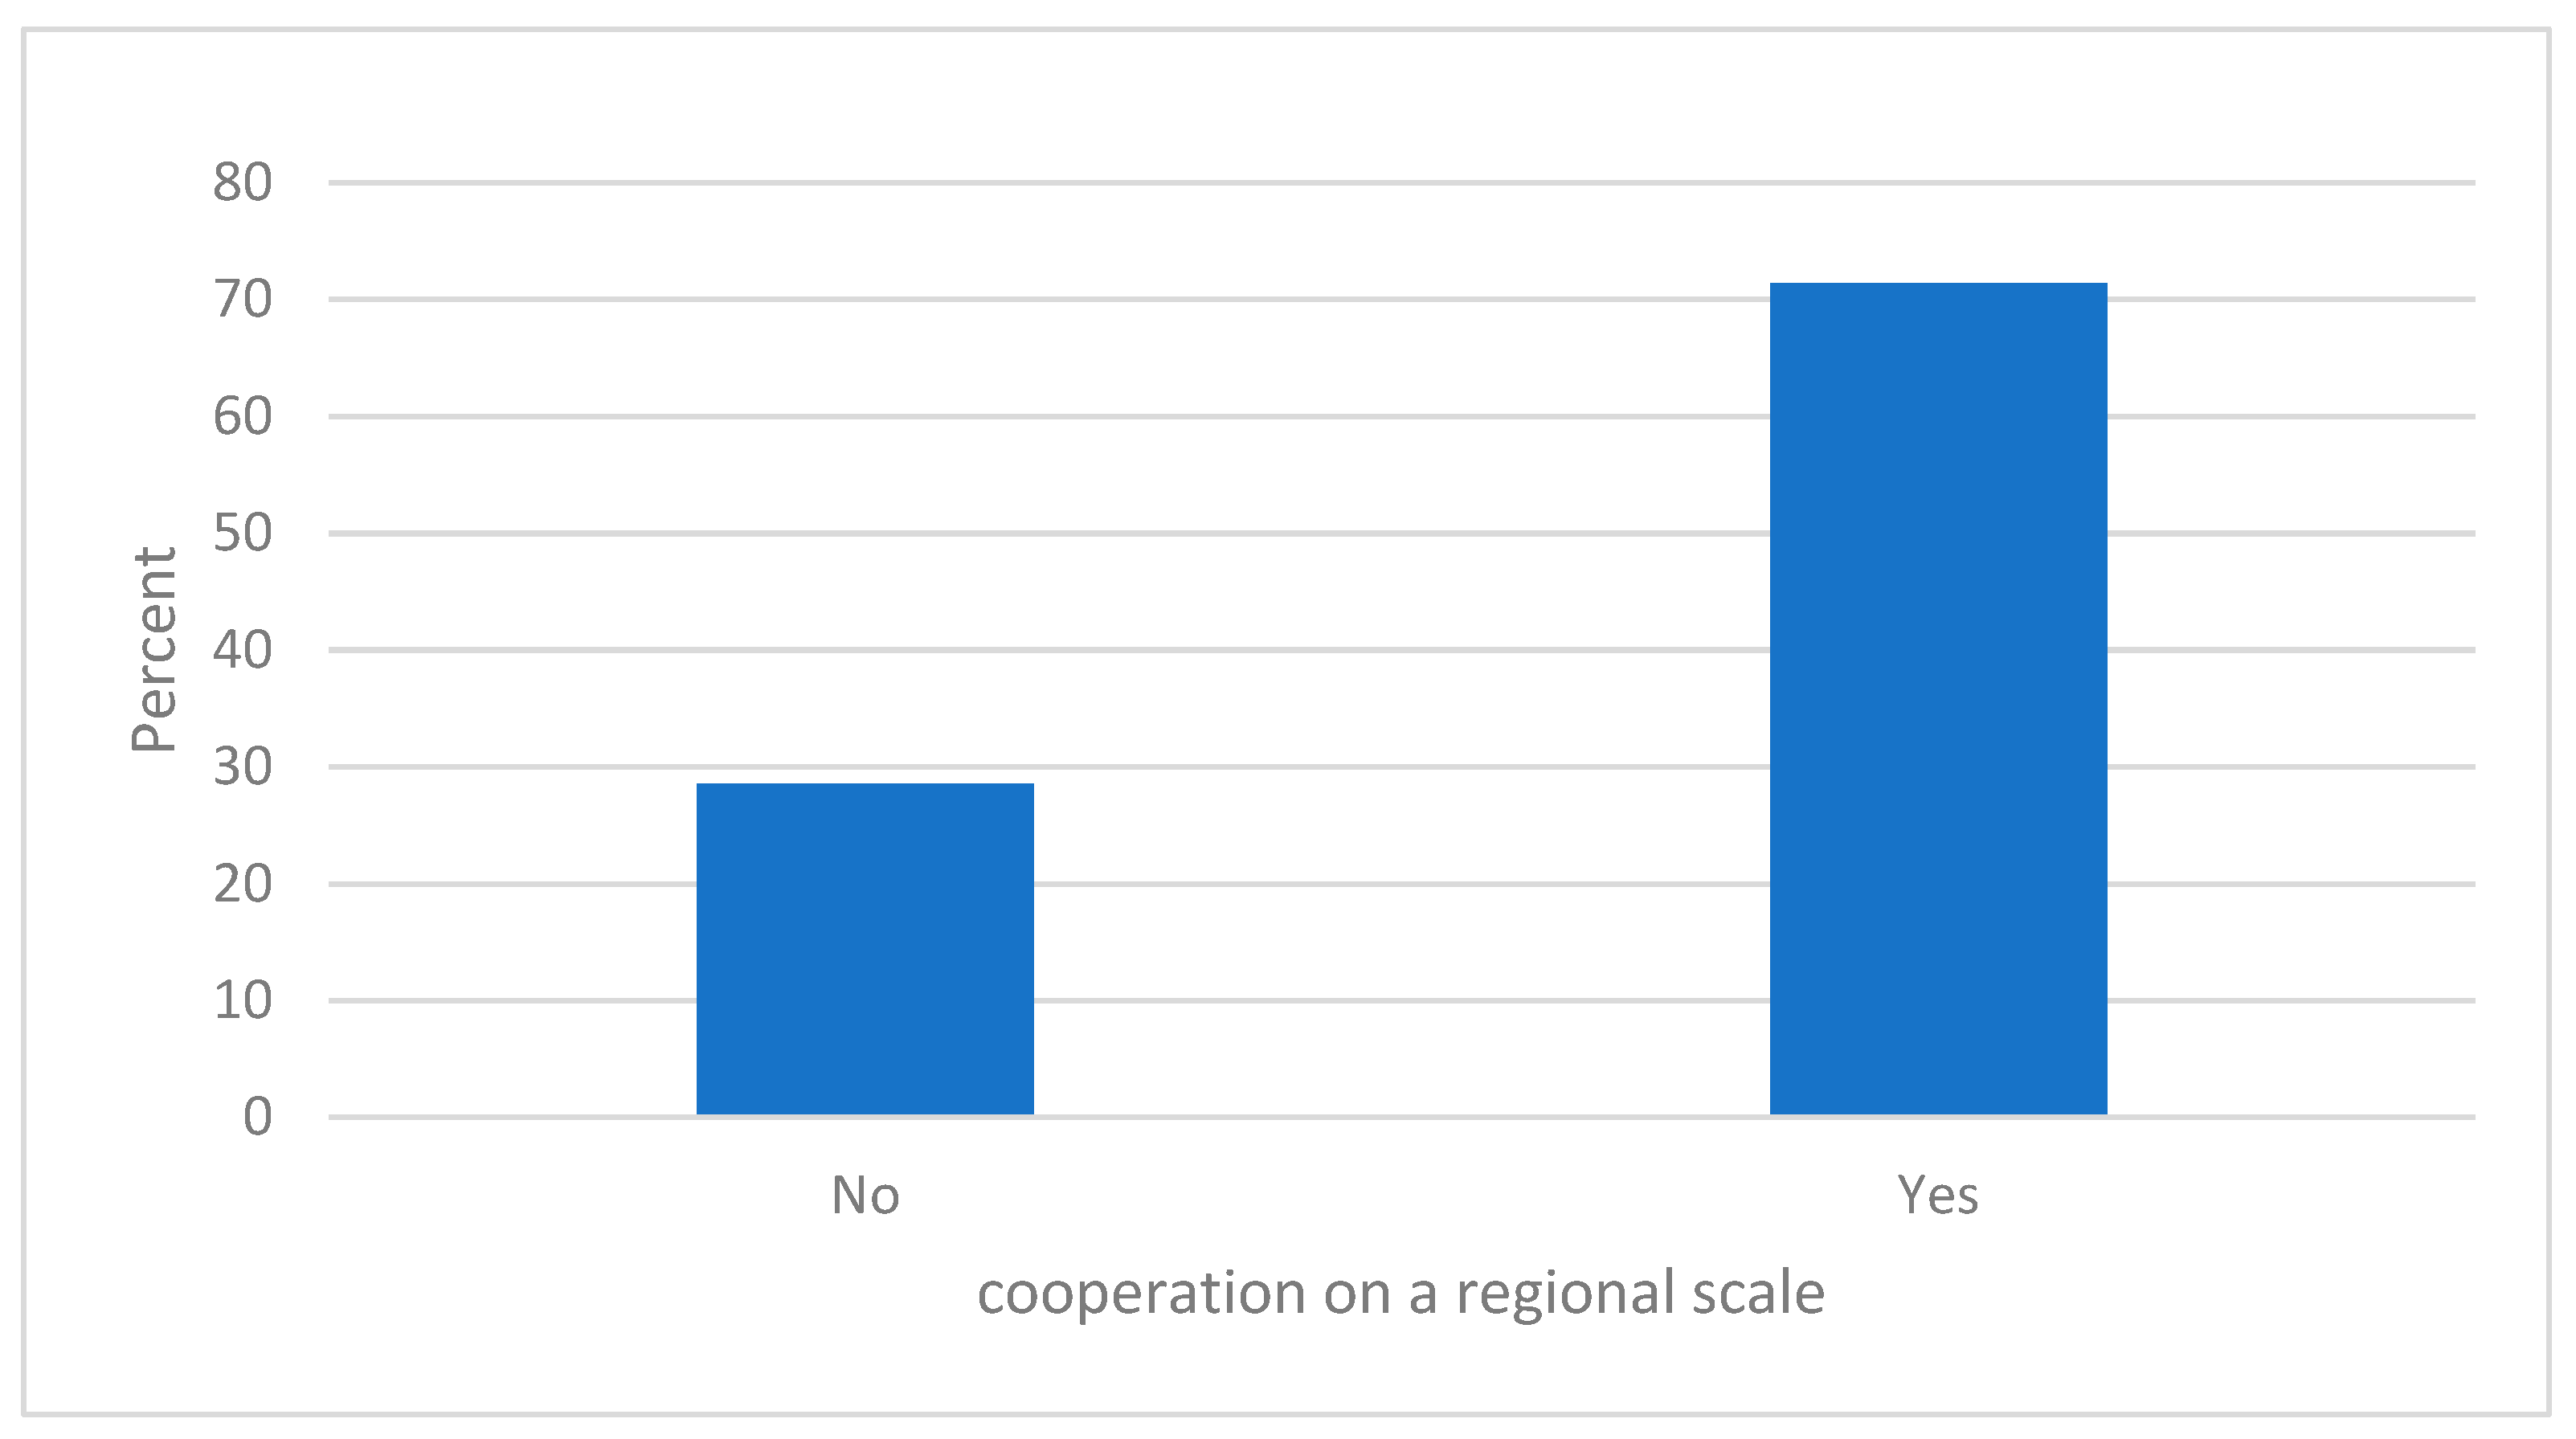
Only two variables have been investigated directly among those who declared themselves to use EO satellite data and services already (N = 14). As shows in
Figure 11, inter-organizational cooperation at the regional scale—such as collaboration with other cities, provinces or regional agencies—has been reported by 71% (N = 10) of the respondents, while 29% (N = 4) indicated they are not engaged in this kind of cooperation.
Also, respondents were asked to express their agreement with the following sentence: “Access to EU funds has been key to start EO data adoption”. A mean value of 3.36 (S.D.: 1.33) suggests a high value of EU funding as an opportunity to support the adoption of EO satellite data.
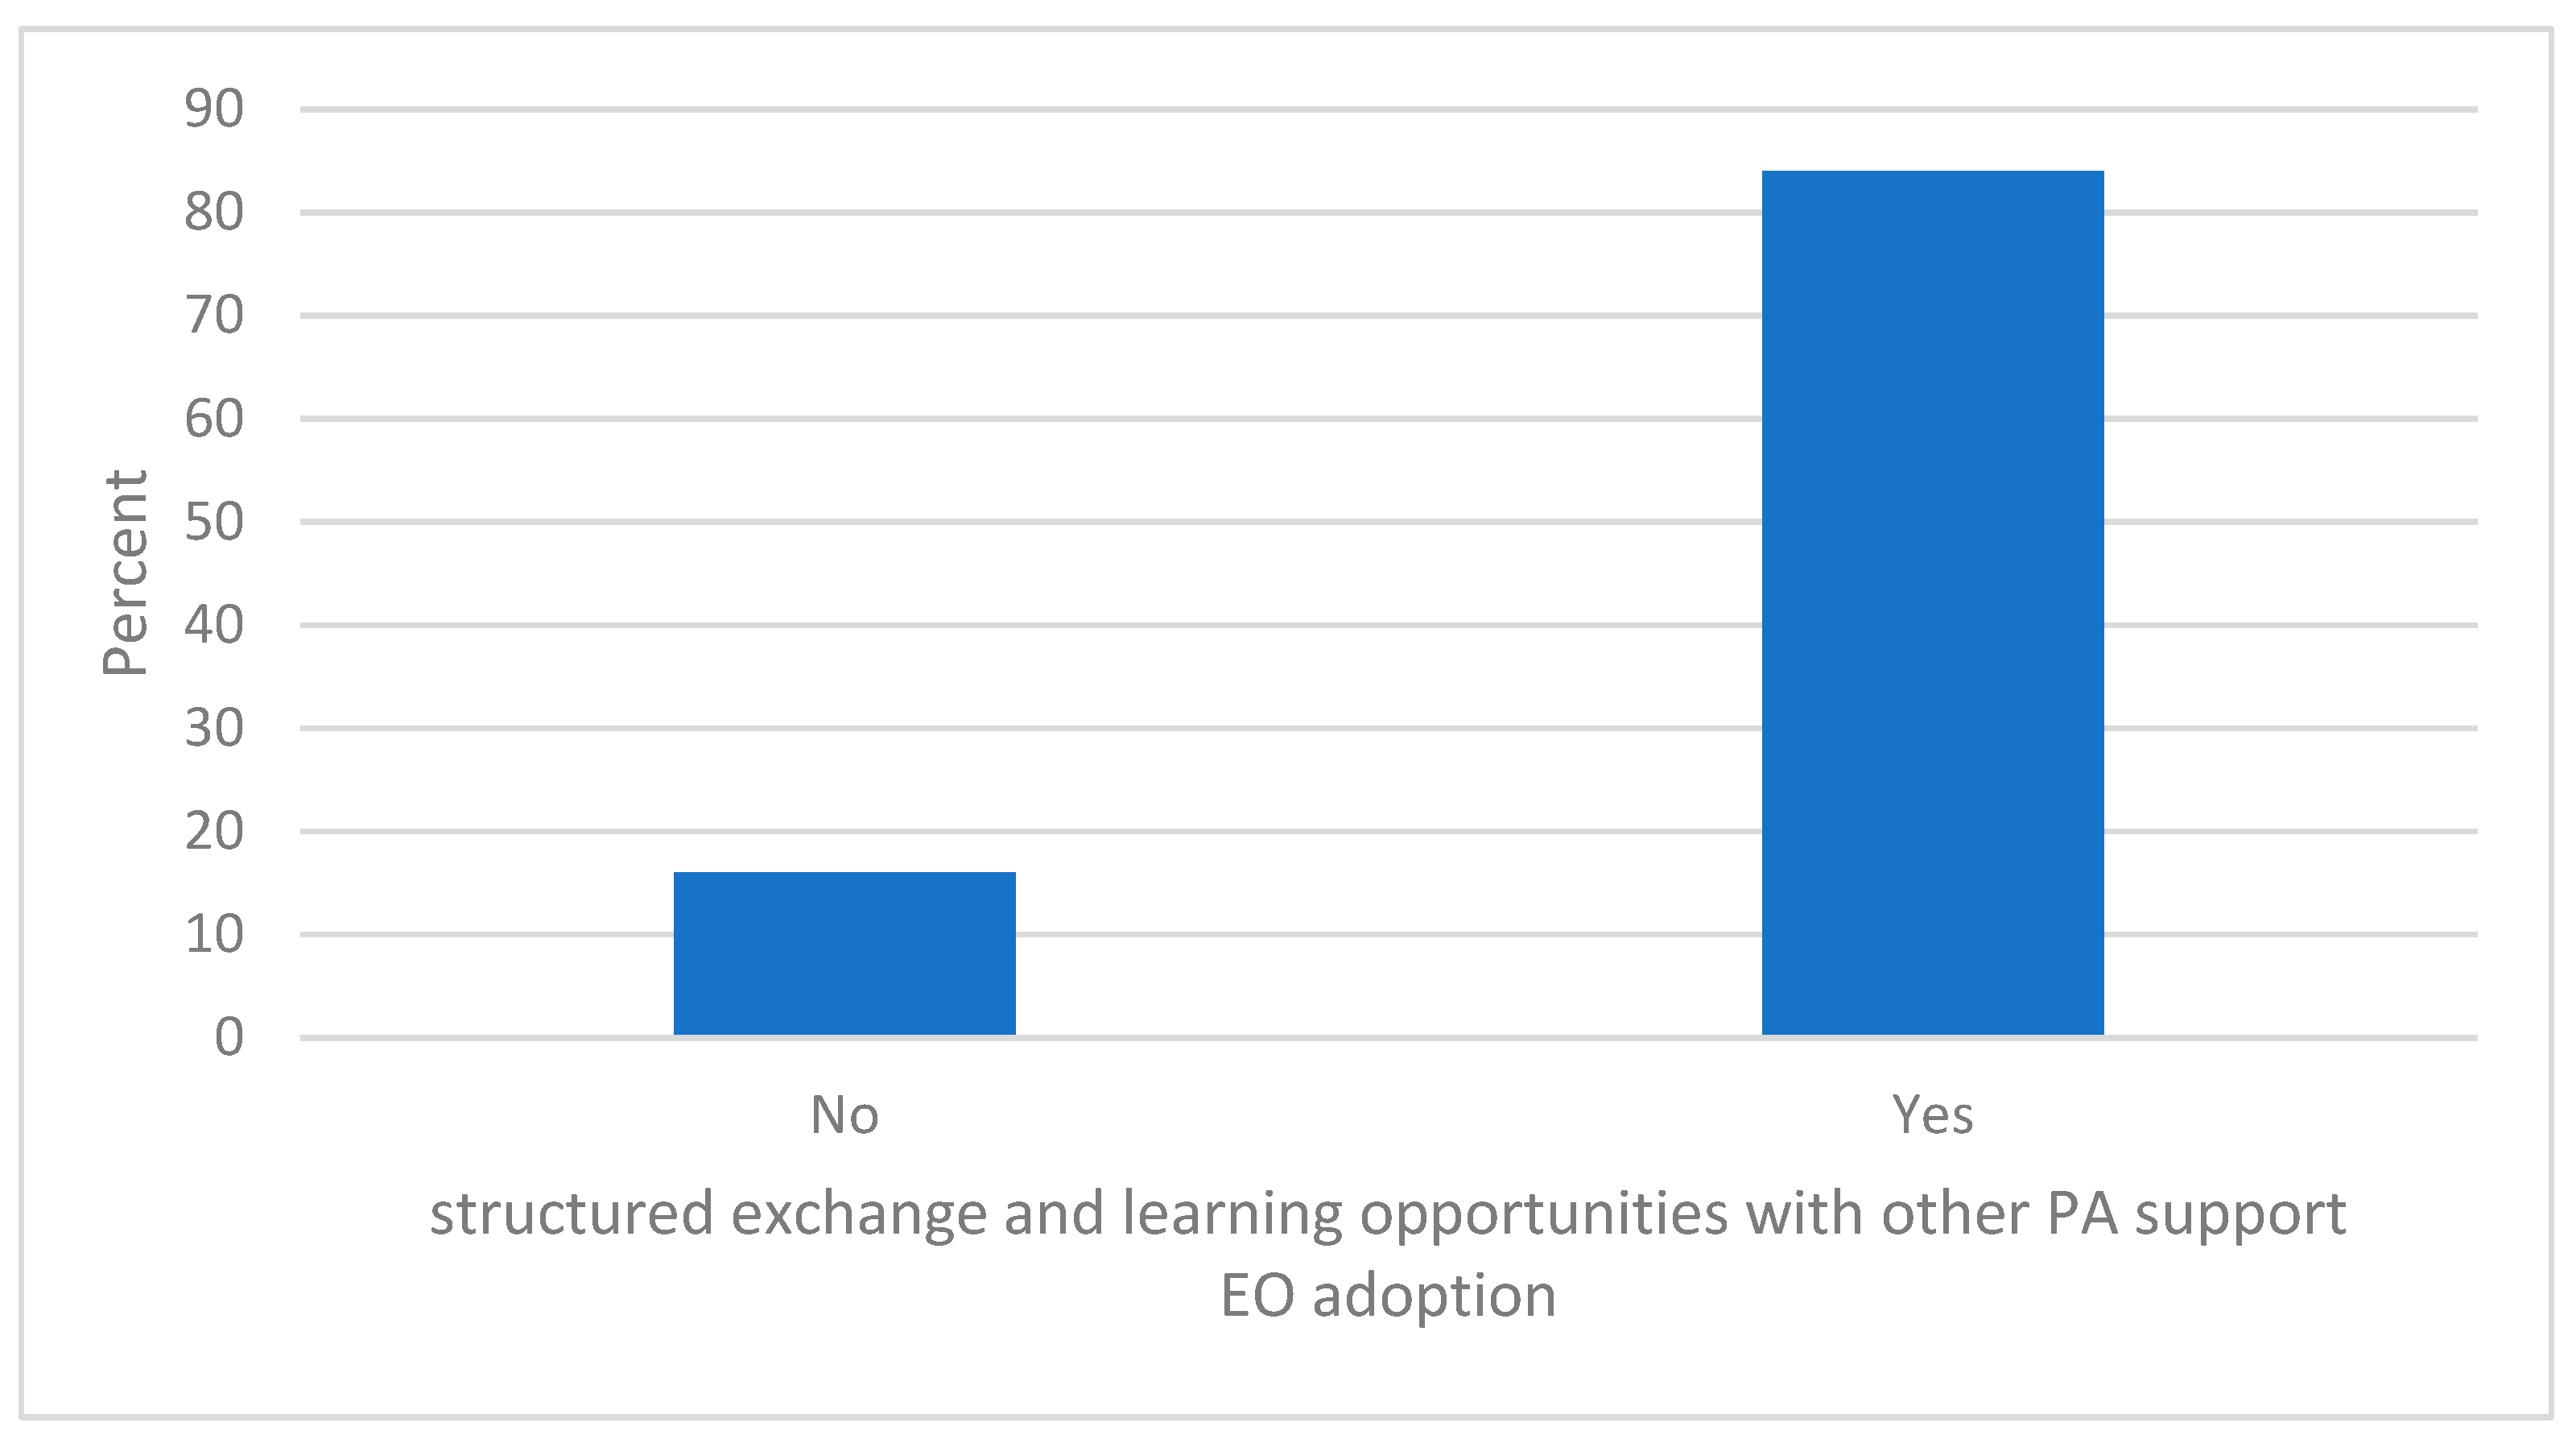
As shown in
Figure 12, a particularly strong consensus emerged on the value of structured exchange and learning opportunities among public authorities. This question has been posed to the whole sample, including those not using EO so far (N = 25). The majority of the respondents, 84% (N = 21), agreed that opportunities for exchange and capacity-building with other PAs would support EO adoption in their organization, with only 16% (N = 4) expressing disagreement. This result underscores the importance of peer-to-peer learning, knowledge transfer and capacity-building networks as potential enabling conditions for wider and more effective EO integration in the public sector context.
3.5. Perceived Barriers, Drivers Perceived, Peer-to-Peer Advice
All the survey respondents, including those not using EO satellite data (N = 25), were asked to identify the main barriers to adopting and using EO data in their organization. They were invited to choose the three most relevant barriers from six different options.
As shown in
Table 4, the most common perceived barrier is the “lack of skilled staff and training” (N = 17), followed by “limited budget” (N = 12) and “EO satellite data do not fully meet our operational and knowledge needs” (N = 11). Complexity of the procurement (N = 6) and of the technology (N = 5) are also considerable, as well as the lack of top-management and law inputs (N = 5 respondents each). N = 4 respondents also chose “others”.
The distribution of perceived barriers was relatively consistent across organizational types (cities, metropolitan cities, regional/municipal agencies, others), suggesting that these issues are not limited to one level of government or administrative model.
Interestingly, the two respondents who reported no EO data usage both identified the mismatch with operational needs as their sole barrier. Both also reported high levels of autonomy in their roles (Likert 4), indicating that lack of mandate was not the constraining factor.
3.6. Key Drivers Perceived
To better understand what enables EO satellite data adoption at the local and regional levels, respondents who reported direct use of EO satellite data (N = 14) were asked to identify the key enabling factors that supported its adoption within their organization. Each respondent could select up to three drivers from a predefined list of nine options.
In your experience, which of the following factors played a decisive role in fostering the adoption of EO data?
As shown in
Table 5, the most frequent factor recognized as a driver (N = 10) was the participation in a specific project or initiative, followed by the organization’s need for the improvement of monitoring and planning (N = 9).
These results highlight the importance of both external enablers and endogenous needs in driving EO uptake. Among secondary factors, collaboration with universities or research centres was the most significant (N = 6), closely followed by industrial partnerships (N = 5) and individual motivation (N = 5). EU programme funding (N = 4) has also been identified, and engagement with ESA/Copernicus forums (N = 1) was reported as an enabling condition. Legal inputs and leadership commitment appear absent.
These insights reveal a hybrid model of EO adoption at the intersection between internal needs and external opportunities. Indeed, the existence of a recognized bottom-up organizational need appears to be important to trigger interest in EO technologies. However, for this need to be effectively addressed by EO technologies, an external opportunity such as participation in a pilot project appears crucial. In particular, these initiatives overcome the lack of internal skills or trained staff issues by providing proper expertise. Prominent research institutes and industrial service providers can play a critical role in facilitating this adoption. While individual motivation and awareness are recognized as relevant triggers, the role of leadership or top-down incentives does not appear to have played a significant role in this adoption process.
3.7. Peer-to-Peer Advice
Respondents who reported direct use of EO satellite data (N = 14) were asked to indicate what advice they would give to a public authority planning to initiate the use of EO data and services. They were invited to select the three most relevant recommendations from a predefined list. The frequency of each suggested recommendation is presented in
Table 6.
As presented in
Table 6, the most frequently recommended action was “Establish partnerships with research centres or universities” (N = 10), closely followed by “Invest in internal training for staff” (N = 7). These recommendations directly address the primary barrier identified by respondents, namely, the lack of proper skills and training. They emphasize the need both to build internal capacity and to leverage external expertise. Nearly half of the respondents (N = 6) also indicated “Collaborating with an industrial service provider” and “Raising awareness and commitment from leadership” (N = 5). “Building a direct cooperation with ESA and/or the National Copernicus User Forum” has been indicated by fewer respondents, as well as “Allocate appropriate funding within the ordinary budget” (N = 4 respondents). These align with factors previously identified as barriers (especially the lack of properly trained staff), combined with moderately influential drivers (such as collaboration with external organizations).
3.8. Profiles and Clustering
As detailed in the Methodology section, the typologies were constructed using a two-step qualitative clustering approach. This method integrated respondents’ self-reported levels of EO satellite data adoption (first step) with their perceived value of EO technologies (second step) and was further enriched by identifying recurring patterns of barriers and drivers perceived.
The Weberian ideal types [
31] offer an interpretative lens through which to understand recurring patterns and divergent trajectories among local and regional authorities (LRAs).
The leadership awareness variable—“The top-level management is not fully aware of the potential of EO satellite data”—was reverse-scored to ensure that higher values reflect greater awareness. The transformation was calculated as (6—original score).
Ideal-types are identified as below.
Non-Users. This group includes public agencies based in Denmark and Portugal (N = 2). Both report no current use of EO satellite data. The main barrier mentioned is “EO data do not fully meet our operational needs”. It should be noted that both organizations report a high degree of autonomy (4 on a 1–5 Likert scale, where 1 = strongly disagree, 5 = strongly agree), ruling out organizational rigidity or dependency as potential constraints.
“Indirect Users Only”. This profile comprises seven LRAs (N = 7) that benefit from EO data only indirectly, typically via platforms like Google Earth. Values are represented in the
Table 7.
These LRAs possess a relatively strong data culture and some technical readiness but lack internal leadership awareness and an institutional mandate to pursue direct EO integration. The absence of accessible EU funding or strong leadership support further limits their progress. These authorities appear well positioned in principle but lack institutional and financial leverage.
- 3.
Proven Users. This group represents established adopters (adoption level 3–4), including two LRAs (N = 2) with high levels of EO use. Interestingly, neither uses Copernicus data, relying instead on commercial or national sources. Values are represented in
Table 8.
Both organizations report a high level of autonomy (a score of 4). Despite high perceived benefits, they show only moderate internal capacity (skills and data culture: 2.5). The Dutch agency, driven by internal demand, opted for commercial EO services and recommended industrial/research collaboration. In contrast, the Spanish agency, triggered by participation in an EU project, focused its recommendations on staff training and ESA cooperation. This contrast illustrates two distinct adoption pathways: one internal and potentially leadership-driven, and the other project-triggered and externally supported. Notably, neither perceived technology complexity nor budget availability as a significant barrier.
- 4.
Experimental or Partial Users (adoption level 1–2). This diverse group was subdivided into three distinct subtypes based on their perceived EO value.
- 4.1.
Sceptics. This group includes two organizations (N = 2): a Swedish regional agency and a Czech metropolitan city. Values are represented in
Table 9.
To better explain the barriers to EO adoption, the Swedish agency stated, “We do not have strong use cases that require satellite data as we mainly rely on air-photo data.”
This profile reflects low benefit realization, insufficient internal skills and limited leadership engagement. Both organizations were introduced to EO through external projects but remain unconvinced about its long-term value.
- 4.2.
Enthusiasts. This subgroup includes three LRAs (N = 3) characterized by high perceived EO value despite limited internal capacity. Values are represented in
Table 10.
Table 10.
Summary of key indicators. Enthusiasts.
Table 10.
Summary of key indicators. Enthusiasts.
| Construct | Indicators (Mean) | Level (Mean) |
|---|
| Perceived EO value | decision-making improvement 5, adequacy 4.6,
cost-effectiveness 4.3 | 4.6 |
| Organizational readiness and trust | data culture 1.6, lower internal expertise 2.6 | 2.1 |
| Leadership awareness and support | low regular training 1.3, awareness of EO potential 3 (after reverse calculation) | 2.3 |
| Main drivers | Access to EU funds, special project participation, collaboration with research institutes, and individual motivation | |
| Main barriers | Limited budget, lack of trained staff, and technology complexity | |
A Greek regional agency in this group noted, “Geospatial mapping helped us identify the urban heat island effect…but without EU project support, we could not sustain this work.” This group demonstrates very high perceived benefits, even though leadership awareness is only moderate and internal skills are low despite an average data culture. In all cases within this group, exchange between public administrations is recognized as important in supporting EO adoption, as is access to European funds. These LRAs are essentially optimistic about EO’s potential and recognize the enabling role of external support.
- 4.3.
Cautious Users. This is the largest subgroup, comprising seven LRAs (N = 7) with moderate adoption and satisfaction levels. The values are represented in
Table 11.
Table 11.
Summary of key indicators. Cautious users.
Table 11.
Summary of key indicators. Cautious users.
| Construct | Indicators (Mean) | Level (Mean) |
|---|
| Perceived EO value | decision-making improvement 3.7, adequacy 3
cost-effectiveness 3.1 | 3.2 |
| Organizational readiness and trust | data culture 3.2, lower internal expertise 2 | 2.6 |
| Leadership awareness and support | low regular training 2.1, awareness of EO potential 1.8 (after reverse calculation) | 1.9 |
| Main drivers | EU funds, project participation, ESA cooperation, research partnerships, and internal organizational needs | |
| Main barriers | EO data inadequacy, lack of trained staff, and technology complexity | |
These LRAs are situated in the middle of the adoption spectrum. They recognize EO’s potential, but adoption is hindered by moderate technical readiness, low leadership awareness and skills shortages. While perceived availability of adequately qualified personnel is low (2.0), organizational readiness is moderate (3.2). Almost all recognize that exchange between public administrations is a potentially important factor in supporting EO adoption, and access to European funds is generally considered a possible driver (3.4). For three out of seven cases, the main barrier to EO adoption is indicated as the inadequacy of EO data, together with a lack of adequately trained staff and the complexity of the technology. The main drivers include an internal organizational need for EO, participation in a special project/initiative and cooperation with a research centre; cooperation with ESA is also mentioned in one case.
The following two tables provide a synthetic overview of the typologies.
Table 12 summarizes the adoption levels and organizational characteristics for each group, while
Table 13 highlights the most cited barriers and drivers across profiles.
Table 13 shows overarching patterns in barriers identified across the different LRA groups. Overall, barriers across the different groups converge around two main issues: internal skills shortages and low leadership awareness. However, while “Sceptics”, “Cautious” and Non-users doubt EO’s relevance, “Enthusiasts” and “indirect users” believe in its value but face technical limitations.
4. Discussion
4.1. EO Adoption and Usage Patterns
The findings confirm a fragmented and context-dependent adoption of EO satellite data within a selected sample of European LRAs. Given the article’s exploratory design and the purposive nature of the sample, the findings presented below are not to be interpreted as a statistical generalization, but rather as an analytical generalization of specific, consistent patterns within the sample.
The analysis reveals that 56% of respondents reported direct adoption of EO satellite data. In comparison, 28% indicated only indirect use (for instance, through a platform such as Google Earth), and the remaining 16% either did not use EO data or were unaware of its use within their organization. Interestingly, this distribution closely mirrors the findings of the authors’ previous study on the Italian sample (Filippi, 2025) [
20], which reported a direct adoption rate of 58%. This similarity is particularly striking given that the EU sample was purposively drawn from LRAs already engaged in policy domains likely to benefit from EO satellite data, such as climate adaptation and mitigation, urban resilience and smart city initiatives. Unlike the Italian sample, however, the present survey did not reveal significant variation in adoption rates based on organizational type. However, this should be interpreted as a preliminary observation rather than a generalizable result, given the underrepresentation of regional authorities in the sample.
Moreover, even among the direct users of EO satellite data, the degree of adoption remains generally weak. Most respondents described their use as experimental or project-based, while institutionalized, routine integration into operational processes remains rare. Aligned with previous studies conducted at EU levels (JRC 2025 [
4], OECD 2023 [
13]), this finding confirms how EO data use within local and regional authorities across Europe continues to be largely non-systematic and context-specific.
In terms of thematic domains, EO satellite data appear to be used primarily for monitoring urban heat islands, followed by applications in urban planning, urban greening and land use and land cover analysis. This thematic focus reflects a clear urban-centric orientation, likely influenced by the nature of the respondent organizations, many of which operate at the city or metropolitan level, and the specific projects in which they are involved.
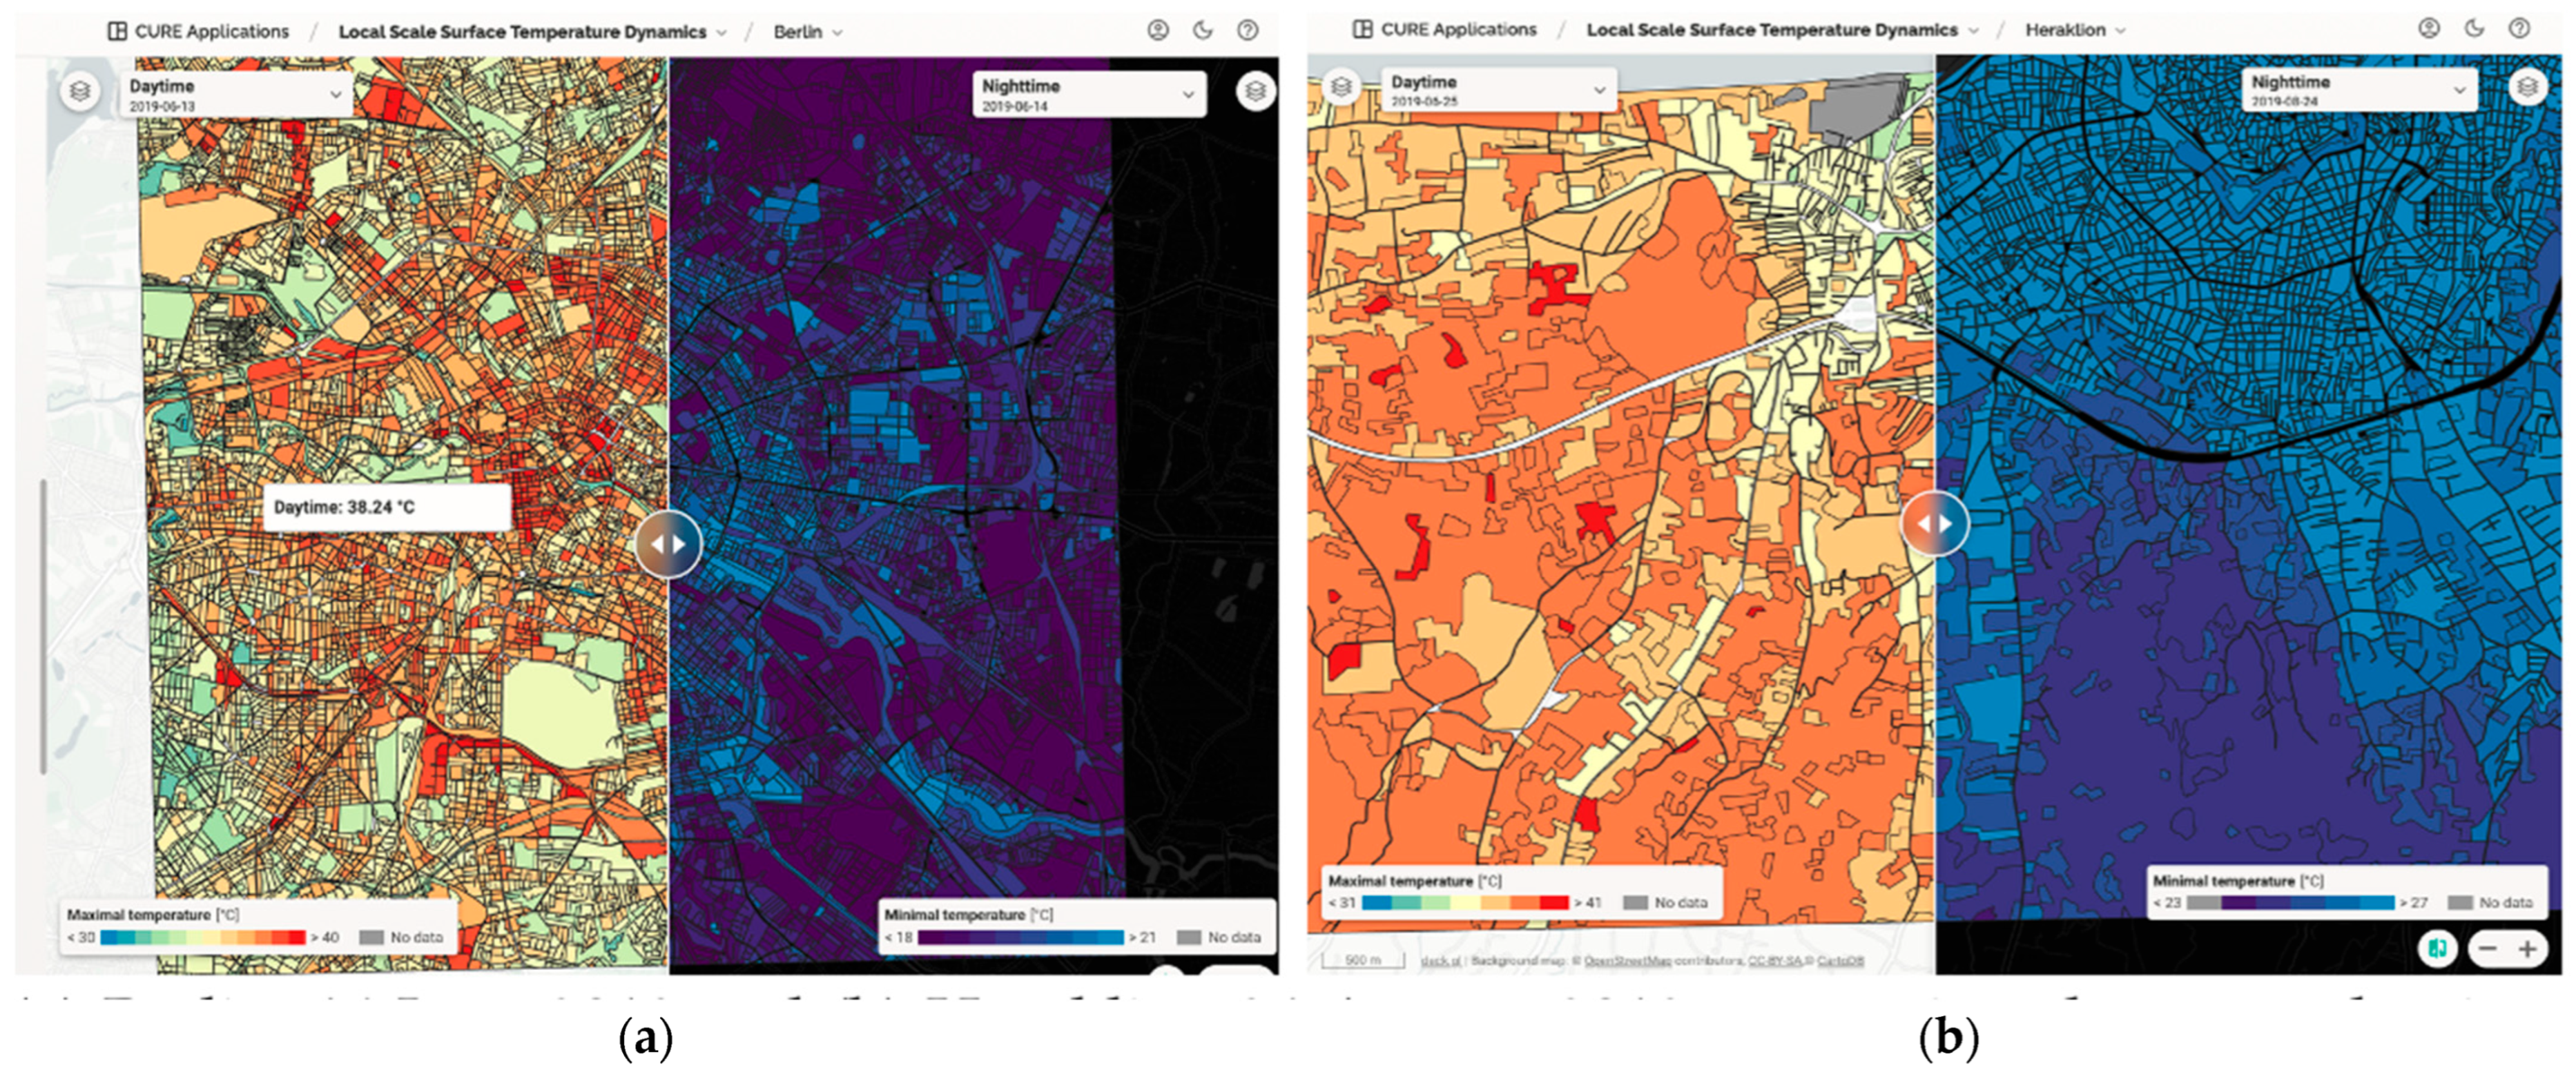
To illustrate how satellite-derived information can support local policy needs, examples can be found in the Copernicus Urban Resilience Explorer (CURE) portal [
40].
Figure 13 shows Sentinel-3 land surface temperature (LST) products for European cities, visualizing the spatial distribution of daytime and nighttime heat intensity. Such data enable municipalities to identify urban heat island hotspots, supporting them in prioritizing green infrastructure investments and evaluating the effectiveness of adaptation measures. The comparison between daytime and nighttime temperatures highlights the intra-urban variability of heat exposure, a key factor for evidence-based climate adaptation planning at the local scale.
The European programme “Copernicus” clearly emerges as the primary source of EO satellite data for the majority of respondent organizations. The main activities for which this data is employed are monitoring and planning. Notably, no respondents reported using EO data for law-making or forecasting purposes. This absence reveals a potential implementation gap. It marks a minor but clear difference from the Italian study (Filippi, 2025), in which forecasting, although still limited, was occasionally mentioned, particularly by cities experimenting with advanced applications such as digital twin projects. Given the growing recognition of predictive analytics based on EO satellite data, artificial intelligence (AI) and machine learning as critical tools to enhance urban planning and climate resilience (Cong et al., 2024 [
41]; Pasupuleti, 2024 [
42]), these data highlight a missed opportunity and suggests an untapped potential. The absence of forecasting applications points to a strategic gap, which may require targeted policy interventions, capacity-building and cross-sectoral collaborations to unlock.
RQ1: Among LRAs in the sample, already involved in EO, urban innovation, or climate-related EU-funded projects, what are the main organizational, and environmental factors influencing the adoption and use of EO satellite data?
4.2. Influential Factors
4.2.1. Organizational Factors
Leadership. The analysis of the organizational factors highlights a diffuse perception of leadership (including high-level management and political representatives) as not being fully aware of the potential of EO satellite data. This finding is particularly concerning in light of a well-established body of literature that identifies leadership as a critical driver of digital transformation in the public sector (among others,
Mergel 2019 [
43],
Rekunenko et al. 2025 [
44],
OECD 2021 [
45],
Adade, de Vries 2025 [
46]). This is one of the critical factors triggering the loop of underinvestment described below.
Training. Low awareness at the executive level appears to be closely linked to two additional deficits: a lack of tailored training opportunities in EO satellite data and remote sensing and a shortage of adequately skilled personnel. These findings are consistent with the author’s previous research on the Italian context (Filippi, 2025) [
20] and they are reinforced by broader industry-wide evidence. For instance, the EARSC Industry Survey 2024 [
11] reveals the existence of barriers to filling open positions by companies due to a lack of skills in new tech and transversal skills. This also aligns with the need for future-proof digital public administration identified by EC in the Compact 2023 [
47] and aligns with the broader literature on geospatial technology at the local level (Adade, de Vries 2025 [
46]).
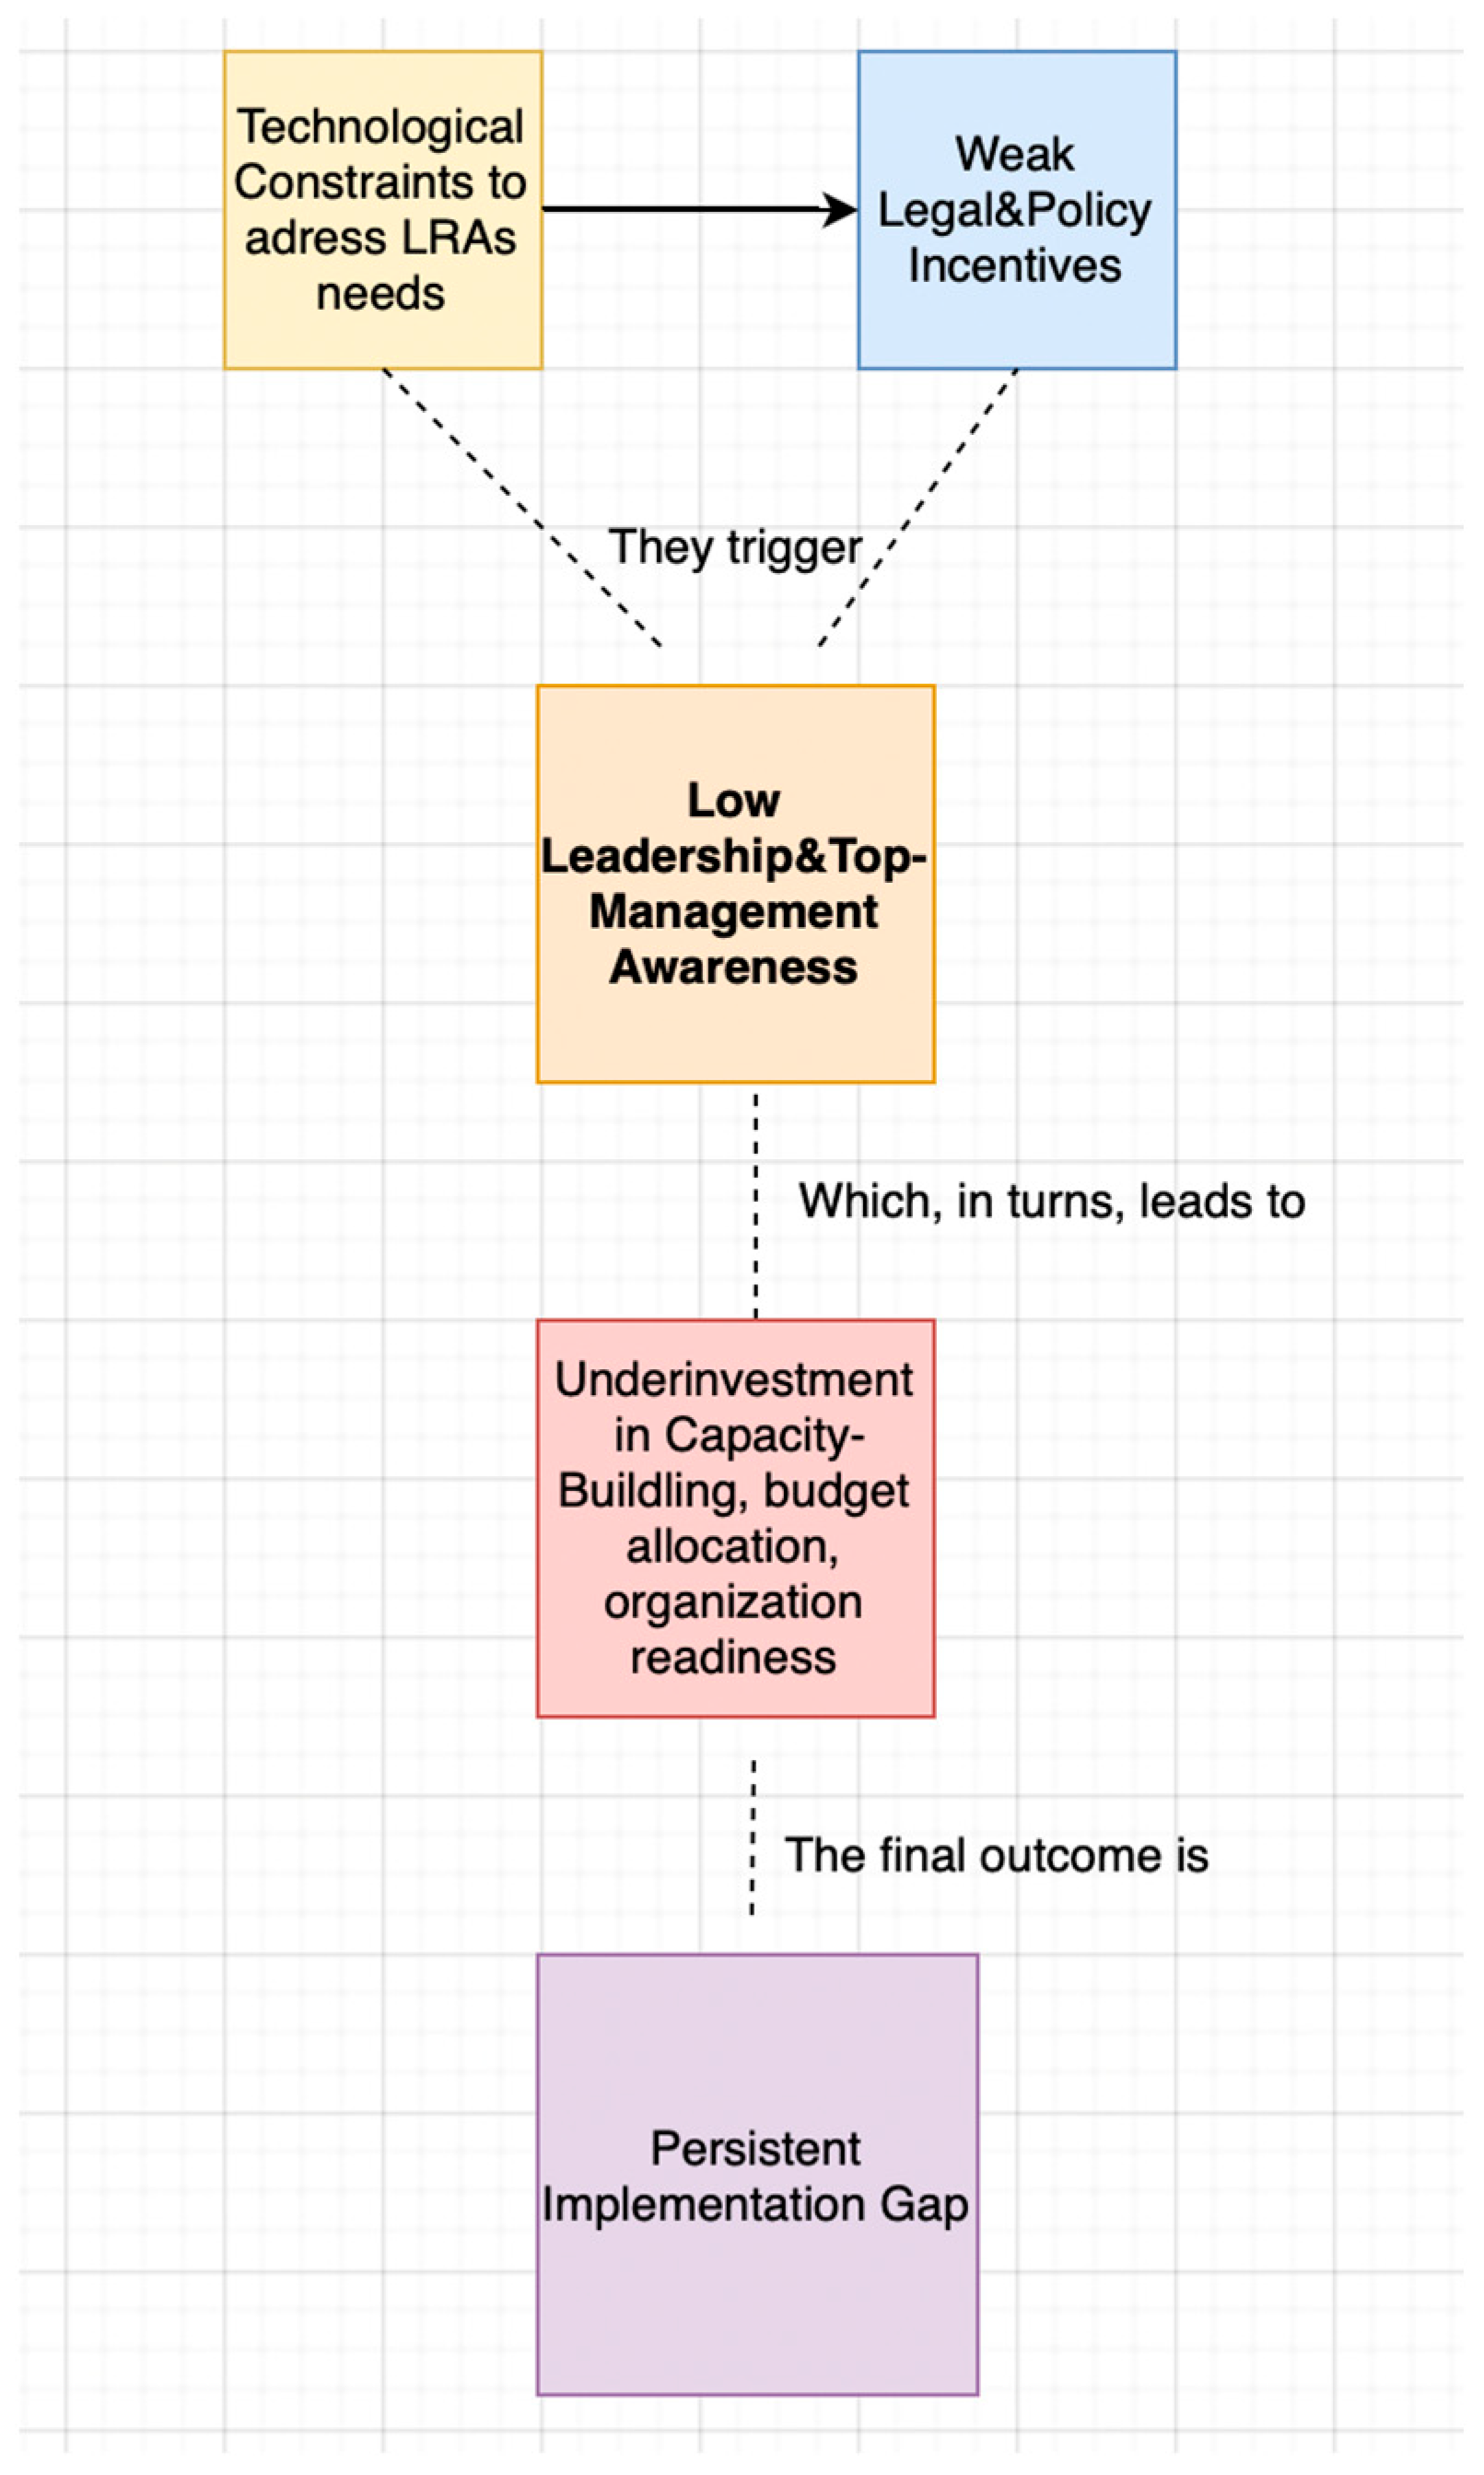
The feedback loop of underinvestment. A cause–effect relationship can be identified in this cluster of organizational shortcomings: when top-level managers are unaware of EO’s potential (weak leadership), they are less likely to allocate the necessary resources to support training and invest in EO-based projects. This creates a feedback loop of underinvestment, manifesting as limited training provision, insufficient technical staffing and constrained budgets, which impedes the development of EO readiness at the operational level.
4.2.2. Environmental Factors
External institutional pressures appear weak.
Legal incentives. The majority of LRAs in the sample face no formal legal requirement to use EO data; around a third perceive only indirect encouragement, and only one respondent mentioned a binding regulation. This matches with earlier observations in the Italian context. Nevertheless, EO is referenced increasingly—though not in a mandatory way—in EU legislation, particularly within climate and resilience frameworks, for example, the “EU Climate Law” [
48], which recognized the role of Copernicus data in assessing the EU’s path to climate neutrality and progress on adaptation, and the EU Deforestation Regulation [
49], as mentioned in the EU Space programme mid-term evaluation 2021 [
50]. Together with the perception of only indirect legal encouragement among a significant proportion of respondents, this emerging legislative landscape suggests the presence of latent regulatory potential that could be further enhanced through clearer mandates or policy alignment.
This weak regulatory environment can be identified as one of the main factors contributing to the low awareness of local leadership about EO satellite data potential. The absence of mandatory inputs fails to trigger the attention necessary for budget and resource allocation. This process is well represented in
Figure 14.
This “casual chain of constraints” mirrors cross-study evidence that weak top management support and skills, triggered by non-binding policy and regulations environments, negatively affect local government digital technology uptake (Faizura, 2018) [
51].
Furthermore, the data underscore the enabling role of EU programmes and initiatives. Respondents moderately agreed that access to EU funds was key to initiating EO adoption, and a large majority (84%) expressed strong consensus on the fact that structured knowledge exchange opportunities among public authorities would support EO adoption. Together, these findings highlight the importance of soft incentives, such as EU funding and inter-institutional learning, and the potential for stronger regulatory drivers to accelerate the integration of EO in the public sector. This finding is powerfully illustrated by the Greek regional agency (an “Enthusiast” profile), which noted: “Geospatial mapping helped us identify the urban heat island effect...but without EU project support, we could not sustain this work.” This demonstrates that EU funding acts as a direct compensatory mechanism for internal resource deficits, transforming potential affordances into actionable services.
Inter-organizational cooperation. Inter-organizational collaboration already seems to play a central role, with 70% of respondents stating that they cooperate with other organizations at the regional scale (within national boundaries). This trend can perhaps be explained by the fact that EO products often span-jurisdictional boundaries (e.g., land-cover mapping and ground-motion monitoring) and require multi-stakeholder data. However, the results also underscore the need for what Janssen & Singh (2022) [
52] define as “data intermediaries”, understood as organizations that mediate between data providers and users, offering confidence and context-specific datasets tailored to local operational needs. In this light, the concept of “regional EO data intermediaries”—whether public or hybrid in nature—may help address some of the constraints repeatedly identified in the article, such as the lack of internal expertise or technical capacity in LRAs.
RQ2: What are the key affordances and constraints perceived in the use of EO satellite data and services?
4.3. Technology Affordances and Constraints
To explore the perceived technological affordances and constraints of EO satellite data, respondents were asked to rate their agreement with five statements developed in a previous Italian qualitative national study by the author (not yet published, PhD Thesis). Overall, the responses reflect a cautiously positive view of EO technology, with a median agreement score of 4 for most items. Respondents generally moderately agree that EO satellite data contributes to improving decision-making, they are generally cost-effective compared to other sources of data and their integration into existing GIS platforms is generally manageable. Notably, this positive view on data integration contrasts with the Italian case, where many LRAs—especially those relying on outsourced services—mentioned the inability to specify technical requirements and integrate EO data as a recurring barrier. The more favourable perception in this EU sample may suggest either more advanced internal capabilities or closer partnerships with external providers.
However, there is a weakening consensus on whether EO data adequately meet operational and knowledge needs, with a median rating of 3. This ambivalence, acknowledging the potential of EO while questioning its suitability in specific contexts, emerges as one of the research’s most consistent findings. Similar scepticism was evident in Filippi 2025 [
20] and in M. Dowell et al. 2025 [
4], both of which identified a lack of alignment between EO service offerings and local-level informational needs as a systemic barrier. The industrial perspective also reinforces this finding: EARSC 2024 [
49] reported difficulties for companies in designing solutions addressed to local and regional needs.
The empirical results derived from the small pre-selected sample, together with the above-mentioned authors’ previous articles, suggest that the perceived misalignment between EO offerings and local-scale requirements is a systemic issue rather than a country-specific anomaly. Importantly, this perception does not appear to be significantly correlated with the type of organization.
From the perspective of Technology Affordances and Constraints Theory [
24], EO satellite data affords LRAs capabilities such as territorial monitoring, cost efficiency and data integration. However, these affordances only materialize when organizational conditions (e.g., skills, resources, governance) and enablers (e.g., leadership support, legal mandates) are in place to mitigate constraints mostly derived from technology adequacy and accessibility. The observed ambivalence reflects partial affordance activation: EO technology’s latent possibilities currently exceed the institutional capacity of most LRAs.
Globally, our findings echo Gerasopoulos et al.’s (2022) [
12] insights, particularly regarding operational barriers in local authorities—such as fragmented data systems and lack of stakeholder coordination—that can dampen the realization of EO’s potential in urban governance.
This perceived misalignment between EO satellite data products/services and local-scale needs is one of the most important factors behind the absence or weakness of law and policy incentives at the EU level. This technical misalignment may make it more difficult for policymakers to mandate the use of EO technology directly.
When combined with the constraints of weak regulatory incentives (the Environment dimension of TOE), weak leadership awareness and the feedback loop of underinvestment (the Organization dimension), it allows us to define what we call a “hierarchy of constraints” (see
Figure 15), where the Technological dimension and the Environmental/Organizational dimension affect wider EO adoption.
4.4. Barriers, Drivers and Peer-to-Peer Advice
4.4.1. Barriers
Among the three most frequently reported barriers to the adoption of Earth Observation (EO) satellite data, two key endogenous factors emerge, alongside one notable technological constraint, namely, lack of trained staff and limited budget, associated with the not fully satisfactory adequacy of EO satellite data in addressing the organization’s needs. An empirical observation allows us to analyze the key constraint of EO data not fully meeting operational and knowledge needs (44%), compared to specific alternatives. For example, the Swedish regional agency (with a “Sceptical” profile) explained, “we do not have strong use cases that require satellite data, as we mainly rely on air photo data.”
These findings align closely with previous analyses, confirming the complex and multi-dimensional nature of EO data adoption. It requires organizational readiness, leadership’s involvement (to allocate proper budget) and the need for an enhanced alignment between EO satellite data services providers, academia and PA at the local level.
4.4.2. Adoption Drivers
The adoption process of EO satellite data has been driven by different variables, leading to both endogenous and exogenous factors. The participation in a specific project or initiative has been identified as the most relevant driver (mentioned by 71% of respondents). It has often been accompanied by more endogenous factors such as the existence of an organization’s internal knowledge of who requires or benefits from EO satellite data technologies (mentioned by 64% of respondents). In most cases, the cooperation with a university or research institution, listed as the third most mentioned driver (mentioned by 42%), or by an industrial service provider (mentioned by 35%), has enabled this process. Notably, the strong commitment from leadership or legal/regulatory requirements was never mentioned. The absence of strong leadership engagement or top-down incentives underscores a recurring theme: EO data adoption lacks high-level institutional prioritization.
This framework points to a bottom-up and project-based model of EO adoption, in which staff, possibly mid-level, initiate use through funded experimentation or collaboration, often in the absence of clear strategic direction or legal compulsory mandate. The lack of leadership engagement is particularly striking and aligns with earlier findings on barriers, where top-down support was often missing or perceived as weak. Environmental factors such as regulation or institutional leadership remain underdeveloped or untapped.
When aggregating the five most frequently mentioned drivers, there is a notable overlap with findings from the Italian comparative study (Filippi, 2025) [
20], albeit with some variations in ranking. While both studies underscore the role of project-based involvement and internal knowledge needs, the Italian study emphasized a more pronounced bottom-up approach, where “Public administration knowledge needs” and “Individual awareness and motivation” emerged as the top two drivers, followed by participation in special initiatives and resource availability.
In comparison, the broader EU sample assigns greater weight to external cooperation as a catalyst. This is not fully surprising, as all participants were already involved in EU programmes, potentially skewing the importance of external funding in the adoption process.
4.4.3. Peer-to-Peer Recommendations
The pattern of peer-to-peer recommendations gathered from the EU sample largely mirrors the findings of the earlier Italian study (Filippi, 2025) [
20], though with a comparatively greater emphasis on external drivers.
As shown in
Table 14, the most frequently cited recommendation among EU local and regional authorities (LRAs) is to create formal partnerships with universities or research centres (71%). This reflects a strong recognition of the value of research-driven collaboration in building EO capacity. Ranking second is internal staff training, identified as essential by exactly 50% of EU respondents. While this figure denotes a high level of concern, it is substantially lower than in the Italian sample, where 84% of LRAs emphasized the need for investment in in-house capacity development. In line with a more project-oriented approach, EU respondents place greater priority on collaboration with industrial service providers (43%) than their Italian counterparts (27%). Awareness-raising among leadership is a prominent recommendation across both samples, albeit with slightly lower emphasis in the EU group (36%) compared to the Italian sample (53%). This reflects a shared understanding of the importance of high-level buy-in, even if its perceived priority varies. Interestingly, cooperation with the European Space Agency (ESA) or the Copernicus User Forum—while not identified as a major current driver—emerges as a desirable future step in both groups, with nearly identical mentions (28% EU; 27% Italy). This might suggest the existence of a critical gap between the perceived value of EO partnerships and their institutional uptake. While local actors see value in ESA or Copernicus cooperation, many may lack the mechanisms, clarity or entry points to initiate it.
Taken together, the recommendations framework corroborates the barrier-and-driver analysis: both groups face skill shortages, but EU LRAs prioritize external collaboration over training, whereas Italian LRAs tend to invest more in internal training over external collaboration. Some of the divergence is due to differences in composition (the EU sample comprises project-active LRAs), while some may reflect administrative culture and procurement flexibility that make outsourcing easier in other EU Member States. However, despite the numerical differences, both groups agree on two key points: (1) leadership commitment is essential, and (2) the uptake of EO is a multi-dimensional process that hinges on targeted capacity-building, strategic partnerships and continuous alignment between technological solutions and policy needs.
RQ3: How do perceived technological affordances and constraints of EO satellite data vary across different levels of adoption among LRAs, and what factors condition this variation?
4.5. Profiles
The profile analysis reveals four co-existing adoption trajectories and different subgroups: non-use, indirect use, fully proven use and experimental use. The latter group is divided into three subgroups: Enthusiastic, Sceptical and Cautious. These different trajectories are shaped by a distinct blend of three main components: organizational readiness; leadership commitment; and the perceived value of EO technology. Rather than following a linear maturity ladder, the diffusion of EO technology in LRAs seems to be more path-dependent. Indeed, the profile analysis shows how perceptions of EO affordances vary not only with EO adoption level but also with leadership’s awareness. Viewed through the Technology Affordances and Constraints (TACT) lens, the data show that affordances become actionable only when leadership amplifies organizational capabilities or when it invests directly in their enhancement. For example, some LRAs among the “Indirect users” group exhibit medium organizational readiness—moderately skilled staff and a generally supportive data culture—yet remain stuck in the indirect group because top-level management neither allocates stable funding nor prioritizes EO. Budget limitations, as well as weak access to tailored training and a low propensity to join externally funded projects, further hinder progress. With all the caution required due to the very small sample, it is possible to argue that organizational readiness is necessary but not sufficient; it must be paired with strong top-management awareness and commitment to converting latent affordances into value-adding EO services embedded in the process.
4.6. EO as a Strategic Component of Digital Public Infrastructure for Urban Governance
The concept of space as a common good, as set out in the 1967 Outer Space Treaty, supports the idea that outer space and its infrastructure, including satellite systems and Earth Observation (EO) data, should serve the collective interests of humanity. Adopting OECD perspective (OECD 2024) [
50,
53], EO satellite data, when open and freely accessible via platforms like Copernicus, can be classified as digital public goods and a key component of digital public infrastructure (DPI). DPIs are secure and interoperable foundational digital systems that enable delivery of and access to public and private services, including data exchange, across society, particularly for urban governance (United Nations, 2023 [
51,
54]). This vision is consistent with our empirical findings. Insights from the technological affordances analysis highlight that, in an urban context, EO satellite data functions as a strategic knowledge layer, supporting many kinds of municipal functions, stemming from climate and environmental monitoring to disaster risk reduction. The local and regional authorities (LRAs) surveyed consistently recognized the potential of EO technologies to support urban innovation and resilience.
As demonstrated in this study, institutional barriers, from low leadership awareness to skill shortages and project-based strategies, prevent many LRAs from translating EO’s affordances into fully embedded practices. These gaps reflect a broader issue of “last-mile delivery”: while the data and platforms exist, the capacity to access, adapt and apply them effectively at the local level is often missing, especially in smaller or less digitally mature municipalities.
To bridge this gap, EO must be recognized as a digital public infrastructure’s component. Treating EO as part of digital public infrastructure justifies targeted public investment (training, shared services, regional intermediaries) and procurements that deliver routine, city-ready products. This implies the need for public targeted investment, capacity-building and alignment with local policy needs.
Just as water needs pipes to circulate and reach every household, satellite data needs public infrastructure to flow, effectively transforming global observation into local intelligence.
4.7. Policy Implication and Future Works
Looking at the broader policy context, the analysis provides several strategic insights:
Strategic investment concern. A significant percentage of LRAs reported accessing EO-derived services through non-European commercial platforms (e.g., Google Earth). While this is an exploratory finding, it raises significant policy concerns regarding the return on European investments in publicly funded programmes such as Copernicus. This dynamic suggests a potential flaw, or “policy bug,” in the EU’s industrial strategy regarding value capture and digital sovereignty, where public infrastructure feeds generate private, non-European platforms.
Comparison with Italian sample. A comparison with the Italian dataset [
20] revealed similar recommendations but different priorities: European LRAs involved in this research prioritize external collaboration and knowledge exchange, whereas Italian respondents focus more on internal capacity-building.
European Space ecosystem potential. Institutions such as ESA, the Copernicus User Forum and EUSPA, while not yet perceived as active drivers, were widely recognized as potential enablers. This, combined with strong appreciation for peer learning, suggest to further develop and enhance multi-level institutional ecosystems that foster knowledge sharing and capacity-building.
4.8. Policy Recommendations
In light of these findings, particularly the “feedback loop of underinvestment” and the related constraints, a multi-tiered policy strategy is needed to strengthen EO adoption among LRAs.
The strategy must address the hierarchy of constraints identified.
Introduce clearer legal and policy incentives. Building on existing EU initiatives, such as the JRC Knowledge Center for Earth Observation, future policy design could include, for instance, incentive-based mechanisms tied to regulatory compliance or performance improvement; use-case-specific policy guidance to integrate EO data within EU directives implementation already in development (e.g., climate adaptation, biodiversity); and cost–benefit analyses to identify where EO data use yields the highest returns, guiding targeted incentive schemes (EARSC 2020 [
52,
55]). An embryonal example could be the introduction from the EC of incentives for using EO satellite data within the framework of projects directly funded by the EU.
- 2.
Strengthen the ecosystem of EO support and facilitation. Institutions such as ESA (for example, through its Stakeholders Engagement Facility), the Copernicus User Forum, EUSPA and National Space Agencies have been recognized as potential critical enablers for EO adoption among LRAs. To further enhance their vital role, a stronger focus should be placed on facilitating direct communication channels with local public authorities, including decision-makers and operational departments, to ensure their needs are heard and addressed. A concrete example could be the creation of a “European community of practice for cities and regions in EO” involving directly local and regional public decision-makers and staff. This initiative could foster peer exchange, mutual learning and collaborative solution design among LRAs. Such a network, supported by ESA, EUSPA and national agencies, would provide a sustainable mechanism to share experiences, troubleshoot challenges and promote scalable EO applications across LRAs.
- 3.
Align EO data acquisition and product development with user needs. To bridge EO services supply and LRAs demand, more systematic engagement with local public end-users might be useful during the design of future satellite missions, payloads and product development. To this end, leveraging existing successful initiatives and projects (including those funded by ESA and EUSPA), further in-depth user requirement analysis at the local and regional level and the development of interoperable and user-friendly tools should be continued and enhanced. From a more up-stream perspective, it should also be considered to reinforce co-design in mission planning by incorporating user requirements from local and regional levels.
4.9. Future Research
This article provides a foundational understanding of Earth Observation (EO) adoption among European local and regional authorities (LRAs). To build upon these findings and further advance the understanding of EO integration in public governance, future research is needed.
First of all, future studies should aim to extend the sample size, allowing for wider coverage of EU LRAs and enabling more robust quantitative analysis of variations across different types of organizations and countries. This would facilitate stronger statistical inferences.
To mitigate the limitations of relying primarily on self-reported survey data and to address potential self-reported bias, future investigations could significantly benefit from methodological triangulation.
As policy recommendations are proposed based on these findings, subsequent research should empirically evaluate the effectiveness of implemented policy interventions in fostering EO uptake and their beneficial integration into LRAs operations.
5. Conclusions
This article aimed to investigate the key affordances and constraints perceived by local and regional authorities (LRAs) regarding the adoption of Earth Observation (EO) satellite data, and to analyze the technological, organizational and environmental factors influencing its adoption (RQ1–RQ3).
From a theoretical perspective, the study provides a cross-national analytical application and operationalization of the integrated Technology–Organization–Environment (TOE) and Technology Affordances and Constraints Theory (TACT) frameworks. Despite the limited sample size, the findings demonstrate internally consistent and policy-relevant trends, offering valuable insights for both the academic and policy communities engaged in public sector digitalization and Earth Observation governance.
Key findings
Although exploratory in nature, this research confirms that the adoption of Earth Observation (EO) satellite data by European local and regional authorities (LRAs) within the sample remains limited and fragmented, suggesting the persistence of structural barriers that transcend national contexts.
RQ1: Influential factors (TOE)
The analysis reveals that, within the pre-selected sample of EU LRAs, EO satellite data adoption is affected strongly by organizational and environmental constraints.
- ▪
Organizational: The major internal constraint is what we defined as a “feedback loop of underinvestment”. Leadership’s partial unawareness limits investment in training, staff and appropriate budget, reinforcing technical inertia.
- ▪
Environmental: External pressures remain weak, as legal and financial incentives are largely non-binding. Nonetheless, inter-organizational cooperation and access to EU funds act as soft enablers, providing entry points for experimentation and initial uptake.
RQ2: Perceived affordances and constraints (TACT)
EO satellite data are generally perceived as beneficial for decision-making, cost-efficiency and integration in existing GIS platforms (affordances). However, this potential remains only partially activated. From a technological perspective, the primary constraints lie in the perception of an only partial adequacy of EO satellite data in meeting local-scale operational needs. Also, the leadership’s weak awareness of EO satellite data negatively effect the full activation of the affordances within the LRAs.
RQ3: Variation in adoption
Although the limited sample size precludes statistical generalization, the qualitative typology analysis indicates that EO adoption pathways are path-dependent rather than linear. Organizational readiness emerges as a necessary but not sufficient condition for adoption: affordances become actionable only when leadership actively mobilizes organizational capabilities.
For instance, the “Indirect Users” group displays moderate readiness but remains stalled because top management neither allocates stable funding nor integrates EO into core priorities. This finding underscores that leadership commitment and strategic vision are essential to convert latent affordances into embedded and sustainable EO-based services.
As the number of Earth Observation satellites continues to grow, the convergence of advanced technologies is enabling faster, more efficient planetary monitoring and the development of predictive tools that can enhance quality of life. Empowering regions and cities to seize these opportunities is not just a technical challenge; it is an environmental, social and economic priority. To fully realize the value of the significant investments made in science, research and technology, it is necessary to match them with equal investment in local capacity, awareness and governance, ensuring that the benefits of innovation reach the “last mile” of sustainability.
