Article

The Impact of Transportation and the Built Environment on Community and Individual Well-Being in the United States

by
Muhammad Asif Khan
1,
Ranjit Prasad Godavarthy
2,*,
Jeremy Mattson
2 and
Diomo Motuba
2
1
NUST Institute of Civil Engineering (NICE), School of Civil and Environmental Engineering (SCEE), National University of Sciences and Technology (NUST), Islamabad 44000, Pakistan
2
Department of Transportation, Logistics and Finance, North Dakota State University (NDSU), Fargo, ND 58108-6050, USA
*
Author to whom correspondence should be addressed.
Urban Sci. 2025, 9(11), 490; https://doi.org/10.3390/urbansci9110490
Submission received: 6 August 2025 / Revised: 22 October 2025 / Accepted: 13 November 2025 / Published: 19 November 2025
(This article belongs to the Special Issue Climate Change and Sustainable City Design)

Abstract

This study investigates the effects of transportation, specifically public transit, the built environment, and sociodemographic factors on community quality of life (QOL) and individuals’ overall life satisfaction (OLS) in the United States. Using data from the 2017 National Community Livability Survey (NCLS), which includes responses from 994 adults across all 50 states, structural equation modeling (SEM) was applied to examine four latent constructs: the built environment, access to amenities, transportation quality, and support for transit funding. Additional observed variables included perceived importance of public transit, public transit need, ease of travel, and key sociodemographic indicators. Results show that the built environment and transportation quality significantly enhance community QOL but do not have a direct effect on individual OLS. In contrast, support for transit funding has a significant positive effect on individual OLS but not on community QOL. Public transit and walking access to amenities such as parks and recreation facilities, grocery stores, healthcare services, etc., improve both the built environment’s perceptions and community QOL. Interestingly, the perceived importance of public transit negatively influences community QOL, while perceived transit need negatively impacts individual OLS. Ease of travel is the only factor with a significant positive effect on both outcomes. Sociodemographic factors such as gender, age, income, health, education, and race are also found to significantly influence individual life satisfaction. These findings suggest that enhancing perceptions of the built environment, improving transportation quality—particularly public and active transit—and ensuring ease of travel can contribute to improved quality of life. Policies that integrate transportation planning with broader livability and well-being goals may offer more inclusive benefits at both the community and individual levels.

1. Introduction

Quality of life (QOL) is a multidimensional construct that encompasses both objective life indicators (e.g., health, education) and qualitative subjective measures of life (e.g., feeling positive or negative, happiness). Numerous factors influence QOL, ranging from personal characteristics such as income, age, and health, to broader societal attributes like culture, safety, environmental quality, and physical infrastructure [1,2]. The World Health Organization (WHO) identifies six key domains of QOL: (1) physical health, (2) psychological health, (3) social relationships, (4) level of independence, (5) environment, and (6) personal beliefs [3]. Among the six domains, the environmental domain encompasses the home environment, transportation, access to social and health care services, satisfaction with work, the physical environment, and options for recreational/entertainment activities participation.
Within the transportation sector, Lee and Sener (2026) [4] highlighted four QOL dimensions—physical, social, mental, and economic—shaped by the built environment, mobility/accessibility, and vehicular traffic. Their analysis of 148 long-range transportation plans across the U.S. found that metropolitan planning organizations (MPOs) inconsistently incorporate QOL metrics [4]. They recommended that future transportation planning efforts explicitly integrate QOL dimensions.
For transportation planners and policymakers to effectively incorporate QOL considerations into transportation decisions, a clear understanding of the relationship between transportation systems and QOL is essential. This understanding can support more holistic community development strategies by considering various dimensions of QOL that simultaneously address urban congestion and enhance overall well-being [4].
Public transit plays a critical role in improving QOL, especially for populations dependent on it—such as older adults, individuals with disabilities, those unable to drive, or those without access to private vehicles [5]. Similarly, walkable neighborhoods promote physical activity and health, thereby contributing to better QOL [2,6]. Delbosc (2012) [2] proposed a conceptual framework linking transportation to QOL or well-being, emphasizing three key components: (1) accessibility to life activities, (2) physical mobility and active transportation options, and (3) transportation infrastructure. Kwon et al. (2019) [7] also found that perceived walkability—defined by access to services and neighborhood aesthetics—positively influences QOL.
Scholars have argued that improving QOL should be the overarching objective of transportation policy, rather than merely enhancing mobility or accessibility [8,9]. Without a QOL-centered focus, transportation initiatives may inadvertently promote access or mobility without translating those improvements into meaningful social outcomes.
QOL is shaped by a complex interplay of transportation-related factors (e.g., quality of public transit, traffic safety, road conditions, walkability), built environment attributes, (e.g., availability and access to schools, healthcare, parks, and recreation), and individual characteristics (e.g., age, income, disability status). A comprehensive framework that accounts for all these elements is essential to accurately evaluate QOL outcomes.
This study addresses this research gap by empirically evaluating the effects of transportation (particularly public transit, active transportation options, quality of transportation), perceived built environment features, and sociodemographic variables on both community-level QOL and individuals’ overall life satisfaction (OLS). Using a national dataset from the 2017 National Community Livability Survey (NCLS), this research applies structural equation modeling (SEM) to explore these relationships within a single integrated framework.
The remainder of this paper is structured as follows: the next section presents a review of relevant literature, followed by the data and methodology used in this study. The results and discussion are then presented, and the paper concludes with key findings and policy implications.

2. Literature Review

2.1. Defining Quality of Life (QOL)

Early definitions of QOL typically fall under four general categories: objective, subjective, combination of objective/subjective, and domain-specific [4]. Objective indicators—such as crime rates, household income, and divorce rates—are useful for assessing QOL at the societal level but may not capture individual-level perceptions [10,11,12]. Subjective measures, including positive and negative emotions and overall life satisfaction, offer insight into individual experiences and have been validated alongside objective indicators [13,14]. However, relying solely on subjective indicators can also be insufficient, as they may not fully reflect individuals’ material circumstances [4].
Many scholars now argue for a combined approach that integrates both objective and subjective indicators to provide a more comprehensive understanding of QOL [1,15,16]. This approach recognizes the importance of objective life outcomes (e.g., employment, health, safety) as well as subjective well-being (e.g., overall life satisfaction, happiness), which may vary by individual perceptions and context.
The fourth category, domain-specific definitions, examines QOL within particular disciplines or sectors. Scholars in fields such as health, transportation, and social sciences have explored how specific factors—ranging from housing quality and job satisfaction to health conditions and transportation costs—influence QOL [17,18,19,20]. These domain-specific measures offer targeted insights, allowing researchers to better understand how variables within a given context interact with individual and community well-being [1,4].

2.2. Transportation and Quality of Life

Transportation influences key aspects of life, including health, social connectivity, and economic opportunity. These elements are integral to QOL and are significantly shaped by transportation access and infrastructure [2]. Active transportation options, such as walking and biking, contribute to better physical health and reduced obesity rates [21], while increased public transit usage is associated with overall health improvements [22,23]. However, the risks associated with transportation are also evident; for instance, Ohlin et al. (2017) [24] reported that 44% of bicyclists and 59% of car occupants experienced long-term health-related QOL issues following traffic injuries.
Transportation systems also affect social well-being. Reliable access to transportation enables participation in recreational and social activities, helping individuals maintain relationships and expand social networks [25]. Although digital communication has replaced some face-to-face interactions, physical mobility continues to be essential for active life engagement, which in turn enhances QOL. Hart and Parkhurst (2011) [26] found that high traffic volumes negatively affect social life and environmental quality. Velho (2019) [27] emphasized the challenges wheelchair users face with public transit, citing both social and physical barriers that diminish their health and social experiences.
Transportation accessibility is also closely linked to employment. Lack of affordable and reliable transit can hinder job search and retention, especially among disadvantaged populations [28]. Policies supporting transit affordability and multimodal options—such as biking and walking—can help alleviate transportation burdens, particularly for low-income and unemployed individuals [2].
Research has increasingly examined transportation-related QOL indicators. Banister and Bowling (2004) [29] evaluated the influence of mobility on the QOL of older people using categorical analysis in Britain; they found that older adults with mobility limitations report significantly lower QOL. de Groot and Steg (2006) [20] studied the effects of transport pricing, finding that doubling car costs led to modest declines in perceived QOL. Stanley et al. (2011) [30] demonstrated that increased trip-making correlates with reduced social exclusion risks in both urban and regional settings. Bergstad et al. (2011) [31] explored the relationship between individual travel patterns, social exclusion, and personal well-being in the Melbourne metropolitan area and at the regional level in Victoria found that satisfaction with daily travel contributes directly and indirectly to subjective well-being (SWB).
Further, additional models and empirical analysis have emerged. Carse (2011) [32] proposed a transport quality of life (TQOL) model to assess TQOL across all public transportation modes within a city. The model was applied to the case studies of Glasgow and Manchester, considering light rail, train, and bus public transit modes. The validated TQOL indicators included access and availability, sustainable transportation, environment, transportation costs, and personal safety. Cao (2013) [33] examined the Light Rail Transit’s (LRT) impact on life satisfaction in the Minneapolis–Saint Paul area using public transit perception, accessibility perception, and satisfaction with travel as latent variables. It was concluded that LRT in the twin cities has a significant positive impact on the residents’ life satisfaction. Kolodinsky et al. (2013) [34] emphasized that the ability to make trips, rather than trip frequency, is more predictive of QOL in rural areas. Similarly, Morris (2015) [35] investigated the relationship between travel for out-of-home activities and life satisfaction using data from the American Time Use Survey. The study found that time spent walking, bicycling, and travelling to activities such as religious services, dining, and volunteering was significantly and positively associated with life satisfaction. Kim et al. (2020) [36] examined the connection between individual travel behavior and perceived QoL for older adults in Shizuoka, Japan, using smart card data and survey-based travel satisfaction measures. The findings revealed that public transport use and travel satisfaction significantly influence QOL.
Commute-related studies have offered mixed findings. Zhu et al. (2019) [37] found that shorter commutes were associated with greater SWB in China, though users of active transport reported lower satisfaction. Sun et al. (2021) [38] also identified negative associations between public transit use and prolonged commute times with SWB. However, ref. [39] found positive links between active commuting and work-life balance, especially among Canadian women. Iamtrakul et al. (2023) [40] examined how built environment characteristics influence transportation-related quality of life (QoLT) in Bangkok’s Sukhumvit district by integrating GIS-based spatial analysis with deep learning. The findings revealed spatial variations in commuters’ life satisfaction linked to physical and socioeconomic differences across areas. Hybel and Mulalic (2022) [41] assessed the influence of transportation on QOL in Denmark using a general equilibrium model and a quality-of-life index based on household willingness to pay for local amenities. The results show that quality of life, wages, and rents are higher in large cities, and that the quality of public transport plays a significant role in enhancing overall life satisfaction.
Mattson et al. (2021) [42] explored transportation’s influence on QOL using three ordered probit models, each focusing on ease of travel, community QOL, and individual life satisfaction. The authors recommended adopting a systems approach to better capture interconnected influences. Tran et al. (2024) [43] assessed the indirect impacts of mode choice on SWB in Japan, highlighting that public transport enhanced cognitive well-being but reduced affective well-being, while the role of active transportation remained inconclusive.

2.3. Built Environment and Quality of Life

The impact of the built environment on quality of life (QOL) has been the focus of numerous studies. Sarmiento et al. (2010) [44] found that characteristics such as land use heterogeneity and park density were positively associated with the health-related quality of life (HRQOL), while the availability of public transit stations was negatively associated. Gao et al. (2016) [45] studying neighborhoods in Xian, China, reported that ease of access significantly correlated with higher levels of both physical and mental well-being. In newer neighborhoods, attributes such as safety, diversity, and aesthetics also showed positive associations with psychological and physical well-being. Mouratidis (2018) [46] used structural equation modeling to explore the relationship between social well-being and urban form. The findings indicated that proximity to city centers, mixed land use, and higher population densities were positively associated with social well-being. Similarly, Huang et al. (2019) [47] examined older adults in Taiwan and found that access to historical and cultural facilities significantly improved HRQOL. The study also highlighted the role of physical and social activity engagement in enhancing older adults’ QOL. Yu et al., 2023 [48] analyzed how different elements of the built environment influence ride-sourced commuting behavior during urban village renewal in Shenzhen using a Spatial Durbin Error Model and DiDi trip data. Results revealed that built environment factors affect commuting differently at residential and workplace locations.
In a more comprehensive review, Mouratidis, (2021) [49] identified seven pathways linking the built environment to SWB: travel, work, health, leisure, social relationships, emotional responses, and residential well-being. Based on this evidence, the author proposed several urban planning strategies to improve SWB, including improved conditions for active travel, car use restrictions, improved public transportation services, ease of access to services and facilities, equitable support for housing and transport, and the development of emerging mobility technologies to promote inclusivity across diverse social groups. Lee et al. (2023) [50] found that easy access to urban amenities such as medical facilities, parks, sports facilities, shopping facilities, and schools was significantly associated with higher levels of resident satisfaction with the urban environment. Kodali et al. (2023) [51] conducted a systematic review by synthesizing 17 studies (2010–2023) examining how built environment features influence children’s QOL. Results revealed that neighborhood green spaces and overall neighborhood satisfaction are consistently associated with higher QOL among children.
Previous studies have examined the influence of individual transportation components—such as pricing, travel satisfaction, number of trips, and travel demand—on quality of life (QOL). Similarly, research has explored the relationship between built environment features and well-being. However, an integrated framework that simultaneously considers various domains of transportation and the built environment is largely absent from empirical literature. While some conceptual frameworks have been proposed, e.g., [2,4] comprehensive empirical analysis remains limited. This study addresses this gap by empirically examining the combined impact of transportation-related factors, access to amenities (such as grocery stores, parks, and recreation facilities, healthcare services, etc.), built environment characteristics, and sociodemographic variables on both community and individual well-being. Moreover, by leveraging nationwide representative survey data, this research provides the first comprehensive assessment of how these factors collectively shape QOL across communities in the United States.

3. Materials and Methods

3.1. Data Source, Study Area, and Sample

This study utilized data from the National Community Livability Survey (NCLS), conducted between April and December 2017 by the Texas A&M Transportation Institute and North Dakota State University’s Upper Great Plains Transportation Institute (UGPTI). The survey was designed with 55 questions and was part of a broader research project aimed at studying the nexus of transit and livability in U.S. communities [52].
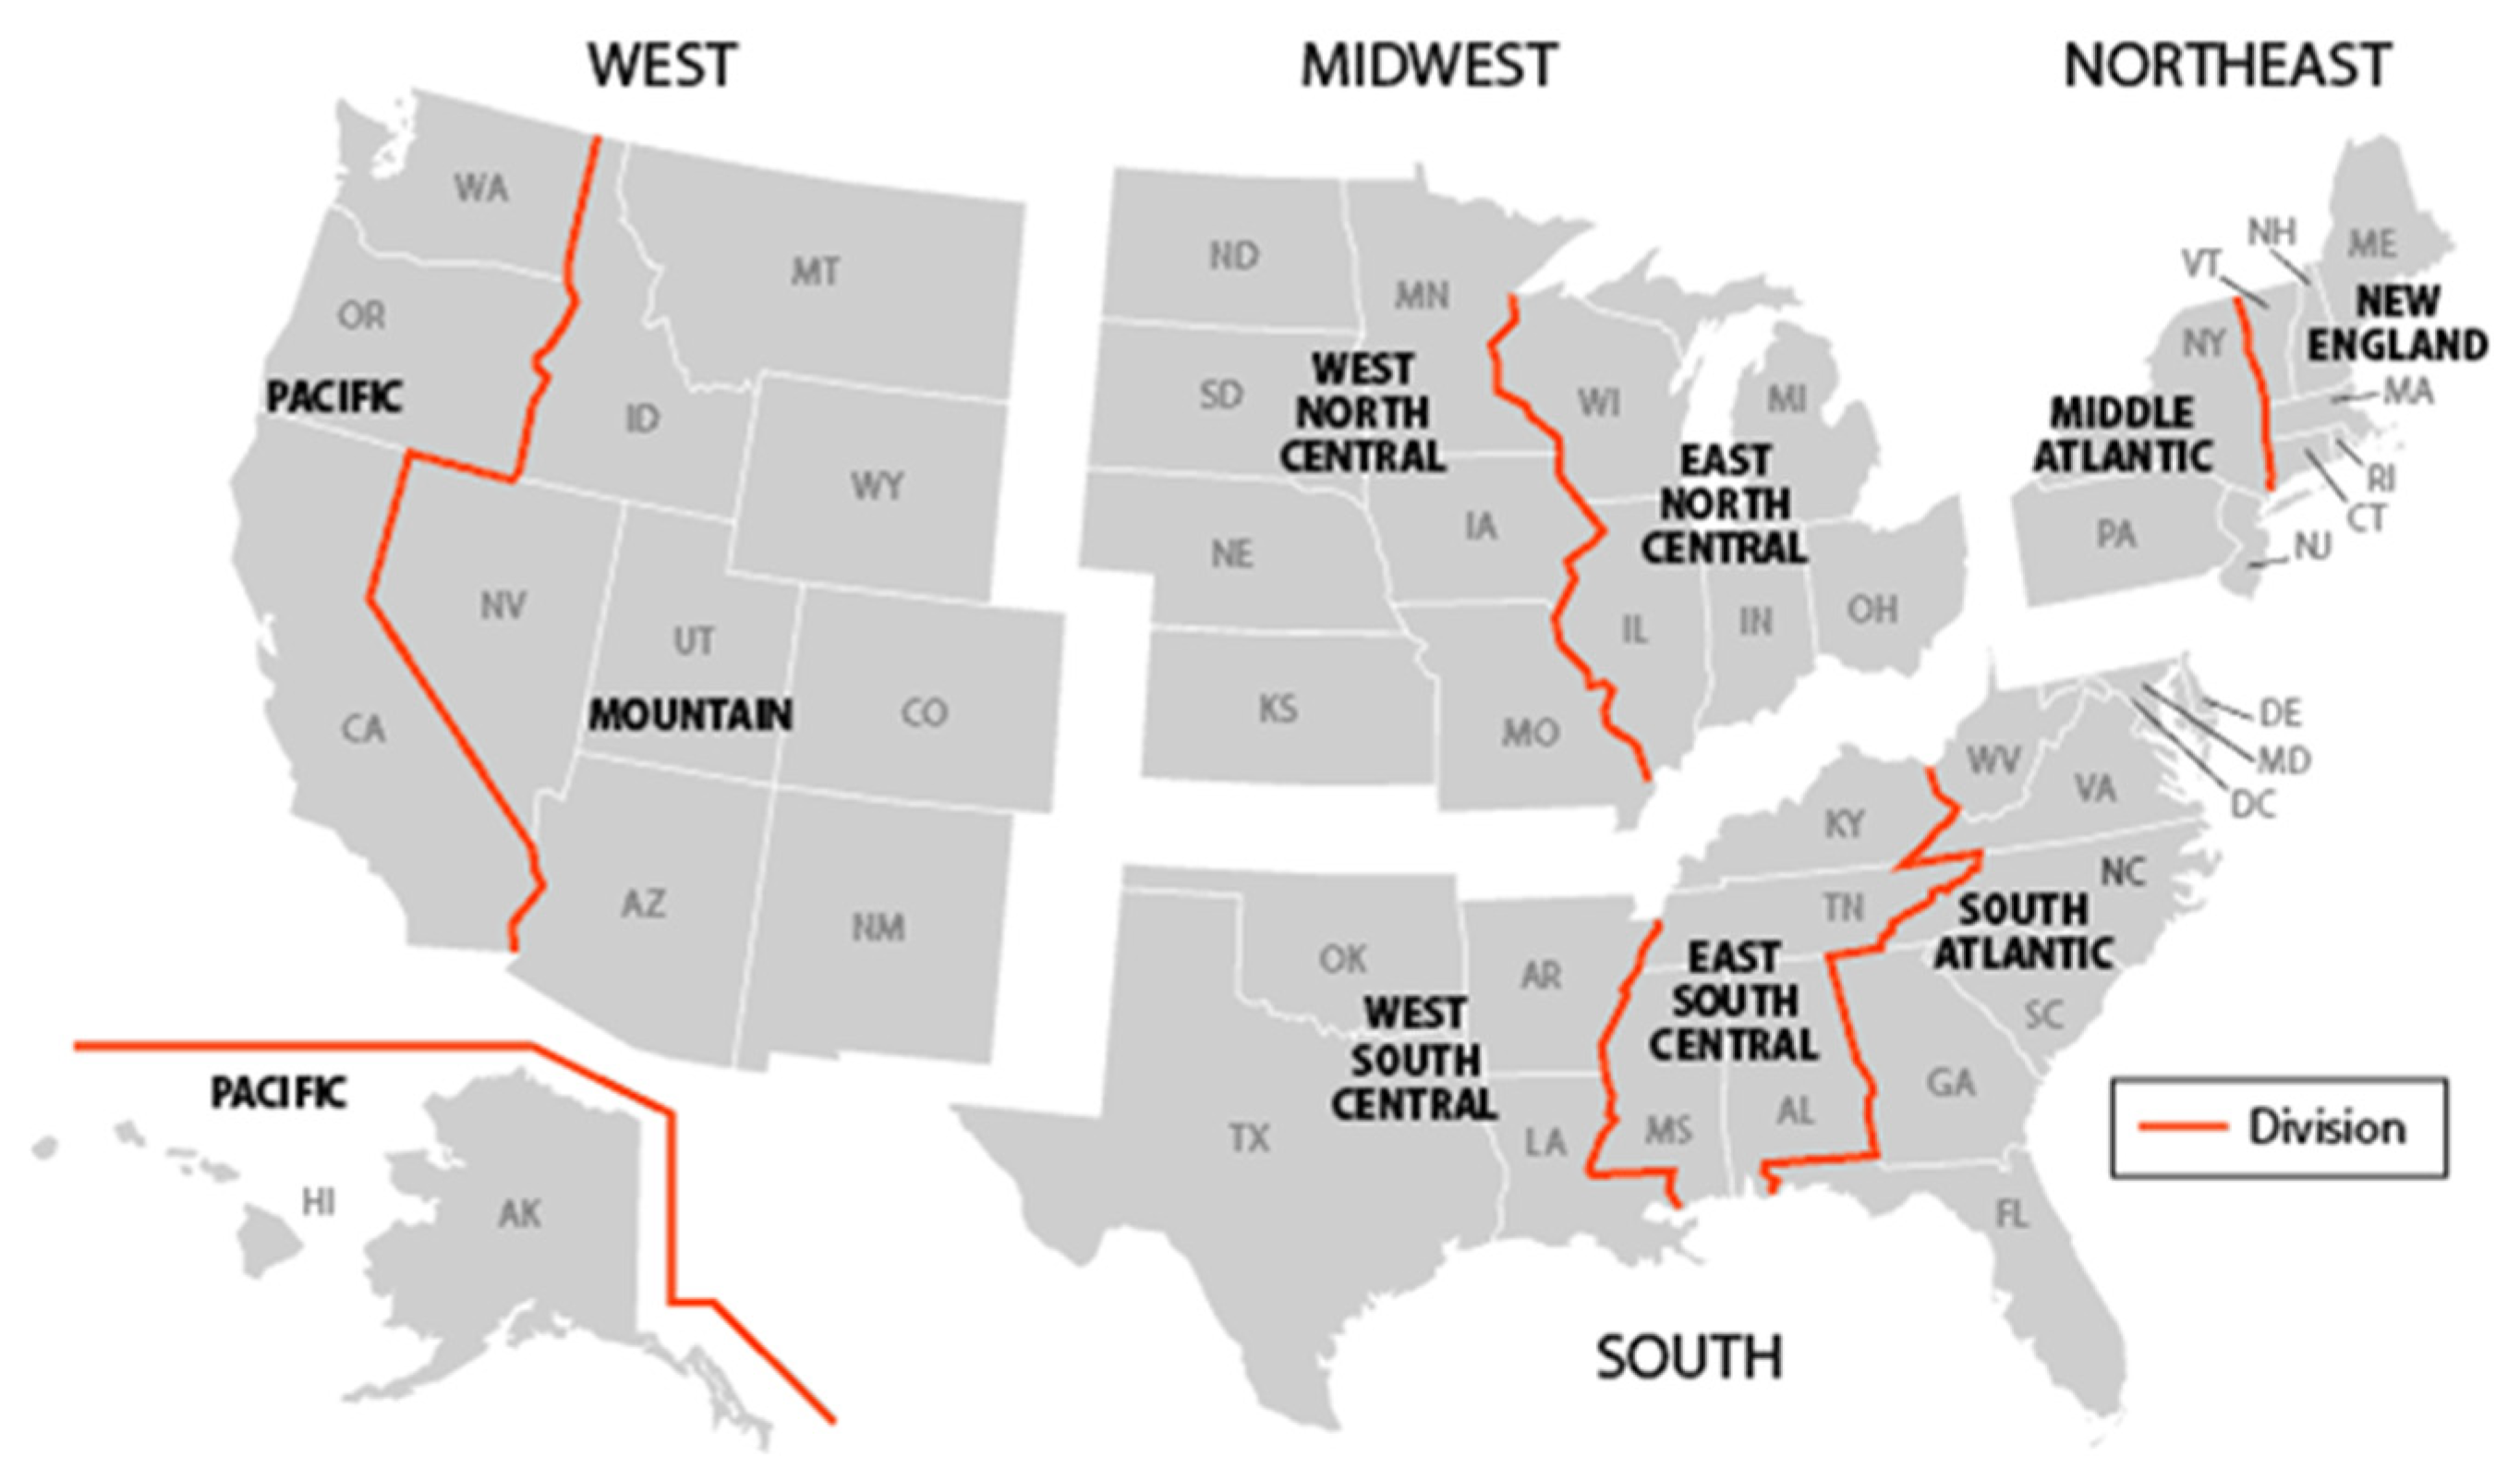
A stratified random sampling approach was employed to ensure a proportional representation of the U.S. adult non-institutionalized population. Stratification was based on four U.S. regions and nine Census Divisions (see Figure 1), accounting for age and sex to ensure broad geographic and demographic representation. Additionally, the sample was stratified according to the U.S. Department of Agriculture’s (USDA) Economic Research Service (ERS) Rural–Urban Continuum Codes (RUCC), covering all nine RUCC classifications (see Figure 2). The darker blue colors in Figure 2 show urban areas, while the lighter colors represent rural areas. RUCC codes 1–3 were classified as metro areas, while codes 4–9 were considered non-metro. For the purposes of this study, communities with RUCC codes 1, 2, and 3 are classified as metro areas, while those with codes 4 through 9 are considered non-metro. Although 85% of the U.S. population resides in metro areas (RUCC 1–3) (see Table 1 for population distribution according to U.S. regions and RUCC code), the research team aimed to contact a roughly equal number of adults across all nine RUCC classifications. As a result, rural communities were intentionally over-sampled to achieve a balanced number of survey responses across geographic categories.
In total, the survey was distributed to 25,000 adults across all 50 U.S. states. The response rate was 4%, yielding 994 completed responses. The survey collected detailed information on community livability (both general and local), transportation use, public transit access, walkability, community QOL, individual OLS, future transportation and technology expectations, and sociodemographic characteristics.

3.2. Variables Used in the Study

The primary objective of this study is to empirically evaluate how transportation factors (including public transit, active transportation, and transportation quality), built environment characteristics, and sociodemographic variables influence both community-level QOL and individual life satisfaction.
This section outlines the survey variables used in the analysis. Table 2 shows the sociodemographic characteristics of the survey respondents in the metro and non-metro areas. Most respondents in both groups were aged 55–74 years, with slightly older adults in non-metro areas. Females represented a larger share than males in both groups. Employment patterns show a higher proportion of employed respondents in metro areas, while non-metro areas had more retirees. In terms of income, metro residents tended to have higher earnings, while lower- and middle-income categories were more common in non-metro areas. Physical disability was more prevalent in non-metro areas (20%) than in metro areas (11%). Metro residents were generally more educated, with a greater percentage holding bachelor’s or graduate degrees. Overall health status was similar across groups, with most reporting good health. The majority of respondents in both areas identified as White, with a slightly higher proportion in non-metro areas.
Table 3 shows the summary statistics of the community QOL, individual’s OLS, built environment, and transportation-related variables. Built environment characteristics were captured through respondents’ evaluations of the availability and quality of various community features, including available jobs, cultural institutions, quality health care, quality public schools, the overall cost of living, shopping and entertainment options, parks and recreational facilities, affordable transportation options, and a sense of community. Public transit and walking access to amenities were also measured in the survey. The five different types of amenities considered in the study are as follows: (1) grocery store or supermarket (vegetables, fresh fruit, meat, bread), (2) personal services (bank, laundromat, hair/nail salon), (3) other retail shopping (pharmacy, clothes, household goods), (4) recreation and entertainment (parks, museums, movies, live theater), and (5) health care facility (hospital, doctor’s office, urgent care). The public transit and walk access to these non-work amenities were measured on a scale of 0 (a person does not have access to any of the five non-work amenities mentioned) to 5 (a person has access to all five amenities).
Respondents also rated five aspects of transportation in their community: public transit services, bikeability, walkability, road conditions, and traffic safety. Each of these indicators was measured on a 5-point Likert scale ranging from 1 (very poor) to 5 (very good). Support for transit funding was assessed by asking respondents whether they supported the use of federal, state, city, and county funds for public transit. Responses for the variable “I support using (city, county, state, and federal) funds for transit” were recorded on a 5-point Likert scale from 1 (strongly disagree) to 5 (strongly agree).
In addition, the perceived importance of public transit for the community and the perceived need for transit services were included to evaluate their effects on QOL. Both were measured using a 5-point Likert scale from 1 (strongly disagree) to 5 (strongly agree). The ease of travel (mobility indicator) was captured through the question, “How much do you agree or disagree with the following statement? How easily can you travel to the places you need to go using your current travel options?” Responses were measured on a 5-point Likert scale from 1 (strongly disagree) to 5 (strongly agree).
Two main dependent variables were used in this study: community quality of life (QOL) and individual overall life satisfaction (OLS). Community QOL was assessed by asking, “How satisfied are you with the quality of life in your community?” [53], with responses captured on a 5-point Likert scale from 1 (very dissatisfied) to 5 (very satisfied). OLS was measured using the question, “All things considered, how satisfied are you with your life as a whole these days?” Responses were rated on a scale from 0 (completely dissatisfied) to 10 (completely satisfied).

3.3. Structural Equation Model (SEM)

SEM is a multivariate analysis technique used to model complex phenomena by examining relationships between observed indicators and unobserved (latent) variables. Structural equation models are comprised two components: (1) a measurement model, which assesses the relationship between latent variables and observed variables; and (2) a structural model or latent variable model, which evaluates the strengths and direction of the relationship between latent exogenous and endogenous variables. The basic equation to describe the structural or latent variable model is as follows [54]:
η = B η +   Γ ξ +   ζ
where η (eta) is a m × 1 vector of latent endogenous variables, ξ (Xi) represents n × 1 vector of exogenous latent variables, ζ (zeta) is m × 1 vector of random variables, B (beta) represents m × m coefficient matrix for endogenous latent variables and Γ (gamma) is a m × n coefficient matrix for the exogenous latent variables.
The basic equations to describe the measurement model are as follows:
x =   Λ x ξ +   δ
y = Λ y η + ε
where x and y are the column q-vectors and column p-vectors related to the observed exogenous and observed endogenous variables, respectively; δ (delta) and ε (epsilon) are the errors related to observed exogenous and observed endogenous variables respectively; Λx (lambda) and Λy represents q × n and p × m structural coefficient matrices for the effects of the latent exogenous, and latent endogenous variables on the observed ones respectively.
The study employs Partial Least Squares Structural Equation Modeling (PLS-SEM) instead of Covariance-Based SEM (CB-SEM) due to several advantages. PLS-SEM effectively handles non-normal data without normality assumptions [55], performs better with complex models and small samples [56], and retains all construct indicators to preserve theoretical integrity [57], unlike CB-SEM, which can yield biased fit measures under non-normality [58].

3.4. SEM Hypothesized in This Study

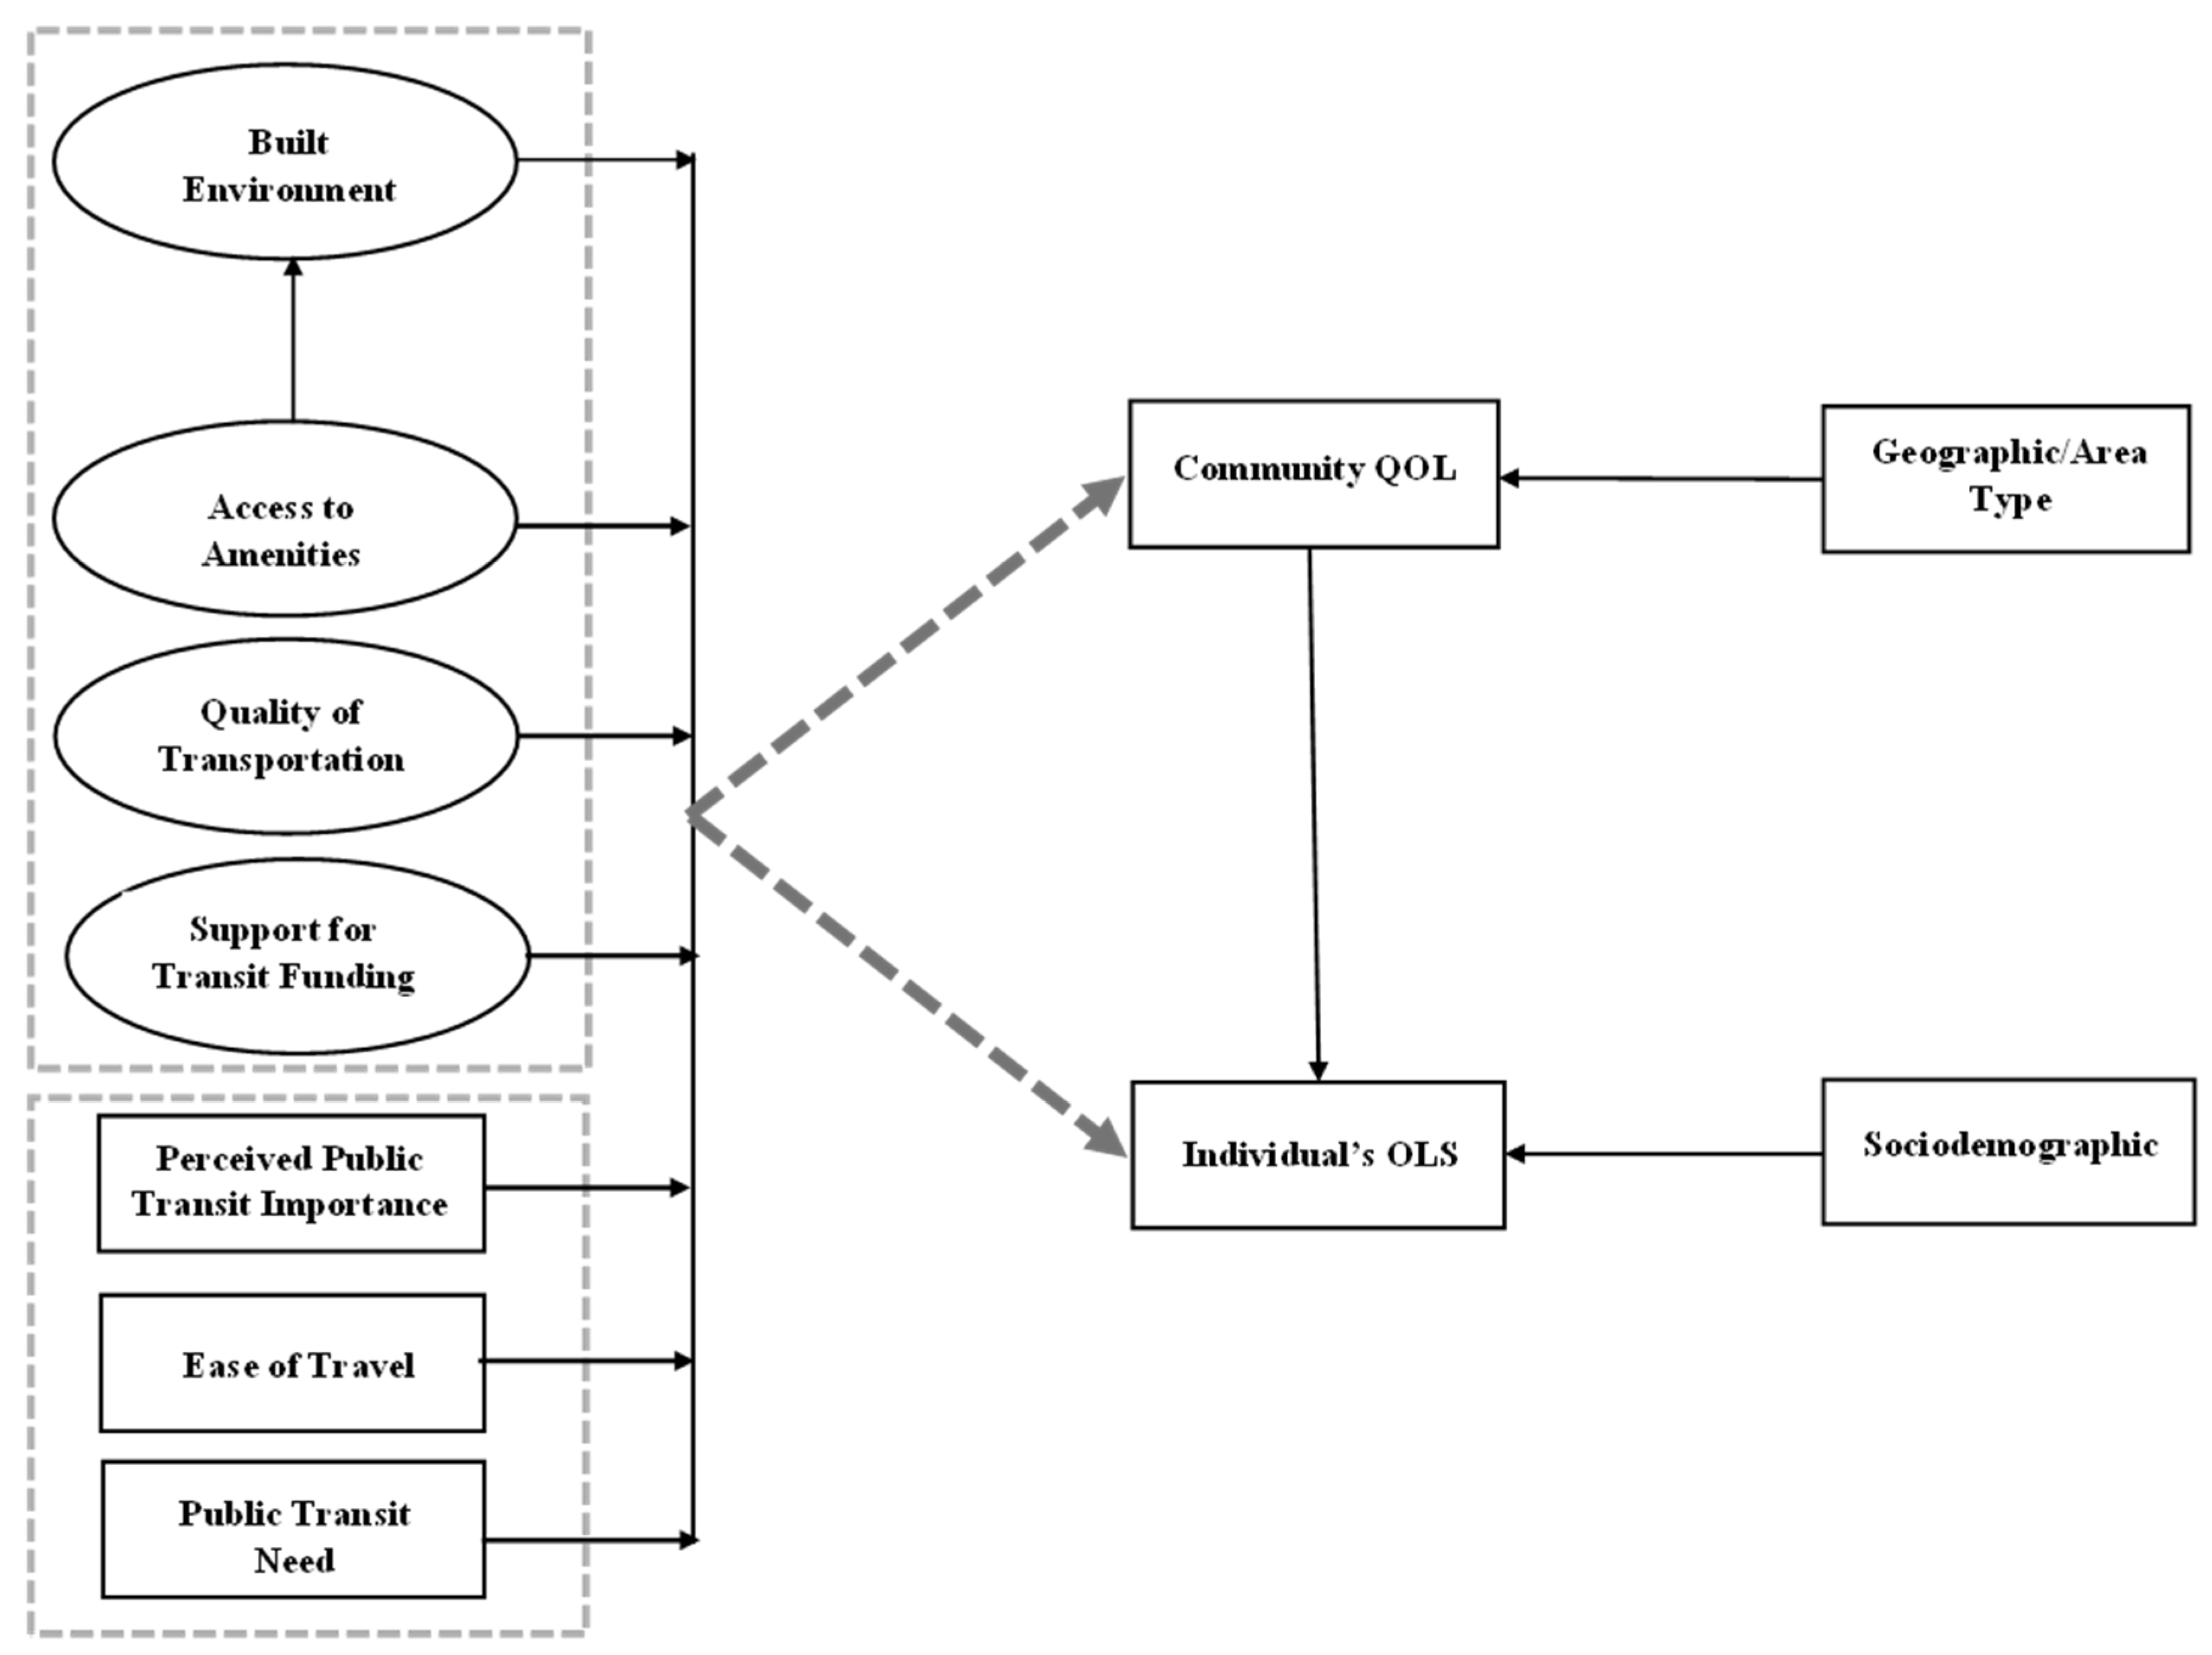
Figure 3 presents the conceptual SEM hypothesized for this study. Variables shown in the square box represent observed or manifest variables, while those in circles represent latent variables. The four latent independent variables (shown in circles) in this study are the built environment, access to amenities, quality of transportation, and support for transit funding. The respective observed variables related to the three latent factors/variables are provided in Table 4.
In the model, the final dependent variable is the individual’s OLS, which is an observed endogenous variable. There are two mediating dependent variables: community QOL and built environment. The model also includes three observed exogenous variables: ease of travel (mobility indicator), perceived public transit importance for a community, and public transit need/support for the community. The impact of these exogenous variables is evaluated directly on an individual’s life satisfaction and indirectly through the mediating community QOL variable. Previous research has shown that the type of area in which individuals reside significantly influences QOL [59]. Therefore, this research will also evaluate the impact of area type (metro vs. non-metro) on community QOL and individual OLS, as shown in Figure 3. The other set of observed exogenous variables includes sociodemographic characteristics, which are treated as control variables [60]. These include age, gender, employment status, level of education, physical disability, health, income, and race.
By developing the SEM, the study aims to evaluate the direct effects of the built environment, access to amenities by using public transit and/or walking, quality of transportation, support for transit funding, ease of travel, public transit needs for a community, and perceived importance of public transit on an individual’s OLS, as well as indirect effects through the mediating variable, community QOL. The study also examines the relationship between sociodemographic characteristics and individual OLS.

4. Results and Discussion

4.1. Measurement Model

The measurement model, or confirmatory factor analysis (CFA), examines the relationship between manifest (observed) variables and latent factors. Confirmatory factor analysis (CFA) is conducted to assess the measurement model’s reliability and validity. Reliability is evaluated using Cronbach’s alpha and composite reliability, with values above 0.7 deemed acceptable [61]. Validity is examined through convergent and discriminant validity: convergent validity is confirmed when the average variance extracted (AVE) exceeds 0.5 [62], while discriminant validity is verified using the Fornell–Larcker criterion, requiring the square root of AVE to exceed inter-construct correlations [63]. In this study, four latent constructs were specified: (1) built environment, (2) access to amenities by using public transit and/or walking, (3) quality of transportation, and (4) support for transit funding.
After accounting for missing values, the final sample size used for the SEM analysis was 742 out of the total 994 survey responses (n = 742). Table 5 presents the standardized factor loadings for each observed variable linked to the respective latent variables, along with composite reliability, average variance extracted, and Cronbach’s Alpha values. All items showed loadings above 0.7, except two indicators of the built environment (overall cost of living = 0.63, and sense of community = 0.69), and one indicator of quality of transportation (quality of public transit services = 0.61). As both these latent factors’ average variance extracted, composite reliability, and Cronbach’s alpha exceeded the respective thresholds of 0.5, 0.7, and 0.7, the variables were retained. Internal consistency reliability, assessed through Cronbach’s alpha and composite reliability, met the acceptable range of 0.6–0.95 [64], confirming construct reliability. Convergent validity was also established, as all constructs had average variance extracted values above 0.5, indicating satisfactory convergence.
The next step involves assessing discriminant validity using the Fornell and Larcker criterion, with the findings presented in Table 5. The results indicate that the average variance extracted for each construct exceeds its correlations with other constructs, confirming that each factor is conceptually distinct and captures a unique dimension of the model.
Finally, the Standardized Root Mean Square Residual (SRMR) and the Normed Fit Index (NFI) were employed to assess the overall goodness of fit, reflecting how well the proposed model reproduces the observed data. A lower SRMR value and a higher NFI value indicate a better-fitting model, suggesting that the structural model adequately represents the empirical relationships among the constructs. The threshold values for the SRMR should be less than 0.1 [65] and the value for NFI should be ≥0.90 [62]. For the developed model in this study, the SRMR and NFI values are 0.074 and 0.94, which are within the threshold ranges, indicating an acceptable fit.

4.2. Structural Model Results and Discussion

The structural model in SEM investigates the strengths and direction of the relationships between latent exogenous and endogenous variables. This study examines the direct effects of latent exogenous variables (built environment, access to amenities, quality of transportation, and support for transit funding) on community QOL and individual OLS. The study also investigates the direct effects of important observed exogenous variables (ease of travel, perceived transit importance, transit need/support, and area type) on both community QOL and individual OLS.
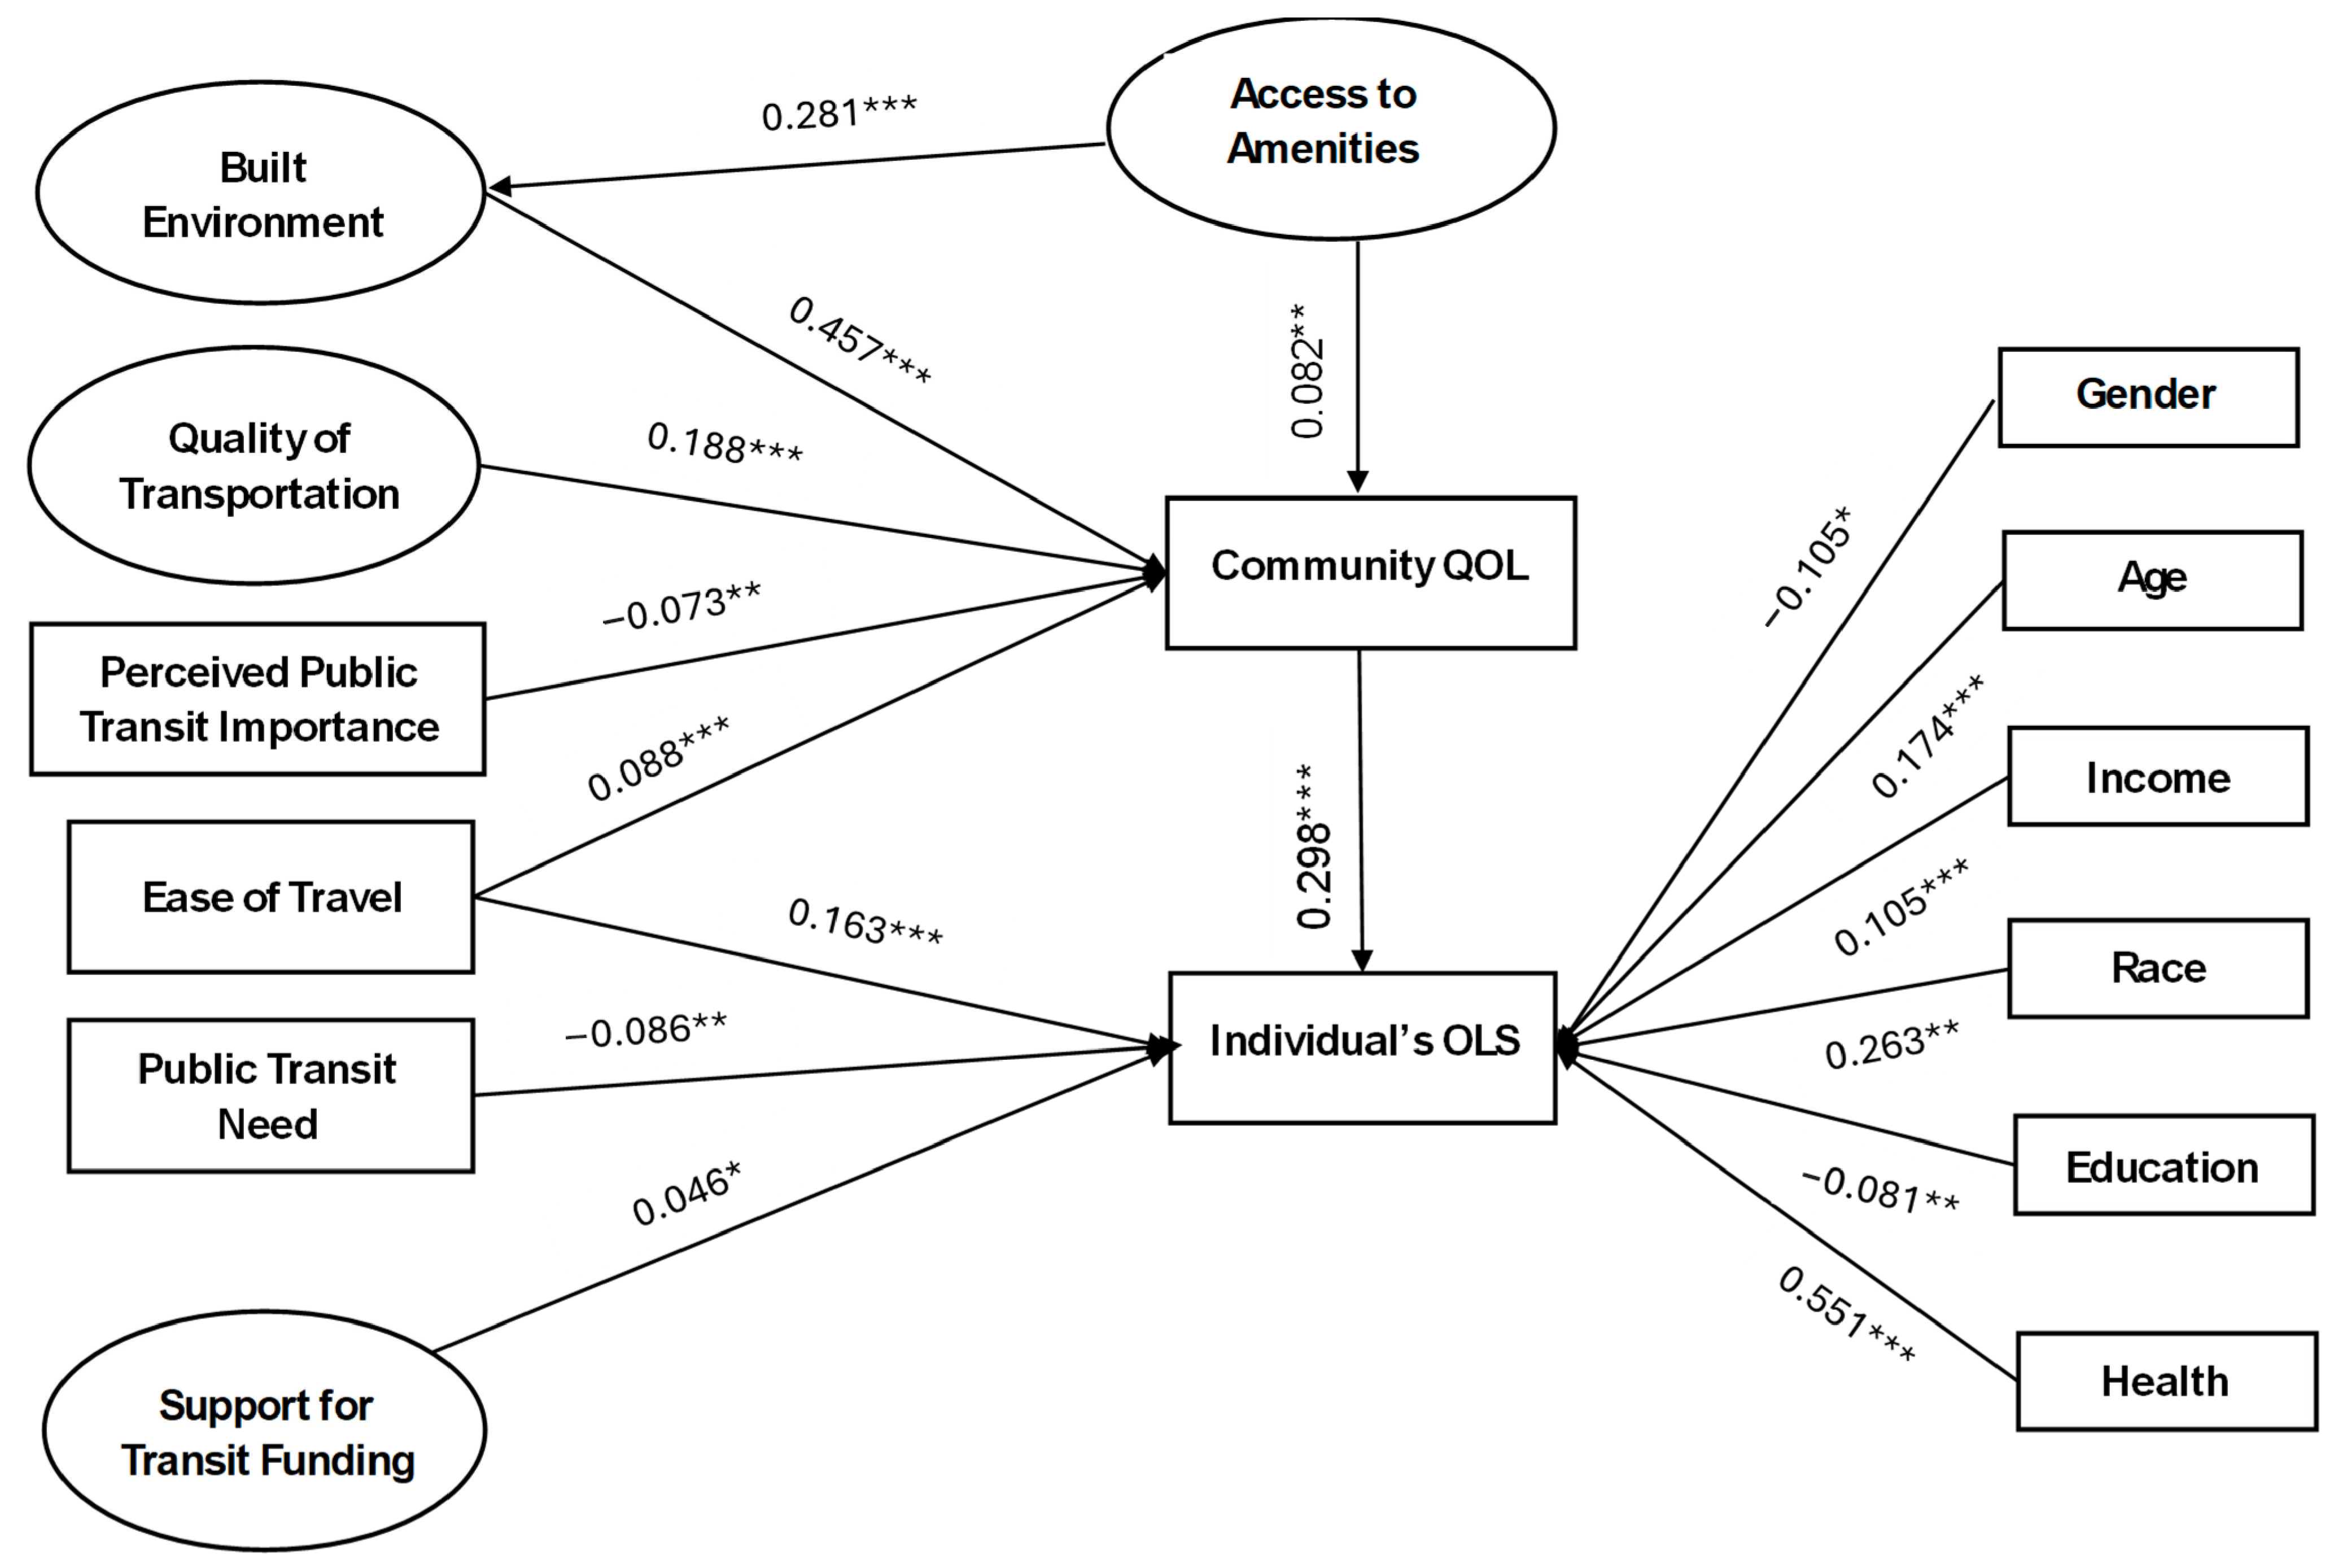
The area type variable in the SEM is measured on a 1-to-5 scale, where 1 represents urban areas and 5 represents rural areas. This scale is based on the RUCC (Rural-Urban Continuum Codes, 1–9), with some categories merged to ensure adequate sample distribution across the five levels. The model also estimates indirect effects of latent and observed exogenous variables through the mediating community QOL variable while accounting for the influence of sociodemographic characteristics on individual OLS. Table 6 presents the statistical results of the structural model developed for this study. Access to amenities significantly improves perceptions of the built environment (Std. R.W. = 0.281, p < 0.0001). This suggests that when people have better access to grocery stores, parks, or healthcare, they perceive their physical surroundings as more favorable and supportive of a high QOL. Urban planners should prioritize mixed-use development and enhance proximity to everyday amenities to improve the livability of its residents. The built environment latent factor has the strongest direct effect on community QOL (Std. R.W. = 0.457, p < 0.0001). However, it has an insignificant direct effect on an individual’s OLS. Access to amenities significantly (p-value = 0.013) influences the QOL of the residents at the community level, even though to a relatively lesser degree (Std. R.W. = 0.082). Communities with better public transit and walk access to everyday amenities (like grocery stores, schools, healthcare facilities, parks, and shops) tend to have a higher perceived quality of life among residents. The quality of transportation latent factor has a moderate effect on community QOL (Std. R.W. = 0.188, p < 0.0001), significant at the 5% level, while it has an insignificant direct effect on an individual’s OLS. The third latent factor, “support for transit funding,” has a statistically insignificant effect on community QOL, but a significant (p = 0.060) and moderate direct effect on individual OLS (Std. R.W. = 0.046).
These findings align with expectations, as the built environment, access to amenities, and quality of transportation represent broad societal indicators and therefore have a strong direct impact on community QOL. In contrast, support for transit funding reflects an individual’s perception of public transit funding from external sources (city, county, state, or federal) and has a significant direct effect on individual OLS.
Within the built environment latent factor, the most influential indicators were shopping and entertainment options, quality health care services, available jobs, and parks and recreation facilities (see Table 4). Policymakers should prioritize enhancing these aspects of the built environment. Similarly, the top three factors contributing to the quality of transportation were the quality of walkability, bikeability, and traffic safety (see Table 4). Investing in improving non-motorized transportation and improving road traffic safety will significantly improve community QOL.
Regarding transit funding, city, county, state, and federal governments should allocate necessary resources to public transit agencies to optimize service quality and enhance satisfaction with life for transit users.
Ease of travel impacts both community QOL and individual OLS, with a stronger effect on OLS (Std. R.W. = 0.163) compared to community QOL (Std. R.W. = 0.088). De Vos (2024) [66] conducted a comprehensive study on ease of travel and found that it is associated with higher subjective well-being. Providing efficient and more easily accessible travel options that meet daily travel needs can enhance the QOL of residents at both community and individual levels.
Perceived public transit importance negatively affects community QOL (Std. R.W. = −0.073). This likely includes transit-dependent populations, such as lower-income individuals, people who cannot drive, those with disabilities, and people without their own vehicle [5]. This finding suggests that in communities where residents perceive public transit as highly important, their overall QOL tends to be lower. The reason behind this finding may be that these communities experience inefficient or inadequate public transit options, leading to transportation challenges that negatively impact their daily life. Enhancing public transit services may improve their QOL.
Public transit need/support negatively affects individual OLS (Std. R.W. = −0.086), but has an insignificant impact on community QOL. This suggests that individuals who support more public transit services may feel the existing services are insufficient to meet their daily needs, leading to lower OLS. Additionally, people with greater transit needs are often low-income, in poor health, or unable to drive. The impact of community QOL on individual OLS (Std. R.W. = 0.298) is significant, indicating that a higher community QOL enhances individual life satisfaction.
Age, income, and health positively influence individual OLS, indicating that older individuals, those with higher incomes, and those in better health report higher life satisfaction. However, higher education and non-white status have a significant negative impact on OLS, which may be due to the higher goals and aspirations of more educated individuals or the systemic challenges faced by non-white populations. Gender also has a significant negative influence on an individual’s OLS, indicating women report slightly lower life satisfaction, possibly due to differential mobility constraints or safety perceptions.
The results emphasize that enhancing the built environment, access to amenities, transportation quality, and ease of travel can significantly improve both community and individual well-being. Urban and transport policies should promote walkable and well-connected neighborhoods that facilitate convenient access to essential destinations. Improving the comfort, reliability, and efficiency of public transport can further the community’s QOL and individual life satisfaction. The findings also highlighted the need for equitable mobility strategies that address unmet transit needs among vulnerable social groups, such as women, older adults, and low-income residents. Overall, integrated planning approaches that link land use, accessibility, and transportation equity are vital for fostering sustainable and inclusive communities. Figure 4 provides a visual representation of the significant relationships shown in Table 6, with standardized regression weights. Negative signs indicate the negative effects of independent variables on the respective dependent variables.
While the current findings are based on traditional measures of the built environment and transportation, it is important to acknowledge that the transportation landscape has been rapidly evolving in recent years. The emergence of electric vehicles (EVs), the integration of digital transport applications (e.g., real-time transit apps, mobility-as-a-service systems), and shared and on-demand mobility platforms are transforming accessibility and travel behavior. Moreover, the growing emphasis on sustainability and inclusion through active travel promotion, low-emission transport initiatives, and universal design offers new dimensions to community QOL. Future community livability surveys or similar national datasets should incorporate indicators reflecting these technological and policy transitions to better capture their influence on well-being outcomes.

4.3. Total Indirect Effects on Community QOL and an Individual’s OLS

SEM can assess both direct and indirect effects through mediating variables. In this study, the built environment and community QOL serve as the mediators (refer to Figure 4). For mediation to be valid, three conditions must be met: (1) the independent variable must be significantly related to the mediator, (2) the mediator must be significantly related to the final dependent variable, and (3) the relationship between the independent variable and the final dependent variable should diminish after including the mediator [67]. Additionally, the mediator must be theoretically appropriate. All these conditions were satisfied for the hypothesized mediating variables.
Table 7 presents the total indirect effects on community QOL and individual’s OLS. Access to amenities shows a significant positive indirect effect on community QOL (β = 0.128, p < 0.001), indicating that better access enhances overall community well-being. For individual outcomes, built environment (β = 0.136, p < 0.001), ease of travel (β = 0.026, p < 0.05), and quality of transportation (β = 0.056, p < 0.001) significantly and positively influence life satisfaction, suggesting that well-designed, accessible, and efficient transport environments contribute to individual well-being. In contrast, area type, public transit need, and support for transit funding show no significant indirect effects, while perceived importance of public transit has a small negative association (β = −0.022, p < 0.05), possibly reflecting unmet expectations regarding transit quality or availability. These findings highlight the critical role of accessibility, travel ease, and transport quality in shaping both community and individual life satisfaction.
5. Conclusions and Recommendations

This study uses SEM to evaluate the impact of various transportation factors, the built environment, and sociodemographic characteristics on community QOL and individual OLS. The findings reveal that improvements in the built environment have the most significant direct effect on enhancing community QOL. Public transit and walking access to amenities such as grocery stores, parks and recreation facilities, healthcare services, etc., improve both the built environment’s perceptions and community QOL. Additionally, enhancing non-motorized transportation (walking and biking) and public transit can improve community-level QOL. It can be concluded that providing safe, efficient, and accessible travel options to meet individuals’ daily travel needs will enhance QOL at both the community and individual levels. Another key finding is that transit-dependent populations, such as women, lower-income individuals, non-drivers, and those with disabilities, can benefit from more efficient public transit systems, which would improve their QOL. The negative effect of perceived public transit importance may indicate dissatisfaction with current services, reflecting the need for more efficient and equitable public transit provision. These findings suggest that improving the built environment, enhancing active and public transport options, and ensuring safe and convenient access to essential amenities can improve both community QOL and individuals’ OLS.
The study’s results are based on aggregate national survey data, which may not fully reflect local community dynamics. Some population groups, such as minorities, younger people, and individuals with lower education, were under-represented in the survey. Future research should examine whether these relationships hold in adequately represented population groups. Researchers should also explore local community-specific factors to provide insights for transportation planners and policymakers. Future models could integrate behavioral theories such as the Theory of Planned Behavior to capture psychological effects. Adding variables related to daily travel patterns, commuting stress, travel time reliability, or active travel could enhance understanding of how individual travel behaviors contribute to QOL outcomes. Future studies should utilize recent datasets incorporating real-time mobility, electric and automated vehicles, inclusive mobility innovations, and smart city indicators to examine how emerging transportation technologies continue to reshape accessibility, community QOL, and individual well-being. Additionally, future studies could adjust the formation of latent factors based on available data and the study’s hypothesis or introduce new latent factors that might influence QOL within the transportation and built environment domains.

Author Contributions

Conceptualization, M.A.K., R.P.G., J.M. and D.M.; methodology, M.A.K.; software, M.A.K.; validation, M.A.K., R.P.G., J.M. and D.M.; formal analysis, M.A.K., R.P.G., J.M. and D.M.; investigation, M.A.K., R.P.G. and J.M.; data curation, M.A.K.; writing—original draft preparation, M.A.K.; writing—review and editing, M.A.K., R.P.G., J.M. and D.M.; visualization, M.A.K.; supervision, R.P.G., J.M. and D.M. All authors have read and agreed to the published version of the manuscript.

Funding

This research received no external funding.

Data Availability Statement

The data presented in this study are available from the first and corresponding authors upon request.

Acknowledgments

During the preparation of this manuscript, the authors used an AI-assisted tool (ChatGPT-4) on a few occasions for the purpose of proofreading and improving readability. The authors have reviewed and edited the output and take full responsibility for the content of this publication. The authors are grateful for the insightful feedback from four anonymous reviewers that greatly enhanced the quality of the paper.

Conflicts of Interest

The authors declare no conflicts of interest.

References

  1. Atkinson, S. Beyond Components of Wellbeing: The Effects of Relational and Situated Assemblage. Topoi 2013, 32, 137–144. [Google Scholar] [CrossRef] [PubMed]
  2. Delbosc, A. The Role of Well-Being in Transport Policy. Transp. Policy 2012, 23, 25–33. [Google Scholar] [CrossRef]
  3. Pankewycz, O.G.; Gross, C.R.; Laftavi, M.R.; Gruessner, A.C. Quality of Life. In Transplantation of the Pancreas, 2nd ed.; Gruessner, R.W.G., Gruessner, A.C., Eds.; Springer: Cham, Switzerland, 2023; pp. 1039–1052. [Google Scholar] [CrossRef]
  4. Lee, R.J.; Sener, I.N. Transportation Planning and Quality of Life: Where Do They Intersect? Transp. Policy 2016, 48, 146–155. [Google Scholar] [CrossRef]
  5. Godavarthy, R.; Mattson, J. Exploring Transit’s Contribution to Livability in Rural Communities: Case Studies of the North Dakota Cities of Valley City and Dickinson. J. Public Transp. 2018, 21, 60–72. [Google Scholar] [CrossRef]
  6. Frank, L.D.; Sallis, J.F.; Conway, T.L.; Chapman, J.E.; Saelens, B.E.; Bachman, W. Many Pathways from Land Use to Health: Associations between Neighborhood Walkability and Active Transportation, Body Mass Index, and Air Quality. J. Am. Plan. Assoc. 2006, 72, 75–87. [Google Scholar] [CrossRef]
  7. Kwon, M.; Pickett, A.C.; Lee, Y.; Lee, S. Neighborhood Physical Environments, Recreational Wellbeing, and Psychological Health. Appl. Res. Qual. Life 2019, 14, 253–271. [Google Scholar] [CrossRef]
  8. Stanley, J.; Stanley, J. Public Transport and Social Policy Goals. Road Transp. Res. A J. Aust. N. Z. Res. Pract. 2007, 16, 20–30. [Google Scholar]
  9. Stanley, J.; Vella-Brodrick, D. The Usefulness of Social Exclusion to Inform Social Policy in Transport. Transp. Policy 2009, 16, 90–96. [Google Scholar] [CrossRef]
  10. Farquhar, M. Elderly People’s Definitions of Quality of Life. Soc. Sci. Med. 1995, 41, 1439–1446. [Google Scholar] [CrossRef] [PubMed]
  11. Felce, D.; Perry, J. Quality of Life: Its Definition and Measurement. Res. Dev. Disabil. 1995, 16, 51–74. [Google Scholar] [CrossRef] [PubMed]
  12. Sirgy, M.J.; Michalos, A.C.; Ferriss, A.L.; Easterlin, R.A.; Patrick, D.; Pavot, W. The Quality-of-Life (QOL) Research Movement: Past, Present, and Future. Soc. Indic. Res. 2006, 76, 343–466. [Google Scholar] [CrossRef]
  13. Diener, E. Subjective Well-Being: The Science of Happiness and a Proposal for a National Index. Am. Psychol. 2000, 55, 34–43. [Google Scholar] [CrossRef]
  14. Oswald, A.J.; Wu, S. Objective Confirmation of Subjective Measures of Human Well-Being: Evidence from the U.S.A. Science 2010, 327, 576–579. [Google Scholar] [CrossRef]
  15. Ferkany, M. The Objectivity of Wellbeing. Pac. Philos. Q. 2012, 93, 472–492. [Google Scholar] [CrossRef]
  16. Sarch, A.F. Multi-Component Theories of Well-being and Their Structure. Pac. Philos. Q. 2012, 93, 439–471. [Google Scholar] [CrossRef]
  17. Kyle, T.; Dunn, J.R. Effects of Housing Circumstances on Health, Quality of Life and Healthcare Use for People with Severe Mental Illness: A Review. Health Soc. Care Community 2007, 16, 1–15. [Google Scholar] [CrossRef] [PubMed]
  18. Drobnič, S.; Beham, B.; Präg, P. Good Job, Good Life? Working Conditions and Quality of Life in Europe. Soc. Indic. Res. 2010, 99, 205–225. [Google Scholar] [CrossRef]
  19. Bize, R.; Johnson, J.A.; Plotnikoff, R.C. Physical Activity Level and Health-Related Quality of Life in the General Adult Population: A Systematic Review. Prev. Med. 2007, 45, 401–415. [Google Scholar] [CrossRef] [PubMed]
  20. de Groot, J.; Steg, L. Impact of Transport Pricing on Quality of Life, Acceptability, and Intentions to Reduce Car Use: An Exploratory Study in Five European Countries. J. Transp. Geogr. 2006, 14, 463–470. [Google Scholar] [CrossRef]
  21. Bassett, D.R.; Pucher, J.; Buehler, R.; Thompson, D.L.; Crouter, S.E. Walking, Cycling, and Obesity Rates in Europe, North America, and Australia. J. Phys. Act. Health 2008, 5, 795–814. [Google Scholar] [CrossRef]
  22. Sener, I.N.; Lee, R.J.; Elgart, Z. Potential Health Implications and Health Cost Reductions of Transit-Induced Physical Activity. J. Transp. Health 2016, 3, 133–140. [Google Scholar] [CrossRef]
  23. Rojas-Rueda, D.; de Nazelle, A.; Teixidó, O.; Nieuwenhuijsen, M.J. Replacing Car Trips by Increasing Bike and Public Transport in the Greater Barcelona Metropolitan Area: A Health Impact Assessment Study. Environ. Int. 2012, 49, 100–109. [Google Scholar] [CrossRef]
  24. Ohlin, M.; Berg, H.-Y.; Lie, A.; Algurén, B. Long-Term Problems Influencing Health-Related Quality of Life after Road Traffic Injury—Differences between Bicyclists and Car Occupants. J. Transp. Health 2017, 4, 180–190. [Google Scholar] [CrossRef]
  25. Metz, D. Transport Policy for an Ageing Population. Transp. Rev. 2003, 23, 375–386. [Google Scholar] [CrossRef]
  26. Hart, J.; Parkhurst, G. Driven to Excess: Impacts of Motor Vehicles on the Quality of Life of Residents of Three Streets in Bristol UK. World Transp. Policy Pract. 2011, 17, 12–30. [Google Scholar]
  27. Velho, R. Transport Accessibility for Wheelchair Users: A Qualitative Analysis of Inclusion and Health. Int. J. Transp. Sci. Technol. 2019, 8, 103–115. [Google Scholar] [CrossRef]
  28. Social Exclusion Unit. Making the Connections: Transport and Social Exclusion; Cabinet Office: London, UK, 2003. [Google Scholar]
  29. Banister, D.; Bowling, A. Quality of Life for the Elderly: The Transport Dimension. Transp. Policy 2004, 11, 105–115. [Google Scholar] [CrossRef]
  30. Stanley, J.K.; Hensher, D.A.; Stanley, J.R.; Vella-Brodrick, D. Mobility, Social Exclusion and Well-Being: Exploring the Links. Transp. Res. Part A Policy Pract. 2011, 45, 789–801. [Google Scholar] [CrossRef]
  31. Bergstad, C.J.; Gamble, A.; Gärling, T.; Hagman, O.; Polk, M.; Ettema, D.; Friman, M.; Olsson, L.E. Subjective Well-Being Related to Satisfaction with Daily Travel. Transportation 2011, 38, 1–15. [Google Scholar] [CrossRef]
  32. Carse, A. Assessment of Transport Quality of Life as an Alternative Transport Appraisal Technique. J. Transp. Geogr. 2011, 19, 1037–1045. [Google Scholar] [CrossRef]
  33. Cao, J. The Association between Light Rail Transit and Satisfactions with Travel and Life: Evidence from Twin Cities. Transportation 2013, 40, 921–933. [Google Scholar] [CrossRef]
  34. Kolodinsky, J.M.; DeSisto, T.P.; Propen, D.; Putnam, M.E.; Roche, E.; Sawyer, W.R. It Is Not How Far You Go, It Is Whether You Can Get There: Modeling the Effects of Mobility on Quality of Life in Rural New England. J. Transp. Geogr. 2013, 31, 113–122. [Google Scholar] [CrossRef]
  35. Morris, E.A. Should We All Just Stay Home? Travel, out-of-Home Activities, and Life Satisfaction. Transp. Res. Part A Policy Pract. 2015, 78, 519–536. [Google Scholar] [CrossRef]
  36. Kim, J.; Schmöcker, J.-D.; Nakamura, T.; Uno, N.; Iwamoto, T. Integrated Impacts of Public Transport Travel and Travel Satisfaction on Quality of Life of Older People. Transp. Res. Part A Policy Pract. 2020, 138, 15–27. [Google Scholar] [CrossRef]
  37. Zhu, Z.; Li, Z.; Chen, H.; Liu, Y.; Zeng, J. Subjective Well-Being in China: How Much Does Commuting Matter? Transportation 2019, 46, 1505–1524. [Google Scholar] [CrossRef]
  38. Sun, B.; Lin, J.; Yin, C. How Does Commute Duration Affect Subjective Well-Being? A Case Study of Chinese Cities. Transportation 2021, 48, 885–908. [Google Scholar] [CrossRef]
  39. Herman, K.M.; Larouche, R. Active Commuting to Work or School: Associations with Subjective Well-Being and Work-Life Balance. J. Transp. Health 2021, 22, 101118. [Google Scholar] [CrossRef]
  40. Iamtrakul, P.; Chayphong, S.; Kantavat, P.; Hayashi, Y.; Kijsirikul, B.; Iwahori, Y. Exploring the Spatial Effects of Built Environment on Quality of Life Related Transportation by Integrating GIS and Deep Learning Approaches. Sustainability 2023, 15, 2785. [Google Scholar] [CrossRef]
  41. Hybel, J.; Mulalic, I. Transportation and Quality of Life. Transp. Res. Part A Policy Pract. 2022, 157, 107–125. [Google Scholar] [CrossRef]
  42. Mattson, J.; Brooks, J.; Godavarthy, R.; Quadrifoglio, L.; Jain, J.; Simek, C.; Sener, I. Transportation, Community Quality of Life, and Life Satisfaction in Metro and Non-Metro Areas of the United States. Wellbeing Space Soc. 2021, 2, 100056. [Google Scholar] [CrossRef]
  43. Tran, Y.; Hashimoto, N.; Ando, T.; Sato, T.; Konishi, N.; Takeda, Y.; Akamatsu, M. The Indirect Effect of Travel Mode Use on Subjective Well-Being through out-of-Home Activities. Transportation 2024, 51, 2359–2391. [Google Scholar] [CrossRef]
  44. Sarmiento, O.L.; Schmid, T.L.; Parra, D.C.; Díaz-del-Castillo, A.; Gómez, L.F.; Pratt, M.; Jacoby, E.; Pinzón, J.D.; Duperly, J. Quality of Life, Physical Activity, and Built Environment Characteristics Among Colombian Adults. J. Phys. Act. Health 2010, 7, S181–S195. [Google Scholar] [CrossRef]
  45. Gao, M.; Ahern, J.; Koshland, C.P. Perceived Built Environment and Health-Related Quality of Life in Four Types of Neighborhoods in Xi’an, China. Health Place 2016, 39, 110–115. [Google Scholar] [CrossRef]
  46. Mouratidis, K. Built Environment and Social Well-Being: How Does Urban Form Affect Social Life and Personal Relationships? Cities 2018, 74, 7–20. [Google Scholar] [CrossRef]
  47. Huang, N.-C.; Chu, C.; Kung, S.-F.; Hu, S.C. Association of the Built Environments and Health-Related Quality of Life in Community-Dwelling Older Adults: A Cross-Sectional Study. Qual. Life Res. 2019, 28, 2393–2407. [Google Scholar] [CrossRef] [PubMed]
  48. Yu, L.; Li, X.; Luo, Q. How Does the Built Environment in Urban Villages Affecting Ride-Sourcing Commuting Trips Interacting with the Spatial Dependence Effect. Appl. Sci. 2023, 13, 8921. [Google Scholar] [CrossRef]
  49. Mouratidis, K. Urban Planning and Quality of Life: A Review of Pathways Linking the Built Environment to Subjective Well-Being. Cities 2021, 115, 103229. [Google Scholar] [CrossRef]
  50. Lee, C.; Choi, S.; Yoon, J. The Influence of Access to Urban Amenities on Urban Environment Satisfaction: A Case Study of Four New Towns in the Vicinity of Seoul, South Korea. Appl. Res. Qual. Life 2023, 18, 3111–3139. [Google Scholar] [CrossRef]
  51. Kodali, H.P.; Hitch, L.; Dunlap, A.F.; Starvaggi, M.; Wyka, K.E.; Huang, T.T. A Systematic Review on the Relationship between the Built Environment and Children’s Quality of Life. BMC Public Health 2023, 23, 2472. [Google Scholar] [CrossRef]
  52. Godavarthy, R.; Mattson, J.; Brooks, J.; Jain, J.; Quadrifoglio, L.; Sener, I.; Simek, C. Transit and Livability: Results from the National Community Livability Survey; TRID: Washington, DC, USA, 2018. [Google Scholar]
  53. Kahneman, D.; Krueger, A.B. Developments in the Measurement of Subjective Well-Being. J. Econ. Perspect. 2006, 20, 3–24. [Google Scholar] [CrossRef]
  54. Bollen, K. Structural Equations with Latent Variables; Wiley: New York, NY, USA, 1989. [Google Scholar]
  55. Cassel, C.; Hackl, P.; Westlund, A.H. Robustness of Partial Least-Squares Method for Estimating Latent Variable Quality Structures. J. Appl. Stat. 1999, 26, 435–446. [Google Scholar] [CrossRef]
  56. Reinartz, W.; Haenlein, M.; Henseler, J. An Empirical Comparison of the Efficacy of Covariance-Based and Variance-Based SEM. Int. J. Res. Mark. 2009, 26, 332–344. [Google Scholar] [CrossRef]
  57. Hair, J.F., Jr.; Matthews, L.M.; Matthews, R.L.; Sarstedt, M. PLS-SEM or CB-SEM: Updated Guidelines on Which Method to Use. Int. J. Multivar. Data Anal. 2017, 1, 107. [Google Scholar] [CrossRef]
  58. Lei, M.; Lomax, R.G. The Effect of Varying Degrees of Nonnormality in Structural Equation Modeling. Struct. Equ. Model. 2005, 12, 1–27. [Google Scholar] [CrossRef]
  59. Schneider, I.E. Quality of Life: Assessment for Transportation Performance Measures; Minnesota Department of Transportation: Saint Paul, MN, USA, 2013. [Google Scholar]
  60. Najaf, P.; Thill, J.-C.; Zhang, W.; Fields, M.G. City-Level Urban Form and Traffic Safety: A Structural Equation Modeling Analysis of Direct and Indirect Effects. J. Transp. Geogr. 2018, 69, 257–270. [Google Scholar] [CrossRef]
  61. Hair, J.F.; Black, W.C.; Babin, B.J.; Anderson, R.E.; Tatham, R.L. Multivariate Data Analysis, 5th ed.; Prentice Hall: Hoboken, NJ, USA, 2006. [Google Scholar]
  62. Sarstedt, M.; Ringle, C.M.; Hair, J.F. Partial Least Squares Structural Equation Modeling. In Handbook of Market Research; Springer: Berlin/Heidelberg, Germany, 2021; pp. 587–632. [Google Scholar]
  63. Fornell, C.; Larcker, D.F. Evaluating Structural Equation Models with Unobservable Variables and Measurement Error. J. Mark. Res. 1981, 18, 39–50. [Google Scholar] [CrossRef]
  64. Hair, J.F.; Risher, J.J.; Sarstedt, M.; Ringle, C.M. When to Use and How to Report the Results of PLS-SEM. Eur. Bus. Rev. 2019, 31, 2–24. [Google Scholar] [CrossRef]
  65. Henseler, J.; Ringle, C.M.; Sarstedt, M. A New Criterion for Assessing Discriminant Validity in Variance-Based Structural Equation Modeling. J. Acad. Mark. Sci. 2015, 43, 115–135. [Google Scholar] [CrossRef]
  66. De Vos, J. The Ease of Travel: A Person-Based Measure of People’s Ability to Travel. Transp. Res. Part A Policy Pract. 2024, 187, 104174. [Google Scholar] [CrossRef]
  67. Baron, R.M.; Kenny, D.A. The Moderator–Mediator Variable Distinction in Social Psychological Research: Conceptual, Strategic, and Statistical Considerations. J. Pers. Soc. Psychol. 1986, 51, 1173–1182. [Google Scholar] [CrossRef]
Figure 1. Four U.S. Regions and Nine Census Divisions.
Urbansci 09 00490 g001
Figure 2. County Rural–Urban Continuum Code 2013, USDA ERS.
Urbansci 09 00490 g002
Figure 3. Proposed Effects of the Built Environment and Transportation on Community and Individual Well-being.
Urbansci 09 00490 g003
Figure 4. Calibrated SEM Representing the Significant Effects of the Built Environment and Transportation on Community and Individual Well-being. ***, **, * denote significance at 1%, 5%, and 10% levels respectively.
Urbansci 09 00490 g004
Table 1. Rural–Urban Continuum Codes.
CodeDescription
1Counties in metro areas of 1 million population or more
2Counties in metro areas of 250,000 to 1 million population
3Counties in metro areas of fewer than 250,000 population
4Urban population of 20,000 or more, adjacent to a metro area
5Urban population of 20,000 or more, not adjacent to a metro area
6Urban population of 2500 to 19,999, adjacent to a metro area
7Urban population of 2500 to 19,999, not adjacent to a metro area
8Completely rural or less than 2500 urban population, adjacent to a metro area
9Completely rural or less than 2500 urban population, not adjacent to a metro area
Table 2. Summary of Socio-demographic Characteristics of the Survey Respondents.
VariableMetro Area (n = 417)Non-Metro Area (n = 577)
Age07% 18–34 years09% 18–34 years
31% 35–54 years29% 35–54 years
48% 55–74 years47% 55–74 years
12% 75 years or above15% 75 years or above
Gender43% male, 57% female40% male, 60% female
Employment50% employed, 34% retired, 16% unemployed and students44% employed, 38% retired, 18% unemployed and students
Level of education17% high school graduate24% high school graduate
31% college and associate34% college and associate
27% bachelor’s degree24% bachelor’s degree
25% master’s or doctorate19% Master’s or doctorate
Physical disability11% physically disabled20% physically disabled
Health72% good, 25% fair, 3% poor69% good, 27% fair, 4% poor
Annual household income20% less than 24,999$22% less than 24,999$
19% 25,000–49,999$28% 25,000–49,999$
30% 50,000–99,999$31% 50,000–99,999$
31% greater than 100,000$19% greater than 100,000$
Race85% white91% white
Table 3. Summary Statistics of the Community QOL, Individual’s OLS, Built Environment, and Transportation-Related Variables.
VariableMetro Area (n = 417)Non-Metro Area (n = 577)
Built environment
Available Jobs3.2 (1.02)2.7 (1.05)
Cultural Institutions3.2 (1.05)2.8 (1.07)
Quality health care services3.8 (1.03)3.3 (1.05)
Quality public schools3.6 (0.99)3.5 (1.06)
Overall cost of living3.4 (0.99)3.3 (0.98)
Shopping and entertainment options3.3 (1.09)2.5 (1.03)
Parks and recreational facilities3.7 (0.97)3.4 (1.08)
Affordable transportation options3.04 (1.07)2.5 (1.04)
Sense of community3.0 (0.96)3.6 (0.99)
Access to amenities
Public transit access to amenities3.1 (0.94)2.8 (0.97)
Walk access to amenities3.3 (0.98)3.0 (1.01)
Quality of transportation
Quality of public transit services2.8 (1.19)2.2 (1.15)
Quality of bike-ability3.1 (1.10)2.9 (1.05)
Quality of walkability3.2 (1.06)3.2 (1.10)
Quality of road condition3.0 (1.02)3.0 (1.01)
Quality of traffic safety3.5 (0.90)3.8 (0.85)
Support for transit funding
Support from city funds3.6 (1.12)3.3 (1.21)
Support from county funds3.6 (1.08)3.3 (1.23)
Support from state funds3.7 (1.12)3.5 (1.22)
Support from federal funds3.7 (1.19)3.4 (1.27)
Perceived public transit importance 4.0 (1.09)3.6 (1.16)
Public transit support/need5% less, 44% same, 51% more7% less, 47% same, 45% more
Ease of Travel4.2 (0.87)4.1 (0.98)
Community QOL4.0 (0.90)3.8 (1.02)
Individual’s OLS7.8 (1.85)7.7 (2.05)
Values in parentheses represent standard deviations.
Table 4. Measurement Model’s Validity and Reliability.
Latent VariablesObserved VariablesFactor LoadingsComposite ReliabilityAverage Variance ExtractedCronbach’s Alpha
Built environmentQuality Health Care Services0.770.880.550.84
Parks and Recreation Facilities0.77
Quality Public Schools0.70
Cultural Institutions0.79
Shopping and Entertainment Options0.81
Available Jobs0.74
Overall Cost of Living0.63
Affordable Transportation Options0.71
Sense of Community0.69
Access to AmenitiesPublic Transit Access to Amenities0.810.810.680.71
Walk Access to Amenities0.85
Quality of TransportationQuality of Public Transit Services0.610.810.570.78
Quality of Bikeability0.75
Quality of Walkability0.78
Quality of Roads Conditions0.73
Traffic Safety0.74
Support for Transit FundingSupport City Funds0.750.930.780.93
Support County Funds0.83
Support State Funds0.96
Support Federal Funds0.96
Table 5. Discriminant Validity Results using Fornell–Larcker Criterion.
Access to AmenitiesBuilt EnvironmentQuality of TransportationTransit Funding
Access to Amenities0.827
Built Environment0.3810.671
Quality of Transportation0.3140.6520.682
Transit Funding0.2260.0190.0070.880
Table 6. Structural Model Results: Direct and Mediated Effects of Built Environment, Transportation, and Socio-Demographic Factors on Community QOL and Individual OLS.
Dependent VariablesIndependent VariablesStd. R.W.S.E.p-Value
Latent En. (Mediator)Latent Ex. Variables
Built EnvironmentAccess to Amenities0.2810.036<0.0001 ***
Observed En. (Mediator)Latent Ex. Variables
Community QOLBuilt environment0.4570.041<0.0001 ***
Quality of Transportation0.1880.040<0.0001 ***
Support for Transit Funding0.0150.0440.729
Access to Amenities0.0820.0330.013 **
Observed Ex. Variables
Ease of Travel0.0880.0340.009 ***
Perceived Transit Importance−0.0730.0370.050 **
Transit Need/Support-0.0080.0380.834
Area Type-0.0130.0300.659
Observed En. (Final)Observed En. (Mediator)
Individual’s OLSCommunity QOL0.2980.045<0.0001 ***
Latent Ex. Variables
Built environment0.0280.0550.613
Quality of Transportation−0.0350.0420.396
Support for Transit Funding0.0460.0490.060 *
Observed Ex. Variables
Ease of Travel0.1630.040<0.0001 ***
Perceived Transit Importance0.0370.0450.420
Transit Need/Support−0.0860.0400.031 **
Area Type0.0010.0340.525
Sociodemographic
Gender−0.1050.0630.097 *
Age0.1740.036<0.0001 ***
Income0.1050.0390.007 ***
Employment−0.0220.0380.563
Level of Education−0.0810.0370.029 **
Race/Ethnicity0.2630.1080.015 **
Disability−0.1570.1230.200
Health0.5510.086<0.0001 ***
En. denotes Endogenous, and Ex. denotes Exogenous. ***, **, * denote significance at 1%, 5%, and 10% levels respectively.
Table 7. Total Indirect Effects on Community QOL and Individual’s OLS (α = 0.05).
VariablesTotal Indirect Effectp-Value
Access to Amenities → Community QOL0.128<0.0001 ***
Area Type → Life Satisfaction−0.0040.666
Built environment → Individual’s OLS0.136<0.0001 ***
Ease of Travel → Individual’s OLS0.026<0.016 **
Quality of Transportation → Individual’s OLS0.056<0.0001 ***
Public Transit Need → Individual’s OLS−0.0020.835
Perceived Public Transit Importance → Individual’s OLS−0.022−0.056 *
Support for Transit Funding → Individual’s OLS0.0040.731
***, **, * denote significance at 1%, 5%, and 10% levels respectively.
Disclaimer/Publisher’s Note: The statements, opinions and data contained in all publications are solely those of the individual author(s) and contributor(s) and not of MDPI and/or the editor(s). MDPI and/or the editor(s) disclaim responsibility for any injury to people or property resulting from any ideas, methods, instructions or products referred to in the content.