


Abstract
Buildings in climate-vulnerable regions face critical challenges in reducing energy demand while supporting environmental and social resilience. In the Peruvian Amazon, off-grid riverine communities experience energy insecurity and seasonal flooding, threatening both the built environment and cultural continuity. This research presents a non-built architectural case study for an Indigenous community-based ecotourism lodge in Loreto, Peru. The methodology combines culturally informed passive bioclimatic strategies with design-stage quantitative calculations based on secondary sources, architectural programming assumptions, and a ten-year SENAMHI meteorological dataset (2014–2024). The proposed photovoltaic microgrid comprises 52 bifacial N-Type TOPCon modules (31.72 kWp) and a 286.3 kWh LiFePO4 battery system. Under the base demand scenario—defined by lighting loads, 180 standard outlets, an outlet simultaneity factor of 0.8, and an effective evening-use period of 5 h/day—the system is projected to cover modeled demand under average-month solar conditions. However, rainy-season performance remains conditional when bifacial gain is excluded, so the system is interpreted as preliminary off-grid sizing rather than evidence of continuous off-grid operation. Compared with a 30 kW diesel-generator baseline, the photovoltaic-battery configuration projects an 84.3% annual OPEX reduction. The design also estimates 570 L/day of biogas from a 2.0 m3 biodigester, 233,600 L/year of potable water savings, and proposes 152 Calycophyllum spruceanum and 15 Ceiba pentandra trees for NbS-based stabilization. These design-stage estimates suggest a reproducible research-by-design workflow for preliminary environmental, energetic, and socio-cultural evaluation of off-grid Amazonian ecotourism infrastructure.
1. Introduction
The Amazon Basin represents a highly sensitive ecosystem where indigenous communities face severe socio-environmental pressures exacerbated by acute infrastructural isolation. Access to electricity and other basic infrastructure remains highly uneven across Amazonia, particularly in remote and geographically isolated areas [1]. A critical manifestation of this vulnerability is the persistent energy gap; vast expanses of the territory are forced to operate under strict off-grid conditions, completely disconnected from centralized national electricity networks. This disconnection is clearly evidenced when mapping the superposition of above-ground biomass density and recognized indigenous territories [2] against the national power grids. Institutional data confirms this severe infrastructural gap across the Amazonian territories of Peru [3], Brazil [4], Ecuador [5], Colombia [6], and Bolivia [7] (Figure 1).
Figure 1.
Map illustrating the superposition of above-ground biomass density, recognized indigenous territories, and centralized national power grids in the Amazon Basin. Elaborated by the authors using Adobe Photoshop 2025.
In remote Amazonian contexts, diesel generators remain a common solution for isolated electricity supply because of their relatively low initial cost and rapid deployment; however, they involve recurrent fuel costs, greenhouse-gas emissions, noise, and fuel-transport risks [8]. Faced with this reality, tropical climatic conditions dictate that rural infrastructure should not rely on active climatization, requiring instead an explicit integration of passive environmental strategies and low-carbon materials [9]. Furthermore, architecture must evolve toward culturally adapted construction systems that respond to both thermal demands and the biophilic behavior of native communities [10]. Consequently, there remains a lack of architectural models specifically designed for infrastructures in Amazonian contexts that successfully integrate bioclimatic adaptation, respect for cultural practices, and preliminary off-grid energy performance simultaneously.
In response to structural vulnerabilities and acute energy isolation, various indigenous communities in the Peruvian Amazon—such as the Yagua, Matsigenka, and Shipibo-Konibo ethnic groups based on regional demographic data [11] (Figure 2)—have increasingly adopted community-based experiential tourism as a key strategy for socioeconomic resilience [12]. In these contexts, tourism does not replace traditional subsistence systems but operates as part of a diversified livelihood structure, in which households combine agriculture, forest-based activities (fishing, hunting, and resource use), and emerging monetary income sources [13]. Studies on tourism development in the Peruvian Amazon indicate that community-based tourism represents a relevant complementary source of income, particularly in communities with greater accessibility and organizational capacity [14]. This is evidenced in consolidated ecotourism models such as Casa Matsiguenka in Manu [15] and Posada Amazonas in Tambopata [16], where indigenous management has successfully integrated conservation and tourism-based economies.
Figure 2.
Spatial and economic characterization of indigenous communities in the Peruvian Amazon. (A) Territorial distribution map of recognized native communities. (B) Proportional distribution of livelihood sources and economic profit for selected communities, including the Yagua, Matsigenka, and Shipibo-Konibo. Elaborated by the authors using Adobe Photoshop 2025 and Google earth Pro.
This hybrid economic model reflects a gradual transition from subsistence and extractive economies toward more diversified systems linked to tourism and environmental conservation. Furthermore, experiential tourism enables the valorization of intangible cultural heritage—including traditional ecological knowledge, ritual practices, and vernacular spatial organization—transforming them into active economic assets [12]. However, reliable electricity supply remains a challenge for remote Amazonian ecolodges. A case study in the Bolivian Amazon documents the combined use of photovoltaic systems and a fuel-powered generator, and proposes expanded solar generation with battery storage to improve electricity services [17]. Therefore, architectural responses must move beyond conventional lodging typologies, proposing integrated systems that articulate vernacular spatial logic, decentralized renewable energy production, and circular metabolism strategies to ensure long-term socio-ecological sustainability.
The present research focuses on the Yagua native community, located along the banks of the Momón River, near Iquitos. Yagua culture is distinguished by a profound knowledge of the rainforest and the practice of invaluable ancestral traditions, such as hunting with the pucuna (blowgun), which symbolize a unique territorial connection [11]. Despite this richness, the history of the community has been marked by systemic vulnerabilities, ranging from social fragmentation during the rubber boom [18] to its current location in a peri-urban area subject to the pressure of unregulated extractive tourism (Figure 3).
Figure 3.
Spatial record of Yagua settlements. Circles and dashed lines indicate the historical spatial trajectory of Yagua settlements. (A) Putumayo River, Peru; (B) Amazon River; (C) Pebas area; (D) Inland areas of Ampiyacu; (E) Ramón Castilla and Las Amazonas Area; and (F) Loreto, Peru. Solid lines indicate Peru’s international borders with neighboring countries. Elaborated by the authors using Adobe Photoshop 2025.
Currently, the Yagua community of the Momón River operates in a context of high environmental vulnerability. Recent studies in the river basins of Loreto reveal that 79% of the population presents mercury levels above the permissible limits due to illegal mining [19]. Added to this water crisis is a severe loss of forest cover driven by massive illegal logging [20], and high climatic vulnerability manifested in extreme seasonal flooding, with 65% of the peripheral areas of Iquitos classified as having a “high” flood risk [21] (Figure 4). Facing these simultaneous processes of environmental degradation and cultural loss, coupled with a high dependence on external systems (off-grid isolation), current infrastructure is obsolete and unsustainable.
Figure 4.
Main issues: (A) Illegal mining in the Peruvian Amazon; (B) Forest burning; (C) Flooding in Iquitos; (D) Lack of basic services in native communities; and (E) Illegal logging in Loreto. Elaborated by authors using Adobe Photoshop 2025.
Within this context, the following research question arises: How can a design-stage architectural framework for community-based ecotourism in a flood-prone Amazonian context integrate culturally informed spatial criteria, passive bioclimatic design, and decentralized water-energy systems to support off-grid environmental performance? Based on this question, the present study is oriented toward the analysis and proposal of an ecotourism infrastructure that articulates bioclimatic architecture, circular water and energy systems, and cultural activation as the foundation for a territorially sustainable development model.
This article reports a non-built research-by-design case study. Its contribution is not the empirical validation of a built facility, but a transferable design-stage workflow that links secondary-source cultural interpretation, humid-tropical passive design criteria, and preliminary off-grid sizing of photovoltaic, water, and circular metabolism systems for Amazonian ecotourism infrastructure.
1.1. State of the Art
1.1.1. Indigenous Infrastructure
Community-based ecotourism has emerged as a key strategy for sustainable development in Indigenous territories by prioritizing local governance, direct benefit distribution, and environmental conservation [12,13]. In the Peruvian Amazon, experiences such as Posada Amazonas demonstrate that Indigenous-led tourism models can generate stable economic benefits while reinforcing territorial governance [16]. However, the recent literature highlights a critical gap: many ecotourism initiatives remain heavily reliant on external logistics and fossil fuels (e.g., diesel generators). To reduce cultural commodification and external dependence, sustainable tourism in remote Amazonian basins requires decentralized infrastructure that can support operational resilience without compromising the surrounding ecosystem [13,17].
1.1.2. Bioclimatic Design
Amazonian vernacular architecture has proven to be highly responsive to tropical humid conditions through passive strategies such as elevated stilt structures, steep palm-thatch roofs, and cross-ventilation [9,10]. These architectural forms embody Indigenous knowledge systems developed through long-term environmental interaction. Nevertheless, the progressive replacement of vernacular typologies with conventional industrial materials—such as concrete and corrugated metal—has exacerbated thermal discomfort and increased energy vulnerability in riverine settlements. Contemporary literature underscores the necessity of reinterpreting these traditional bio-materials through modern engineering frameworks, protecting them with extended eaves and modular logic to achieve low-carbon thermal resilience [9,22].
1.1.3. Off-Grid Microgrids
The transition from fossil fuels to renewable energy is critical for the resilience of isolated riverine settlements. While standard polycrystalline solar arrays are becoming more common in the Global South, their efficiency drops significantly under the high-humidity, high-temperature, and diffuse-light conditions typical of the Amazon rainforest. Recent advancements in energy studies highlight decentralized off-grid microgrids utilizing high-efficiency bifacial modules which capture albedo reflectance from water and terrain and recent advancements in energy studies highlight decentralized off-grid microgrids that combine high-efficiency photovoltaic modules with Battery Energy Storage Systems (BESS) as a promising pathway for reducing diesel dependence in isolated settlements [8]. However, in flood-prone Amazonian contexts, their operational reliability depends on seasonal solar radiation, demand variability, battery autonomy, maintenance conditions, and site-specific technical validation.
1.1.4. Circular Metabolism
This approach shifts architectural planning from a linear resource-consumption model to a closed-loop system. In rural Peru, models such as the Casa Blanca ecological farm validate the integration of continuous-flow biodigesters to transform organic waste into biogas and liquid fertilizer [23]. Despite its proven efficacy, the literature indicates a significant gap in scaling and adapting these metabolic systems within flood-prone ecotourism infrastructure. Implementing these systems is vital to reduce dependency on LPG (Liquefied Petroleum Gas) and to establish a sanitary, closed-loop nutrient cycle in ecologically sensitive riparian zones [23,24].
1.1.5. Nature-Based Solutions
Amazonian riverine settlements are exposed to extreme environmental conditions characterized by intense rainfall, riparian erosion, and seasonal river level fluctuations [25,26]. To address these vulnerabilities, current sustainability paradigms advocate for Nature-Based Solutions (NbS). Implementing NbS—such as constructed wetlands for greywater phytoremediation and targeted reforestation with native carbon-sequestering species—acts as a critical socio-ecological infrastructure [23,27]. This approach not only mitigates environmental degradation but actively regenerates the ecosystem, transforming the built environment from a passive consumer into an active participant in territorial climate adaptation [27].
2. Materials and Methods
2.1. Methodological Framework
This research is developed as a non-built research-by-design case study, focusing on the Yagua indigenous community located in the Momón River basin (Loreto, Peru). The methodological approach integrates a qualitative component, oriented toward socio-cultural interpretation, and a quantitative component, focused on environmental, climatic, and energetic analysis.
The methodological structure is organized into four sequential phases, defined through inputs, methods, outputs, and decision criteria, with the aim of ensuring the reproducibility of the process; this methodological framework is presented in Figure 5.
Figure 5.
Methodologic Scheme. Elaborated by authors in Adobe Illustrator 2025.
2.2. Methodological Stages
2.2.1. Literature Review and Conceptual Framework
In the initial phase, a focused literature review was conducted to establish the theoretical foundations connecting community-based experiential tourism, indigenous cultural identity, and off-grid sustainable architecture in the Amazonian context. To contextualize the socio-ecological and infrastructural dimensions of the study, data were collected from indexed scientific articles (Google Scholar 2015–2025), official institutional reports (MINCETUR, PROMPERÚ), anthropological studies on the Yagua community, and technical references on decentralized renewable energy and circular metabolism in tropical environments.
A qualitative thematic approach was used to organize the socio-cultural information gathered from secondary sources. The reviewed material was read comparatively in order to identify recurring references related to collective life, relationships with the riverine territory, material practices, spatial organization, and environmental vulnerability. These references were then grouped into thematic categories and used as preliminary design inputs. Rather than being transferred directly into form, the extracted themes were interpreted as criteria for spatial organization, circulation, communal use, threshold design, and environmental adaptation.
A comparative evaluation of consolidated ecotourism models in the Peruvian Amazon was also performed. Cases were intentionally selected based on three operative variables: community governance, integration of nature-based solutions, and operational continuity independent of centralized power grids. The literature filtering process prioritized references demonstrating direct applicability to flood-prone riverine environments, off-grid energy transition, and reduced dependence on extractive economic logics.
Ethically, the study was conducted strictly through secondary sources and institutional databases, without interviews, workshops, participant observation, or direct consultation with community members. For this reason, the socio-cultural interpretation should be understood as a preliminary, non-participatory reading of published information rather than an authorized cultural representation. To reduce the risk of overgeneralization or romanticization, only recurring themes with spatial or environmental relevance were retained as design criteria.
Ultimately, this phase generated the research conceptual framework, structured around five guiding axes derived from the state of the art: (1) Community-Based Ecotourism as a strategy for local governance; (2) Vernacular Architecture reinterpreted for passive efficiency; (3) Socio-Ecological Infrastructure to strengthen territorial resilience; (4) Circular Metabolism for decentralized management of water, energy, and soil; and (5) Climate Adaptation addressing flood vulnerability. Consequently, this framework redefines tourism infrastructure not merely as a building, but as an integrated design approach linking cultural interpretation, environmental adaptation, and decentralized resource management in isolated Amazonian environments.
2.2.2. Study Area, Climate Analysis, Flora, and Fauna
During the second phase, this study focused on the physical and environmental characterization of the intervention area in the Peruvian Amazon, with the aim of establishing criteria for the integration of ecosystem services within an experiential ecotourism project of a non-built nature. Climatic, geospatial, and biological data were collected to support the development of sustainable design strategies adapted to the low jungle environment.
Study Area
A detailed site analysis was conducted in the district of Punchana, province of Maynas, Loreto, Peru, within the Momon River basin, in order to delimit the project’s area of intervention. The study area was defined using Google Earth Pro 2025 [28] and official cartography from the Research Institute of the Peruvian Amazon (IIAP).
These tools were used to analyze the floodplain terrain, measure river connectivity, and determine the coordinates of the study area for a comprehensive understanding of the context. The geospatial analysis was carried out through the interpretation of satellite imagery, considering variables such as vegetation cover, settlement patterns, and ecosystem services (carbon sequestration, hydrological regulation, and potential for cultural tourism).
Climate Analysis
Additionally, climatological data were analyzed to address essential aspects such as air temperature, wind conditions, relative humidity, solar radiation, and precipitation. This process was used to develop the Givoni bioclimatic chart and to define the adaptive comfort framework based on ASHRAE 55, supporting passive and energy design decisions for naturally ventilated buildings in a humid tropical climate. The following procedure was followed to obtain the data:
Annual solar radiation data were extracted from the Solar Energy Atlas of Peru (SENAMHI), from which average solar radiation values (kWh/m2/day) for the study area were obtained [25]. These values were later used as input for the photovoltaic sizing procedure.
Meteorological records were collected from the SENAMHI AMAZONAS station in Iquitos for the ten-year period 2014–2024 [25]. The station is located in the Department of Loreto, Province of Maynas, District of Iquitos, at latitude 3°45′50.3″ S and longitude 73°15′17.7″ W, with an altitude of 113 m a.s.l. The station is registered as a conventional meteorological station under code 000154. These records provided monthly values of air temperature, precipitation, relative humidity, wind speed, and wind direction.
The Köppen climate classification was incorporated to define the intervention area as an Af humid tropical climate [29,30], characterized by high annual rainfall, high relative humidity, and limited seasonal thermal variation.
Monthly climatic data were processed through comparative analysis to identify representative climatic patterns for the study area. This procedure allowed the organization of temperature, humidity, precipitation, solar radiation, and wind parameters as the climatic baseline for the architectural proposal.
The Givoni bioclimatic chart was developed in AutoCAD 2024 using monthly temperature and relative humidity parameters. This chart was used as a preliminary tool to identify passive design zones, including natural ventilation, solar protection, evaporative-cooling limitations, and humidity-related constraints.
The ASHRAE 55 Adaptive Comfort Model was also incorporated as a theoretical reference for the later evaluation of operative temperature ranges in naturally ventilated and occupant-controlled spaces [31]. The corresponding adaptive comfort equations and acceptability ranges are applied in the Section 3.5.3 to compare the climatic baseline with the passive design response.
Finally, interpretive diagrams were developed to summarize solar radiation, wind direction, precipitation, temperature, relative humidity, and passive design implications. These outputs supported the definition of bioclimatic criteria such as shading devices, permeable building envelopes, elevated structures, roof ventilation, and cross-ventilation paths. This analysis corresponds to a design-stage theoretical approach based on climatic records and does not represent in situ thermal measurements, dynamic simulation, or post-occupancy validation.
Environmental Analysis of Flora and Fauna
The environmental analysis was conducted based on biodiversity inventories from IIAP and specialized literature, in order to define ecological criteria for the design process.
In flora, species selection was based on carbon capture capacity, ecological function, and traditional use, including Cedrela odorata, Swietenia macrophylla, Ochroma pyramidale, and Euterpe precatoria.
In fauna, the analysis was based on biological records of representative Amazonian species, including the pink river dolphin (Inia geoffrensis), giant river otter (Pteronura brasiliensis), and jaguar (Panthera onca). Criteria such as habitat requirements and sensitivity to disturbance were considered to establish parameters for ecological zoning (controlled observation and conservation areas) within the design process.
2.2.3. Design Development and Performance Assessmement
Site Analysis and Topography
In the first stage, the precise boundaries of the intervention area along the Momón River were established using Google Earth Pro 2025. This phase analyzed the topographical constraints, specifically focusing on the pronounced riverbank slope and the transition to the higher elevation terrace. The objective was to strategically position the intervention above the maximum flood level to mitigate seasonal hydroclimatic risks, confirming the river as the primary axis for connectivity and cultural subsistence.
Urban Analysis of the Surroundings of the Study Site
The second stage evaluated the broader context of the Yagua settlement. Utilizing Google Earth Pro and municipal cartographic databases to identify existing community facilities, this analysis mapped the building density, pedestrian accessibility, and the relationship between the proposed site and existing public spaces. This step ensured that the new infrastructure would respectfully integrate with the current community dynamics rather than disrupting them.
Master Plan Analysis
Based on geospatial analysis and site environmental evaluation, this stage identified flood risks and optimal solar orientation. The resulting master plan establishes four key functional zones—Welcome (Pier), Ritual (Plaza), Lodging (Bungalows), and Productive (Workshops)—integrating local heritage preservation with a circular economy model.
Analysis of Proposed Spaces
In the fourth stage, the conceptual zoning was translated into detailed spatial hierarchies. A comprehensive 3D model was developed using Rhinoceros 7 and D5 Render 2.1 to adapt vernacular construction techniques and organic roof structures to the tropical topography. This modeling process established a clear spatial hierarchy, separating public ceremonial areas from private lodging spaces to respect community privacy while optimizing the visitor experience.
Analysis of Applied Strategies
Finally, the fifth stage synthesized the passive and active environmental strategies. Bioclimatic comfort parameters, energy autonomy goals, and water management systems were integrated into the architectural design using the Givoni chart and drafted in AutoCAD 2024. This stage finalized the balance between traditional knowledge (ventilation, shading) and active off-grid systems (photovoltaics, biodigesters) using local materials, establishing the technical baseline illustrated in Figure 6.
Figure 6.
Methodological workflow diagram illustrating the sequential relationship between literature review, environmental analysis, design development, and performance assessment. Developed by the authors using Adobe Illustrator 2025.
To assess preliminary photovoltaic and battery sizing, demand was estimated using an approach based on usage scenarios, considering the number of users, occupancy profiles, the proposed built floor area, and types of electrical equipment. Because monitored consumption profiles were not available, the demand model was interpreted as a design-stage estimate rather than as measured operational demand. Three demand scenarios were defined according to outlet simultaneity: a low-demand case with a simultaneity factor of 0.6, a base-demand case with a factor of 0.8, and a high-demand case with a factor of 1.0. Lighting and emergency lighting were maintained at full availability, while an effective use period of 5 h/day was used to represent the main evening operating window.
The electrical-demand model was defined in relation to the passive architectural strategy. Since the proposal prioritizes natural ventilation, shaded transitional spaces, elevated floors, lightweight roofing, and permeable envelopes as the primary thermal-conditioning approach, the base-demand scenario does not include conventional mechanical-cooling loads. This assumption links the passive design strategy with the PV/BESS sizing, but it should be interpreted as a design-stage assumption rather than as a measured reduction in energy consumption.
A conventional Amazonian rural lodge relying on a 30 kW diesel generator was established as the baseline scenario. This methodological reference allowed the photovoltaic-battery configuration to be compared with diesel-based operation through a preliminary annual Operational Expenditure (OPEX) assessment.
Monthly electrical generation (E) was determined using Equation (1), integrating monthly solar-radiation variability:
E = P(kW) × R(kWh/m2/day) × ηp × days,
In this formulation, E represents the total energy produced in kilowatt-hours (kWh) during the analysis period; P denotes the installed photovoltaic capacity considered in the calculation, expressed in kWp; R corresponds to the average daily solar radiation in kWh/m2/day; ηp represents the photovoltaic system performance ratio; and days refers to the operational period. In the present study, the equation was applied to the proposed 52-module photovoltaic array, equivalent to an installed capacity of 31.72 kWp.
For this study, R was considered through two solar-radiation conditions: an average-month scenario and a critical rainy-season scenario corresponding to the lowest-radiation condition. This distinction was used to avoid relying only on a single annual average. The performance ratio (ηp) was adjusted within the 0.75–0.80 range to account for expected system losses, including high temperature, dust accumulation, wiring and inverter losses, partial shading, and surrounding vegetation [32]. The results tables report the base calculation using ηp = 0.80, while the broader range is retained as a methodological reference for sensitivity analysis.
To further account for uncertainty in the preliminary sizing process, a 20% safety margin (M) was applied to the modeled demand rather than to the expected photovoltaic generation, as defined in Equation (2):
Edesign = Edemand × (1 + M),
In this relationship, Edesign represents the adjusted design demand considered for preliminary sizing, Edemand is the modeled electrical demand for the evaluated scenario, and M corresponds to the 20% safety factor. This margin should be interpreted as an additional demand-side sizing reserve and not as an increase in expected photovoltaic output. The core energy-balance discussion is therefore based on the explicit average-month and worst-month photovoltaic production scenarios, while the 20% margin indicates an additional reserve that may be considered in later technical development.
Battery storage was dimensioned as a preliminary autonomy check based on the modeled daily demand and a two-day autonomy target without solar generation. The nominal storage capacity was calculated using Equation (3):
where Cnom is the nominal battery capacity, Ed is the modeled daily electrical demand, Daut is the number of autonomy days, and DoD is the selected Depth of Discharge. This equation was used to verify whether the proposed nominal battery capacity could theoretically support the base-demand scenario for two days before considering additional losses.
Cnom = (Ed × Daut)/DoD
A conservative battery sensitivity was also calculated by incorporating round-trip efficiency and a degradation or reliability reserve, as shown in Equation (4):
where Cnom,cons is the conservative nominal battery capacity, ηrt is the battery round-trip efficiency, and Rdeg is the degradation or reliability reserve factor. This second calculation was used to identify whether the preliminary storage capacity would remain sufficient after incorporating efficiency losses and long-term performance uncertainty.
Cnom,cons = (Ed × Daut)/(DoD × ηrt × Rdeg)
Finally, the photovoltaic-battery configuration was compared with the diesel-generator baseline through annual Operational Expenditure. The preliminary OPEX reduction in the photovoltaic-battery system relative to the diesel scenario was calculated using Equation (5):
where OPEXdiesel represents the estimated annual operational cost of the 30 kW diesel-generator baseline, including fuel, logistics, and maintenance; and OPEXPV represents the estimated annual operational cost of the photovoltaic-battery system, including maintenance and annualized component-replacement allowances. This comparison was limited to operational expenditure and does not represent a full life-cycle cost assessment.
OPEXreduction (%) = [(OPEXdiesel − OPEXPV)/OPEXdiesel] × 100
Therefore, the photovoltaic, battery, and OPEX calculations should be interpreted as design-stage estimates based on explicit assumptions rather than as measured or empirically validated operational performance.
The biodigester system was evaluated as part of the project’s circular-metabolism strategy for organic-waste treatment and renewable cooking-energy generation. Organic feedstock was estimated from the same peak design occupancy used in the PV/BESS assessment, corresponding to 25 guests and 8 staff members, for a total of 33 users. Daily organic-waste generation was estimated at 5.74 kg/day, based on an average rate of 0.174 kg/person/day.
The required biodigester volume was calculated using Equation (6), which incorporates the daily organic load, hydraulic retention time (HRT), and substrate density under mesophilic conditions typical of the Amazonian climate (26–30 °C). A design HRT of 25 days was adopted. Prior to digestion, the feedstock was assumed to be homogenized and diluted with harvested rainwater at a 1:10 ratio. The resulting slurry volume was used to define the active digester capacity. In Equation (6), Vd represents the biodigester volume (m3), L is the daily organic load (kg/day), HRT is the hydraulic retention time (days), and ρ is the substrate density (kg/m3).
Biogas production was estimated using a volatile-solids (VS) approach. Methane production was calculated using Equation (7), where volatile solids were used to estimate methane production through a conservative yield coefficient of 220 L CH4/kg VS. In Equation (7), CH4 is the methane production (L/day), VS is the volatile solids content (kg/day), and YCH4 is the methane yield coefficient, assumed as 220 L CH4/kg VS.
The VS content was quantified for each waste stream and converted into methane production using the adopted yield factor. Total biogas production was subsequently estimated using Equation (8), assuming a methane concentration of 60% in raw biogas. Operational losses, H2S removal, and moisture condensation were subsequently considered to estimate the effective biogas yield. In Equation (8), B represents total biogas production (L/day), CH4 is the methane production (L/day), and 0.60 corresponds to the methane fraction in raw biogas.
Finally, the effective biogas volume was converted into useful cooking energy using Equation (9), based on the lower heating value (LHV) of biogas and the thermal efficiency of a conventional biogas burner. In Equation (9), Eu is the useful cooking energy (kWh/day), B is the biogas production (m3/day), LHV is the lower heating value of biogas, and η represents the thermal efficiency of the burner.
Eu = B (B × LHV × η)/3.6
To ensure system viability in a vulnerable riverine environment, the model incorporates fundamental operational safety and environmental risk criteria. These include design protocols for gas leakage control, hydrogen sulfide (H2S) management, adequate ventilation in storage areas, and physical flood protection through the elevated placement of the infrastructure. This approach establishes the parameters for conceptual feasibility, acknowledging that the system will require detailed engineering in subsequent phases.
2.2.4. Discussion and Conclusions
Finally, in the last stage, a critical evaluation of the proposal was conducted. Given the limited specific architectural literature on off-grid Indigenous ecotourism infrastructure, the project was comparatively assessed against the conventional baseline model prevalent in the Amazon region: diesel-dependent, extractive tourism facilities that lack hydroclimatic adaptation.
This stage established a structured framework to evaluate how the proposed socio-ecological infrastructure, circular metabolism, and passive bioclimatic strategies overcome the vulnerabilities of the conventional baseline. Furthermore, to ensure methodological rigor, this final stage explicitly defined the parameters for assessing the limitations of the study—specifically regarding assumption-driven demand scenarios and the unbuilt nature of the project—while outlining the structural conditions required for the model’s transferability to other highly vulnerable riverine communities.
2.3. Site Analysis
The site analysis was conducted to define the spatial and environmental conditions of the intervention area within the Momon River basin, located in the district of Punchana (Figure 7C), province of Maynas (Figure 7B), Loreto (Figure 7A), Peru (3°36′18″ S, 73°15′22″ W) [28], as detailed in the macro-location maps in Figure 7. The analyzed area covers approximately 2.5 hectares and corresponds to a floodplain ecosystem characterized by seasonal variations in water levels.
Figure 7.
Project location: (A) Department of Loreto; (B) Province of Maynas; and (C) District of Punchana. Author-generated cartographic composition based on geospatial information obtained from official Peruvian administrative boundaries and satellite imagery accessed through Google Earth Pro 2025.
Geospatial analysis was performed using satellite imagery from Google Earth Pro 2025, with an estimated spatial resolution between 0.5 and 1 m/pixel, complemented by official cartographic data from the Research Institute of the Peruvian Amazon (IIAP). The analysis included the identification of vegetation density, river connectivity, flood-prone zones, and settlement patterns.
2.4. Climate Analysis and Design Strategies
According to the Köppen classification, the intervention area corresponds to an Af humid tropical climate [29,30]. The climate analysis was developed as a design-stage procedure to identify the environmental variables affecting passive design decisions in naturally ventilated buildings. The analysis considered air temperature, relative humidity, precipitation, wind speed and direction, and solar radiation.
Meteorological records were obtained from the SENAMHI AMAZONAS station in Iquitos for the ten-year period 2014–2024 [25]. The station is located in the Department of Loreto, Province of Maynas, District of Iquitos, at latitude 3°45′50.3″ S and longitude 73°15′17.7″ W, with an altitude of 113 m a.s.l. The station is registered as a conventional meteorological station under code 000154. The dataset included monthly air temperature, relative humidity, precipitation, and wind records.
The monthly temperature and relative humidity values were used to construct the Givoni bioclimatic chart in AutoCAD 2024. The chart was used as a preliminary tool to identify passive design zones, including natural ventilation, solar protection, evaporative-cooling limitations, and humidity-related constraints. The wind rose was used to identify prevailing wind directions and to support the orientation of openings and cross-ventilation paths. These outputs are presented in Figure 8A,B, while Figure 8C summarizes the passive design strategies derived from the climate-reading process.
Figure 8.
(A) Climate Analysis; (B) Bioclimatic Chart; and (C) Design Strategies. Elaborated by authors in Adobe Illustrator 2025.
Thermal comfort was evaluated as a theoretical design-stage approximation using the ASHRAE 55 Adaptive Comfort Model for occupant-controlled naturally conditioned spaces [31]. This model was selected because the proposed buildings are conceived as naturally ventilated spaces with operable openings and without continuous mechanical cooling during normal operation. The comfort analysis used operative temperature as the target indoor variable and prevailing mean outdoor temperature as the climatic input. For this preliminary assessment, the prevailing mean outdoor temperature was approximated using monthly mean outdoor air temperature values from the SENAMHI record [25].
The neutral adaptive comfort temperature was calculated as follows:
Tcomf = 0.31 × Tpma(out) + 17.8
The 80% acceptability range was defined as:
Tlower,80 = Tcomf − 3.5
Tupper,80 = Tcomf + 3.5
The 90% acceptability range was defined as:
where Tcomf is the neutral adaptive comfort temperature, Tpma(out) is the prevailing mean outdoor temperature, and Tlower and Tupper are the lower and upper operative-temperature limits for the selected acceptability range.
Tlower,90 = Tcomf − 2.5
Tupper,90 = Tcomf + 2.5
For the passive-design assessment, elevated air speeds were considered as design-stage sensitivity scenarios based on the cross-ventilation strategy. Air movement is promoted through operable openings oriented toward prevailing winds, opposed openings, permeable façades, elevated floors, and roof ventilation gaps. These velocities were not measured or simulated and therefore represent theoretical design assumptions rather than predicted indoor airflow.
Therefore, this section provides the climatic inputs, comfort model, and calculation rules used in the analysis; it does not represent in situ thermal monitoring, dynamic energy simulation, or post-occupancy validation.
2.5. Environment
2.5.1. Flora
The flora of the Amazonian environment of Iquitos is characterized by high functional diversity associated with hydrological dynamics, the seasonality of varzea floodplains, and the vertical stratification of the tropical rainforest (see Figure 9). The selection of species for the project considers criteria of climatic adaptation, provision of ecosystem services, and sociocultural relevance for Indigenous communities.
Figure 9.
Representative Flora Species and Ecosystem Services in the Study Area. Elaborated by authors in Adobe Illustrator 2025.
Arboreal species such as Cedrela odorata and Swietenia macrophylla exhibit carbon sequestration rates exceeding 100–150 kg CO2·individual−1·year−1, contributing significantly to the thermal and climatic regulation of the ecosystem [33,34]. Their deep root systems also enhance soil stability in riparian zones, reducing erosion associated with the dynamics of the Momon River.
Pioneer species such as Ochroma pyramidale (topa) and Cecropia spp. play a crucial role in ecological succession processes; their rapid growth enables early regeneration in disturbed areas and the creation of microhabitats that facilitate the recruitment of new species [35,36]. Ochroma pyramidale, in particular, has high water-use efficiency and optimal adaptability to precipitation regimes exceeding 2500 mm/year, a typical condition in Loreto [34].
Ethnobotanical Value Additionally, Amazonian flora includes species of strong ethnobotanical value for the Yagua community, such as Oenocarpus bataua (huasaí) and Euterpe precatoria (açai), used for food, oils, fibers, and cultural practices, and whose capacity to thrive in seasonally flooded soils ensures their ecological and sociocultural relevance [37]. Finally, herbaceous species such as Heliconia bihai and Costus scaber contribute to pollinator-support functions within tropical landscapes. Heliconia bihai is associated with hummingbird pollination, while Costus species are also visited by hummingbirds in neotropical systems [38,39].
Together, the selection of these species (see Table 1) ensures the integration of key ecological functions—carbon sequestration, water regulation, soil stabilization, and biodiversity support—with traditional and landscape uses, articulating conservation and experiential tourism within the proposal for the Yagua community.
Table 1.
Analysis Flora.
2.5.2. Fauna
The fauna of the Amazonian environment of Iquitos exhibits high functional diversity closely linked to riparian ecosystems, seasonally flooded forests, and cochas (oxbow lakes). Among the most representative species is the pink river dolphin (Inia geoffrensis), an emblematic aquatic mammal whose distribution depends on the connectivity between rivers, lakes, and varzea floodplains, making it a key indicator of water quality [40,41] (see Figure 10).
Figure 10.
Fauna. Elaborated by authors in Adobe Illustrator 2025.
At the aerial level, Amazonian macaws (Ara spp.) are particularly relevant to wildlife observation because of their conspicuous use of clay licks (collpas) in southeastern Peru, where large aggregations of psittacids can be observed. Their visibility also contributes to their value within tourism and conservation-oriented wildlife experiences [42,43]. The hoatzin (Opisthocomus hoazin), meanwhile, is a folivorous bird highly dependent on wetlands and inundated channels, acting as an ecological indicator of well-conserved swamp ecosystems [44].
Finally, in Table 2, within the functional soil fauna, earthworms of the genus Eisenia play an essential role in organic matter decomposition and soil regeneration, improving aeration, nutrient cycling, and structural stability in areas under community use [45,46,47]. Their presence in controlled management zones allows the integration of ecological restoration processes without interfering with the dynamics of Amazonian wildlife, complementing the ecosystem-based approach of the project.
Table 2.
Analysis fauna.
3. Results
3.1. Territorial Context and Environmental Vulnerability Assessment for Building Energy Performance
The primary result of the territorial evaluation established the boundary conditions and critical constraints for the intervention area along the Momón River, within the Yagua Indigenous community in the Punchana district (Figure 11). The geospatial assessment identified strict fluvial access as the sole connection to the site, confirming its profound isolation from centralized infrastructure.
Figure 11.
Project location within the Momón River basin. Analytical site-location map generated by the authors using satellite imagery from Google Earth Pro 2025. Elaborated by authors in Adobe Illustrator 2025.
Furthermore, the environmental analysis yielded critical physical parameters that dictate the project’s structural baseline: (1) a high vulnerability to seasonal flooding, as the site sits on a low river terrace characterized by the flat topography of the lowland Amazon; (2) severely limited soil drainage capacity due to the presence of acidic soils of fluvial origin typical of the lowland Amazon [21]; and (3) complete off-grid isolation from national energy networks [3]. The synthesis of these constraints confirms that conventional construction models are unviable in this environment. Consequently, these findings demand an elevated, resilient architectural response that enables the revalorization of Yagua culture and ecosystem conservation, autonomously managing its resources against the demanding hydrological dynamics of the Amazon Basin.
Topographic and hydrological conditions were assessed to determine areas suitable for construction, prioritizing zones with lower flood risk and direct accessibility from the river, which are illustrated in the cross-sectional profiles in Figure 12. The river was identified as the primary axis of mobility and cultural interaction, influencing the spatial organization of the proposal. This analysis provided the basis for defining the master plan and the location of architectural elements in relation to environmental constraints and ecosystem services.
Figure 12.
Topographic sections and visual context of the intervention area. Elaborated by authors in Adobe Photoshop 2025.
3.2. Fluvial Connectivity and Peri-Urban Dynamics
The urban context of the project is defined by its strategic relationship with the city of Iquitos and with the fluvial system that shapes its territorial dynamics. The proposal is inserted within the natural tourism corridor that begins at the FAP Francisco Secada Vignetta International Airport and continues toward the Nanay Port (Figure 13A), the metropolitan embarkation point that concentrates both tourist and local mobility [48]. From this point onward, the river becomes the primary infrastructure: the fluvial route toward Padre Cocha and subsequently to the Momón River establishes a sequence of nodes that progressively link the urban landscape with the Amazonian ecosystem. This condition underscores the historical dependence of Iquitos on the hydrographic system as the main axis of connectivity and reinforces the isolated—yet accessible—character of the Yagua settlement.
Figure 13.
Contextual maps: (A) Macro-scale connection between Iquitos City infrastructure and the Nanay River; and (B) Micro-scale placement of the intervention area along the Momón River. Analytical site-location map generated by the authors using satellite imagery from Google Earth Pro 2025. Elaborated by authors in Adobe Illustrator 2025.
In the immediate context (Figure 13B), the project is located at a key point where navigation routes, small-scale tourist facilities, and clusters of economic activity converge, allowing it to integrate into an existing value chain without altering the territorial structure. The linear configuration of the fluvial route and the proximity to consolidated resorts offer opportunities to establish strategic partnerships and visitor flow redistribution, supporting a model of regulated and culturally appropriate ecotourism.
Furthermore, the three-dimensional reading of the environment reveals a territory shaped by fluvial terraces, flood-prone riverbanks, and a landscape gradient that transitions from urban to forested environments [21]. This transition conditions both the location and the logic of the project, which is conceived as a threshold between the city and the rainforest, articulating mobility, landscape, and culture within a system coherent with the urban and ecological structure of the Momón River.
3.3. Architectural Concept and Socio-Cultural Integration
The architectural concept draws the qualitative interpretation of Yagua cultural references [11] derived from secondary sources and translates them into a spatial strategy for socio-ecological infrastructure. The spatial organization is governed by the dual metaphor of “The River and the Serpent,” which serves as the primary geometric device (Figure 14). Rather than a purely symbolic gesture, this axis structures the central circulation system, organically linking the programmatic components: vernacular-inspired modules, transitional thresholds, and communal plaza.
Figure 14.
Conceptual design diagram illustrating the translation of cultural references identified in the literature review into spatial organization principles. Elaborated by authors in Adobe Photoshop 2025.
The spatial genesis derives from the traditional maloca. While the ancestral maloca establishes a direct, direct connection with the earth, the environmental constraints of the flood-prone site (detailed in Section 3.1) required a structural adaptation [18]. The cultural philosophy of “emerging from the soil” is reinterpreted through expansive, open-plan gathering spaces for rituals and social cohesion, which are structurally elevated to ensure climate resilience without losing their communal openness [11]. Furthermore, the cultural significance of the color red [11]—derived from achiote (Bixa orellana) and prominent in Yagua attire—is integrated not merely as an aesthetic choice, but as a functional wayfinding mechanism and material identifier across the complex.
Consequently, the proposal seeks to reduce the risk of cultural simplification typical of extractive tourism models by translating cultural references into spatial, functional, and environmental design criteria instead of literal formal imitation. In this sense, the “serpent” path articulates the architectural modules, the riparian landscape, and the project narrative within a culturally informed but still preliminary design interpretation.
3.4. Spatial Organization and Functional Zonings
The spatial organization of the project is defined by a primary structural axis that functions both as a cultural catalyst for the Yagua community and as a technical device for organizing the off-grid infrastructure. This axis—inspired by the territorial metaphor of “The River and the Serpent” (detailed in Section 3.2)—determines the formal and functional hierarchy of the intervention, operating as the main circulation route, orientation system, and transitional boundary between public, ritual, and residential domains, as mapped in the spatial distribution of the Master Plan in Figure 15A.
Figure 15.
Project proposal: (A) Master Plan of the Yagua Ecotourism Center showing spatial distribution; and (B) Longitudinal section illustrating the building’s elevation relative to the riverbank profile. Elaborated by authors in Adobe Illustrator 2025.
Additionally, the longitudinal section in Figure 15B illustrates how this sequence adapts to the terrain, defining the building’s elevation relative to the riverbank profile to ensure structural resilience.
The spatial sequence is articulated to optimize both cultural integration and operational efficiency. The progression begins in Zone A (Entrance/Change of Scale), where visitors arrive from the river via the Pier-Embarcadero (1) and enter the Welcome Threshold (2), an area structurally designed to adapt to fluctuating water levels and ensure continuous access during peak flood seasons. From there, the layout transitions into Zone B (Rituals), the social and symbolic core of the project organized around the Central Plaza (14). This structurally elevated area functions as a multi-use stage for ceremonies and collective gatherings, maintaining its usability throughout the rainy season. Branching laterally from the main axis, Zone C (Lodging) provides acoustic separation for the Bungalows (7) and the Lodging Plaza (13), strategically utilizing the surrounding vegetation for optimal shading to reduce the potential mechanical-cooling demand considered in the PV/BESS sensitivity assessment (Figure 16). Complementing these spaces, Zone D (Experiential and Productive) concentrates the Workshops and Classrooms (3) alongside the Cultivation Areas (11) to facilitate craft education and agroforestry, integrating traditional ecological knowledge into the community-based tourism model. Taken as a whole, the Master Plan integrates principles of environmental sustainability through bioclimatic adaptation; the strategic distribution of the zones maximizes natural cross-ventilation, minimizes solar heat gain in critical areas, and incorporates Rainwater Harvesting Systems (4) distributed across the functional clusters. Consequently, the proposal establishes a living territory where the spatial organization directly supports the project’s off-grid autonomy, acting as a mediator between the Amazonian landscape, Yagua identity, and resilient community-based tourism.
Figure 16.
Illustrative architectural rendering of the proposed project. Elaborated by the author in D5 Render.
3.5. Integrated Architectural Strategies for Energy Efficiency and Renewable Autonomy
3.5.1. Vernacular Adaptation and Passive Energy Conditioning
Zone A functions as the primary bioclimatic interface of the project. To reduce the baseline cooling demand before sizing the off-grid photovoltaic system, the structural geometry is organized around passive environmental principles rather than mechanical cooling. As illustrated in the architectural and material analysis (Figure 17), the design prioritizes shaded transitional spaces, elevated construction, permeable enclosures, and cross-ventilation paths. Elevating the structure on stilts over the riverbank separates the occupied floor from seasonal flooding and ground humidity, while also allowing air movement below the platform. At the same time, operable and permeable openings are oriented in relation to the prevailing winds identified in the climate analysis, while opposed openings and the open spatial layout provide continuous inlet and outlet paths for cross-ventilation. The extended eaves increase the shaded perimeter of the building and reduce direct solar incidence on occupied spaces and openings, while still allowing diffuse daylight to enter the interior [49].
Figure 17.
Architectural and structural analysis of passive conditioning strategies in Zone A. (A) Exploded isometric view illustrating the material hierarchy from foundation to roof; (B) Shihuahuaco wood selection for primary surfaces; (C) detail of the beam-column assembly using Estoraque wood joinery; and (D) aerial render showing the elevated geometry, shaded roof perimeter, and cross-ventilation logic proposed for passive thermal conditioning. Elaborated By authors in D5 render.
The infrastructure supports this passive strategy through a contemporary reinterpretation of Amazonian vernacular architecture, using locally available timber species proposed for structural use, including Shihuahuaco and Estoraque, assembled through traditional-inspired joinery systems (Figure 17B,C). This material and structural approach seeks to reduce dependence on high-impact industrial construction systems while providing the elevated structural resilience required in a flood-prone riverine context. However, the environmental suitability of these timber species depends on legal, traceable, and sustainable sourcing, which should be verified in any future implementation stage.
By establishing the fluvial pier as the main access vector, the design reduces the need for disruptive terrestrial access infrastructure and preserves the continuity of the riparian landscape. In this sense, Zone A operates as a design-stage prototype for combining low-impact access, elevated flood adaptation, solar protection, and natural ventilation. Its passive performance should therefore be interpreted as an expected design contribution derived from climatic and architectural criteria, rather than as a field-validated thermal result.
3.5.2. Ecosystem-Based Strategies for Thermal Regulation and Carbon Reduction
Zone B (Ritual Zone) constitutes the symbolic and environmental core of the Master Plan, spatially articulating the “River and Serpent” metaphor. The configuration of the Central Plaza relies on a nature-based landscape strategy that integrates topography, vegetation, and ceremonial space to create an environment of strong Yagua identity. As shown in Figure 18A, this circular space functions as a permeable natural amphitheater that visually and acoustically regulates ritual activities while organizing pedestrian flows toward the secondary plazas (Figure 18B).
Figure 18.
Eco-social infrastructure: (A) Permeable Central Plaza integrating drainage systems; (B) Secondary Plaza; and (C) Technical section including stratified planting and slope stabilization. Elaborated by the authors in D5 Render.
As illustrated in the technical section in Figure 18C, the design incorporates a stratified vegetal system composed of native Amazonian species—such as Aguaje, Banana, Capirona, and Lupuna—selected for their ecological value. These species are distributed across slopes, edges, and platforms to fulfill differentiated ecosystem services: natural shading for thermal comfort, carbon sequestration, soil erosion control, and biodiversity support. This arrangement constructs a spatially integrated environment that frames collective dances and rituals while regenerating the riparian soil.
From a performance perspective, the plaza maximizes passive thermal regulation through natural cross-ventilation and vegetative shading, operating exclusively with solar lighting for nocturnal activities. Furthermore, the strategy integrates permeable pavements and sustainable drainage systems (SUDS) that manage natural infiltration and runoff. These landscape features are directly connected to the rainwater harvesting systems, creating a resilient surface adapted to the high humidity and intense rainfall of the Amazonian climate. By hosting ceremonies and oral narratives, the plaza structurally anchors an identity-bearing space that ensures the continuity of Yagua living culture.
The landscape strategy utilizes native species from the Amazonian rainforest that perform specific ecological functions. Calycophyllum spruceanum (Capirona) is used as a structural tree to stabilize slopes and riverbanks due to its flood resistance [34]; Musa × paradisiaca (Banana) supports soil protection and rapid biomass production in the understory [36]; Mauritia flexuosa (Aguaje) serves as a key species for wetland recovery and water regulation [37]; and Ceiba pentandra (Lupuna) is established as the emblematic emergent species [20]. This selection was validated through literature demonstrating high adaptability to hydromorphic soils and effective carbon fixation [33,34].
Table 3 details the estimated annual carbon sequestration values, canopy dimensions, and the precise allocation of the approximately 49,086 m2 of total afforested area. The total quantity of individuals per species was mathematically derived by dividing the specific assigned area percentage by the individual canopy area of each species, ensuring an accurate spatial distribution. The quantities, area allocations, and carbon sequestration values reported in Table 3 should be interpreted as design-stage estimates intended to support landscape planning and ecological restoration strategies rather than as precise forecasts of long-term carbon storage. Actual sequestration performance may vary according to planting density, species survival, growth rates, soil conditions, maintenance practices, and environmental variability. Consequently, the reported values are intended to indicate the relative ecological contribution of the proposed vegetation scheme rather than a guaranteed carbon offset outcome.
Table 3.
Carbon sequestration parameters and area allocation for native project species.
Ceiba pentandra stands out for its high carbon capture capacity (exceeding 150 kg CO2·year−1) and wide canopy, justifying its allocation of 15% of the green area as a strategic landmark [33]. Calycophyllum spruceanum shows a rate of 80–120 kg CO2·year−1, but its density and root strength contribute significantly to slope stability, covering 35% of the intervention area [34]. Mauritia flexuosa represents 25% of the area (40–60 kg CO2·year−1), essential for water regulation [37]. Finally, Musa × paradisiaca acts as a rapid vegetative cover that protects the soil from erosion during early succession stages, occupying the remaining 25% of the green space [36].
3.5.3. Passive Thermal Performance and Photovoltaic-Battery Energy Assessment
Before defining the passive design response, the adaptive comfort range was calculated using the ASHRAE 55 Adaptive Comfort Model defined in Section 2.4 [31]. Using the annual mean outdoor temperature of 26.5 °C as a preliminary approximation of the prevailing mean outdoor temperature, the neutral adaptive comfort temperature is estimated as follows:
T_comf = 0.31 × 26.5 + 17.8 = 26.0 °C
Accordingly, the 80% acceptability range is approximately 22.5–29.5 °C, while the 90% acceptability range is approximately 23.5–28.5 °C. The local climatic record indicates peak outdoor temperatures of approximately 31.5 °C [25]. This value is used as an external climatic design reference indicating warm outdoor conditions rather than as a quantified exceedance of the ASHRAE 55 indoor operative-temperature comfort limit. Consequently, the passive thermal strategies prioritize increased air movement, solar protection, roof shading, and envelope permeability.
As a simplified sensitivity assessment, the ASHRAE 55 elevated-air-speed adjustment was also considered. For the calculated upper 80% operative-temperature limit of 29.5 °C, air speeds of 0.6, 0.9, and 1.2 m/s increase the corresponding upper limits to approximately 30.7, 31.3, and 31.7 °C, respectively [31]. These values represent potential comfort-range extensions rather than predicted indoor temperatures.
The bioclimatic proposal integrates vernacular construction references with passive environmental control strategies derived from the climate analysis presented in Section 2.4. Rather than being interpreted as measured thermal performance, these strategies are evaluated as design-stage responses to the humid tropical conditions of the site. The passive approach is based on four main criteria: continuous cross-ventilation, solar protection, elevated floor structures, and lightweight breathable envelope materials.
The structural system uses locally available round timber and palm-thatch roofing to maintain a low-mass, ventilated construction logic consistent with Amazonian architectural practices. In thermal terms, the roof and envelope strategy is intended to reduce direct solar heat gain, increase shading over occupied spaces, and allow air movement through permeable and elevated building sections. The elevated platforms also separate occupied areas from seasonal ground humidity and flood exposure, while allowing air circulation below the floor.
The ventilation strategy does not rely on a solar chimney as a quantified passive-cooling device. Instead, the proposal prioritizes cross-ventilation through opposed openings, permeable façades, elevated floors, and roof ventilation gaps. This approach is consistent with the climate-reading process developed through the Givoni chart and the ASHRAE 55 adaptive comfort framework, where air movement is treated as a key design assumption for improving perceived comfort in naturally ventilated spaces. In this design-stage assessment, cross-ventilation is therefore presented as an expected passive performance mechanism rather than as a field-validated reduction in indoor temperature. The design-stage contributions of the proposed passive thermal strategies are summarized in Table 4.
Table 4.
Design-stage contribution of passive thermal strategies.
The passive design system is coordinated with active environmental technologies. The roof structure incorporates rainwater-harvesting gutters and photovoltaic mounting points, allowing the same architectural envelope to support water collection, shading, ventilation, and renewable-energy integration. Figure 19 illustrates this integration between passive cooling principles, roof-based water collection, and photovoltaic infrastructure.
Figure 19.
Bioclimatic and technological integration: Design-analysis diagram integrating passive cooling, rainwater harvesting, and photovoltaic systems. (A) Systemic integration of the water-energy cycle; (B) Detail of roof components, gutters, and solar panel fixation. Elaborated using D5 render.
Accordingly, these passive strategies are presented as preliminary design-stage performance indicators responding to warm-humid climatic conditions; their validation requirements are detailed in the Study Limitations section.
The project’s electrical supply was evaluated through a design-stage photovoltaic energy balance for the proposed ecotourism complex. The model is based on a decentralized photovoltaic microgrid composed of 52 high-efficiency 610 W bifacial N-Type TOPCon modules [50,51], equivalent to an installed capacity of 31.72 kWp. Rather than treating the system as evidence of continuous off-grid operation, the calculation estimates the potential correspondence between the modeled electrical demand and the expected photovoltaic production under average and critical rainy-season solar conditions.
The electrical demand estimate was linked to the architectural programme of the complex, which includes approximately 2000 m2 of built area, 15 lodging units, communal/ritual areas, workshop spaces, service areas, and a design occupancy of 25 guests and 8 staff during the main evening-use period. The load schedule includes 100 LED luminaires, 15 emergency lights associated with the lodging units, one central Wi-Fi unit, and 180 standard power outlets distributed across lodging, communal, workshop, and service areas. The number of outlets does not imply continuous full use of all sockets; instead, outlet use was treated through simultaneity factors to represent different occupancy and device-charging conditions. Photovoltaic sizing was based on the estimated annual energy demand, local solar irradiation conditions, and a performance ratio (PR) of 0.80.
The electrical demand estimate was linked to the architectural programme of the complex, which includes approximately 2000 m2 of built area, 15 lodging units, communal/ritual areas, workshop spaces, service areas, and a peak design occupancy of 25 guests and 8 staff during the main evening-use period. The load schedule includes 100 LED luminaires, 15 emergency lights associated with the lodging units, one central Wi-Fi unit, and 180 standard power outlets distributed across lodging, communal, workshop, and service areas. The number of outlets does not imply continuous full use of all sockets; instead, outlet use was treated through simultaneity factors to represent different occupancy and device-charging conditions. The base-demand scenario does not include conventional mechanical-cooling loads because the proposal relies on passive thermal-conditioning strategies as the primary architectural response. Photovoltaic sizing was therefore based on the estimated electrical demand, local solar irradiation conditions, and a performance ratio of 0.80. The main photovoltaic system parameters used in the design-stage energy balance are summarized in Table 5.
Table 5.
Photovoltaic system parameters used for the design-stage energy balance.
To clarify the demand-side assumptions, Table 6 presents the base-case load schedule. In this base case, outlet demand dominates the modeled peak load, representing approximately 94.3% of the total maximum demand. This confirms that the energy balance is highly sensitive to the simultaneity of guest device charging and service-related outlet use, who typically require simultaneous charging of multiple electronic devices (cameras, drones, mobile phones, and power banks) upon returning to their bungalows from off-grid daytime excursions.
Table 6.
Maximum electrical demand calculation (Total Project).
The peak demand was estimated from the quantity of installed devices, their nominal power ratings, and the diversity factors presented in Table 6.
Because the modeled demand is strongly influenced by outlet simultaneity, three demand scenarios were calculated instead of relying on a single deterministic value [52]. The low, base, and high scenarios use outlet simultaneity factors of 0.6, 0.8, and 1.0, respectively. The effective operating window was maintained at 5 h/day, corresponding to the evening period when guests return to the lodge, lighting is required, and electronic devices are charged. The annual energy demand was calculated from the estimated peak demand and the assumed effective operating period of 5 h/day corresponding to the main occupancy period of the ecotourism complex. The resulting low-, base-, and high-demand scenarios are summarized in Table 7.
Table 7.
Electrical demand scenarios based on outlet simultaneity.
The annualized values were calculated from twelve representative 30-day operational months and should therefore be interpreted as design-stage annualized estimates rather than monitored annual electricity consumption.
To make the relationship between passive design and PV/BESS sizing explicit, a mechanically cooled reference scenario was added as a design-stage sensitivity. This reference scenario assumes the same 15 lodging units and the same 5 h/day evening-use period, but adds one small split-type cooling unit per bungalow. Based on Panasonic technical specifications for the ClimaPure™ XZ Series XZ9AKUA mini-split system [53], which reports a cooling capacity of 8700 BTU/h and a cooling input power of 530 W, a reference value of 0.53 kW per lodging unit was adopted for this simplified comparison.
Under this assumption, the additional mechanical-cooling demand would be 15 × 0.53 kW × 5 h/day = 39.75 kWh/day. Consequently, the base-demand scenario would increase from 114.53 kWh/day to approximately 154.28 kWh/day, equivalent to an additional 1192.5 kWh/month. Under the same photovoltaic calculation framework, this additional cooling load would require approximately 15 additional 610 W modules under average-month solar conditions, or approximately 20 additional modules under worst-month rainy-season conditions. This comparison is presented only as a reference-case sensitivity and not as a measured energy-saving result, since no dynamic energy simulation or monitored cooling demand was conducted.
Photovoltaic production was estimated using the same generation method described in the methodology. The results reported below use PR = 0.80 as the base-case value. The average-month production scenario uses 5.5 kWh/m2/day, while the worst-month rainy-season scenario uses 4.2 kWh/m2/day [25]. These scenarios were used to compare expected photovoltaic production against the modeled demand without relying only on a single annual average. Therefore, the following balance should be interpreted as a design-stage estimate under average and critical solar-radiation conditions, not as a guarantee of continuous off-grid operation. The resulting photovoltaic production estimates under average- and worst-month solar conditions are summarized in Table 8.
Table 8.
Photovoltaic production under average and worst–month solar conditions.
The +10% bifacial gain was not used as a necessary component of the core autonomy proof. It was included only as an optimistic sensitivity scenario because the actual rear-side contribution of bifacial modules depends on site-specific parameters that were not measured in this design-stage study, including river-water and walkway albedo, module tilt, mounting height, row spacing, vegetation shading, humidity, soiling, and maintenance conditions. Consequently, the base-case energy balance should be interpreted without bifacial gain, while the +10% case represents a favorable scenario requiring future site-specific validation.
Table 9 compares the modeled monthly demand with the estimated photovoltaic production. The 31.72 kWp array covers the low-demand scenario in both average and worst-month conditions. It also covers the base-demand scenario under average-month solar radiation, with a surplus of 751.14 kWh/month. However, under worst-month rainy-season conditions, the base scenario presents a deficit of 238.52 kWh/month when bifacial gain is excluded. If the 10% bifacial gain is included as an optimistic sensitivity, the worst-month base scenario becomes only marginally positive, with a surplus of 81.21 kWh/month.
Table 9.
Monthly energy balance by demand and solar-production scenario.
These results indicate that the proposed 52-module photovoltaic array is suitable for the modeled average-month base scenario. However, rainy-season performance remains conditional. Under the worst-month base case without bifacial gain, the system presents a deficit of 238.52 kWh/month, while the +10% bifacial sensitivity produces only a marginal surplus of 81.21 kWh/month. If the design objective is to close the base-demand balance during the worst month without relying on bifacial gain, the array would need to increase from 52 to approximately 56 modules under the same simplified calculation framework. If the 20% design-capacity margin is applied, a larger array would be required in later technical development.
The Battery Energy Storage System was therefore interpreted as a preliminary design-stage sizing rather than proof of uninterrupted operation. The current 286.3 kWh nominal LiFePO4 battery capacity, at 80% Depth of Discharge, provides approximately 229.0 kWh of usable storage. This is almost equal to two days of the modeled base daily demand before considering round-trip efficiency, degradation reserve, or critical-load prioritization. A more conservative battery sensitivity, including 90% round-trip efficiency and a 90% degradation/reliability reserve, would increase the recommended nominal storage capacity to approximately 353.5 kWh.
To clarify the sensitivity of the two-day autonomy claim, the usable battery storage was compared against the low, base, and high demand scenarios defined above. At 80% Depth of Discharge, the 286.3 kWh nominal LiFePO4 battery provides approximately 229.0 kWh of usable storage. In the base-demand scenario, two days of autonomy require 229.06 kWh before losses, which is almost equal to the usable storage available; therefore, the remaining reserve before losses is approximately 0 kWh. This confirms that the two-day autonomy claim applies only to the modeled base-demand scenario before considering round-trip efficiency, degradation reserve, or critical-load prioritization. The resulting battery-autonomy sensitivity across the three demand scenarios is summarized in Table 10.
Table 10.
Battery autonomy sensitivity by demand scenario.
When a conservative sensitivity is applied to the base-demand scenario, including 90% round-trip efficiency and a 90% degradation/reliability reserve, the recommended nominal storage capacity increases from 286.3 kWh to approximately 353.5 kWh.
As a preliminary operational comparison, the photovoltaic-battery configuration was evaluated against a conventional diesel-generator baseline. This comparison was limited to annual Operational Expenditure (OPEX) and does not represent a full life-cycle cost assessment. The reference case assumes a 30 kW diesel generator serving the same modeled electrical demand, while the photovoltaic case includes annual maintenance and annualized component-replacement allowances. Under these assumptions, the diesel baseline results in an estimated annual OPEX of USD 20,553, whereas the photovoltaic-battery alternative results in an estimated annualized OPEX of USD 3226. This represents a projected annual operational-cost reduction of approximately 84.3%. The resulting annual OPEX comparison is summarized in Table 11.
Table 11.
Preliminary annual OPEX comparison between diesel and photovoltaic-battery operation.
This result should be interpreted as a design-stage economic projection rather than verified operational saving. The comparison is sensitive to diesel fuel price, river transport cost, generator loading factor, maintenance frequency, battery replacement interval, inverter replacement, and the final installed cost of the photovoltaic system. Therefore, the OPEX reduction indicates the potential economic advantage of reducing diesel dependence in remote Amazonian conditions, but it should be verified through a detailed techno-economic analysis in subsequent project phases.
Overall, the photovoltaic and battery system should be understood as a preliminary design-stage off-grid energy configuration with quantified performance limits. The 52-module, 31.72 kWp array is projected to cover the modeled base-demand scenario under average-month solar conditions, while its rainy-season performance remains conditional under the worst-month scenario, particularly when bifacial gain is excluded from the core calculation. Similarly, the 286.3 kWh LiFePO4 battery capacity provides a preliminary two-day autonomy estimate at 80% DoD for the base-demand scenario, but a more conservative storage configuration would be required if round-trip efficiency, degradation reserve, and critical-load prioritization are incorporated. The preliminary OPEX comparison suggests a potential operational-cost advantage over diesel-based supply; however, this result remains sensitive to fuel price, river logistics, maintenance frequency, and component replacement assumptions. Therefore, the proposed system should be presented as a preliminary off-grid configuration with technical potential that requires detailed techno-economic modeling, monitored demand profiles, and site-specific photovoltaic and battery performance validation in subsequent project phases.
3.5.4. Circular Metabolism: Waste-to-Energy and Integrated Water Cycle
Complementing the photovoltaic-battery autonomy, the project integrates a circular metabolic system in Zone C (Services and Lodging), designed to transform the complex’s organic waste into useful cooking energy and organic fertilizers. As detailed in the metabolic flow diagram in Figure 20, this biogas–vermicomposting–compost system achieves up to 80% of the modeled low-demand cooking-energy requirement while supporting the recovery of nutrients through biol and stabilized solids [54].
Figure 20.
Metabolic cycle of the Biogas Strategy: anaerobic digestion process, storage, and byproduct utilization. Elaborated by authors in Adobe Photoshop 2025.
Complementing the photovoltaic-battery system, the project integrates a circular metabolic system in Zone C (Services and Lodging), designed to transform the complex’s organic waste into useful cooking energy and organic fertilizers. As detailed in the metabolic flow diagram in Figure 20, this biogas–vermicomposting–compost system is estimated to cover up to 80%.
The biodigester feedstock is derived from two organic waste streams generated by the complex’s peak design occupancy of 33 users, corresponding to 25 guests and 8 staff members. This occupancy criterion was aligned with the PV/BESS demand scenario to avoid inconsistencies between the energy and circular-metabolism calculations. Based on an average organic-waste generation rate of 0.174 kg/person/day, the total daily feedstock was estimated at 5.74 kg/day. This amount was divided into kitchen fruit and vegetable scraps, equivalent to 2.87 kg/day with a volatile-solids content of 85%, and agroforestry garden biomass, equivalent to 2.87 kg/day with a volatile-solids content of 75%.
The digester volume was calculated using Equation (6), with a daily organic load of 5.74 kg/day, a Hydraulic Retention Time (HRT) of 25 days, and a substrate density (ρ) of 1.0 kg/L. Before dilution, this organic load corresponds to an approximate substrate volume of 143.5 L over the selected retention period. However, prior to digestion, the feedstock was assumed to be homogenized and diluted with harvested rainwater at a 1:10 ratio, producing approximately 63 L/day of slurry. Over a 25-day HRT, this results in an active slurry volume of approximately 1.58 m3. Therefore, a 2.0 m3 biodigester was adopted as a preliminary design capacity to include active volume, gas headspace, operational reserve, and fluctuations in daily feedstock input.
The system operates under ambient mesophilic conditions (26–30 °C), consistent with the annual mean temperature of 26.5 °C recorded at the Iquitos SENAMHI station (2014–2024), and a pH range of 6.8–7.5 was considered as the target operating range for stable methanogenesis.
Volatile solids available per day total approximately 4.59 kg VS/day, composed of 2.44 kg VS/day from kitchen fruit and vegetable scraps and 2.15 kg VS/day from agroforestry garden biomass. Applying a conservative methane yield of 220 L CH4/kg VS for mixed organic feedstocks, following anaerobic digestion design references [ 54], daily methane production is estimated at approximately 1010 L CH4/day. Assuming a CH4 content of 60% in the raw biogas, the theoretical biogas volume is approximately 1684 L/day. Accounting for system start-up losses, H2S biofilter removal, moisture condensation, and operational variability through an overall conservative efficiency factor of 0.34, the effective design output is approximately 570 L biogas/day.
To convert this volume to useful cooking energy, the lower heating value of biogas at 60% CH4 content was applied (LHV = 21.5 MJ/m3). For an effective biogas output of 0.57 m3/day, the gross energy content is approximately 12.26 MJ/day. Considering a biogas burner thermal efficiency of 55%, the net useful cooking energy is approximately 6.74 MJ/day, equivalent to 1.87 kWh/day. Against a scaled low-demand cooking-energy requirement of approximately 8.47 MJ/day for 33 users, this represents an estimated coverage of approximately 80%. Therefore, the 80% value should be interpreted as a modeled low-demand cooking-energy coverage scenario rather than as full cooking-energy autonomy.
Through anaerobic digestion, the system additionally generates biol (liquid fertilizer) and stabilized solids transferred to vermiculture modules, supporting the recovery of nutrients within the productive landscape strategy.
Operational safety is addressed through a set of integrated protocols adapted to the flood-prone riparian context of the Momón River. Regarding flood anchoring and elevation, the digester tanks and gas storage components are structurally anchored to the elevated platform system, positioned above the maximum recorded flood level (+2 m), preventing displacement or structural failure during seasonal flood events. Gas leakage is mitigated through automated pressure relief valves and a closed-circuit conveyance system with leak-detection joints; all gas pipes are routed above floor level to prevent submersion. H2S control is achieved through a biological biofilter installed at the digester outlet, which removes hydrogen sulfide and moisture prior to kitchen distribution, protecting both equipment and occupants. Backflow prevention is ensured by one-way check valves on the gas line between the digester and the stove connection, avoiding reverse flow during pressure fluctuations. Ventilation of the digester and gas storage areas is supported by their open-air placement under the elevated structure, maintaining natural cross-ventilation consistent with the passive bioclimatic strategy of the complex. Sanitation risks associated with digestate handling are managed through the physical separation of the biol (liquid effluent) outlet from water harvesting zones, and by routing stabilized solids directly to enclosed vermiculture modules, preventing contact with users or food areas. Finally, maintenance responsibilities are assigned to trained community staff following a monthly inspection protocol covering valve integrity, biofilter replacement, gas pressure monitoring, and digester inlet cleaning, supporting operational continuity while reducing dependence on external technical assistance.
Regarding the cooking-energy balance, the kitchen equipment requires an estimated biogas flow rate of 200–250 L/h. The conservative production of approximately 570 L/day is compatible with a two-hour low-demand cooking window under the modeled operating assumptions. In energy terms, the useful biogas output of approximately 6.74 MJ/day covers about 80% of the scaled low-demand cooking-energy requirement of 8.47 MJ/day for 33 users.
Economically, the system was also adjusted to the 33-user scenario. Assuming a scaled preliminary implementation cost of approximately USD 320 for the 2.0 m3 biodigester and a projected annual gross benefit of approximately USD 398, derived from scaled LPG substitution and fertilizer-production value, the simple payback period is approximately 0.80 years. This payback value should be interpreted as a preliminary design-stage estimate before maintenance; replacement, operational variability, and real biogas-yield losses are incorporated.
The technical precedent for this implementation is informed by the Casa Blanca project in the Lurín Valley, where a 10 m3 Chinese-model biodigester processes organic matter to produce biogas for cooking and biol for agroecological application [23]. In the Casa Blanca model, biogas is stored in recycled tire chambers to maintain pressure, while artificial wetlands with papyrus filter the effluents. This precedent supports the feasibility of integrating biodigesters, composting, and vegetated filters in the Peruvian context, although the proposed 2.0 m3 system would require site-specific technical validation before implementation in a flood-prone Amazonian environment.
Finally, the water system in Zone C follows a circular metabolic approach that supports partial closure of the water cycle within the complex [55]. As detailed in the hydraulic flow diagram in Figure 21, the process begins with rainwater harvesting. Due to the limitations of traditional palm thatching for direct collection, a secondary waterproof membrane or discreet gutter system is installed beneath the roof to redirect runoff toward primary downspouts. The collected water passes through coarse filtration and a first-flush, discarding the initial pollutant-loaded runoff.
Figure 21.
Integrated water cycle strategy: Rainwater harvesting, filtration, and greywater treatment via constructed wetlands. Elaborated by authors in Adobe Photoshop 2025.
Advanced filtration—combining mechanical filters, activated carbon, UV treatment, and small doses of hypochlorous acid—provides treated service water for selected non-potable uses. Subsequently, greywater is channeled to a primary treatment system consisting of sedimentation, grease separation, and homogenization. The pretreated effluent flows into constructed wetlands, designed as gravel beds with native macrophytes. These wetlands operate through physical filtration, microbial biofilms, and phytoremediation to remove organic matter and nutrients efficiently.
This ecological treatment produces water suitable for landscape irrigation and agroforestry, preventing pollutant discharge into soils or nearby waterways—a critical condition in the Momón River basin, where environmental pressures are high [19,20].
The rainwater-harvesting system was evaluated as a design-stage strategy for reducing dependence on external potable water supply by substituting non-potable service demands. The modeled non-potable demand includes toilet flushing, laundry, cleaning, irrigation, and bio-garden/vermicompost uses, totaling approximately 640 L/day. On an annual basis, this represents a projected substitution of 233,600 L/year.
The volumetric viability of this substitution was checked using the rational water-balance equation V = A × P × C, where V is the annual rainwater capture potential, A is the effective catchment roof area, P is annual precipitation, and C is the runoff coefficient. Considering an effective catchment roof area of approximately 105 m2, an annual precipitation value of 2800 mm/year, and a runoff coefficient of 0.8 for the waterproof membrane and gutter system, the theoretical annual capture potential is approximately 235,200 L/year. Therefore, the reported 233,600 L/year saving does not correspond to the maximum capture from a 60 m2 roof area; rather, it represents the projected annual substitution of non-potable demand using the effective catchment area, local precipitation records, runoff efficiency, and integrated storage assumptions.
This projected substitution reduces the need for externally supplied potable water for service uses and supports the circular water-management strategy of the complex. Economically, the estimated annual saving associated with this substitution is approximately USD 187, allowing for a projected investment payback period of approximately 3 years and 8 months under the assumed cost conditions. However, both the water-saving and payback values should be interpreted as design-stage estimates rather than field-validated results. Seasonal variability, first-flush losses, storage capacity, maintenance, collection efficiency, and real user demand may reduce the effective annual yield and should be verified in future technical development.
To preliminarily assess the economic feasibility of the proposed off-grid infrastructure, a design-stage comparison was conducted based on estimated Capital Expenditure (CAPEX) and Operational Expenditure (OPEX) savings. The metabolic systems suggest potential economic benefits under the assumed cost and performance conditions, but these values require future verification through detailed technical design, monitored operation, and maintenance cost assessment.
4. Discussion
The analysis of the Yagua Experiential Ecotourism Center reveals how the integration of vernacular logic with contemporary technologies can generate resilient architectural models adapted to the highly vulnerable Amazonian context. Just as projects like Posada Amazonas [16] and the Casa Blanca [23] ecological farm have set regional benchmarks for community tourism and metabolic circularity, this proposal scales these approaches to address the specific challenges of the flood-prone Momón River basin. In terms of biosustainability, the project stands out for its systemic integration with the riparian landscape, exceeding the standard conservation approach of conventional Amazonian lodges. While regional precedents often focus on passively preserving the forest, this proposal actively regenerates the ecosystem through a Nature-Based Solutions (NbS) reforestation strategy [27,51]. The planting scheme includes approximately 152 individuals of Calycophyllum spruceanum for slope stabilization and 15 of Ceiba pentandra as canopy landmarks, the infrastructure creates an active carbon sink [33,34]. Furthermore, whereas traditional rural settlements and extractive lodges often discharge effluents directly into rivers, this project implements a Net-Zero Water cycle comparable to the Casa Blanca model [23]. The use of constructed wetlands allows for the safe treatment and reuse of greywater, estimating an annual saving of 233,600 L of potable water and demonstrating that architectural infrastructure can function as a restorative environmental device [55,56].
From a bioconstruction perspective, the use of local materials acts as a determining factor for both durability and cultural coherence. Similar to the vernacular approaches observed in recent ethno-architecture studies [9,10], the Yagua Center utilizes round timber and palm thatching (Iriartea deltoidea). However, it innovates by integrating these organic materials with a modular structural logic elevated on stilts to withstand extreme seasonal flooding (+2 m). Unlike conventional contemporary construction in Iquitos that prioritizes concrete and corrugated metal—creating thermal islands and disjointed riparian landscapes—this proposal suggests that bio-materials, when designed with structural protection like extended eaves, offer superior hygroscopic performance and a significantly lower carbon footprint [49,50].
This project presents a design stage alternative with potentially improved operational performance relative to the modeled diesel-generator baseline. The proposal incorporates a photovoltaic microgrid composed of 52 bifacial N-Type TOPCon modules, equivalent to 31.72 kWp, together with a 286.3 kWh LiFePO4 battery system. Under the modeled assumptions, the photovoltaic array covers the base-demand scenario during average-month solar conditions. However, under the worst-month rainy-season condition, the base scenario presents a deficit of 238.52 kWh/month when bifacial gain is excluded. Only when an optimistic and unvalidated 10% bifacial gain is included does the balance become marginally positive, with a surplus of 81.21 kWh/month. Therefore, rainy-season performance should be considered conditional rather than guaranteed. The biodigester is projected to generate approximately 570 L/day of biogas and cover up to 80% of the modeled low-demand cooking-energy requirement. Taken together, these systems could reduce dependence on diesel-based operation and are projected to produce an 84.3% annual OPEX reduction relative to the modeled diesel baseline, subject to future technical and field validation.
Because the assessment was conducted at the design stage, the reported energy-generation, water-capture, and biogas values represent calculated potentials rather than field-measured performance. The electrical-demand model is based on assumed outlet-simultaneity factors and an effective evening-use period rather than monitored occupancy profiles. Under the worst-month solar-radiation condition, the current array does not fully cover the modeled base demand when bifacial gain is excluded. Furthermore, the optimistic 10% bifacial-gain scenario requires site-specific validation because its actual contribution will depend on albedo, module tilt, mounting height, vegetation shading, humidity, soiling, and maintenance conditions. Future research should therefore incorporate monitored demand profiles, detailed photovoltaic simulation, battery-loss modeling, and field-based performance validation.
Study Limitations
The findings of this study should be interpreted within the scope of a research-based architectural proposal developed at the design stage. Although the project integrates territorial analysis, environmental assessment, bioclimatic design strategies, renewable energy planning, and circular resource-management systems, its environmental and operational performance has not yet been validated through construction, long-term monitoring, dynamic simulation, or post-occupancy evaluation. Therefore, the reported thermal, energy, water, biogas, economic, and ecological values should be understood as design-stage estimates or projections rather than as measured or field-validated performance results.
The passive thermal assessment was based on climatic records, the Givoni bioclimatic chart, and the ASHRAE 55 adaptive comfort model. However, no in situ indoor thermal measurements, Computational Fluid Dynamics (CFD) analysis, or dynamic building-energy simulation were conducted. Consequently, the passive strategies proposed—cross-ventilation, solar protection, elevated floor construction, lightweight roofing, and permeable envelopes—should be interpreted as expected passive-performance indicators derived from climatic and architectural criteria, not as verified reductions in indoor operative temperature.
The photovoltaic and battery assessment was also developed as a preliminary design-stage energy balance. The modeled autonomy depends on assumptions regarding daily electrical demand, outlet simultaneity, effective operating hours, solar radiation, performance ratio, battery Depth of Discharge, and system losses. In particular, bifacial photovoltaic gain was treated only as an optimistic sensitivity case because site-specific parameters such as albedo, module tilt, mounting height, vegetation cover, humidity, soiling, and shading were not measured. Similarly, the proposed battery capacity provides a preliminary autonomy estimate and does not account fully for long-term degradation, round-trip efficiency, critical-load prioritization, or operational uncertainty under remote Amazonian conditions.
The preliminary OPEX comparison between the photovoltaic-battery configuration and a diesel-generator baseline should not be interpreted as a full life-cycle cost assessment. The projected operational-cost reduction remains sensitive to diesel fuel price, river transport logistics, generator loading factor, maintenance frequency, battery replacement intervals, inverter replacement, and the final installed cost of the renewable-energy system. Further techno-economic analysis would be required before confirming the long-term financial feasibility of the proposed system.
A further limitation concerns the socio-cultural interpretation of Yagua identity and spatial practices. The study relied exclusively on secondary anthropological, institutional, and contextual sources. No interviews, workshops, participant observation, community consultation, or co-design process were conducted during this phase. Therefore, the cultural references used in the architectural proposal should be interpreted as preliminary design criteria rather than as an authorized representation of Yagua culture. Before any implementation, the proposal would require participatory validation with the Yagua community, including discussion of cultural representation, governance, tourism use, benefit distribution, and the acceptability of the proposed spatial and symbolic references.
Climatic, hydrological, ecological, and operational analyses were based on available datasets and simplified design assumptions. As a result, future research should focus on detailed thermal simulation, field monitoring, photovoltaic and battery performance validation, water-system testing, community-based participatory review, and long-term operational assessment under real remote Amazonian conditions.
5. Conclusions
This study proposes and preliminarily evaluates an energy-efficient architectural design integrated with decentralized renewable-energy and circular-resource systems for a climate-vulnerable Amazonian community. The proposal combines passive bioclimatic strategies, photovoltaic generation, battery storage, biogas production, rainwater harvesting, and ecosystem-based landscape interventions within a culturally informed architectural framework.
Under the modeled assumptions, the 31.72 kWp photovoltaic array is projected to cover the base-demand scenario during average-month solar conditions. However, under the worst-month rainy-season condition, the base scenario presents a deficit of 238.52 kWh/month when bifacial gain is excluded. The balance becomes marginally positive only when an optimistic 10% bifacial gain is considered, producing a modeled surplus of 81.21 kWh/month. Rainy-season energy autonomy must therefore be interpreted as conditional rather than guaranteed. Similarly, the proposed 286.3 kWh battery provides approximately two days of base-demand autonomy before accounting for round-trip efficiency, degradation, reliability reserves, and critical-load prioritization.
The preliminary economic comparison projects an 84.3% reduction in annual OPEX relative to the modeled diesel-generator baseline. This result, together with the modeled biogas and water-management outcomes, should be interpreted as a preliminary projection subject to technical and field validation.
Overall, the findings suggest that integrating culturally informed passive design with decentralized renewable-energy and circular-resource systems has the potential to improve the environmental and operational resilience of off-grid Amazonian infrastructure. The principal contribution of the study is therefore a potentially transferable research-by-design workflow for preliminary decision-making in off-grid Amazonian infrastructure. Future research should incorporate participatory validation with the Yagua community, detailed energy and thermal simulations, monitored demand profiles, site-specific bifacial-performance assessment, and long-term post-occupancy evaluation.
Author Contributions
Conceptualization, B.B.B.P., R.A.P.B. and J.V.C.; methodology, D.E. and J.V.C.; software, B.A.F.Z.; validation, D.E. and J.V.C.; formal analysis, A.A.-B. and L.A.C.T.; investigation, B.B.B.P., R.A.P.B. and J.V.C.; resources, K.M.A.P.; data curation, J.V.C.; writing—original draft preparation, B.B.B.P., R.A.P.B. and J.V.C.; writing—review and editing, B.B.B.P., R.A.P.B. and J.V.C.; visualization, B.B.B.P. and R.A.P.B.; supervision, D.E. and J.V.C.; project administration, J.V.C.; funding acquisition, B.A.F.Z., K.M.A.P., A.A.-B. and L.A.C.T. All authors have read and agreed to the published version of the manuscript.
Funding
This research received no external funding.
Institutional Review Board Statement
Not applicable.
Informed Consent Statement
Not applicable.
Data Availability Statement
All the data is in the manuscript.
Acknowledgments
We sincerely thank our colleagues for their collaboration and support in the development of the architectural design proposal titled “Energy-Efficient Architectural Design Integrating Renewable Energy for Community Resilience in the Peruvian Amazon”.
Conflicts of Interest
The authors declare no conflicts of interest.
References
- Inter-American Development Bank (IDB). Infrastructure for Access to Basic Services in Amazonia; IDB Publications: Washington, DC, USA, 2023; Available online: https://publications.iadb.org (accessed on 11 April 2026).
- NASA Earth Science. Comunidades Indígenas Protegen el Amazonas. National Aeronautics and Space Administration. Available online: https://ciencia.nasa.gov/ciencias-terrestres/comunidades-indigenas-protegen-el-amazonas/ (accessed on 11 April 2026).
- Organismo Supervisor de la Inversión en Energía y Minería (OSINERGMIN). Mapa del Sistema Eléctrico Interconectado Nacional (SEIN)—Visor Mapa SEIN. Gobierno del Perú. Available online: https://gisem.osinergmin.gob.pe/nuevo_mapasein/ (accessed on 10 September 2026).
- Operador Nacional do Sistema Elétrico (ONS). Mapas do Sistema Interligado Nacional (SIN). Ministério de Minas e Energia, Brasil. Available online: https://www.ons.org.br/paginas/sobre-o-sin/mapas (accessed on 11 April 2026).
- Agencia de Regulación y Control de Electricidad (ARCONEL). Mapa No. 1: Infraestructura Eléctrica del Ecuador; ARCONEL: Quito, Ecuador, 2026. Available online: https://arconel.gob.ec/mapas-del-sector-electrico/ (accessed on 10 September 2026).
- Unidad de Planeación Minero Energética (UPME). Sistema de Información Eléctrico Colombiano. Ministerio de Minas y Energía, Colombia. Available online: https://www.upme.gov.co/ (accessed on 11 April 2026).
- Ministerio de Hidrocarburos y Energías (MHE). Mapa Eléctrico 2025; Viceministerio de Electricidad y Energías Alternativas: Bolivia, 2025. Available online: https://geoportal.mhe.gob.bo/maps/794 (accessed on 10 September 2026).
- Salari, S.; Etminan, A.; Jamil, M. Design and performance evaluation of a hybrid renewable energy system integrating wind, diesel generators, and battery storage for remote communities. Energies 2026, 19, 1676. [Google Scholar] [CrossRef] [Scilit]
- Vilchez Cairo, J.; Sanchez Grandez, T.Y.; Hidalgo Cabrera, D.N.; Medrano Canchari, L.F.; Tornero Loayza, J.R.; Esenarro, D.; Cavani Grau, C.M.; Cobeñas Cabrera, M.R. Low-Carbon and Bioclimatic Design for a Sustainable Interpretation and Research Center for Ecosystem Conservation in Madre de Dios, Peru. Clean Technol. 2026, 8, 37. [Google Scholar] [CrossRef] [Scilit]
- Esenarro, D.; Perez, J.; Navarro, A.; Ricaldi, R.; Vilchez Cairo, J.; Alvarado Perez, K.M.; Aguilar Vizcarra, D.; Rios Navio, J. Biophilic Strategies for Sustainable Educational Buildings in Amazonian Rural Contexts: An Agricultural School for the Asheninka Community. Architecture 2026, 6, 58. [Google Scholar] [CrossRef] [Scilit]
- Base de Datos de Pueblos Indígenas u Originarios (BDPI). Pueblo Yagua; Ministerio de Cultura: Lima, Peru, 2015; Available online: https://bdpi.cultura.gob.pe/pueblos/yagua (accessed on 11 April 2026).
- Chaparro Ortiz de Zevallos, A. Los Yagua en el contexto del turismo étnico. La construcción de la cultura para el consumo en el caso de Nuevo Perú. Anthropologica 2008, 26, 113–142. [Google Scholar] [CrossRef] [Scilit]
- Ministerio de Comercio Exterior y Turismo. Reporte Regional de Turismo Loreto-Año 2023; Ministerio de Comercio Exterior y Turismo: Lima, Perú, 2024; Available online: https://cdn.www.gob.pe/uploads/document/file/4688069/4315787-rrt_loreto_ano2023.pdf?v=1711487113 (accessed on 12 April 2026).
- MINCETUR. Diagnóstico de Turismo Comunitario en la Amazonía Peruana; Dirección General de Estrategia Turística: Lima, Peru, 2023; Available online: https://www.gob.pe/7609-ministerio-de-comercio-exterior-y-turismo-direccion-general-de-estrategia-turistica (accessed on 10 September 2026).
- SERNANP; Frankfurt Zoological Society (FZS). Gestión Indígena del Ecoturismo en el Manu: El Caso Casa Matsiguenka; SERNANP: Lima, Peru, 2020; Available online: https://peru.fzs.org/noticias/turismo-en-el-manu-casa-matsiguenka-lista-para-recibir-visitantes/ (accessed on 10 September 2026).
- Nature and Culture International. Posada Amazonas: Indigenous Ecotourism Case Study; Nature and Culture International: San Diego, CA, USA, 2021; Available online: https://natureandculture.org (accessed on 12 September 2025).
- Egido, M.A.; Solórzano, J.; Fernández, M. Towards Energy Sustainability in Ecolodges for Latin America: A Case in the Bolivian Amazon. In Proceedings of the 7th International Conference on PV-Hybrid and Mini-Grid, Bad Hersfeld, Germany, 10–11 April 2014; pp. 1–6. Available online: https://oa.upm.es/36745/ (accessed on 10 September 2026).
- Chirif, A. El Caucho, un Auge Pagado con la Vida de Miles de Indígenas; Centro Amazónico de Antropología y Aplicación Práctica (CAAAP): Lima, Peru, 2017; Available online: https://www.caaap.org.pe/publicaciones/ (accessed on 11 April 2026).
- Sierra Praeli, Y. La amenaza del Mercurio: El 79% de la Población de Seis Comunidades Nativas de Loreto Presenta Niveles Por Encima de los Límites Permitidos. Mongabay Latam, 25 June 2025. Available online: https://es.mongabay.com/2025/06/amenaza-mercurio-comunidades-indigenas-loreto-presenta-niveles-altos/ (accessed on 11 April 2026).
- Centro Amazónico de Antropología y Aplicación Práctica (CAAAP). El 100% de Toda la Tala de Bosques en Loreto Y Ucayali Desde 2012 a 2018 Es Ilegal, Revela Informe; CAAAP: Lima, Peru, 2024; Available online: https://caaap.org.pe/el-100-de-toda-la-tala-de-bosques-en-loreto-y-ucayali-desde-2012-a-2018-es-ilegal-revela-informe/ (accessed on 11 April 2026).
- Soria-Díaz, H.; Camarasa-Belmonte, A.; Carmona, P. Riesgo de inundación de la ciudad de Iquitos, Perú. Cienc. Amaz. 2015, 5, 11. [Google Scholar] [CrossRef] [Scilit]
- Vilchez Cairo, J.; Rodriguez Chumpitaz, A.N.; Esenarro, D.; Ruiz Huaman, C.; Alfaro Aucca, C.; Ruiz Reyes, R.; Veliz, M. Green Infrastructure and the Growth of Ecotourism at the Ollantaytambo Archaeological Site, Urubamba Province, Peru, 2024. Urban Sci. 2025, 9, 317. [Google Scholar] [CrossRef] [Scilit]
- Uyejara Abanto, E.; Mujica Yépez, A.E. El proyecto Casa Blanca, Vivir y Producir en Armonía con la Naturaleza. Apuntes–Revista Digital de Arquitectura. 14 April 2017. Available online: https://apuntesdearquitecturadigital.blogspot.com (accessed on 11 April 2026).
- SERNANP. Informe Anual de Visitación a Áreas Naturales Protegidas 2023; Servicio Nacional de Áreas Naturales Protegidas por el Estado: Lima, Peru, 2024; Available online: https://www.gob.pe/institucion/sernanp/informes-publicaciones/5867467-informe-anual-2023 (accessed on 11 April 2026).
- Servicio Nacional de Meteorología e Hidrología del Perú (SENAMHI). Datos Climatológicos de la Estación Iquitos, 2014–2024; SENAMHI: Lima, Peru, 2023; Available online: https://www.senamhi.gob.pe/site/descarga-datos/ (accessed on 11 April 2026).
- Instituto Geofísico del Perú (IGP). Clima de Iquitos: Promedios Multianuales; IGP: Lima, Peru, 2022; Available online: http://met.igp.gob.pe/clima/HTML/iquitos.html (accessed on 11 April 2026).
- Esenarro, D.; Montenegro, L.K.; Medina, C.; Cairo, J.V.; Legua Terry, A.I.; Veliz Garagatti, M.; Salas Delgado, G.W.; Escate Lira, M.M. Green Corridor Along the Chili River as an Ecosystem-Based Strategy for Social Connectivity and Ecological Resilience in Arequipa, Arequipa, Peru, 2025. Urban Sci. 2025, 9, 488. [Google Scholar] [CrossRef] [Scilit]
- Google Maps. Map View of Iquitos, Loreto, Peru (3°36′18″ S, 73°15′22″ W). Available online: https://www.google.com/maps/place/3%C2%B036’18.0%22S+73%C2%B015’22.0%22W/@-3.7390601,-73.4042412,11.14z/data=!4m4!3m3!8m2!3d-3.605!4d-73.2561111!5m1!1e4?entry=ttu&g_ep=EgoyMDI2MDEyNi4wIKXMDSoASAFQAw%3D%3D (accessed on 28 January 2026).
- Weather Spark. Datos Históricos del Clima Para Iquitos, Perú; Cedar Lake Ventures, Inc.: Minneapolis, MN, USA, 2024; Available online: https://es.weatherspark.com/y/24250/Clima-promedio-en-Iquitos-Perú-durante-todo-el-año (accessed on 28 January 2026).
- Peel, M.C.; Finlayson, B.L.; McMahon, T.A. Updated world map of the Köppen–Geiger climate classification. Hydrol. Earth Syst. Sci. 2007, 11, 1633–1644. [Google Scholar] [CrossRef] [Scilit]
- ANSI/ASHRAE Standard 55-2023; Thermal Environmental Conditions for Human Occupancy. American Society of Heating, Refrigerating and Air-Conditioning Engineers: Peachtree Corners, GA, USA, 2023. Available online: https://www.ashrae.org/technical-resources/bookstore/standard-55-thermal-environmental-conditions-for-human-occupancy (accessed on 1 September 2026).
- Grijalva Campoverde, C.X.; Vélez Mosquera, F.D. Estudio e Implementación de un Sistema Fotovoltaico Aplicado a Luminarias: Caso de Estudio Unidad Educativa “Dr. Francisco Falquez Ampuero”. Bachelor’s Thesis, Universidad Politécnica Salesiana, Guayaquil, Ecuador, 2020. Available online: https://dspace.ups.edu.ec/bitstream/123456789/18646/4/UPS-GT002920.pdf (accessed on 2 November 2025).
- Brown, S.; Lugo, A.E. Tropical forests as sinks of atmospheric carbon. Biotropica 1982, 14, 161–187. [Google Scholar]
- Malhi, Y.; Roberts, J.T.; Betts, R.A.; Killeen, T.J.; Li, W.; Nobre, C.A. Climate, carbon cycling, and rainfall patterns in Amazonia. Science 2008, 319, 169–172. [Google Scholar] [CrossRef] [Scilit] [PubMed]
- Denslow, J.S. Tropical rain forest gaps and tree species diversity. Annu. Rev. Ecol. Syst. 1987, 18, 431–451. [Google Scholar] [CrossRef] [Scilit]
- Alvarez-Buylla, E.R.; Martínez-Ramos, M. Demography and allometry of pioneer species of the neotropical rain forest: Cecropia obtusifolia. J. Ecol. 1992, 80, 275–290. [Google Scholar] [CrossRef] [Scilit]
- Henderson, A.; Galeano, G.; Bernal, R. Field Guide to the Palms of the Americas; Princeton University Press: Princeton, NJ, USA, 1995. [Google Scholar]
- Kay, K.M.; Schemske, D.W. Pollinator Assemblages and Visitation Rates for 11 Species of Neotropical Costus (Costaceae). Biotropica 2003, 35, 198–207. [Google Scholar] [CrossRef] [Scilit]
- Temeles, E.J.; Rah, Y.J.; Andicoechea, J.; Byanova, K.L.; Giller, G.S.J.; Stolk, S.B.; Kress, W.J. Pollinator-mediated selection in a specialized hummingbird–Heliconia system in the Eastern Caribbean. J. Evol. Biol. 2013, 26, 135–146. [Google Scholar] [CrossRef] [Scilit] [PubMed]
- Campbell, E.; Alfaro-Shigueto, J.; Mangel, J.C. Abundance estimate of the Amazon River dolphin (Inia geoffrensis) and the tucuxi (Sotalia fluviatilis) in Yarinacocha Lagoon, Ucayali, Peru. Lat. Am. J. Aquat. Res. 2017, 45, 957–971. [Google Scholar] [CrossRef] [Scilit]
- Fung, C.Y.; Peter, B.G.; Simmons, C.S. Habitat Mapping and Spatiotemporal Overlap of the Amazon River Dolphin, Fishers, and Tourism in the Central Region of the Brazilian Amazon. Conservation 2023, 3, 523–542. [Google Scholar] [CrossRef] [Scilit]
- Brightsmith, D.J.; Aramburu Munoz-Najar, R. Avian Geophagy and Soil Characteristics in Southeastern Peru. Biotropica 2004, 36, 534–543. [Google Scholar] [CrossRef] [Scilit]
- Recharte, M.; Lee, P.C.; Vick, S.J.; Bowler, M. Polling the Public to Select Flagship Species for Tourism and Conservation, A ‘Big Five’ for the Peruvian Amazon? Ecol. Evol. 2025, 15, e70983. [Google Scholar] [CrossRef] [Scilit] [PubMed]
- Pacheco, M.A.; García-Amado, M.A.; Manzano, J.; Matta, N.E.; Escalante, A.A. Blood parasites infecting the Hoatzin (Opisthocomus hoazin), a unique neotropical folivorous bird. PeerJ 2019, 7, e6361. [Google Scholar] [CrossRef] [Scilit] [PubMed]
- Edwards, C.A. Earthworm Ecology, 2nd ed.; CRC Press: Boca Raton, FL, USA, 2004. [Google Scholar] [CrossRef] [Scilit]
- Domínguez, J. State of the art and new perspectives on vermicomposting research. In Earthworm Ecology; Edwards, C.A., Ed.; CRC Press: Boca Raton, FL, USA, 2004; pp. 401–424. [Google Scholar]
- Aira, M.; Dominguez, J. Earthworm Effects without Earthworms: Inoculation of Raw Organic Matter with Worm-Worked Substrates Alters Microbial Community Functioning. PLoS ONE 2011, 6, e16354. [Google Scholar] [CrossRef] [Scilit] [PubMed]
- Dirección Regional de Comercio Exterior y Turismo de Loreto (DIRCETUR). Estadísticas Regionales de Turismo 2023–2024; DIRCETUR: Iquitos, Peru, 2024; Available online: https://www.gob.pe/institucion/mincetur/informes-publicaciones/5420947-reportes-de-turismo-reporte-regional-de-turismo-2024 (accessed on 15 September 2025).
- Cuya, N.; Estrada, P.; Esenarro, D.; Vega, V.; Vilchez Cairo, J.; Mancilla-Bravo, D.C. Comfort for Users of the Educational Center Applying Sustainable Design Strategies, Carabayllo-Peru-2023. Buildings 2024, 14, 2143. [Google Scholar] [CrossRef] [Scilit]
- Esenarro, D.; Hidalgo, C.; Vilchez Cairo, J.; Yabar, G.; Vilchez, T.; Zapata, P.; Bermudez, D.; Camayo, A. Microclimates, Geometry, and Constructive Sustainability of the Inca Agricultural Terraces of Moray, Cusco, Peru. Heritage 2026, 9, 56. [Google Scholar] [CrossRef] [Scilit]
- Cobeñas, P.; Esenarro, D.; Vilchez Cairo, J.; Gómez, A.; Prado, M.; Pérez Sosa, A.A.; Raymundo, V.; Garcia, F.L.P.; Peña, J.; Porras, E.; et al. Strategies for the Revalorization of the Natural Environment and Landscape Regeneration at La Herradura Beach, Chorrillos, Peru 2024. Urban Sci. 2026, 10, 2. [Google Scholar] [CrossRef] [Scilit]
- Panel Solar Perú. Panel Solar 610 W Astronergy Bifacial N-Type TOPCon. Available online: https://panelsolarperu.com/panel-solar-610w-astronergy-bifacial-n-type-topcon/ (accessed on 28 August 2025).
- Panasonic Corporation of North America. ClimaPure™ XZ Series Single Split System. Newark (NJ): Panasonic North America. Available online: https://iaq.na.panasonic.com/hvac/mini-split/climapure-xz-series-single-split-system-xz9akua (accessed on 28 August 2026).
- Chernicharo, C.A.L. Anaerobic Reactors. Biological Wastewater Treatment Series; IWA Publishing: London, UK, 2007; Volume 4. [Google Scholar] [CrossRef] [Scilit]
- Estudios Amazónicos. Cosecha de Lluvia en la Amazonía; Estudios Amazónicos: Lima, Peru, 2021; Available online: https://estudiosamazonicos.com/wp-content/uploads/2021/02/COSECHA-DE-LLUVIA-EN-LA-AMAZONIA._compressed.pdf (accessed on 28 January 2026).
- Ministerio de Vivienda; Construcción y Saneamiento. Loreto: Inician Obra de Captación Y Tratamiento de Agua de Lluvia Para Familias de Maynas; Gobierno del Perú: Lima, Peru, 2022; Available online: https://www.gob.pe/institucion/vivienda/noticias/685644-loreto-inician-obra-de-captacion-y-tratamiento-de-agua-de-lluvia-para-familias-de-maynas (accessed on 28 January 2026).
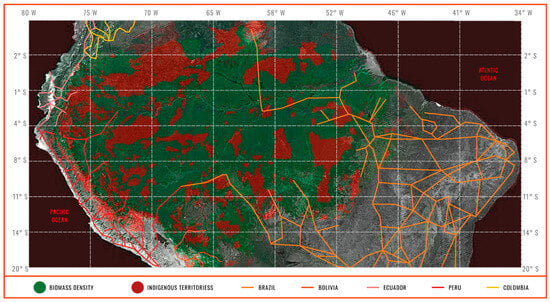
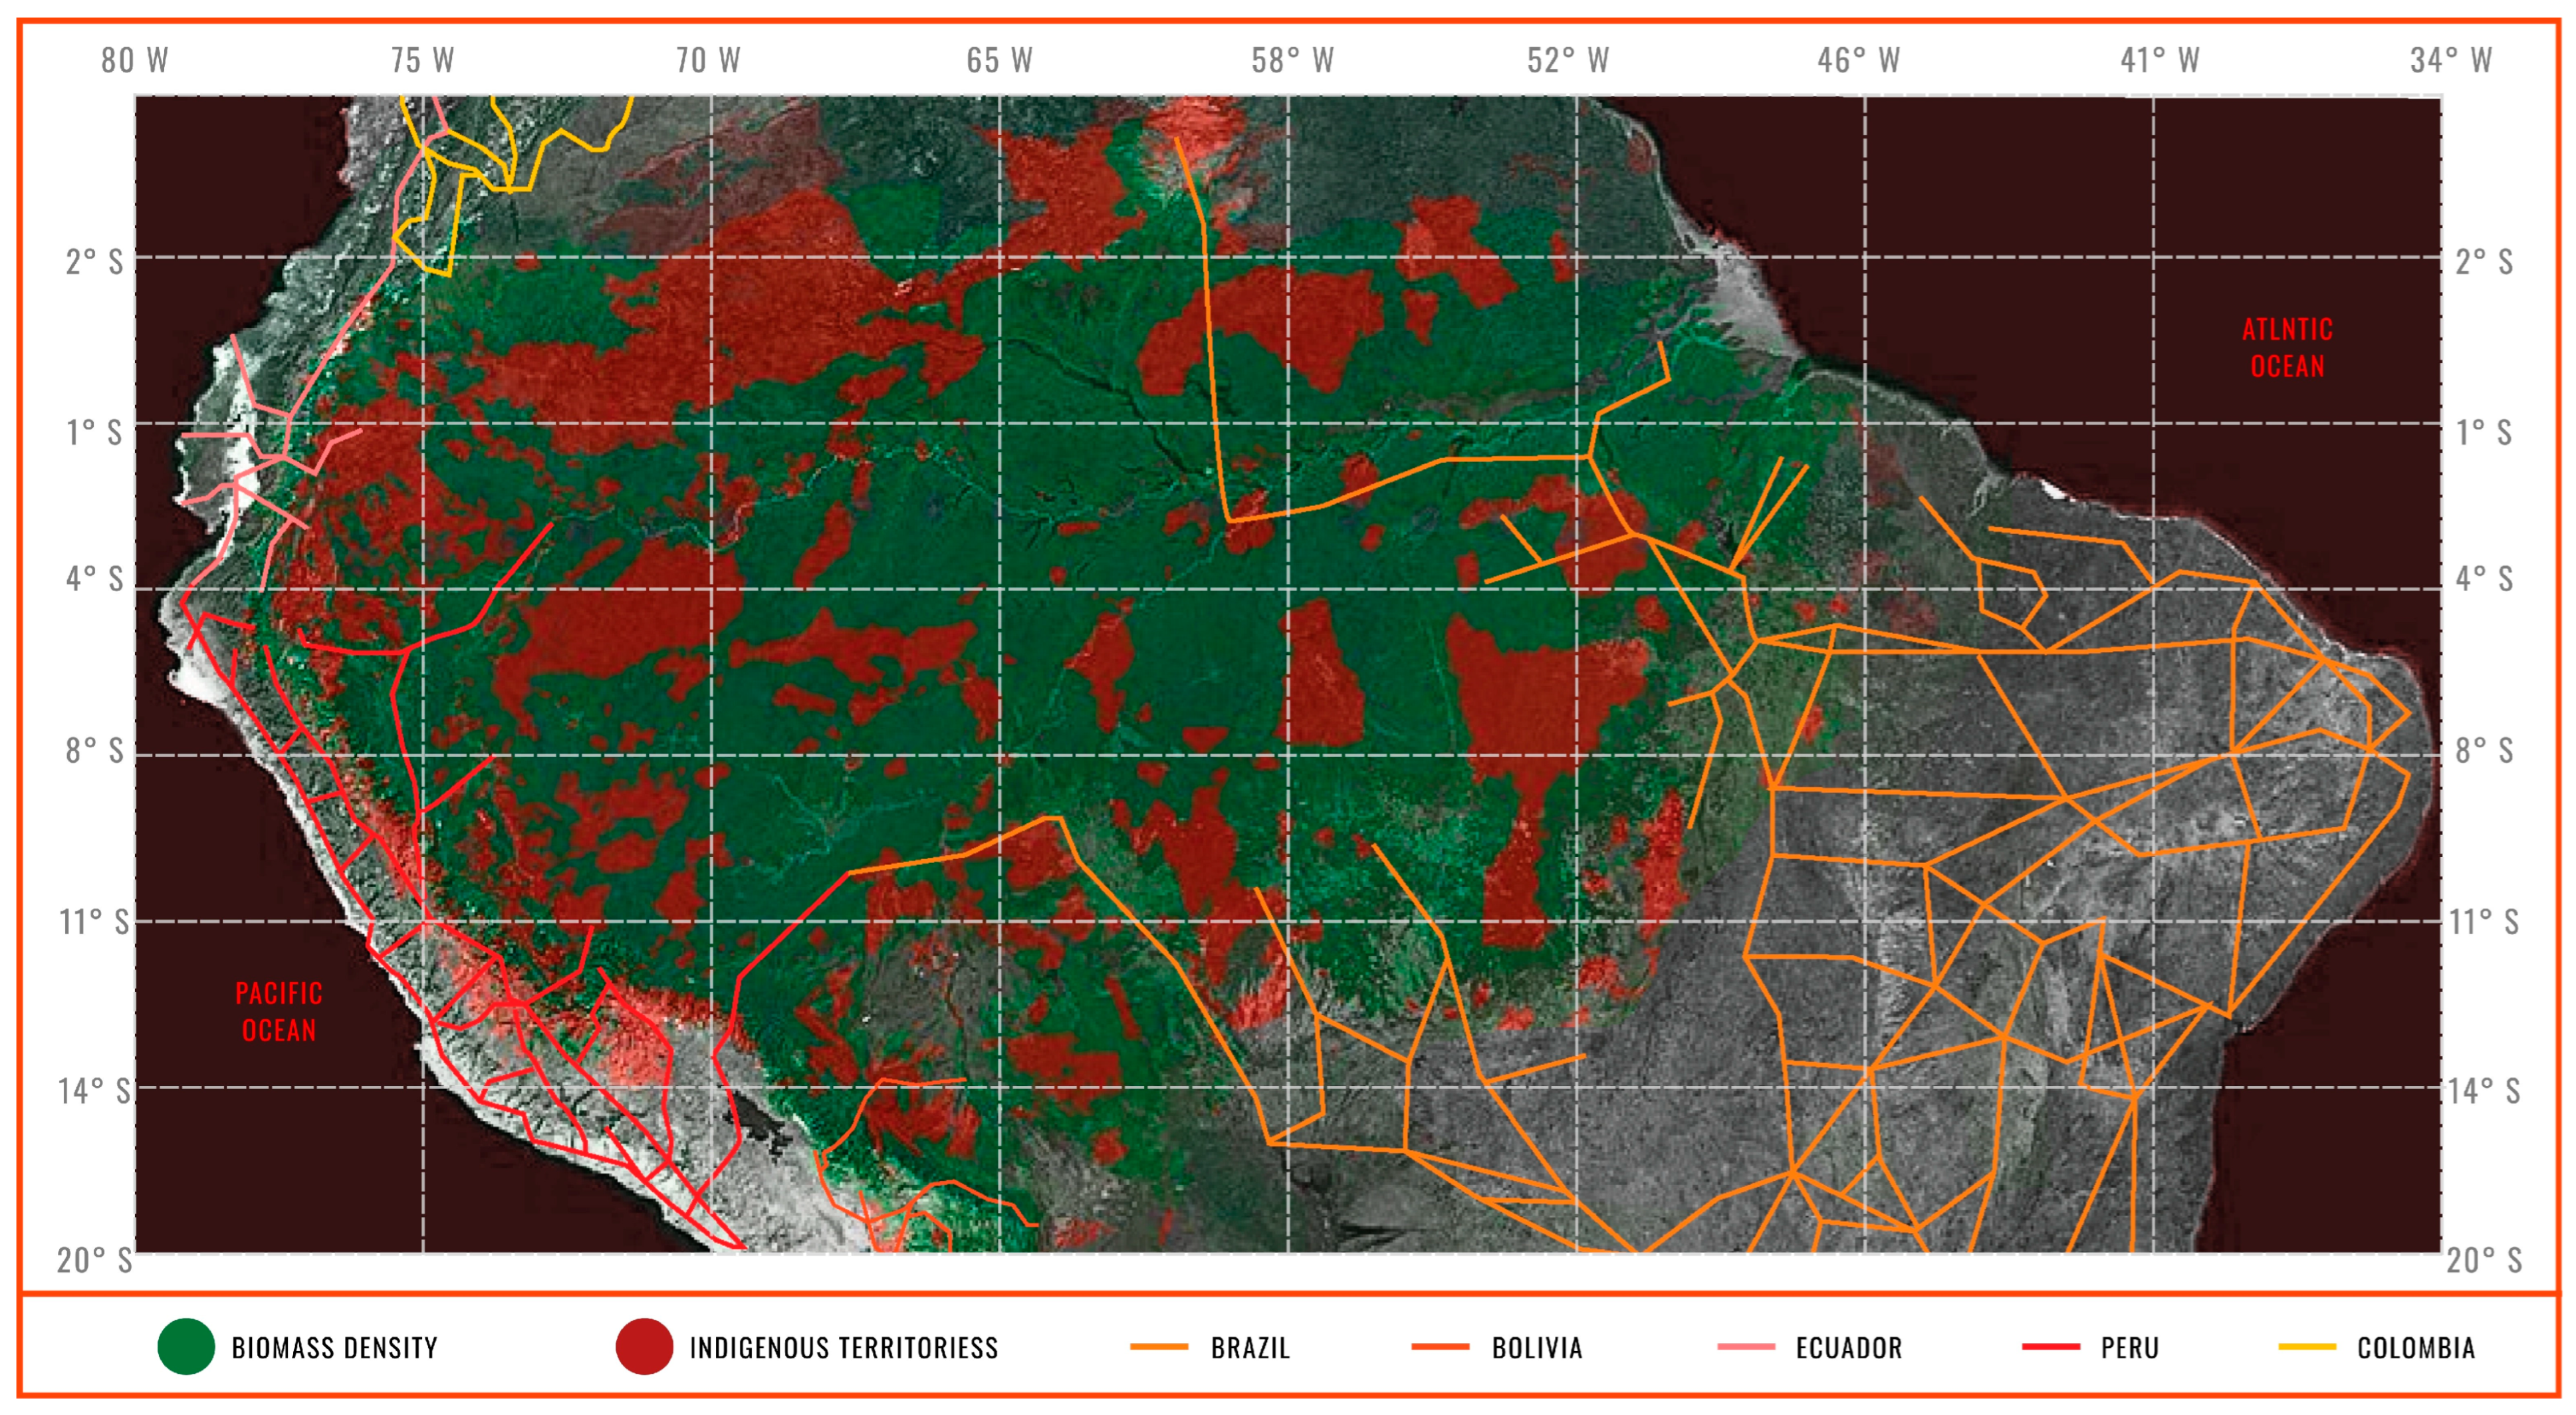
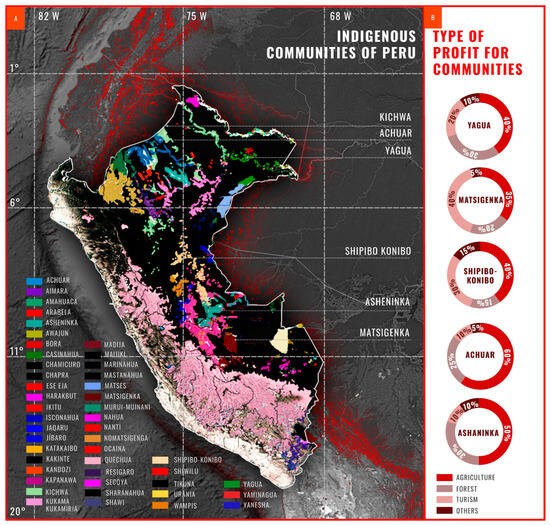
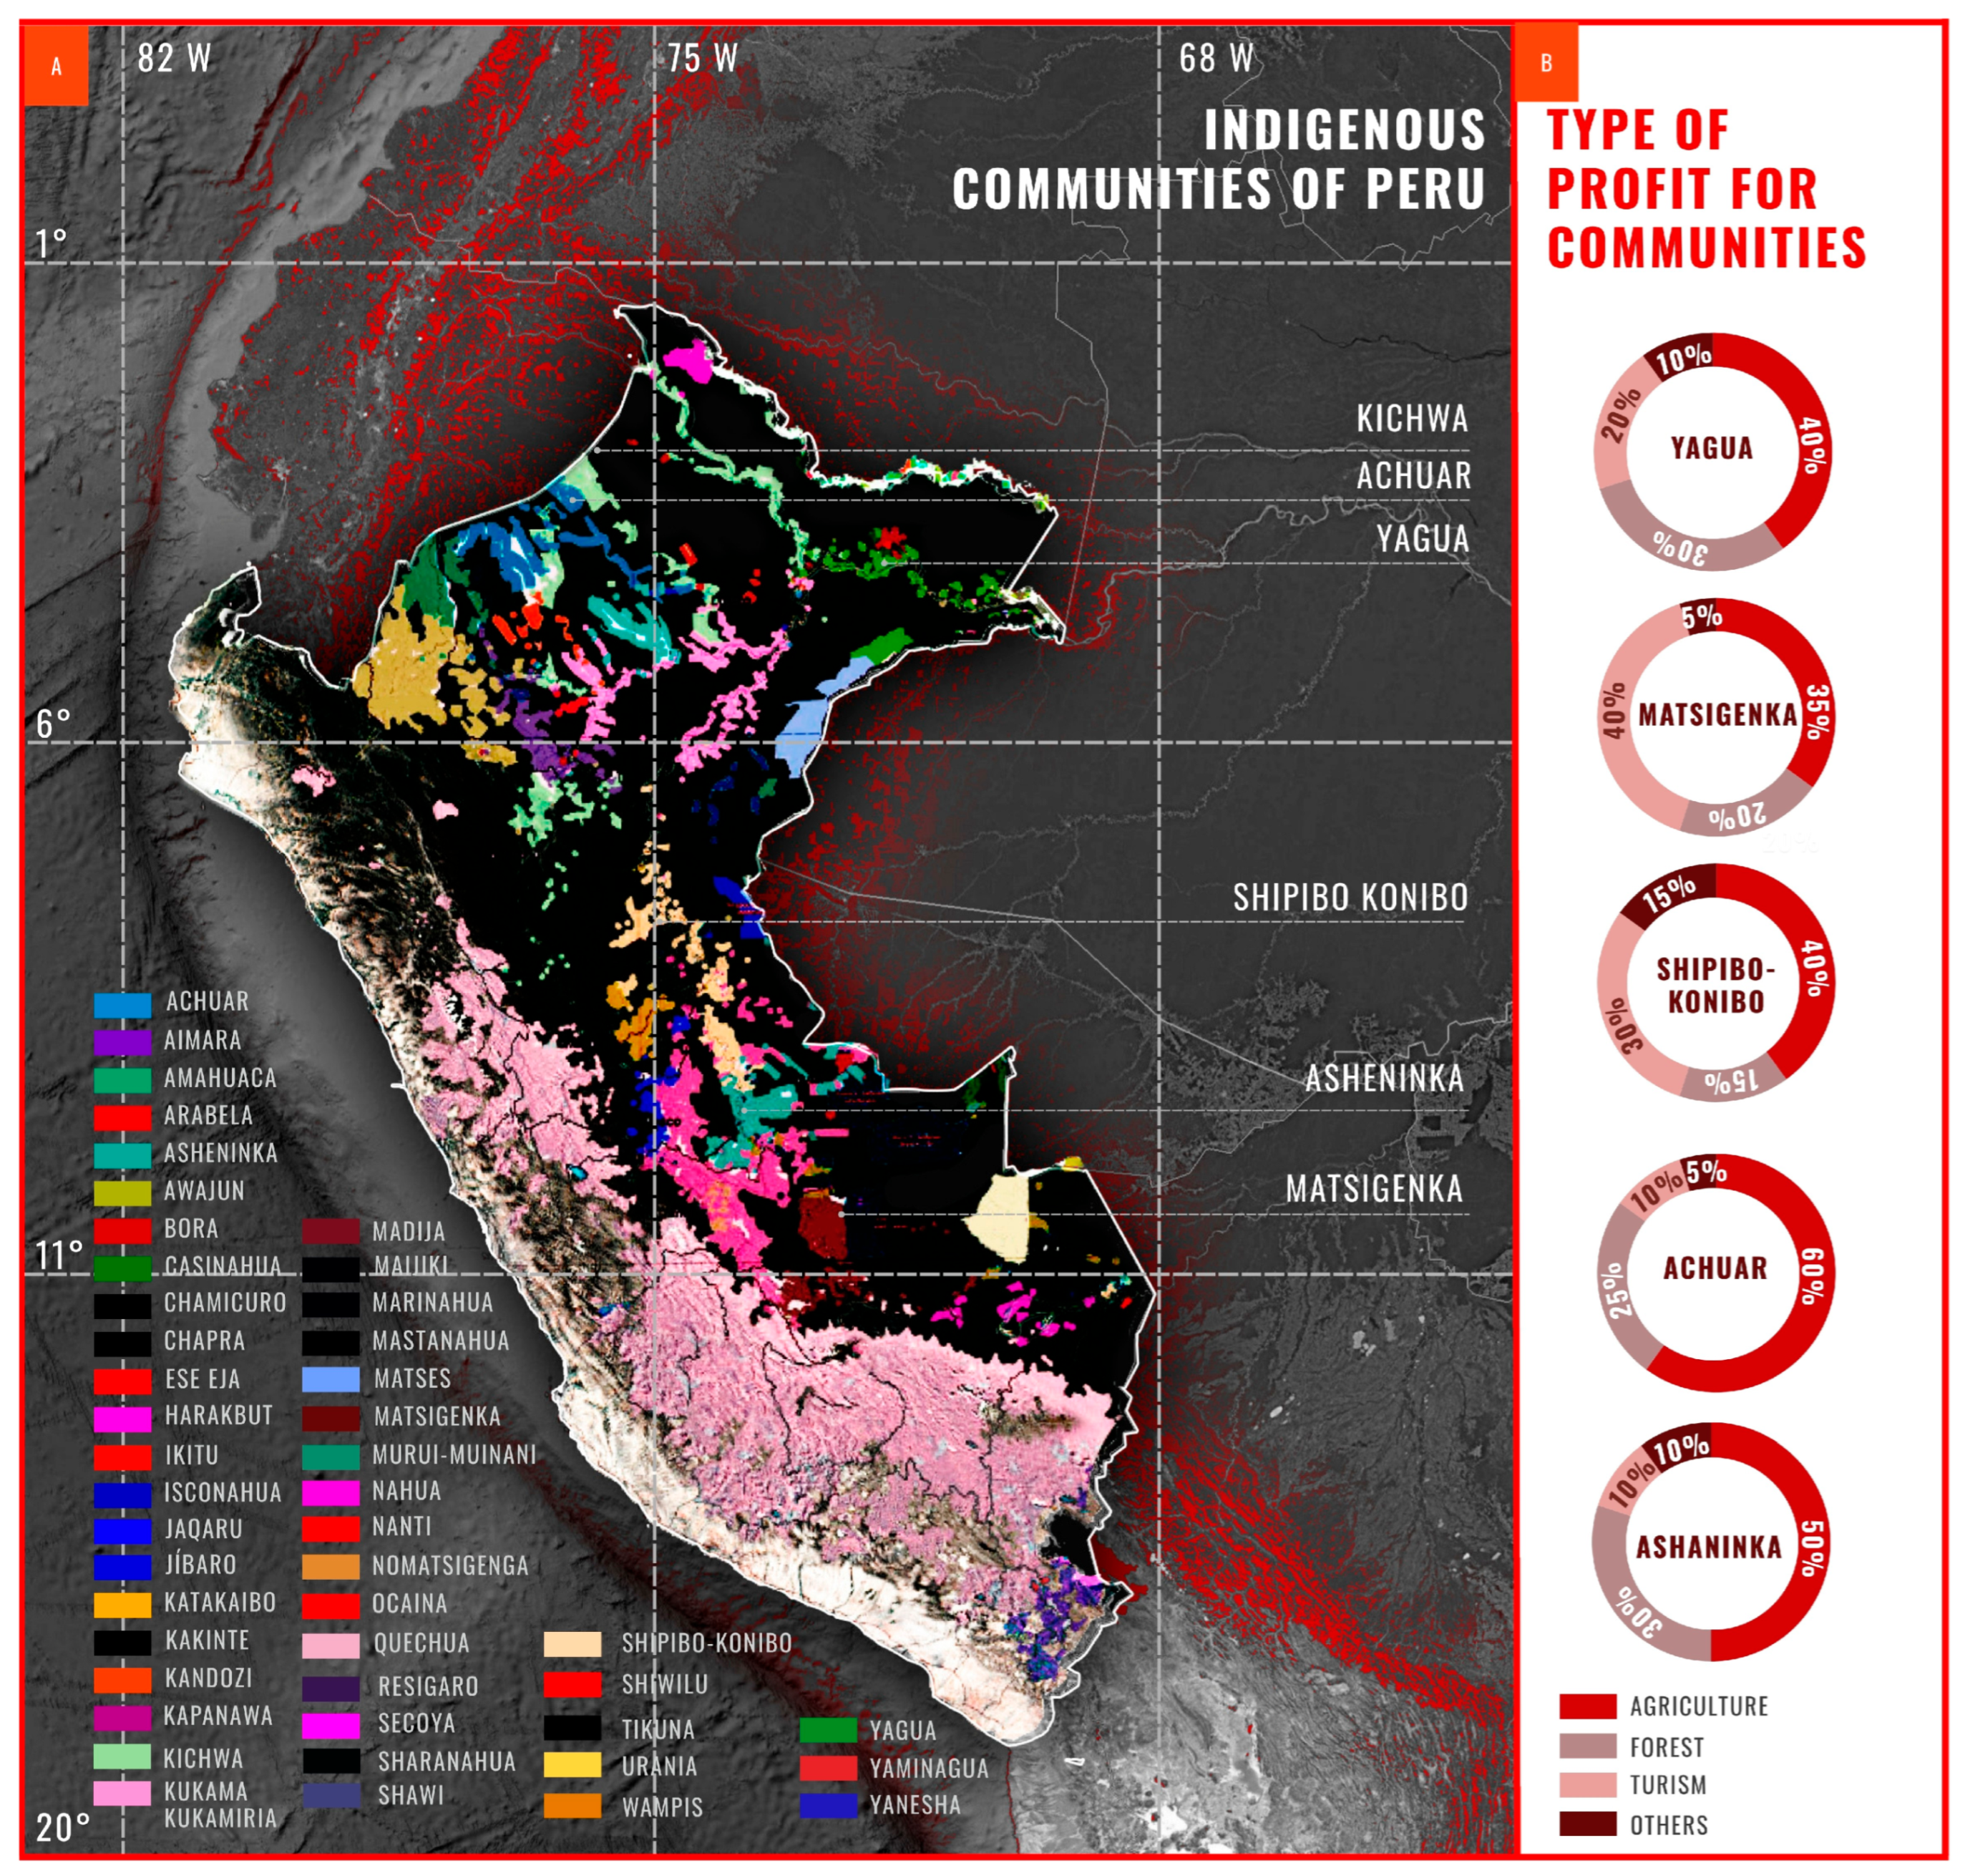
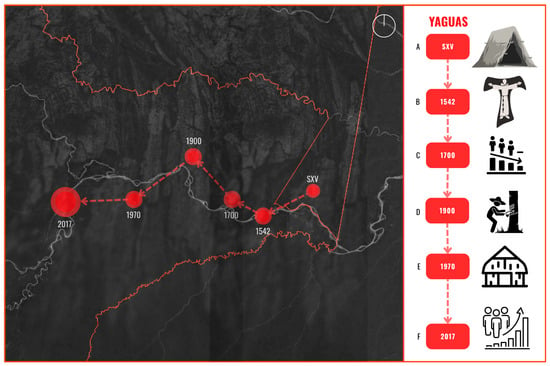

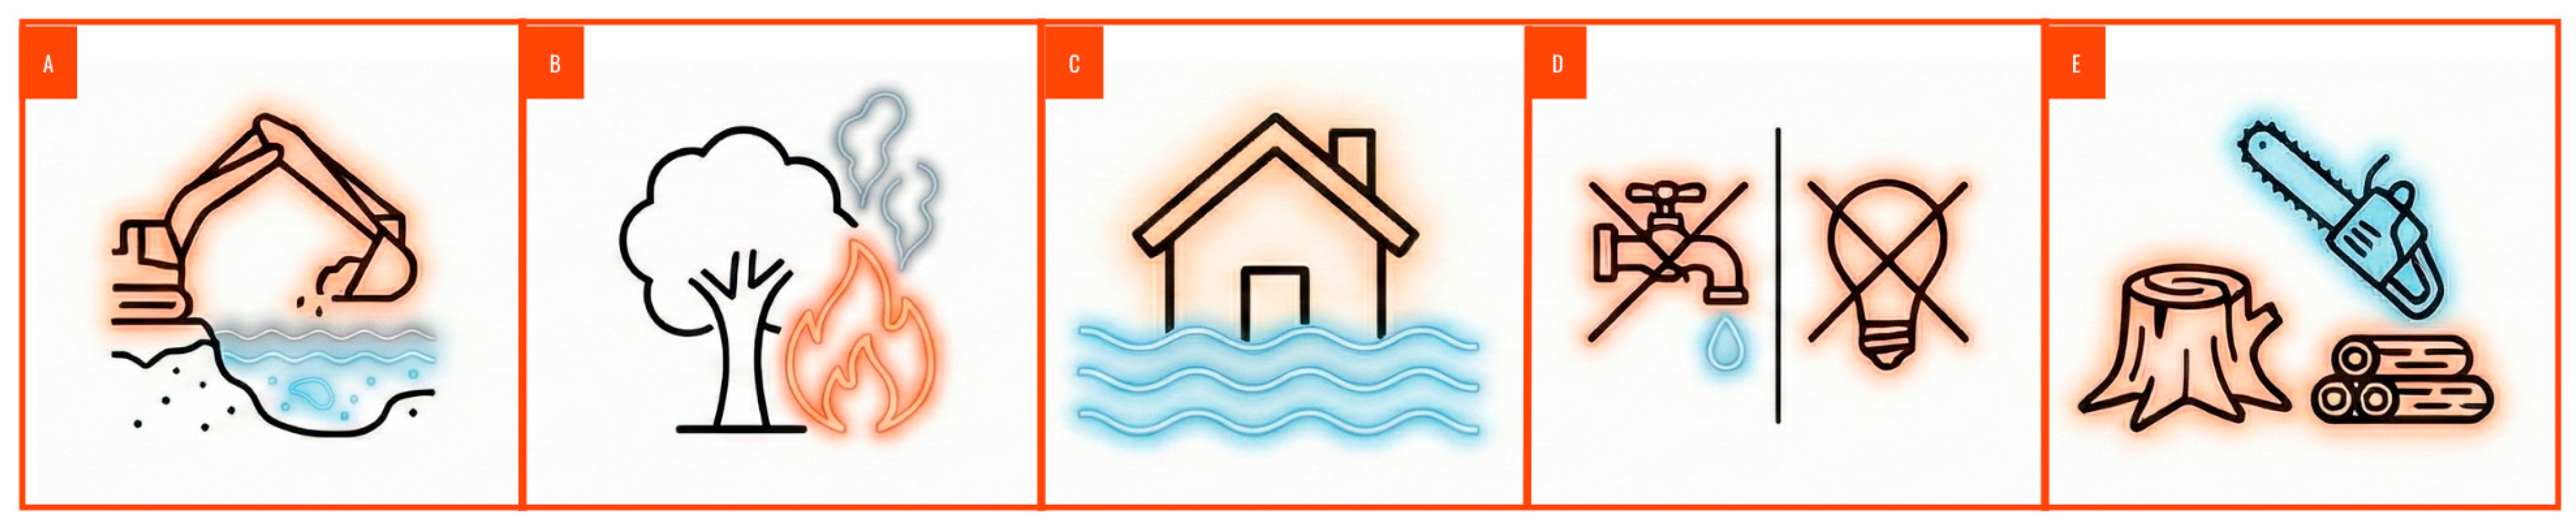


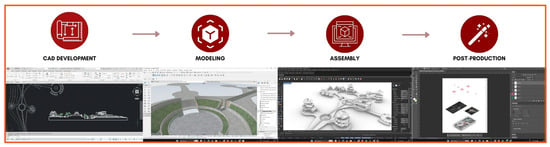
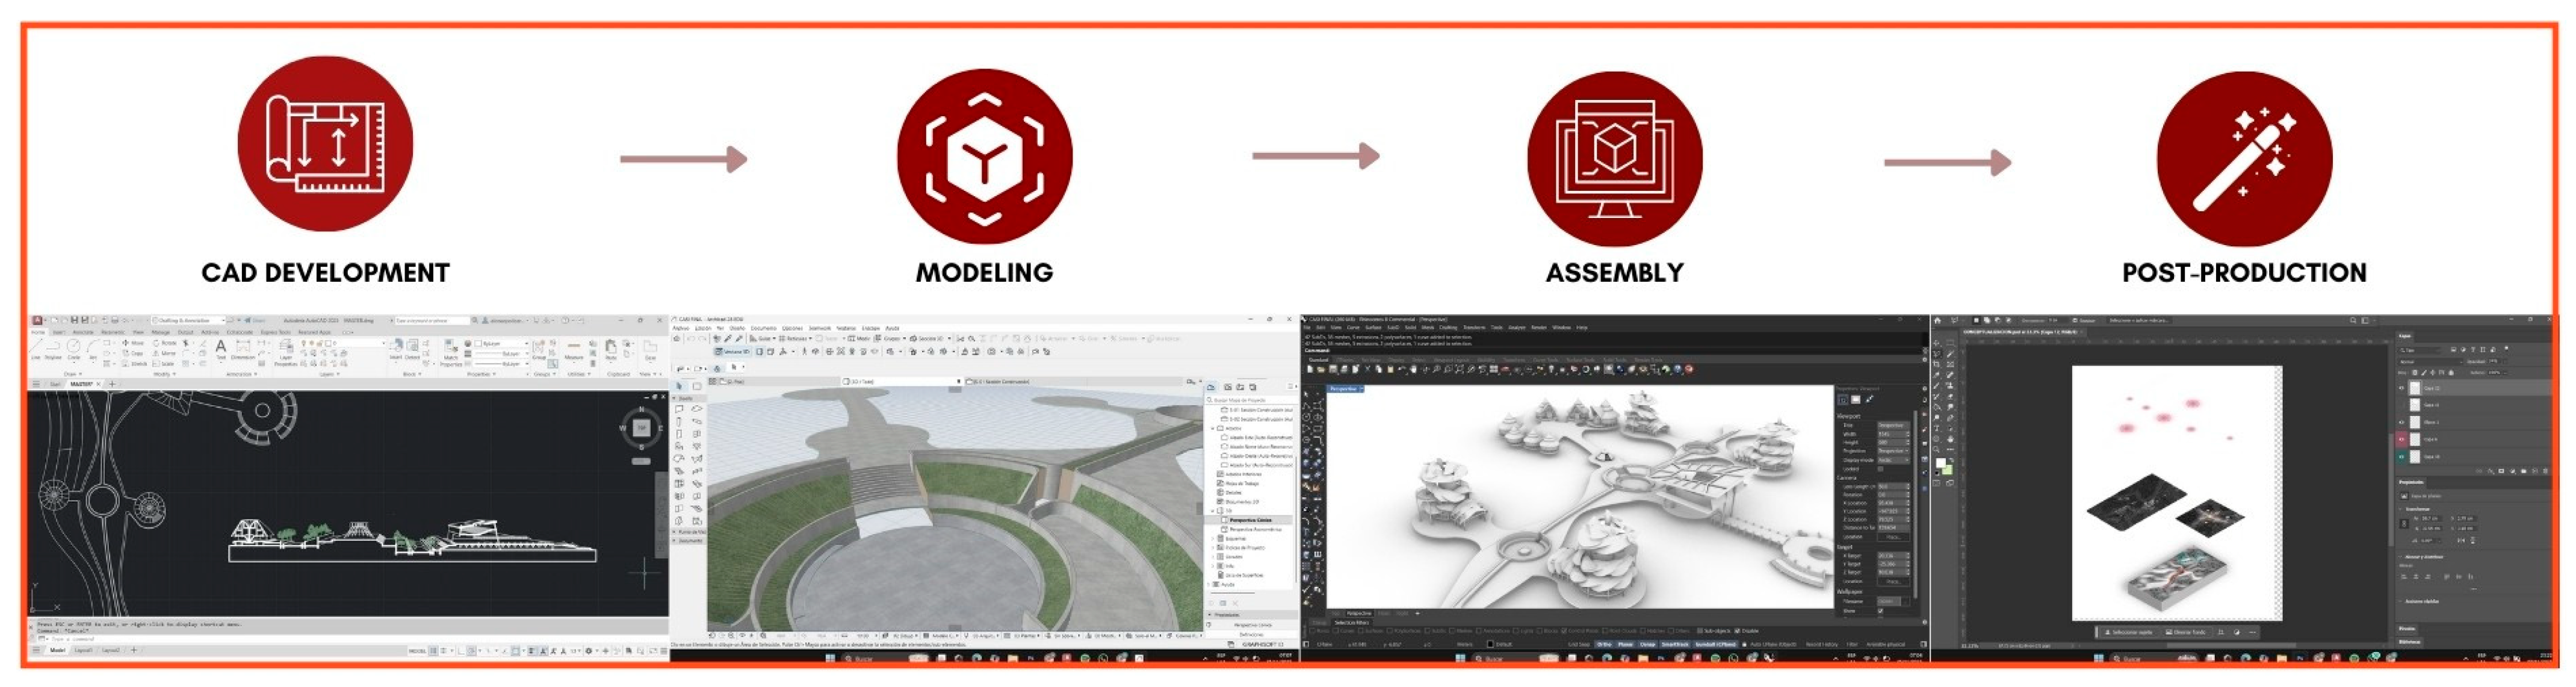
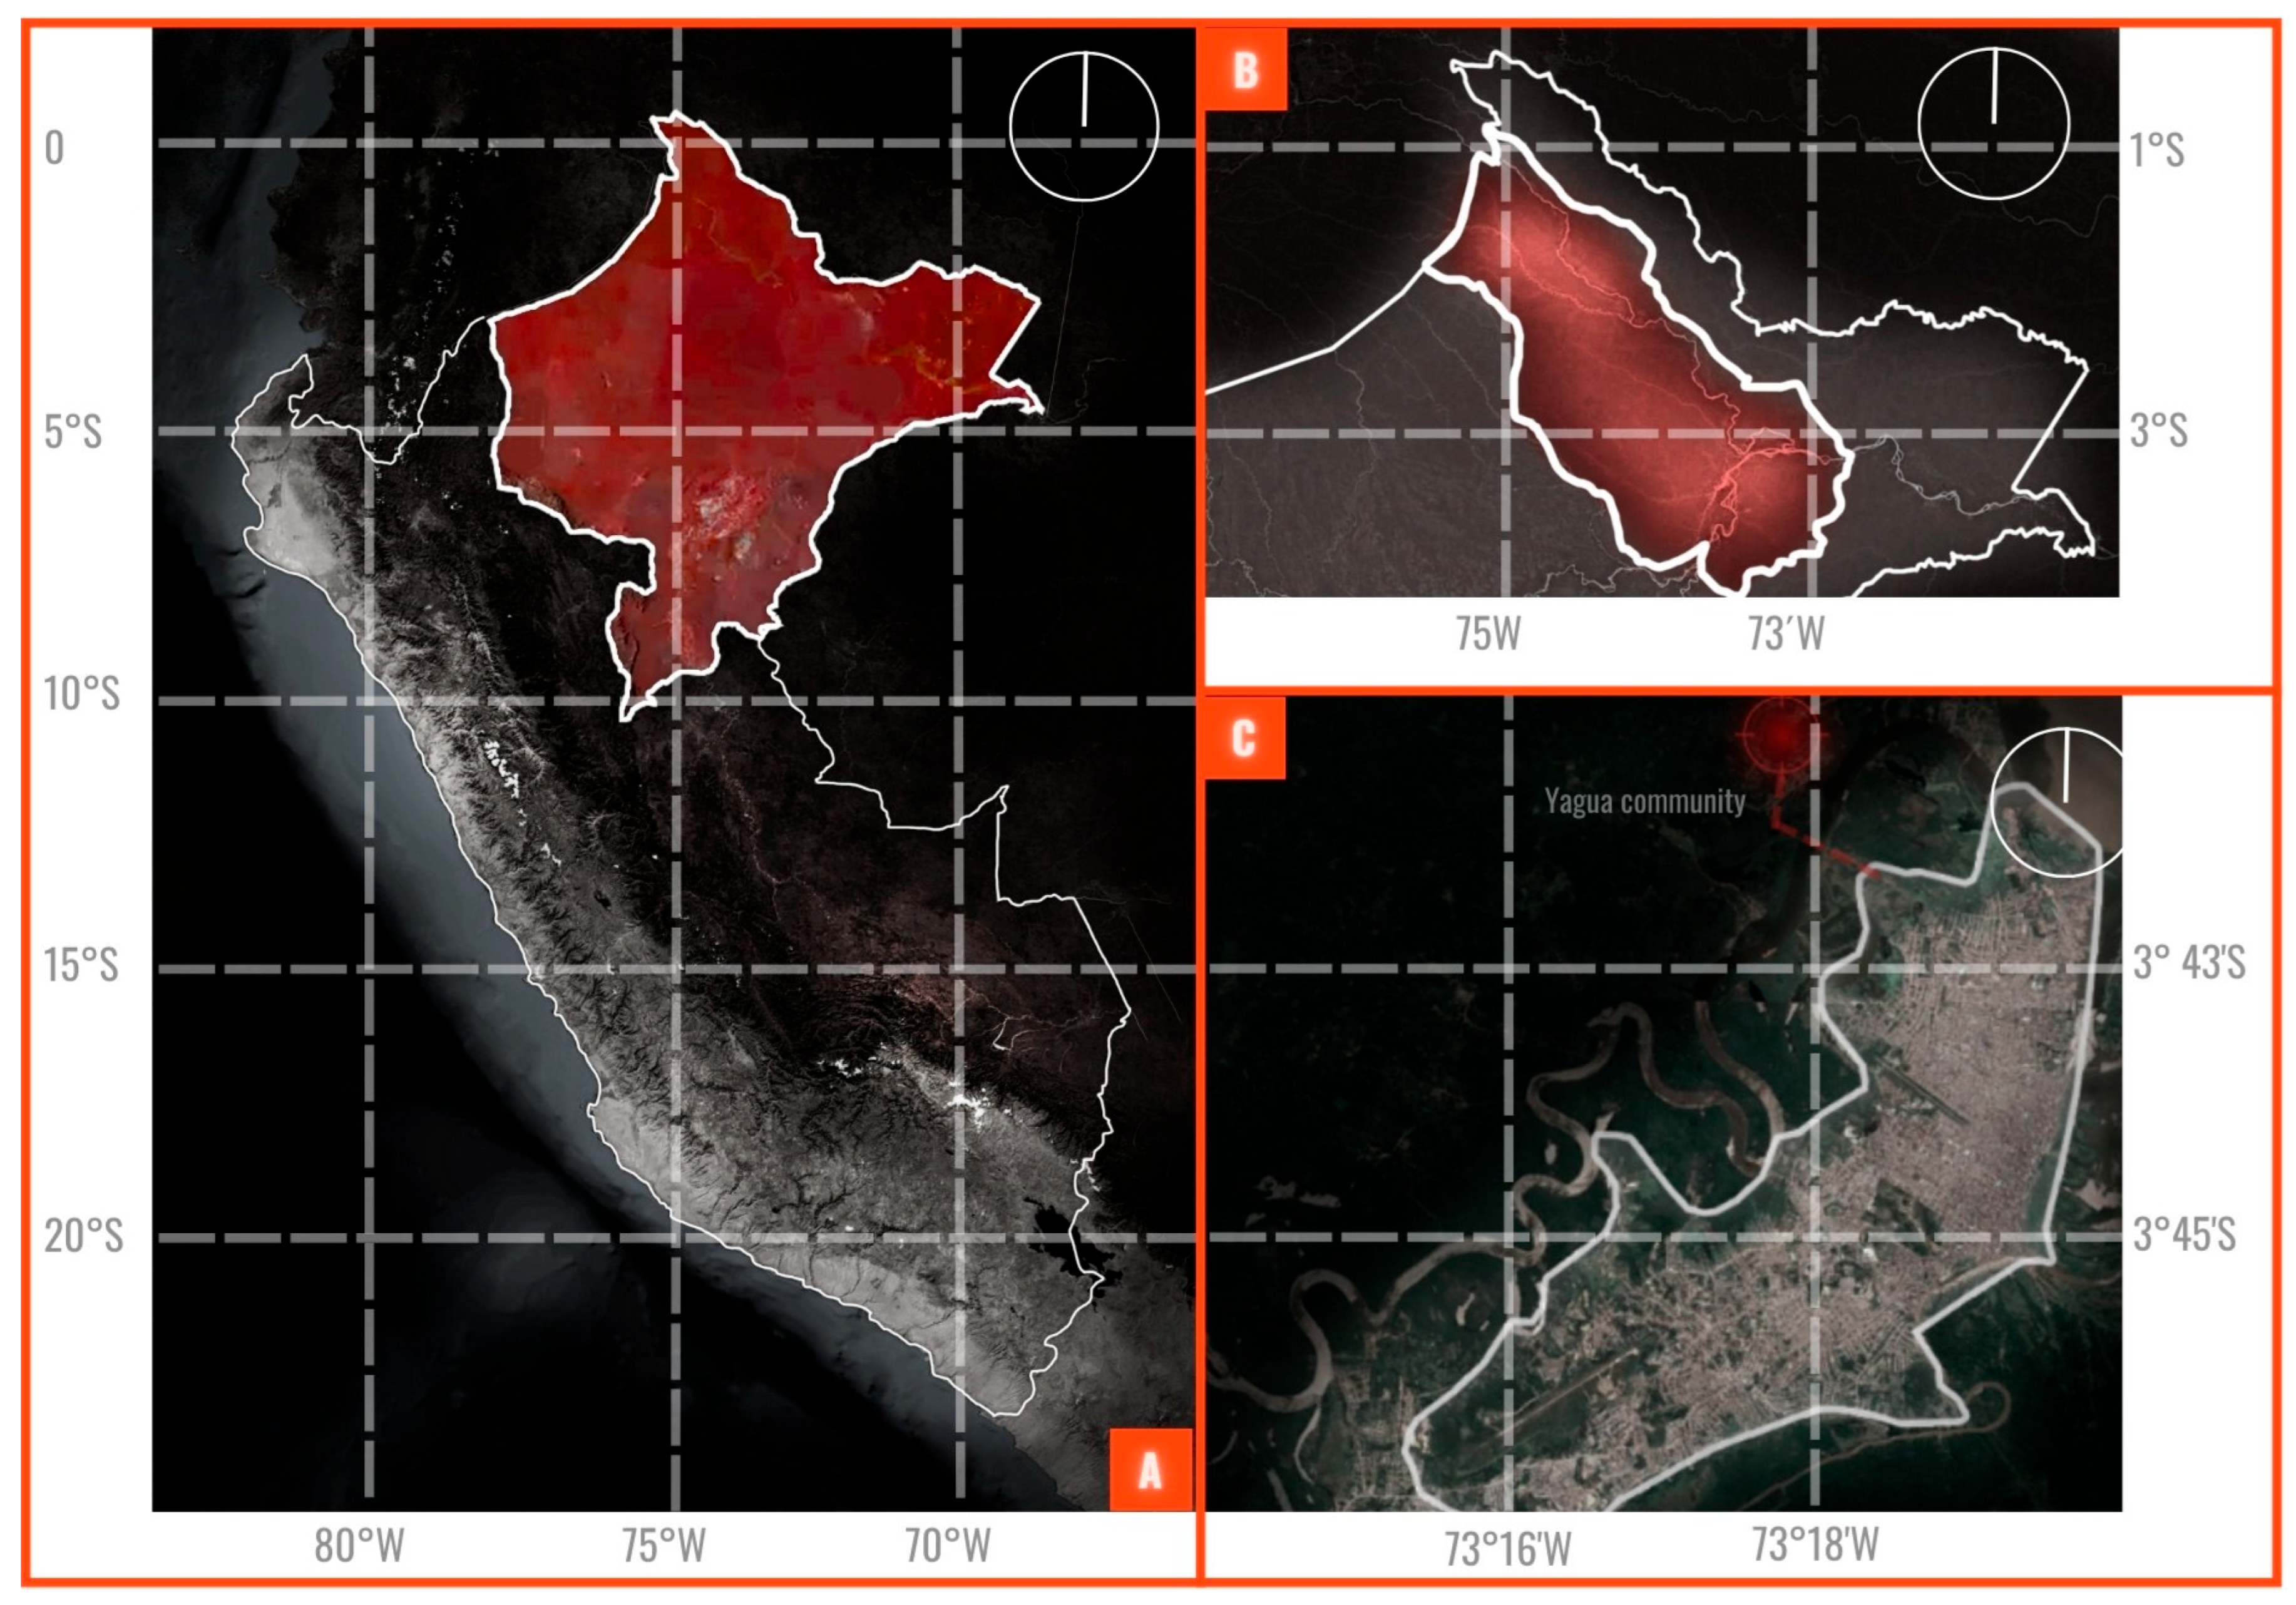
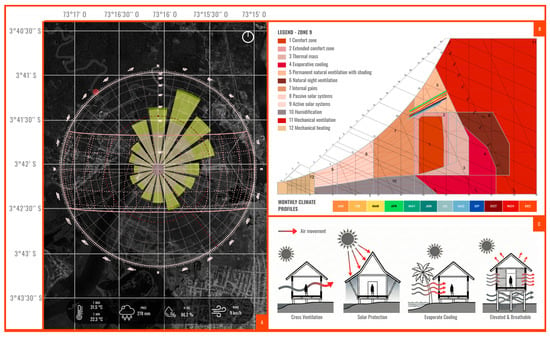
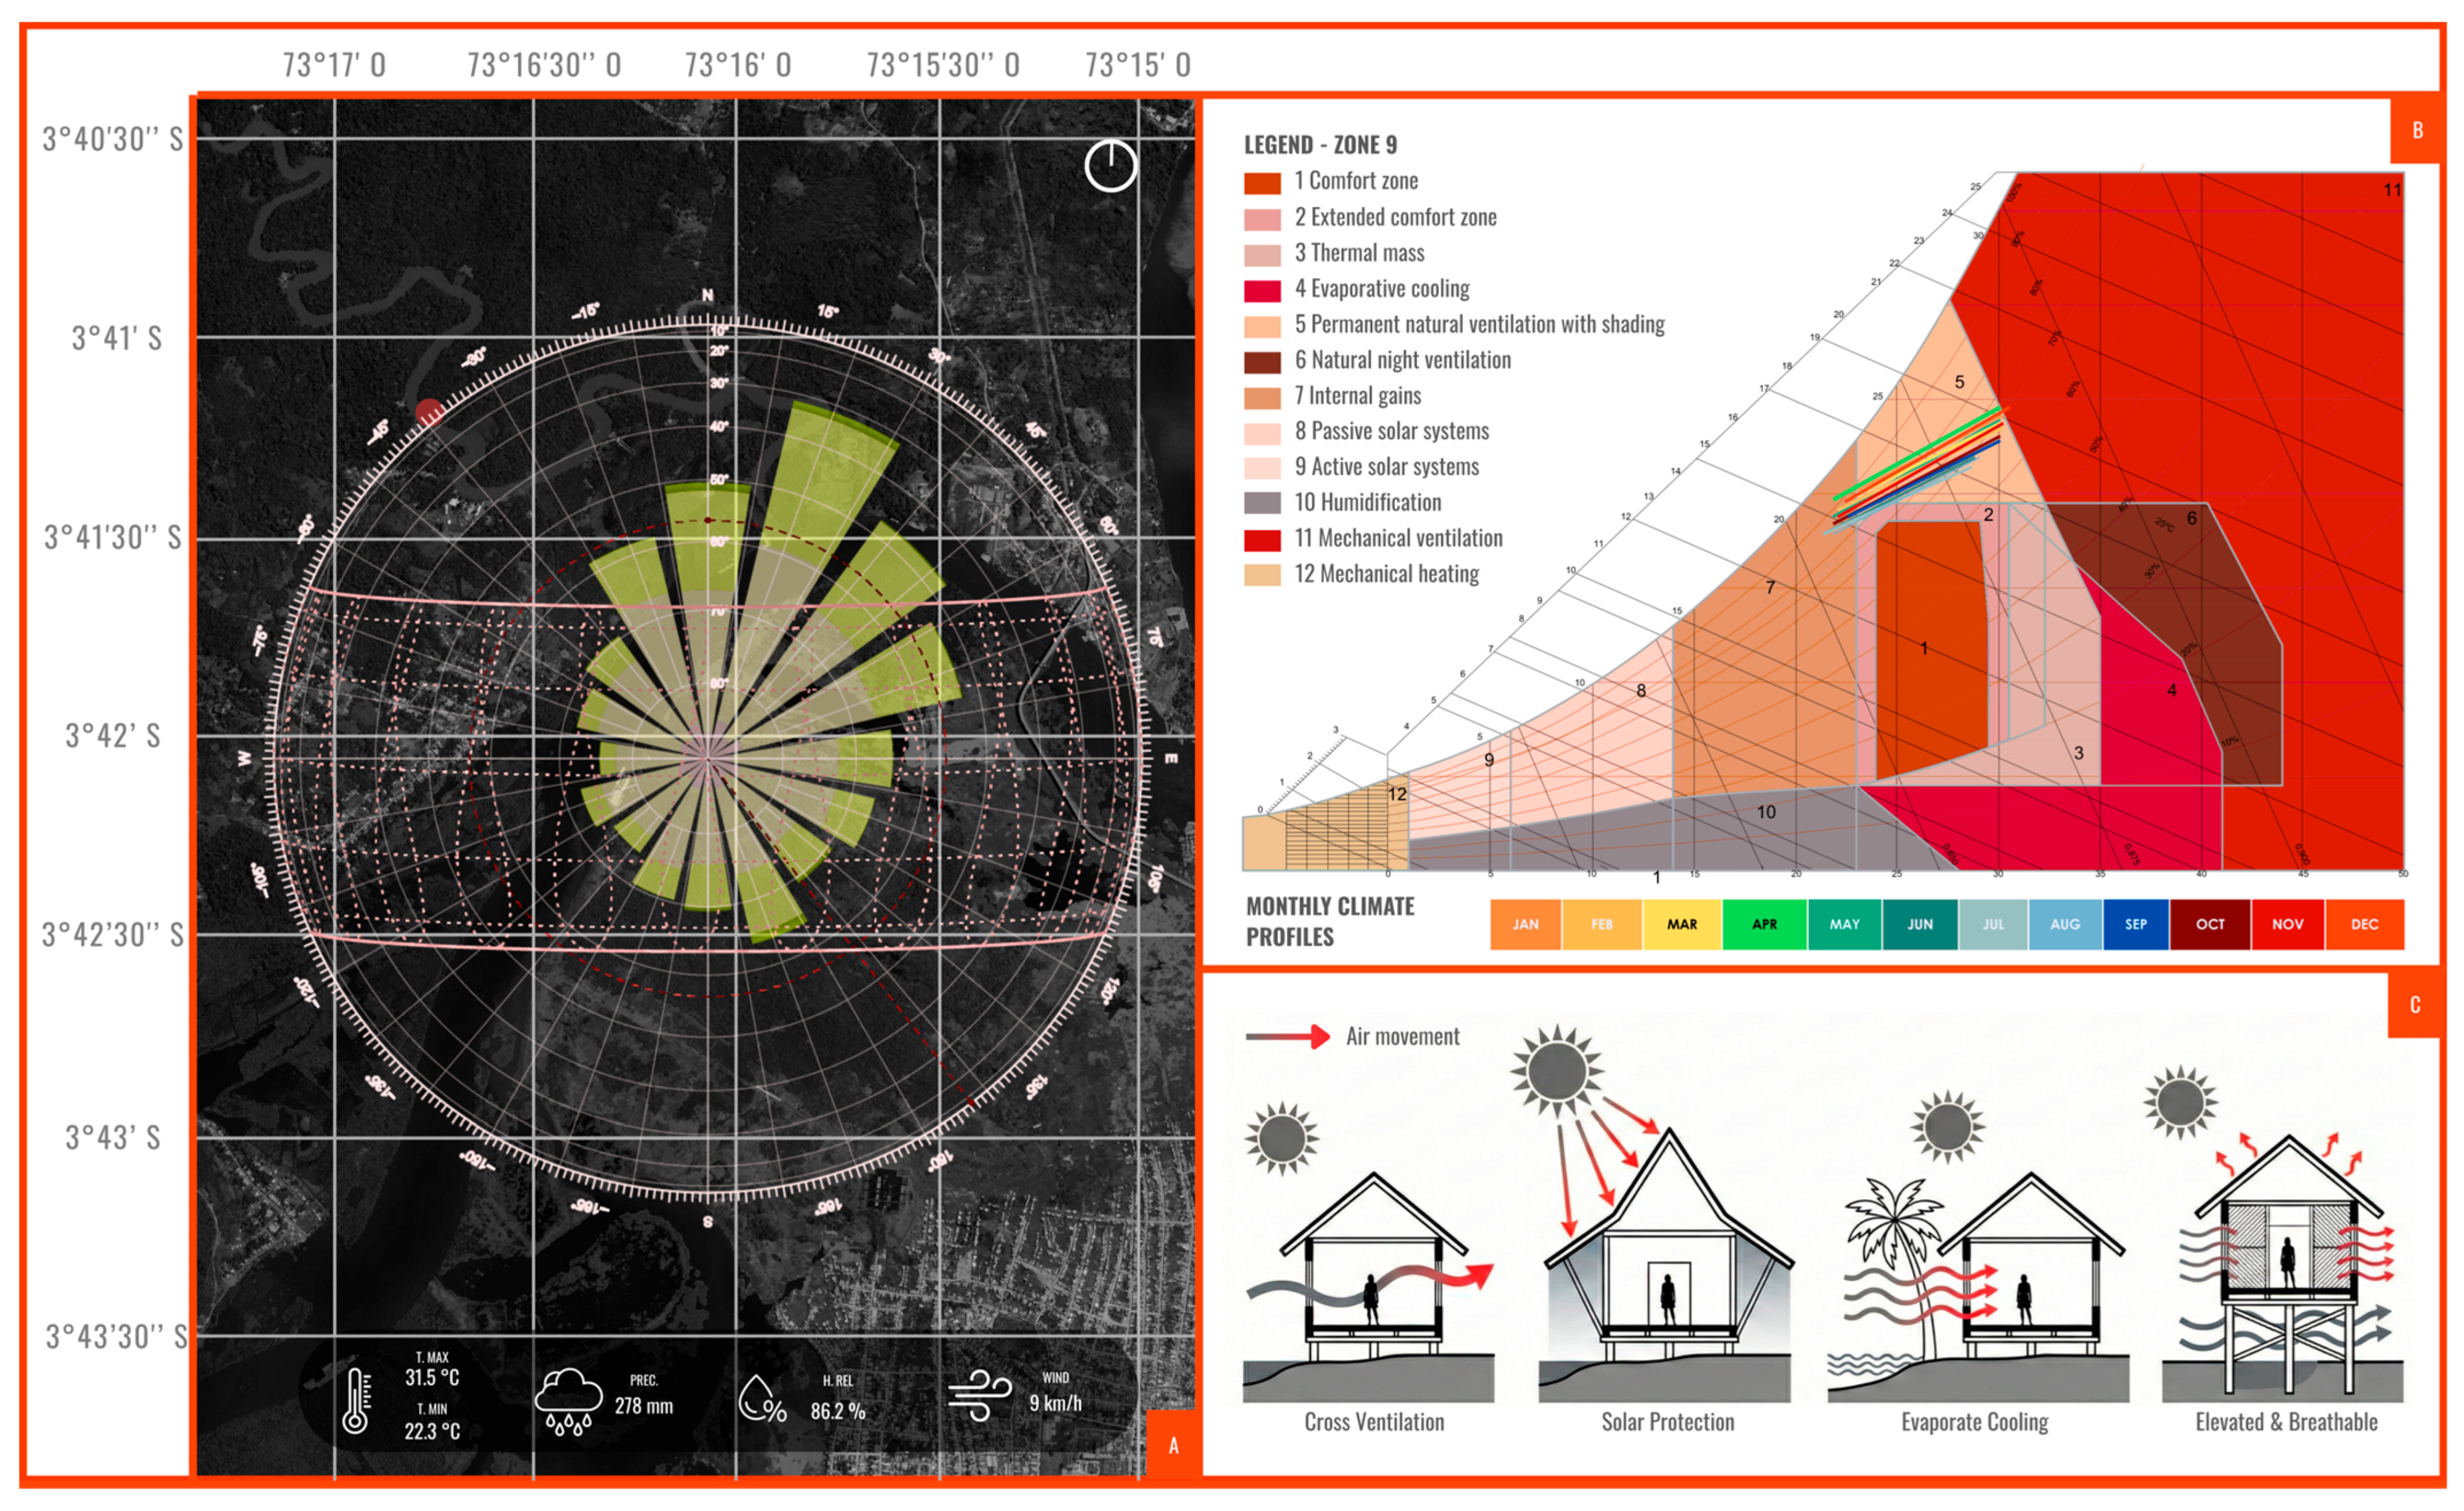




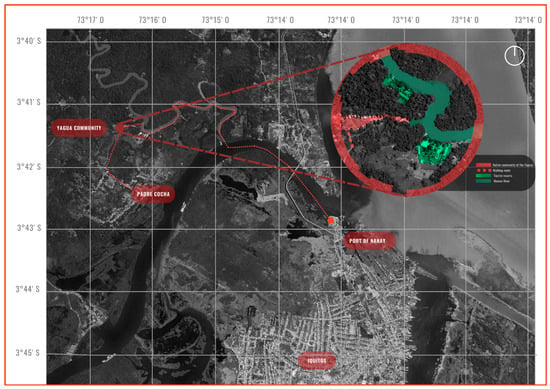
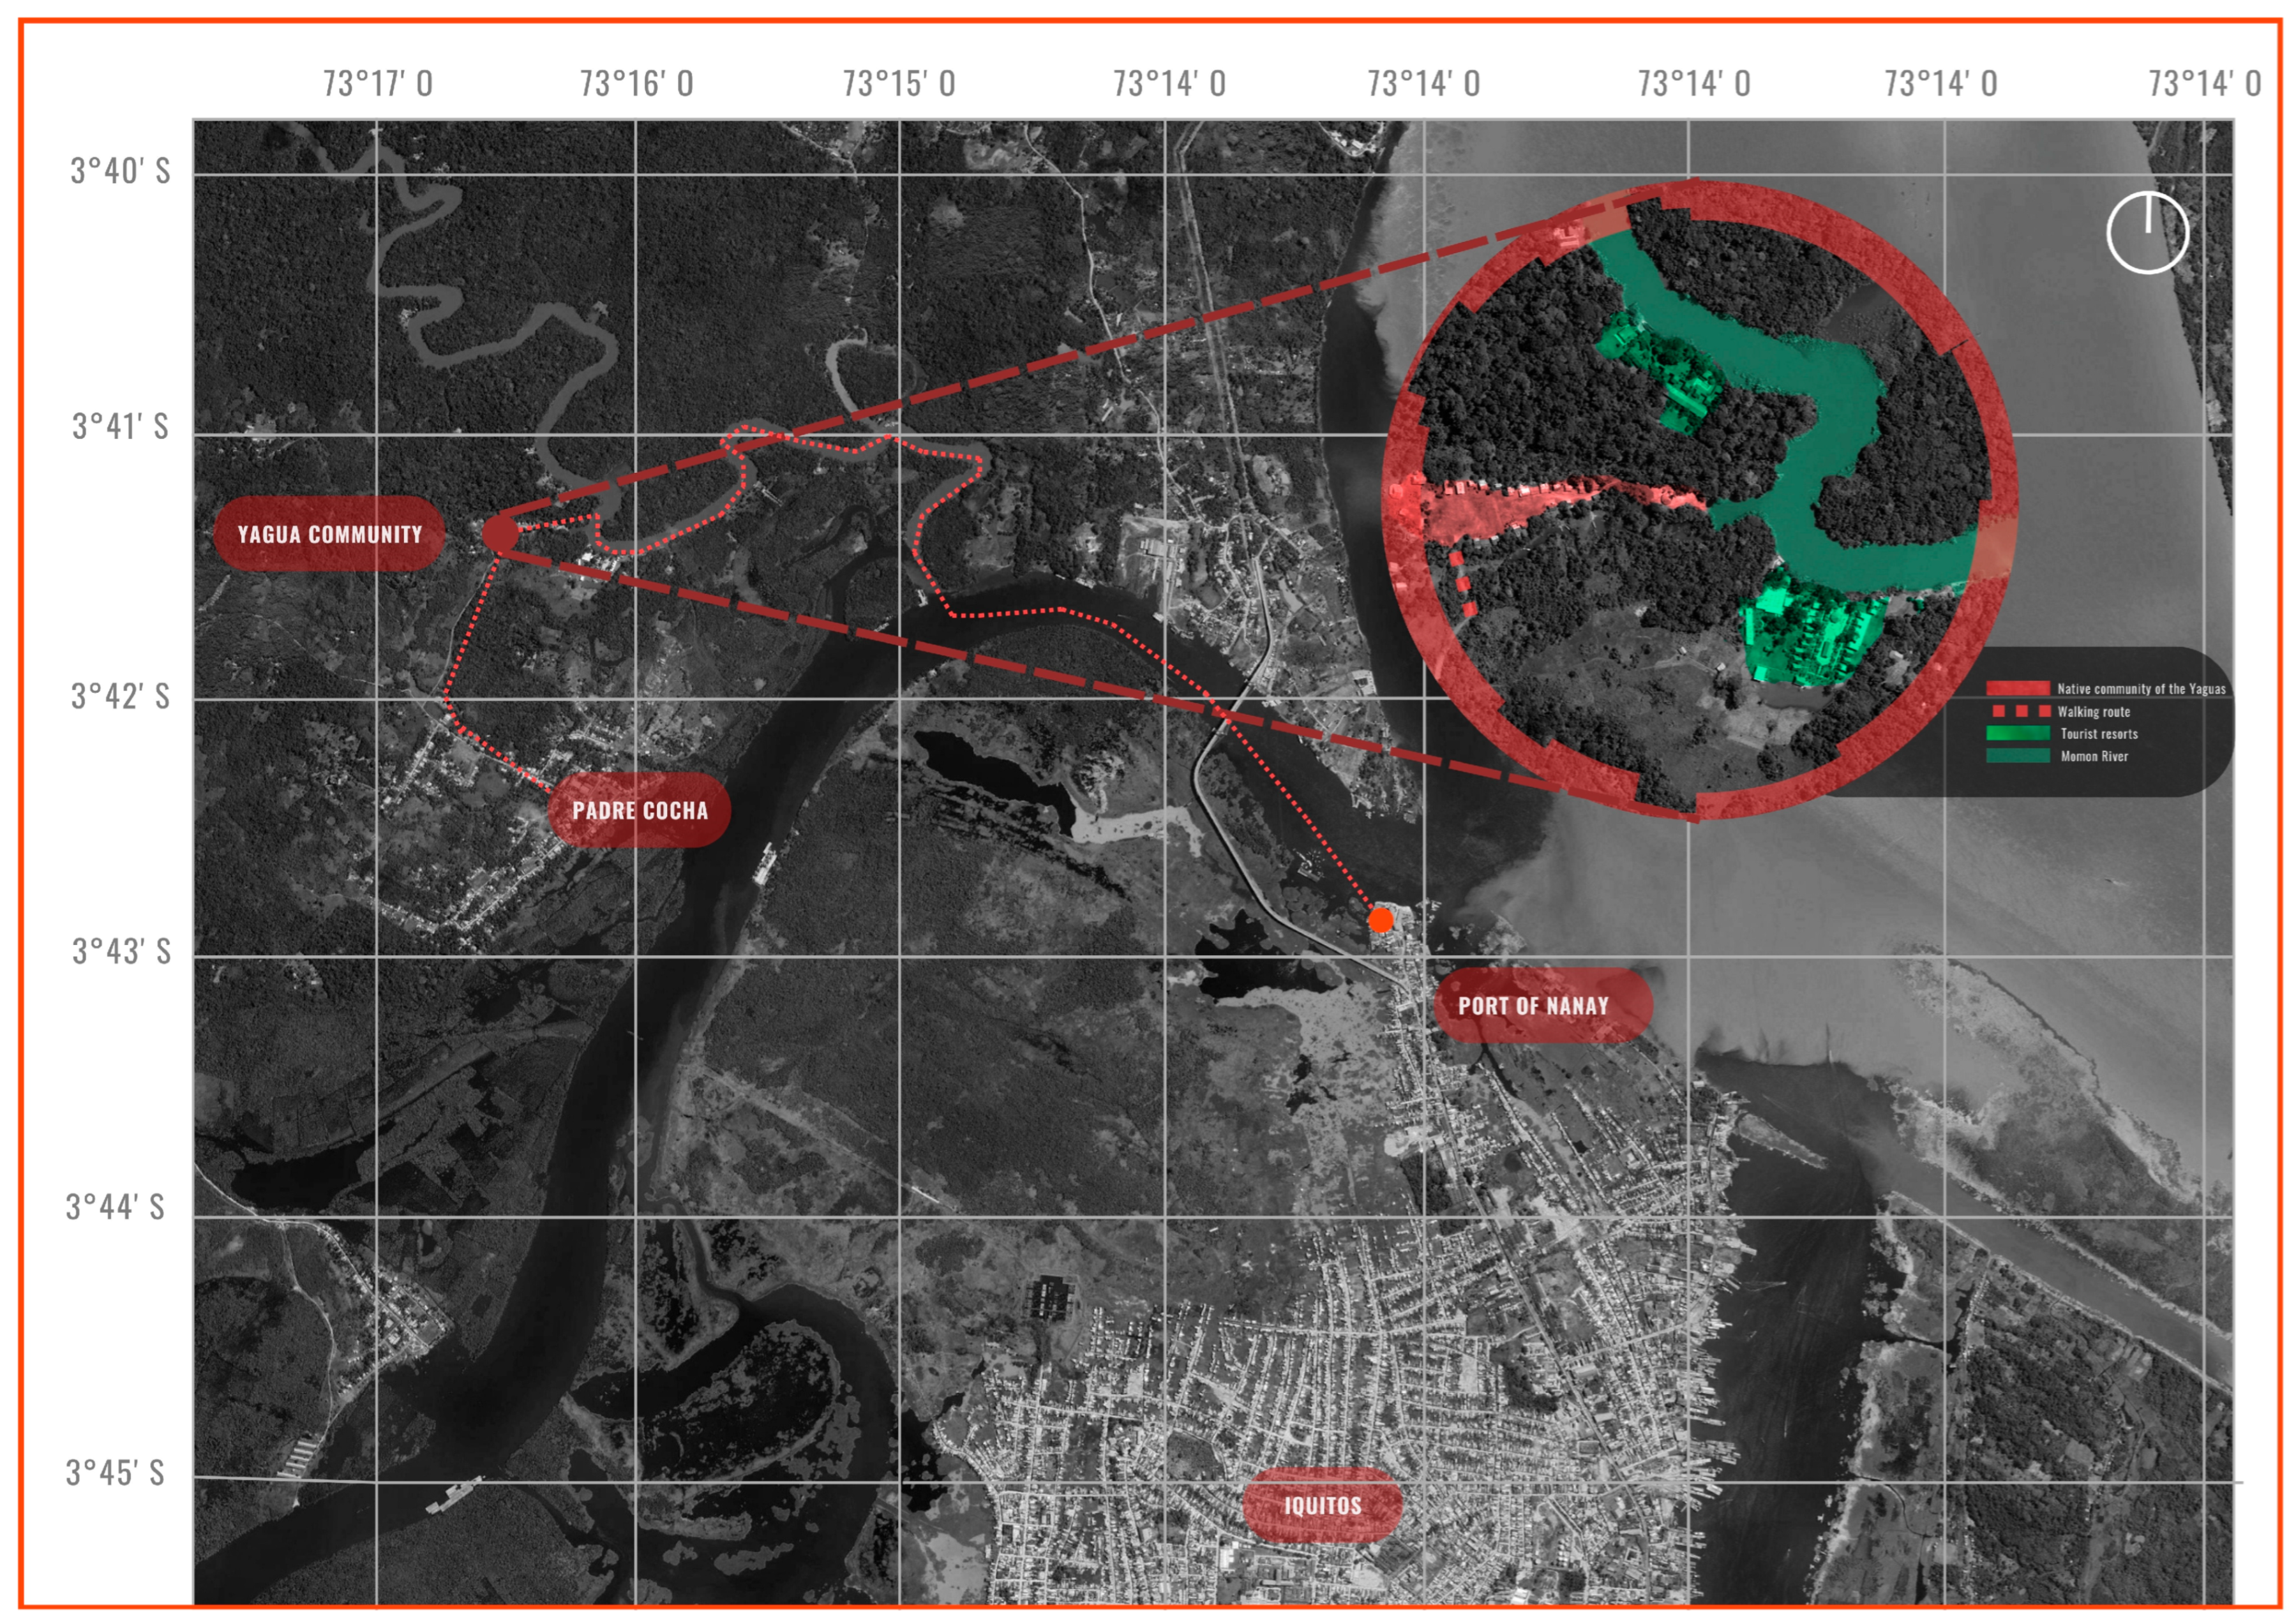
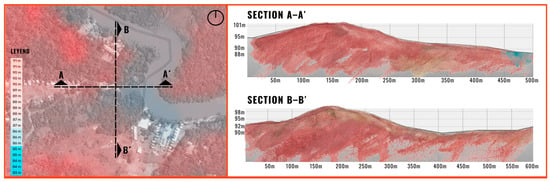
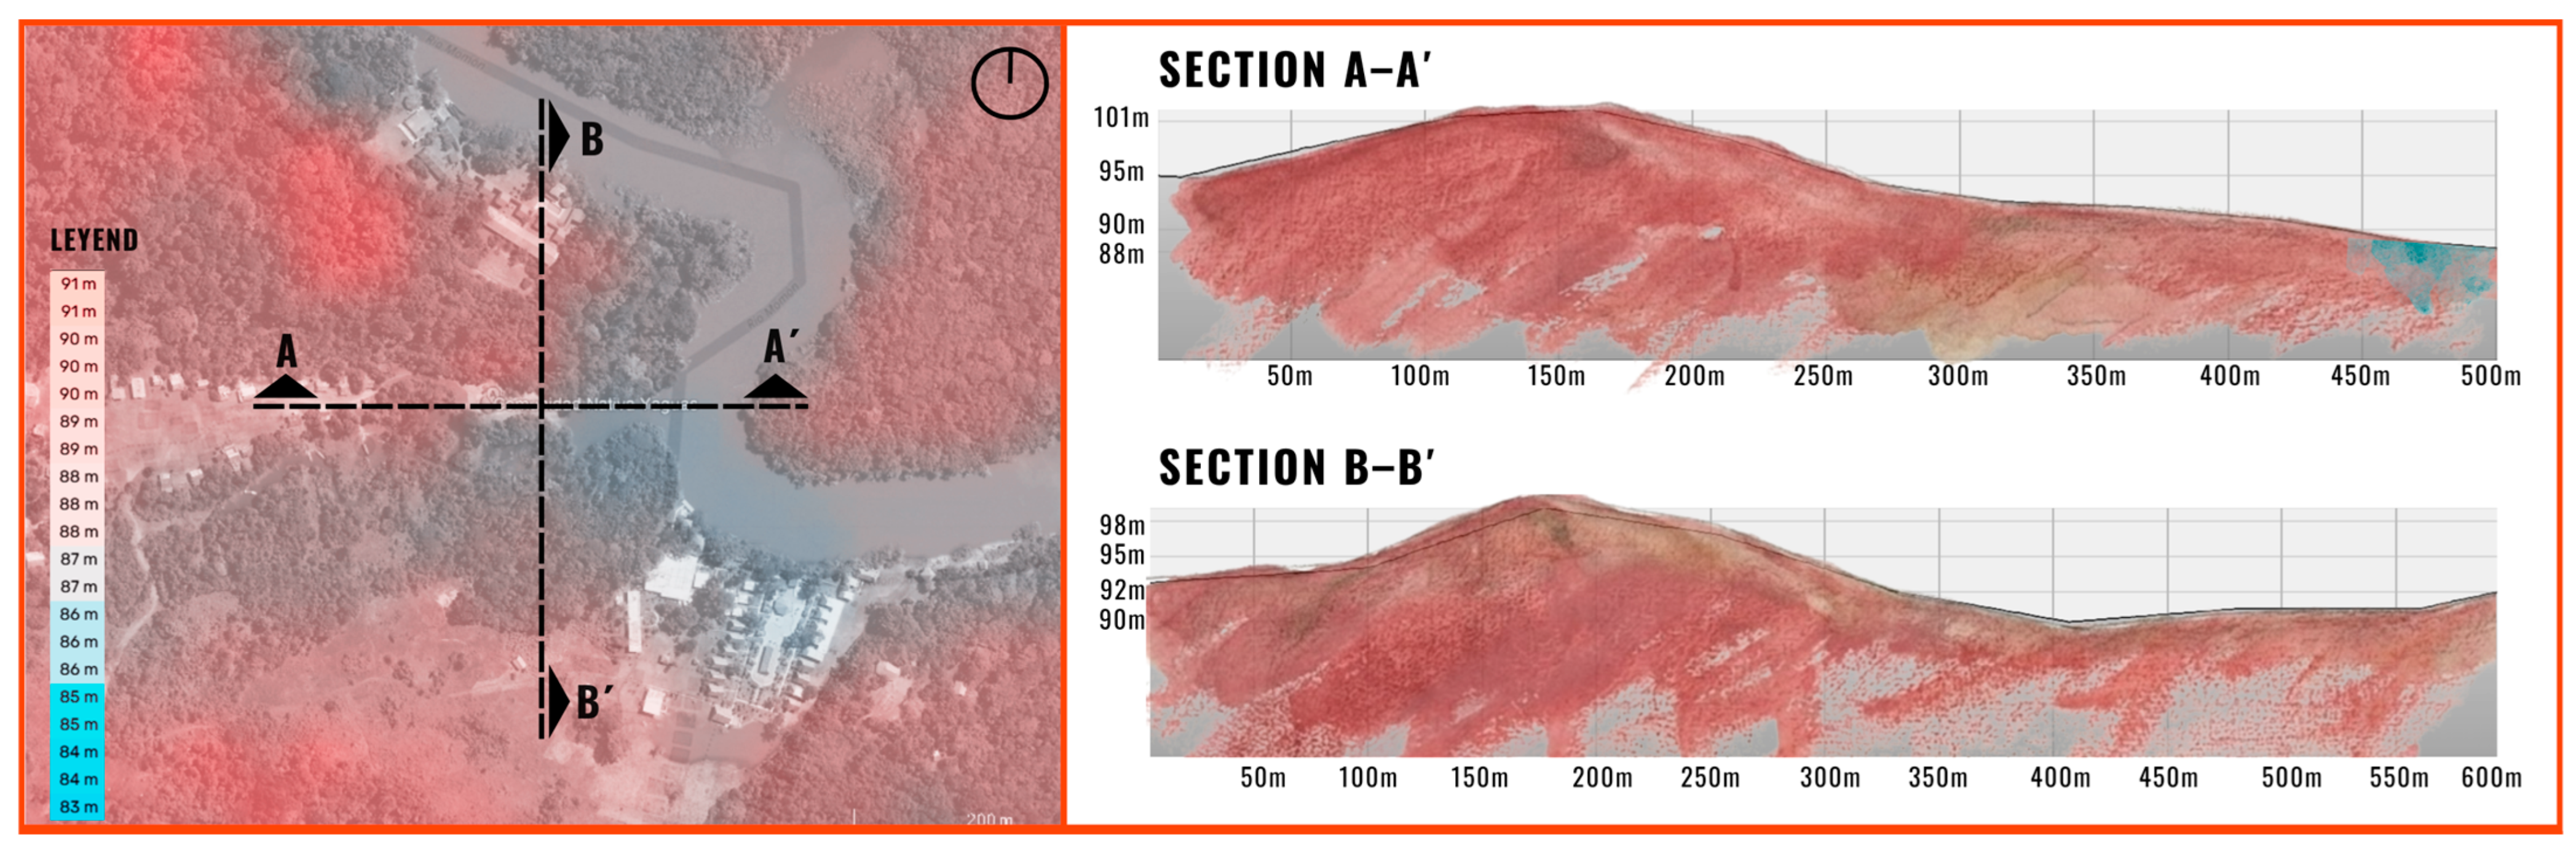
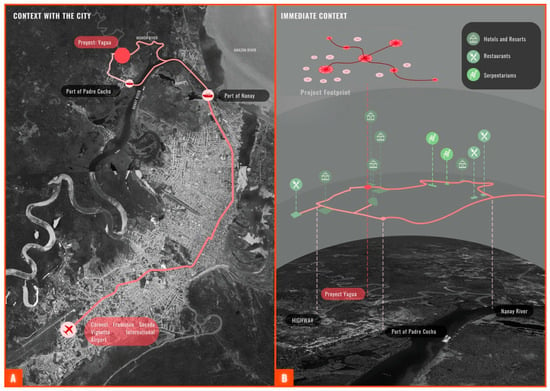
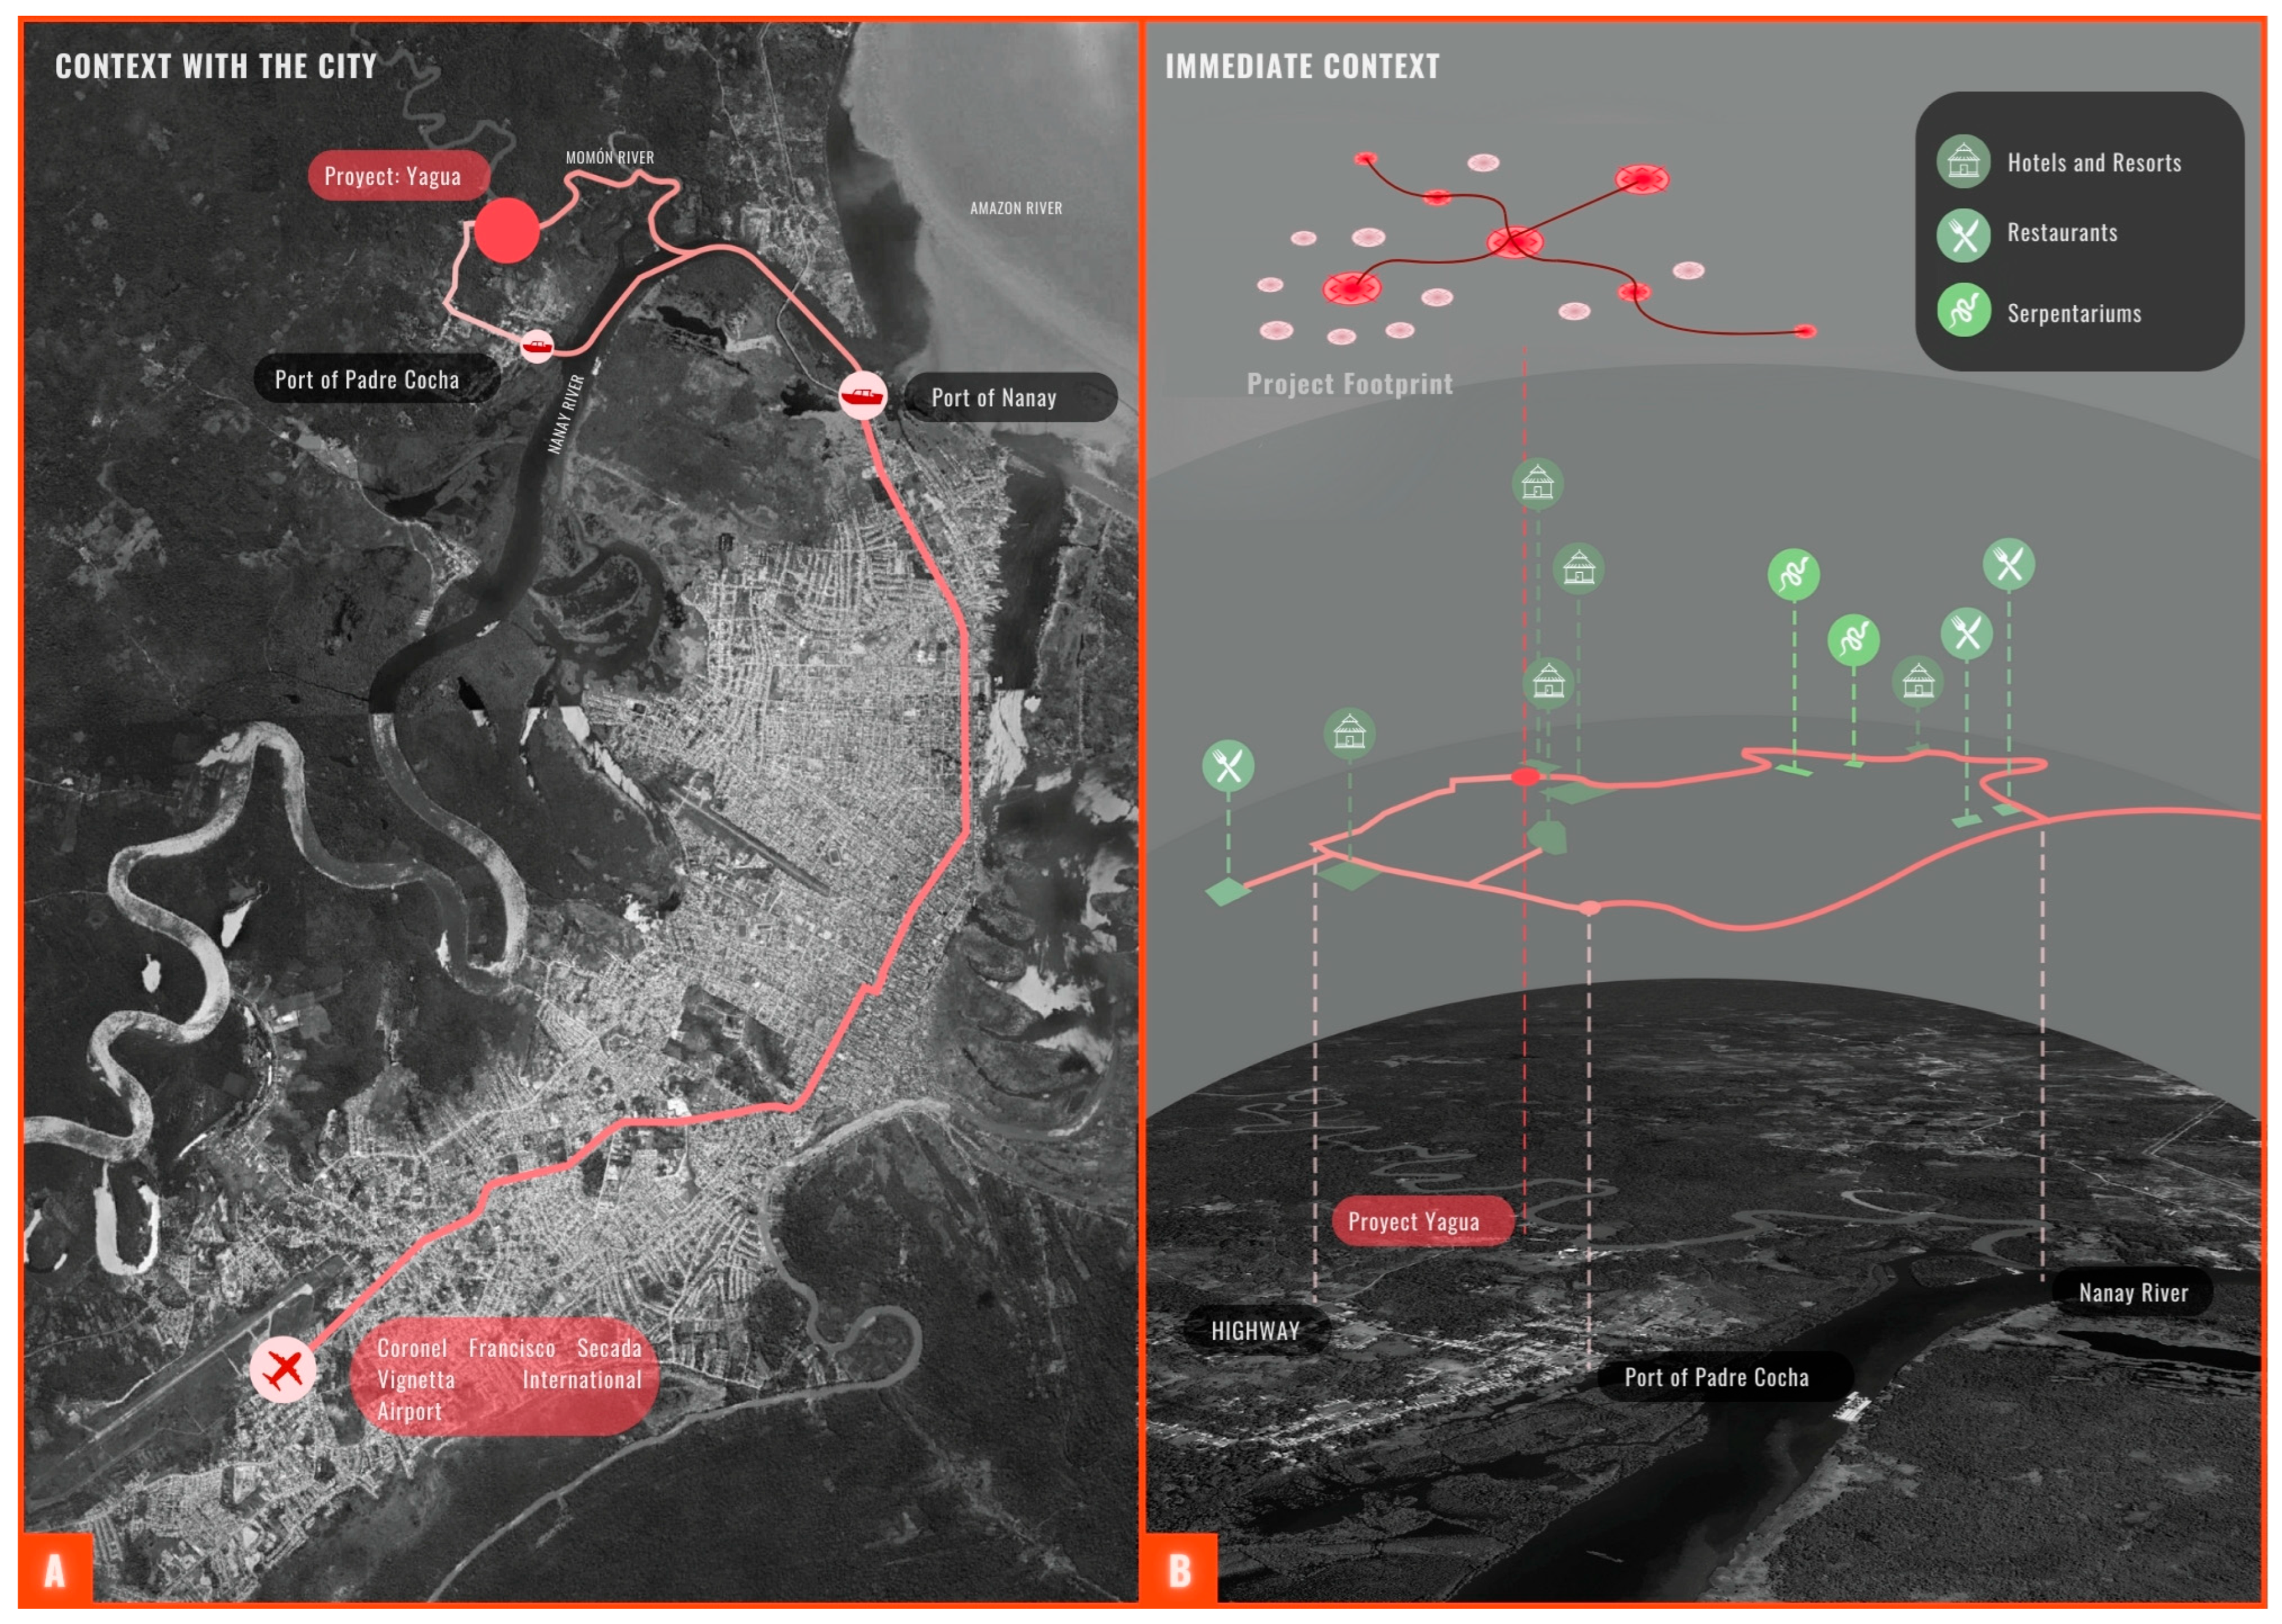
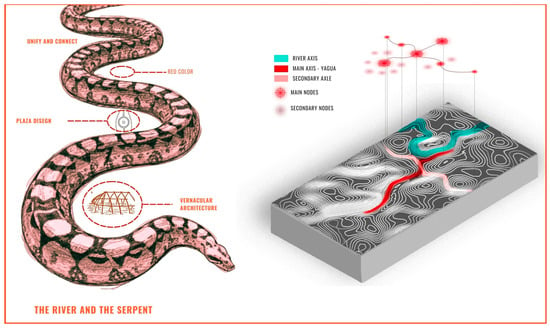
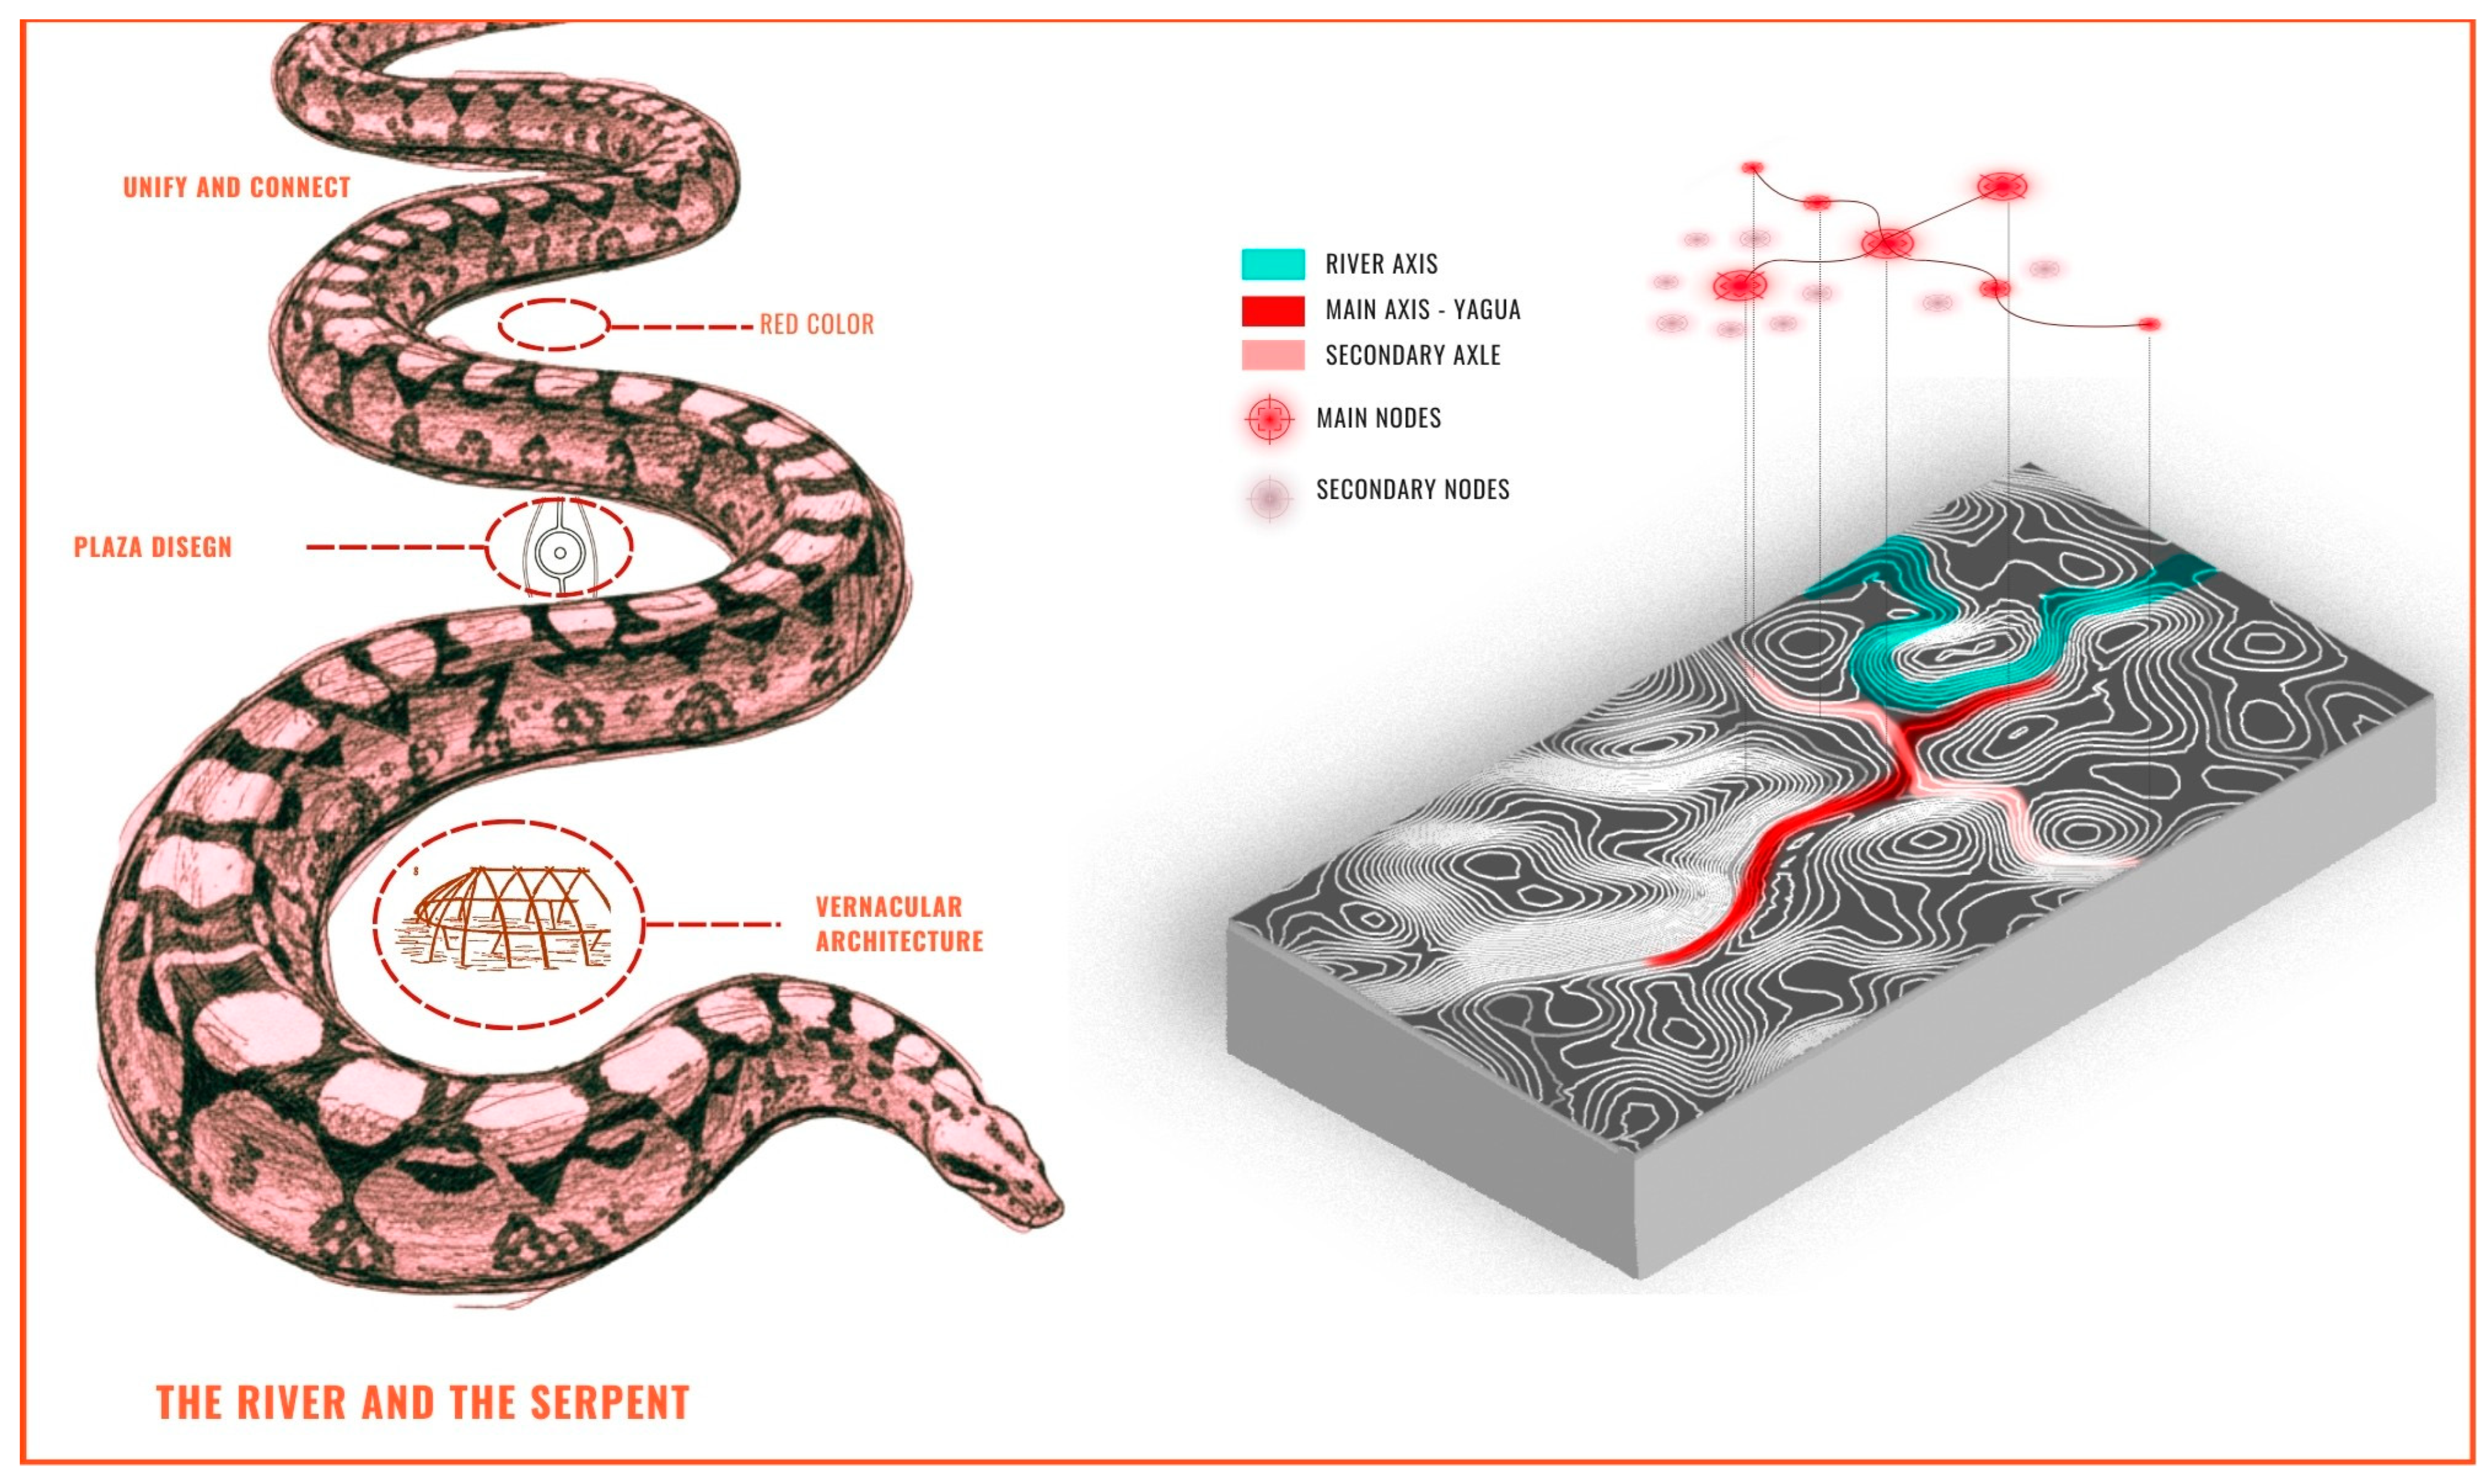
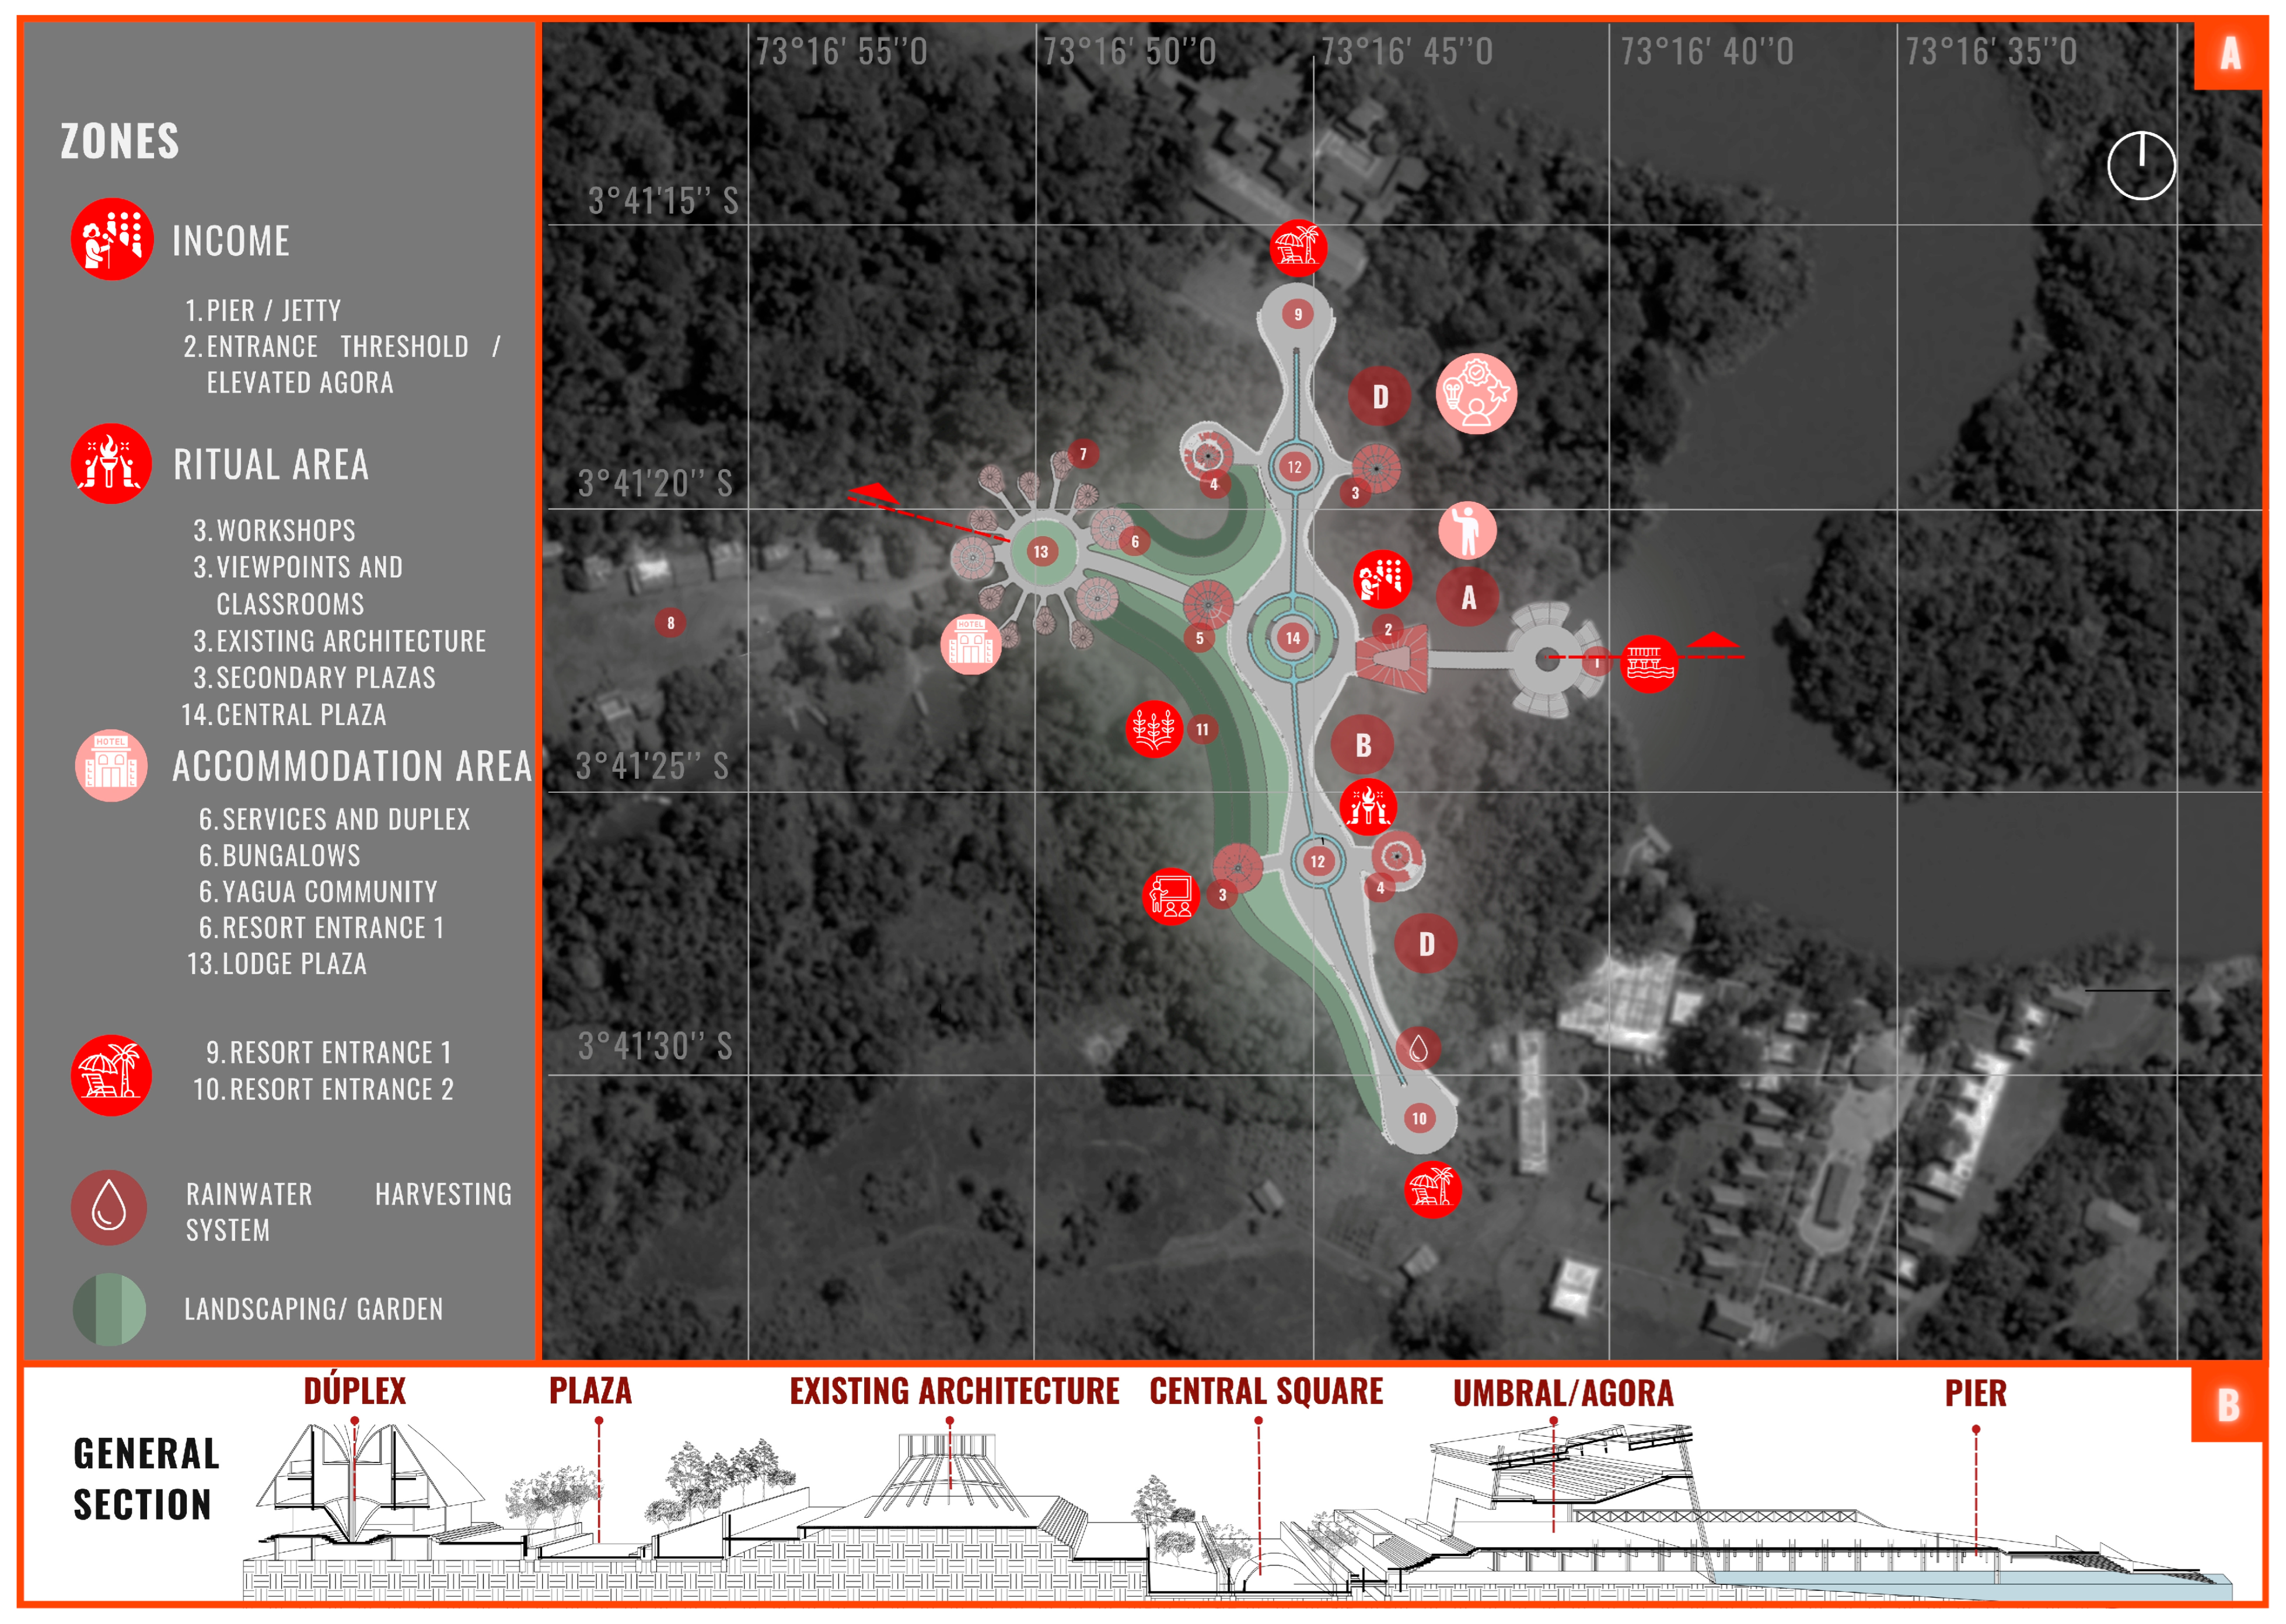
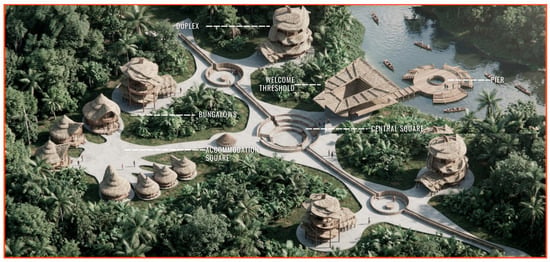
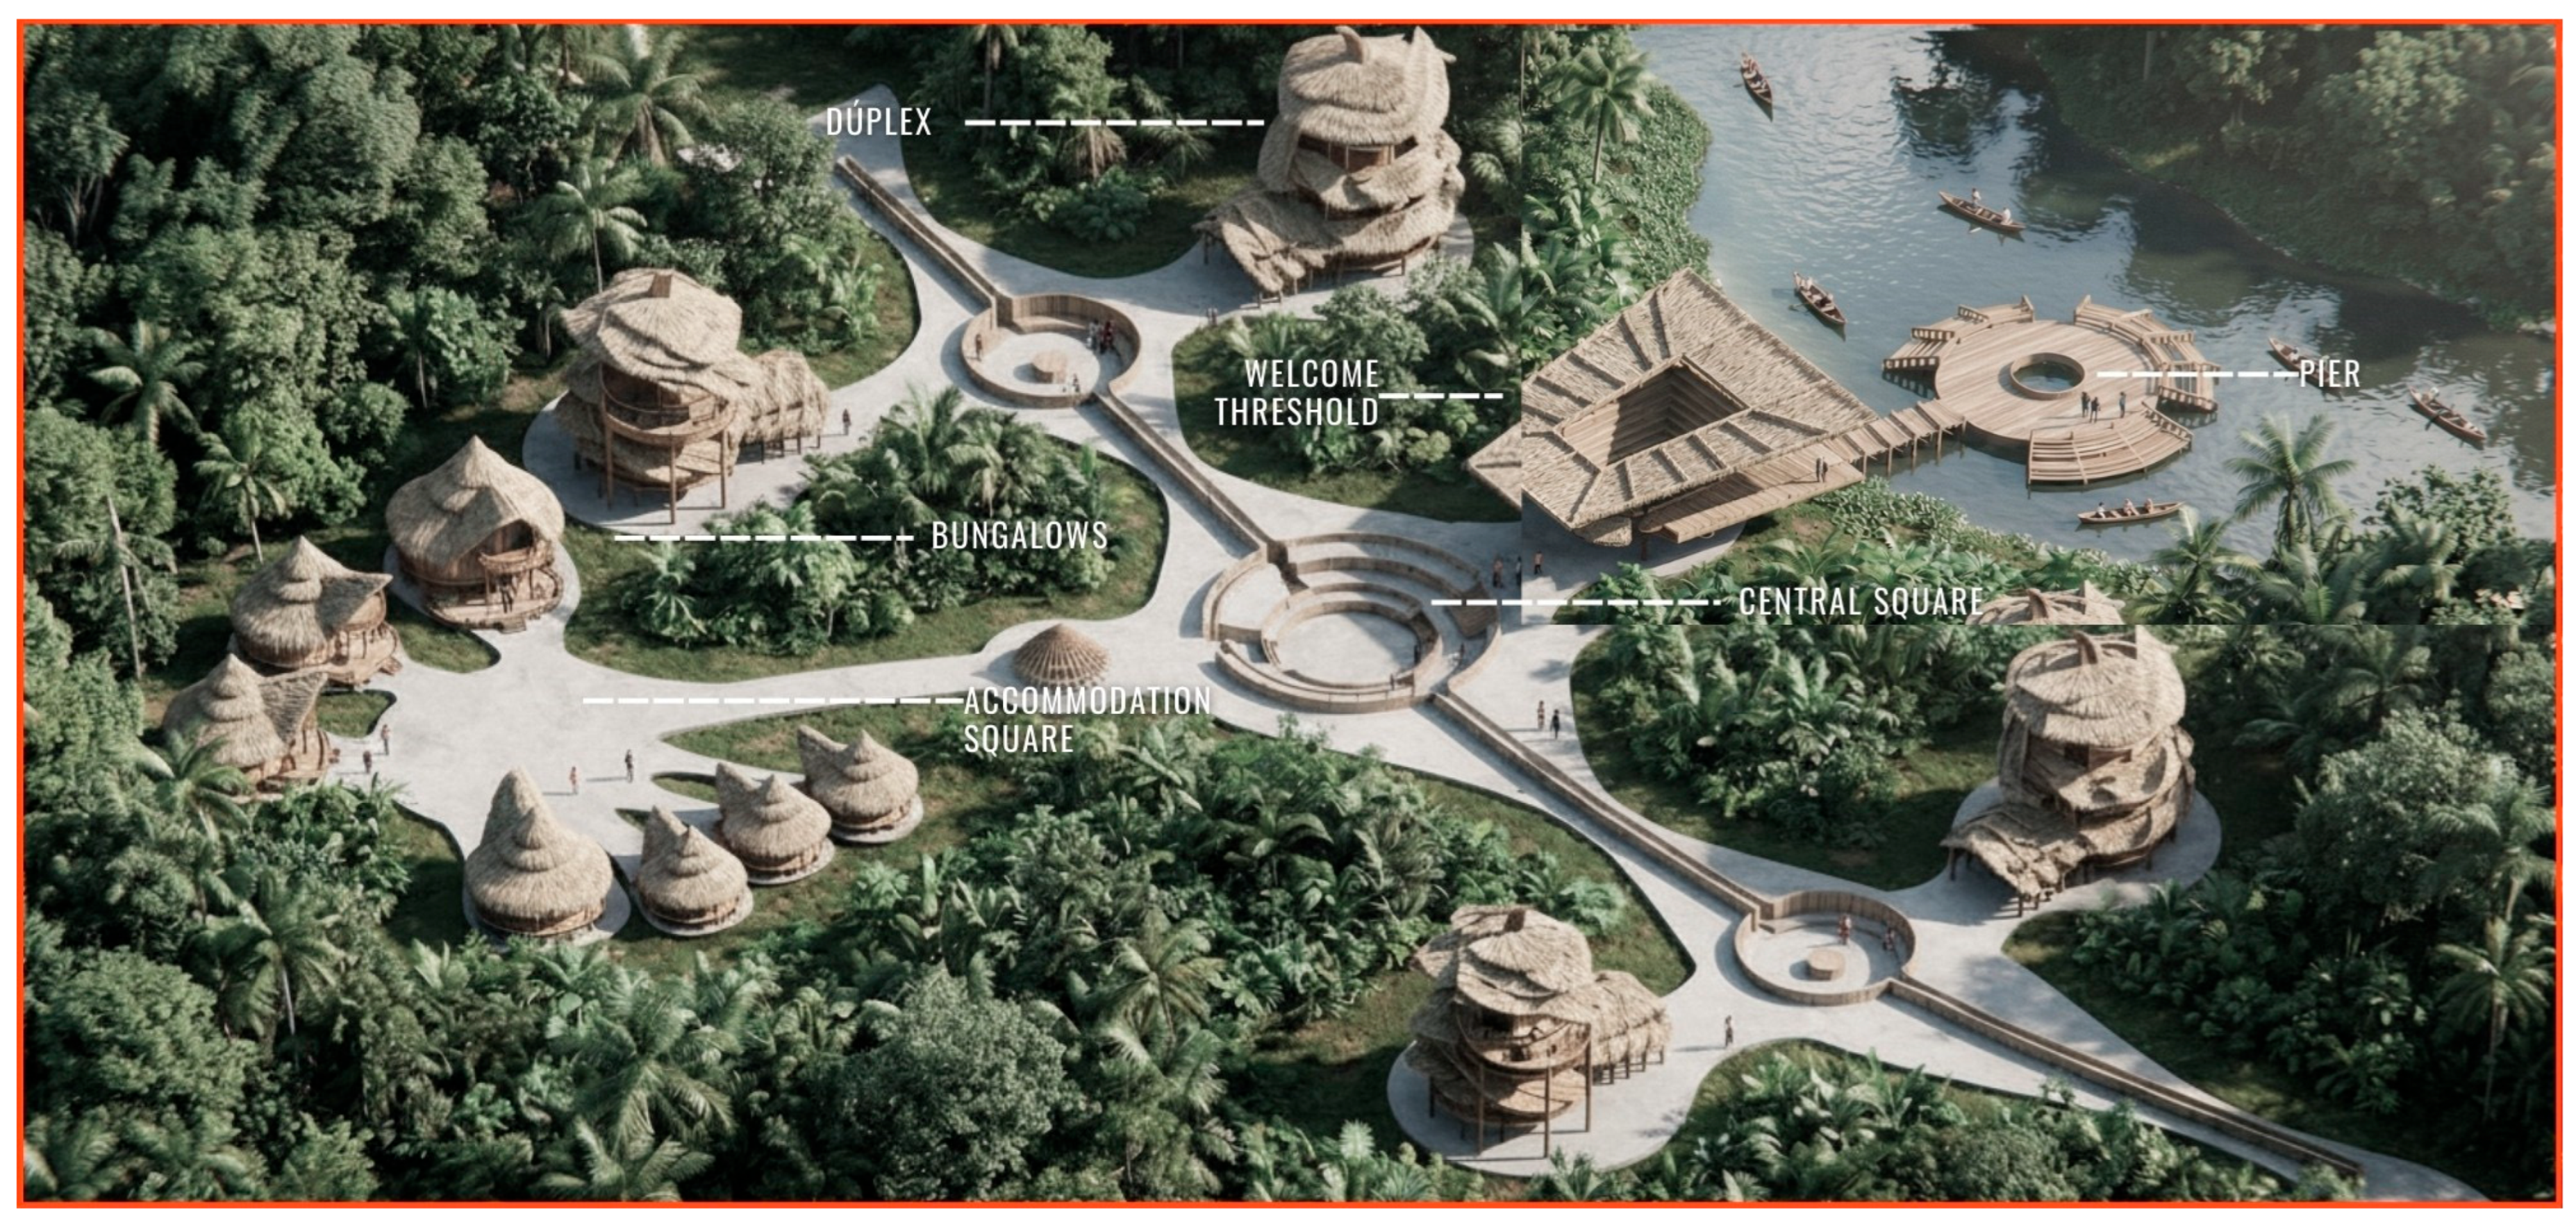
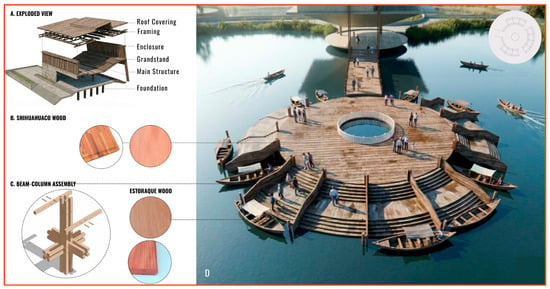
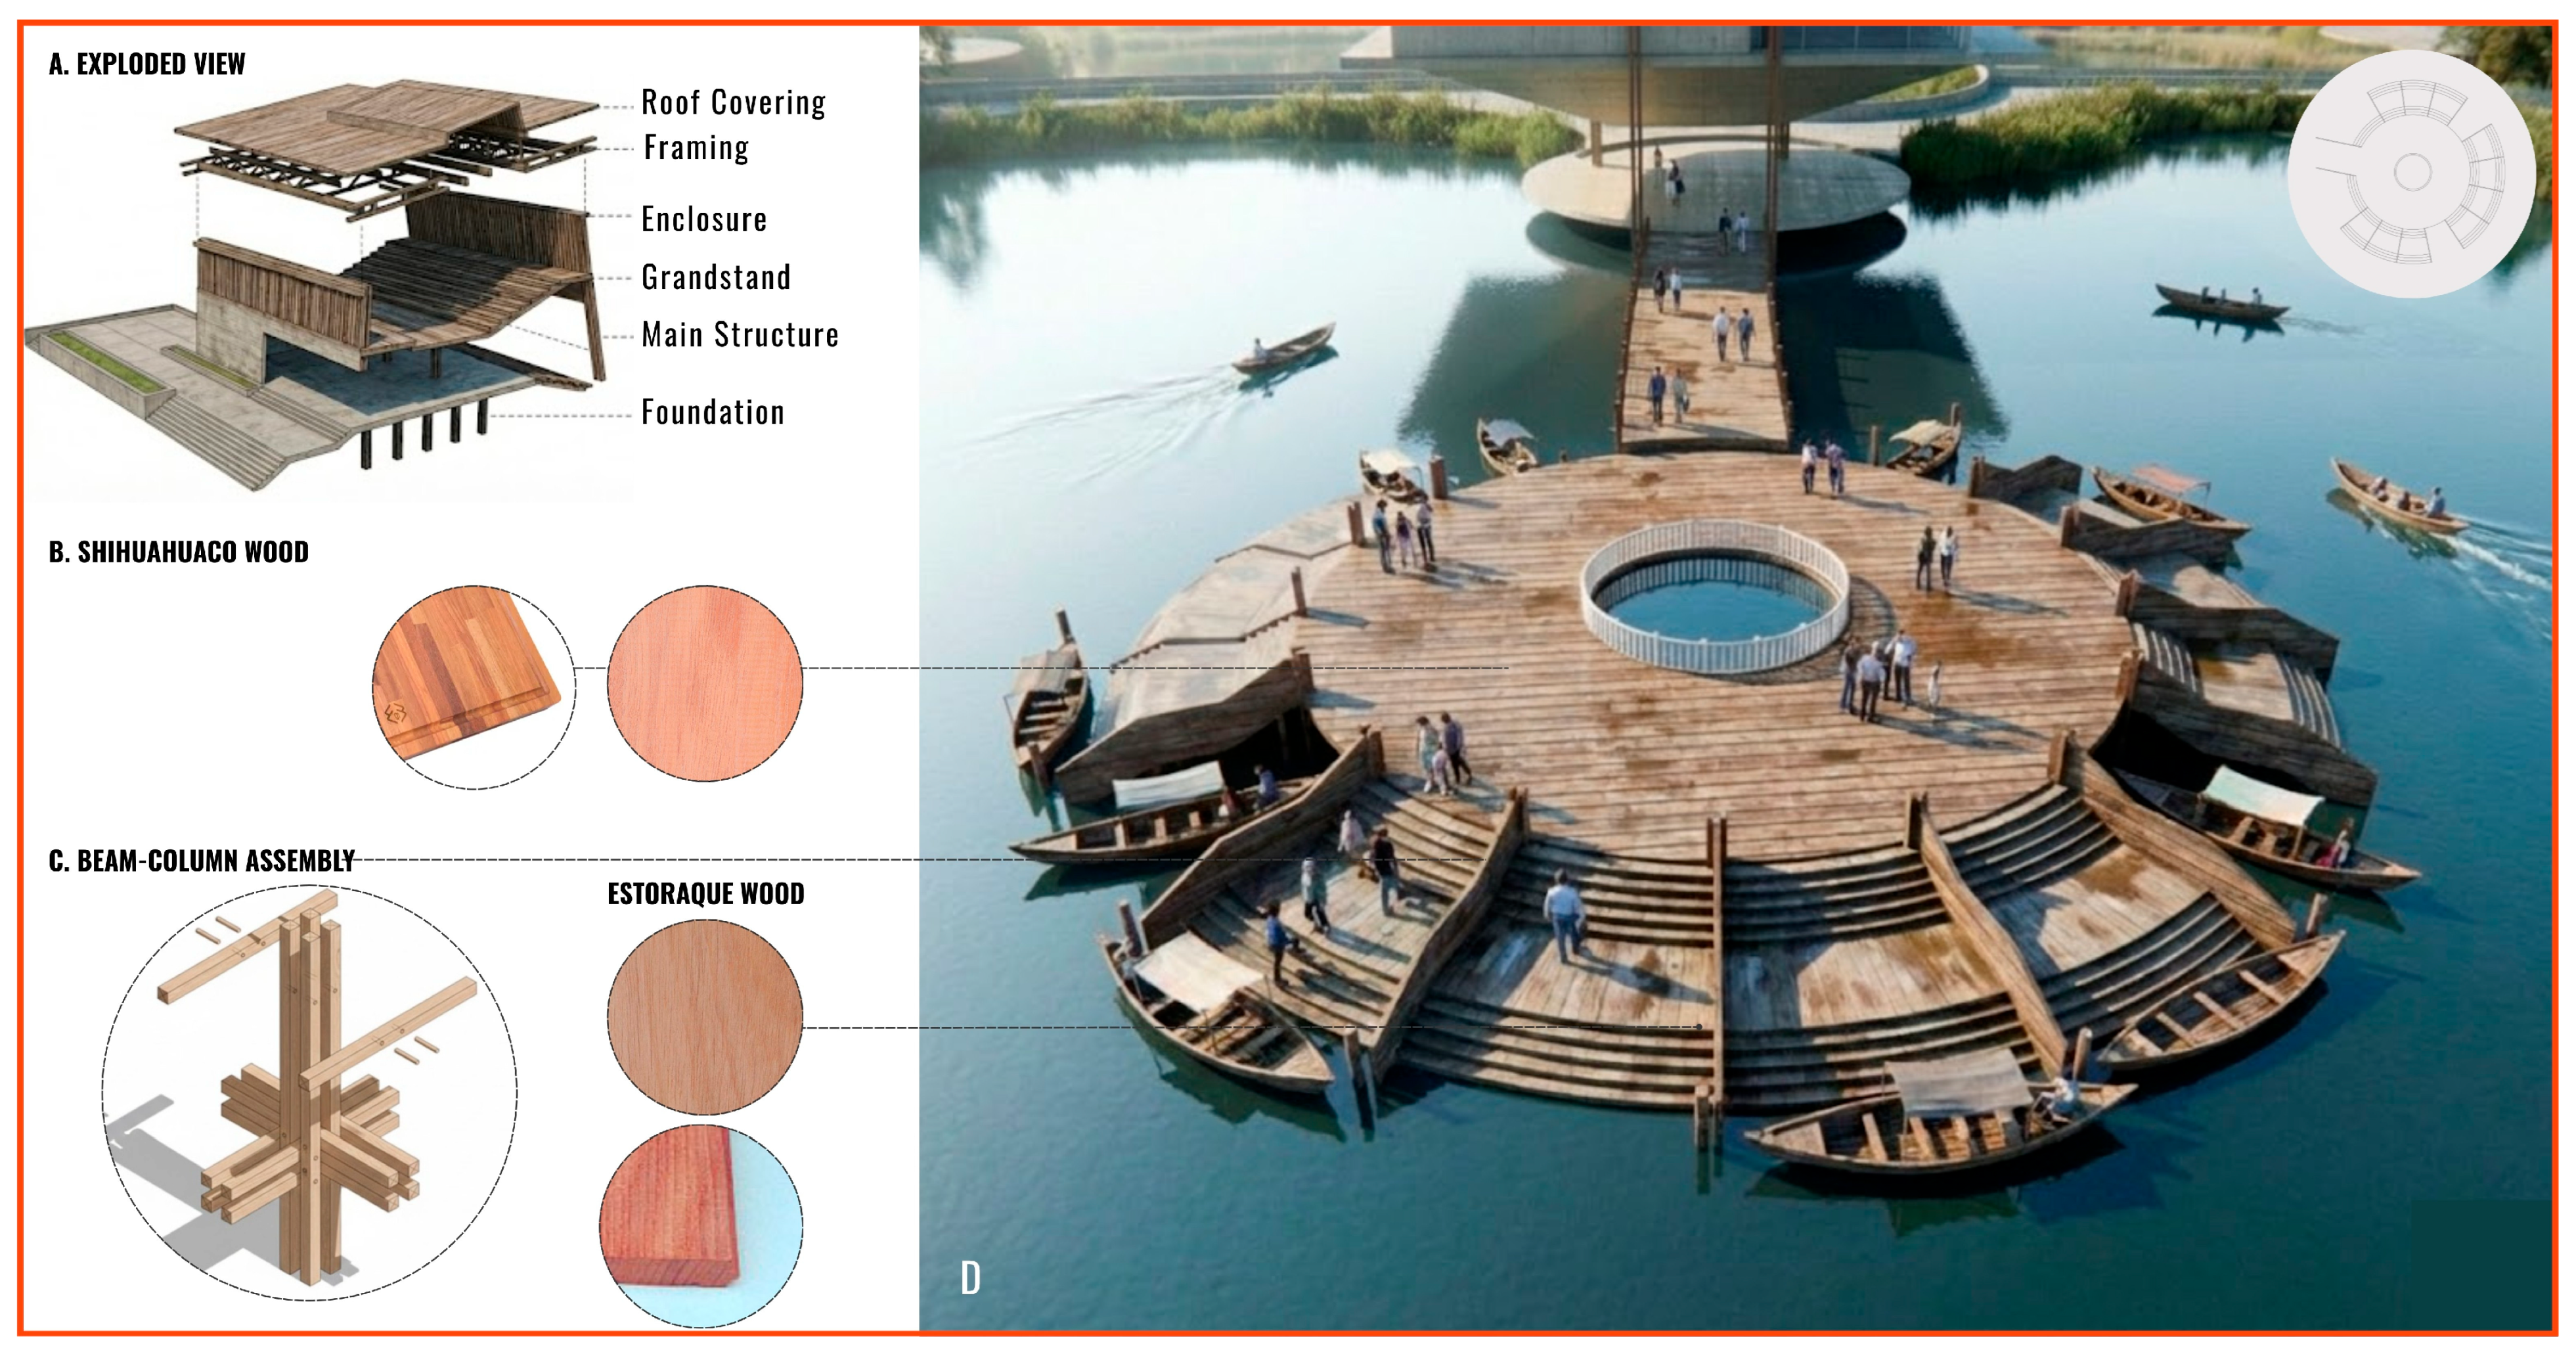
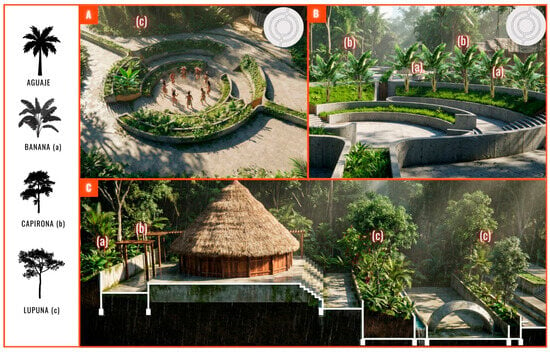
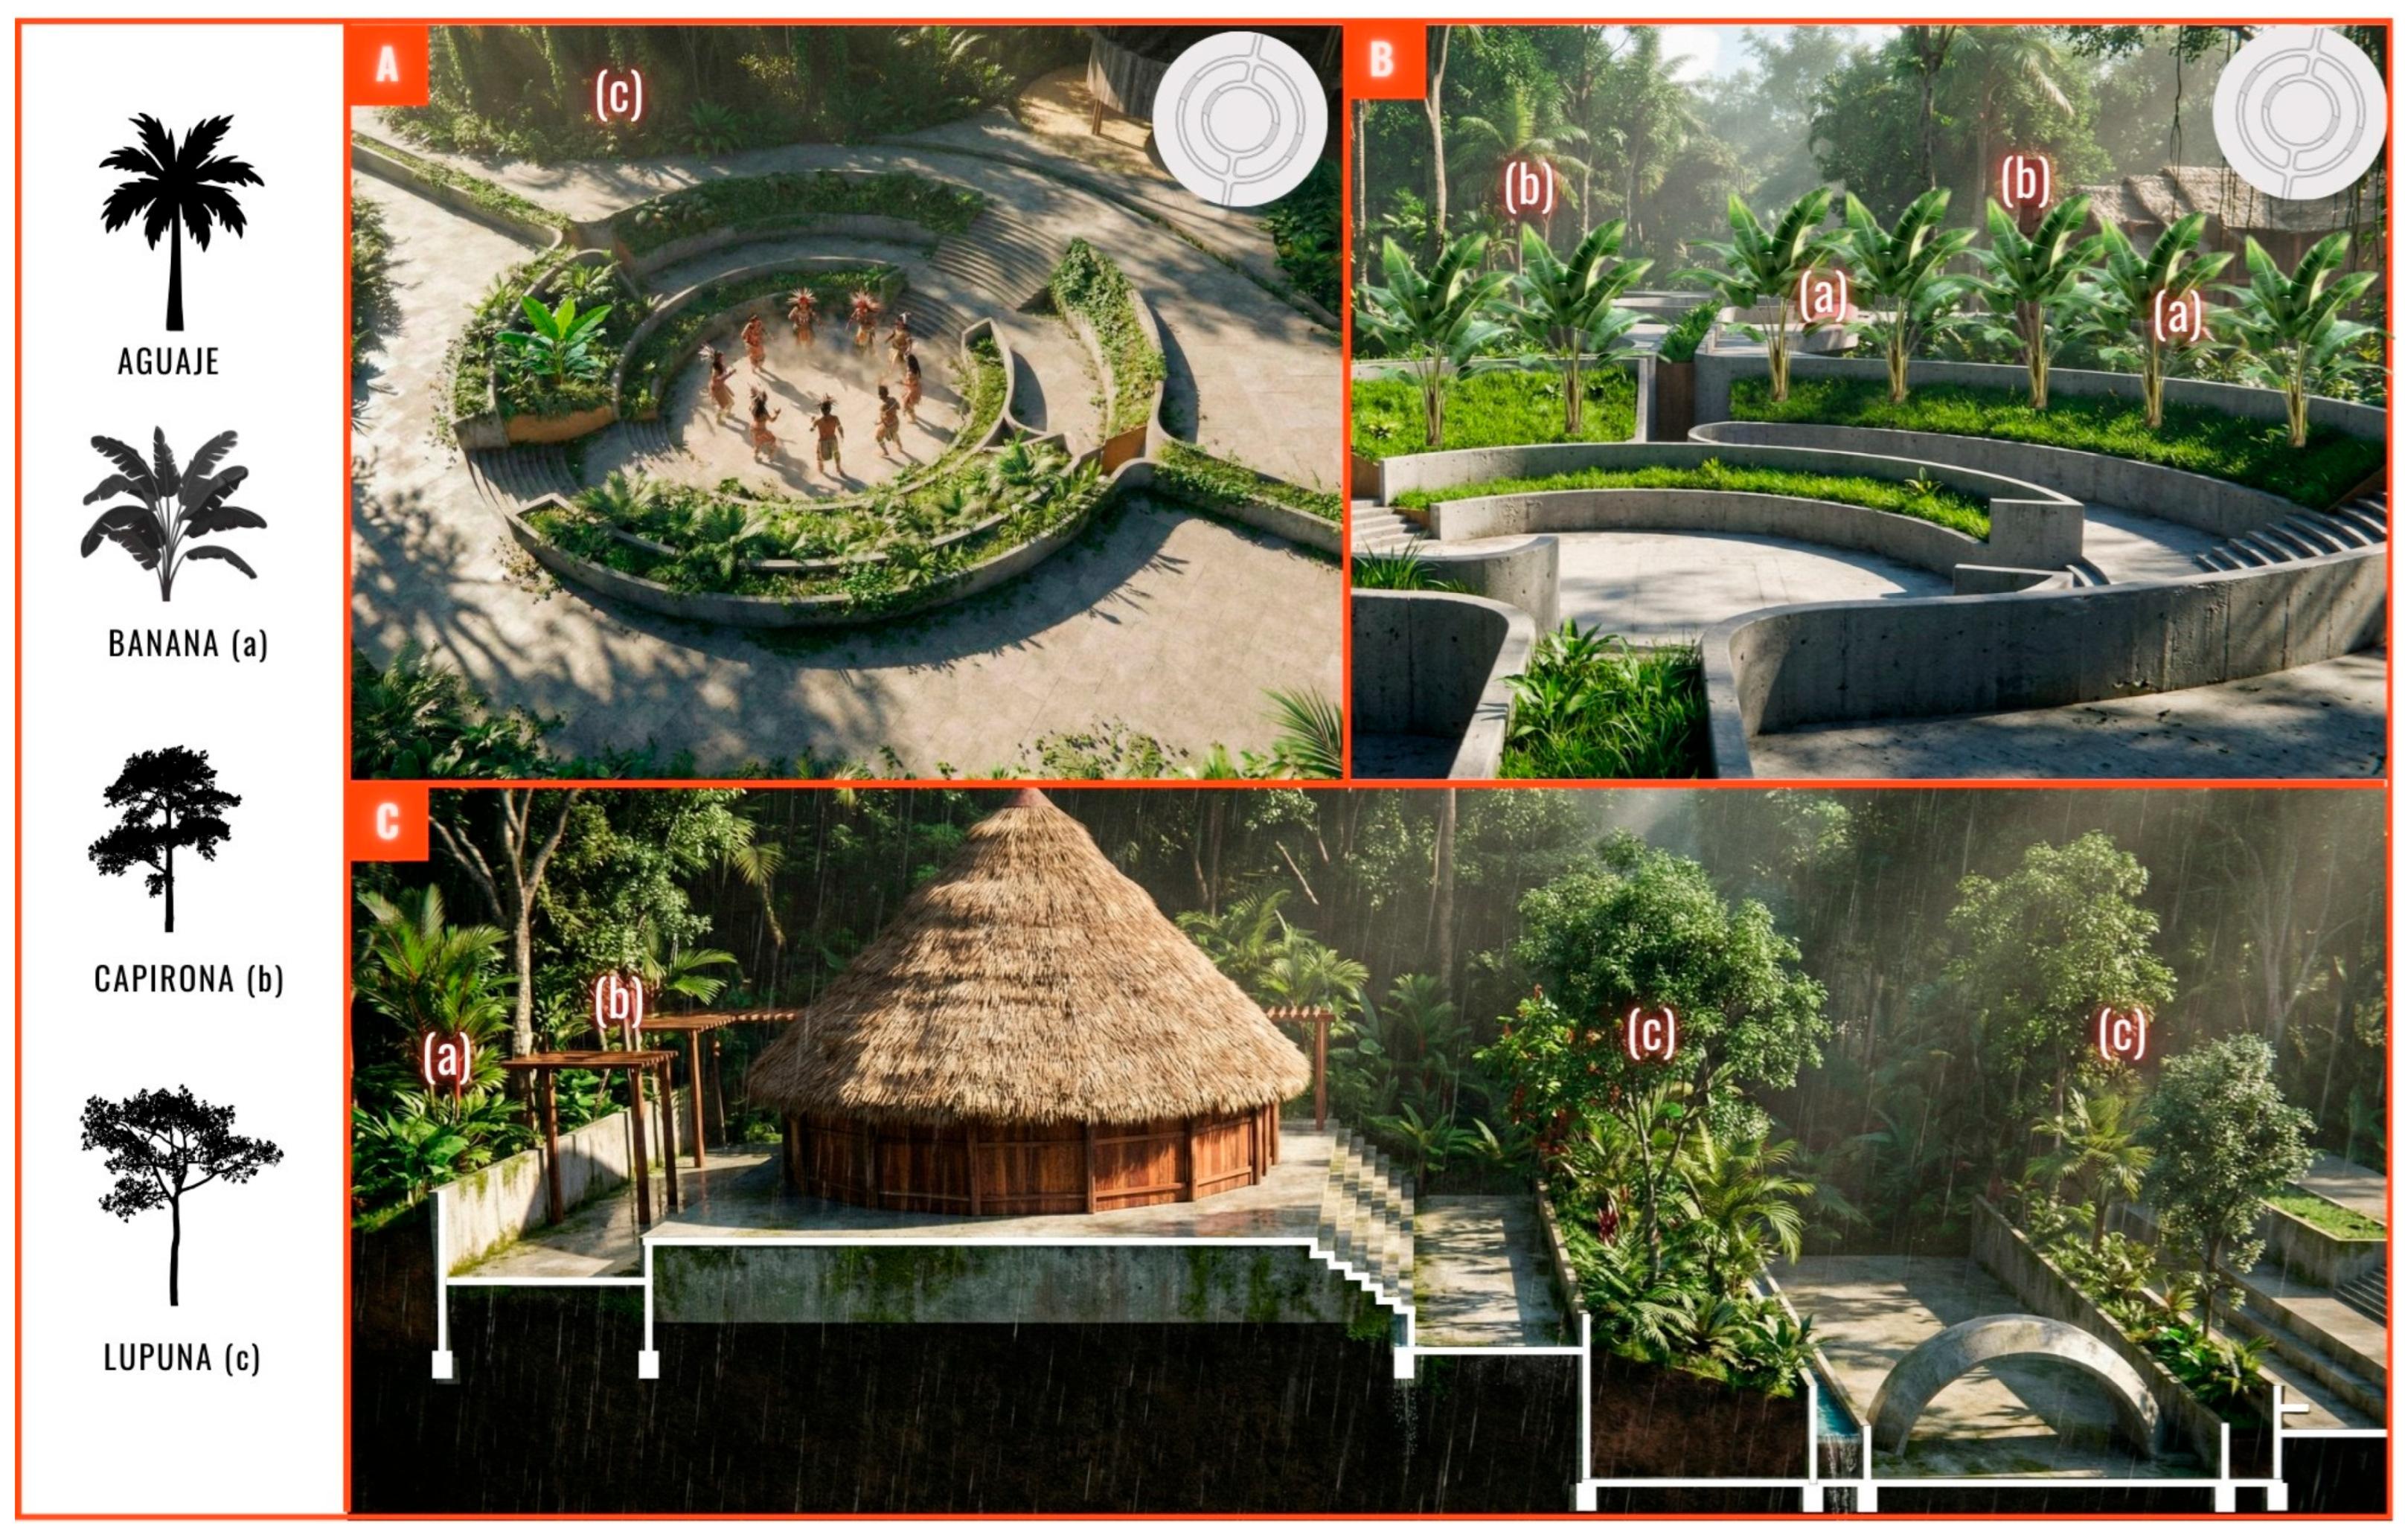
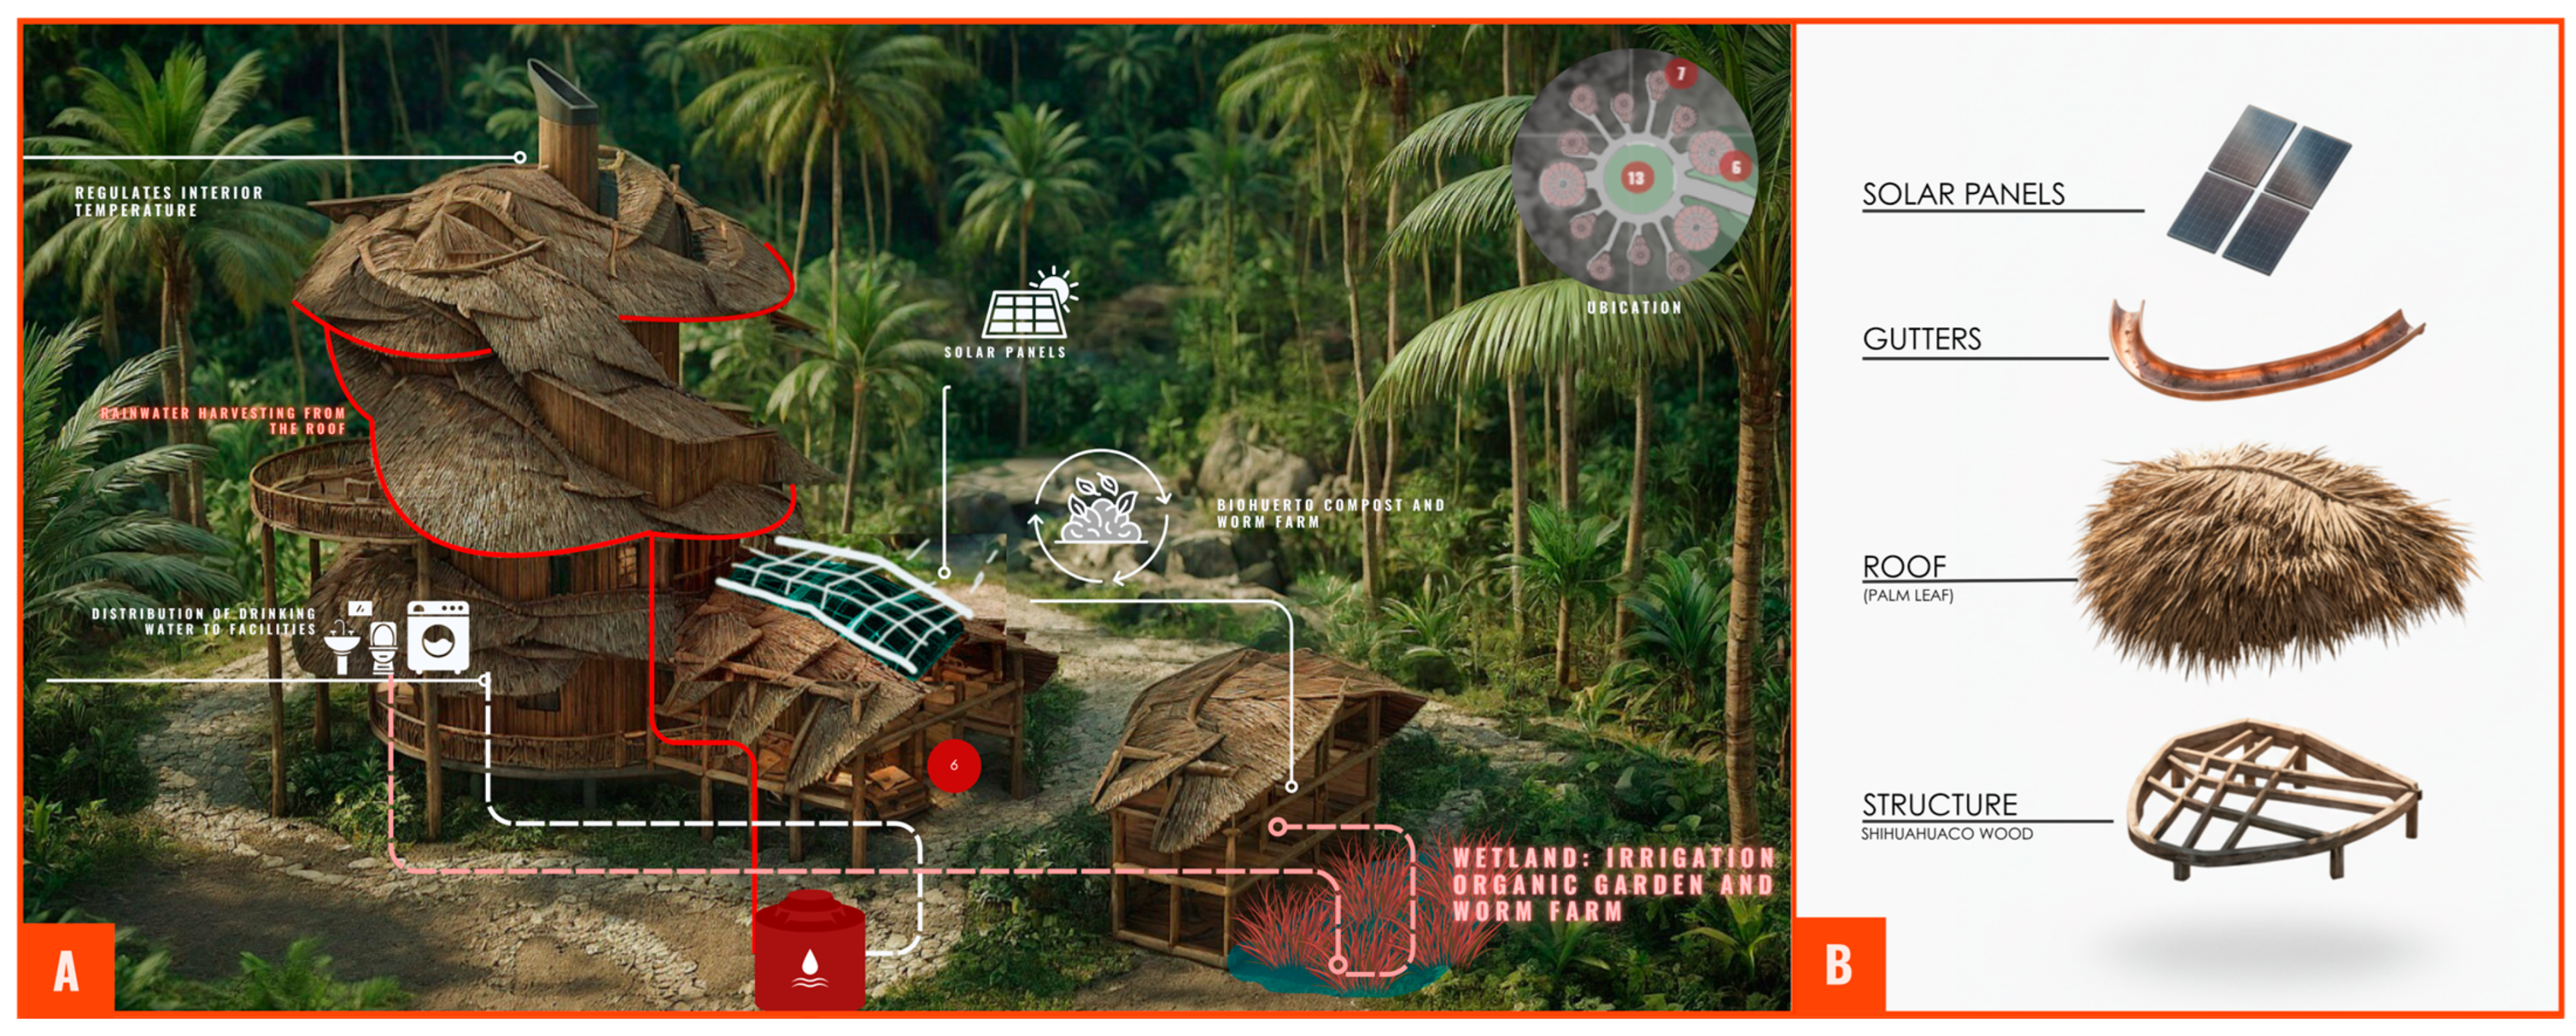
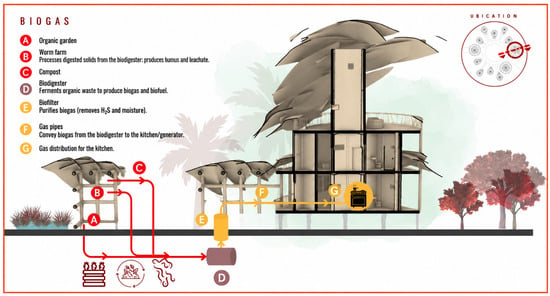
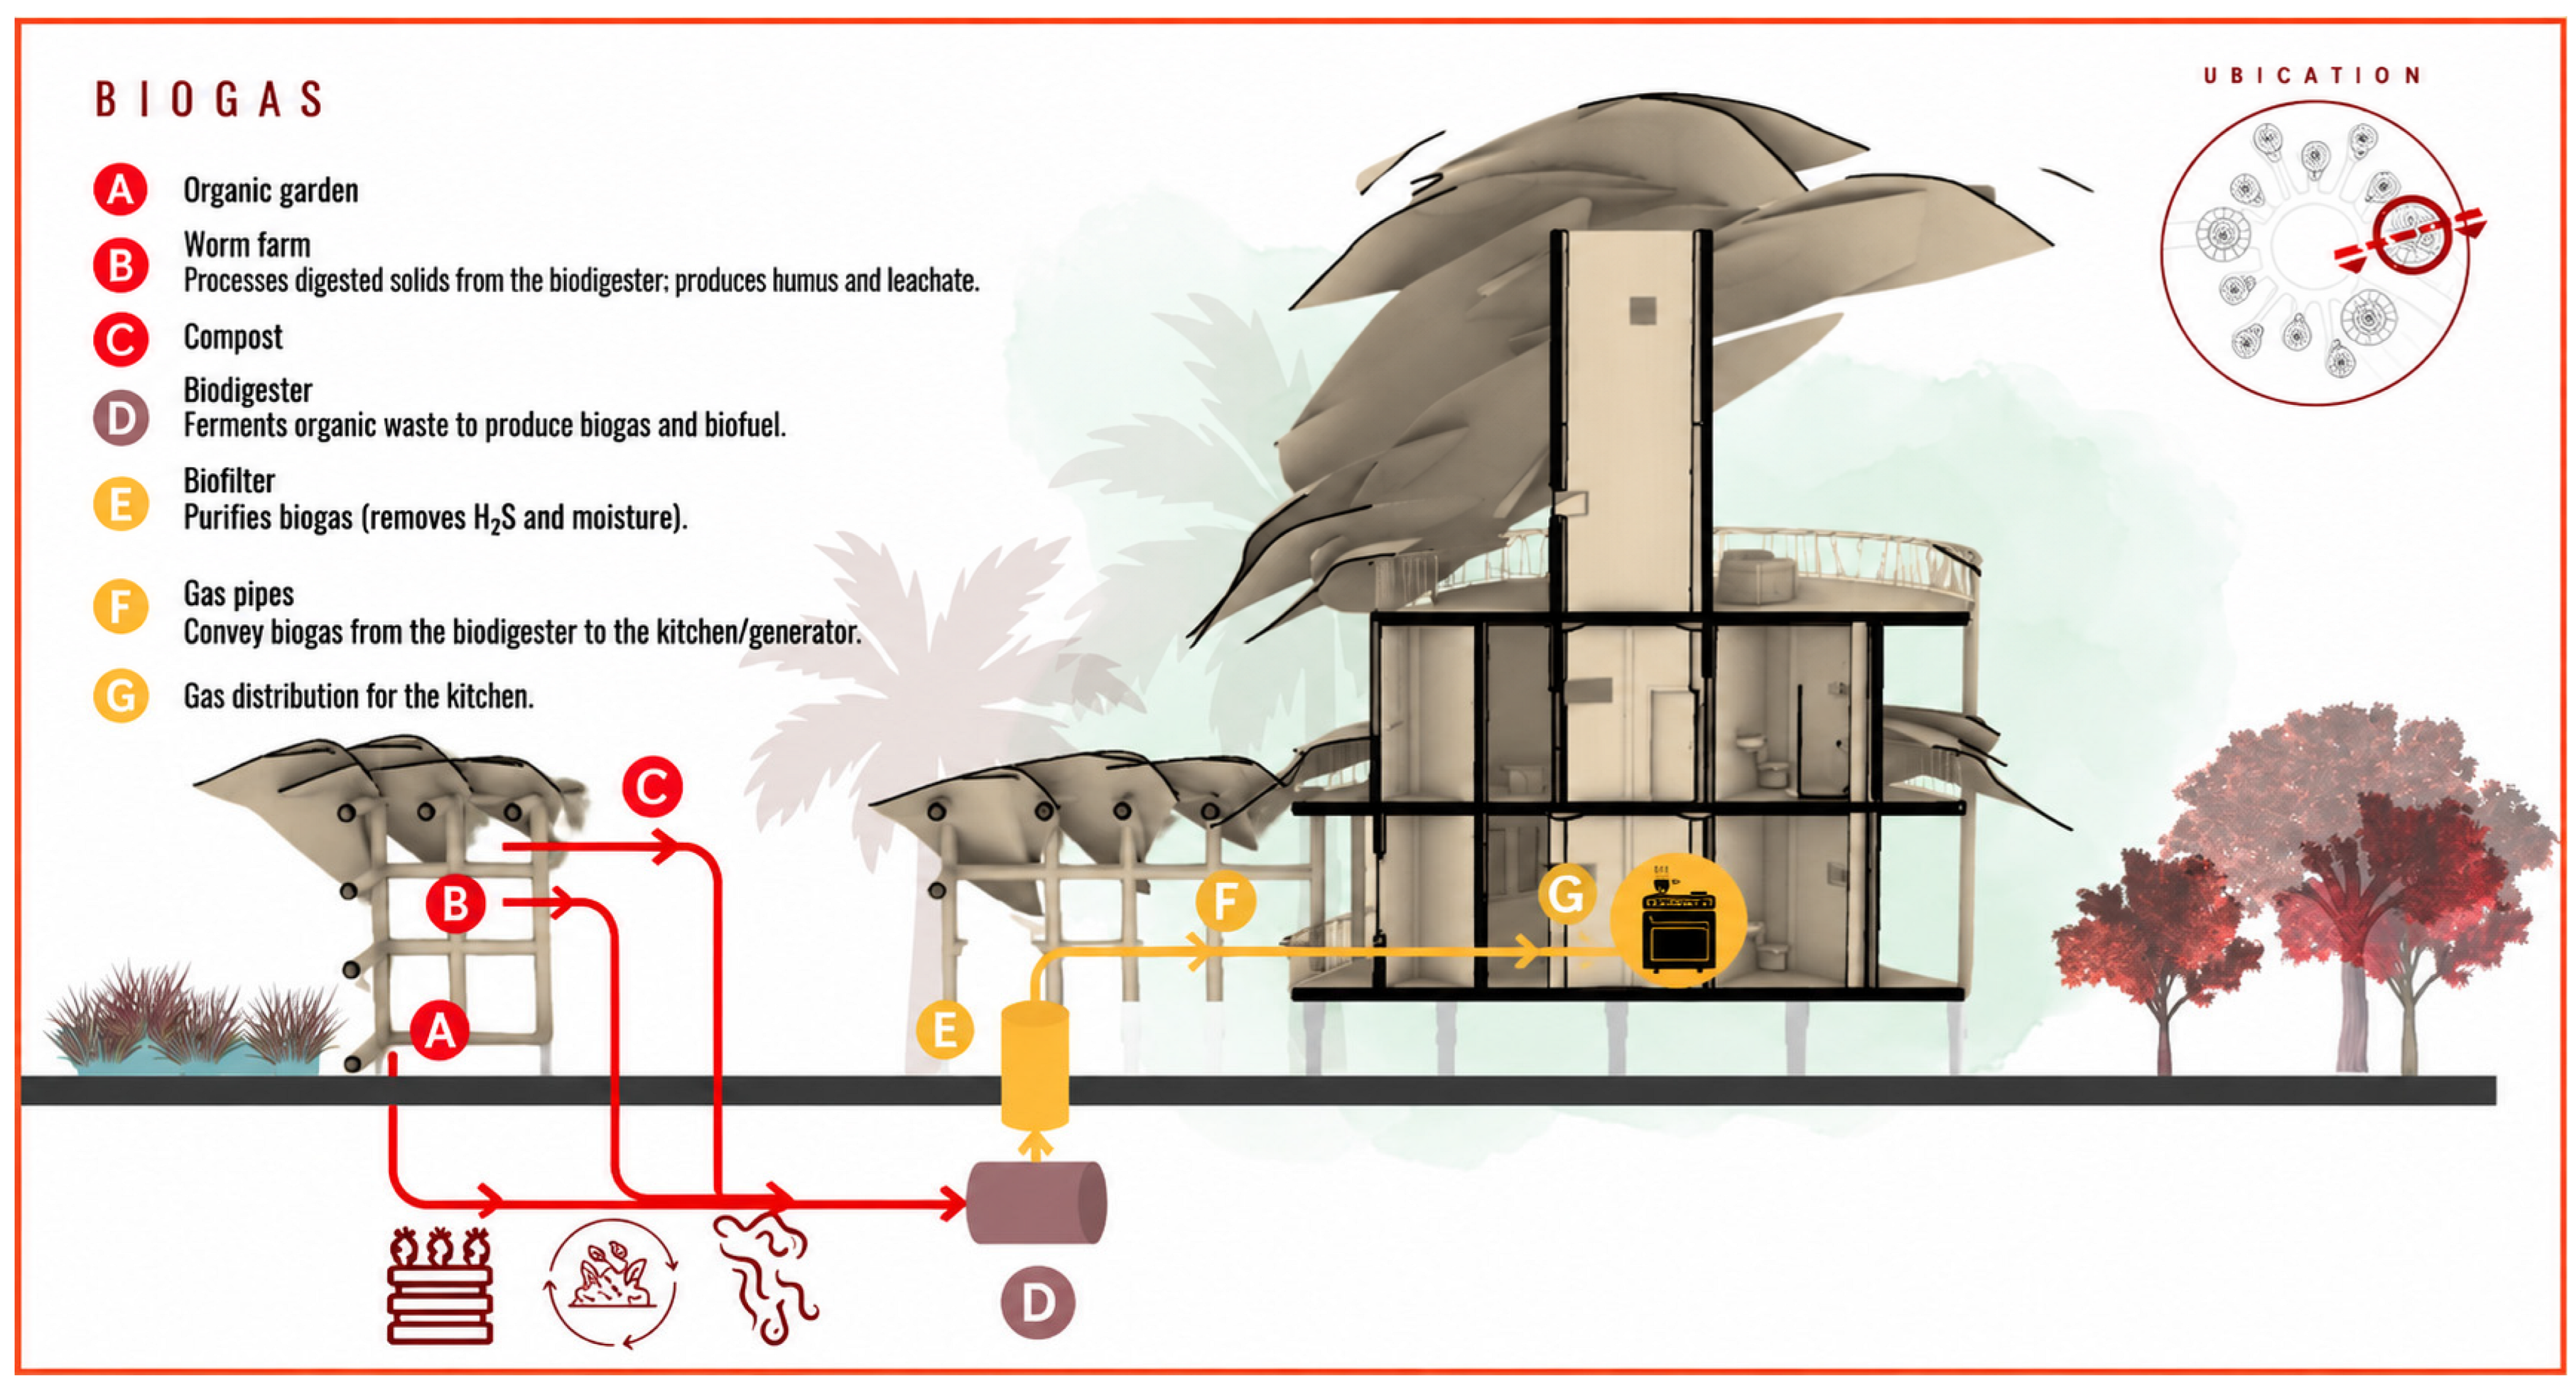
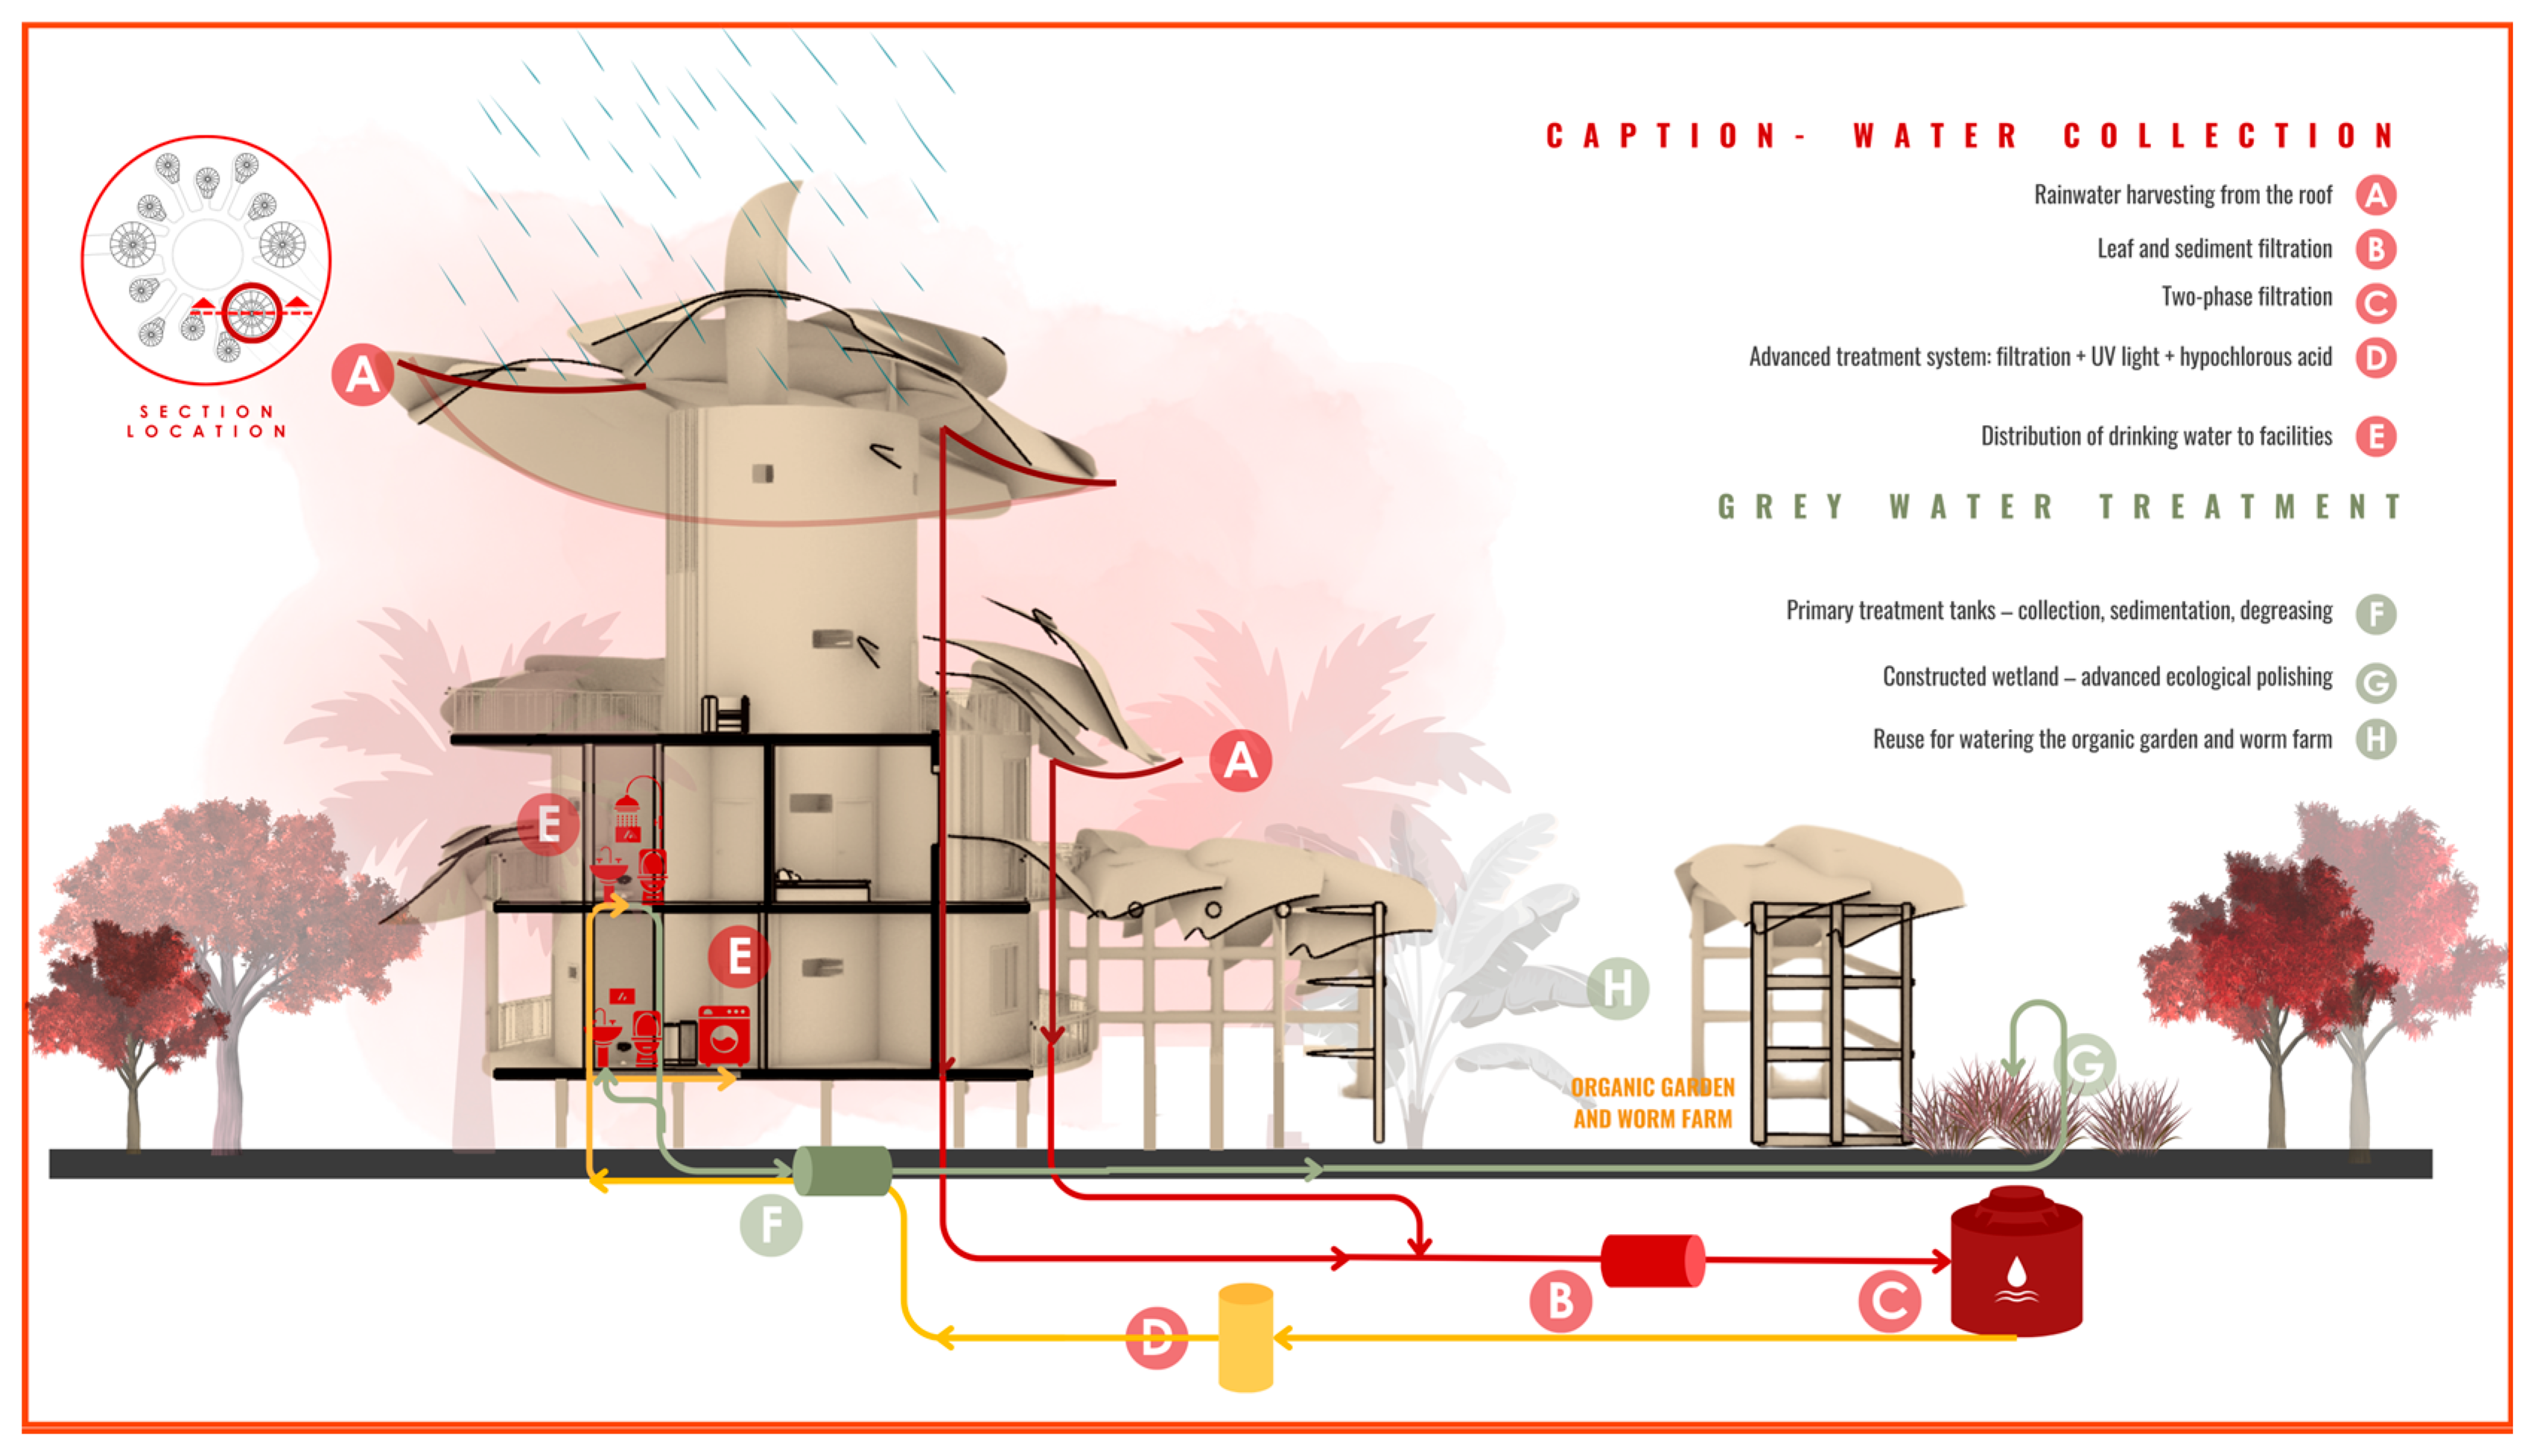

Disclaimer/Publisher’s Note: The statements, opinions and data contained in all publications are solely those of the individual author(s) and contributor(s) and not of MDPI and/or the editor(s). MDPI and/or the editor(s) disclaim responsibility for any injury to people or property resulting from any ideas, methods, instructions or products referred to in the content. |
© 2026 by the authors. Licensee MDPI, Basel, Switzerland. This article is an open access article distributed under the terms and conditions of the Creative Commons Attribution (CC BY) license.