


Abstract
This paper presents a structured planning framework for the coordinated integration of photovoltaic (PV) systems and capacitor banks (CBs) in radial distribution networks to improve steady-state voltage regulation and reduce active-power losses. The proposed methodology combines deterministic power-flow assessment, index-based candidate screening, and constrained joint placement and sizing using the Grey Wolf Optimizer (GWO) with an embedded CAPEX proxy. Compared with PV-only integration, the coordinated PV–CB strategy provides a more effective improvement in steady-state electrical performance, particularly in terms of slack-bus power factor and voltage regulation. In addition, relative to fixed coordinated PV–CB scenarios, the GWO-based formulation yields more balanced technical–economic solutions by improving power factor and voltage conditions while avoiding unnecessary overdimensioning of installed capacity. On the IEEE 15-bus system, the optimized configuration achieves a 45.9% reduction in active-power losses, improves the slack-bus power factor to 0.947, and reduces the average voltage deviation to 2.57%, with convergence reached in approximately 16 iterations. On the IEEE 34-bus system, the optimized solution yields a 49.8% loss reduction, increases the slack-bus power factor to 0.955, and reduces the average voltage deviation to 2.39%, with convergence reached in approximately 133 iterations. Using an energy price of 8.14 ctUSD/kWh, the corresponding annual loss–cost savings are approximately 19,975 USD and 78,475 USD for the IEEE 15- and 34-bus systems, respectively. The results demonstrate that the proposed GWO-based coordinated planning approach can achieve electrically effective and economically feasible solutions through the combined provision of local active-power injection and reactive-power compensation in radial distribution networks under steady-state operating conditions.
1. Introduction
The first three stages of an electric power system (EPS) are generation, transmission, and distribution, whose primary objective is to ensure that the produced electrical energy reaches end consumers with adequate voltage levels and with minimum possible losses throughout the delivery process [1].
In recent years, the global energy crisis and the continuous growth in electricity demand have significantly driven the integration of photovoltaic (PV) systems into power networks. This expansion highlights the importance of efficiently harnessing renewable energy sources and properly integrating them into electrical grids. Photovoltaic systems contribute to local active-power generation, reducing the dependence on upstream substations and decreasing the current flowing through distribution lines, which in turn leads to a reduction in system power losses. However, their location and sizing must be carefully planned, as improper installation may produce adverse effects on overall system performance and voltage stability [2,3].
On the other hand, reactive-power compensation using capacitor banks (CBs) is widely employed to enhance the quality of the EPS. This technique helps reduce reactive-power demand throughout the network, which is primarily responsible for low power factors, voltage drops, and elevated current levels, while still being essential for the proper operation of predominantly inductive loads [4,5].
Consequently, the coordinated integration of photovoltaic systems and capacitor banks has emerged as a highly effective strategy to improve service quality and strengthen overall system performance. This approach combines capacitor banks as a reactive-power compensation mechanism and photovoltaic systems as a source of local active-power injection, thereby contributing to loss reduction and voltage-profile support. Such a coordinated scheme contributes to maintaining voltage levels within acceptable operational limits and is widely adopted in international technical standards and the literature, ensuring a more stable, efficient, and reliable operation of distribution networks [6].
The following paragraphs review related works focused on the application of the Grey Wolf Optimizer (GWO) algorithm in power-system optimization problems.
In [7], the GWO algorithm was employed to solve the optimal placement and sizing problem of photovoltaic distributed generation in distribution systems. The algorithm identified the most suitable buses for renewable generation integration in order to improve voltage profiles and reduce electrical losses. The proposed model evaluated multiple operating scenarios, including load variations, changes in solar irradiance, and different PV placement combinations. The results demonstrate stable convergence behavior and confirm that GWO is an effective alternative for addressing optimization problems in distribution networks.
In [8], the GWO algorithm was applied to the IEEE-34 test system, combining MATLAB R2025b and OpenDDS v3.33.0 to execute up to 100 iterations in order to determine the optimal configuration of distributed generation and transformer tap settings. The objective function focused on maintaining voltage levels within predefined limits. Several load and renewable generation injection scenarios were analyzed, showing stable convergence and a total loss reduction of 26.3%, with an additional improvement of 13.72% attributed exclusively to optimization without PV integration. Furthermore, critical buses such as 9 and 22 exhibited voltage improvements of 6.2% and 5.7%, respectively.
Similarly, in [9], favorable results were obtained using the GWO algorithm for optimal placement and sizing of shunt capacitors (SCs) in the IEEE-34 distribution system. The primary objective was the minimization of total active-power losses. The algorithm was configured using system data and search parameters such as the number of iterations, population size, and a predefined set of three SC units. System operability was evaluated under three distinct demand scenarios, allowing GWO to determine the optimal location and size of the SCs for each case. The study reported an active-power loss reduction of up to 28% and improvements in minimum voltage levels across all evaluated scenarios.
In [10], the GWO algorithm was proposed for optimal reactive-power dispatch in the IEEE-30 and IEEE -118 test systems, incorporating wind power generation. The algorithm adjusts generator voltages, transformer tap positions, and both the location and size of wind generation units, with the objective of reducing active power losses and voltage deviations. The results indicate that the proposed method outperforms other heuristic algorithms such as PSO, GA, and ABC, achieving superior performance with fewer iterations.
In [11], the GWO algorithm was evaluated in benchmark optimization problems involving ten variables, using a population of 40 wolves and 500 iterations within a search range of . Comparisons with algorithms such as PSO and FA reveal that GWO consistently found solutions closer to the global optimum in most scenarios, demonstrating high accuracy with only a marginal increase in computational time, measured in milliseconds, which does not represent a practical disadvantage.
Recent studies have also reinforced the relevance of robust metaheuristic strategies in photovoltaic applications. For example, a robust salp swarm formulation has been proposed for photovoltaic maximum power point tracking under partial shading conditions, showing the continuing interest in intelligent optimization schemes for improving PV operating performance under challenging conditions [12].
Based on the demonstrated effectiveness of the GWO algorithm in solving optimization and sizing problems related to power-system performance enhancement, this work adopts a GWO-based optimization model developed in MATLAB and supported by power-flow simulations using MATPOWER. The proposed approach evaluates multiple operating scenarios to optimally determine the placement and sizing of photovoltaic systems and capacitor banks within a coordinated steady-state planning framework. This strategy aims to reduce power losses, improve the power factor, and enhance voltage profiles across the distribution network.
Main Contributions
Although the integration of distributed generation and reactive compensation using metaheuristic techniques has been widely studied, the present work provides the following specific contributions:
- A structured four-stage analytical framework that integrates deterministic power-flow assessment, index-based candidate screening, and constrained joint placement and sizing solved via the Grey Wolf Optimizer (GWO), ensuring methodological transparency and reproducibility.
- A physically interpretable screening mechanism for photovoltaic systems and capacitor banks based on benefit indices, allowing reduction of the combinatorial search space while preserving electrical insight prior to metaheuristic optimization.
- A normalized multi-criteria objective formulation that simultaneously considers active-power losses, voltage regulation limits, the slack-bus power factor, and investment cost constraints, ensuring balanced technical–economic trade-offs.
- A systematic sensitivity analysis of objective-function weights, enabling interpretation of the discrete Pareto-like trade-offs between loss reduction and investment cost for IEEE benchmark systems.
- An explicit economic feasibility assessment based on annual loss–cost savings and investment normalization, providing quantitative viability metrics under realistic energy pricing.
2. Theoretical Framework
The analytical framework developed in this study is grounded in the steady-state modeling of radial distribution systems under operational and regulatory constraints. The coordinated integration of photovoltaic (PV) generation and capacitor-bank (CB) compensation is formulated as a constrained planning problem in which the voltage regulation, power-factor improvement, and active-loss minimization are simultaneously addressed.
To clarify the logical relationship between the electrical modeling components and the optimization stage, Figure 1 presents the conceptual architecture that structures the theoretical foundations of the proposed methodology.
Figure 1.
Conceptual architecture linking steady-state distribution-system constraints, compensation mechanisms, and metaheuristic optimization for coordinated photovoltaic and capacitor-bank planning.
2.1. Distribution Systems
Electric power generation, transmission, and distribution constitute the three main stages of an electric power system (EPS). Within this structure, the distribution system is responsible for delivering electrical energy to end consumers while ensuring adequate levels of service quality, continuity, and reliability. In order to provide effective voltage control at consumption points within an electrical network, reactive-power compensation is required to improve the system power factor (PF).
Technical energy losses occur due to the internal consumption of electrical equipment, which are not billed to end users, as well as impedance losses caused by current flow through network components. Additionally, no-load losses arise from magnetizing currents in transformers and energized equipment, regardless of load levels, contributing further to total system losses [13].
2.1.1. Distribution Network Topologies
The main topologies employed in distribution networks include radial, meshed, and ring configurations. The radial topology is one of the most widely used structures, characterized by multiple branches forming a tree-like configuration. Its radial operating condition represents a fundamental constraint for both operation and network reconfiguration [14].
The meshed topology is more frequently applied in secondary distribution networks, particularly in rural areas. However, its higher structural complexity leads to increased operational and maintenance costs [15].
The ring topology is primarily employed in medium-voltage distribution networks due to its ability to enhance supply reliability. This configuration provides multiple paths for power flow, allowing electrical supply to be maintained through alternative routes in the event of a fault at one of the network nodes, thereby ensuring operational continuity of the system [16].
2.1.2. Voltage Limits
In the analysis of electrical distribution networks, voltage levels expressed in per unit (p.u.) are evaluated within internationally accepted operational margins. These margins define the admissible voltage limits required to guarantee proper, safe, and reliable operation of the electric power system [17,18].
Proper system operation is achieved when voltage levels at all buses remain within the limits established in Equation (1) under normal operating conditions. This voltage range corresponds to a maximum deviation of with respect to the nominal value and is widely adopted in the IEEE- and ANSI -based technical literature, as well as in recent studies addressing voltage profile analysis and Volt–VAr control in distribution networks [17,18].
2.1.3. Power Factor (PF)
The power factor reflects the efficiency with which apparent power is converted into useful active power within an electric power system. In [19], it is shown that power factor correction significantly contributes to improved system stability and efficiency. High consumption of reactive power (Q) leads to voltage degradation and increased electrical losses in distribution lines. For this reason, compensation techniques such as capacitor banks and reactive-power control strategies are commonly employed, including the use of distributed generation sources such as photovoltaic panels and wind turbines.
In this study, the reactive-power term Q used in Equation (2) denotes the conventional fundamental-frequency reactive power defined under sinusoidal steady-state operation. Accordingly, its applicability is restricted to the power-flow framework adopted in this work, where voltage and current waveforms are represented through their fundamental components. Therefore, the reported reactive-power exchanges and power-factor values should be interpreted exclusively within the scope of steady-state distribution-system analysis and not as measures of non-sinusoidal reactive power, harmonic distortion, or waveform-quality phenomena.
The power factor has a significant influence on active-power losses and voltage regulation, directly affecting operational efficiency and associated system costs. A low power factor increases reactive-power circulation, leading to higher current levels, increased electrical losses, and more pronounced voltage drops in distribution systems. In this context, the international technical literature based on IEEE recommended practices reports that maintaining power factor values close to unity, typically above 0.9 under normal operating conditions, is appropriate for improving the overall system performance and mitigating the effects associated with reactive power [20,21].
In electric power systems, the power factor may operate in either lagging or leading modes. A lagging power factor indicates inductive system behavior, where current lags voltage mainly due to loads such as transformers and motors. This condition increases reactive-power demand from the network, resulting in higher current circulation, voltage deterioration, and increased electrical losses, particularly in distribution networks. Conversely, a leading power factor represents capacitive behavior, in which current leads voltage due to reactive-power injection, contributing to voltage support. However, excessive compensation may negatively impact system performance by causing undesired voltage rises [22].
2.1.4. Power Losses
Losses in electric power systems represent the energy dissipated during the process of electricity distribution to end users. These losses can be classified into two main categories [23]. Technical losses are inherent physical phenomena of the electrical system and are generally associated with copper losses, which are directly related to the Joule effect:
Non-technical losses are associated with factors external to the electrical behavior of the network. Although they do not directly affect the electrical performance of the system, they significantly impact the economic efficiency of distribution companies.
2.2. Photovoltaic Generation
Electricity generation from photovoltaic systems has been consolidated as the fastest-growing energy production source worldwide over the last decade [24]. This growth is driven by technological advances, reductions in solar module costs, and the promotion of policies aimed at renewable energy development.
In this work, PV units are modeled as distributed active-power injection sources operating at unity power factor; thus, their contribution is represented exclusively through active-power injection at the fundamental frequency. This modeling choice is consistent with the steady-state power-flow framework adopted in the present study, whose objective is to evaluate voltage regulation, slack-bus power factor, and active-power loss reduction under sinusoidal operating conditions. Although practical photovoltaic installations are typically interfaced through power-electronic converters that may introduce harmonic distortion, switching-frequency effects, and other non-sinusoidal phenomena, such effects are outside the scope of the present formulation and are therefore not explicitly represented. Consequently, the adopted PV model should be interpreted as a planning-oriented fundamental-frequency equivalent intended for comparative steady-state assessment rather than as a detailed electromagnetic or power-quality model. Photovoltaic solar energy remains a low environmental impact alternative that supports the transition toward sustainable energy systems and contributes to diversification of the energy mix and emission reduction [25].
2.3. Capacitor Banks
Capacitor banks (CBs) play a fundamental role in distribution networks by providing reactive-power compensation, improving system operation, reducing line losses, and maintaining voltage levels within permissible limits. The power factor is commonly measured at the slack bus or the point of common coupling with the utility, as it reflects the overall system behavior. When the power factor is excessively low, economic penalties may be imposed by distribution companies [26].
The placement and sizing of capacitor banks must be carefully planned. Oversizing may deteriorate system performance by causing overvoltage conditions, while undersizing may be insufficient to correct a low power factor. Consequently, optimization techniques are widely used to determine their optimal placement and sizing [27].
2.4. Coordinated Integration of Photovoltaic Systems and Capacitor Banks
The coordinated integration of photovoltaic (PV) systems and capacitor banks (CBs) refers to a planning strategy in which capacitor banks provide shunt reactive-power compensation, while photovoltaic generation units contribute local active-power injection under unity-power-factor operation. Under this coordinated scheme, both technologies act simultaneously but through distinct electrical functions: CBs improve reactive-power support and voltage regulation, whereas PV units reduce upstream active-power transfer and associated line-current magnitudes. Consequently, their combined action improves steady-state system performance by reducing active-power losses, supporting voltage profiles, and improving the power factor under appropriate operating conditions [28].
2.5. Metaheuristic Algorithms
Metaheuristic algorithms are optimization techniques inspired by natural phenomena, emulating the behavior of animals, biological processes, and physical systems, among others. The concept of optimization refers to finding the best possible solution to a given problem [29]. These algorithms are especially useful for solving nonlinear problems characterized by multiple constraints and large search spaces, as they help avoid convergence to local optima. In electric power systems, metaheuristic algorithms enable the effective treatment of highly complex problems involving numerous variables and operational constraints [30,31].
Accordingly, some of the most widely used metaheuristic algorithms include Genetic Algorithms (GA) [32], Particle Swarm Optimization (PSO) [33], and Ant Colony Optimization (ACO). In this work, the Grey Wolf Optimizer (GWO) is employed; it mimics the hunting hierarchy of gray wolves, where the best solutions guide the search process, and the remaining agents adjust their behavior by following the leaders [34].
2.6. Grey Wolf Optimizer Algorithm
The Grey Wolf Optimizer (GWO) is a metaheuristic algorithm developed in 2014 by Seyedali Mirjalili. This algorithm is inspired by the hunting behavior of gray wolves, emulating how these animals organize themselves to search for, encircle, and ultimately capture prey. This collective behavior was translated into a mathematical model to solve complex optimization problems [35].
2.6.1. Hierarchy Classification
Gray wolves typically organize their hunting process according to a hierarchical structure. The alpha wolf (), which leads the pack, represents the best solution and guides the search process. The beta wolf (), acting as the subleader, and the delta wolf (), representing the third level of leadership, correspond to the second- and third-best solutions, respectively, providing alternative search directions under the authority of the alpha wolf. Finally, the omega wolves () represent the remaining members of the pack [35].
Figure 2 illustrates the hierarchical structure of the gray wolf pack adopted in the GWO algorithm.
Figure 2.
Packhierarchy in the GWO algorithm.
The mathematical modeling of the wolf population is defined by the following set:
where p denotes the number of wolves, corresponding to the population size. Each vector represents a wolf, that is, a candidate solution to the optimization problem, with . This indicates that each wolf is an n-dimensional vector composed of the decision variables [36,37], such as the photovoltaic-system capacity at each bus or the size of the installed capacitor banks.
2.6.2. Encircling the Prey
Once the best solution has been identified, the , , and wolves guide the encircling process of the prey, while the wolves follow these trajectories. This cooperative behavior is mathematically modeled as shown in [38].
where represents the distance vector between the wolf position and the prey, denotes the prey position at iteration t, and corresponds to the position vector of a grey wolf. The coefficient vectors and regulate the exploration and exploitation behavior of the wolves and are defined as follows:
where and are random vectors with components uniformly distributed in , introducing stochasticity into the movement direction of the wolves. The control parameter decreases linearly from 2 to 0 throughout the optimization process [39], according to
where represents the total number of iterations.
2.6.3. Hunting the Prey
During the first iteration, the prey position is unknown; therefore, the wolves are randomly distributed within the search space. This initial phase generates candidate positions based on the upper and lower bounds of the decision variables, promoting extensive exploration of the search space before the coordinated hunting process begins. Once the positions of the three best solutions are identified, the remaining wolves are guided to update their positions accordingly [40].
where , , and represent the distances relative to each leading wolf, while , , and are random coefficient vectors that define the movement direction. Similarly, , , and denote the positions of the leading wolves, and corresponds to the current position of the evaluated wolf at each iteration [41]. Based on these distances, the following candidate positions are computed:
where , , and are candidate position vectors used to update the evaluated wolf position with respect to the , , and leaders. The coefficient vectors , , and regulate both the magnitude and direction of movement. The new position of each wolf is obtained as the arithmetic mean of the three leader-influenced candidate positions:
2.6.4. Objective Function
The objective function of each wolf is evaluated in order to compare candidate solutions and guide the algorithm toward the best solution. The best solution is denoted as , corresponding to the most suitable candidate within the pack. Similarly, the second- and third-best solutions are represented by and , respectively, while the remaining wolves are classified as . For minimization problems, the best solution is defined as the one that yields the minimum value of the objective function [41].
Specifically, the objective function f depends on the decision vector x and is formulated either as a minimization or maximization problem. Many optimization problems are constrained by inequality functions and equality functions [42].
Multi-Criteria Formulation and Scalarization Rationale
Although the objective function is expressed as a single aggregated term, the planning problem addressed in this work is inherently multi-criteria, involving loss minimization, voltage regulation, power-factor enforcement, and economic cost control. Instead of adopting a Pareto-based multiobjective optimizer, the problem is formulated through normalized scalarization, where each performance indicator is rendered dimensionless and weighted according to its relative planning priority.
It is important to emphasize that voltage limits and power-factor requirements are enforced as hard operational constraints, while the loss and economic components are incorporated as normalized performance terms. Consequently, the feasible solution space is already restricted by technical admissibility conditions, and the weighted aggregation operates only within that admissible domain.
In regulated distribution planning environments, operational constraints (e.g., and ) are not negotiable objectives but mandatory requirements. Therefore, transforming the problem into a pure Pareto-front exploration would not alter the admissible operating region but would instead increase computational burden without necessarily providing additional actionable insight for utility-level decision making.
For these reasons, the adopted scalarized formulation provides a computationally efficient and technically consistent mechanism to capture multi-criteria trade-offs while preserving strict compliance with distribution-system operational constraints. A fully Pareto-based multiobjective extension (e.g., MOGWO or NSGA-II) may be considered as future work for exploratory planning studies.
3. Study Problem
In many previous studies, photovoltaic systems (PV) and capacitor banks (CBs) are implemented independently, which limits their overall effectiveness. Their coordinated integration is capable of achieving superior results in terms of loss minimization and voltage-profile improvement within electrical systems [43].
This study evaluates the IEEE-15 and IEEE-34 distribution systems starting from their base-case conditions. The integration of PV systems is first analyzed independently, followed by the incorporation of CBs. Finally, the Grey Wolf Optimizer (GWO) algorithm is applied to optimally determine the placement and sizing of both PV systems and capacitor banks in order to achieve a global improvement of the system with respect to the evaluated performance parameters.
3.1. Methodology
The proposed methodology is based on a comparative evaluation of different operating scenarios, using the system base case as a reference. The analysis is conducted in a structured manner, beginning with the assessment of system behavior under base-case conditions, followed by the integration of PV systems, and subsequently the incorporation of capacitor banks while considering their interaction with PV generation. Finally, the GWO algorithm is implemented to determine the optimal placement and sizing of both technologies, using a CAPEX-based economic criterion corresponding to the equipment investment cost.
To simplify the optimization model, the study is limited to the installation of a single PV unit and a single capacitor bank, each located at a bus selected based on the preliminary analysis. This assumption is adopted as a planning-oriented simplification consistent with a minimum-cost perspective, since the inclusion of multiple units per technology would substantially increase both the investment requirements and the dimensionality of the optimization problem, thereby expanding the number of feasible placement-and-sizing combinations to be evaluated in radial distribution systems. Under this criterion, restricting the formulation to one location per device type allows the proposed methodology to identify, with greater analytical clarity, the optimal combined effect of local active-power injection from the PV unit and local reactive-power support from the capacitor bank on the selected steady-state performance variables, namely, voltage magnitude, slack-bus power factor, and active power losses. Therefore, the single-device configuration adopted herein should be interpreted as a rigorous baseline planning model for technically and economically efficient compensation, rather than as a conceptual limitation of the proposed framework, which can be extended in future work to multiple PV units and multiple capacitor banks through an expanded decision vector and the corresponding installation constraints.
It is important to clarify that the term power quality, associated with the concept defined in IEEE Std 1159, refers to phenomena related to the technical quality of voltage waveforms [44], which are not included within the scope of the proposed objectives. Therefore, this study is restricted to steady-state operational performance assessed through power-flow calculations. The proposed framework focuses exclusively on (i) voltage magnitude regulation within permissible limits, (ii) slack-bus power factor improvement, and (iii) active-power loss reduction. Consequently, any performance enhancement reported in this work must be interpreted strictly in terms of steady-state electrical performance metrics and not as waveform-based or dynamic power-quality indices.
Therefore, this study focuses on improving the electrical performance of the distribution system by increasing the power factor, reducing power losses, and enhancing the voltage profile. The analysis is conducted exclusively under steady-state conditions based on power-flow results, without considering disturbances typically associated with power quality phenomena. In this context, the study evaluates the coordinated integration of photovoltaic systems and capacitor banks to achieve a more efficient steady-state system operation.
Modeling Assumptions and Practical Applicability
The present formulation is developed under a steady-state power-flow representation at the fundamental frequency. Accordingly, the load demand at each bus is modeled through its specified active- and reactive-power components , which is consistent with an aggregated constant-power load representation commonly adopted in distribution-system planning studies. Under this formulation, the loads are not explicitly modeled as non-linear waveform-distorting devices; instead, they are represented through their equivalent fundamental-frequency power demand. Therefore, the operating conditions assumed in this work correspond to sinusoidal steady-state operation, and the reported conclusions must be interpreted within the scope of fundamental-frequency power-flow analysis.
In this context, the reactive power considered throughout the manuscript corresponds to the conventional fundamental-frequency reactive power associated with sinusoidal steady-state operation, as commonly used in distribution-system analysis and power-factor assessment [19,20]. Consequently, the proposed methodology is not intended to characterize non-sinusoidal reactive-power components, harmonic distortion, or waveform-quality phenomena.
Likewise, although photovoltaic generation in practical installations may be interfaced through power-electronic converters capable of introducing harmonic effects, such phenomena are outside the scope of the present study. In this work, PV units are modeled as steady-state active-power injection sources operating at unity power factor, while capacitor banks are represented as shunt reactive-power compensation devices. Therefore, the proposed framework should be interpreted as a planning-oriented methodology for evaluating the coordinated steady-state effect of both technologies on voltage regulation, slack-bus power factor, and active-power losses rather than as a harmonic or electromagnetic power-quality assessment.
From the standpoint of practical applicability, the proposed procedure can be used as a decision-support tool during the preliminary planning stage of radial distribution systems, where candidate locations and device sizes must be identified before detailed engineering implementation. In real distribution networks, the solutions obtained through this framework would constitute an initial technically informed planning result that should subsequently be complemented by detailed studies addressing converter behavior, harmonic performance, protection coordination, and time-varying operating conditions before field deployment.
3.2. Scenario 1: Base Case
The base case corresponds to the initial operating condition of the IEEE-15 and IEEE-34 distribution systems, without any type of compensation. Power-flow simulations are performed using MATPOWER to obtain voltage magnitudes and power losses along each line segment, which are used as a comparative reference for performance evaluation. The power factor is assessed at the slack bus, as it reflects the global exchange of active and reactive power and enables an overall assessment of system behavior.
3.3. Scenario 2: PV Integration
The sizing of photovoltaic systems is defined considering three active-power penetration levels, represented by the parameter , based on the total demand of each system. These penetration levels correspond to , , and , as presented in Table 1. The selected values are consistent with commonly adopted criteria in studies addressing photovoltaic integration in distribution networks [45,46].
Table 1.
PV system sizing [author].
Accordingly, the active power installed at bus i is defined as
Photovoltaic systems are assumed to operate at unity power factor and do not exchange reactive power with the network; therefore,
To quantify the impact of PV integration at each bus, the photovoltaic benefit index is defined as
The index represents the reduction in total active-power losses achieved per unit of installed photovoltaic power at a given bus. The optimal bus is selected based on the average benefit index , considering the proposed photovoltaic penetration levels, which is subsequently used to evaluate the impact of PV systems on the analyzed performance parameters.
3.4. Scenario 3: Integration of PV Systems with Capacitor Banks
Once the photovoltaic location in each system was defined using the index, its position was kept fixed, and the highest proposed photovoltaic penetration level was considered in order to analyze its interaction with the incorporation of capacitor banks [47]. The sizing of the capacitor banks was established using the parameter , defined as a function of the total reactive power demand. Compensation levels of , , and were evaluated for each system, as shown in Table 2.
Table 2.
Capacitor bank sizing [author].
Accordingly, the reactive power compensation installed at bus i is defined as
As an analytical criterion, a benefit index for capacitor banks, denoted as , is defined to evaluate the influence of reactive-power compensation on system performance, considering its interaction with photovoltaic systems.
The index represents the reduction in reactive power supplied by the slack bus, , per unit of installed reactive compensation at a given bus. The optimal bus is selected based on the average value of the index , considering the proposed compensation levels.
Physical Rationale and Screening Scope of the Benefit Indices
The indices and are introduced in this work as physically interpretable screening metrics rather than as direct replacements for the final optimization objective. Their purpose is to rank candidate buses according to the marginal technical benefit provided by each technology under the steady-state operating conditions considered in the study, thereby reducing the combinatorial search space prior to the GWO-based joint placement-and-sizing stage.
For photovoltaic systems, the index measures the reduction in total active-power losses achieved per unit of installed photovoltaic active power. Since the PV units are modeled at unity power factor, their contribution is represented exclusively through local active-power injection. Under this steady-state representation, a larger value of indicates that the candidate bus yields a greater marginal loss-reduction effect per unit of installed PV capacity, which is consistent with the physical objective of reducing upstream current flow and Joule losses in radial feeders.
For capacitor banks, the index measures the reduction in reactive power supplied by the slack bus per unit of installed capacitor-bank compensation. This definition is physically consistent with the role of shunt capacitors in distribution networks, since a more effective compensation location is expected to reduce the reactive support required from the slack bus, improve the system power factor, and contribute indirectly to voltage support and current reduction.
The averaging process used to define and across the tested penetration levels provides a robust ranking criterion within the analyzed operating point, avoiding the selection of buses based on a single compensation magnitude. Consequently, the proposed indices should be interpreted as steady-state marginal-effect indicators suitable for candidate-bus screening under fixed-load and fixed-generation assumptions. The final technical–economic decision is not made by these indices alone but by the subsequent constrained GWO optimization, which simultaneously evaluates voltage regulation, power factor, active power losses, and investment cost.
3.5. Scenario 4: Development of the GWO Algorithm
3.5.1. Objective Function to Be Minimized
The primary objective of this study is to achieve the optimal placement and sizing of coordinated photovoltaic systems and capacitor banks, ensuring adequate local active-power injection and reactive-power compensation at the lowest possible cost. To this end, a reference economic criterion based on CAPEX is incorporated, allowing the algorithm to balance operational performance improvements with the installed capacity size, while enhancing voltage profiles, power factor, and system active-power losses.
Accordingly, the following objective function () is proposed for the optimization problem:
where:
- : objective function value associated with decision vector .
- : total active-power losses of the evaluated system [MW].
- : total active-power losses of the base case [MW].
- : total number of buses in the system.
- : voltage magnitude at bus i [p.u.].
- : power factor at the slack bus.
- : minimum allowable power factor.
- : total investment cost associated with PV and CB installation through optimization [USD].
- : maximum investment cost considered for normalization [USD].
- : weight associated with active-power loss reduction.
- : weight associated with voltage-profile improvement.
- : weight associated with power-factor improvement at the slack bus.
- : weight associated with economic investment cost.
3.5.2. Definition of Variables and Objective Function Weights
To avoid unit inconsistencies, each term of the objective function is expressed in a dimensionless form. Active-power losses are normalized with respect to the base case, investment costs are normalized relative to the maximum considered value, and voltage and power-factor constraints are incorporated through quadratic penalty terms. These penalties are null when operational limits are satisfied and increase only when violations occur. In this manner, all objective function components become comparable within the optimization process [48].
- Objective function weights
The coefficients , , , and are dimensionless parameters that represent the relative importance of each term in the objective function (FO). These coefficients do not correspond to physical magnitudes but are used to prioritize and balance the technical and economic criteria of the optimization process. Their selection satisfies a normalization condition, ensuring an appropriate balance among the different objectives considered.
The optimal solution is sensitive to variations in these weights. However, this behavior is inherent to multi-criteria optimization problems and does not affect the validity of the proposed method [49]. In this work, the weighting factors were not assigned through arbitrary empirical tuning but through a structured selection procedure aimed at identifying technically feasible and economically balanced solutions for each benchmark system. The selected weights are presented in Table 3.
Table 3.
Weights used in the objective function for each system [author].
The selection of these weights followed a constrained sensitivity-based procedure. First, candidate weight combinations satisfying the normalization condition were evaluated. Second, combinations producing technically infeasible solutions or economically dominant degenerate solutions were discarded. Third, the remaining combinations were compared according to their trade-off between active-power loss reduction and installed cost. Under this procedure, the final weights were selected as those yielding the most balanced compromise between electrical-performance improvement and economically contained installation capacity for each system. In particular, when the same economic weighting adopted for the IEEE-34 system was applied to the IEEE-15 system, the cost term became dominant and led to solutions without photovoltaic installation. Therefore, the final weighting factors were retained only after verifying that the resulting solutions remained both technically admissible and consistent with the intended planning objective of simultaneous electrical-performance enhancement and cost containment.
3.5.3. Systematic Weight-Selection Rationale
The adopted weighting strategy should be interpreted as a constrained sensitivity-based calibration procedure within a scalarized multi-criteria framework. First, a set of candidate weight combinations satisfying was evaluated. Second, combinations producing technically infeasible solutions or economically dominant degenerate solutions were discarded. Third, the remaining combinations were compared in terms of their associated loss-reduction/cost trade-off, selecting the one that provided the most balanced response for each test system.
Under this rationale, the weights are not intended to represent universal constants transferable to all radial distribution networks. Rather, they define the relative planning priority assigned to each normalized performance term within the admissible operating region of the system under study. This interpretation is consistent with the scalarization philosophy adopted in this work and with the sensitivity analysis later presented, which explicitly illustrates how the optimization outcome changes when the relative importance of technical and economic criteria is modified.
3.5.4. Active-Power Loss Calculation for the Optimization Model
- : total active-power losses of the system [MW].
- : total number of lines.
- : current magnitude flowing through line l.
- : resistance of line l.
Active-power losses in distribution lines are computed using (27), through which the reduction achieved by the proposed compensation mechanisms in distribution networks is assessed.
3.5.5. Cost of Photovoltaic Systems
- : reference total cost of photovoltaic systems.
- : assumed unit cost [USD/kW].
- : installed active power of the photovoltaic system at bus i.
In this work, the cost of photovoltaic systems is considered in a reference manner as a basic economic criterion within the optimization process. This allows the algorithm to determine an appropriate system size by considering both cost and system performance improvement. A reference value of is adopted [50].
3.5.6. Cost of Capacitor Banks
- : reference total cost of the capacitor bank.
- : assumed unit cost [USD/kVAr].
- : installed reactive power at bus i.
In this study, the cost of capacitor banks is considered in a reference manner as a basic economic criterion within the optimization process. This enables the algorithm to determine an adequate sizing by considering both cost and system performance improvement, adopting a reference value of [51,52].
3.5.7. Normalized Investment Cost
Cost normalization is used to convert the investment cost expressed in [USD] into a dimensionless term that can be combined with the remaining technical indicators within the objective function. In this work, the normalized cost is defined as
where is the total investment cost associated with the solution obtained by the GWO algorithm, and represents the maximum reference cost computed based on the maximum allowable compensation limits. Specifically,
where:
- : dimensionless normalized cost.
- : total investment cost of the solution obtained by the GWO algorithm [USD].
- and : maximum allowable compensation values.
- and : compensation values determined by the GWO optimization.
- and : unit reference costs of each equipment.
The term acts as a penalty factor such that more expensive solutions increase the value of the objective function, making them less attractive to the algorithm, which seeks to minimize the objective function (FO) [53].
3.5.8. Voltage Constraint
3.5.9. Power Factor Constraint
In this study, the minimum power factor is established based on technical criteria widely adopted in international literature, which recommend maintaining power factor values close to unity in order to reduce unnecessary reactive power circulation, electrical losses, and voltage drops in distribution systems. According to recommended practices reported by IEEE and several recent studies, minimum power factor values on the order of 0.9 under normal operating conditions are considered appropriate [6,20].
On the other hand, the maximum power factor is set to 1.0, which represents the theoretical upper limit corresponding to operation without net reactive power exchange. The value corresponds to the power factor evaluated at the system slack bus. Additionally, a complementary constraint is imposed within the optimization algorithm to prevent capacitive overcompensation scenarios and to ensure inductive operation of the system at the slack bus, which is expressed as follows:
3.5.10. Location Constraint for PV Systems and Capacitor Banks
The placement of photovoltaic systems (PV) and capacitor banks (CBs) is restricted to buses , where denotes the total number of buses in the analyzed system. The slack bus () is excluded from the optimization process, as its primary function is to maintain system balance, and it typically operates at a voltage level of 1 p.u.
3.5.11. Constraint on the Number of PV Systems and Capacitor Banks
In this work, the number of photovoltaic systems and capacitor banks is fixed to one unit each:
This restriction is adopted to preserve a planning formulation consistent with minimum-investment deployment and manageable optimization complexity in radial distribution systems. Allowing multiple PV units and multiple capacitor banks would considerably enlarge the discrete–continuous search space by increasing the number of admissible placement combinations and sizing interactions to be evaluated simultaneously, which would substantially raise both the computational burden of the optimization process and the total installed cost associated with the solution. Under this formulation, fixing one location per device type enables a rigorous assessment of the maximum coordinated effect that can be achieved through a single PV source of local active-power injection and a single capacitor bank providing local reactive-power support on the selected steady-state performance indicators. Therefore, the restriction and should be interpreted as a deliberate baseline planning constraint adopted to identify technically effective and economically contained solutions rather than as a structural limitation of the proposed methodology.
3.5.12. Installed Capacity Constraint for Photovoltaic Systems
- : installed photovoltaic active power at bus i [kW].
- : minimum allowable photovoltaic power [kW].
- : maximum allowable photovoltaic power [kW].
The installed photovoltaic penetration capacity is defined as a function of the total active demand of the system, considering a maximum limit equivalent to of such demand. This value is used solely as a reference to estimate the maximum investment cost and as the search range for the GWO algorithm. Consequently, the algorithm is responsible for determining the optimal photovoltaic system size in accordance with system constraints.
3.5.13. Installed Capacity Constraint for Capacitor Banks
- : installed reactive power at bus i [kVAr].
- : minimum allowable reactive power for capacitor banks [kVAr].
- : maximum allowable reactive power for capacitor banks [kVAr].
In this work, a maximum limit equivalent to of the total reactive demand of the system is established. This limit is used exclusively as the search range of the GWO algorithm and as a reference for maximum cost estimation. It prevents the algorithm from evaluating excessively large sizes, improving computational efficiency without imposing or conditioning the final capacitor bank sizing.
3.6. GWO Pseudocode
Table 4 presents the pseudocode of the GWO algorithm used to solve the proposed optimization problem.
Table 4.
GWO algorithm pseudocode [author].
3.7. Analysis Based on GWO Algorithm Results
3.7.1. Loss Reduction
Loss reduction is evaluated based on the decrease in active power losses with respect to the base case of each system and the optimal solution obtained through the GWO algorithm. The loss reduction is computed as follows:
where:
- : active-power losses considered for the analysis.
- : system-power losses under base-case conditions.
- : system-power losses obtained after optimization using the GWO algorithm.
3.7.2. Annual Economic Savings and Planning-Level Economic Scope
Annual economic savings are estimated based on the reduction of active-power losses achieved through the optimal solution provided by the GWO algorithm.
where:
- : reduction in active-power losses [kW].
- : total number of hours in one year.
- : unit electricity price [USD/kWh].
For the economic analysis, a unit electricity price of is adopted, which is considered representative of the average electricity cost commonly used in technical–economic studies of distribution systems. This assumption allows a consistent evaluation of the economic impact of loss reduction while preserving the generality and reproducibility of the results.
3.7.3. Planning-Level Economic Interpretation
The economic formulation adopted in this work should be interpreted as a planning-level reference model intended to support the comparative evaluation of technically feasible compensation alternatives. Under this approach, the cost terms associated with photovoltaic systems and capacitor banks are incorporated through fixed unit-cost coefficients and a normalized CAPEX proxy, while the economic benefit is estimated from annual loss–cost savings derived from active power loss reduction.
Accordingly, the proposed formulation does not attempt to represent a full life-cycle cost assessment. In particular, it does not explicitly include differentiated equipment lifetimes, periodic maintenance costs, replacement schedules, discount rates, degradation effects, or time-varying electricity tariffs. These factors may significantly influence the long-term financial performance of real projects; however, their explicit inclusion would require a broader project-finance framework beyond the planning-oriented scope of the present study.
Nevertheless, the adopted economic model remains useful for the intended purpose of this manuscript, namely, to compare candidate compensation solutions under a unified technical–economic criterion and to avoid electrically favorable but economically disproportionate installations. Therefore, the reported savings and cost indicators should be interpreted as comparative planning metrics rather than as a complete financial feasibility analysis. A more detailed economic formulation incorporating life-cycle costs, replacement effects, and tariff variability constitutes an important extension for future research.
3.8. Sensitivity Analysis with Different Weights
This section presents a sensitivity analysis carried out by varying the weights associated with the parameters of the objective function in order to evaluate how the algorithm response changes according to the relative importance assigned to each variable, as proposed in Table 5. This analysis makes it possible to identify the sensitivity of each system to different priorities established during the optimization process.
Table 5.
Variation in objective function weights [author].
In each case, greater importance is assigned to one or, in some scenarios, two variables in order to evaluate the behavior of the GWO algorithm under different optimization priorities.
3.9. Test Systems
To validate the proposed algorithm, two radial distribution test systems are considered in this work. The 15-bus benchmark corresponds to the radial test system adopted in [55,56], whereas the 34-bus benchmark corresponds to the IEEE 34-bus test feeder reported in [57] and subsequently adopted in [58]. Both systems are used as benchmark networks for evaluating optimization techniques in radial distribution systems.
3.9.1. 15-Bus System
The 15-bus system considered in this study corresponds to the radial distribution test system adopted from [55,56]. It consists of one slack generator bus, 14 lines, and 14 load buses, as illustrated in Figure 3. It corresponds to a radial distribution system with a nominal voltage level of 11 kV and a total demand of 1.226 [MW] and 1.251 [MVAr].
Figure 3.
IEEE 15-bus distribution system [author].
Table 6 presents the branch and load data of the 15-bus system in a unified format. For each network segment connecting buses i and j, and denote the series resistance and series reactance of the branch, respectively. The quantities and represent the active- and reactive-power demands assigned to the receiving bus j, that is, to the downstream node reached by the branch . Therefore, each row of the table simultaneously identifies the electrical parameters of one branch and the load connected at its receiving end, which is consistent with the radial feeder representation shown in Figure 3 [56].
Table 6.
Line and load parameters of the IEEE 15-bus system [author].
3.9.2. 34-Bus System
The IEEE 34-bus distribution system is used as the second case study. This benchmark corresponds to the IEEE 34-bus test feeder originally reported by Kersting in [57] and subsequently adopted in [58]. It consists of one slack generator bus, 33 lines, and 29 load buses. The system is modeled at a nominal voltage level of 11 kV on a 1 MVA study base, and it presents a total demand of 4.636 [MW] and 2.873 [MVAr]. Its corresponding single-line diagram is shown in Figure 4.
Figure 4.
IEEE 34-bus distribution system [author].
Table 7 presents the branch and load data of the IEEE 34-bus system in a unified format. For each branch connecting buses i and j, and denote the series resistance and series reactance of the line segment, respectively. The quantities and denote the active- and reactive-power demands assigned to the receiving bus j. Accordingly, each row describes both the electrical parameters of a feeder section and the load connected at its downstream node, which facilitates direct interpretation of the radial network structure represented in Figure 4 [58].
Table 7.
Line and load parameters of the IEEE 34-bus system [author].
3.10. Algorithmic Framework and Optimization Procedure
This subsection presents a rigorous and unified description of the complete algorithmic procedure implemented in this work. The proposed framework integrates deterministic power-flow analysis, index-based screening strategies, and a metaheuristic optimization stage based on the Grey Wolf Optimizer (GWO). The objective is to determine the optimal placement and sizing of photovoltaic systems (PV) and capacitor banks (CB) in radial distribution networks while simultaneously improving voltage profiles, reducing power losses, enhancing the system power factor, and incorporating a basic economic criterion.
The methodology is structured into five sequential stages: (i) base-case power-flow assessment, (ii) photovoltaic integration and benefit-index evaluation, (iii) capacitor-bank integration with fixed PV placement, (iv) simultaneous PV–CB optimization using GWO, and (v) post-processing analysis including convergence assessment and sensitivity analysis.
Formal Optimization Problem Formulation
Let the distribution system be defined by a set of buses and lines , where bus 1 corresponds to the slack bus. The decision vector of the optimization problem is defined as
where denote the buses selected for PV and CB installation, respectively, and (MW) and (MVAr) represent their corresponding sizes.
The optimization problem can be expressed as a constrained multi-objective minimization problem:
subject to
where denotes the voltage magnitude at bus i, and is the power factor at the slack bus.
Each term of the objective function is normalized to ensure dimensional consistency and balanced influence of the weighting coefficients .
3.11. Computational Pipeline and Algorithmic Implementation
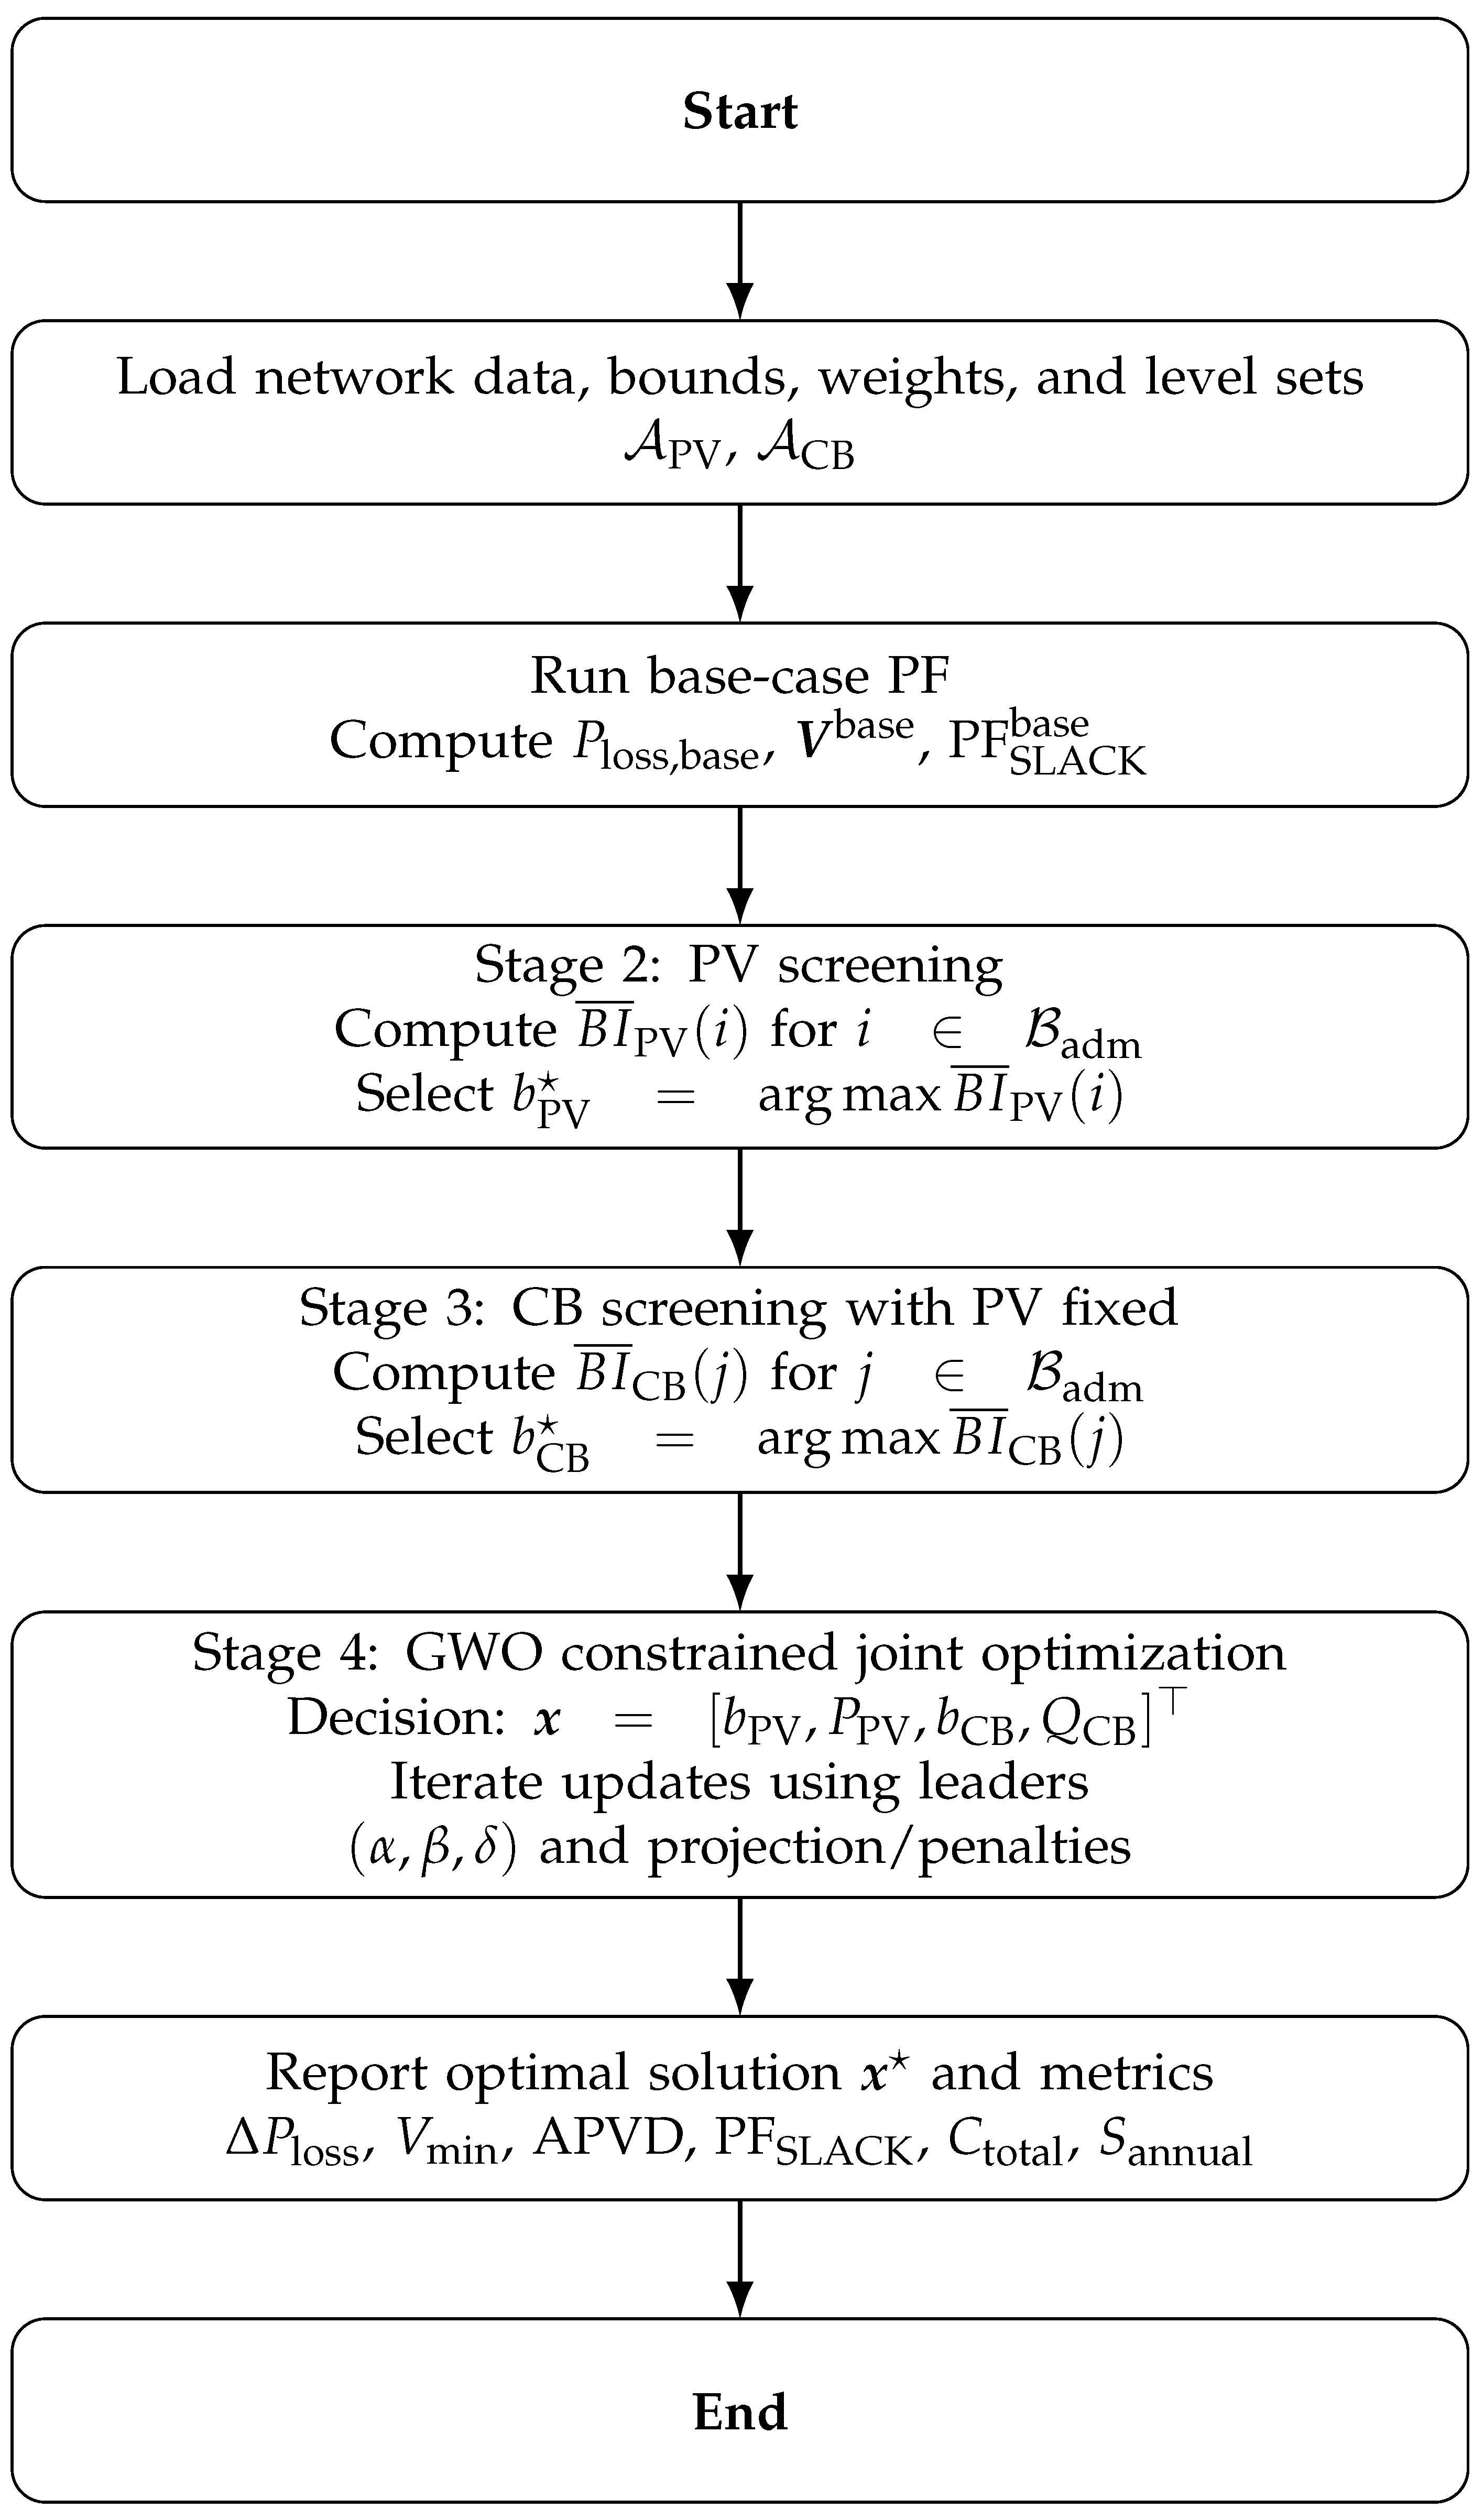
This section formalizes the complete computational workflow implemented in this work, from the base-case power-flow assessment to the constrained joint placement-and-sizing optimization of photovoltaic (PV) generation and capacitor-bank (CB) compensation. The procedure is organized into four sequential stages: (i) base-case analysis, (ii) PV screening via an index-based criterion, (iii) CB screening with PV location fixed, and (iv) joint optimization using the Grey Wolf Optimizer (GWO). The global logic of this pipeline is summarized in Figure 5, while the detailed computational flow is depicted in Figure 6. A rigorous end-to-end pseudocode is provided in Algorithm 1, where the screening stages (Stages 2–3) reduce the combinatorial complexity and the final GWO stage performs constrained continuous/discrete optimization following the canonical GWO update rules introduced by Mirjalili et al. [35].
Figure 5.
Publication-grade bar diagram summarizing the complete computational pipeline. Stages 2–3 implement index-based screening, whereas Stage 4 performs constrained joint placement and sizing using the Grey Wolf Optimizer (GWO).
3.11.1. Role of the Screening Stages
Stages 2 and 3 are not intended to replace the metaheuristic optimization stage. Their role is strictly analytical and preparatory. First, the screening indices provide a physically interpretable ranking of buses according to their individual contribution to active-loss reduction and voltage support under controlled penetration levels. Second, they reduce the effective combinatorial search space before the joint placement-and-sizing problem is solved.
Stage 4 (GWO) performs the final constrained optimization over location and sizing variables simultaneously. The screening results therefore act as an informed preprocessing mechanism that enhances interpretability and computational tractability, while the optimizer retains full freedom within the defined feasible domain. Consequently, the screening procedure is complementary to the metaheuristic stage rather than redundant.
3.11.2. Notation and Problem Objects
Let the radial distribution network be represented by the set of buses and lines , with bus 1 being the slack bus. Define the admissible installation buses as
Let denote the vector of bus-voltage magnitudes obtained from a power-flow (PF) solution. The operational bounds are
and the slack-bus power factor constraint is enforced as
Define PV penetration levels as the finite set and CB compensation levels as . For a given penetration , the PV active-power injection is set as
and for a given compensation level the CB reactive injection is
3.11.3. End-to-End Pseudocode (Stages 1–4)
Algorithm 1 presents the complete computational procedure adopted in this study, including the base-case power-flow evaluation, the PV and CB screening stages, and the final GWO-based constrained joint optimization used to determine the coordinated placement and sizing solution.
| Algorithm 1 Complete computational procedure: screening stages + GWO constrained joint optimization |
Stage 1—Base-case power flow
Stage 2—PV screening via average benefit index
Stage 3—CB screening with PV fixed
Stage 4—GWO constrained joint placement and sizing
|
3.11.4. Flowchart of the Computational Procedure
Figure 6 complements Algorithm 1 by providing a graphical representation of the same computational sequence. The flowchart shows the progression from data loading and base-case power-flow evaluation to PV screening, CB screening, GWO-based constrained joint optimization, and final reporting of the optimal solution and performance metrics.
Figure 6.
Flowchart of the computational procedure. The first three stages compute base-case metrics and index-based screening candidates, while the final stage executes constrained joint placement-and-sizing via GWO [35].
3.11.5. Implementation and Reproducibility Considerations
Discrete placement variables are handled through integer projection within the GWO update rules, while constraint violations are penalized within the objective function to ensure feasible solutions. All power-flow evaluations are performed using a deterministic load-flow solver, ensuring numerical stability and reproducibility. The normalization of objective-function components allows a consistent interpretation of the weight parameters and supports a meaningful sensitivity analysis.
4. Results Analysis
4.1. Base-Case Simulation Results
The results obtained for the base case of each system are presented below. These results serve as a comparative reference for the remaining scenarios.
4.1.1. Voltage Profiles of the IEEE 15-Bus System Under Base-Case Conditions
Figure 7 shows the voltage profile at all buses of the system. A progressive voltage drop is observed, particularly toward the terminal buses, where the minimum voltage value of 0.945 [p.u.] occurs at bus 13. Low voltage levels lead to increased current flow through the lines, which in turn causes higher power losses in the system.
Figure 7.
Voltage profiles of the IEEE 15-bus system under base-case conditions [author].
4.1.2. Power Factor of the IEEE 15-Bus System Under Base-Case Conditions
Table 8 presents the power factor at the slack bus, with a value of 0.701, indicating a high reactive-power demand from the loads. A low power factor forces the system to transport higher current levels to supply the same amount of active power, thereby increasing power losses.
Table 8.
Slack-bus power factor under base-case conditions for the IEEE 15-bus system [author].
4.1.3. Power Losses of the IEEE 15-Bus System Under Base-Case Conditions
Figure 8 and Figure 9 present the active (P)- and reactive (Q)-power losses of the system. It can be observed that the highest losses are concentrated in the initial line segments. This behavior is mainly due to the fact that these segments carry most of the power supplied to the system, resulting in higher current levels. In addition, the transport of reactive power contributes to the increase in current magnitude. As the current decreases along the feeder, power losses are progressively reduced in the downstream segments.
Figure 8.
Active-power losses (P) under base-case conditions for the IEEE 15-bus system [author].
Figure 9.
Reactive-power losses (Q) under base-case conditions for the IEEE 15-bus system [author].
Table 9 summarizes the total power losses of the system under base-case conditions.
Table 9.
Total power losses under base-case conditions for the IEEE 15-bus system [author].
4.1.4. Voltage Profiles of the IEEE 34-Bus System Under Base-Case Conditions
Figure 10 shows that voltage magnitudes decrease progressively along the feeder from the slack bus toward the remote buses, reaching a minimum value of 0.941 [p.u.] at bus 27. Voltage levels below 0.95 [p.u.] lead to an increase in line currents, which in turn results in higher electrical losses throughout the distribution system.
Figure 10.
Voltage profiles under base-case conditions for the IEEE 34-bus system [author].
4.1.5. Power Factor of the IEEE 34-Bus System Under Base-Case Conditions
Table 10 presents the power factor at the slack bus with a value of 0.855. This relatively low power factor indicates that the system requires a significant amount of reactive power to supply the loads, increasing line currents and contributing to higher losses and overall system performance degradation.
Table 10.
Slack bus power factor under base-case conditions for the IEEE 34-bus system [author].
4.1.6. Power Losses of the IEEE 34-Bus System Under Base-Case Conditions
Figure 11 and Figure 12 illustrate the active (P)- and reactive (Q)-power losses along each line segment. The highest losses are observed in the initial segments of the feeder, as these sections carry a large proportion of the power supplied to the system, resulting in higher currents. Furthermore, the transport of reactive power contributes to the increase in losses. As reactive-power demand decreases along the feeder, total losses are gradually reduced.
Figure 11.
Active-power losses (P) under base-case conditions for the IEEE 34-bus system [author].
Figure 12.
Reactive-power losses (Q) under base-case conditions for the IEEE 34-bus system [author].
Table 11 presents the total system losses under base-case conditions.
Table 11.
Total power losses under base-case conditions for the IEEE 34-bus system [author].
4.2. Scenario 2: Integration of Photovoltaic Systems
Figure 13 and Figure 14 present the average photovoltaic benefit index , obtained by averaging the values calculated at all buses of the system for different photovoltaic penetration levels. This index allows evaluating the reduction in power losses associated with each proposed photovoltaic penetration level in the IEEE-15 and IEEE-34 distribution systems.
Figure 13.
Average photovoltaic benefit index for the IEEE-15 system [author].
Figure 14.
Average photovoltaic benefit index for the IEEE-34 system [author].
Table 12 presents the optimal bus for each system, selected based on the highest average photovoltaic benefit index. These buses are used for the subsequent analysis of voltage profiles, system power factor, and power losses.
Table 12.
Bus with the highest average photovoltaic benefit index for each system [author].
4.2.1. Voltage Profiles of the IEEE-15 System with PV Integration
After integrating photovoltaic systems, an increase in voltage magnitude is observed at all buses for different penetration levels, as shown in Figure 15. The highest improvement occurs at the 20% penetration level, particularly at the terminal buses, where the minimum voltage at bus 13 increases from 0.945 to 0.959 [p.u.].
Figure 15.
Voltage profiles of the IEEE-15 system with photovoltaic integration [author].
4.2.2. Power Factor of the IEEE-15 System with PV Integration
Table 13 shows the deterioration of the slack-bus power factor after integrating photovoltaic systems at different penetration levels. The most significant reduction occurs at the 20% penetration level, where the power factor decreases from 0.701 to 0.662. This behavior is attributed to the reduction of active power supplied by the slack bus while reactive-power demand remains unchanged.
Table 13.
Slack-bus power factor of the IEEE-15 system with PV integration [author].
4.2.3. Power Losses of the IEEE-15 System with PV Integration
Figure 16 and Figure 17 illustrate the active- and reactive-power losses along the distribution lines. A significant reduction in losses is observed in the initial line segments as photovoltaic penetration increases. This reduction is caused by the decrease in power flow supplied from the slack bus, which leads to lower current magnitudes and consequently reduced losses.
Figure 16.
Active-power losses of the IEEE-15 system with photovoltaic integration [author].
Figure 17.
Reactive-power losses of the IEEE-15 system with photovoltaic integration [author].
Table 14 summarizes the total power losses for different photovoltaic penetration levels. The maximum reduction is achieved at the 20% penetration level, corresponding to an 18.32% reduction in active-power losses and an 18.71% reduction in reactive-power losses with respect to the base case.
Table 14.
Total power losses of the IEEE-15 system with photovoltaic integration [author].
4.2.4. Voltage Profiles of the IEEE-34 System with PV Integration
After integrating photovoltaic systems, an increase in voltage magnitude is observed at all buses for different photovoltaic penetration levels, as shown in Figure 18. The highest voltage improvement is achieved at the 20% penetration level, particularly at the terminal buses, where the minimum voltage at bus 27 increases from 0.941 to 0.967 [p.u.].
Figure 18.
Voltage profiles of the IEEE-34 system with photovoltaic integration [author].
4.2.5. Power Factor of the IEEE-34 System with PV Integration
Table 15 shows the deterioration of the slack-bus power factor after integrating photovoltaic systems at different penetration levels. The most pronounced reduction occurs at the 20% penetration level, where the power factor decreases from 0.855 to 0.797.
Table 15.
Slack-bus power factor of the IEEE-34 system with PV integration [author].
4.2.6. Power Losses of the IEEE-34 System with PV Integration
Figure 19 and Figure 20 show the active- and reactive-power losses along each line segment. A significant reduction in losses is observed as photovoltaic penetration increases. This behavior is mainly attributed to the reduction in power flow through the upstream segments, which decreases line currents and consequently reduces power losses.
Figure 19.
Active-power losses of the IEEE-34 system with photovoltaic integration [author].
Figure 20.
Reactive-power losses of the IEEE-34 system with photovoltaic integration [author].
Table 16 summarizes the total power losses for different photovoltaic penetration levels. The maximum reduction is achieved at the 20% penetration level, corresponding to a 35.29% reduction in active-power losses and a 34.25% reduction in reactive-power losses with respect to the base case.
Table 16.
Total power losses of the IEEE-34 system with photovoltaic integration [author].
4.3. Scenario 3: Integration of Capacitor Banks with Photovoltaic Systems
Figure 21 and Figure 22 present the average capacitor-bank benefit index , obtained by averaging the values calculated at all buses for different reactive-power compensation levels. This index quantifies the reduction in reactive power supplied by the slack bus associated with each proposed compensation level using capacitor banks.
Figure 21.
Average capacitor bank benefit index for the IEEE-15 system [author].
Figure 22.
Average capacitor bank benefit index for the IEEE-34 system [author].
In this analysis, the PV location is kept fixed at bus 13 for the IEEE-15 system and at bus 26 for the IEEE-34 system, both evaluated at the highest photovoltaic penetration level (20%).
Table 17 shows the optimal bus for capacitor bank installation, considering fixed photovoltaic locations. Based on these results, the corresponding analysis of voltage profiles, power factor, and power losses is carried out for each system.
Table 17.
Bus with the highest average capacitor bank benefit index for each system [author].
4.3.1. Voltage Profile of the IEEE-15 System with PV and Capacitor Bank Integration
After applying the coordinated integration of photovoltaic systems and capacitor banks, a significant voltage improvement is observed compared to both the base case and the scenario with maximum PV penetration, as shown in Figure 23. The highest voltage enhancement is achieved when the maximum PV penetration is combined with a 50% reactive-power compensation level. Under this condition, voltage magnitudes at all buses remain within the acceptable operating limits, and the minimum voltage at bus 13 increases from 0.945 to 0.973 [p.u.].
Figure 23.
Voltage profiles of the IEEE-15 system with coordinated integration of PV systems and capacitor banks [author].
4.3.2. Power Factor of the IEEE-15 System with PV and Capacitor Bank Integration
With the implementation of the coordinated integration of photovoltaic systems and capacitor banks, the system power factor at the slack bus reaches a maximum value of 0.840. This result represents a progressive improvement compared to lower compensation levels and demonstrates a clear enhancement relative to the previously analyzed scenarios, as summarized in Table 18.
Table 18.
Slack-bus power factor with simultaneous PV and capacitor bank compensation for the IEEE-15 system [author].
4.3.3. Power Losses of the IEEE-15 System with PV and Capacitor-Bank Integration
Figure 24 and Figure 25 show that the coordinated integration of photovoltaic systems and capacitor banks significantly reduces both active- and reactive-power losses along the distribution feeder for all evaluated compensation levels. This configuration exhibits superior performance compared to the other analyzed scenarios, as it effectively decreases line currents through the combined effect of local active-power injection from the PV system and reactive-power compensation provided by the capacitor bank.
Figure 24.
Active-power losses of the IEEE-15 system with coordinated integration of PV systems and capacitor banks [author].
Figure 25.
Reactive-power losses of the IEEE-15 system with coordinated integration of PV systems and capacitor banks [author].
Table 19 presents the total loss reduction achieved through the coordinated integration of photovoltaic systems and capacitor banks. At the highest compensation level, total losses are reduced by 52.5% for active power and 56.1% for reactive power compared to the base case.
Table 19.
Total power losses of the IEEE-15 system with simultaneous PV and capacitor-bank compensation [author].
4.3.4. Voltage Profile of the IEEE-34 System with PV and Capacitor-Bank Integration
Similarly, the application of simultaneous PV and capacitor-bank compensation in the IEEE-34 system leads to a substantial voltage improvement compared to both the base case and the scenario with maximum PV penetration, as illustrated in Figure 26. The highest voltage enhancement is achieved when combining maximum PV penetration with a 50% reactive compensation level, increasing the minimum voltage at bus 27 from 0.941 to 0.974 [p.u.].
Figure 26.
Voltage profiles of the IEEE-34 system with coordinated integration of PV systems and capacitor banks [author].
4.3.5. Power Factor of the IEEE-34 System with PV and Capacitor Bank Integration
With the application of the coordinated integration of photovoltaic systems and capacitor banks, the system power factor at the slack bus reaches a maximum value of 0.921, showing a progressive improvement compared to lower compensation levels and a clear enhancement with respect to the previously analyzed scenarios, as summarized in Table 20.
Table 20.
Slack-bus power factor with simultaneous PV and capacitor bank compensation for the IEEE-34 system [author].
4.3.6. Power Losses of the IEEE-34 System with PV and Capacitor Bank Integration
Figure 27 and Figure 28 show that the coordinated integration of photovoltaic systems and capacitor banks significantly reduces both active- and reactive-power losses along the distribution feeder for all evaluated compensation levels. This configuration exhibits superior performance compared to the other analyzed scenarios due to the combined effect of local active-power injection provided by the PV system and reactive-power compensation supplied by the capacitor bank, which reduces the current magnitude in the upstream line segments.
Figure 27.
Active-power losses of the IEEE-34 system with coordinated integration of PV systems and capacitor banks [author].
Figure 28.
Reactive-power losses of the IEEE-34 system with coordinated integration of PV systems and capacitor banks [author].
Table 21 presents the total loss reduction achieved through the coordinated integration of photovoltaic systems and capacitor banks. At the highest compensation level, total losses are reduced by 52.2% for active power and 56.4% for reactive power compared to the base case.
Table 21.
Total power losses of the IEEE-34 system with coordinated integration of PV systems and capacitor banks [author].
4.4. Scenario 4: GWO-Based Optimization
This scenario presents the optimal solutions determined by the Grey Wolf Optimizer (GWO) algorithm for the placement and sizing of photovoltaic systems and capacitor banks. The objective of the optimization is to reduce power losses, improve the system power factor, and enhance low voltage profiles, while incorporating a reference economic criterion into the objective function. This allows the algorithm to determine an optimal solution that balances technical performance and investment cost.
4.4.1. Literature-Based Positioning Relative to Established Metaheuristics
Although the present study does not include a same-testbed experimental comparison against alternative metaheuristics, a literature-based positioning analysis was incorporated in order to contextualize the expected behavior of the Grey Wolf Optimizer (GWO) relative to two widely established reference methods, namely, Particle Swarm Optimization (PSO) and Genetic Algorithm (GA). This complementary analysis is not intended to replace a direct benchmark under identical optimization conditions but rather to provide a bibliographic synthesis of the algorithmic tendencies most frequently reported in the literature.
Figure 29 summarizes an ordinal qualitative synthesis on a 1–5 scale constructed from review and comparative studies. The evaluated dimensions include implementation simplicity, convergence behavior, global-search robustness, computational efficiency, and adoption in electric-power optimization research. Under this literature-based positioning, GWO exhibits a favorable balance between implementation simplicity, convergence behavior, and computational efficiency, while PSO remains highly competitive but more sensitive to premature convergence and high-dimensional search difficulties. GA preserves strong exploratory capability and broad historical adoption, although the literature frequently reports slower convergence and higher computational burden. Therefore, the bibliographic evidence supports the use of GWO as a technically consistent and well-motivated optimization strategy for the coordinated planning problem addressed in this work.
Figure 29.
Literature-based qualitative positioning of GWO, PSO, and GA. The radar chart represents an ordinal 1–5 synthesis derived from cited review and comparative studies, considering implementation simplicity, convergence behavior, global-search robustness, computational efficiency, and adoption in electric-power optimization research. This figure provides bibliographic context only and should not be interpreted as a direct same-testbed benchmark.
4.4.2. Robustness Scope Under Steady-State Operating Conditions
The optimization results reported in this work were obtained under deterministic steady-state operating conditions, using fixed load demand and fixed photovoltaic injection levels for each evaluated scenario. Accordingly, the robustness of the proposed methodology should be interpreted within that modeling scope, that is, as the capability of the optimization framework to identify technically admissible and economically balanced solutions under the specified operating point and imposed network constraints.
Under this formulation, robustness is reflected in three complementary aspects. First, the proposed framework preserves compliance with voltage and slack-bus power-factor constraints throughout the optimization process. Second, the sensitivity analysis performed on the weighting factors shows that the algorithm maintains consistent technical–economic trade-offs when the relative planning priorities are modified. Third, the benchmark validation on two radial distribution systems of different size and loading characteristics demonstrates that the methodology remains applicable across distinct steady-state network conditions.
Nevertheless, the present study does not represent time-varying demand profiles, intermittent photovoltaic fluctuations, or short-term grid disturbances. Therefore, the reported solutions should be interpreted as planning-oriented steady-state optima rather than as dynamic operating schedules. A full robustness assessment under temporal variability would require time-series simulations or stochastic optimization formulations incorporating hourly load evolution, variable irradiance, and network operating uncertainty. Such an extension constitutes a relevant next step for future research, but it lies beyond the scope of the present manuscript.
Figure 30 and Figure 31 illustrate the optimal locations of the photovoltaic systems and capacitor banks obtained by the GWO algorithm for each test system.
Figure 30.
Optimal location of PV systems and capacitor banks obtained using the GWO algorithm for the IEEE-15 system [author].
Figure 31.
Optimal location of PV systems and capacitor banks obtained using the GWO algorithm for the IEEE-34 system [author].
Table 22 presents the optimal buses and corresponding sizing determined by the GWO algorithm. For the IEEE-15 system, the photovoltaic system is installed at bus 13 and the capacitor bank at bus 4. For the IEEE-34 system, the photovoltaic system is located at bus 25 and the capacitor bank at bus 21.
Table 22.
Optimal placement and sizing obtained using the GWO algorithm [author].
The convergence curves allow for analyzing the evolution of the GWO algorithm through the progressive reduction in the objective function value at each iteration while optimizing the placement and sizing of PV systems and capacitor banks. Figure 32 shows a rapid decrease in the objective function during the initial iterations, reaching convergence around iteration 16 for the IEEE-15 system.
Figure 32.
Convergence behavior of the GWO algorithm for the IEEE-15 system [author].
Similarly, Figure 33 shows convergence around iteration 133, where the algorithm stabilizes and identifies the optimal solution for the IEEE-34 system.
Figure 33.
Convergence behavior of the GWO algorithm for the IEEE-34 system [author].
4.4.3. Voltage Profile of the IEEE-15 System with GWO Optimization
Figure 34 presents the solution obtained through the GWO algorithm, showing a clear improvement in voltage levels while maintaining them within the established operational limits. Compared to the base case, where the minimum voltage occurred at bus 13 with a value of 0.945 [p.u.], the optimized solution increases the minimum voltage to 0.970 [p.u.], demonstrating the effectiveness of the proposed optimization strategy.
Figure 34.
Voltage profiles of the IEEE-15 system with GWO optimization [author].
Table 23 presents the average voltage deviation for the IEEE-15 system under the evaluated scenarios. Compared with the base case, the GWO-optimized solution reduces the average voltage deviation from 4.14% to 2.57%, confirming the effectiveness of the proposed optimization strategy in improving the voltage profile while maintaining a balanced technical–economic solution.
Table 23.
Average voltage deviation of the IEEE-15 system [author].
4.4.4. Power Factor of the IEEE-15 System with GWO Optimization
Table 24 summarizes the slack-bus power factor for the evaluated scenarios. With GWO optimization, the power factor improves significantly from 0.701 in the base case to 0.947, indicating a more efficient system operation and an effective coordination of active and reactive power integration.
Table 24.
Slack-bus power factor with GWO optimization for the IEEE-15 system [author].
4.4.5. Power Losses of the IEEE-15 System with GWO Optimization
Figure 35 and Figure 36 illustrate the distribution of active and reactive power losses along the feeder after GWO optimization. A pronounced reduction is observed in the upstream line segments, where the highest power flows were previously present. This reduction leads to lower current magnitudes and, consequently, decreased power losses throughout the system.
Figure 35.
Active-power losses of the IEEE-15 system with GWO optimization [author].
Figure 36.
Reactive-power losses of the IEEE-15 system with GWO optimization [author].
Table 25 presents the total power losses for each scenario. The GWO-optimized solution achieves a reduction of 45.9% in active-power losses and 49.1% in reactive-power losses compared to the base case, highlighting its ability to identify effective coordinated PV–CB integration strategies.
Table 25.
Total power losses of the IEEE-15 system with GWO optimization [author].
4.4.6. Physical Interpretation of the GWO Optimal Locations
The optimal locations identified by the GWO algorithm can be explained by the electrical behavior of radial distribution feeders. In such networks, voltage magnitudes tend to decrease toward electrically remote buses due to the cumulative effect of series impedance. Installing PV generation at buses that are electrically distant and/or strongly loaded reduces upstream active-power transfer, thereby decreasing line current magnitudes in multiple feeder sections. Since active losses scale with , this current reduction produces a nonlinear reduction in total active-power losses.
In parallel, placing a capacitor bank at a bus with low voltage levels provides localized reactive support, reducing the reactive power that must be supplied by the slack bus. This improves and reduces reactive current circulation along the feeder, which further mitigates losses and strengthens voltage regulation.
Therefore, the simultaneous selection of PV and CB buses reflects the joint effect of (i) reducing upstream current through local active-power injection and (ii) decreasing reactive current through local compensation, yielding improved voltage profiles and loss reduction under the enforced technical constraints and the economic normalization embedded in the objective function.
4.4.7. Voltage Profile of the IEEE-34 System with GWO Optimization
Figure 37 shows the voltage profile obtained using the GWO algorithm for the IEEE-34 system. Compared to the base case, where the minimum voltage at bus 27 was 0.941 [p.u.], the optimized solution increases the minimum voltage to 0.971 [p.u.], maintaining all bus voltages within the acceptable operating limits.
Figure 37.
Voltage profiles of the IEEE-34 system with GWO optimization [author].
Table 26 presents the average voltage deviation for the IEEE-34 system under the evaluated scenarios. While the base case exhibits a deviation of 3.42%, the coordinated integration of photovoltaic systems and capacitor banks reduces it to 2.28%. The GWO-optimized solution yields a DPV of 2.39%, reflecting the algorithm’s emphasis on achieving an optimal balance between technical performance and investment cost.
Table 26.
Average voltage deviation of the IEEE-34 system [author].
4.4.8. Power Factor of the IEEE-34 System with GWO Optimization
Table 27 presents the slack-bus power factor for the different analyzed scenarios. With the application of the GWO optimization, the power factor improves from 0.855 in the base case to 0.955, evidencing a significantly more efficient system operation and an effective coordination between active- and reactive-power integration.
Table 27.
Slack-bus power factor with GWO optimization for the IEEE-34 system [author].
4.4.9. Power Losses of the IEEE-34 System with GWO Optimization
Figure 38 and Figure 39 illustrate the distribution of active- and reactive-power losses along the feeder before and after the application of the GWO algorithm. A more pronounced reduction is observed in the upstream and intermediate line sections, where a significant portion of the supplied power previously flowed. This reduction decreases line currents and, consequently, minimizes power losses throughout the system.
Figure 38.
Active-power losses of the IEEE-34 system with GWO optimization [author].
Figure 39.
Reactive-power losses of the IEEE-34 system with GWO optimization [author].
Table 28 summarizes the total power losses for each scenario. The GWO-optimized solution achieves a reduction of 49.8% in active-power losses and 50.8% in reactive-power losses compared to the base case, confirming the algorithm’s capability to identify optimal solutions for simultaneous active and reactive power integration.
Table 28.
Total power losses of the IEEE-34 system with GWO optimization [author].
5. Annual Economic Savings with GWO Optimization
Table 29 presents the reference annual economic savings for the IEEE-15 and IEEE-34 systems. The savings are calculated based on the difference between the active power losses of the base case and those obtained with GWO optimization, converted to annual energy using 8760 operating hours and monetized using an electricity cost of 8.14 ctUSD/kWh.
Table 29.
Annual economic savings obtained with GWO optimization [author].
The IEEE-34 system exhibits higher annual savings of 78,475 USD compared to 19,975 USD for the IEEE-15 system. This result is mainly attributed to its larger size, higher load levels, and greater absolute loss reduction, despite requiring a higher investment in PV systems and capacitor banks. These findings demonstrate that the proposed optimization strategy not only improves the electrical performance of distribution systems but also provides tangible economic benefits.
Simple Payback Assessment
To complement the annual loss–cost savings analysis, the economic feasibility of the optimized solution is evaluated through the simple payback period, defined as
where represents the payback period in years, is the total investment cost of the optimized solution, and denotes the annual loss–cost savings.
Using the investment and savings values reported in Table 29, the estimated simple payback period is approximately 5.90 years for the IEEE 15-bus system and 10.84 years for the IEEE 34-bus system. These results indicate that the proposed coordinated compensation strategy remains economically viable under the assumed energy price and cost parameters.
6. Sensitivity Analysis Results
As shown in Appendix A, Case A for the IEEE-15 system and Case B for the IEEE-34 system correspond to the weighting sets adopted in the main analysis. These configurations were selected because they provide an adequate balance between system performance improvement and investment cost. The results clearly indicate that modifying the priority assigned to each weight leads to different improvements in the evaluated performance indicators, highlighting the importance of properly tuning the objective function weights according to the specific operational requirements of each distribution system.
It is also observed that, due to the stochastic nature of metaheuristic algorithms, the convergence behavior may vary between executions. Consequently, the reported results correspond to individual optimization runs for each analyzed case. The IEEE-34 system required a higher number of iterations to reach convergence compared to the IEEE-15 system, mainly due to its larger size and higher dimensionality of the search space.
Weight Selection Rationale and Trade-Off Interpretation
Since the objective function is formulated as a normalized weighted aggregation of technical and economic criteria, different weight configurations generate different trade-off solutions. Therefore, the sensitivity cases reported in this section can be interpreted as a discrete approximation of a multi-criteria Pareto set.
A weight configuration is considered non-dominated if no other configuration simultaneously improves (i) active-power loss reduction, (ii) voltage deviation performance, and (iii) slack-bus power factor, without increasing the total investment cost.
To provide a systematic decision rule, the preferred configuration can be selected by minimizing the Euclidean distance to the ideal normalized point defined by
evaluated within the tested cases. This ensures that weight selection is not arbitrary but based on a transparent technical–economic compromise.
Table 30 summarizes the sensitivity analysis results for the different weight configurations of the objective function, including convergence characteristics, optimal locations and sizes of the photovoltaic systems and capacitor banks, total investment cost, power loss reduction, minimum voltage levels, voltage deviation percentage, and slack-bus power factor.
Table 30.
Sensitivity analysis results for different objective function weight configurations.
7. Conclusions
This work presented a structured planning framework for the coordinated integration of photovoltaic systems and capacitor banks in radial distribution networks under steady-state operating conditions. The proposed methodology combines deterministic power-flow assessment, index-based candidate screening, and constrained joint placement and sizing using the Grey Wolf Optimizer (GWO), allowing the simultaneous evaluation of technical performance and investment cost within a unified formulation.
The results confirm that photovoltaic integration alone improves voltage profiles and reduces active power losses but does not ensure an adequate reactive-power balance at the slack bus. In contrast, the coordinated PV–CB configuration provides a more effective improvement in overall steady-state performance by combining local active-power injection with localized reactive-power support. For the fixed coordinated PV–CB scenario with the highest evaluated levels, the active-power losses were reduced by 52.5% and 52.2% in the IEEE-15 and IEEE-34 systems, respectively, while the corresponding slack-bus power factors increased to 0.840 and 0.921.
The GWO-based optimization framework identified technically balanced and economically contained solutions for both benchmark systems. In the IEEE-15 system, the optimized solution achieved a 45.9% reduction in active-power losses, improved the slack-bus power factor to 0.947, and reduced the average voltage deviation to 2.57%. In the IEEE-34 system, the optimized configuration yielded a 49.8% reduction in active-power losses, increased the slack-bus power factor to 0.955, and reduced the average voltage deviation to 2.39%. These results demonstrate that the proposed optimization approach is capable of satisfying the imposed technical constraints while limiting unnecessary overdimensioning.
From an economic perspective, the optimized solutions yielded annual loss–cost savings of approximately 19,975 USD for the IEEE-15 system and 78,475 USD for the IEEE-34 system, supporting the practical viability of the proposed framework. In addition, the sensitivity analysis confirmed that the selected solution depends on the relative priority assigned to technical and economic criteria, while preserving the methodological robustness of the proposed formulation. Overall, the results support the applicability of the GWO-based coordinated planning approach as an effective tool for steady-state voltage regulation, power-factor improvement, and active-power loss minimization in radial distribution systems.
8. Future Work
Future research may extend the proposed methodology by incorporating time-varying operating conditions, including low-, medium-, and peak-demand scenarios, in order to evaluate the robustness of the optimal solutions under more realistic distribution-system behavior. In addition, the proposed framework may be expanded to the simultaneous optimization of multiple photovoltaic systems and multiple capacitor banks in larger and more complex networks. Within such an extended formulation, the single-PV/single-CB configuration adopted in this work should be interpreted as a baseline planning model aimed at identifying technically effective and economically contained solutions with manageable optimization complexity, whereas the multi-device case would require an expanded decision vector and a substantially larger placement-and-sizing search space.
Further developments may also investigate the performance of alternative compensation technologies, such as FACTS devices or photovoltaic inverters with reactive power control capability, and compare their effectiveness with that of conventional capacitor banks. Finally, the explicit incorporation of uncertainty in load demand and renewable generation through stochastic or probabilistic optimization frameworks constitutes a relevant research direction for improving the practical applicability of the proposed methodology in real-world distribution systems.
Author Contributions
Conceptualization, S.M. and A.A.T.; methodology, S.M. and A.A.T.; software, S.M.; validation, S.M. and A.A.T.; formal analysis, S.M. and A.A.T.; investigation, S.M.; resources, A.A.T.; data curation, S.M.; writing—original draft preparation, S.M.; writing—review and editing, A.A.T.; visualization, S.M.; supervision, A.A.T.; project administration, A.A.T. All authors have read and agreed to the published version of the manuscript.
Funding
This research received no external funding. The APC was funded by Universidad Politécnica Salesiana.
Data Availability Statement
The data supporting the findings of this study are available from the corresponding author upon reasonable request.
Conflicts of Interest
The authors declare no conflicts of interest.
Abbreviations
The following abbreviations are used in this manuscript:
| EPS | Electric power system. |
| PSO | Particle swarm optimization. |
| GA | Genetic algorithm. |
| ABC | Artificial bee colony algorithm. |
| FA | Firefly algorithm. |
| ACO | Ant colony optimization. |
| GWO | Grey Wolf Optimizer. |
| CB | Capacitor bank. |
| PV | Photovoltaic system. |
| P | Active power (MW). |
| Q | Reactive power (MVAr). |
| S | Apparent power. |
| PF | Power factor. |
| SLACK | Slack bus. |
| FO | Objective function. |
| APVD | Average voltage profile deviation. |
| CAPEX | Capital expenditure. |
| R | Resistance. |
| X | Reactance. |
| B | Susceptance. |
| CPCI | Coordinated photovoltaic–capacitor integration. |
| Photovoltaic system benefit index. | |
| Variation of power losses. | |
| Installed photovoltaic system power. | |
| Average photovoltaic system benefit index. | |
| Capacitor bank benefit index. | |
| Reactive power variation at the slack bus. | |
| Installed capacitor bank reactive power. | |
| Average capacitor bank benefit index. | |
| Power factor at the slack bus. | |
| Normalized cost. | |
| Reference voltage (p.u.). | |
| Minimum voltage (p.u.). | |
| Maximum voltage (p.u.). | |
| Active-power losses (MW). | |
| Reference total cost of photovoltaic systems. | |
| Reference total cost of capacitor banks. | |
| Unit cost of capacitor banks. | |
| Unit cost of photovoltaic systems. | |
| Maximum allowable cost limit. | |
| Total cost after optimization. | |
| Voltage at bus i (p.u.). | |
| Minimum allowable photovoltaic power (kW). | |
| Maximum allowable photovoltaic power (kW). | |
| Minimum allowable capacitor bank reactive power (kVAr). | |
| Maximum allowable capacitor bank reactive power (kVAr). | |
| Number of photovoltaic systems to be installed. | |
| Number of capacitor banks to be installed. | |
| Unit cost of electrical energy (kWh). | |
| Number of buses in the system. | |
| Number of lines in the system. |
References
- Wang, C.; Ju, P.; Wu, F.; Pan, X.; Wang, Z. A systematic review on power system resilience from the perspective of generation, network, and load. Renew. Sustain. Energy Rev. 2022, 167, 112567. [Google Scholar] [CrossRef] [Scilit]
- Andrade, E.D.A.; Cando, C.G.O. Impacto de la industria 4.0 y su relación con la energía fotovoltaica en Ecuador. Rev. Cient. Multidiscip. G-ner@ndo 2024, 5, 11. [Google Scholar] [CrossRef] [Scilit]
- Bautista, S. Generación renovable eólica y fotovoltaica en Ecuador: Una revisión sistemática de literatura. CienciAmérica 2024, 13, 40–62. [Google Scholar] [CrossRef] [Scilit]
- Kamarposhti, M.A.; Beromi, M.H.A.; Ghadimi, A.A. Optimizing capacitor bank placement in distribution networks using a multi-objective particle swarm optimization approach for energy efficiency and cost reduction. Sci. Rep. 2025, 15, 12332. [Google Scholar] [CrossRef] [Scilit]
- Fazal, M.; Raza, W.M.; Faizullah, K.S. Reactive Power Compensation by Power Capacitor Method. Eng. Technol. Open Access J. 2018, 1, 2018. [Google Scholar] [CrossRef] [Scilit]
- Schultis, D.-L.; Ilo, A. Optimal coordinated control of active and reactive power in distribution networks with high penetration of renewable energy sources. Energies 2021, 14, 5106. [Google Scholar] [CrossRef] [Scilit]
- Guarango, P.S.M.; Quilli, M.F.U. Optimización de la Topología de un Sistema de Distribución Residencial en Bajo Voltaje Aplicando el méTodo GWO (Grey Wolf Optimization), Proyecto Técnico con Enfoque Investigativo; Carrera de Ingeniería Eléctrica, Universidad Politécnica Salesiana: Sede Cuenca, Ecuador, 2019. [Google Scholar]
- Electromecánica, C.D.; Umajinga, P.; Danilo, J.; Johnatan, M.; Bonilla, I.C. Optimización de microrredes con generación distribuida utilizando GWO (Grey Wolf Optimizer) para mejorar la estabilidad de voltaje del sistema de prueba IEEE de 34 nodos. Conectividad 2025, 6, 396–414. [Google Scholar] [CrossRef] [Scilit]
- Caiza, D.O.G. Reducción de Pérdidas de Potencia Activa Mediante la Ubicación Óptima de Condensadores en Derivación en Una Red de Distribución Haciendo Uso del Algoritmo del Lobo Gris. Undergraduate Thesis, Universidad Politécnica Salesiana, Cuenca, Ecuador, 2023. Available online: http://dspace.ups.edu.ec/handle/123456789/26436 (accessed on 27 April 2026).
- Varan, M.; Erduman, A.; Menevşeoğlu, F. A Grey Wolf Optimization Algorithm-Based Optimal Reactive Power Dispatch with Wind-Integrated Power Systems. Energies 2023, 16, 5021. [Google Scholar] [CrossRef] [Scilit]
- Dorigo, M.; Stützle, T. The Ant Colony Optimization Metaheuristic: Algorithms, Applications, and Advances. In Handbook of Metaheuristics; Springer: Berlin/Heidelberg, Germany, 2004. [Google Scholar]
- Huang, B.; Song, K.; Jiang, S.; Zhao, Z.; Zhang, Z.; Li, C.; Sun, J. A Robust Salp Swarm Algorithm for Photovoltaic Maximum Power Point Tracking under Partial Shading Conditions. Mathematics 2024, 12, 3971. [Google Scholar] [CrossRef] [Scilit]
- Gómez Carmona, O.; Granada Echeverri, M.; Zapata Grisales, C.J. Pérdidas Técnicas en Redes Secundarias de Distribución de Energía Eléctrica. Undergraduate Thesis, Universidad Tecnológica de Pereira, Pereira, Colombia, 2020. [Google Scholar]
- Rios, J.; Valenzuela, A. Ajuste de la topología de la red eléctrica de distribución basado en restricciones de seguridad usando algoritmo de búsqueda/Ajuste da topologia da rede de distribuição elétrica com base em restrições de segurança usando algoritmo de busca. Braz. Appl. Sci. Rev. 2022, 6, 1203–1223. [Google Scholar] [CrossRef] [Scilit]
- Evas, P.F.C.; Luzuriaga, R.A.L. Estudio comparativo de protocolos de ruteo en redes malladas usando GNS3. TECH Carlos Cisneros 2023. [Google Scholar]
- El Berkaoui, A.; Bahsine, S.; Oukennou, A.; Ait Nouh, F.; Rzine, B. Distribution network topology planning and optimization: A brief review. E3S Web Conf. 2023, 469, 00054. [Google Scholar] [CrossRef] [Scilit]
- Russell, D.; Hamilton, D.; Almassalkhi, M.R.; Ossareh, H.R. Improved Voltage Regulation with Optimal Design of Decentralized Volt–VAr Control. arXiv 2025, arXiv:2510.14834. [Google Scholar] [CrossRef] [Scilit]
- Khan, Z.W.; Khan, S. Analyzing the impacts of distributed generation on power losses and voltage profile. In Proceedings of the International Conference on Emerging Technologies (ICET), Peshawar, Pakistan, 19–20 December 2015; IEEE: New York, NY, USA, 2015; pp. 1–4. [Google Scholar] [CrossRef] [Scilit]
- Aljabbab, A.; Habiballah, I.O. The power factor correction features. Int. J. Eng. Res. Technol. 2022, 11, 144–148. Available online: https://www.ijert.org/research/the-power-factor-correction-features-IJERTV11IS100094.pdf (accessed on 27 April 2026).
- IEEE Std 141-1993; IEEE Recommended Practice for Electric Power Distribution for Industrial Plants. IEEE: New York, NY, USA, 1994.
- Rojas Gómez, J.A. Óptima Compensación de la Potencia Reactiva en Redes de Distribución Eléctrica Basado en Simulated Annealing. Universidad Politécnica Salesiana. 2017. Available online: http://dspace.ups.edu.ec/handle/123456789/14229 (accessed on 28 December 2025).
- Li, X.; Li, H.; Li, S.; Jiang, Z.; Ma, X. Review on reactive power and voltage optimization of active distribution network with renewable distributed generation and time-varying loads. Math. Probl. Eng. 2021, 1196369. [Google Scholar] [CrossRef] [Scilit]
- Aguila Téllez, A. Medidas Para Minimizar Las Pérdidas de Energía en Circuitos de Distribución; Universidad de Ciego de Ávila: Ciego de Ávila, Cuba, 2014. [Google Scholar] [CrossRef]
- Jäger-Waldau, A. Snapshot of photovoltaics–March 2021. EPJ Photovolt. 2021, 12, 2. [Google Scholar] [CrossRef] [Scilit]
- de Oliveira, J.R.H. Energia solar fotovoltaica. Rev. Ibero Am. Humanidades Ciências Educ. 2023, 9, 1945–1954. [Google Scholar] [CrossRef] [Scilit]
- Soma, G.G. Optimal sizing and placement of capacitor banks in distribution networks using a genetic algorithm. Electricity 2021, 2, 187–204. [Google Scholar] [CrossRef] [Scilit]
- Babanezhad, M.; Arabi Nowdeh, S.; Abdelaziz, A.Y.; AboRas, K.M.; Kotb, H. Reactive power based capacitors allocation in distribution network using mathematical remora optimization algorithm considering operation cost and loading conditions. Alex. Eng. J. 2022, 61, 10511–10526. [Google Scholar] [CrossRef] [Scilit]
- David, J.; Murcia, C.; Andrés, C.; Salcedo, R. Compensación Dinámica de Potencia Activa y Reactiva en Sistemas de Distribución Empleando PV-STATCOMs. 2024. Available online: http://hdl.handle.net/11349/40338 (accessed on 29 December 2025).
- Metaheurísticos: Una Alternativa Para la Solución de Problemas Combinatorios en Administración de Operaciones. Available online: http://www.scielo.org.co/scielo.php?pid=S1794-12372007000200009&script=sci_arttext (accessed on 16 November 2025).
- Rajwar, K.; Deep, K.; Das, S. An exhaustive review of the metaheuristic algorithms for search and optimization: Taxonomy, applications, and open challenges. Artif. Intell. Rev. 2023, 56, 13187–13257. [Google Scholar] [CrossRef] [Scilit] [PubMed]
- Fettah, K.; Guia, T.; Salhi, A.; Mouassa, S.; Bosisio, A.; Shirvani, R. Optimal allocation of capacitor banks and distributed generation: A comparison of recently developed metaheuristic optimization techniques on real distribution networks of ALG-AB-Hassi Sida, Algeria. Sustainability 2024, 16, 4419. [Google Scholar] [CrossRef] [Scilit]
- Romero, J.J.; Dafonte, C.; Gómez, Á.; Penousal, F.J.; Brañas, F.A. Avances en Algoritmos Evolutivos. Available online: https://lc.fie.umich.mx/~a1039048f/ST/ms07.pdf (accessed on 16 November 2025).
- Katoch, S.; Chauhan, S.S.; Kumar, V. A review on genetic algorithm: Past, present, and future. Multimed. Tools Appl. 2020, 80, 8091–8126. [Google Scholar] [CrossRef] [Scilit]
- Baldick, R. Applied optimization: Formulation and algorithms for engineering systems. IEEE Control Syst. Mag. 2008, 28, 85. [Google Scholar] [CrossRef] [Scilit]
- Mirjalili, S.; Mirjalili, S.M.; Lewis, A. Grey wolf optimizer. Adv. Eng. Softw. 2014, 69, 46–61. [Google Scholar] [CrossRef] [Scilit]
- Benítez, R.A.; Delgado, J.R. Implementación del algoritmo meta-heurístico Gray Wolf Optimization para la optimización de funciones objetivo estándar. Ser. Cient. Univ. Cienc. Inform. 2020, 13, 174–194. [Google Scholar]
- Das, A.; Rai, R.; Sasmal, B.; Dhal, K.G.; Khurma, R.A.; Saha, R. Metaheuristic Algorithms Since 2020: Development, Taxonomy, Analysis, and Applications. Arch. Comput. Methods Eng. 2025, 1–69. [Google Scholar] [CrossRef] [Scilit]
- Mosavi, S.K.; Jalalian, E.; Gharahchopogh, F.S. A Comprehensive Survey of Grey Wolf Optimizer Algorithm and Its Application. Int. J. Adv. Robot. Expert Syst. 2018, 1, 23–45. [Google Scholar]
- Lakshminarayanan, S.; Paramacharya, S.K.; Kaur, D. Inspired Grey Wolf Optimizer Algorithm for Minimizing Operating Cost in Green Smart Home. 2015. Available online: https://etd.ohiolink.edu/acprod/odb_etd/ws/send_file/send?accession=toledo1438102173 (accessed on 10 March 2026).
- Premkumar, M.; Jangir, P.; Kumar, B.S.; Sowmya, R.; Alhelou, H.H. Augmented Weighted K-Means Grey Wolf Optimizer: An Enhanced Metaheuristic Algorithm for Data Clustering Problems. 2024. Available online: https://www.nature.com/articles/s41598-024-55619-z (accessed on 27 April 2026).
- Gao, Z.-M.; Zhao, J. An Improved Grey Wolf Optimization Algorithm with Variable Weights. Comput. Intell. Neurosci. 2019, 2019, 2981282. [Google Scholar] [CrossRef] [Scilit] [PubMed]
- Boyd, S.; Vandenberghe, L. Convex Optimization. Available online: https://web.stanford.edu/~boyd/cvxbook/ (accessed on 16 November 2025).
- Fahnbulleh, E.B.; Panda, B.; Ghatak, S.R.; Nanda, L.; Kundu, S.; Pradhan, A. A Review on Reactive Power Compensation Techniques in Grid-Integrated Photovoltaic System Using FACTS Devices and Fixed Capacitor Bank. In Proceedings of the 3rd IEEE International Conference on Industrial Electronics: Developments and Applications (ICIDeA), Bhubaneswar, India, 21–22 February 2025. [Google Scholar]
- Transmission and Distribution Committee; IEEE Power and Energy Society. IEEE Recommended Practice for Monitoring Electric Power Quality. 2019. Available online: http://www.ieee.org/web/aboutus/whatis/policies/p9-26.html (accessed on 27 April 2026).
- Fatima, S.; Püvi, V.; Lehtonen, M. Review on the PV Hosting Capacity in Distribution Networks. Energies 2020, 13, 4756. [Google Scholar] [CrossRef] [Scilit]
- Sadeghian, H.; Athari, M.H.; Wang, Z. Optimized solar photovoltaic generation in a real local distribution network. In Proceedings of the IEEE Power and Energy Society Innovative Smart Grid Technologies Conference (ISGT), Washington, DC, USA, 23–26 April 2017. [Google Scholar]
- Dagade, N.R.; Dagade, R.V.; Godha, N.R. Optimal Allocation of PV based DG and Capacitor in Radial Distribution Network. In Proceedings of the IET Conference Proceedings, Kharagpur, India, 14–16 December 2023; Volume 2023, pp. 632–636. [Google Scholar]
- Diab, A.A.Z.; Abdelhamid, A.M.; Sultan, H.M. Comprehensive analysis of optimal power flow using recent metaheuristic algorithms. Sci. Rep. 2024, 14, 13422. [Google Scholar] [CrossRef] [Scilit] [PubMed]
- Ehrgott, M.; Köksalan, M.; Kadziński, M.; Deb, K. Fifty Years of Multi-Objective Optimization and Decision-Making: From Mathematical Programming to Evolutionary Computation; Elsevier B.V.: Amsterdam, The Netherlands, 2025. [Google Scholar]
- Vatankhah Ghadim, H.; Way, R.; Ives, M.C.; Farmer, J.D. Are we too pessimistic? Cost projections for solar photovoltaics, wind power, and batteries are over-estimating actual costs globally. Appl. Energy 2025, 390, 125856. [Google Scholar] [CrossRef] [Scilit]
- Okelola, M.O.; Adebiyi, O.W.; Salimon, S.A.; Ayanlade, S.O.; Amoo, A.L. Optimal Sizing and Placement of Shunt Capacitors on the Distribution System Using Whale Optimization Algorithm. Niger. J. Technol. Dev. 2022, 19, 39–47. [Google Scholar] [CrossRef] [Scilit]
- Mahdavi, M.; Soleimani, A.; Pinnarelli, A.; Heidari, M.; Jurado, F. Cost-based optimization of DG and capacitor placement in distribution networks under dynamic load conditions. Energy Rep. 2025, 13, 5525–5534. [Google Scholar] [CrossRef] [Scilit]
- Kim, I. The Optimization of the Location and Capacity of Reactive Power Generation Units, Using a Hybrid Genetic Algorithm Incorporated by the Bus Impedance Power-Flow Calculation Method. Appl. Sci. 2020, 10, 1034. [Google Scholar] [CrossRef] [Scilit]
- Youssef, A.R.; Kamel, S.; Ebeed, M.; Yu, J. Optimal Capacitor Allocation in Radial Distribution Networks Using a Combined Optimization Approach. Electr. Power Compon. Syst. 2018, 46, 2084–2102. [Google Scholar] [CrossRef] [Scilit]
- Aguila-Téllez, A.; González, D.; Gutiérrez, G.; Ortiz, L. Ubicación y dimensionamiento óptimo de Generación Distribuida en redes de distribución usando PSO. I+D Tecnológico 2022, 18, 50–68. [Google Scholar] [CrossRef] [Scilit]
- Samueza, D.L.G. Ubicación de Recursos Distribuidos Basado en Flujos de Potencia Usando Optimización Por Enjambre de partíCulas. 2018. Available online: http://dspace.ups.edu.ec/handle/123456789/15896 (accessed on 29 December 2025).
- Kersting, W.H. Radial distribution test feeders. In Proceedings of the 2001 IEEE Power Engineering Society Winter Meeting. Conference Proceedings (Cat. No. 01CH37194), Columbus, OH, USA, 28 January–1 February 2001; Volume 2, pp. 908–912. [Google Scholar]
- Simbaña, R.J.A. Óptima Ubicación y Dimensionamiento de D-STATCOM en Sistemas Eléctricos de Distribución Para Mejorar el Perfil de Voltaje Considerando Restricción de Inyección de Armónicos Mediante el Algoritmo JAYA. Available online: http://dspace.ups.edu.ec/handle/123456789/26765 (accessed on 29 December 2025).
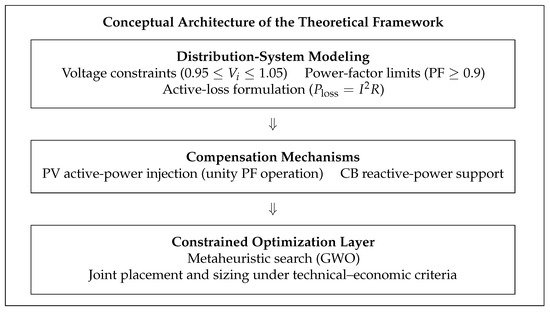
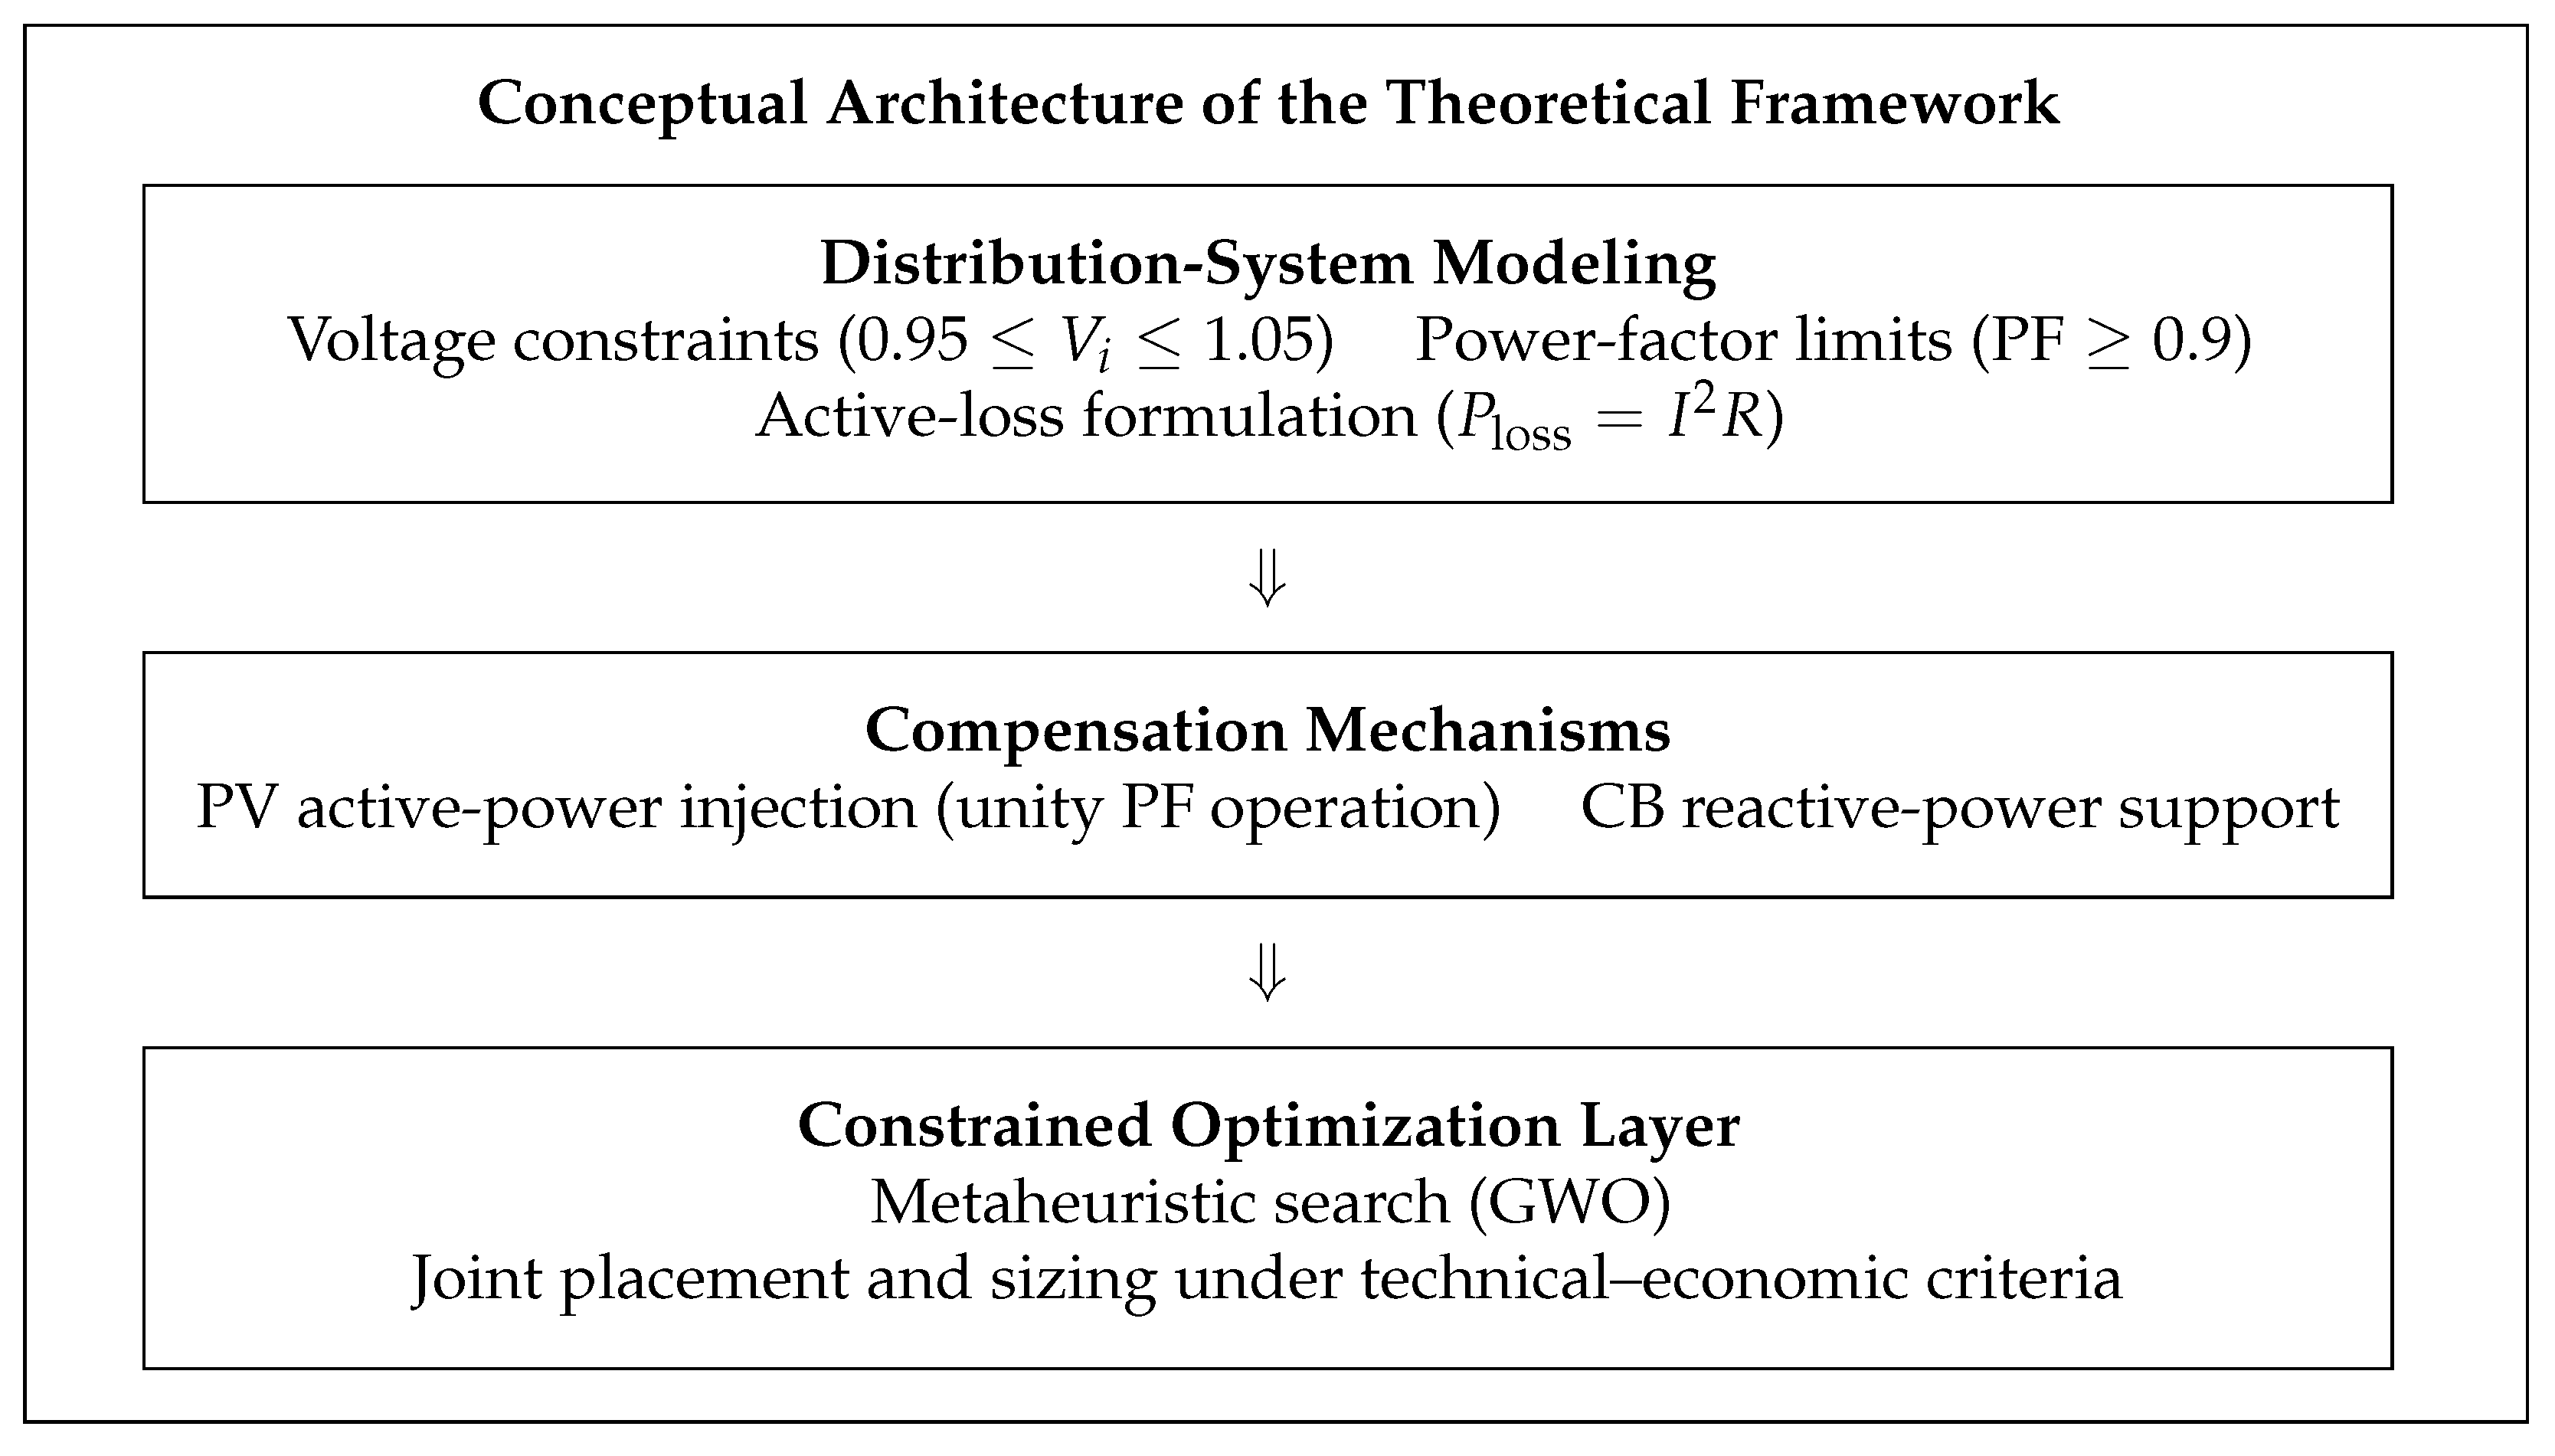
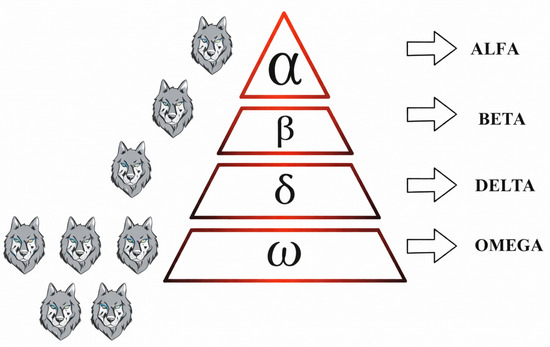
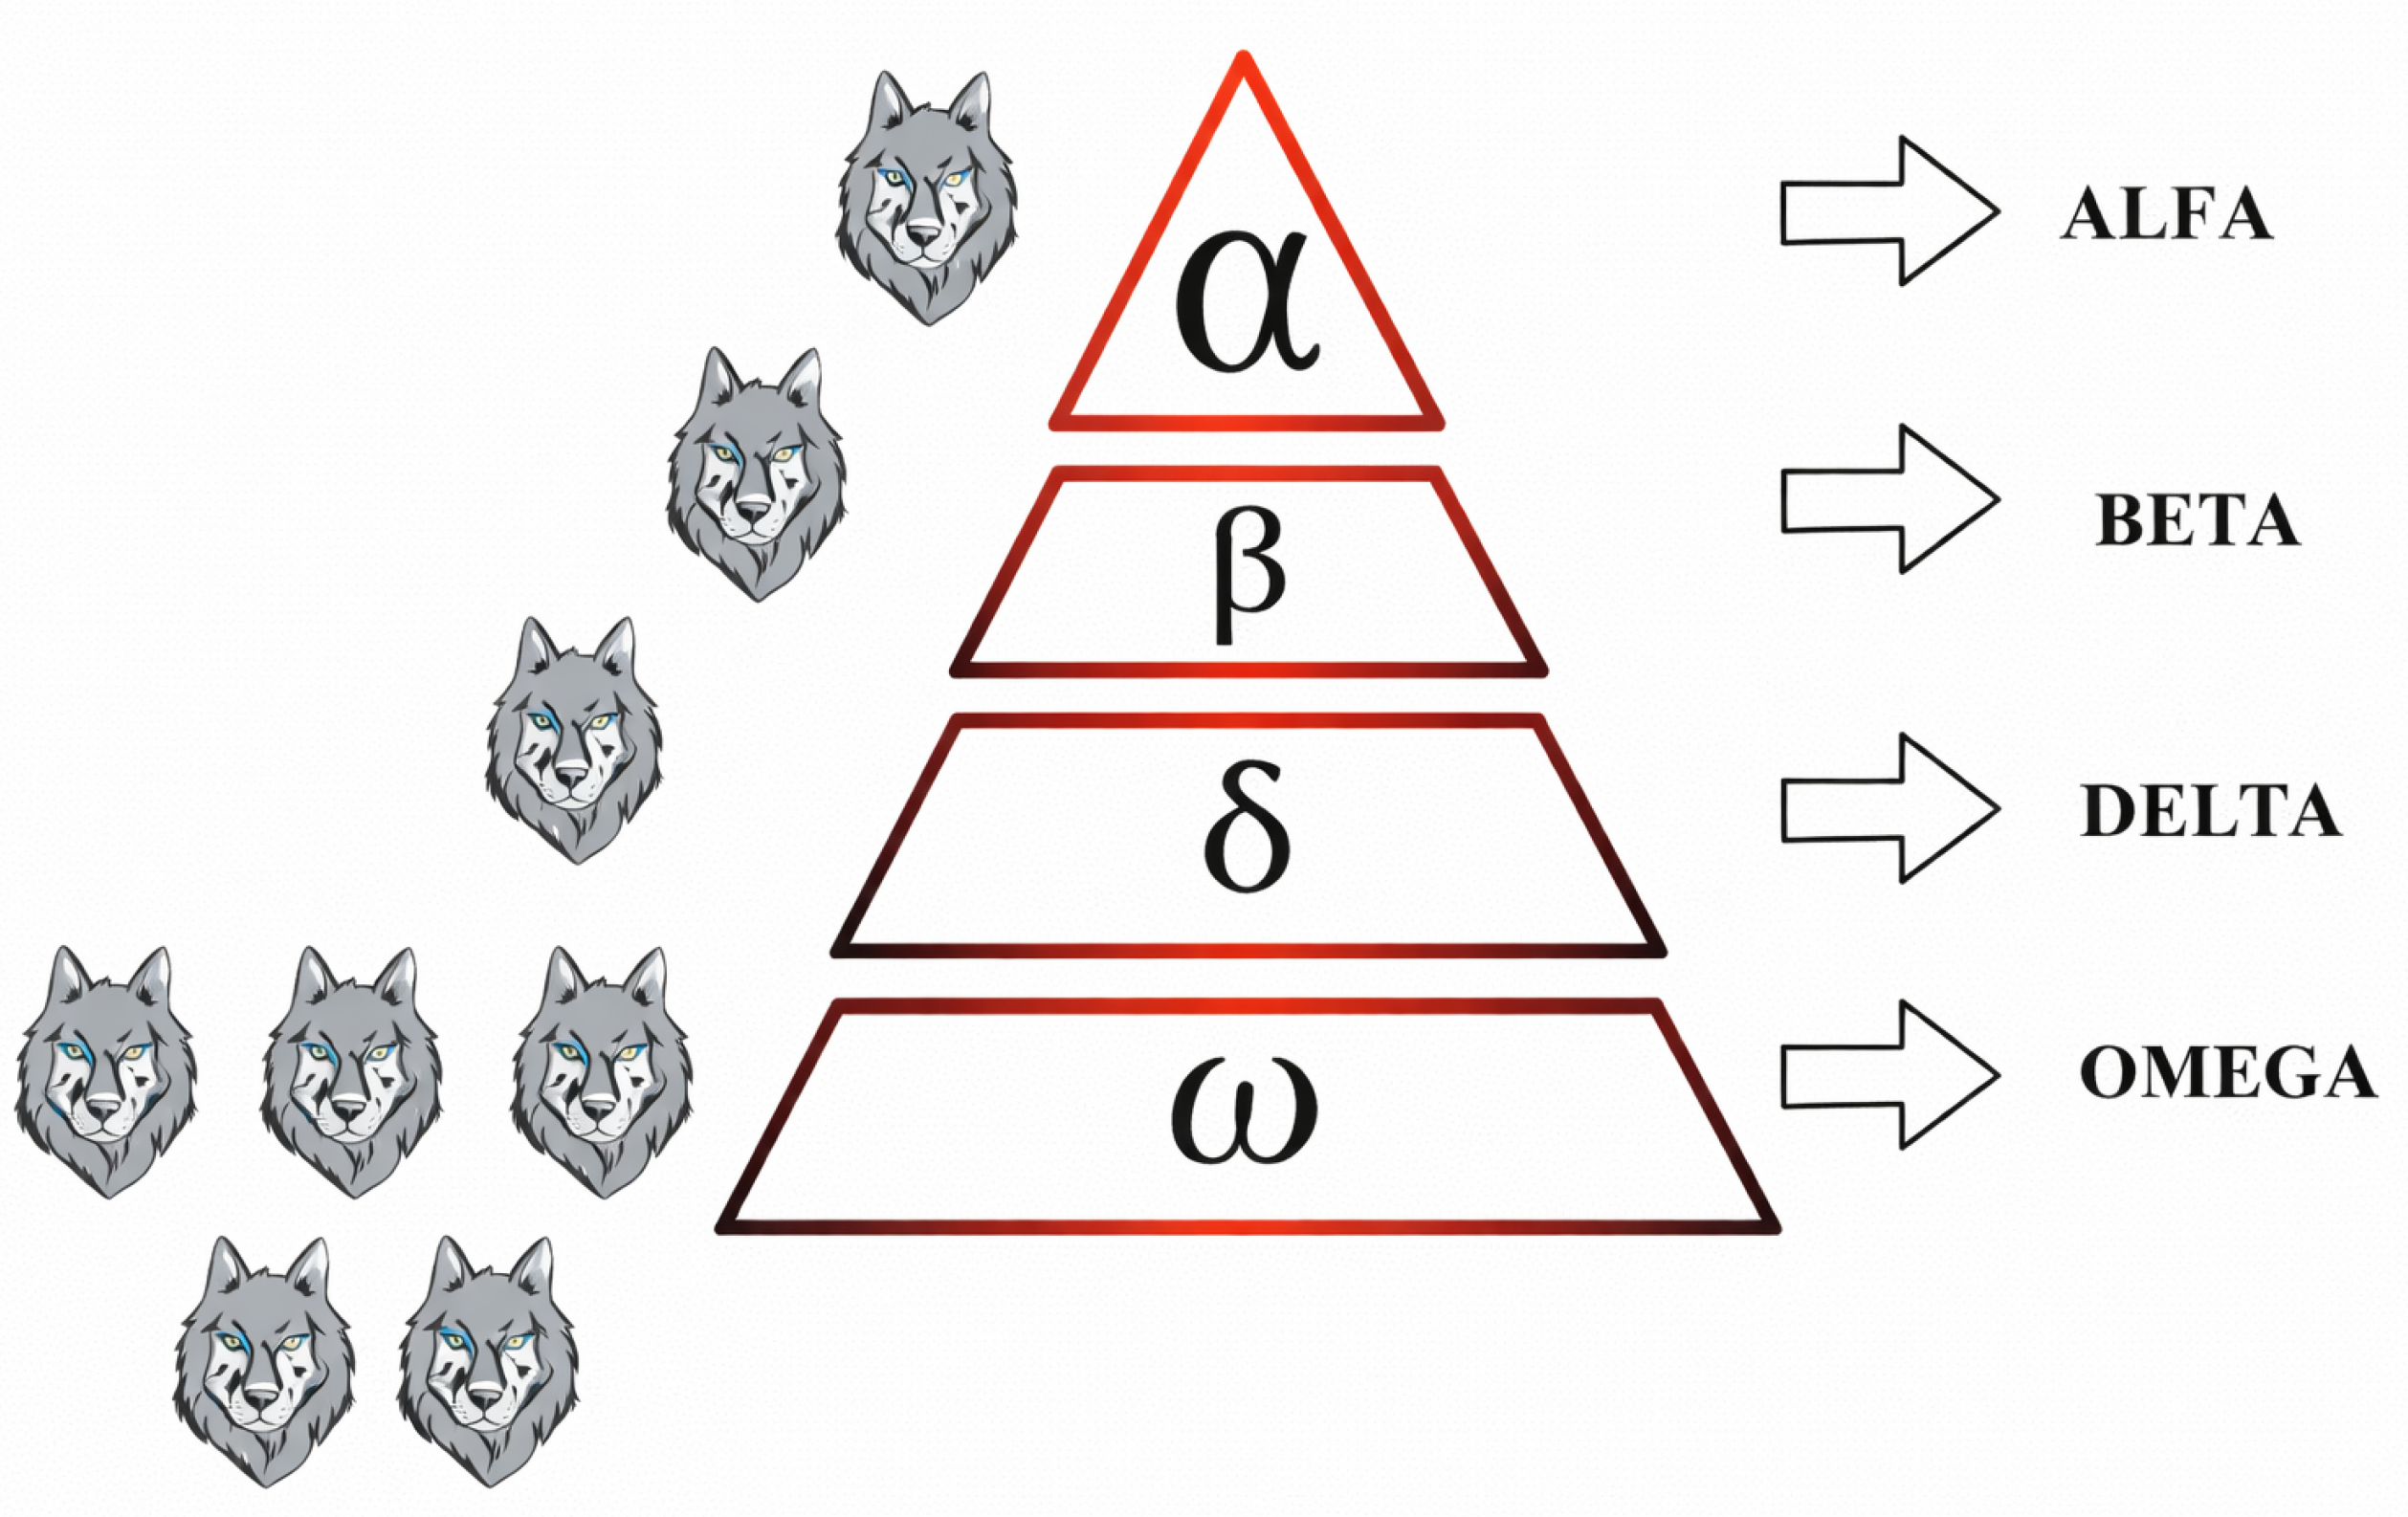
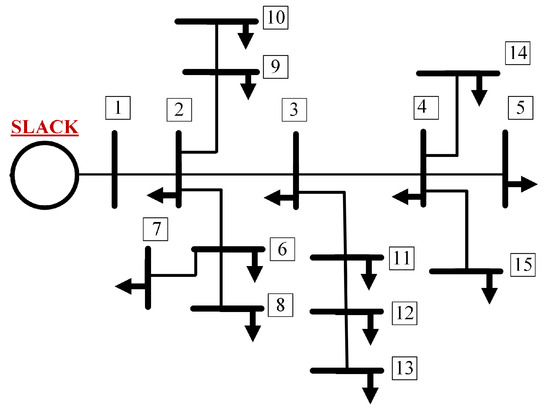
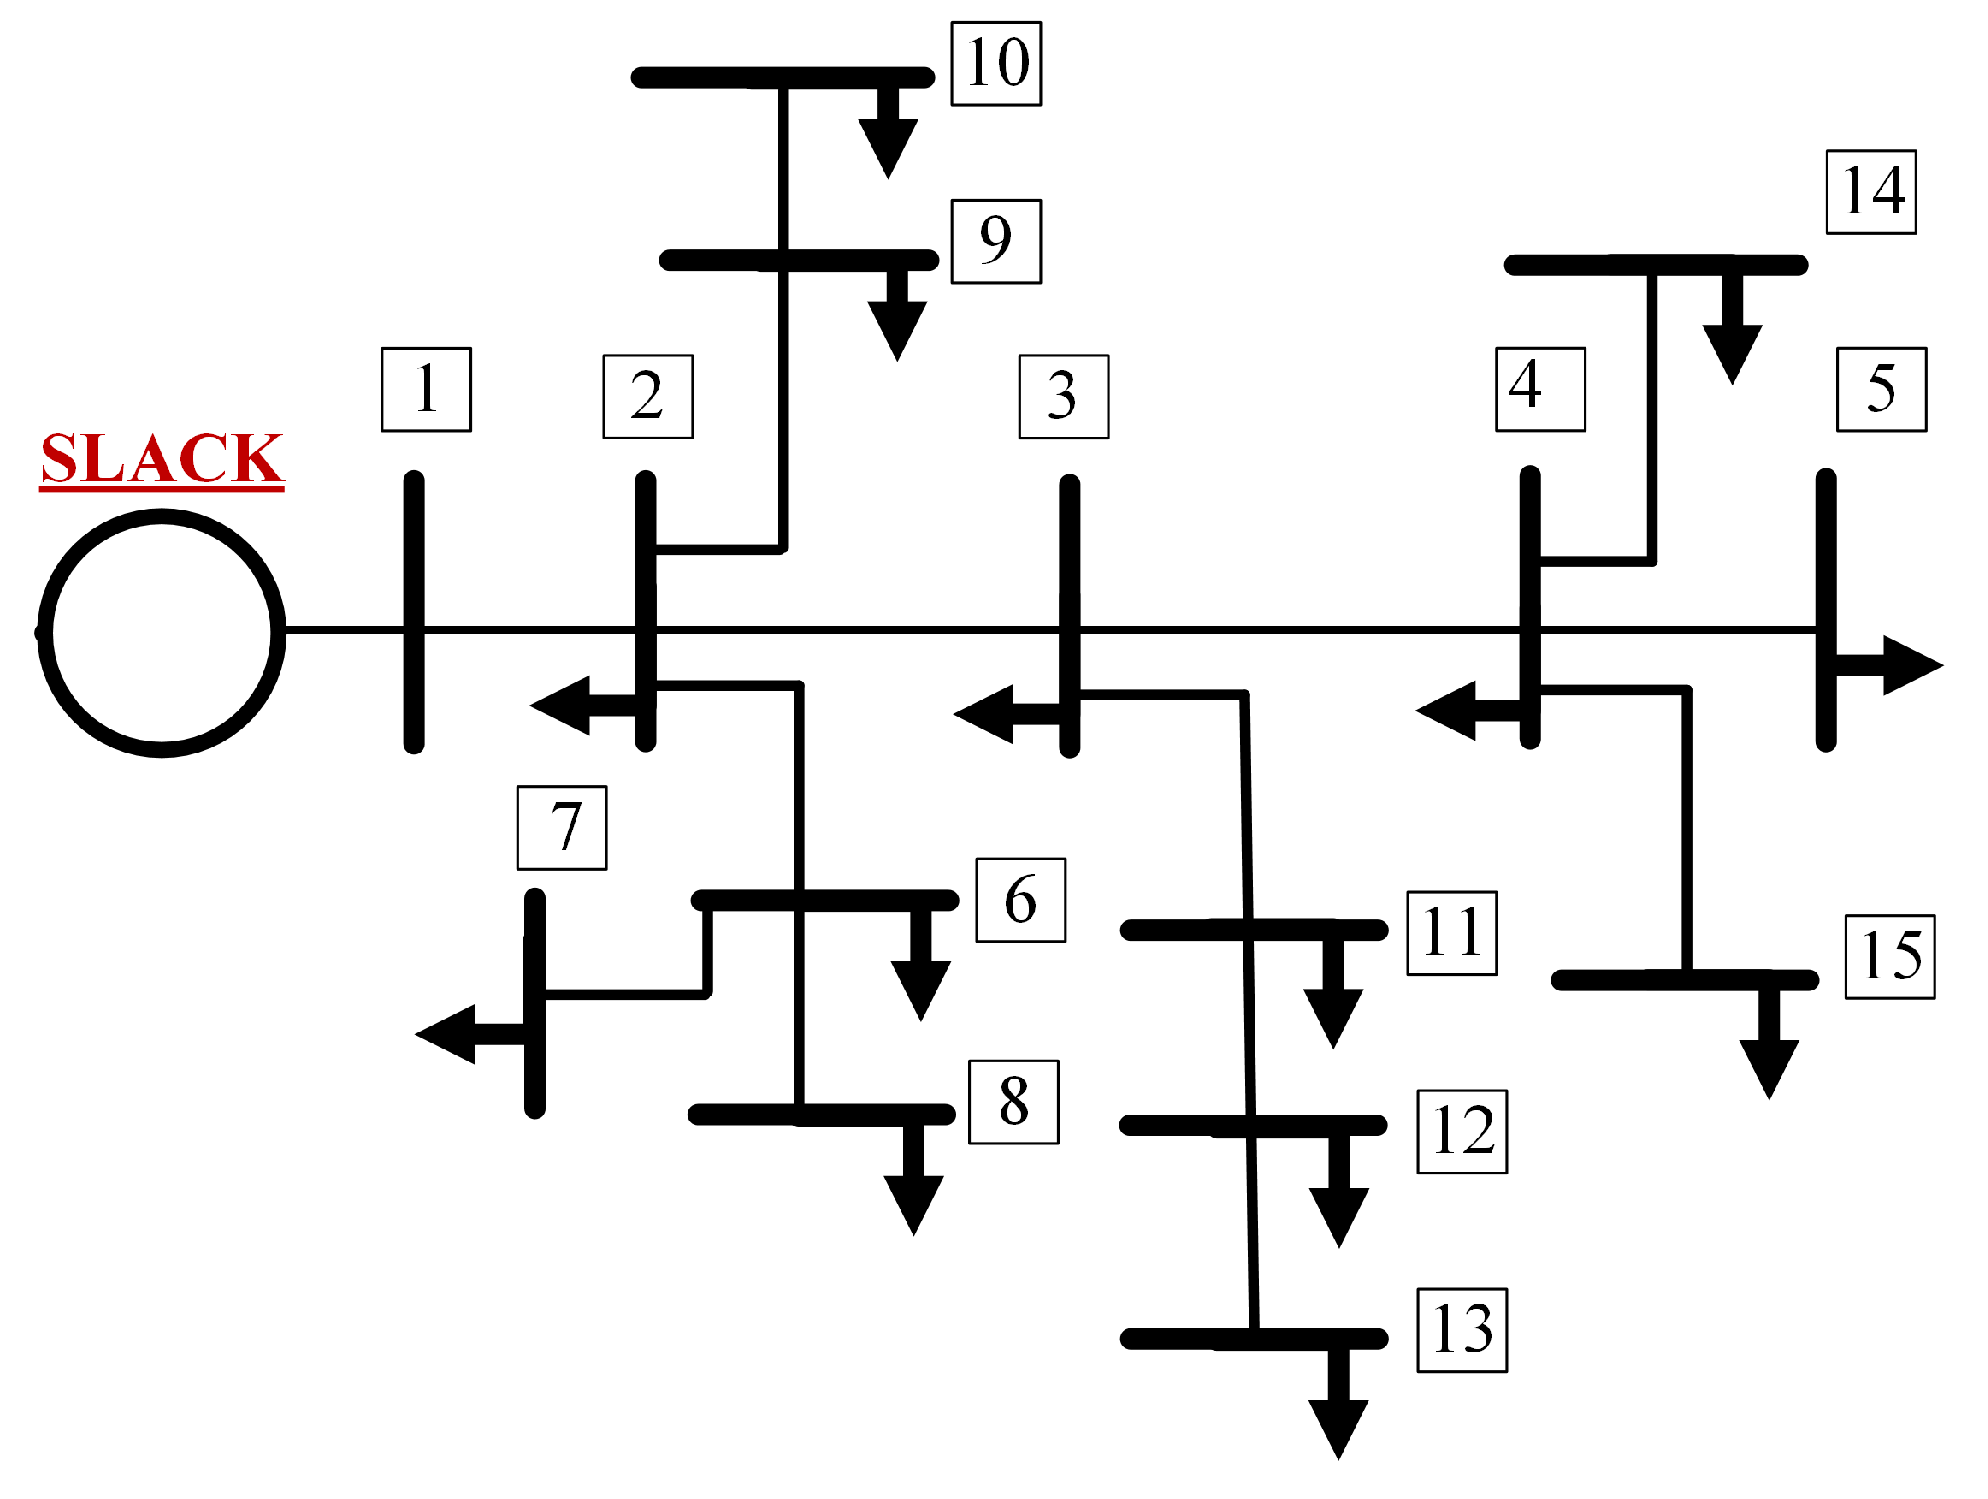
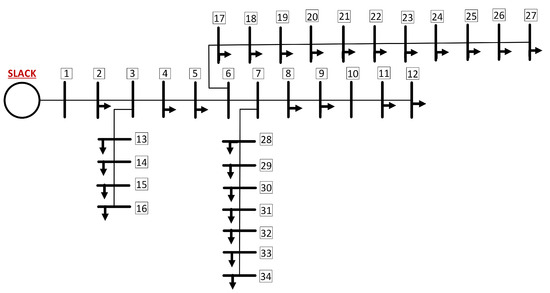
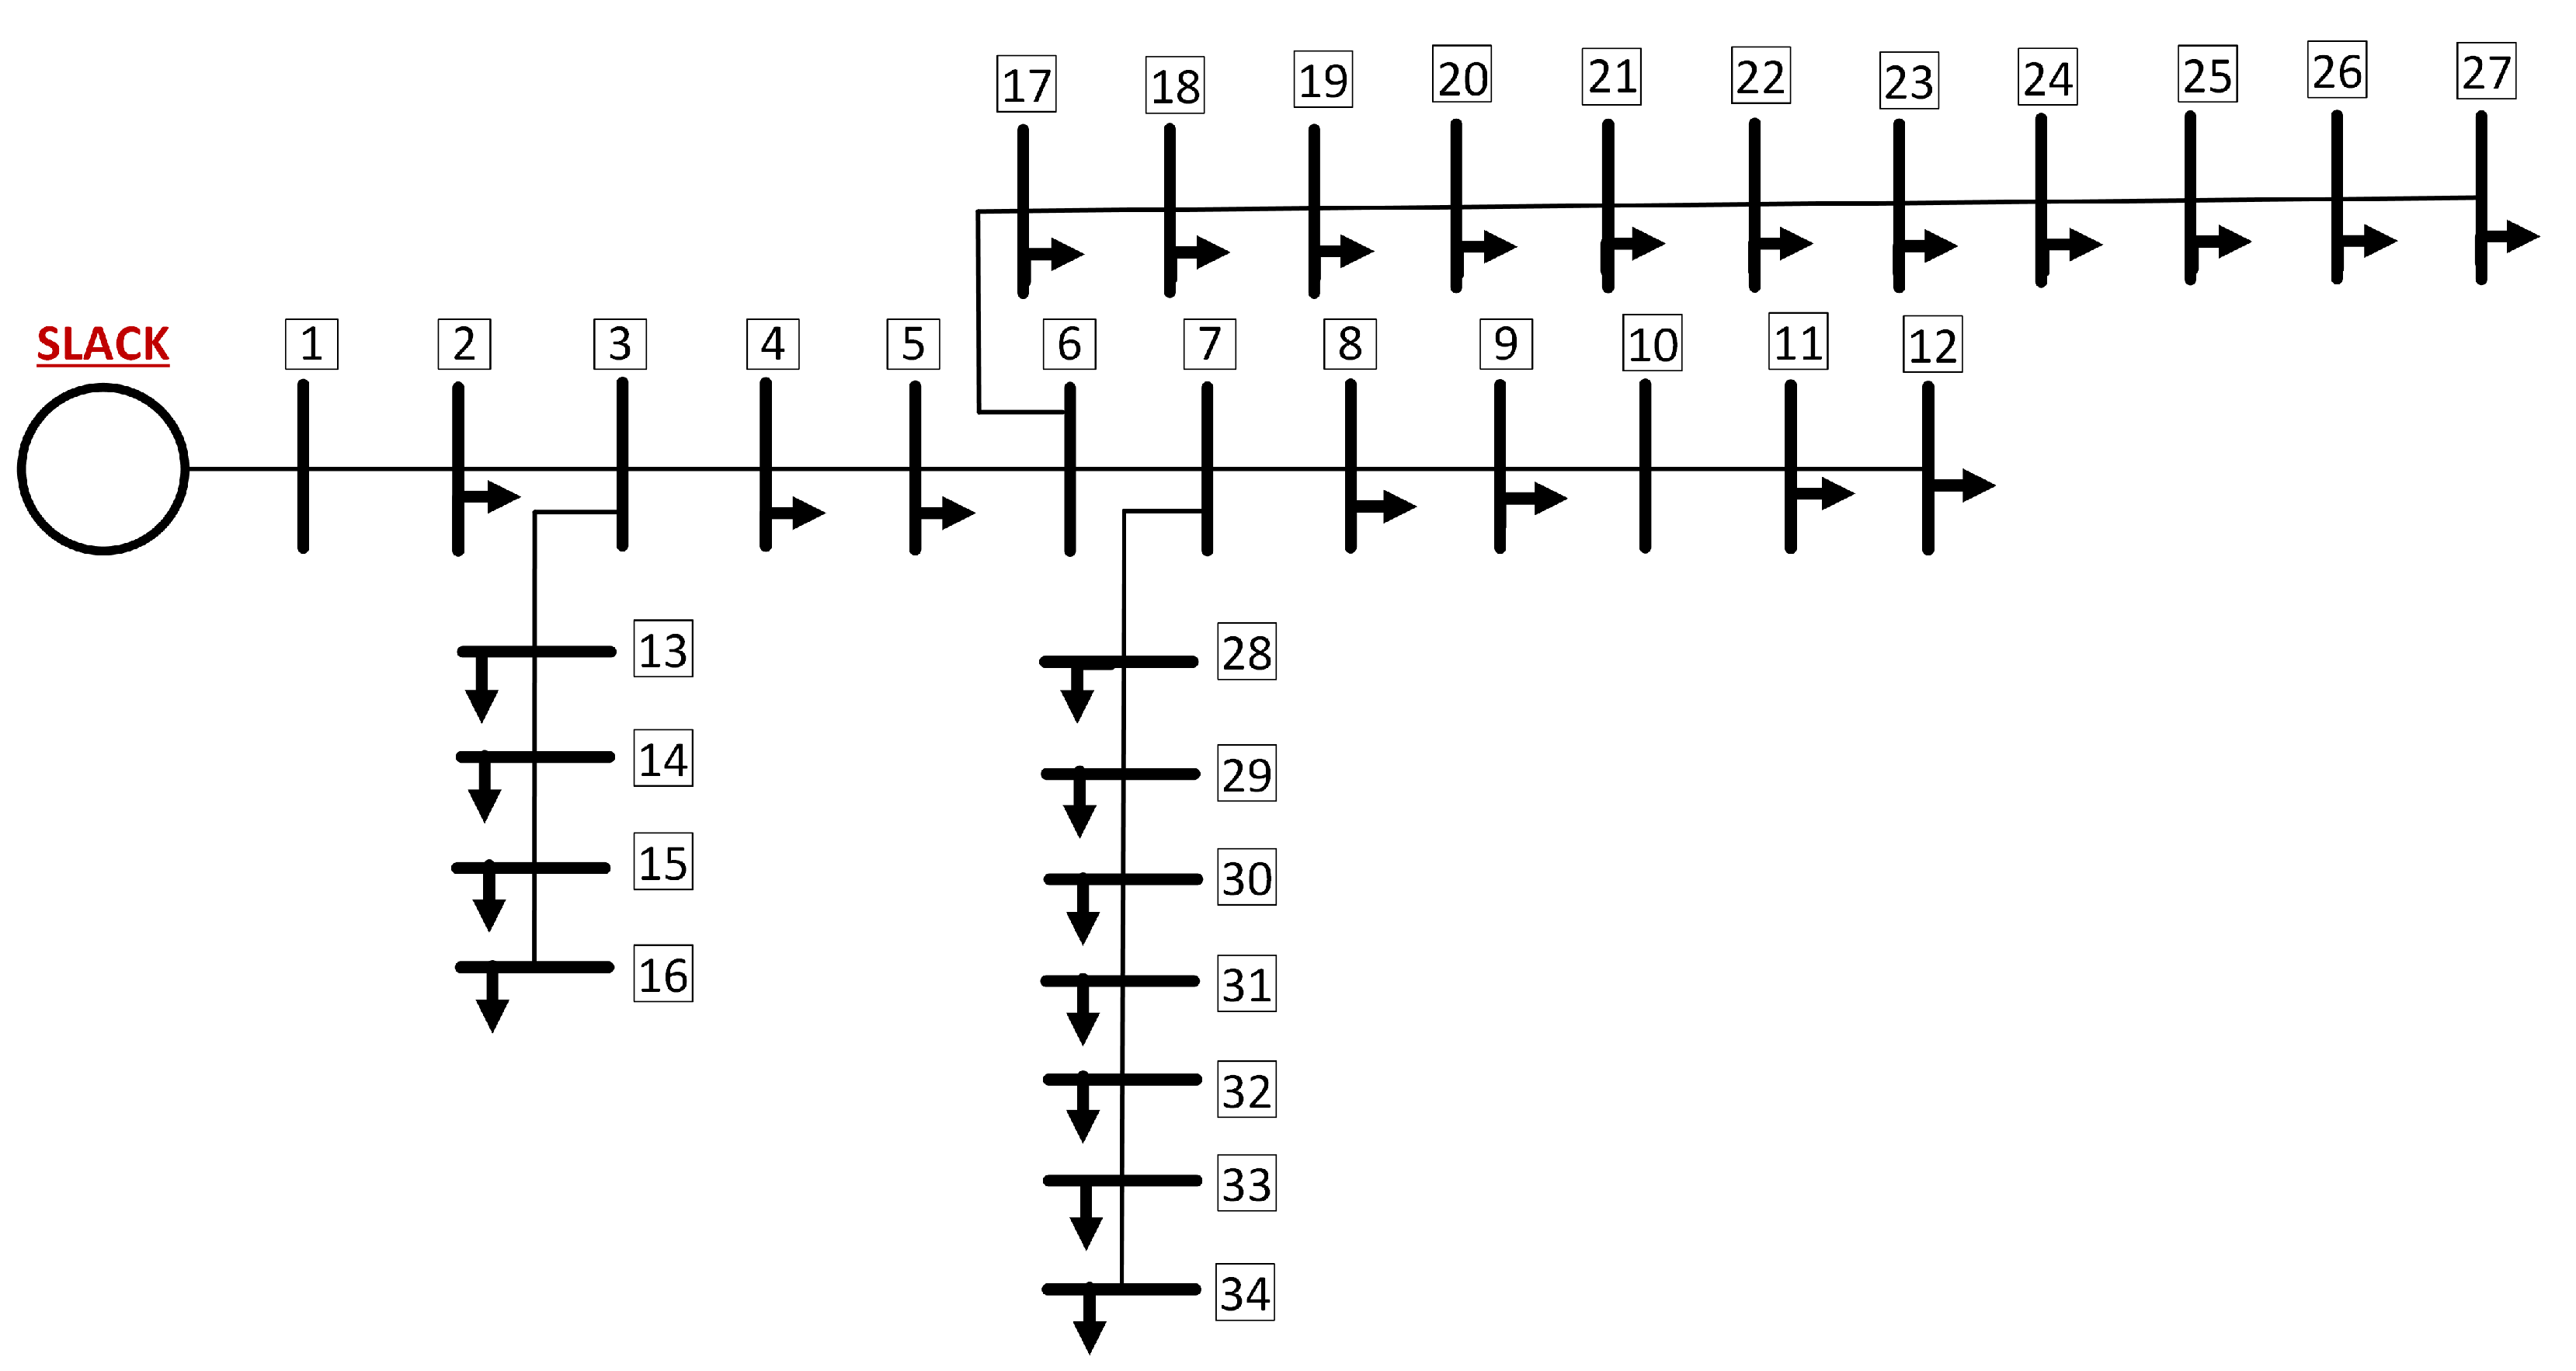
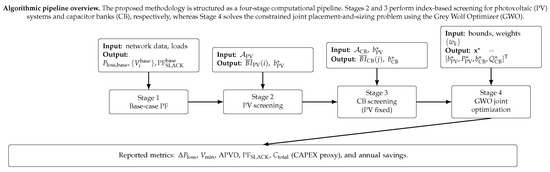
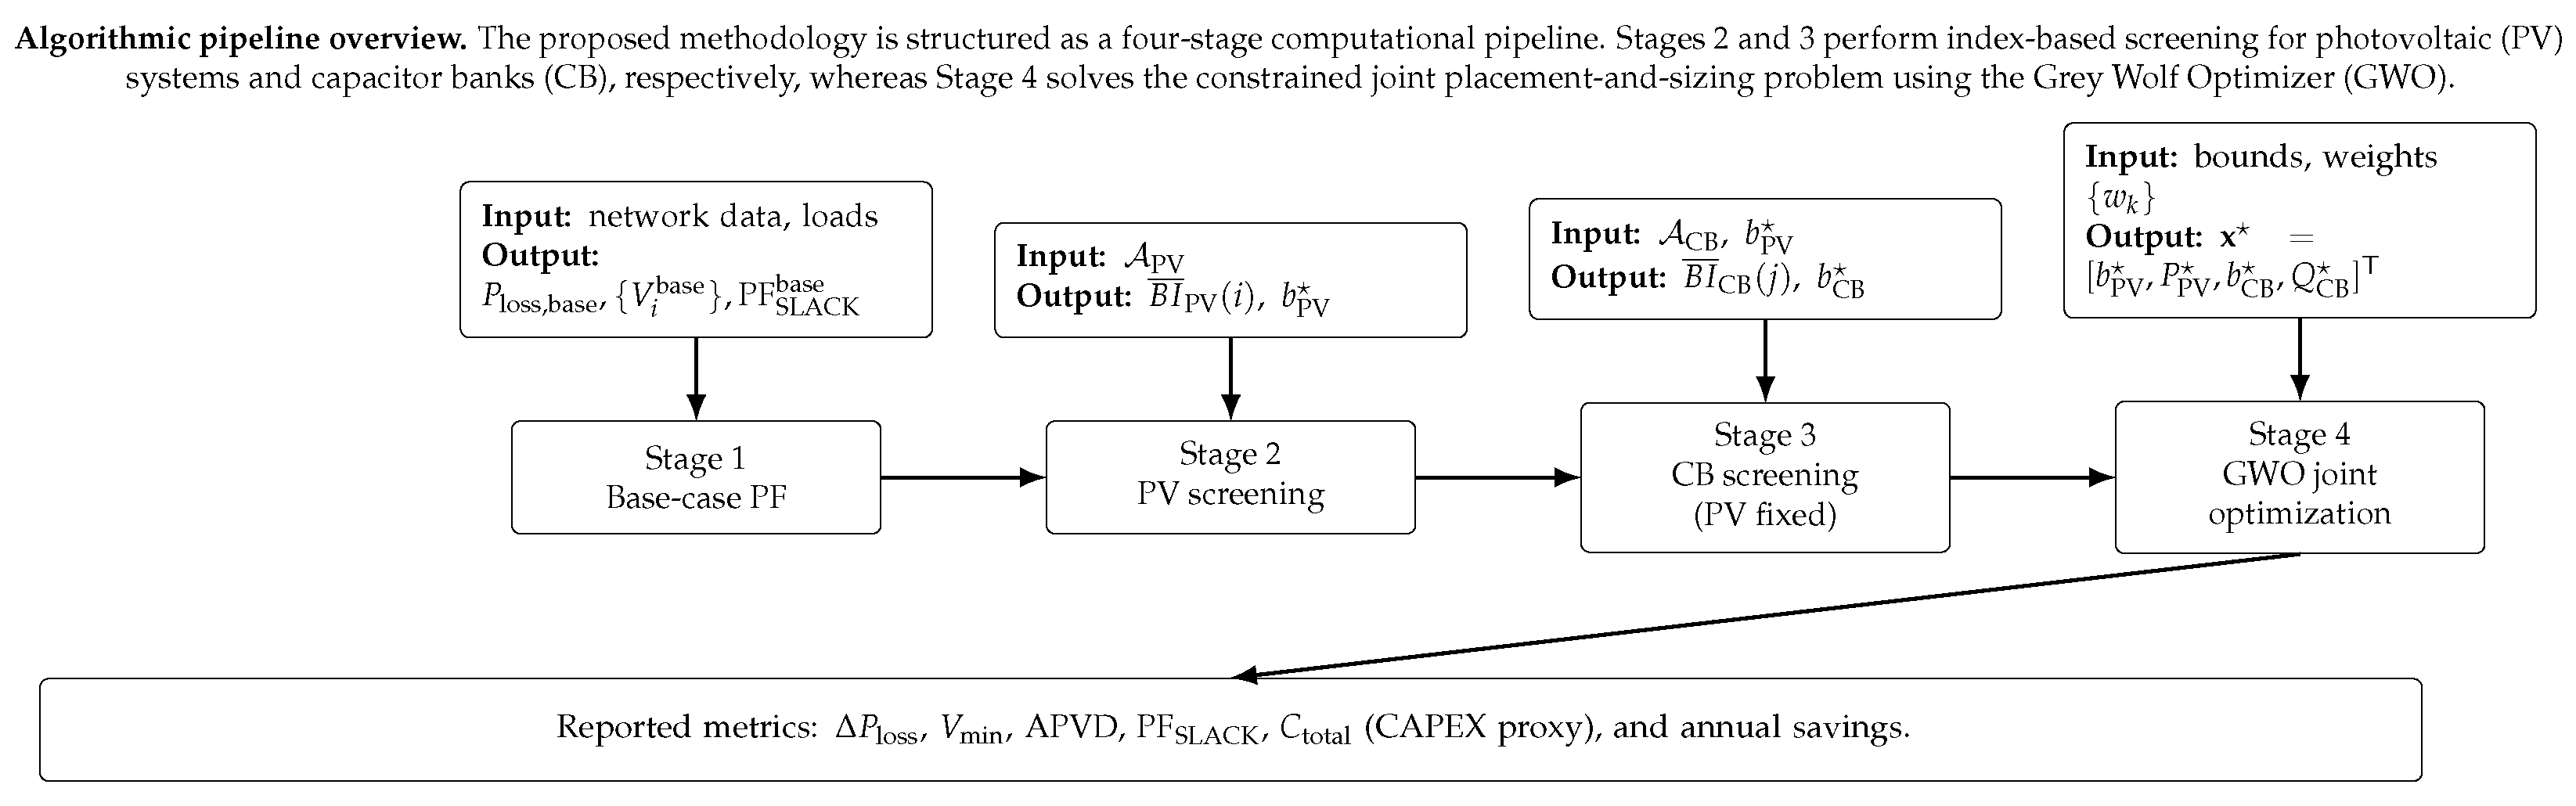
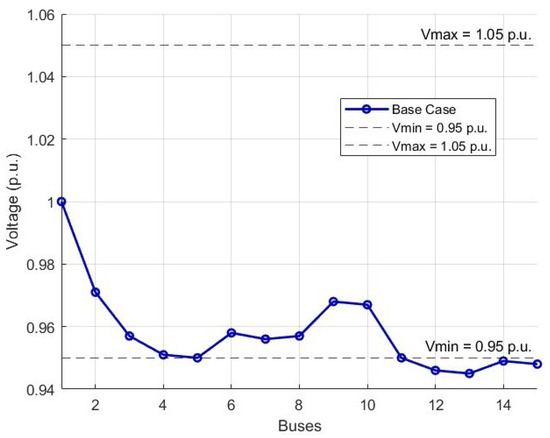
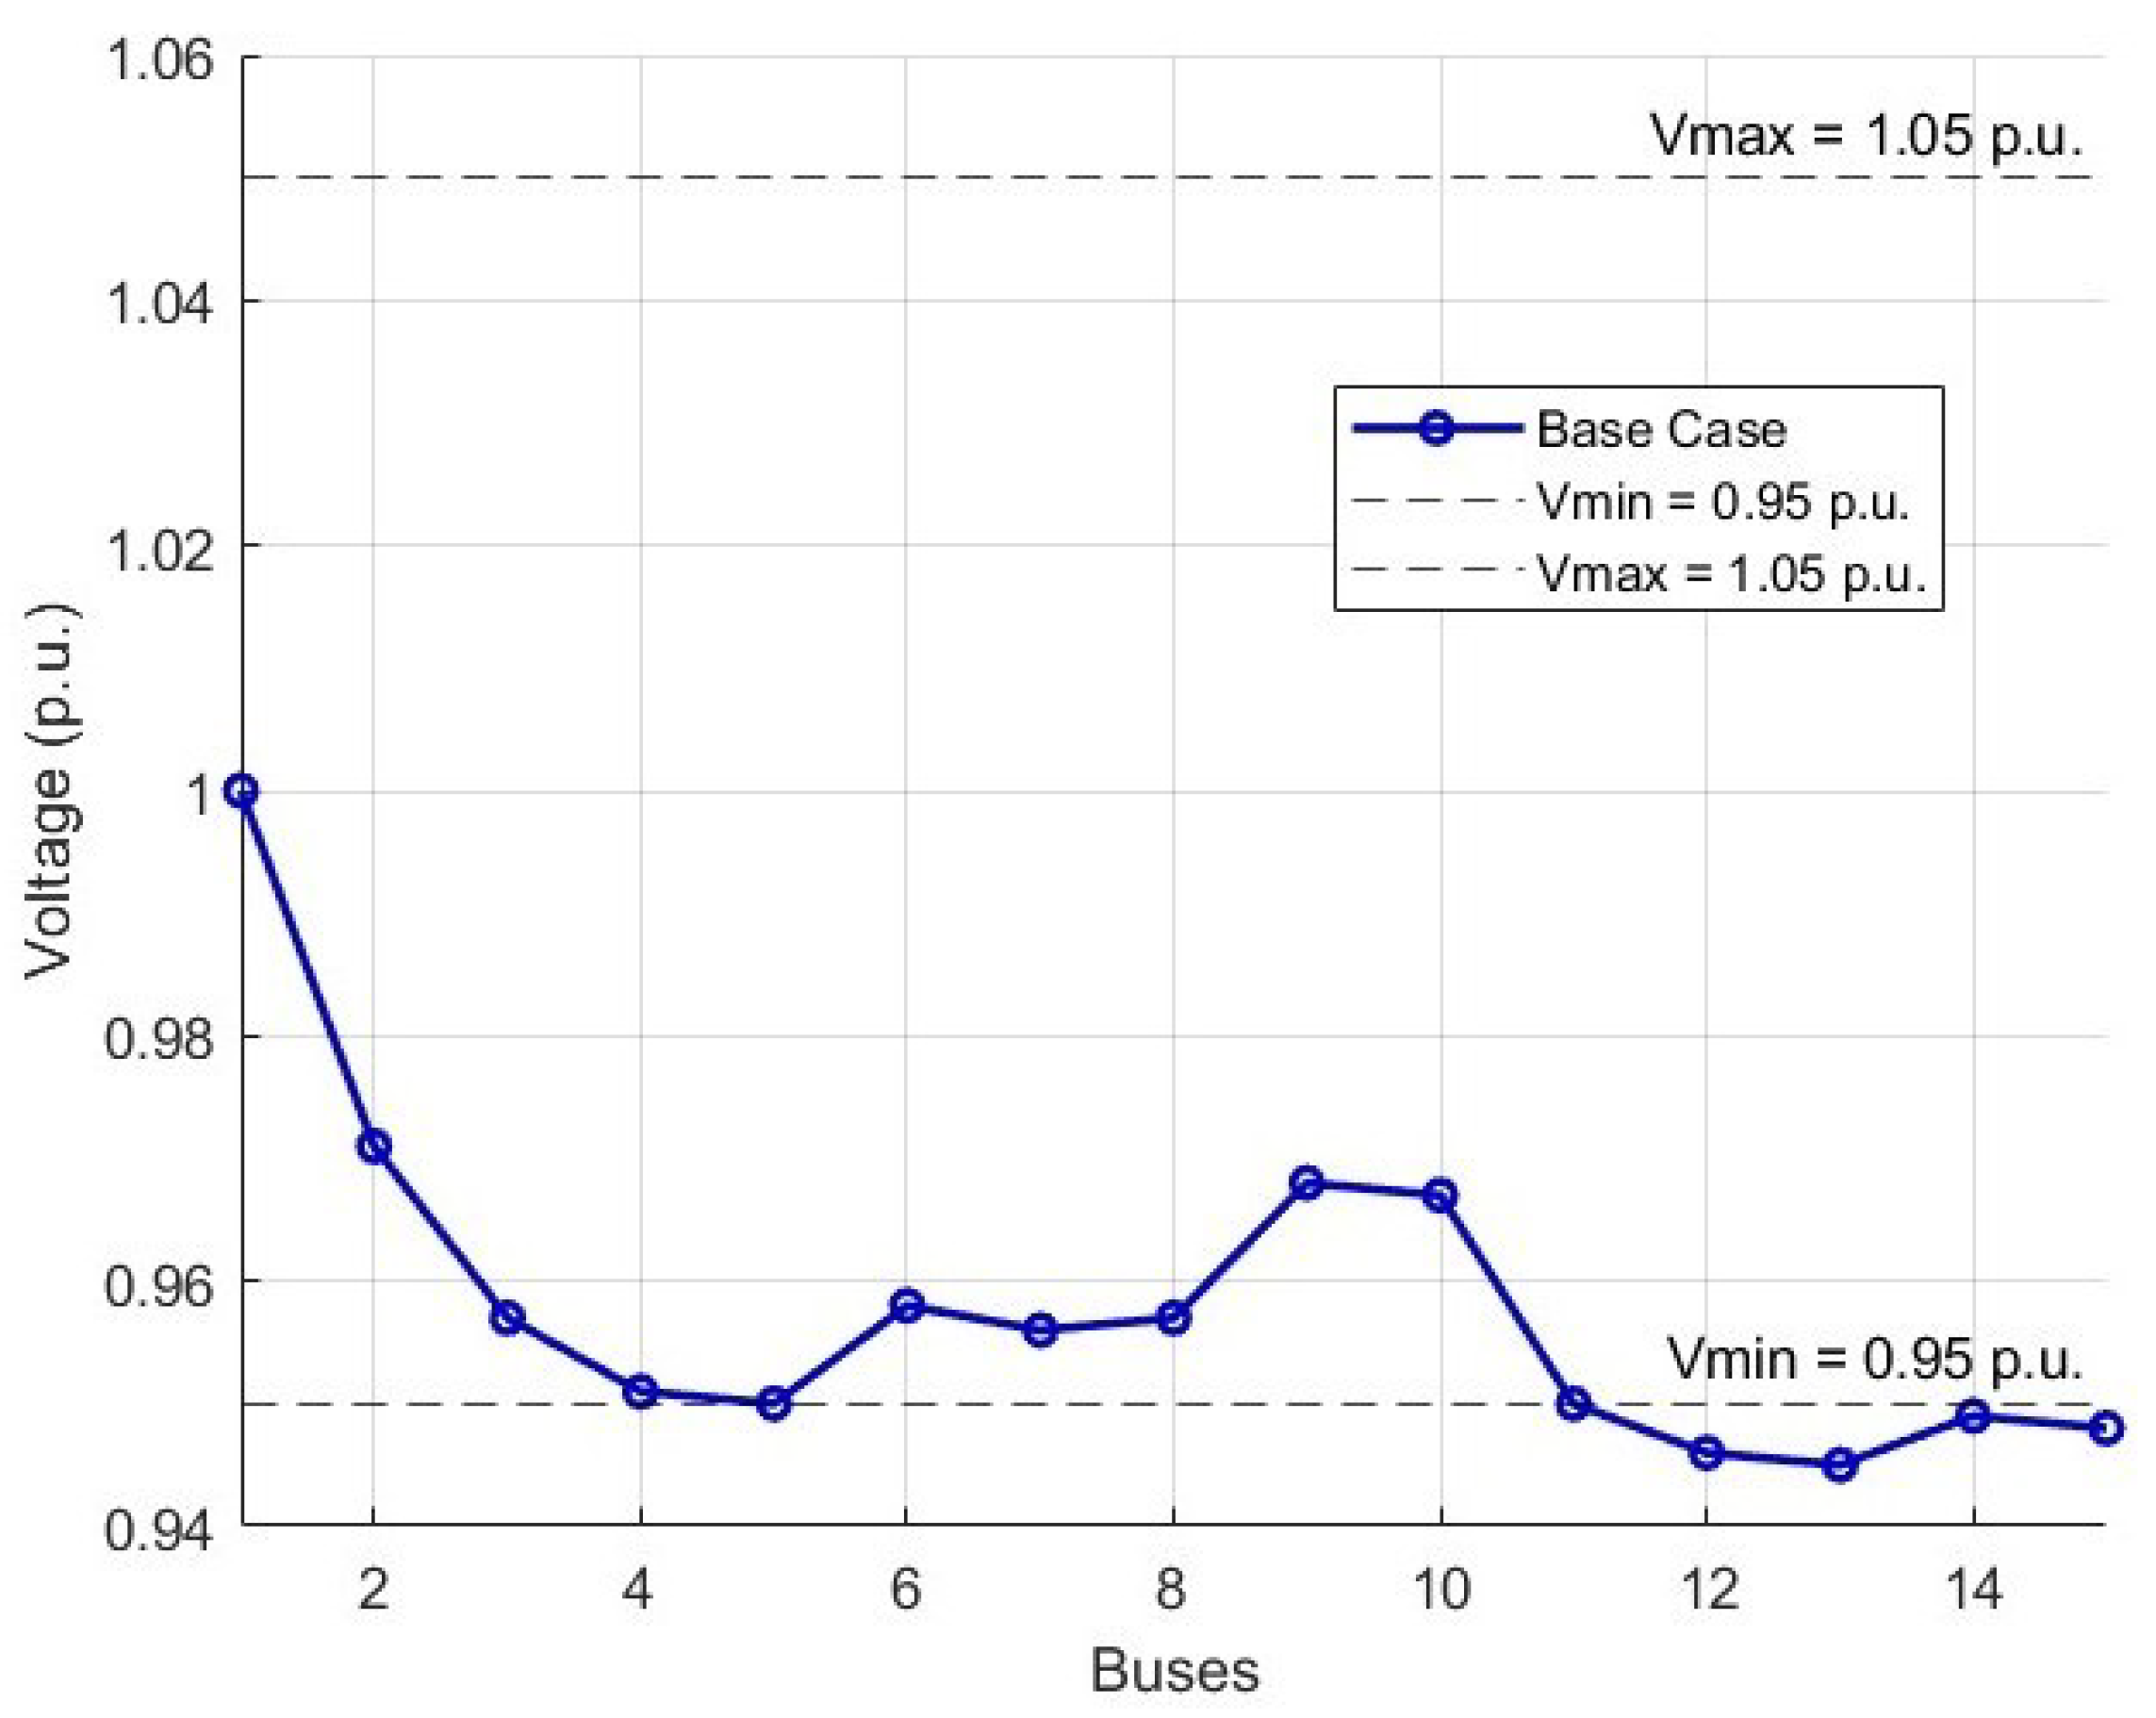
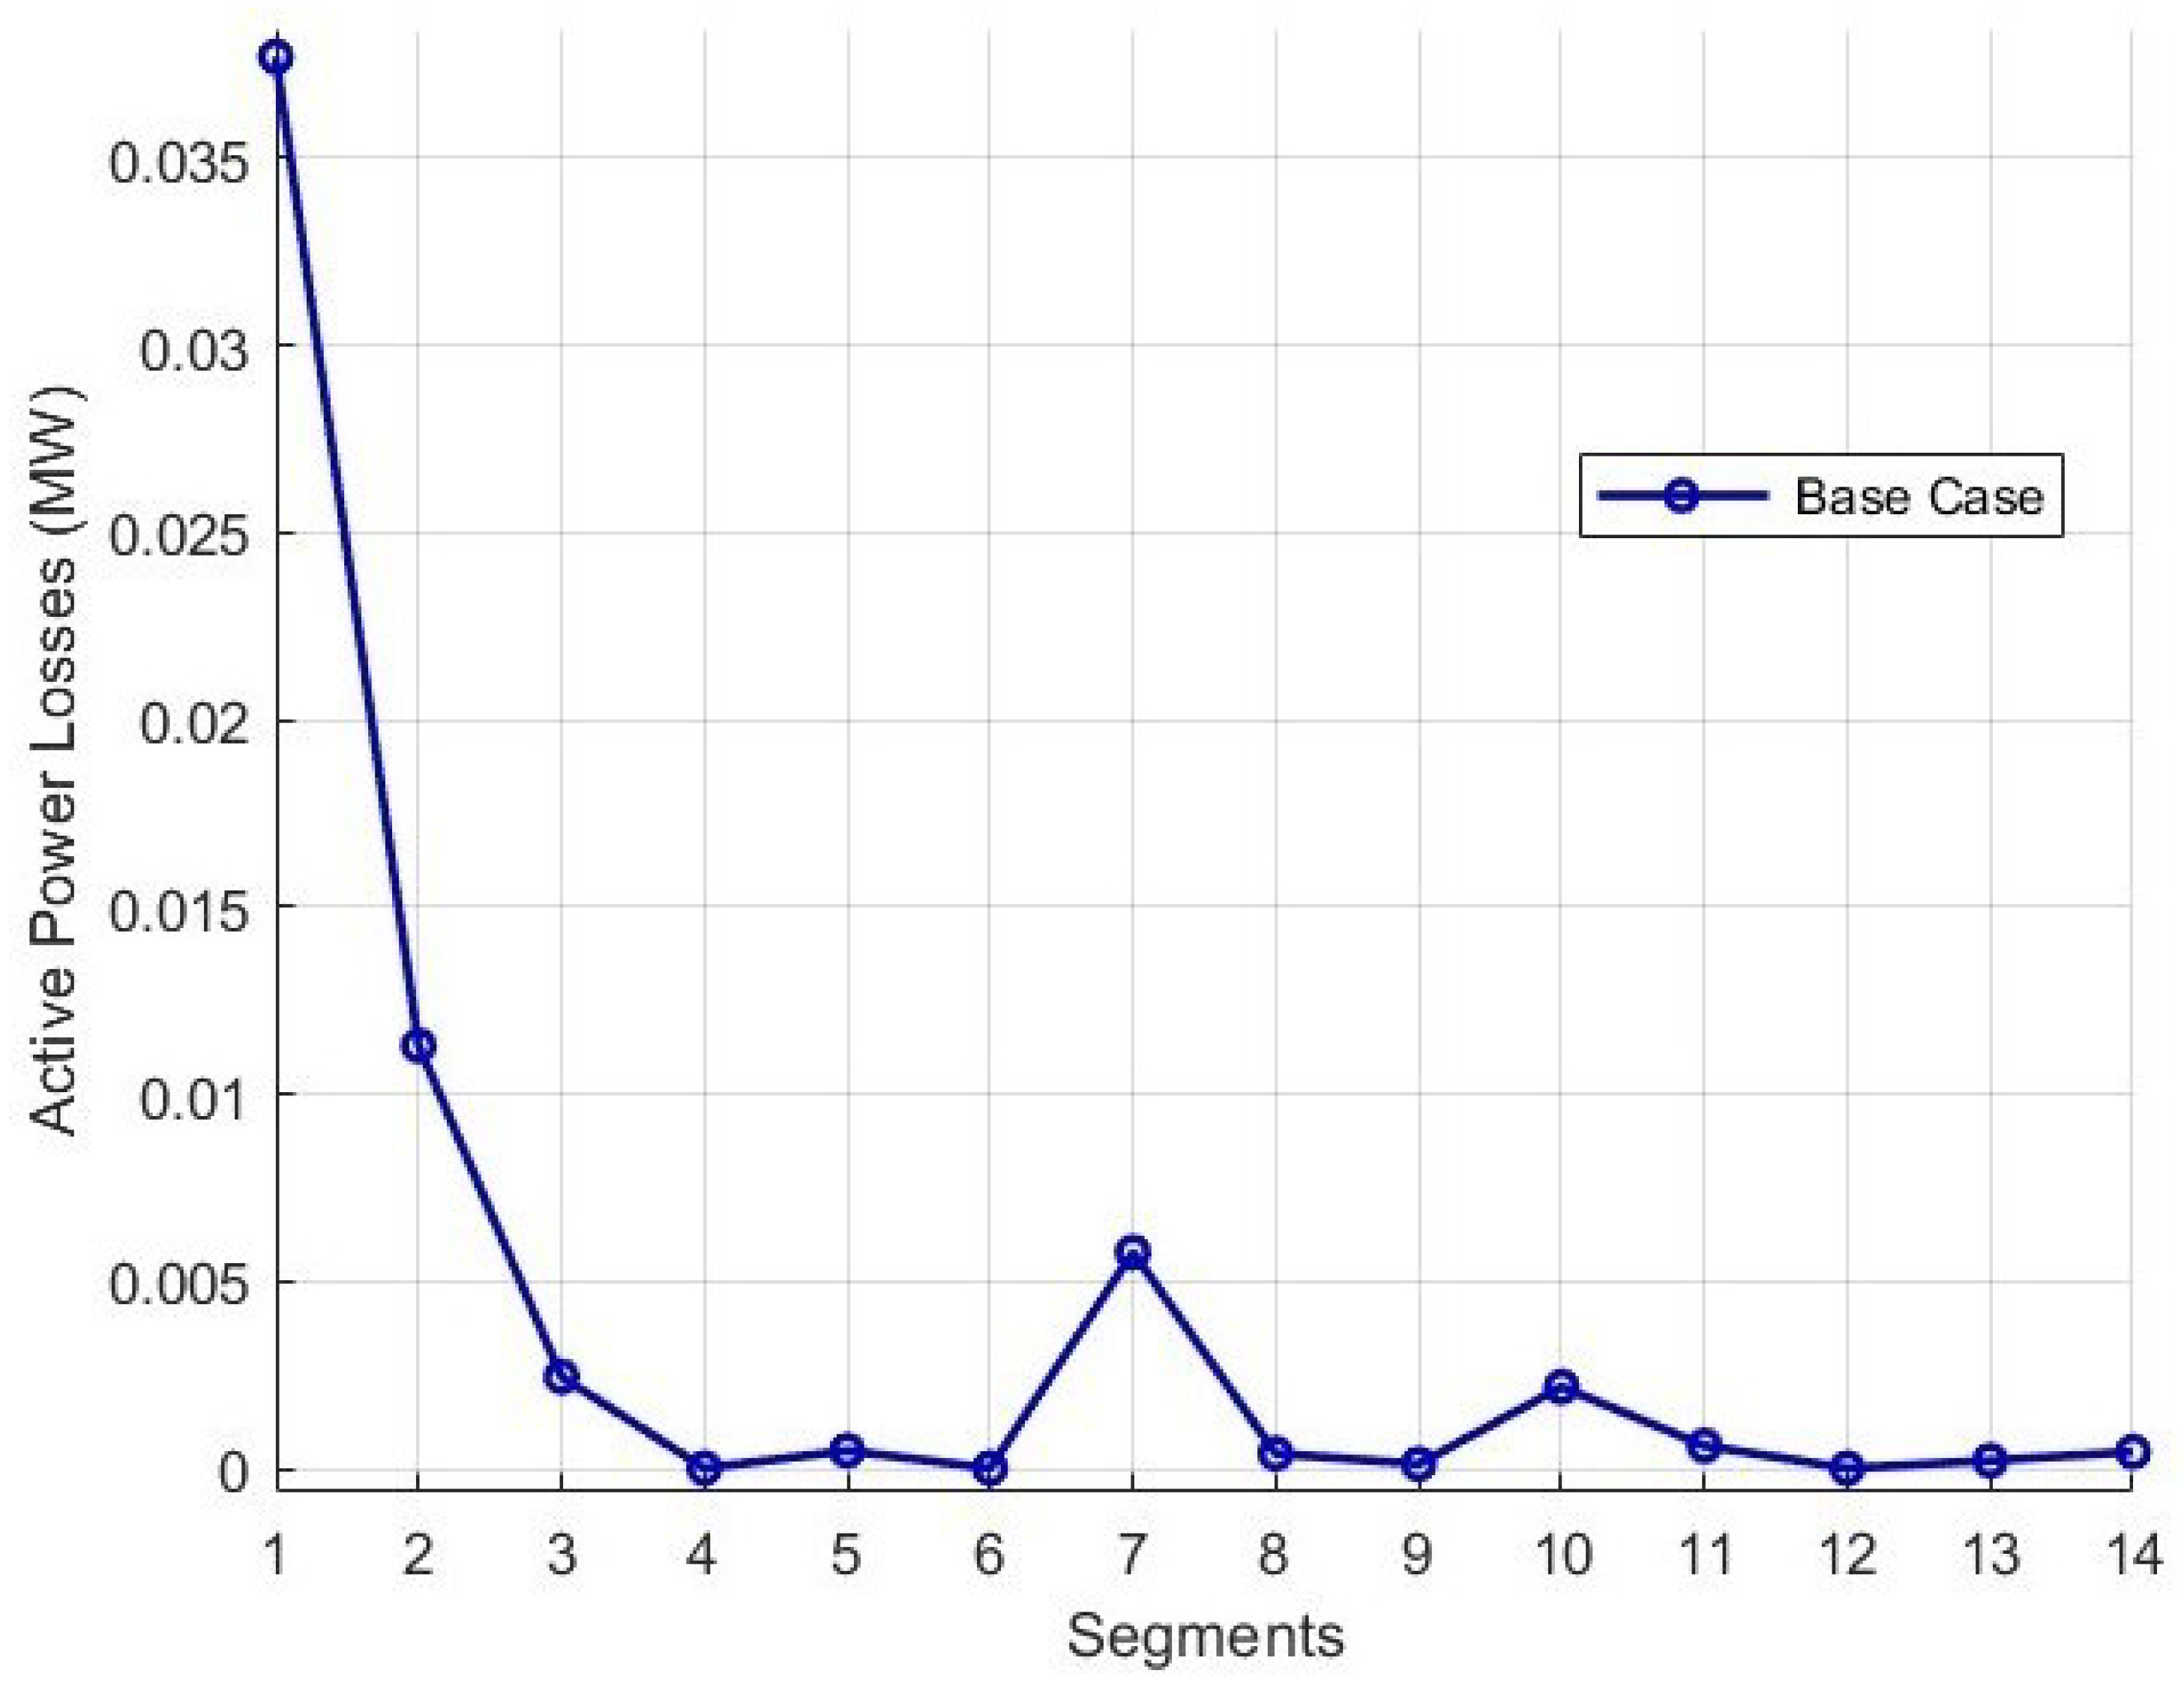
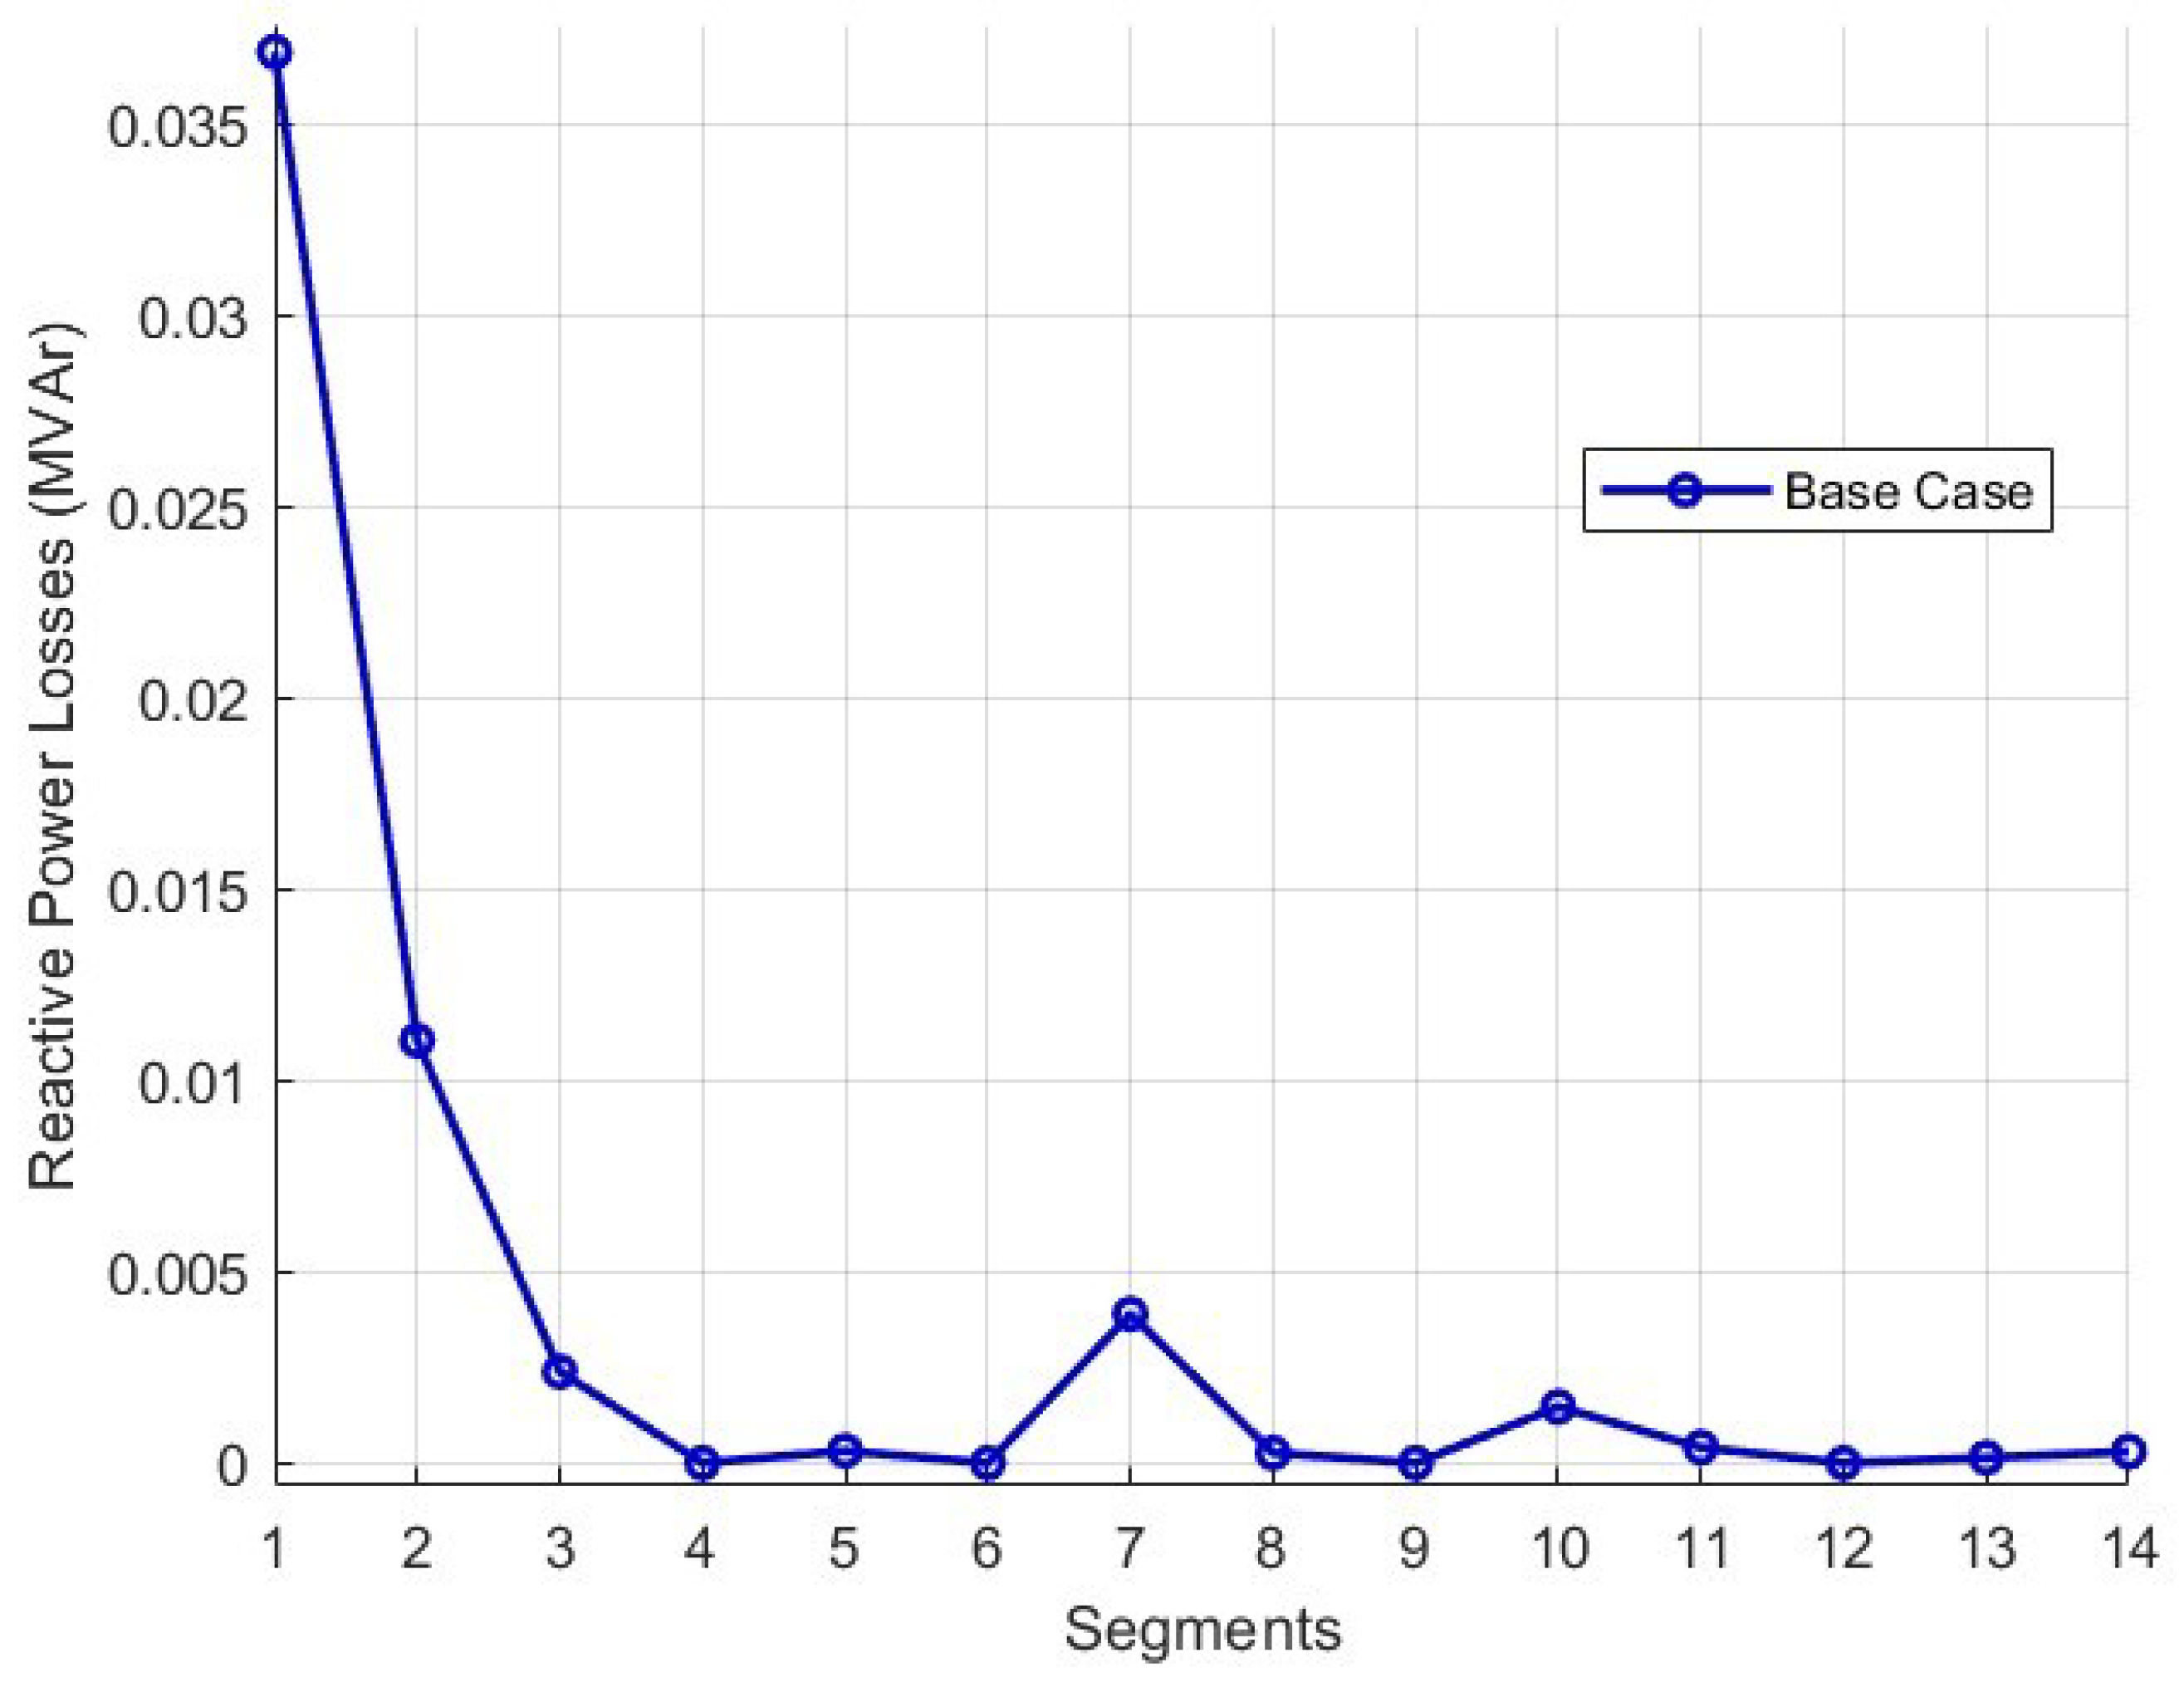
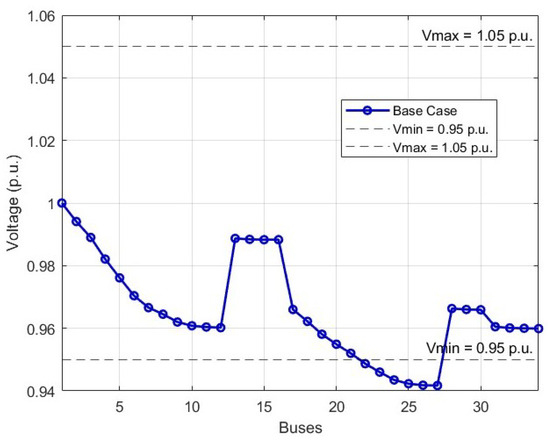
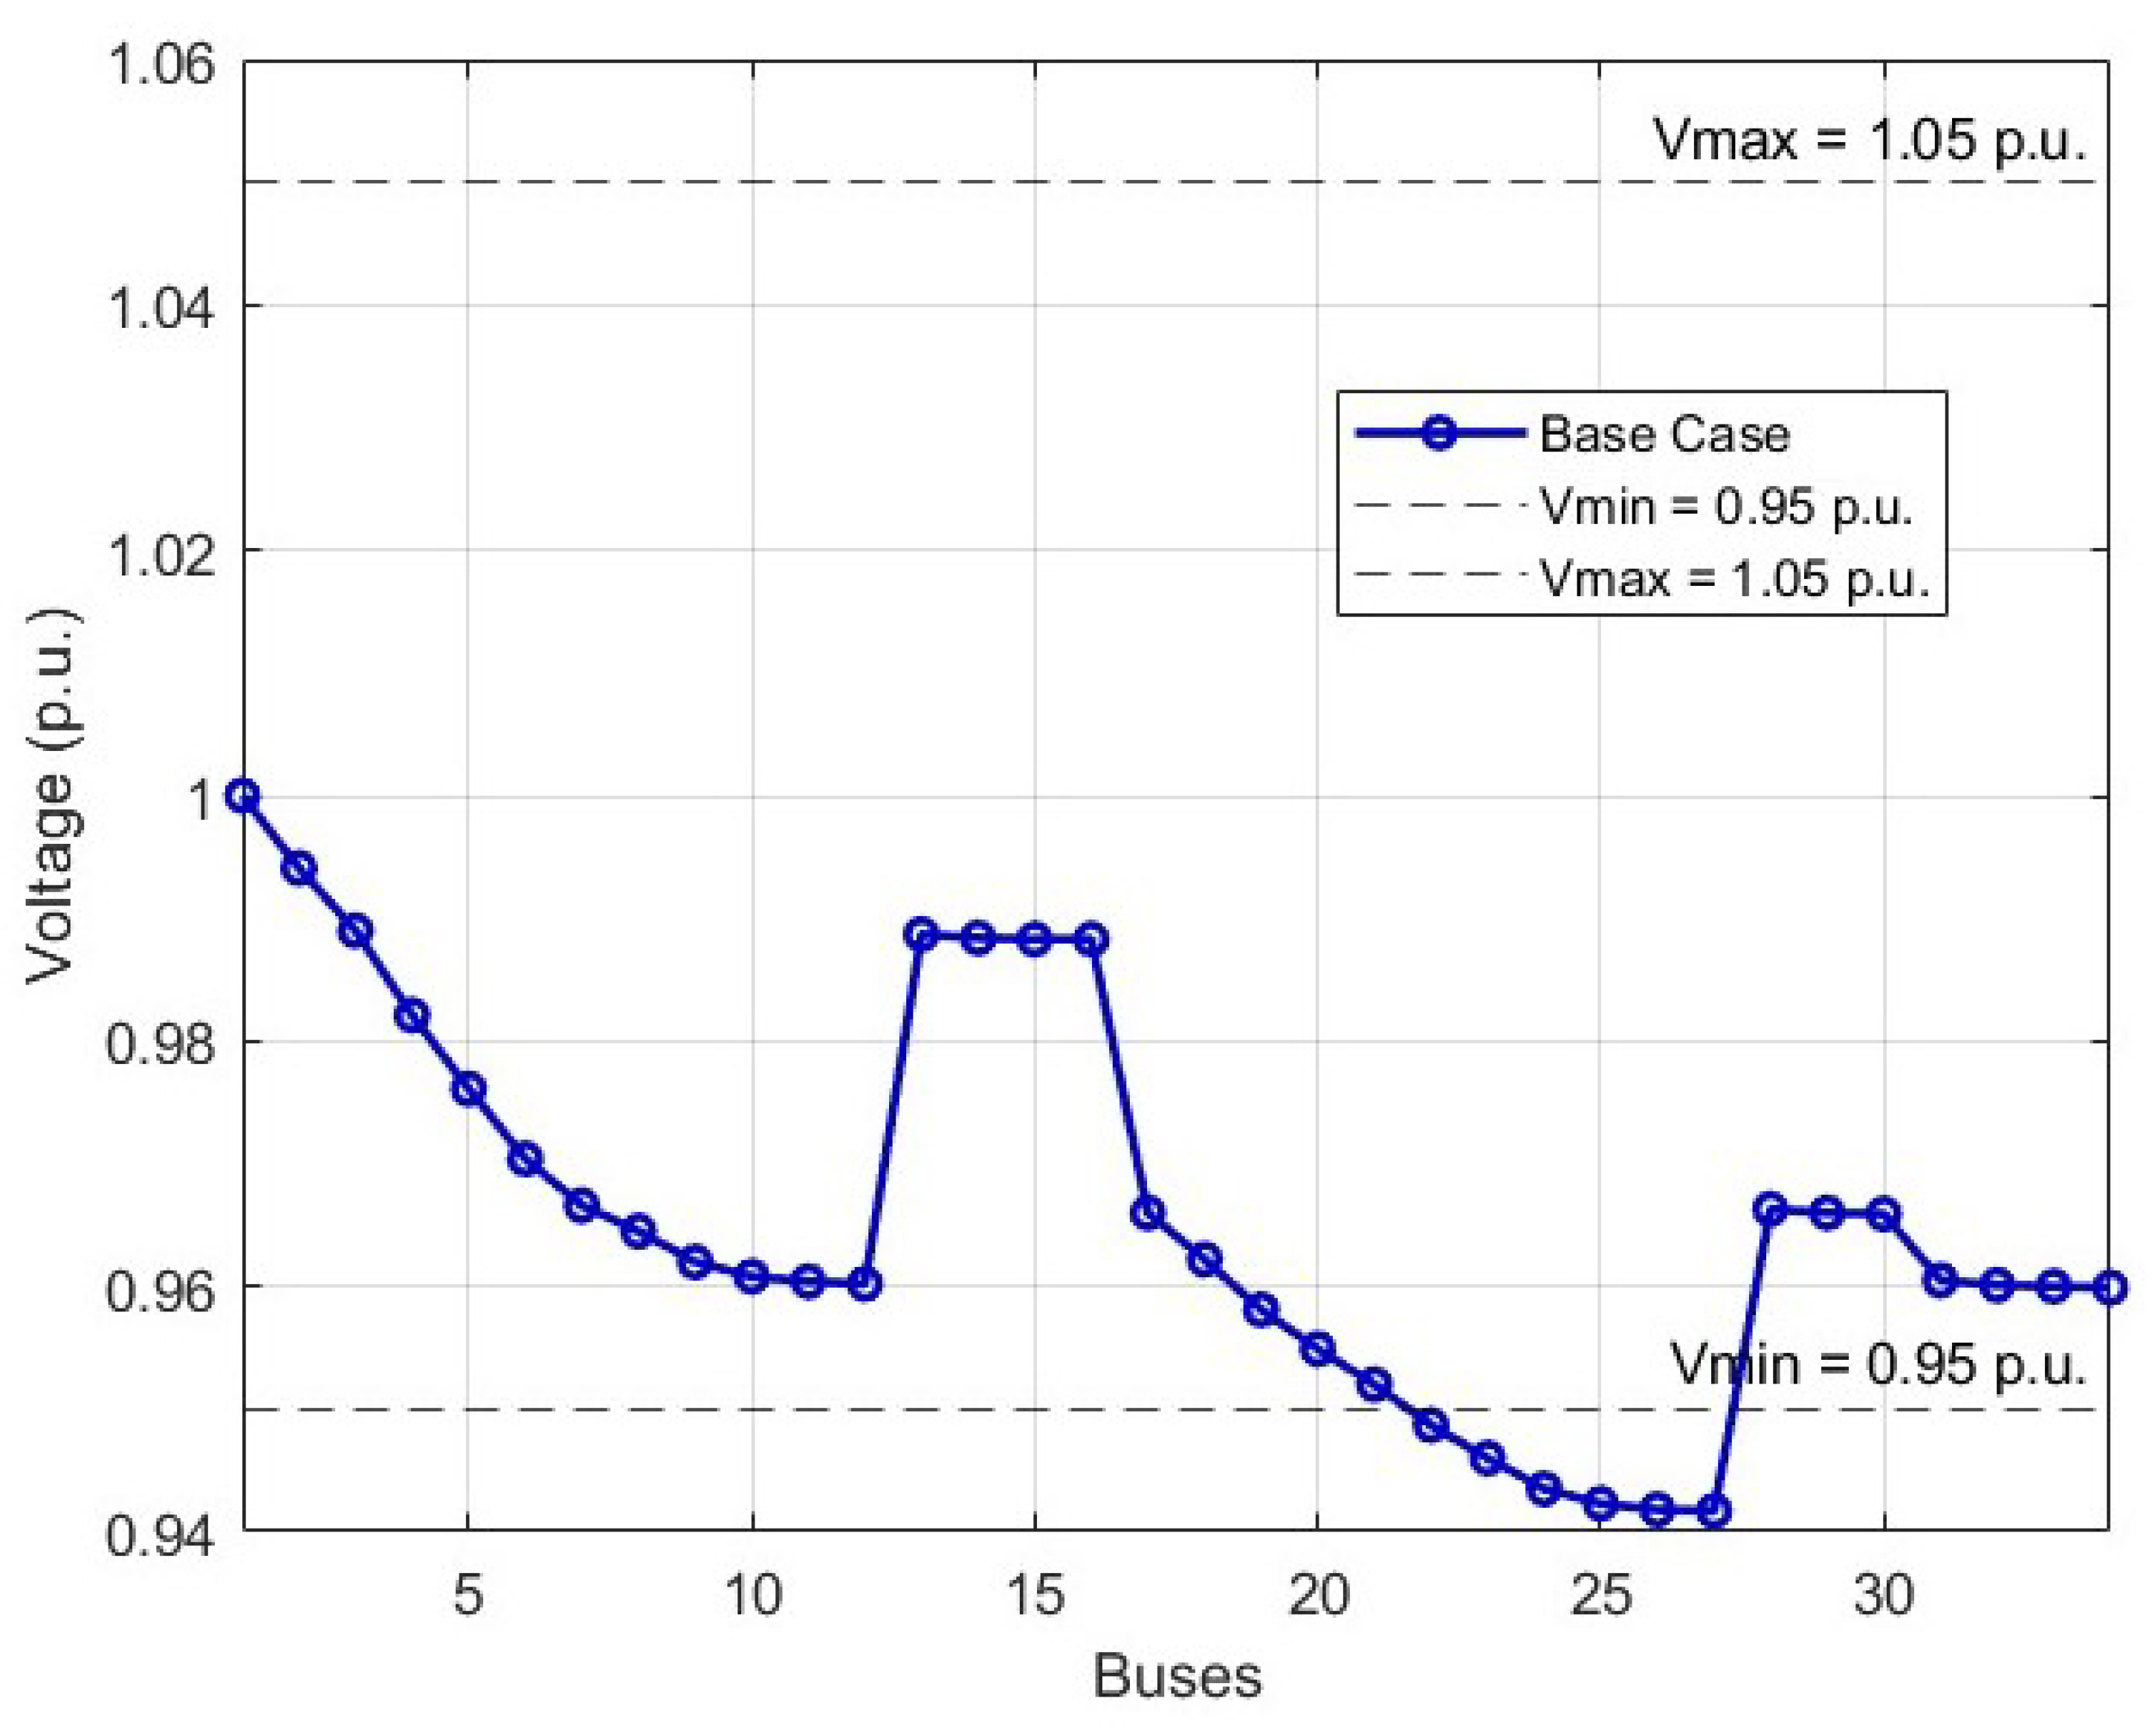
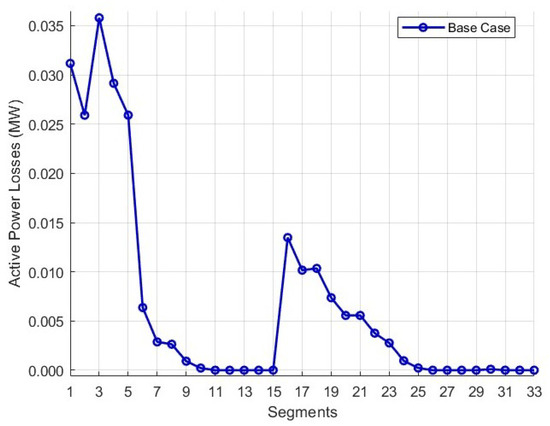
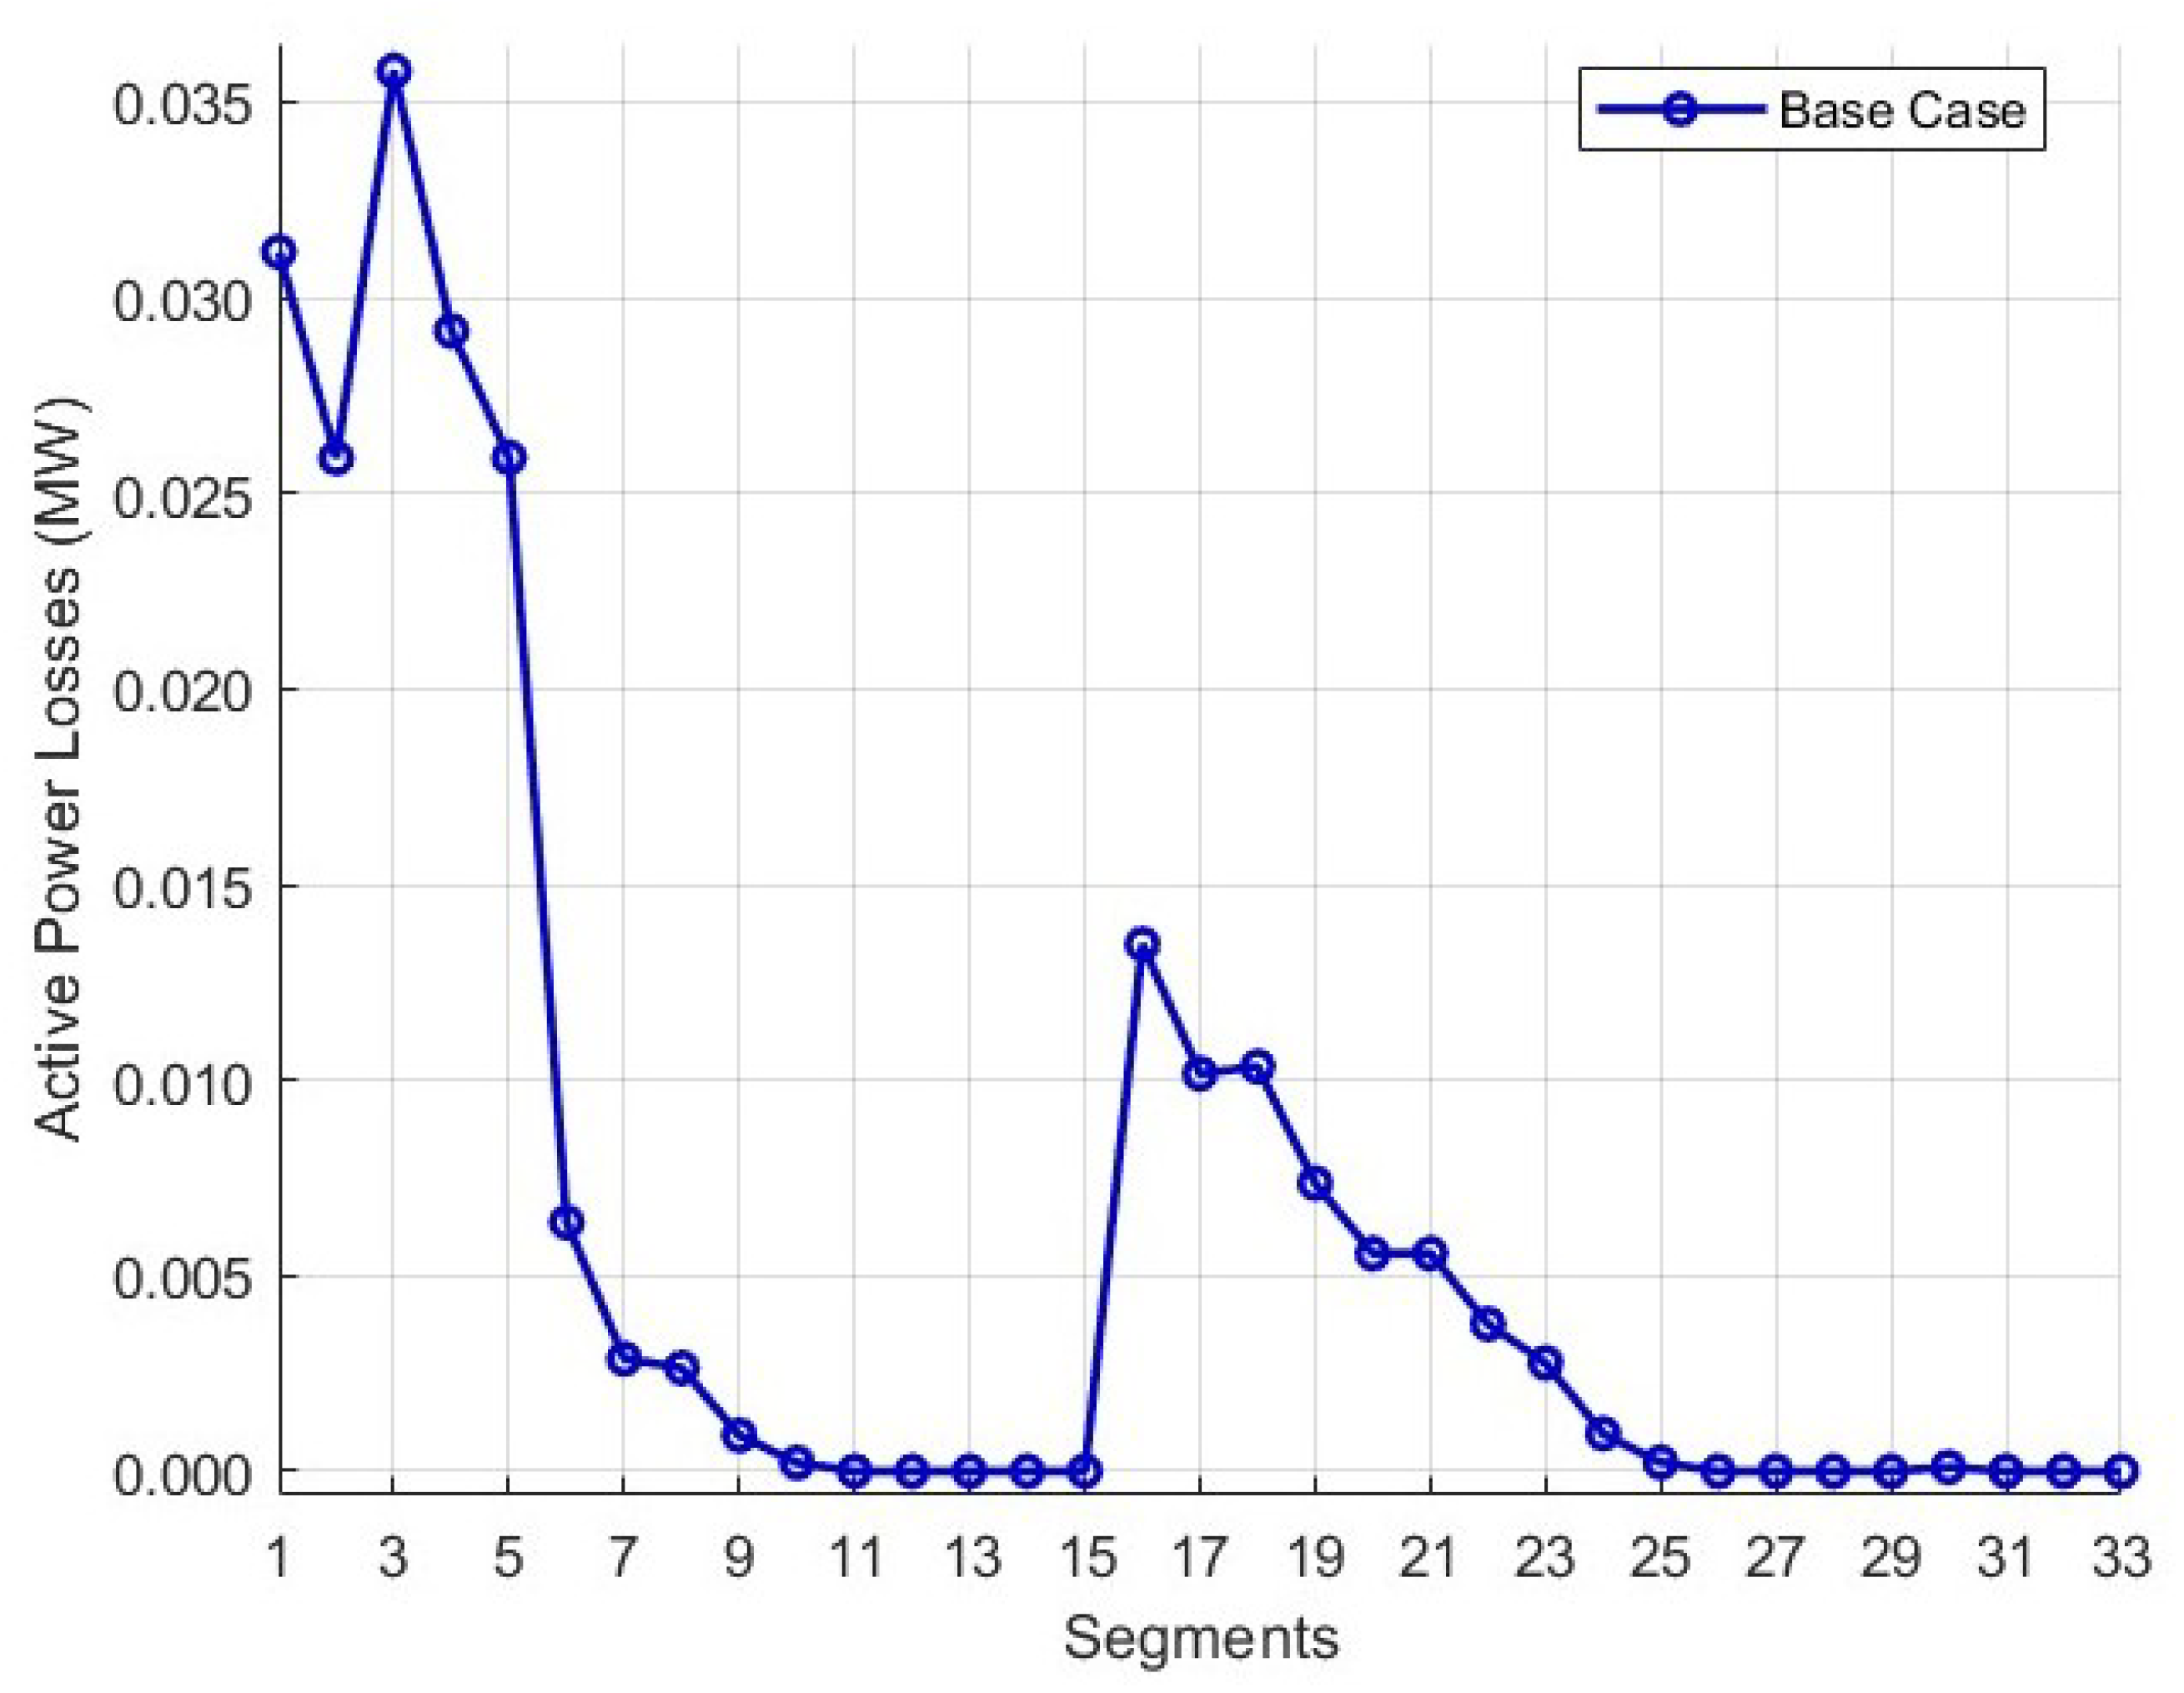
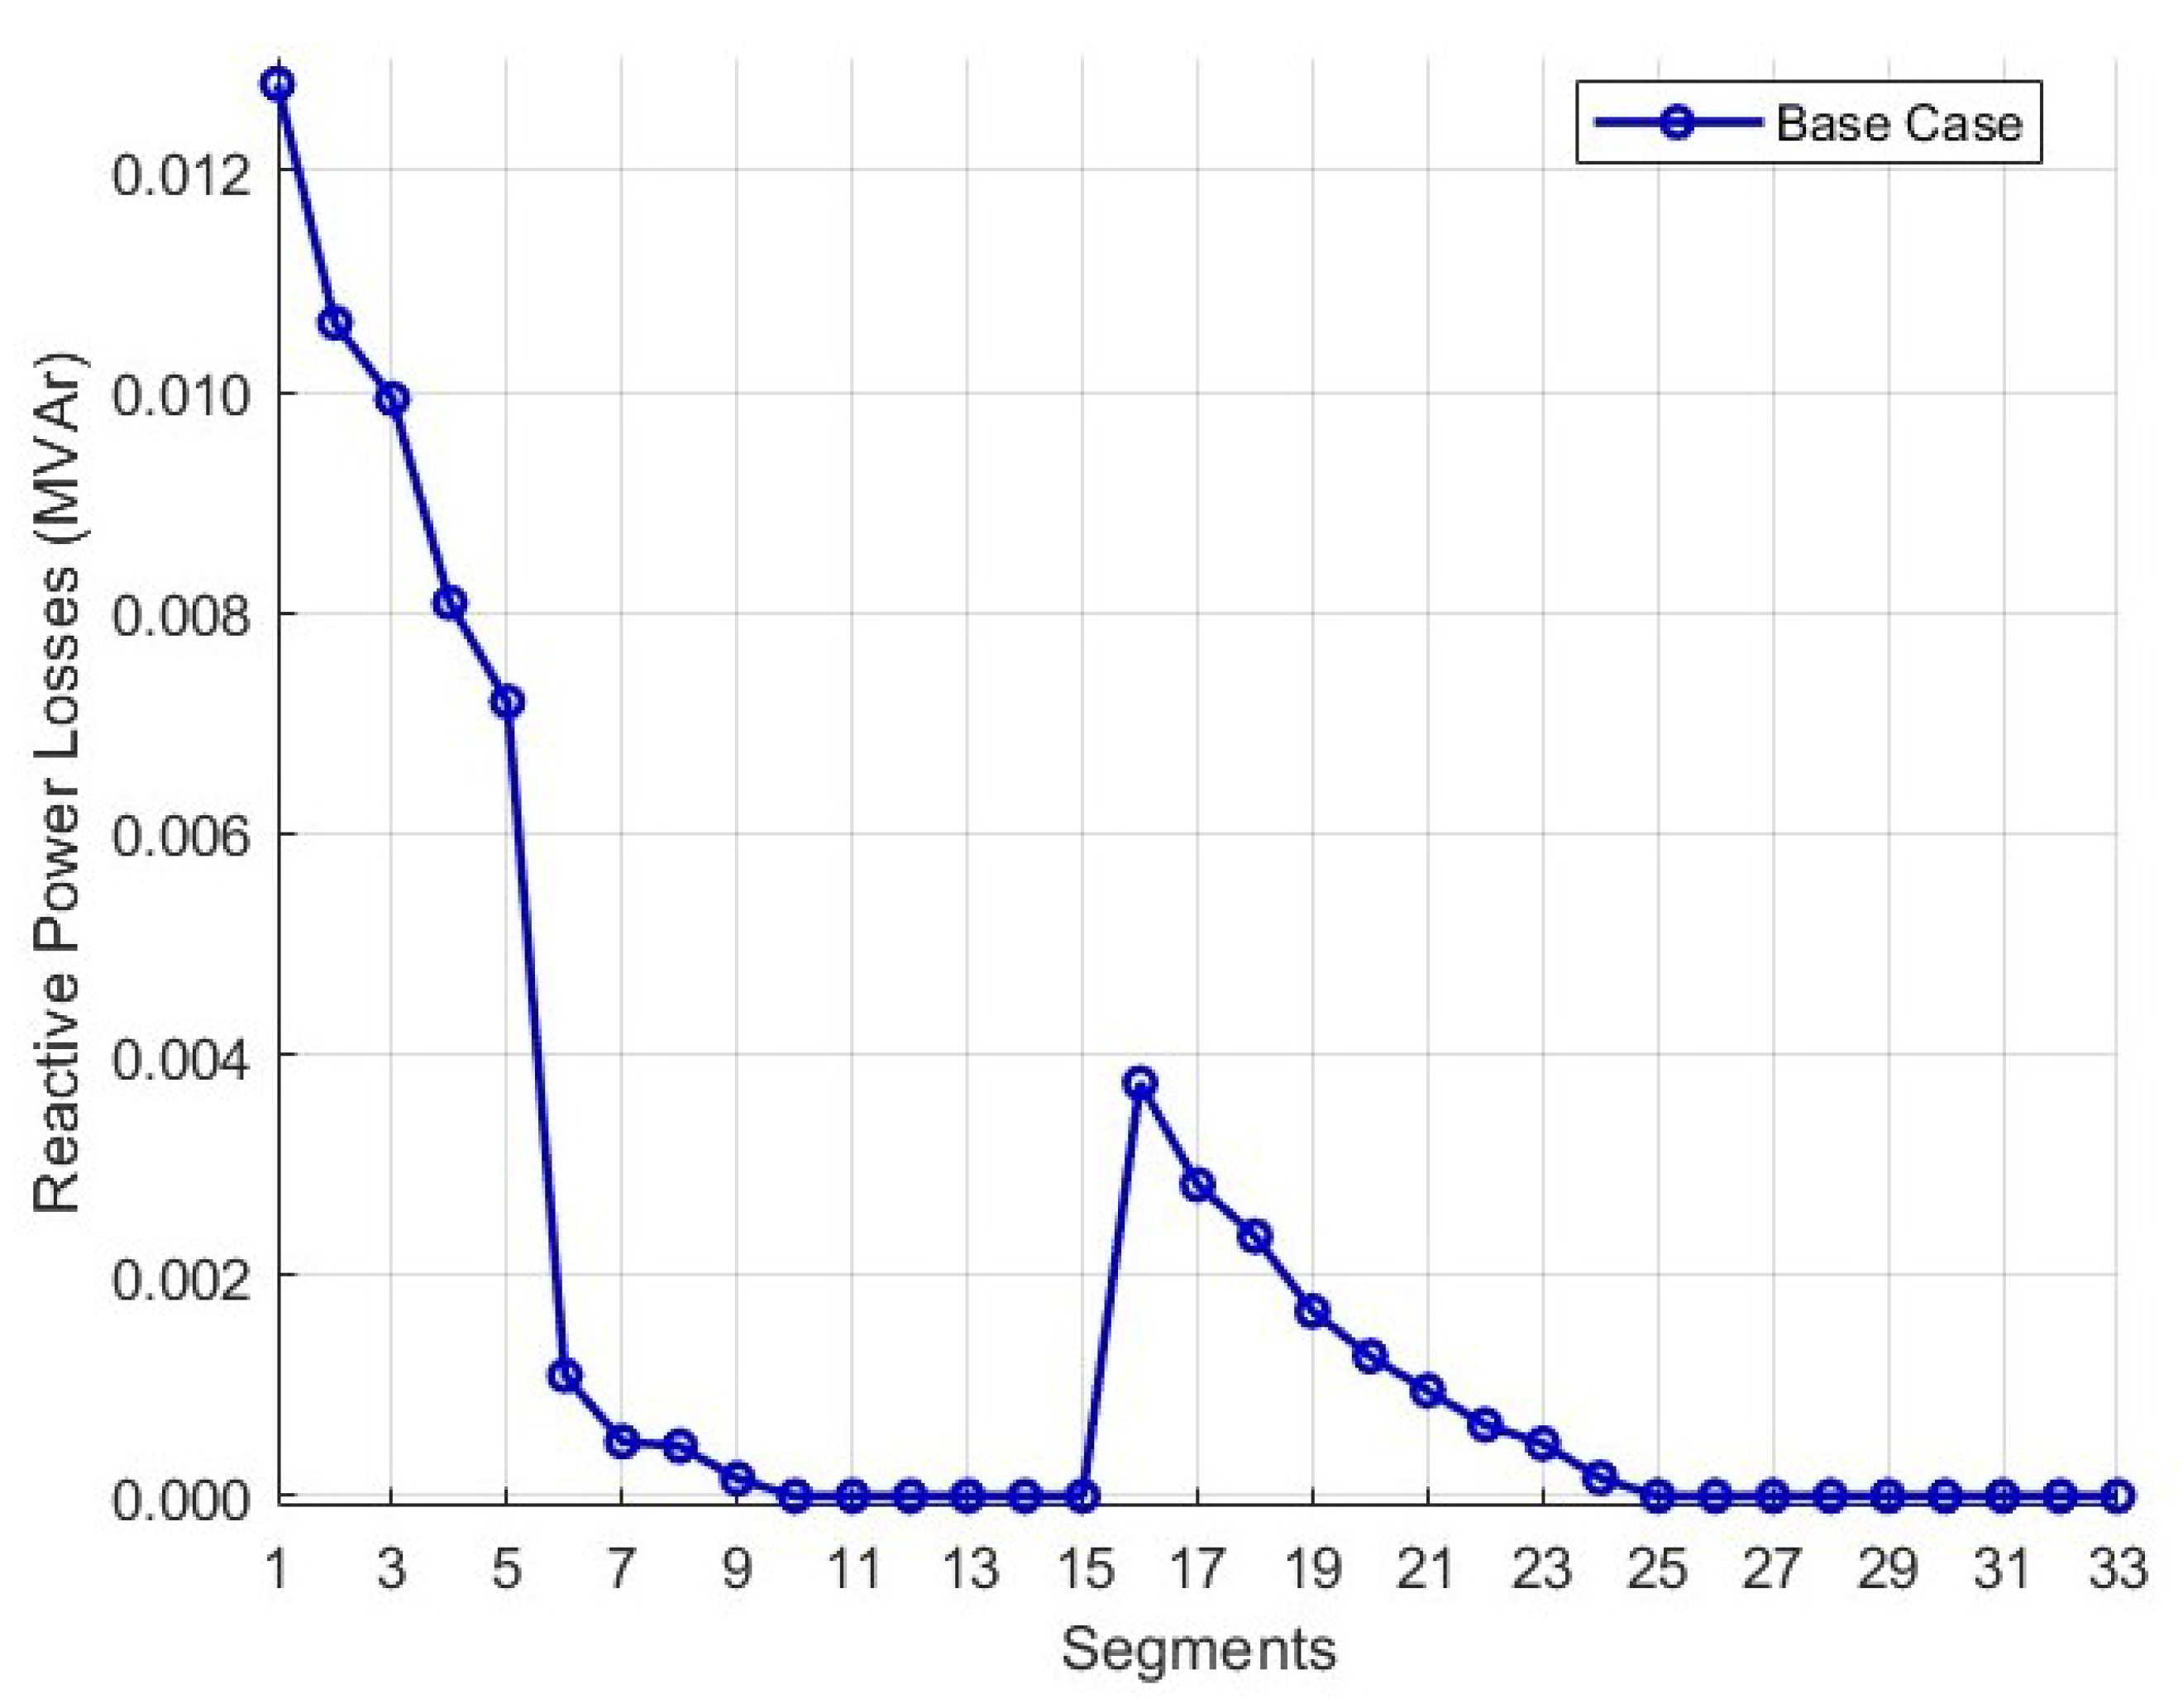
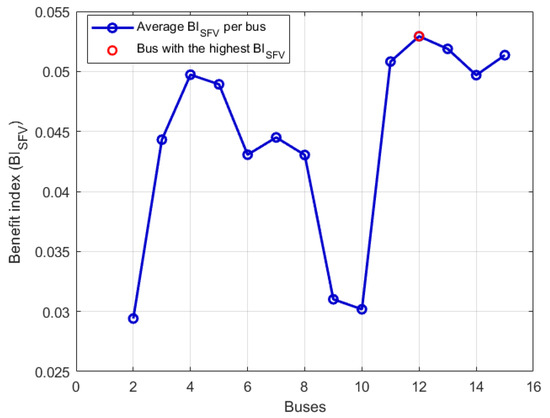
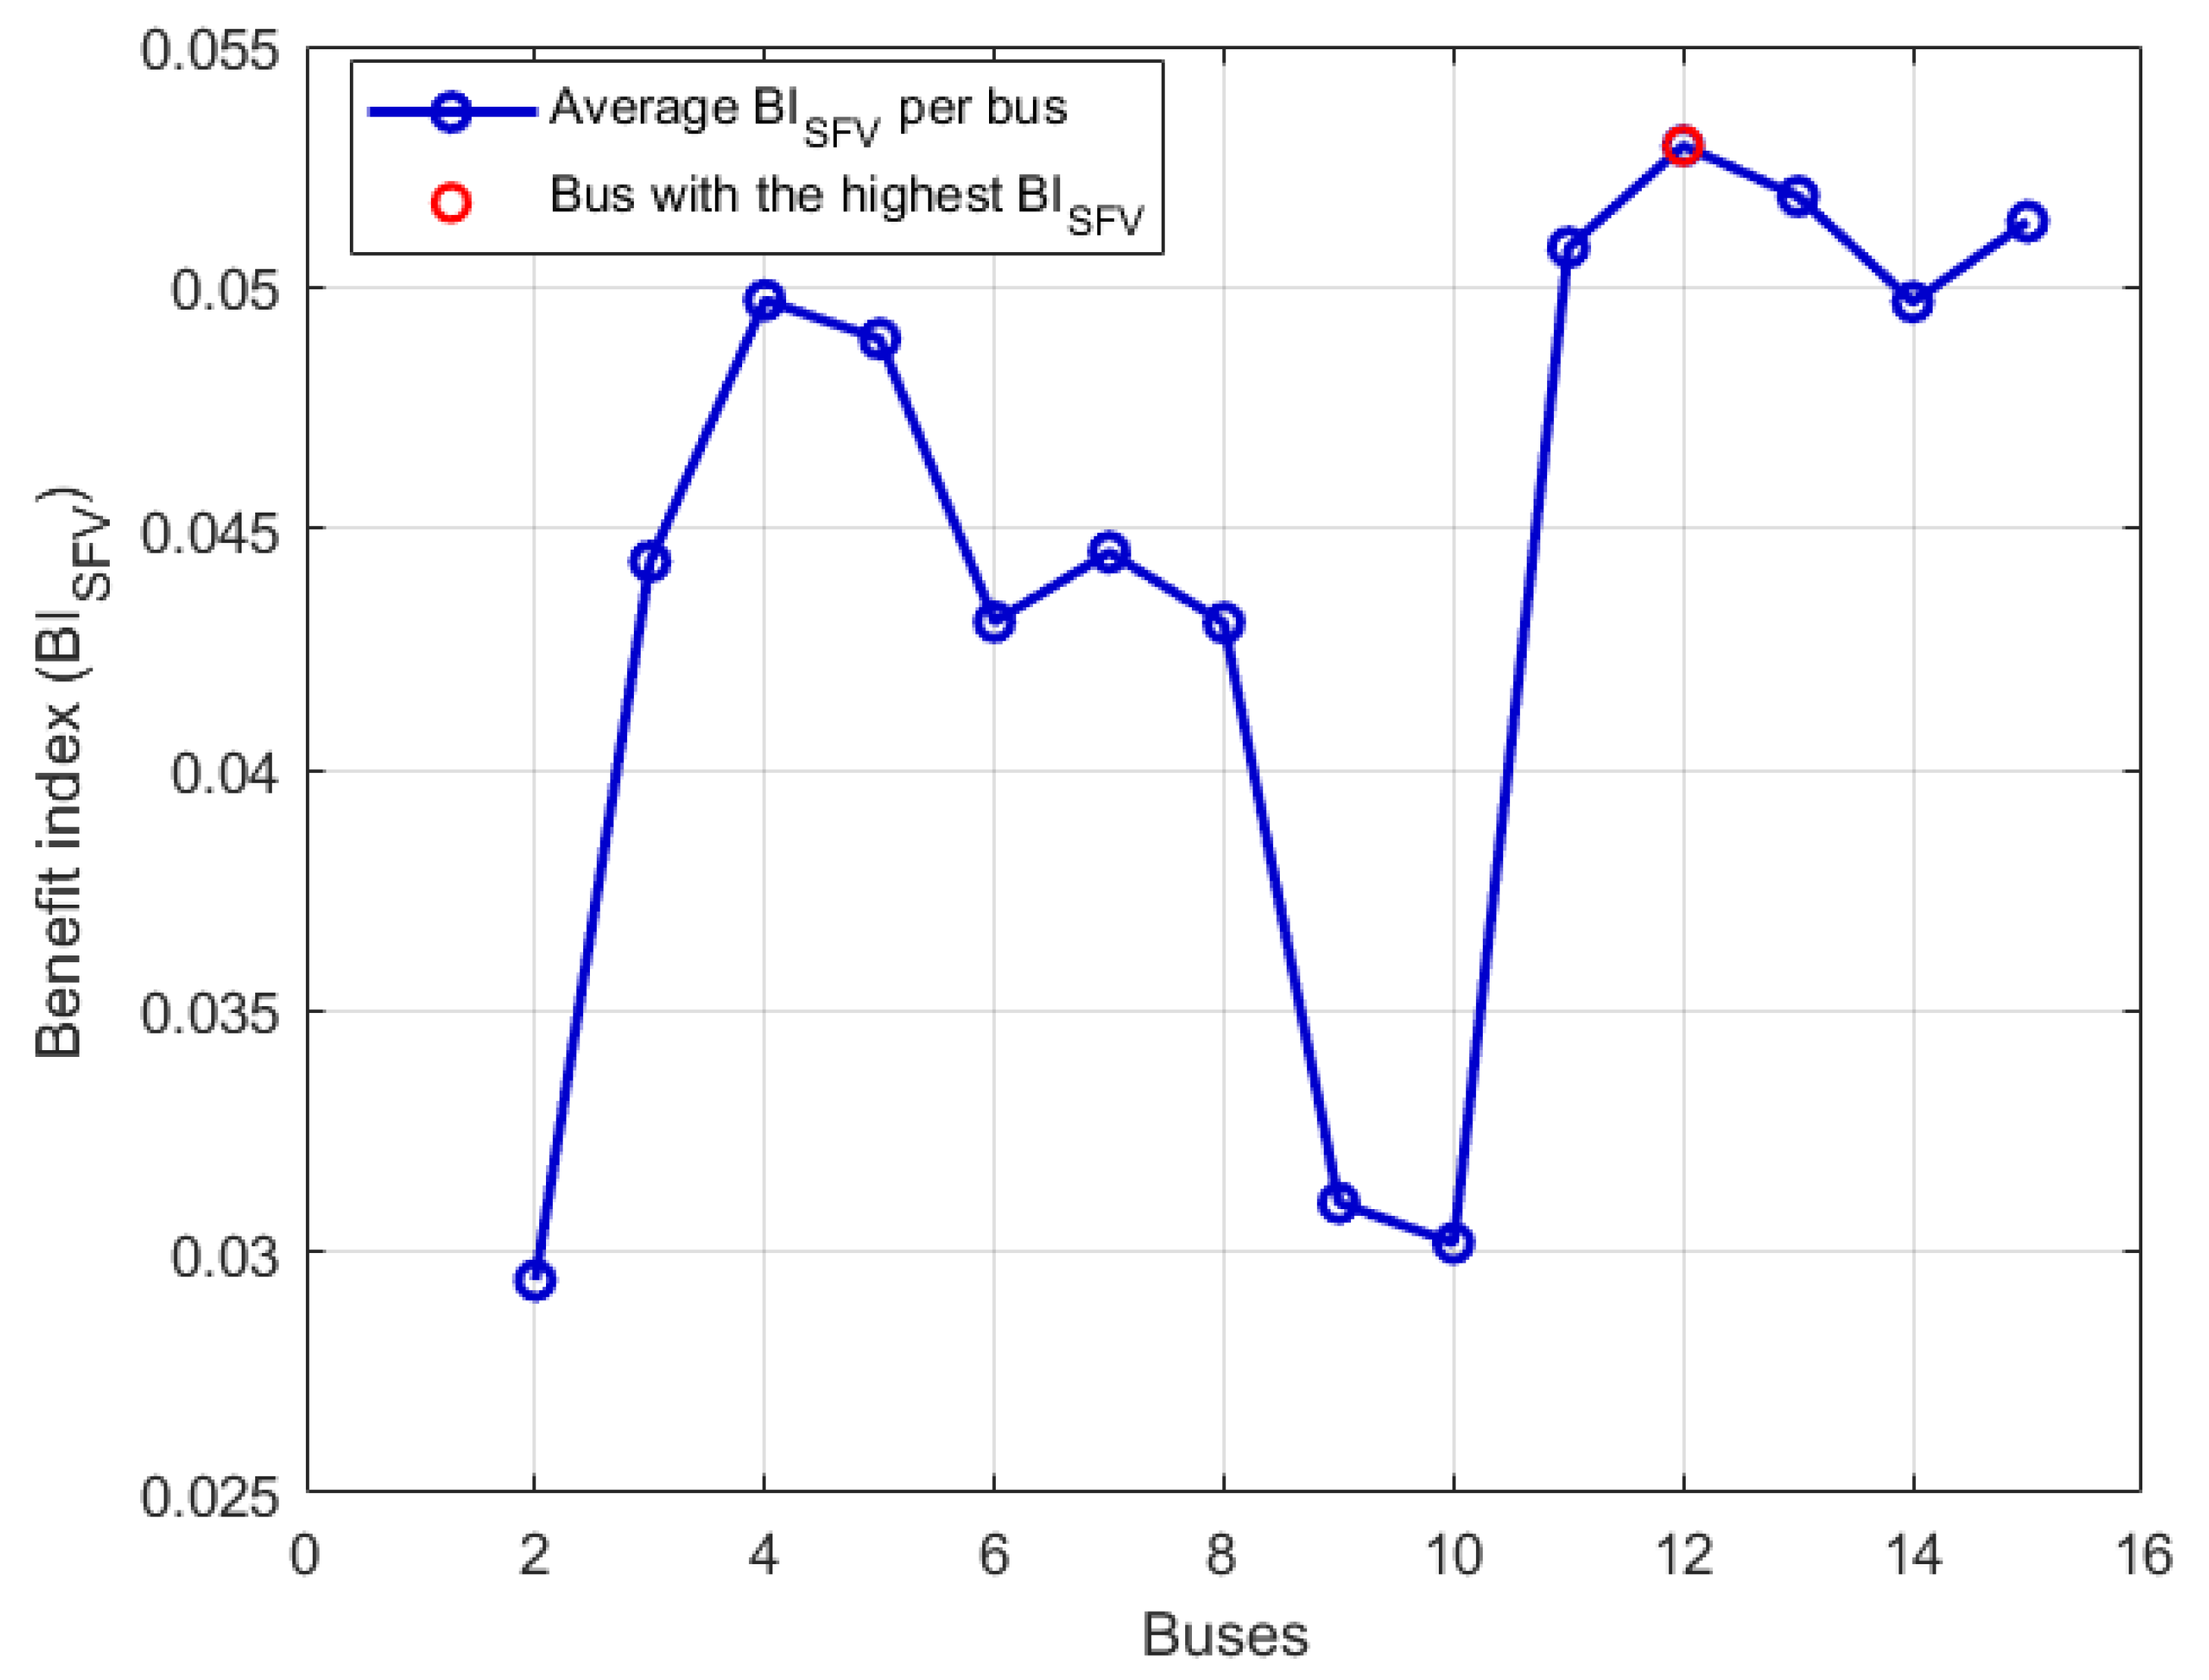
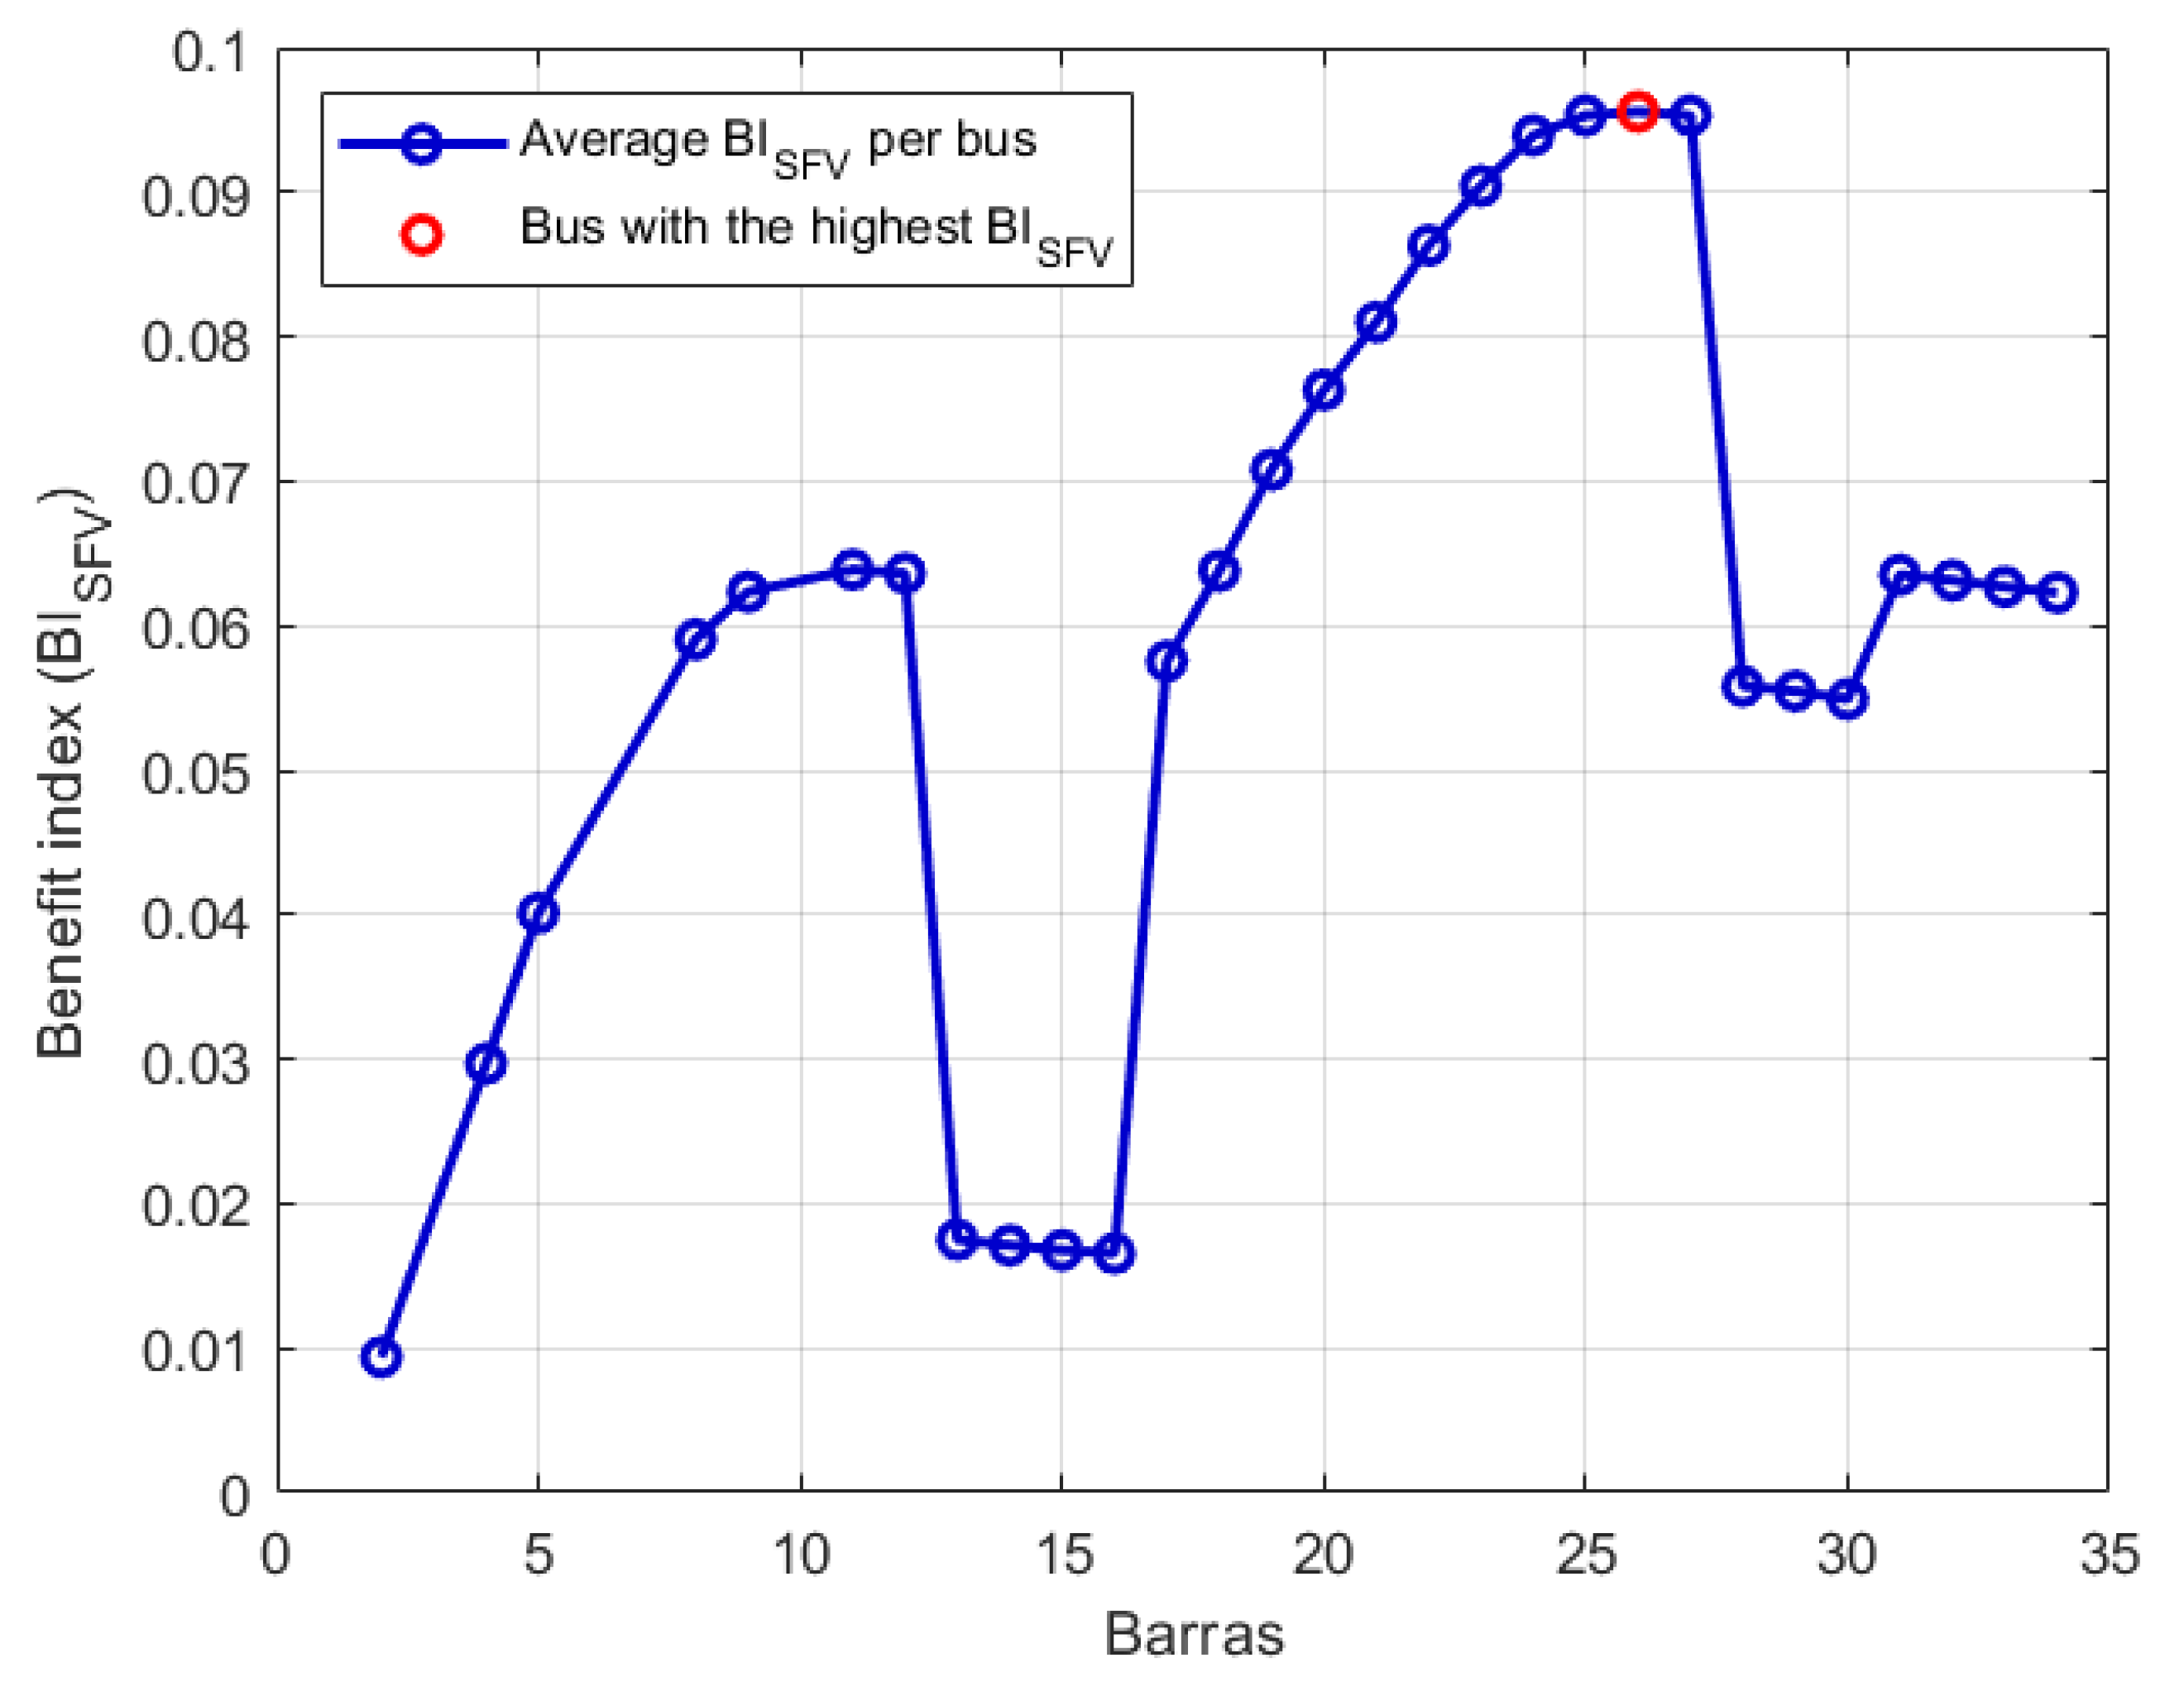
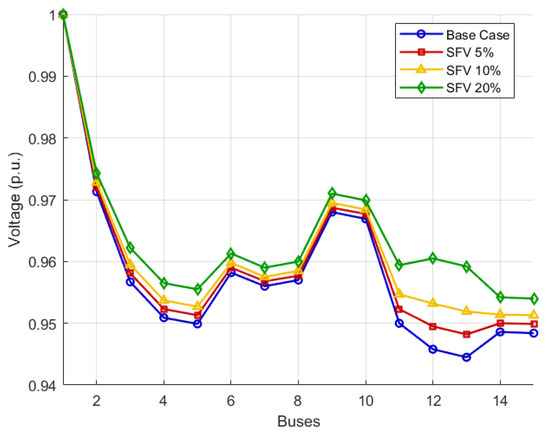
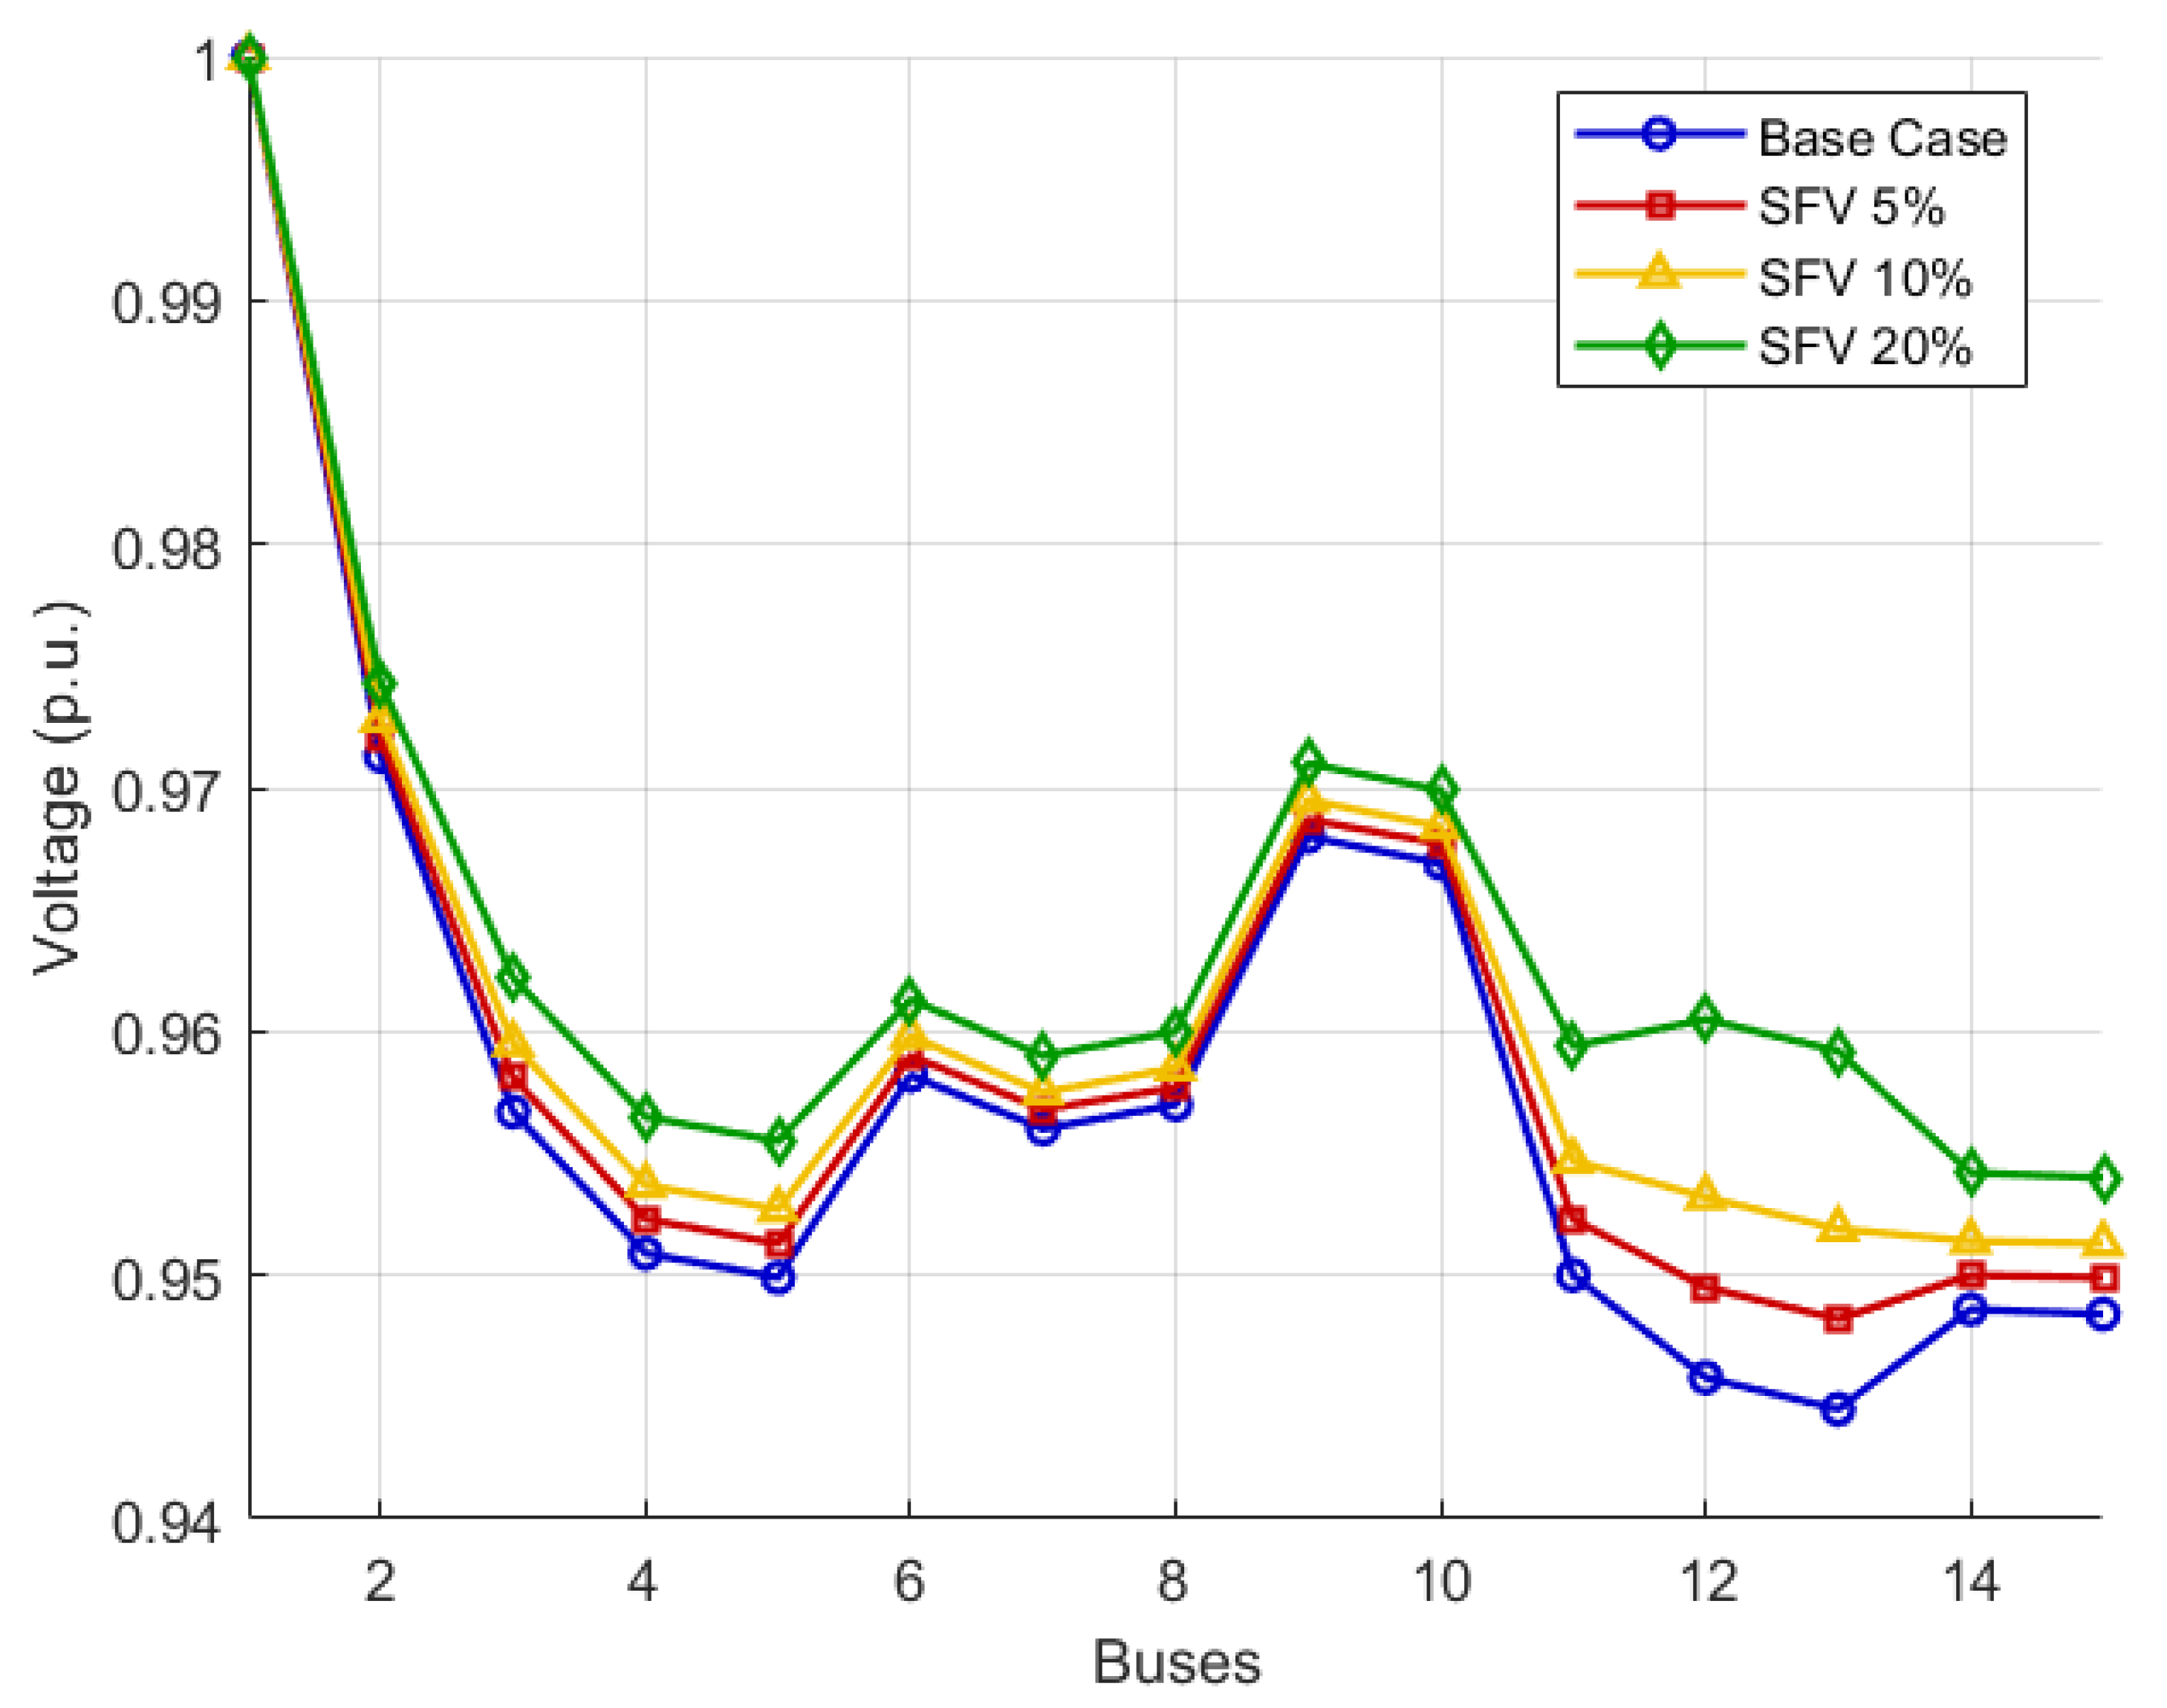
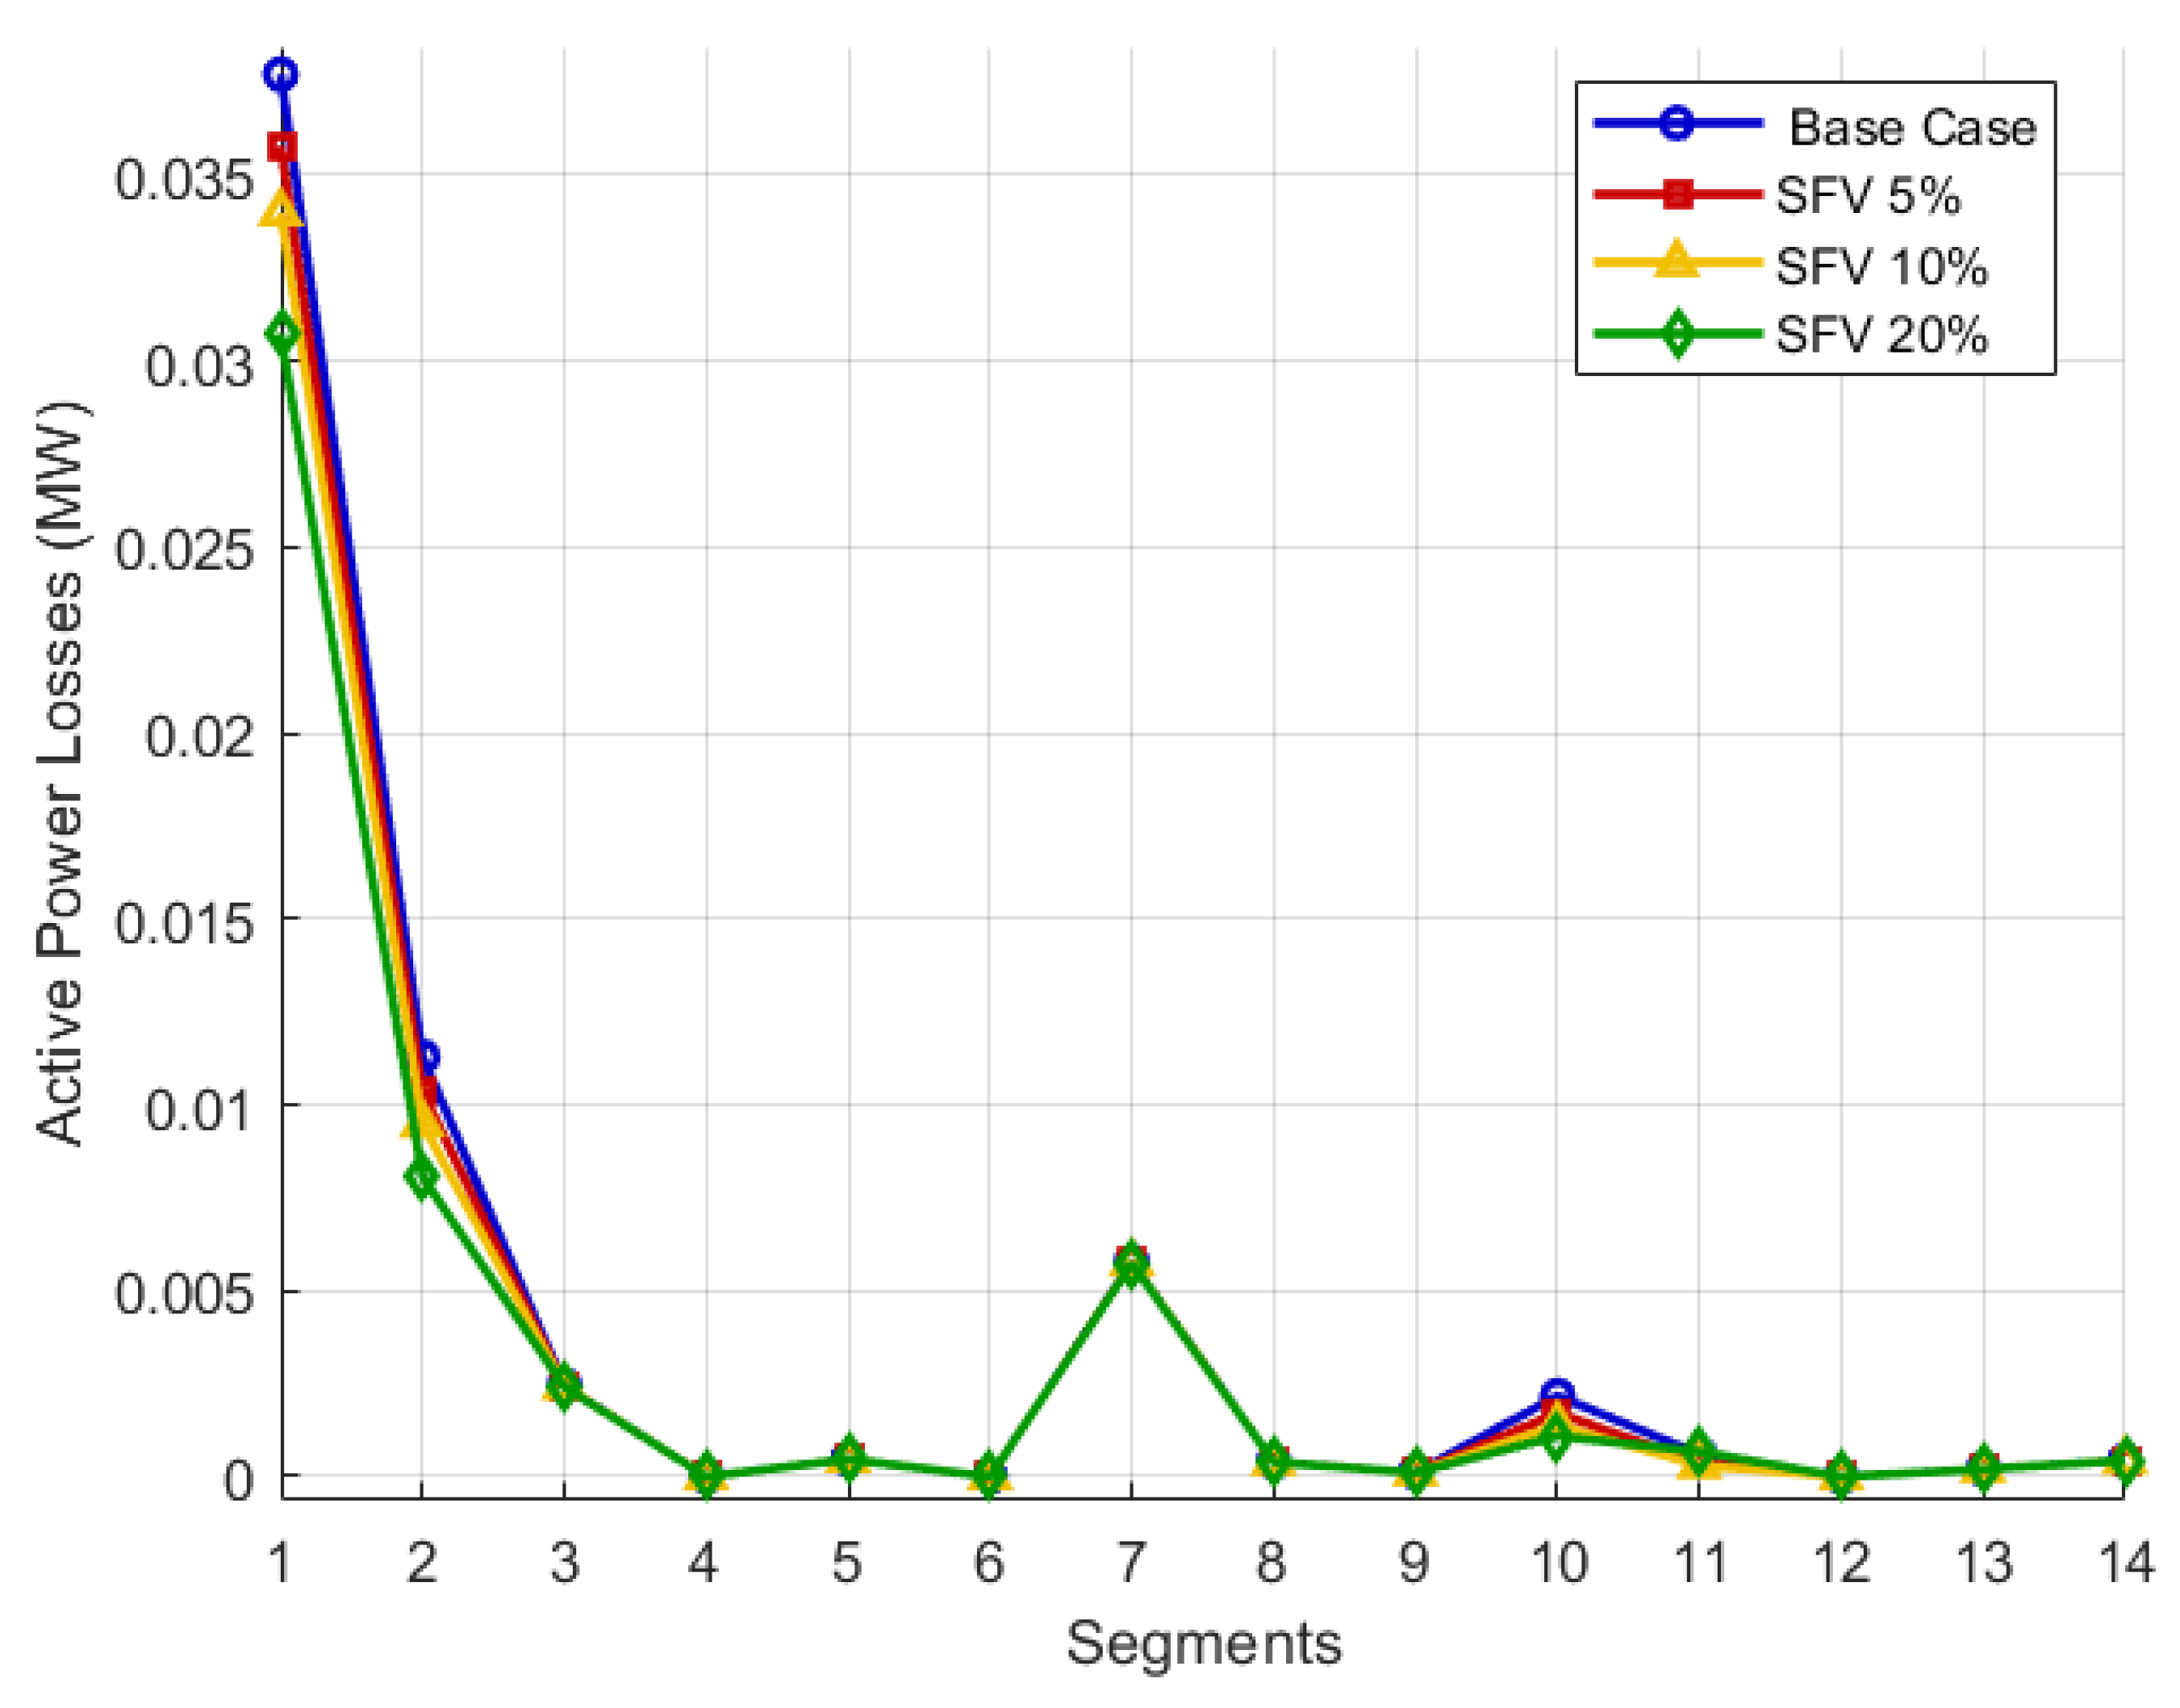
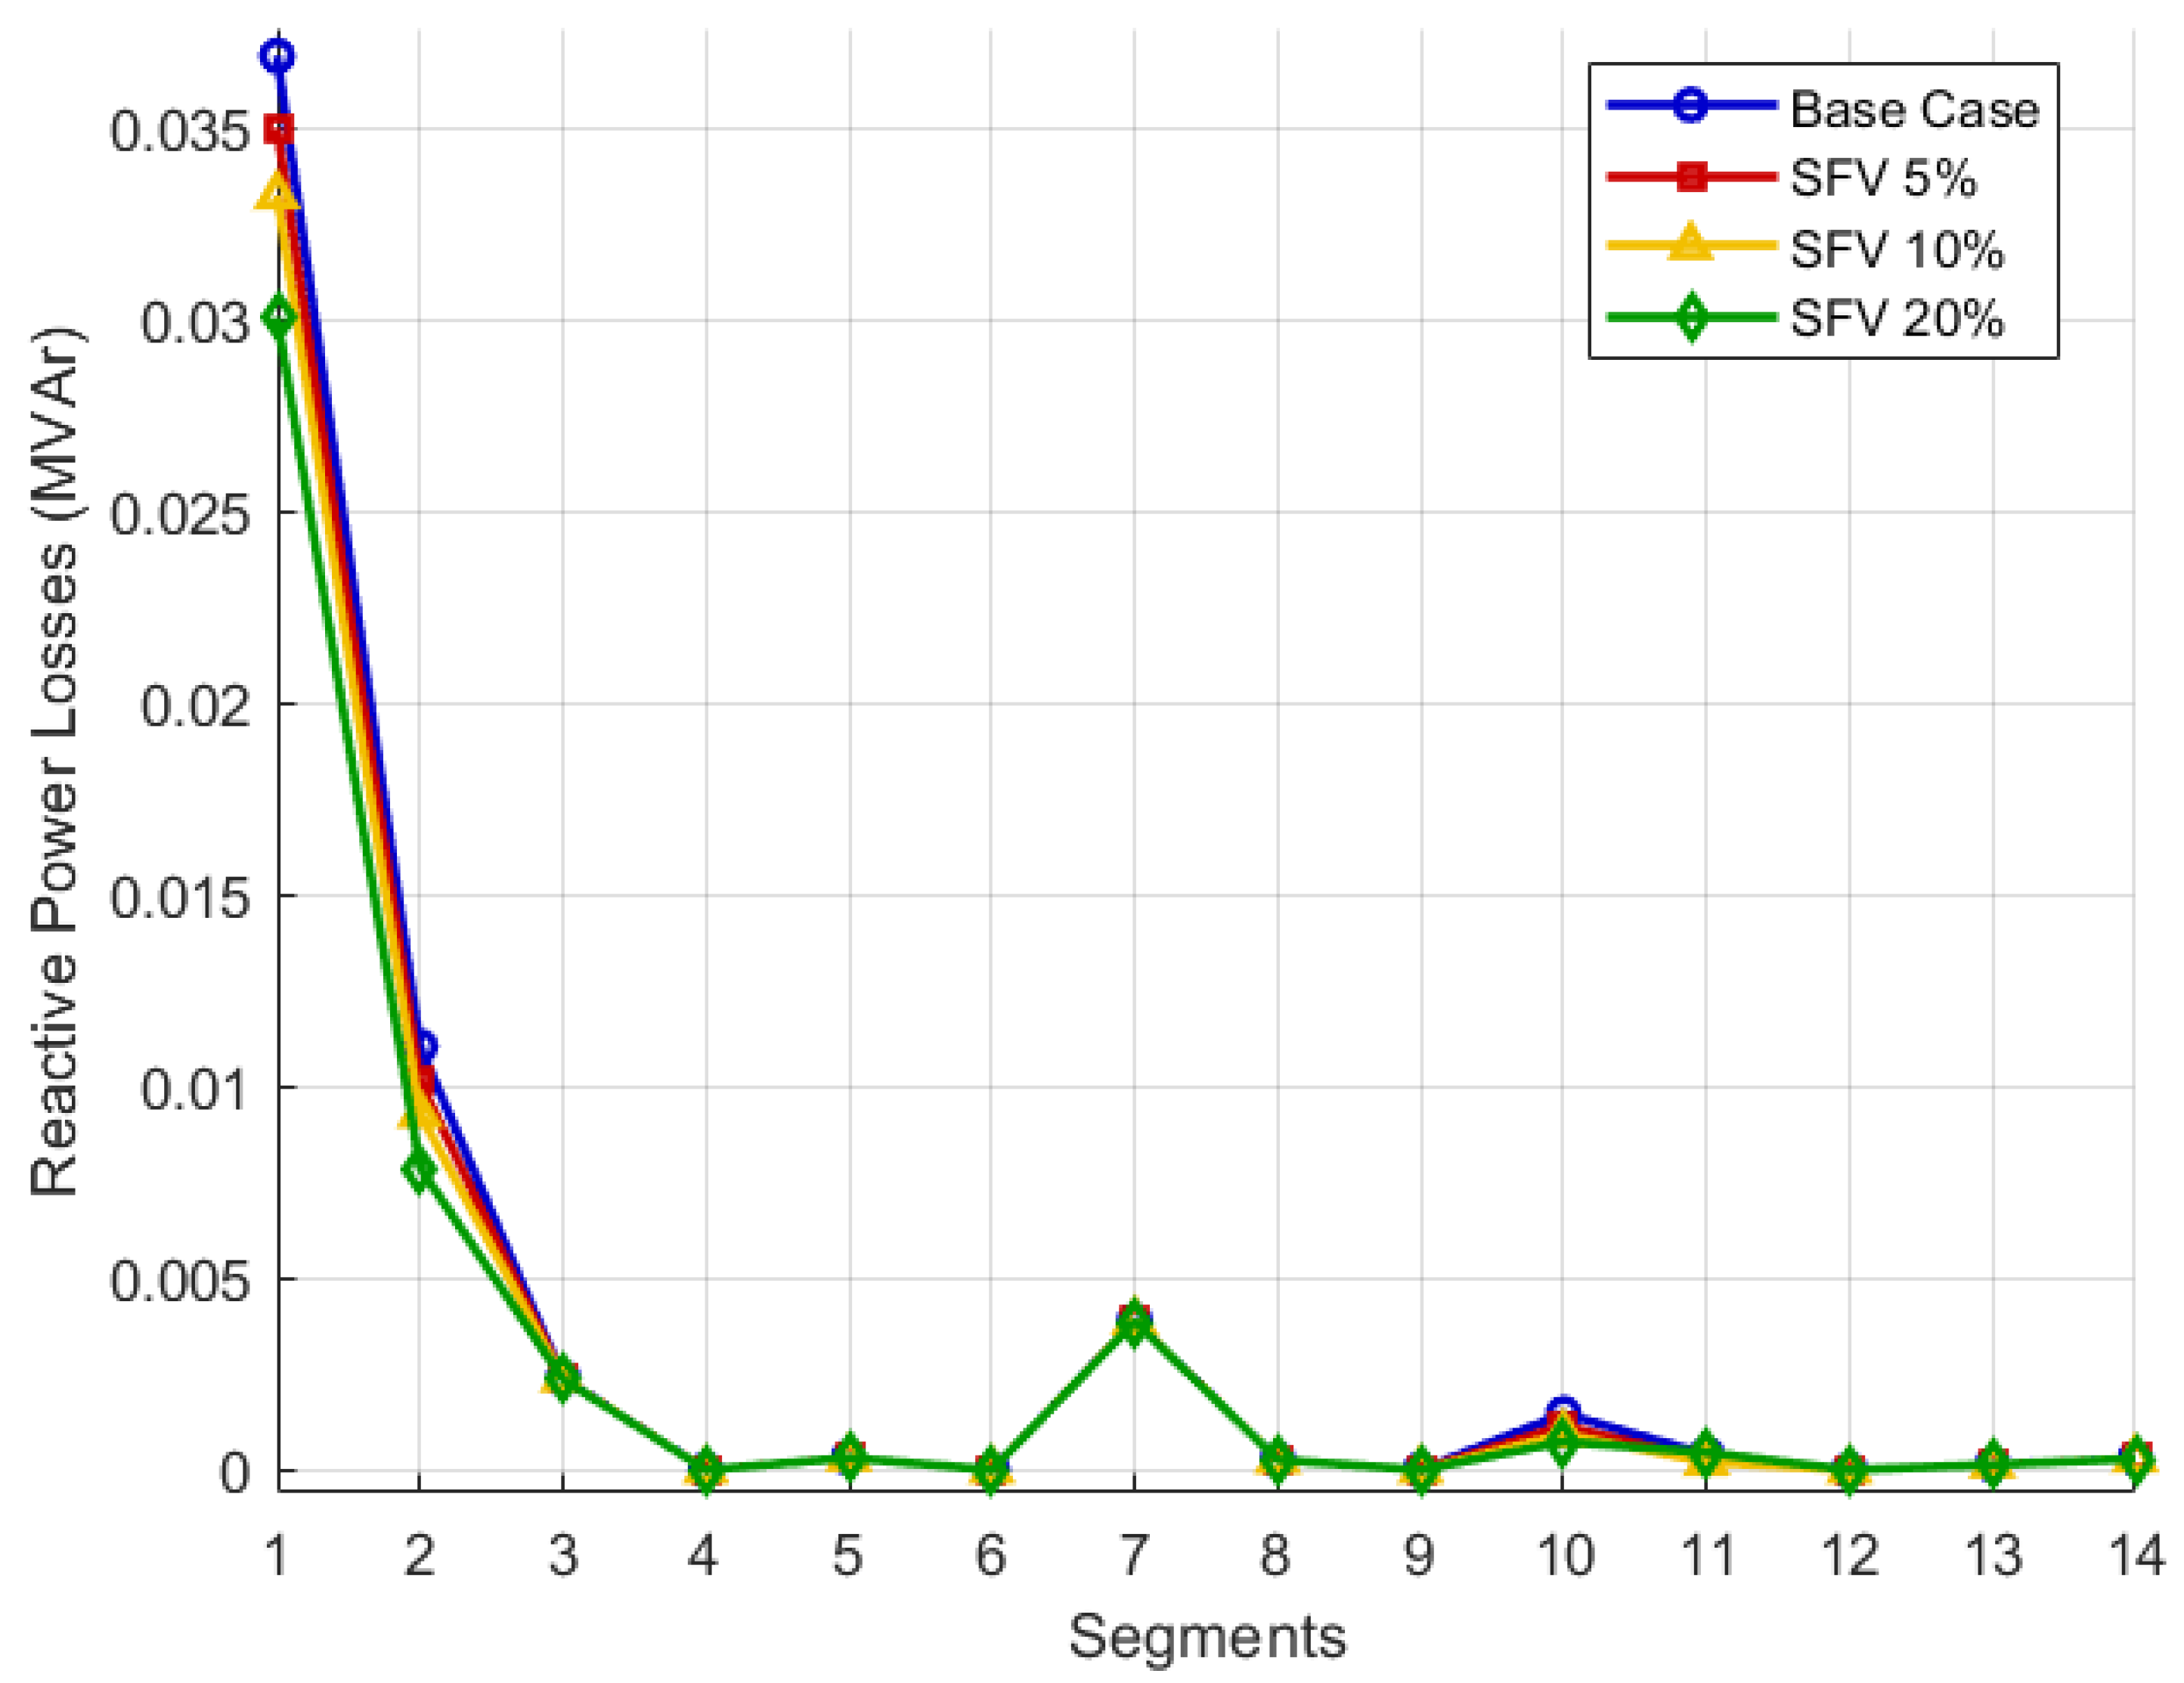
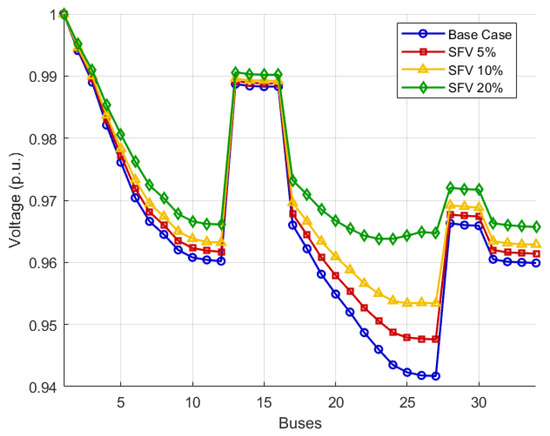
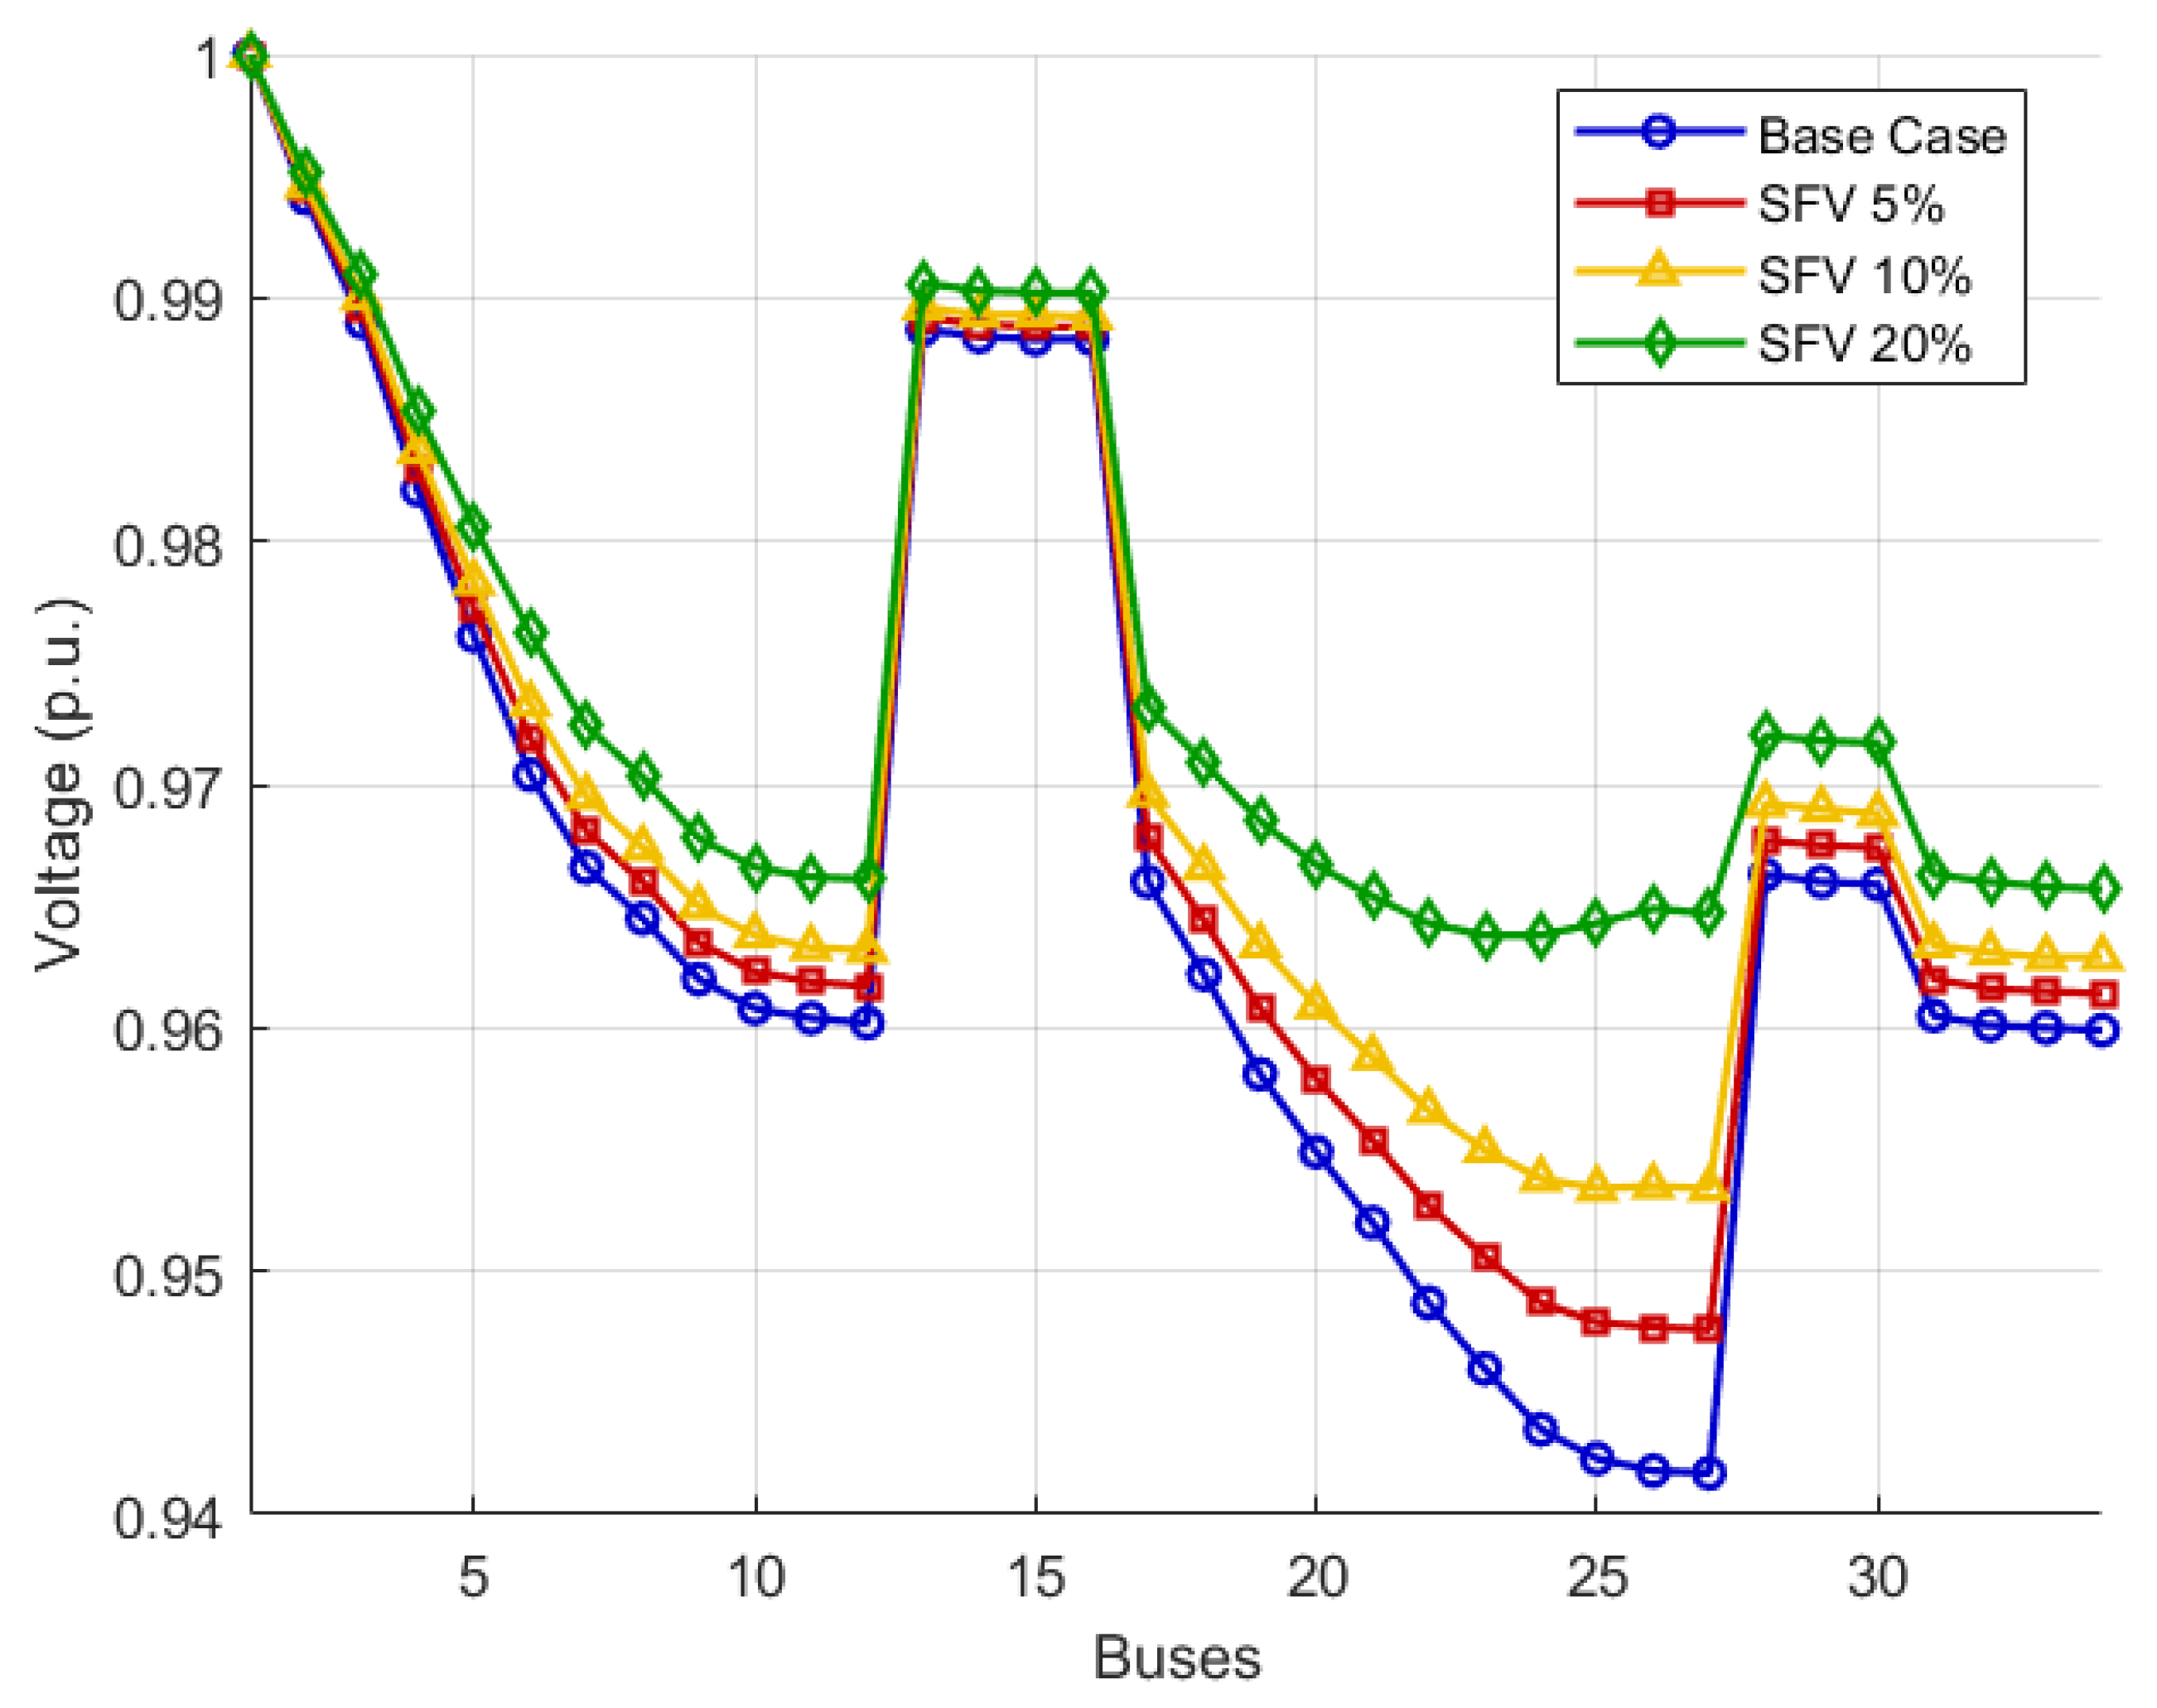
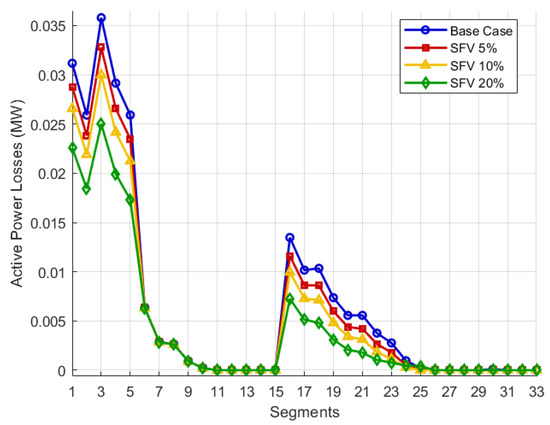
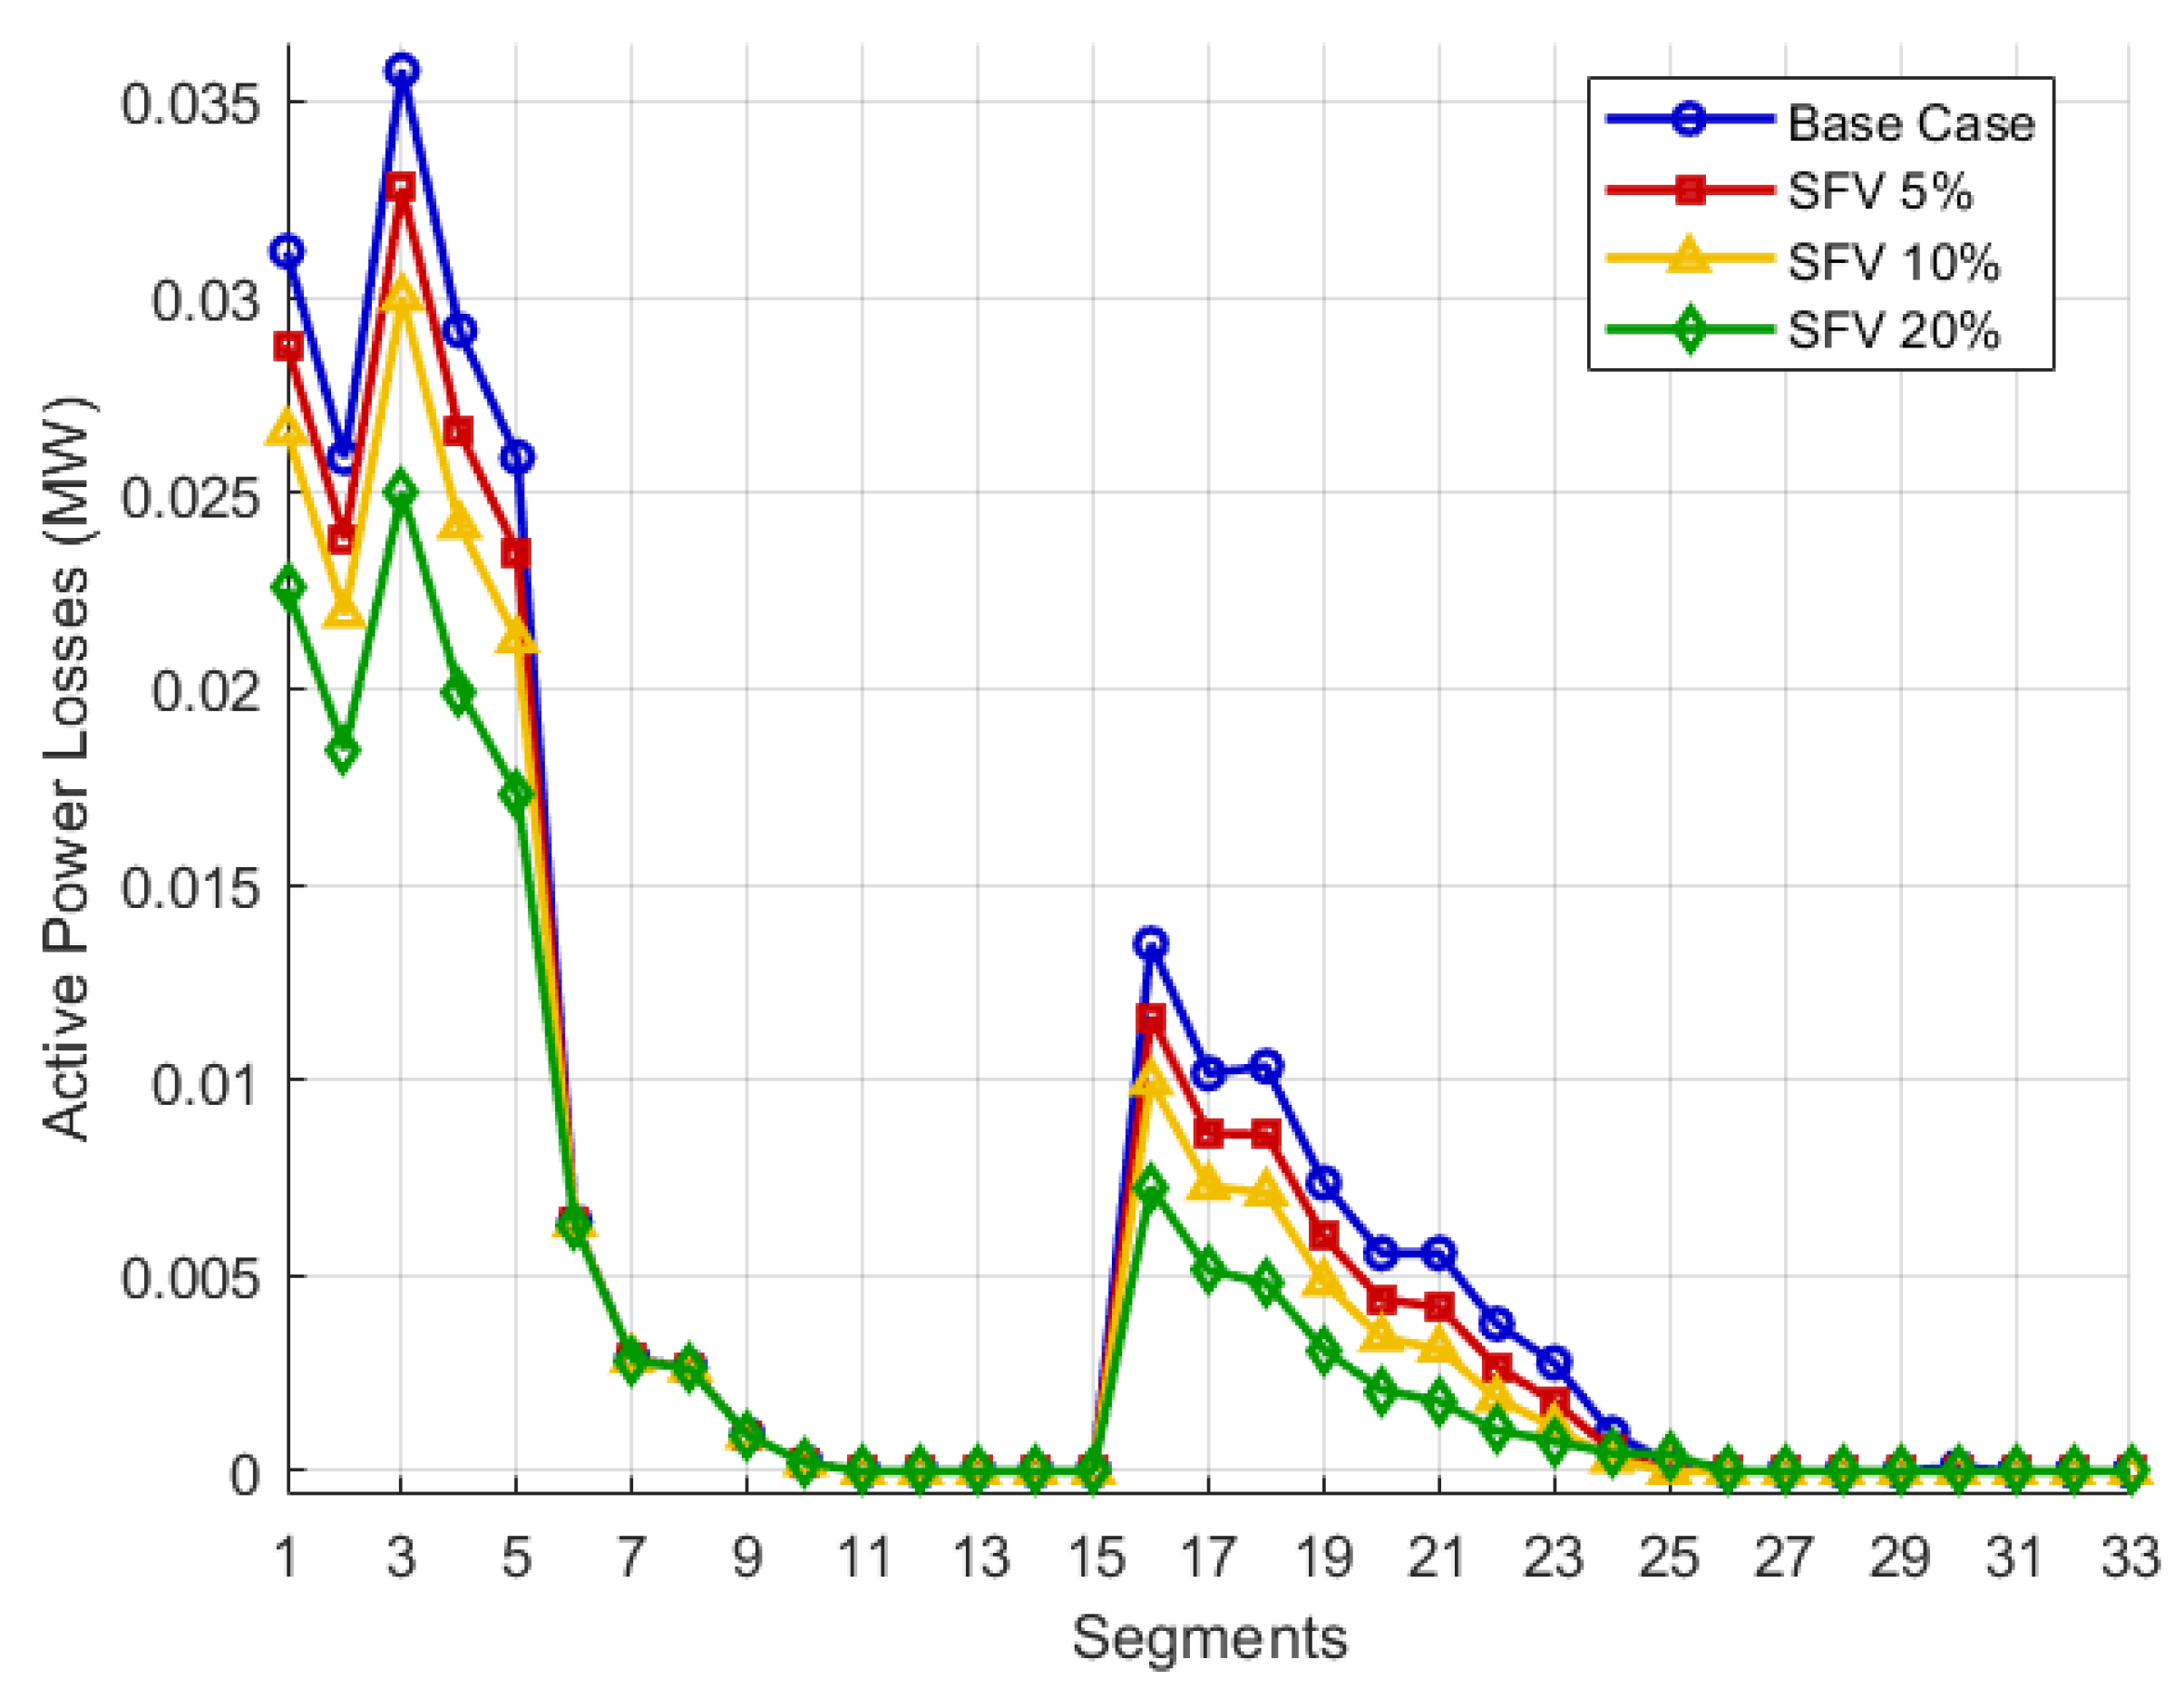
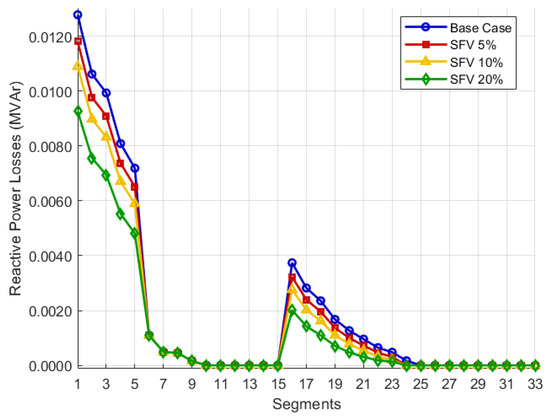
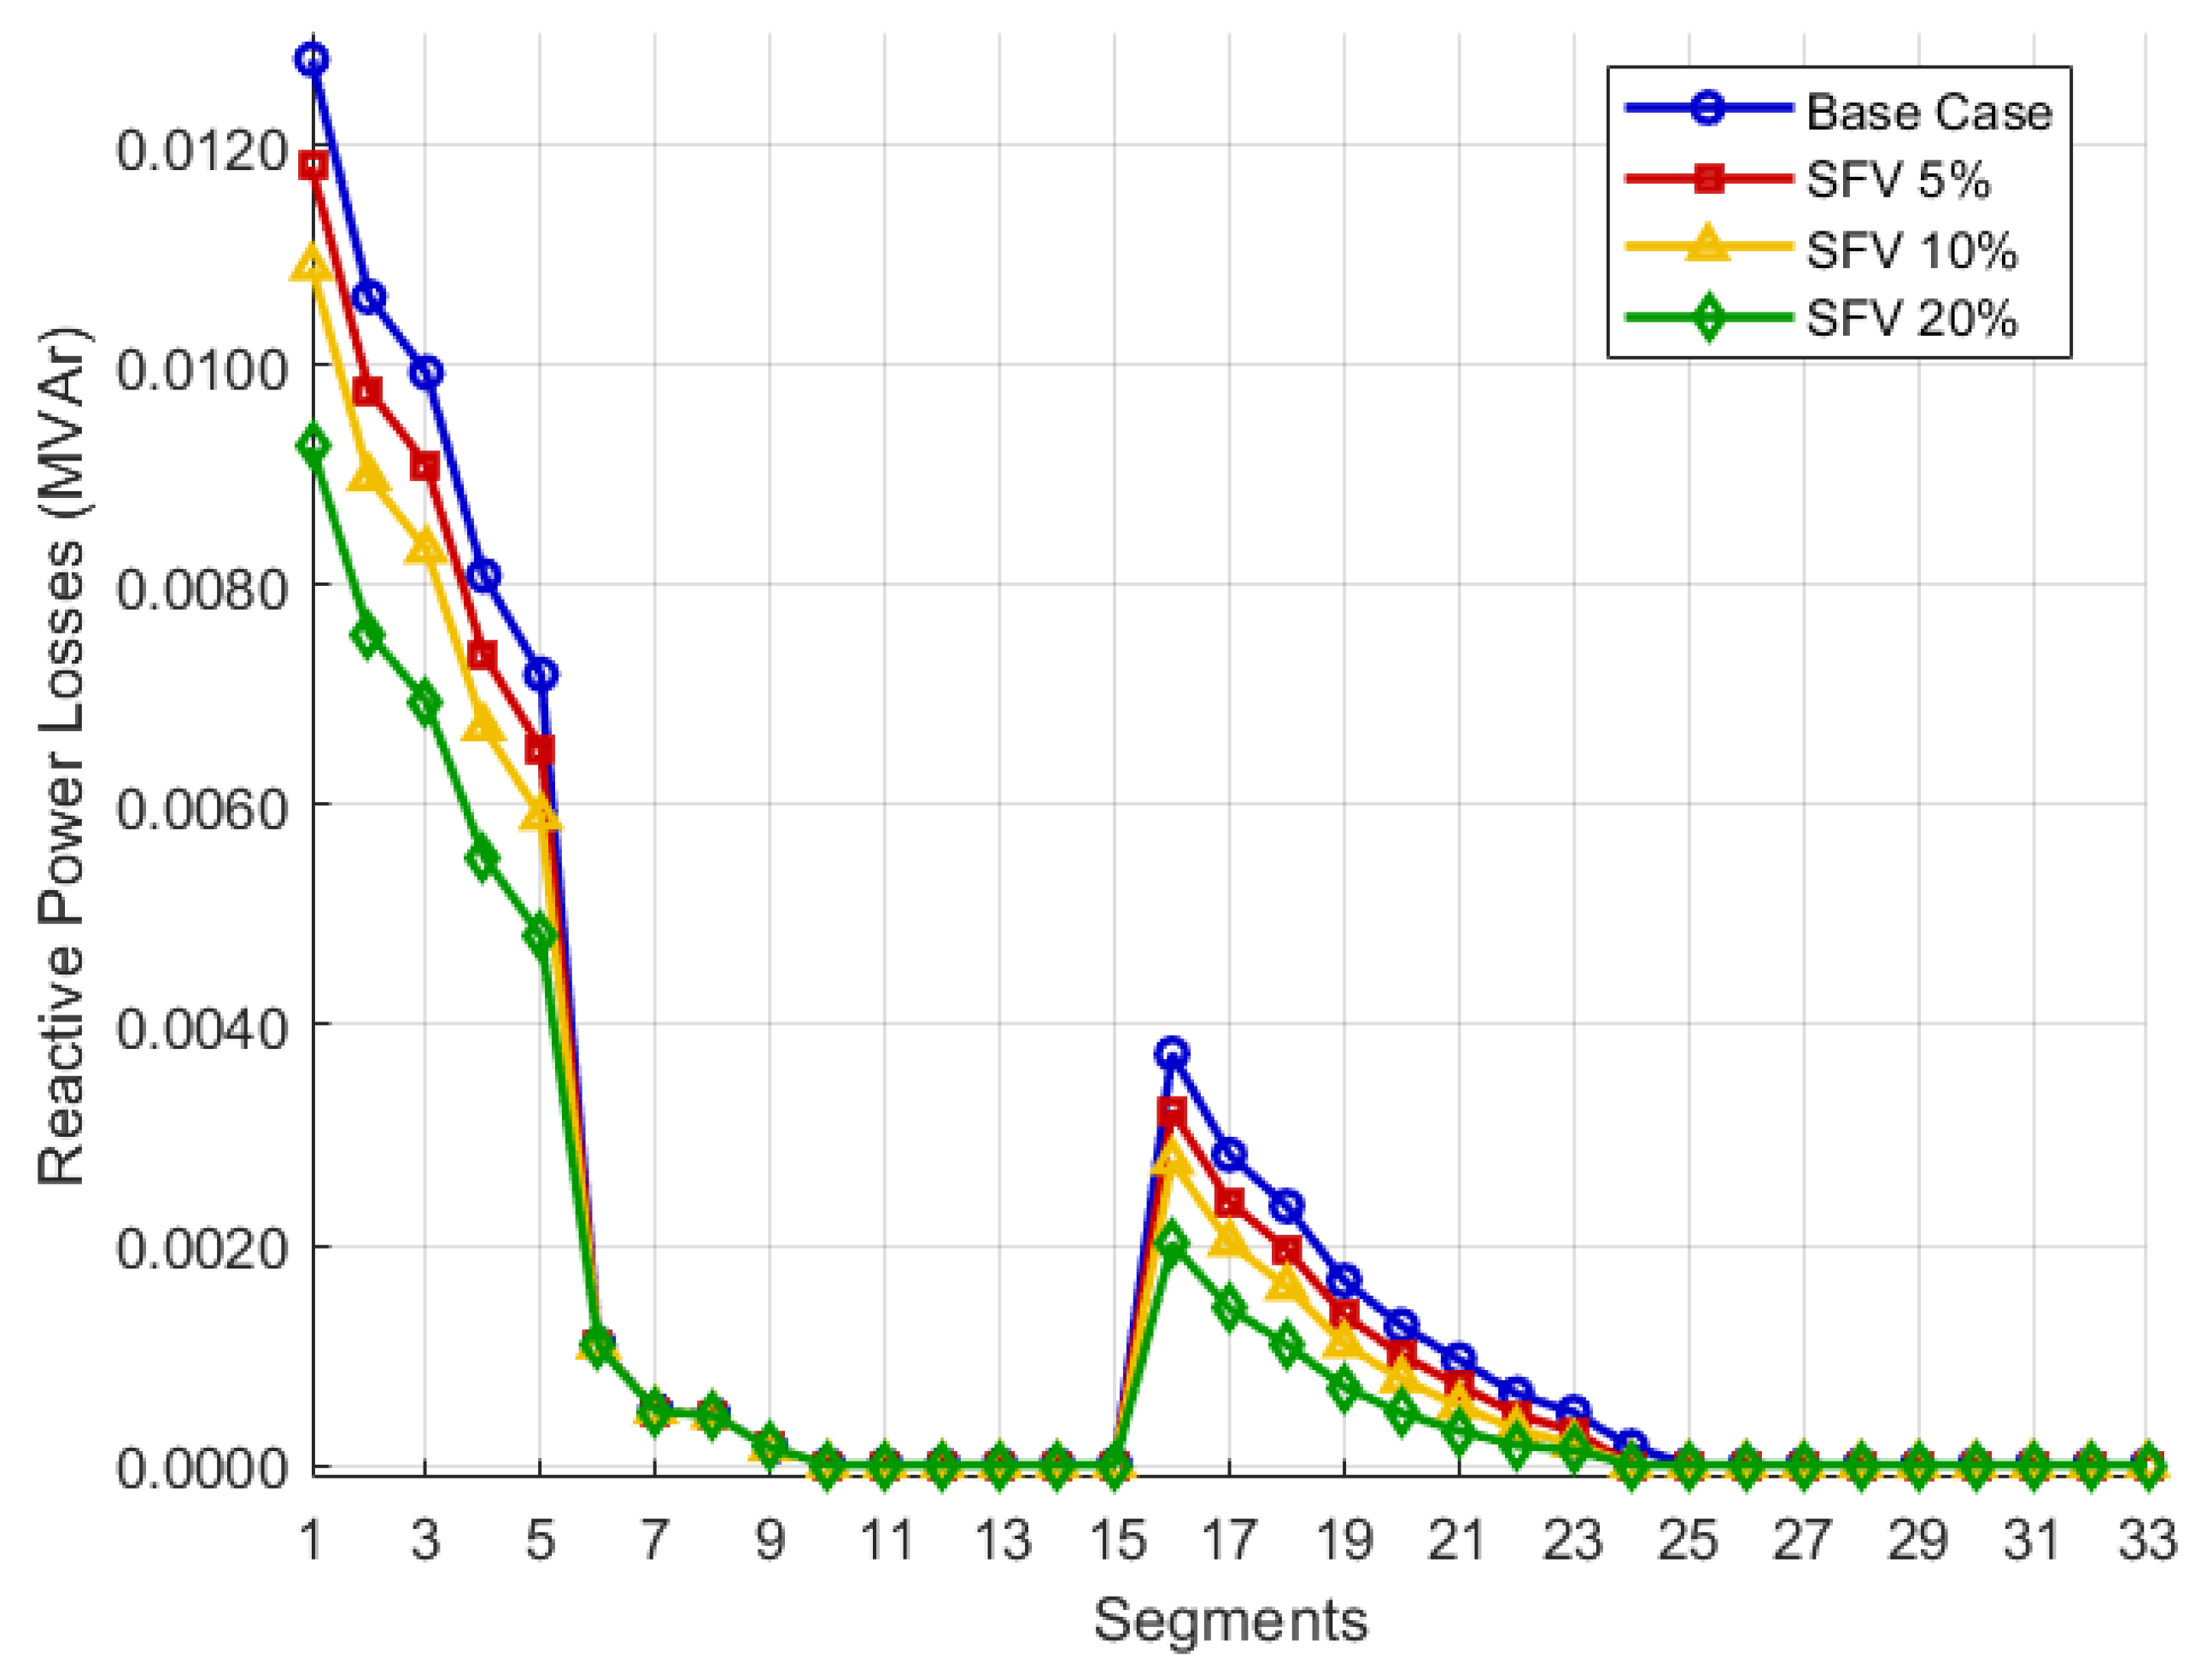
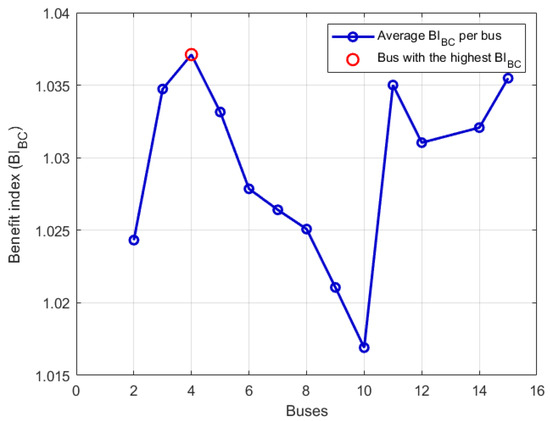
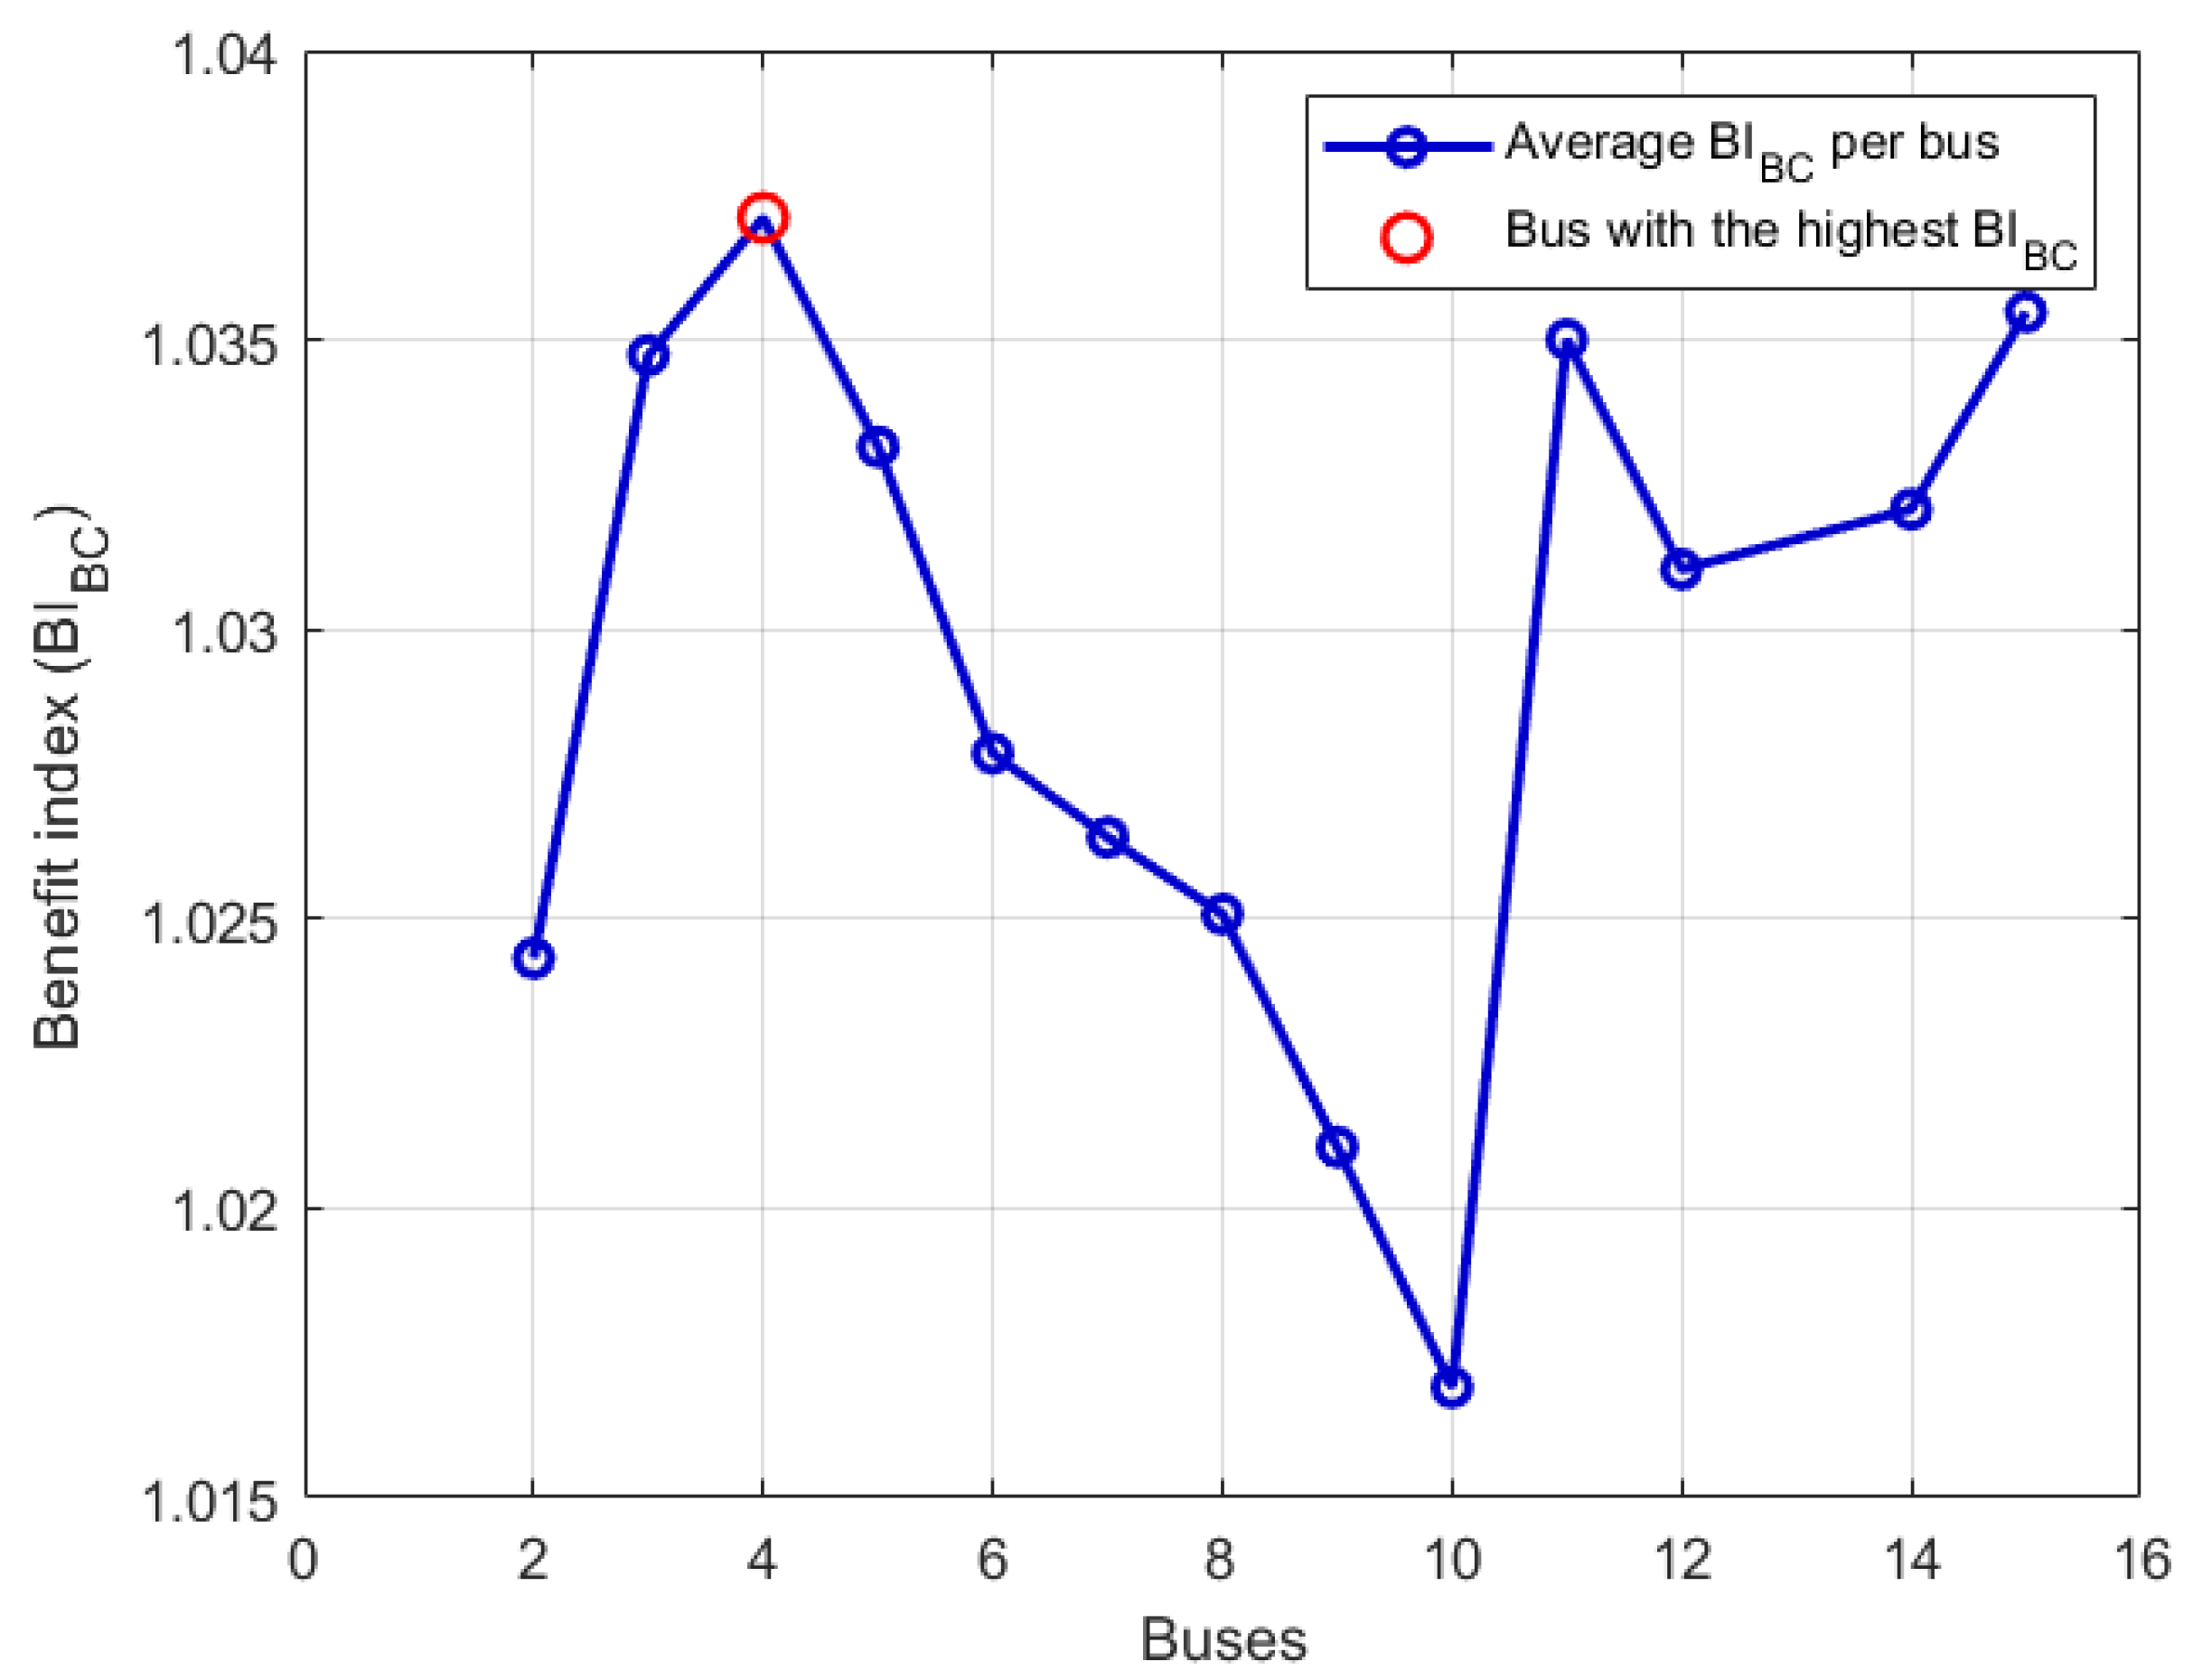
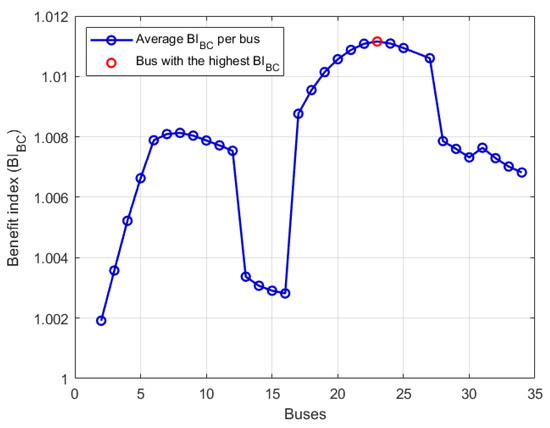
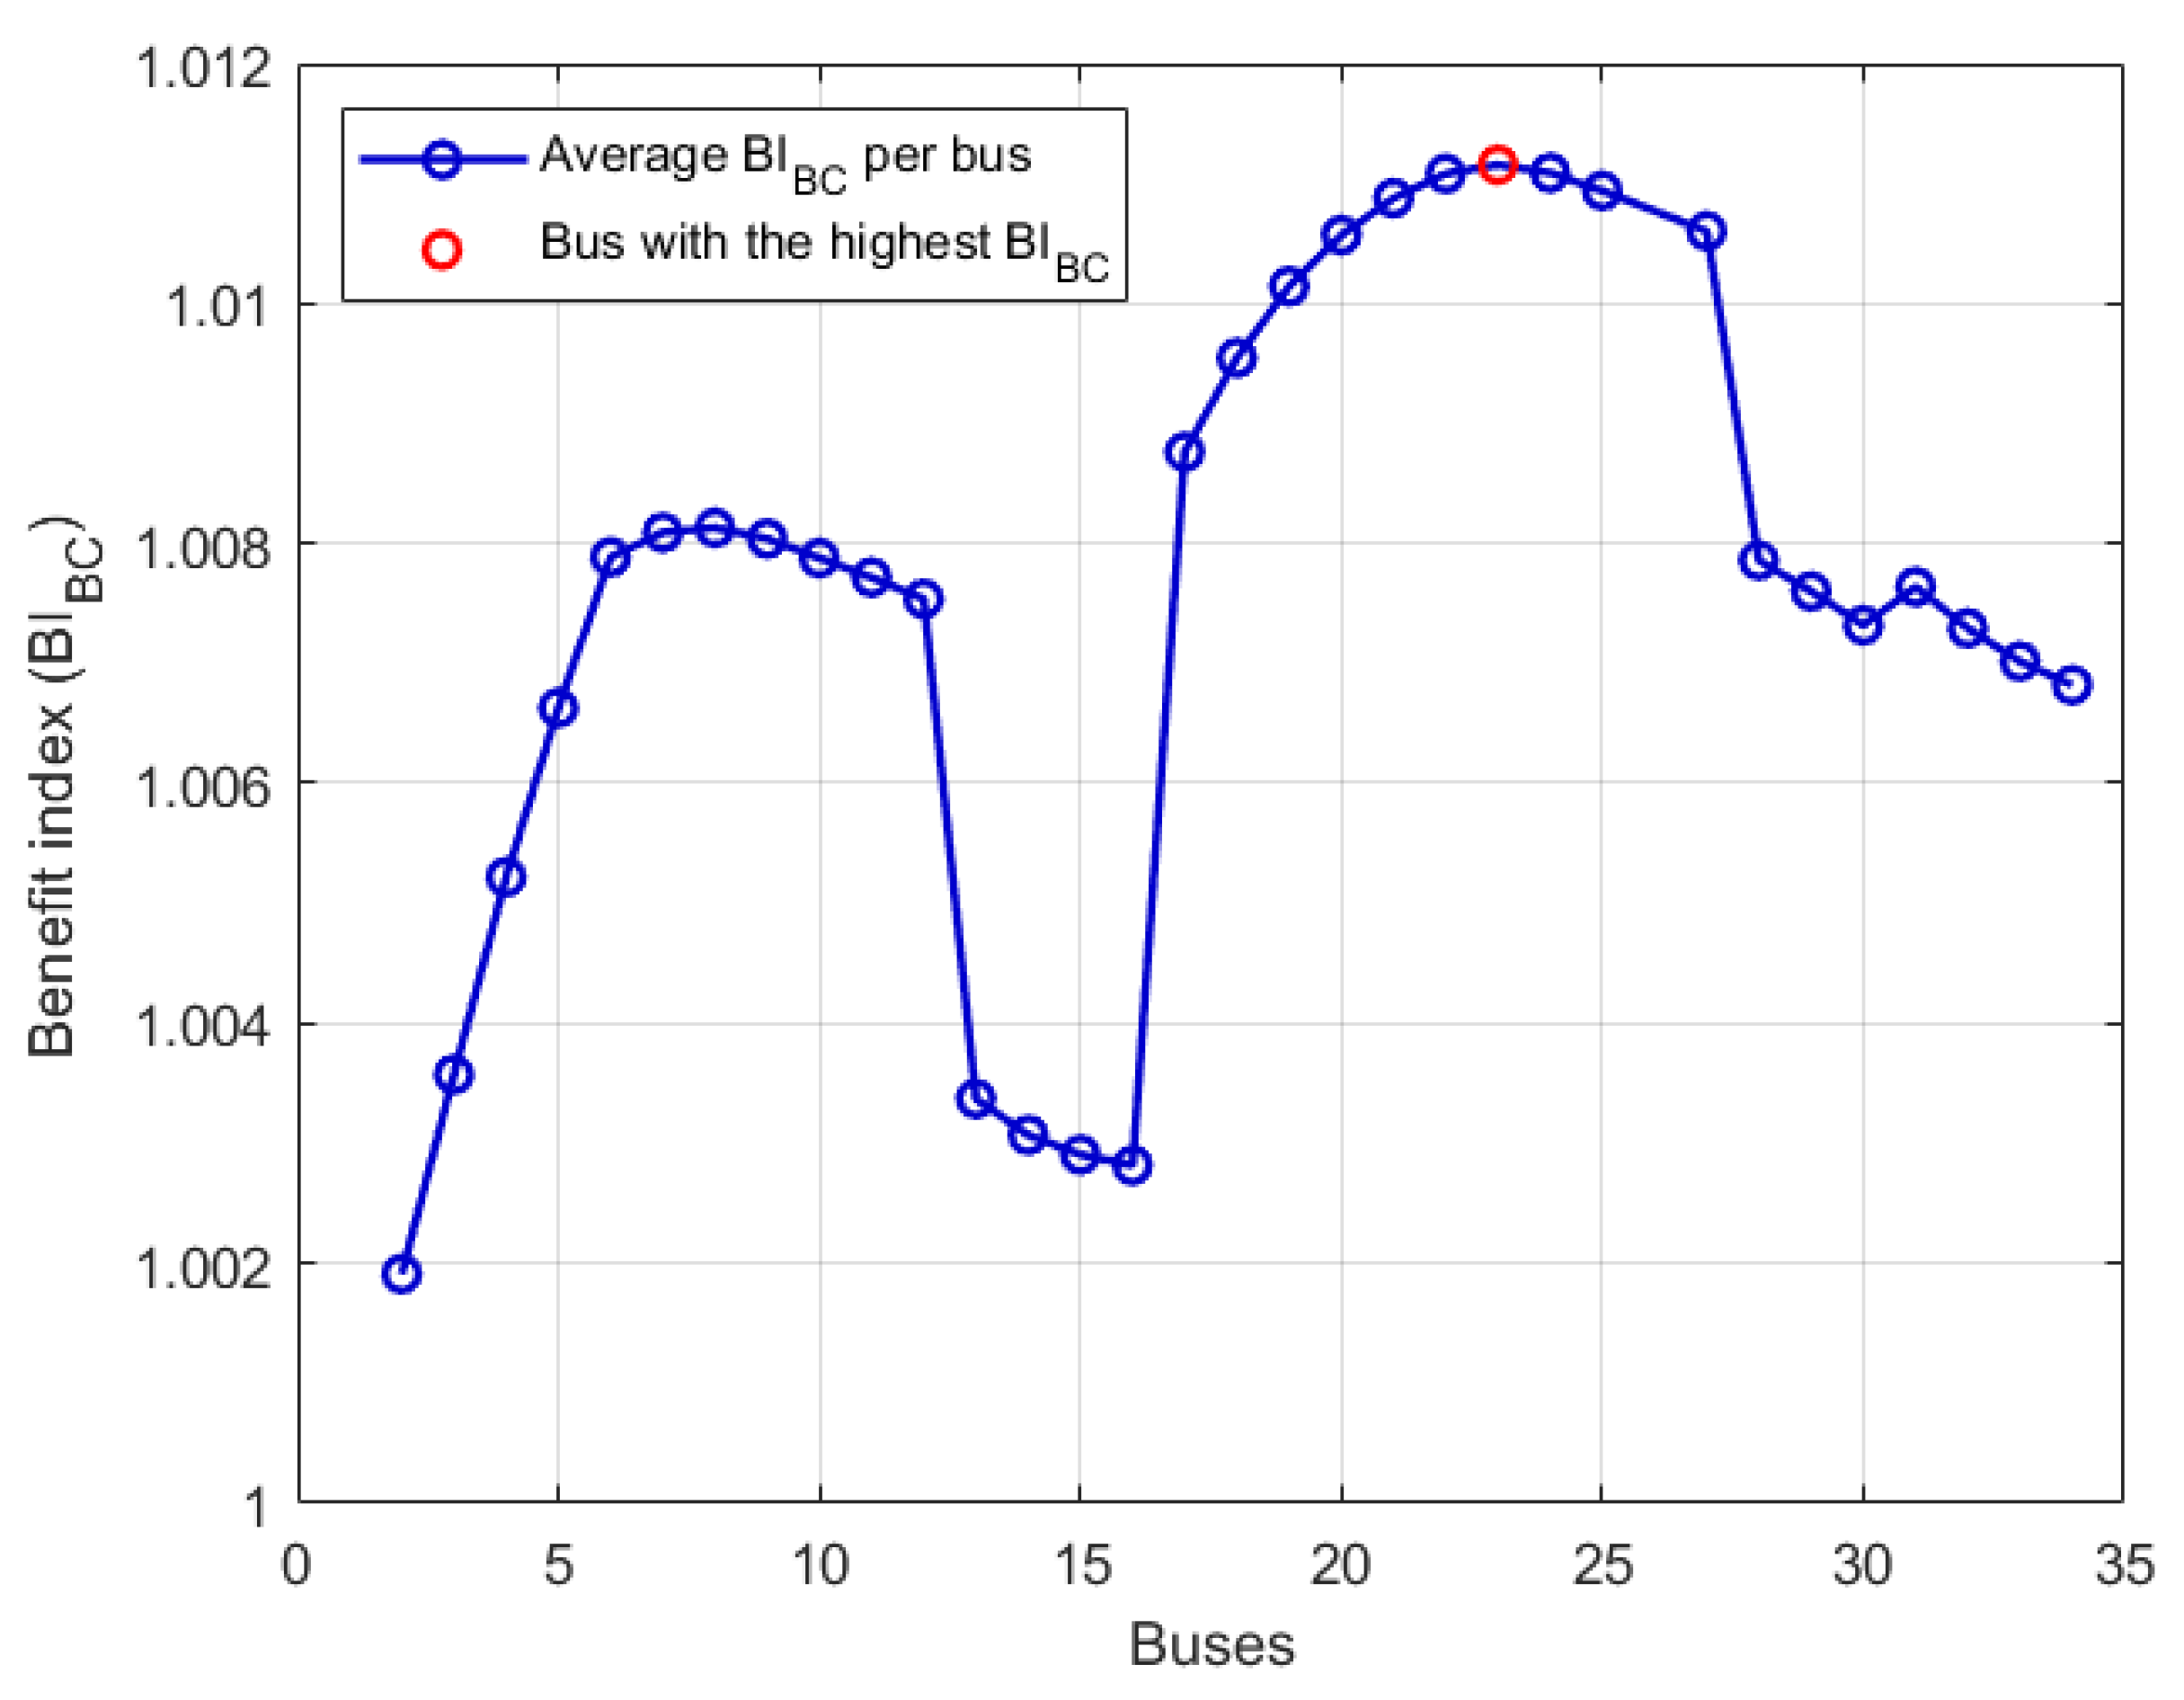
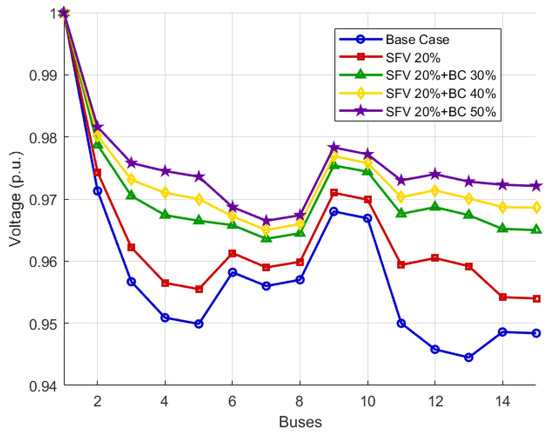
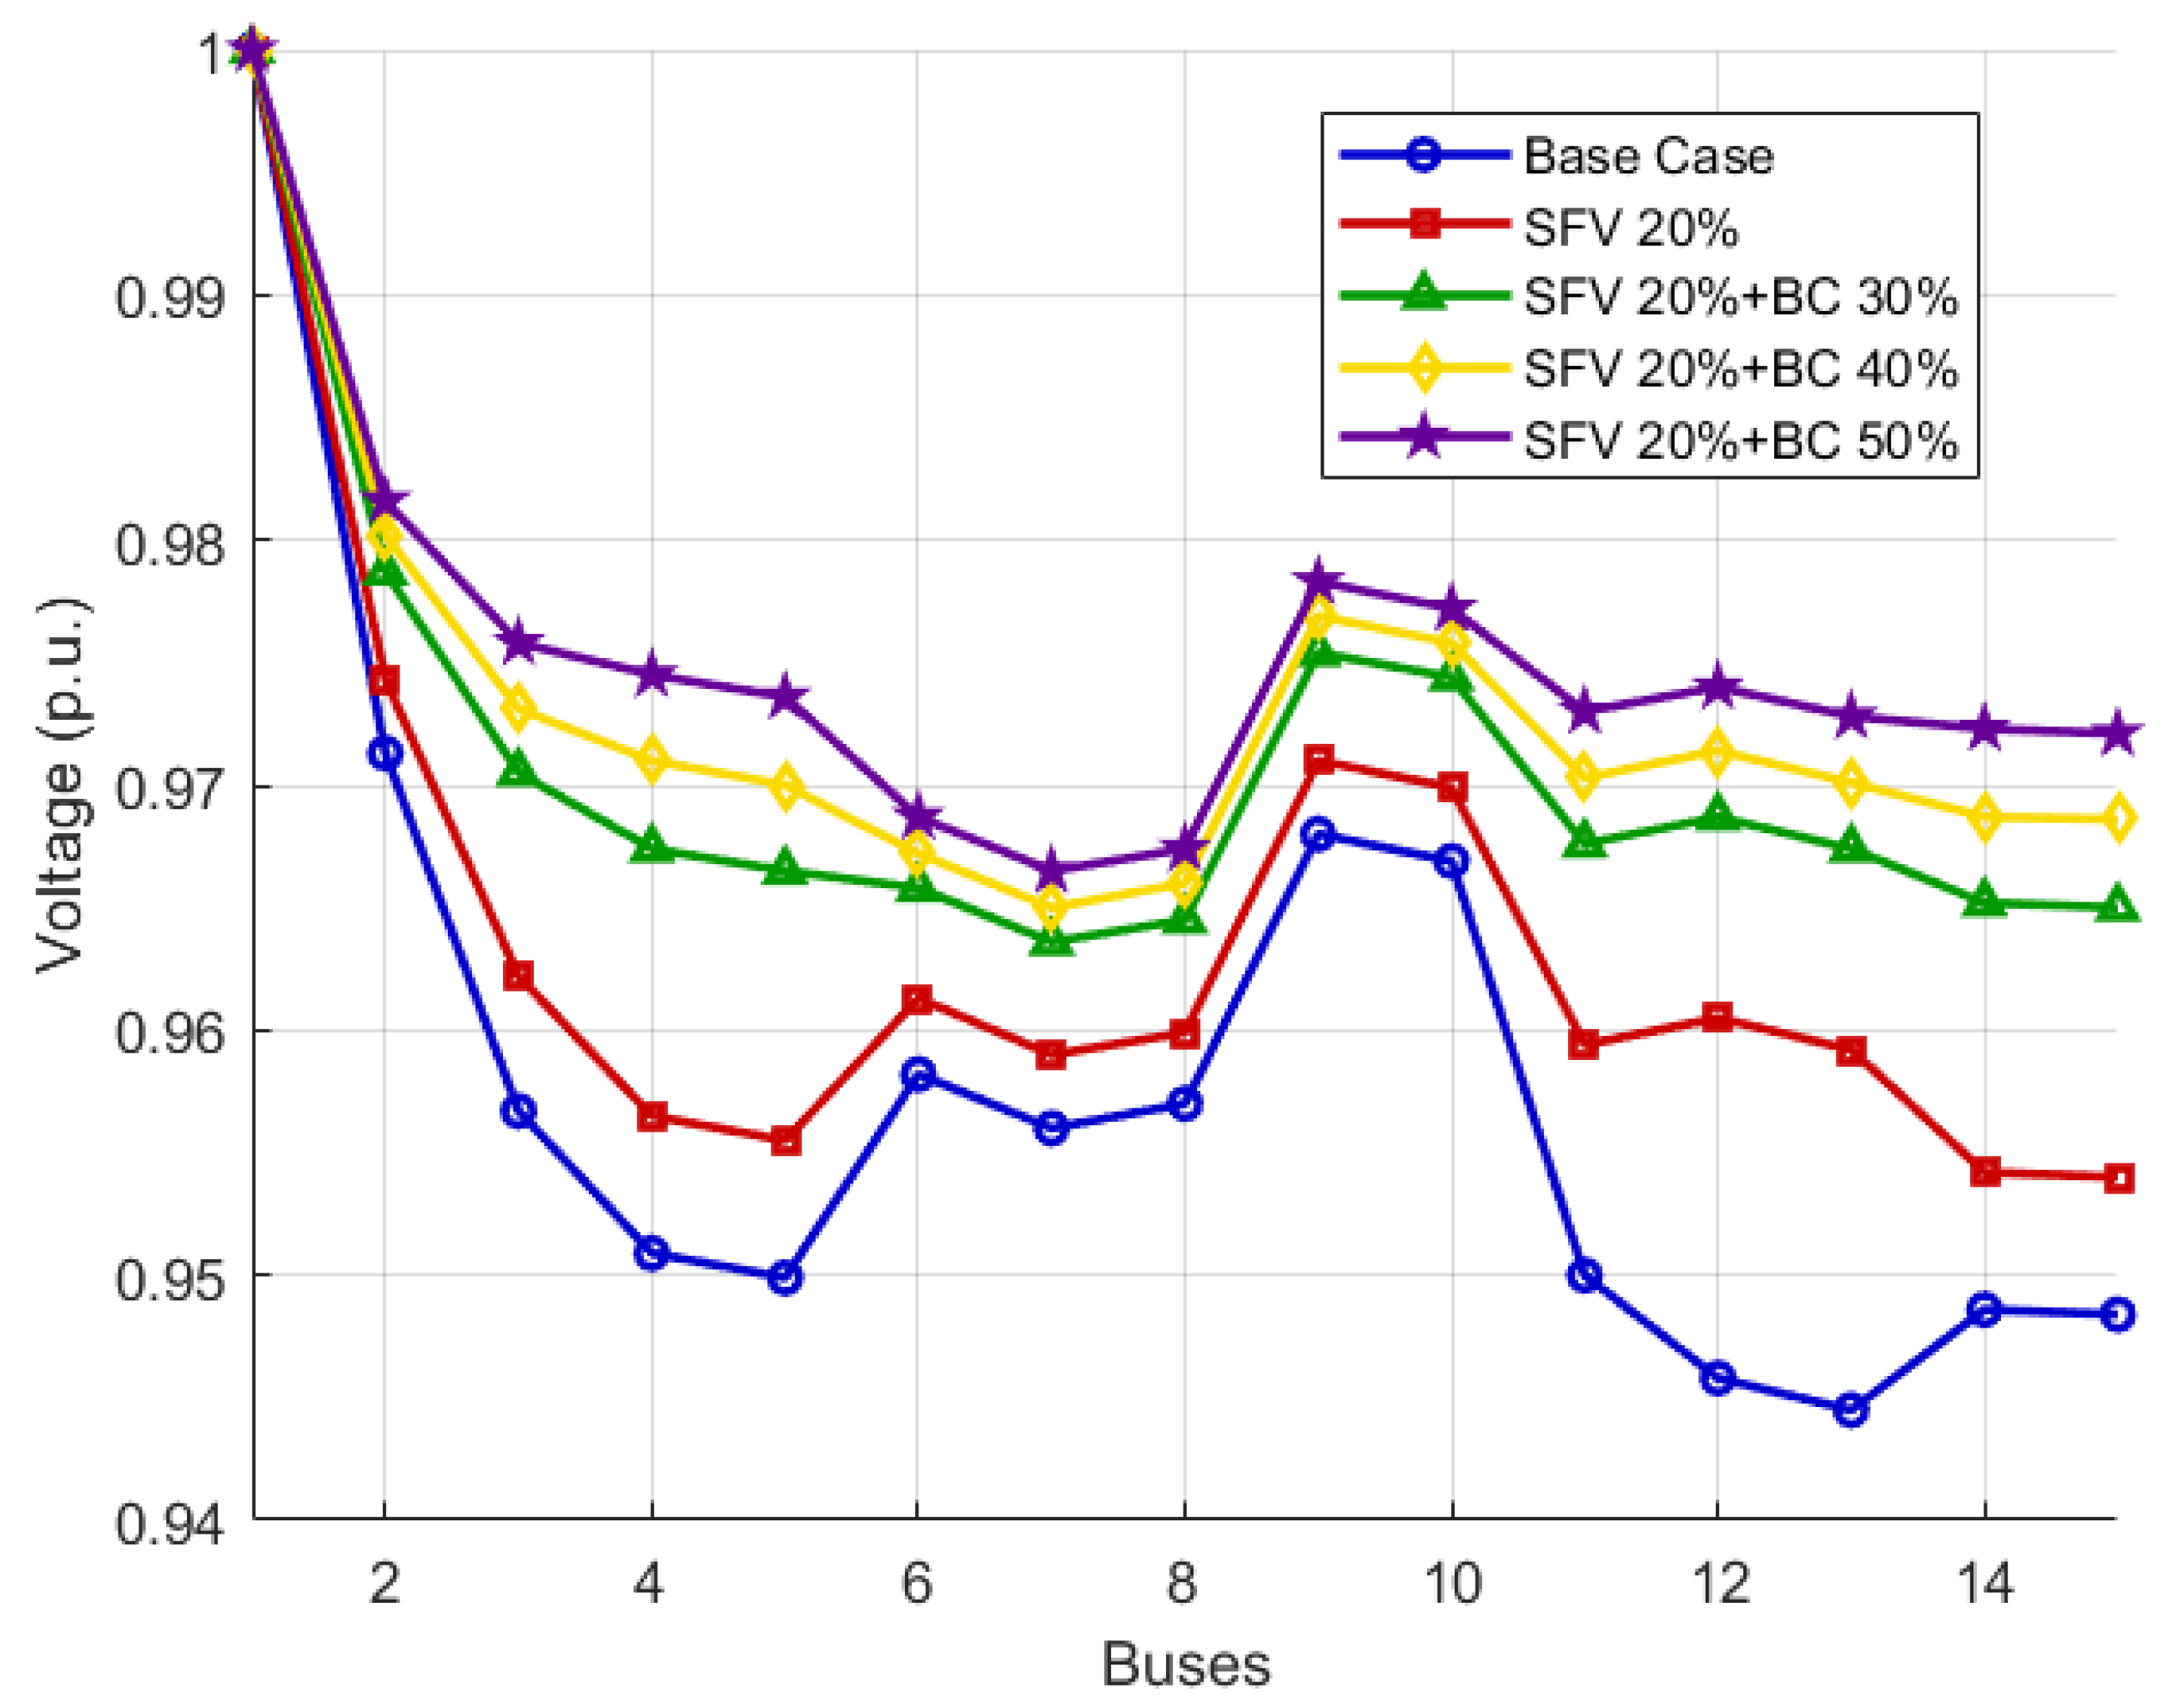
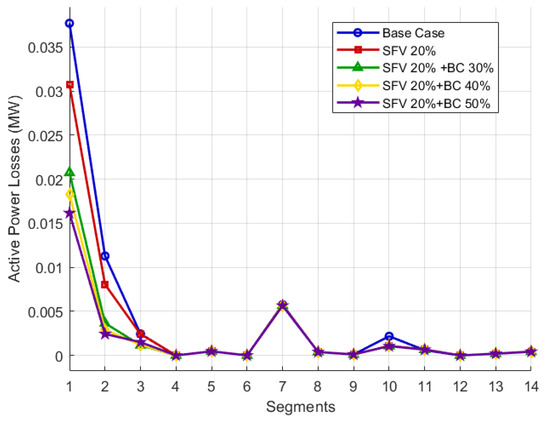
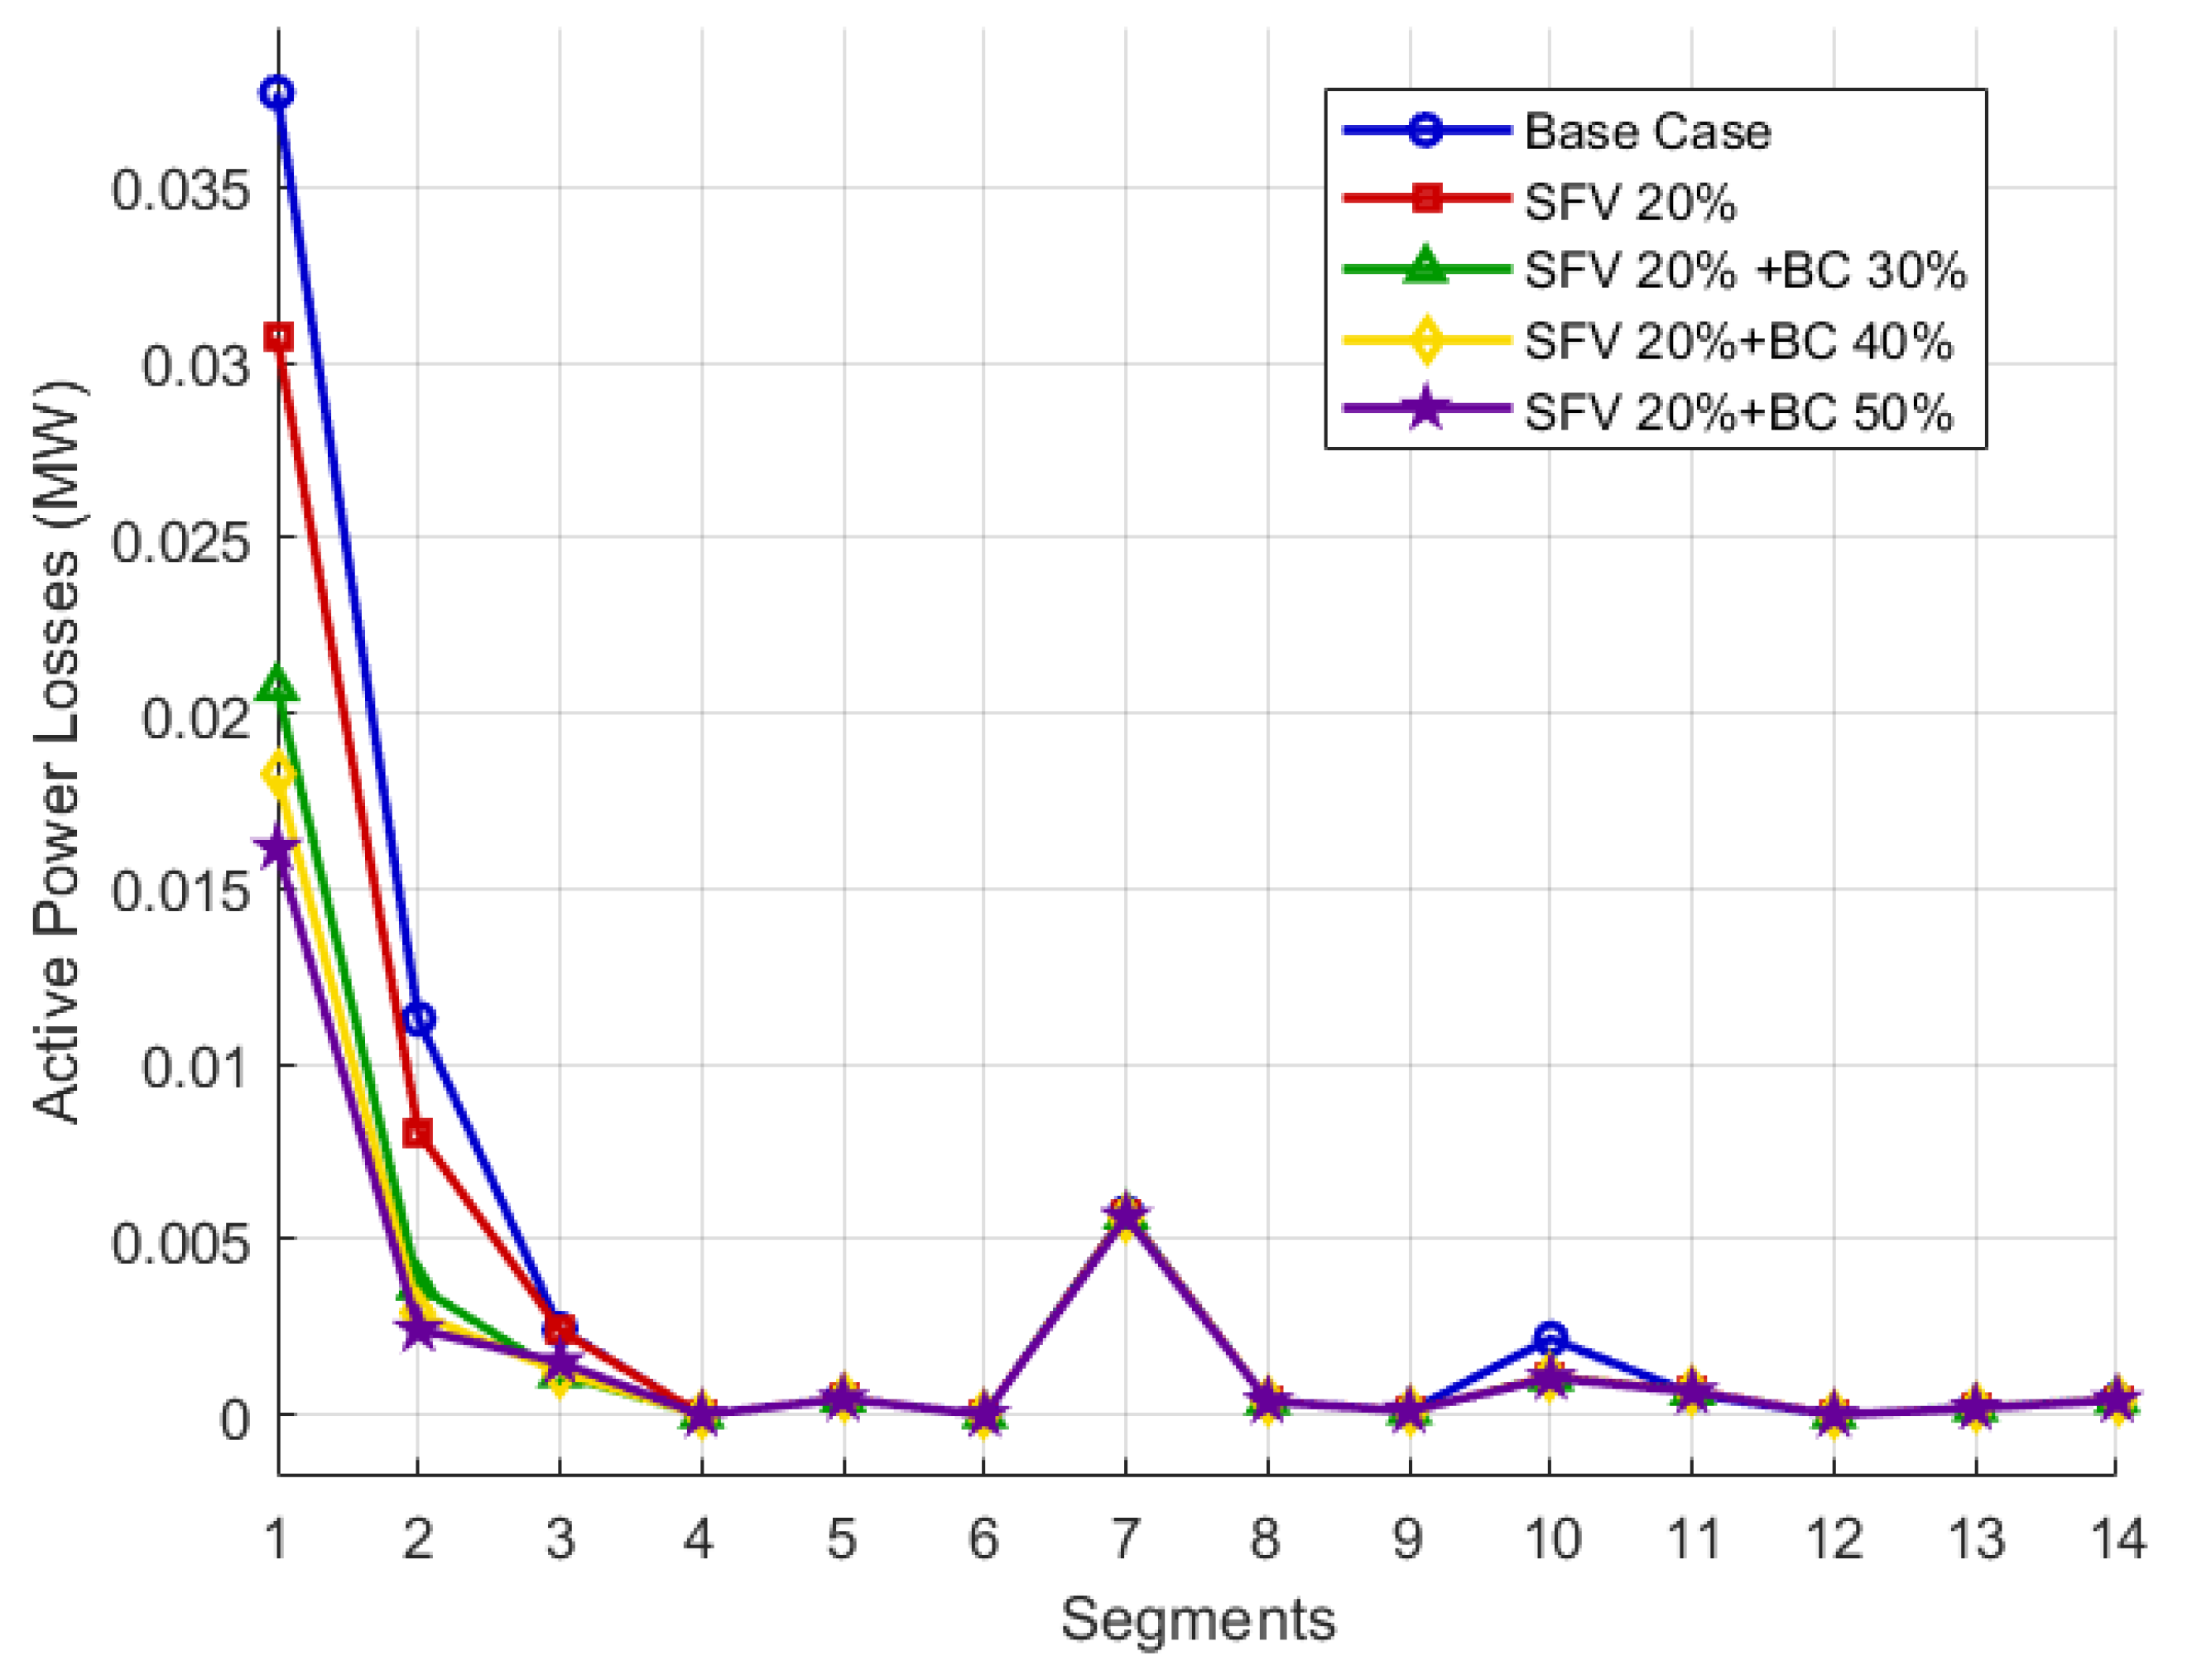
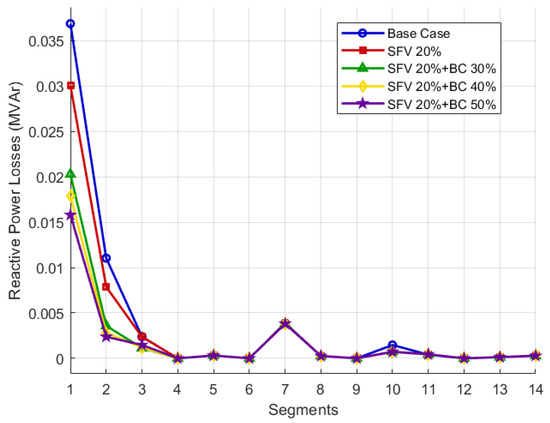
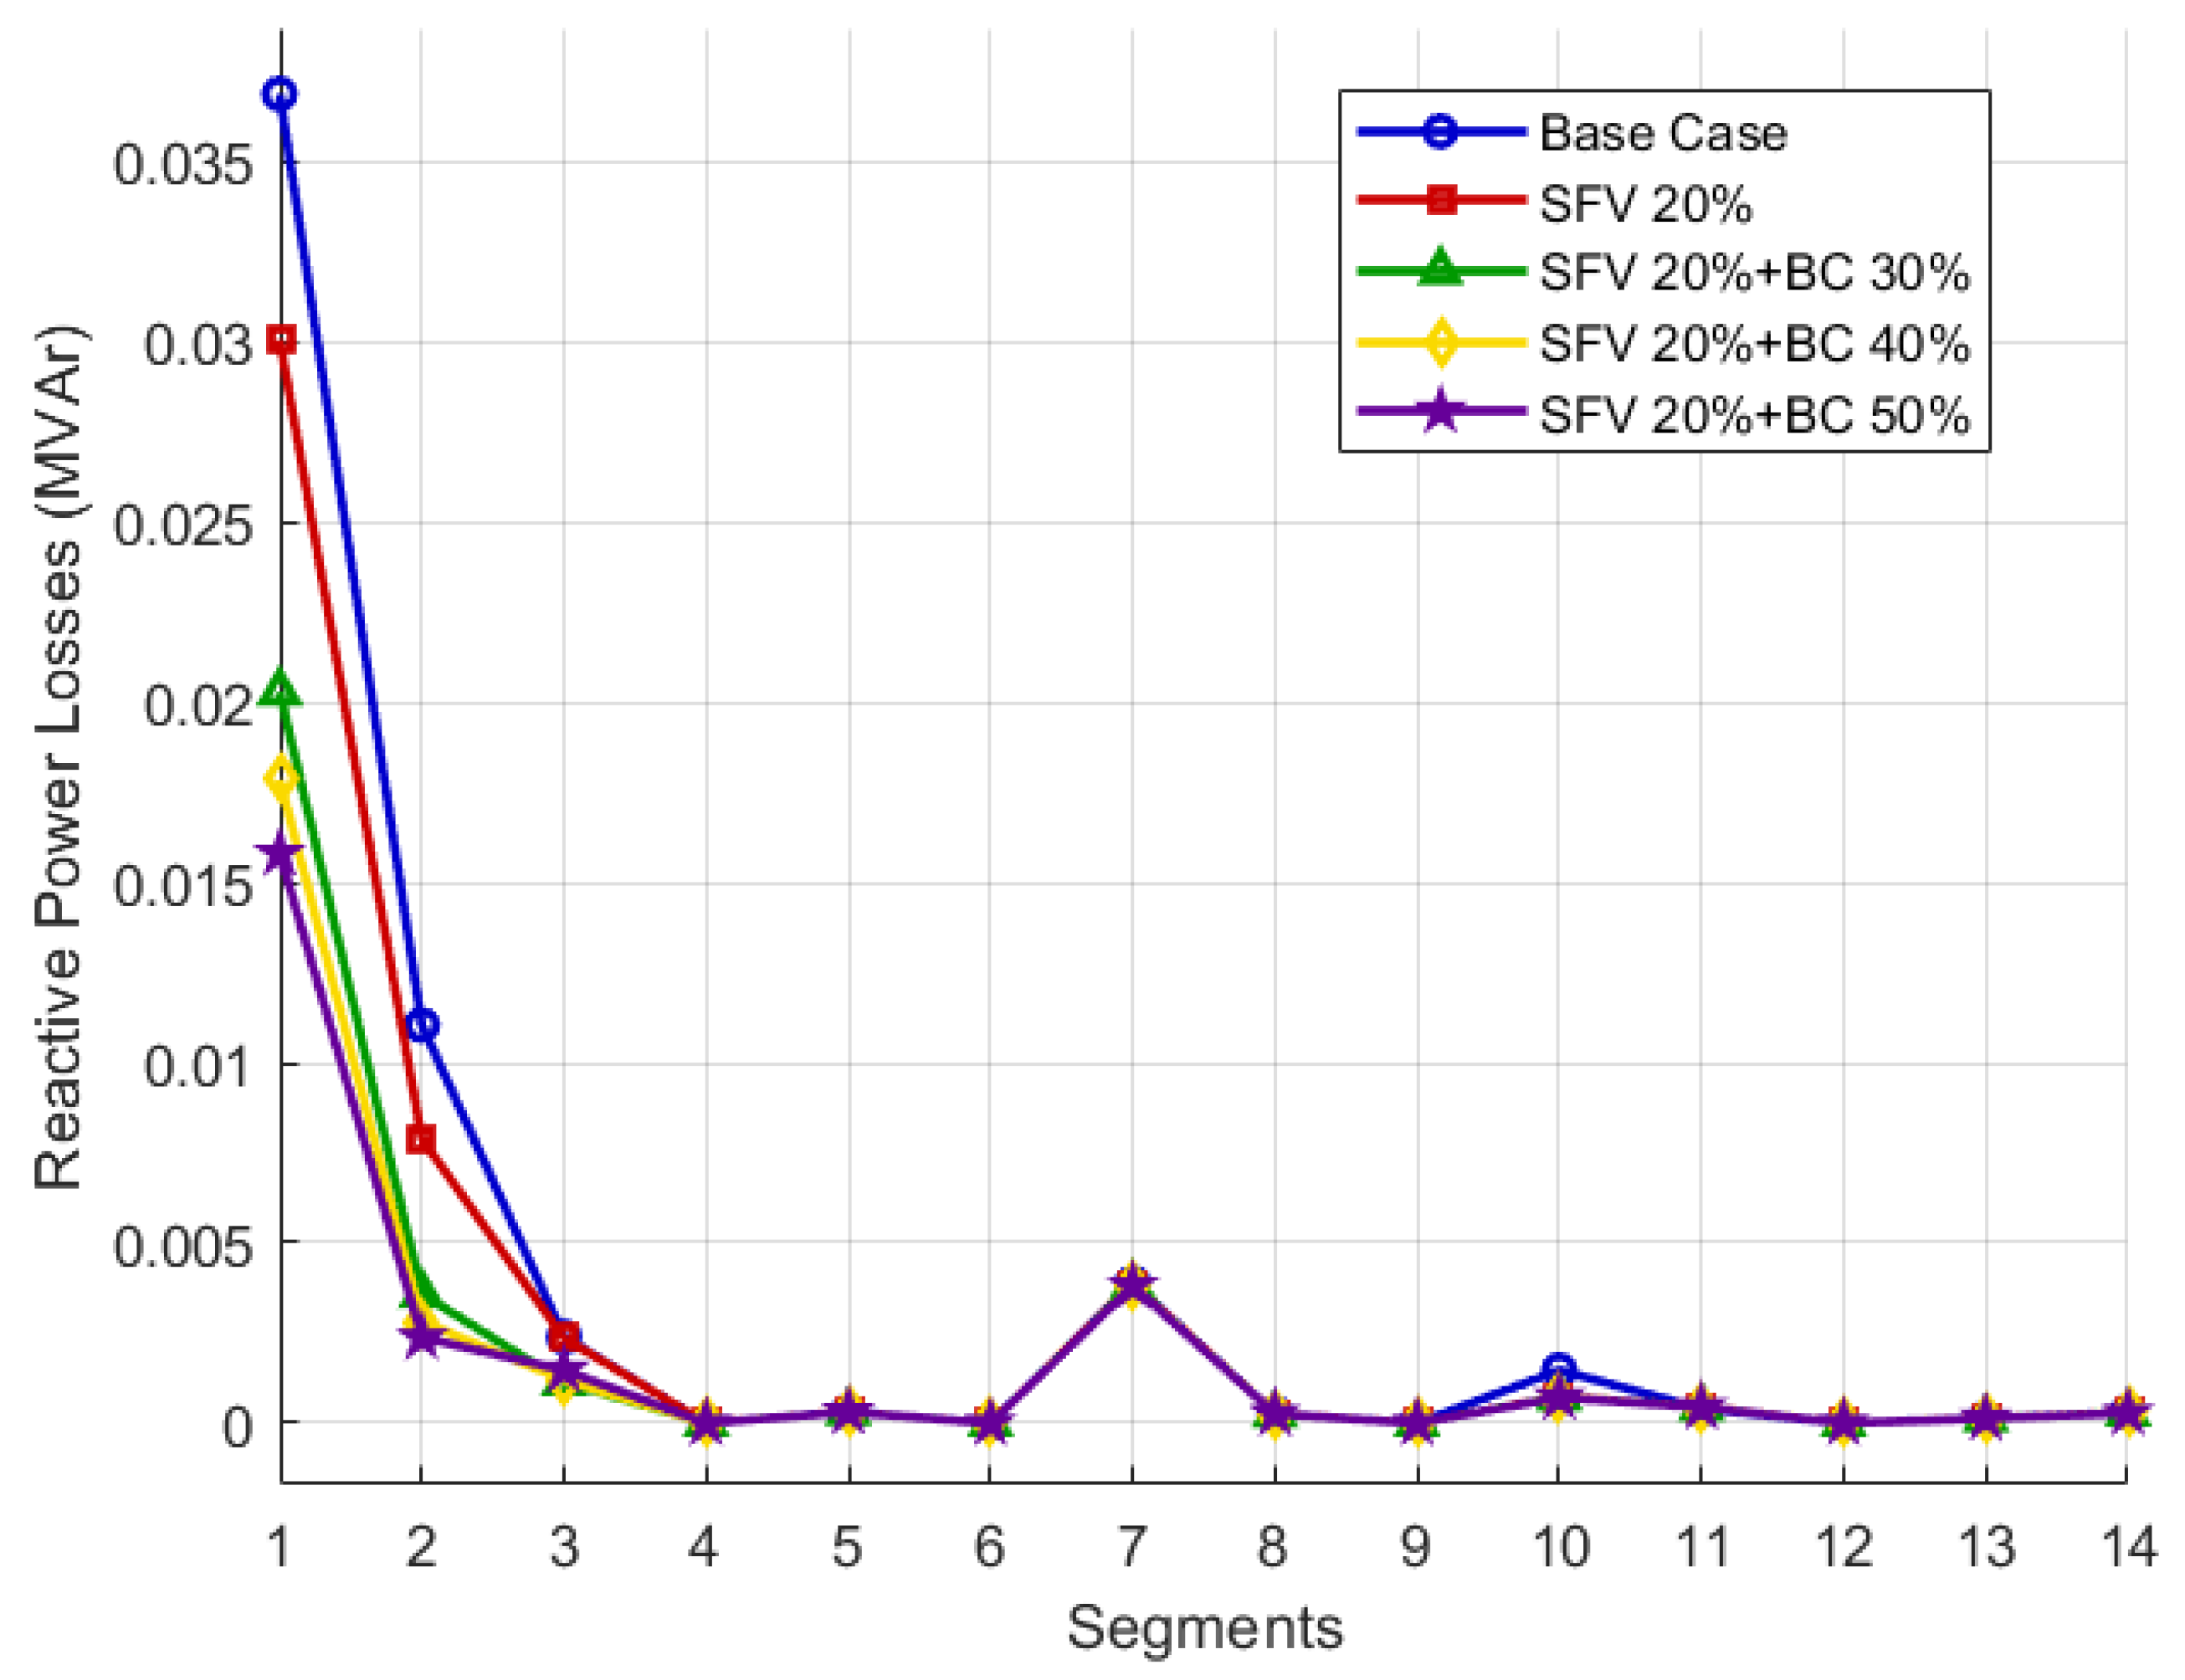
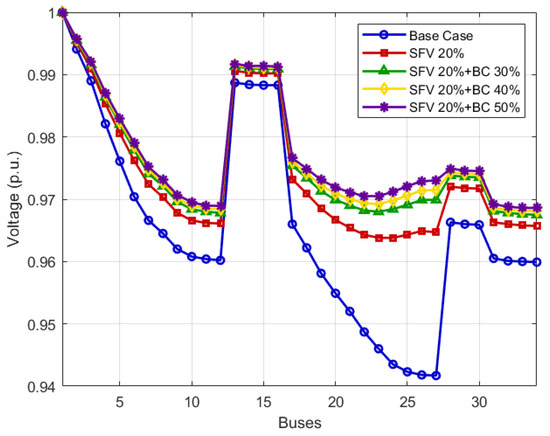
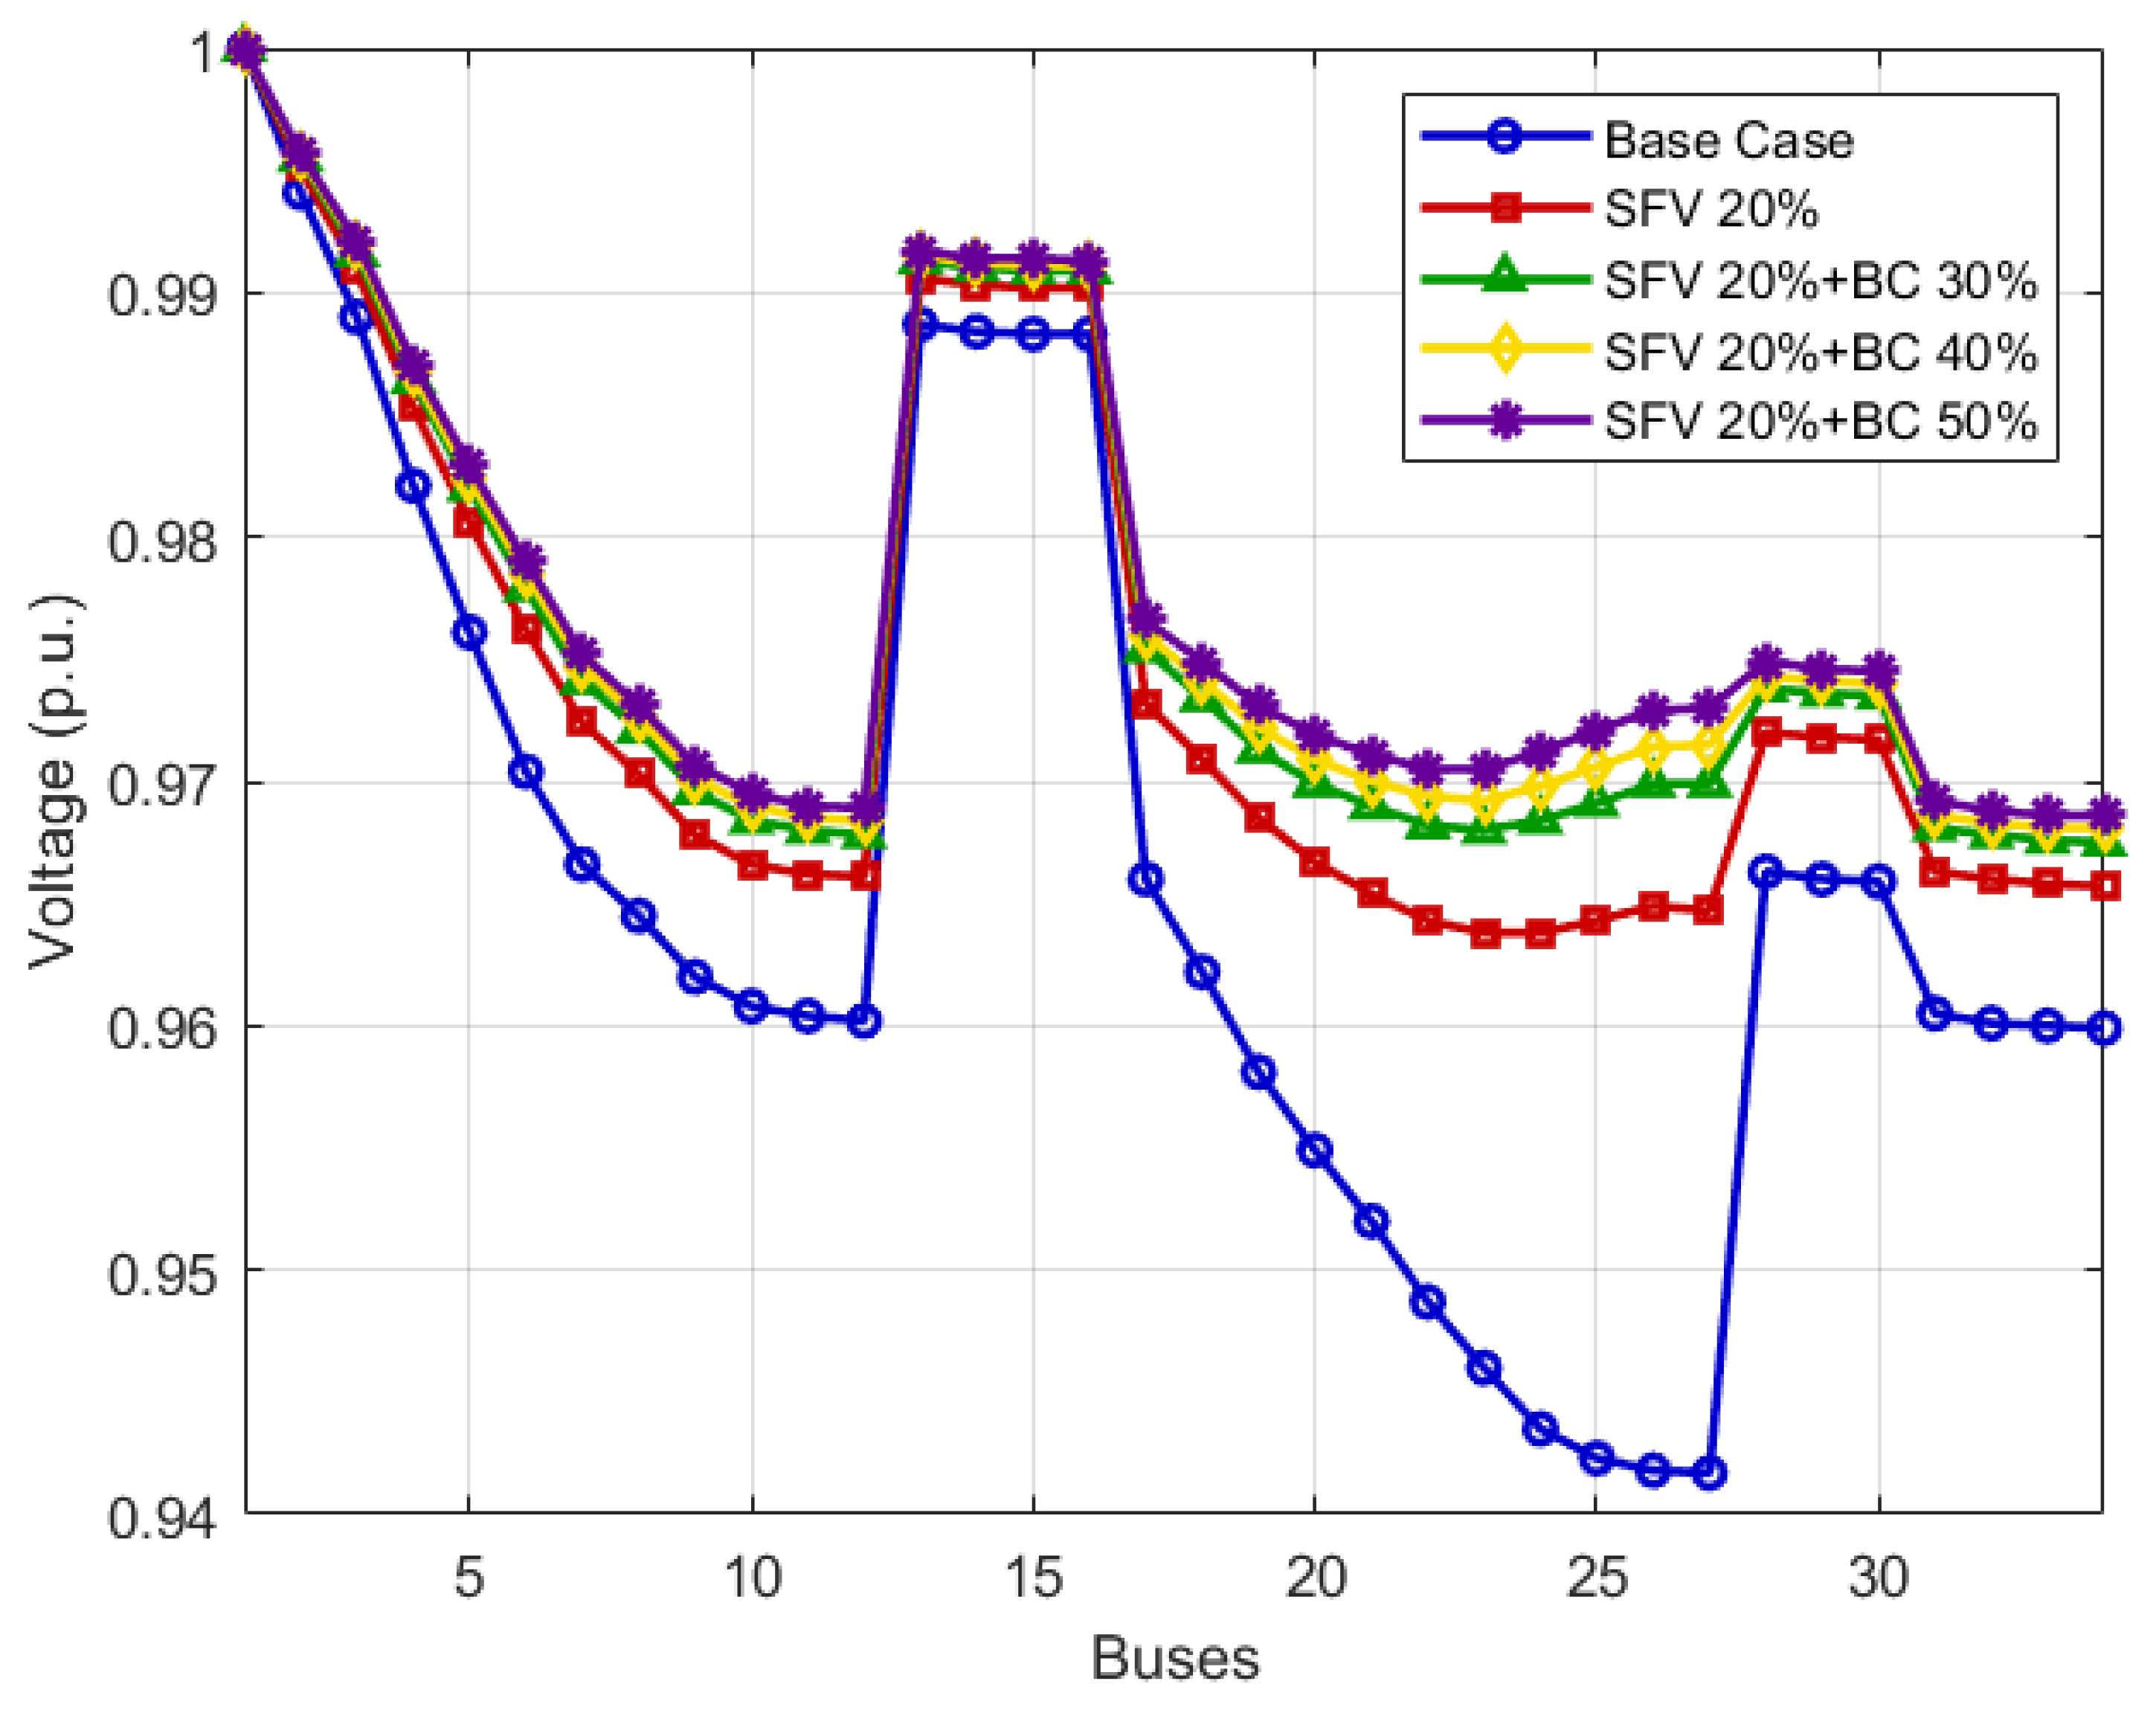
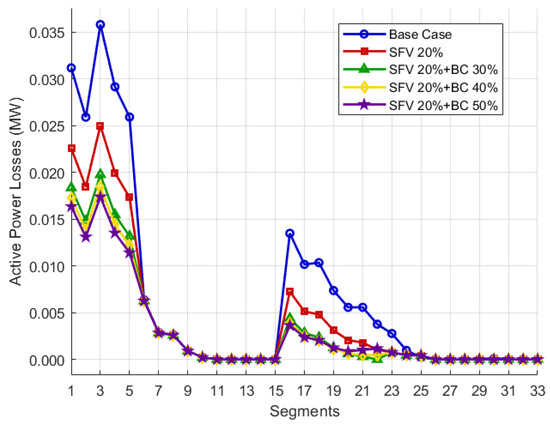
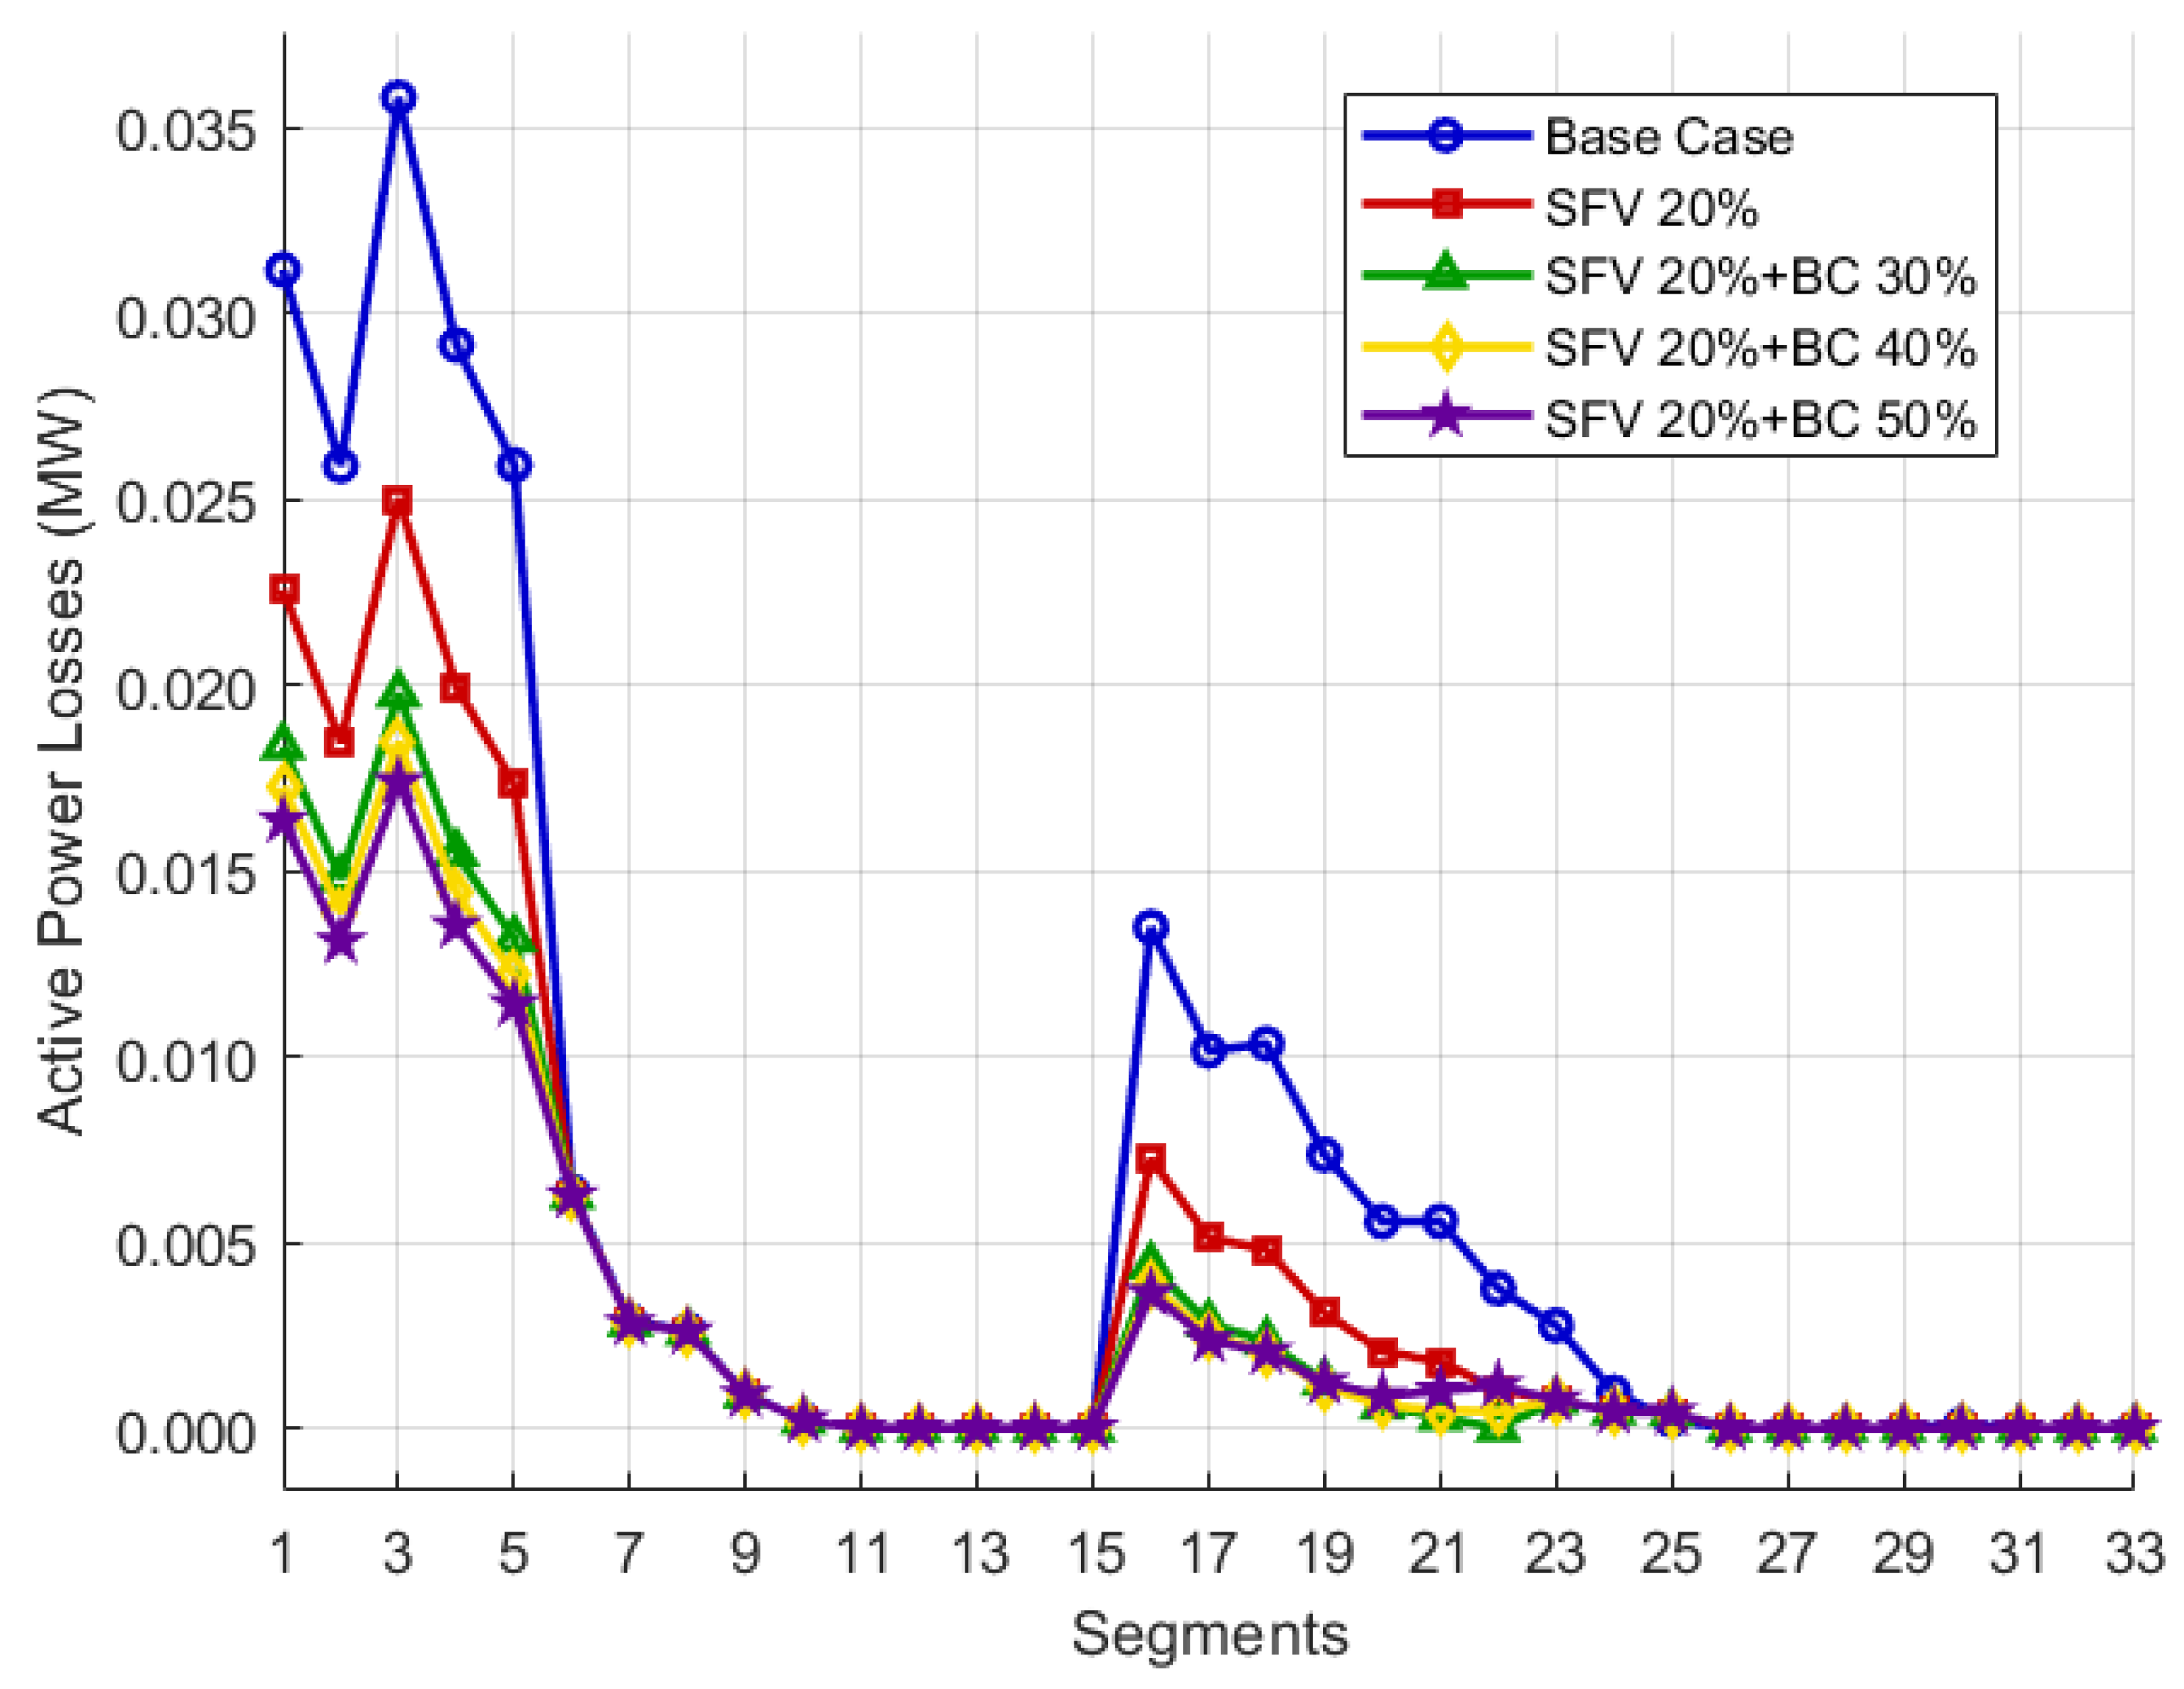
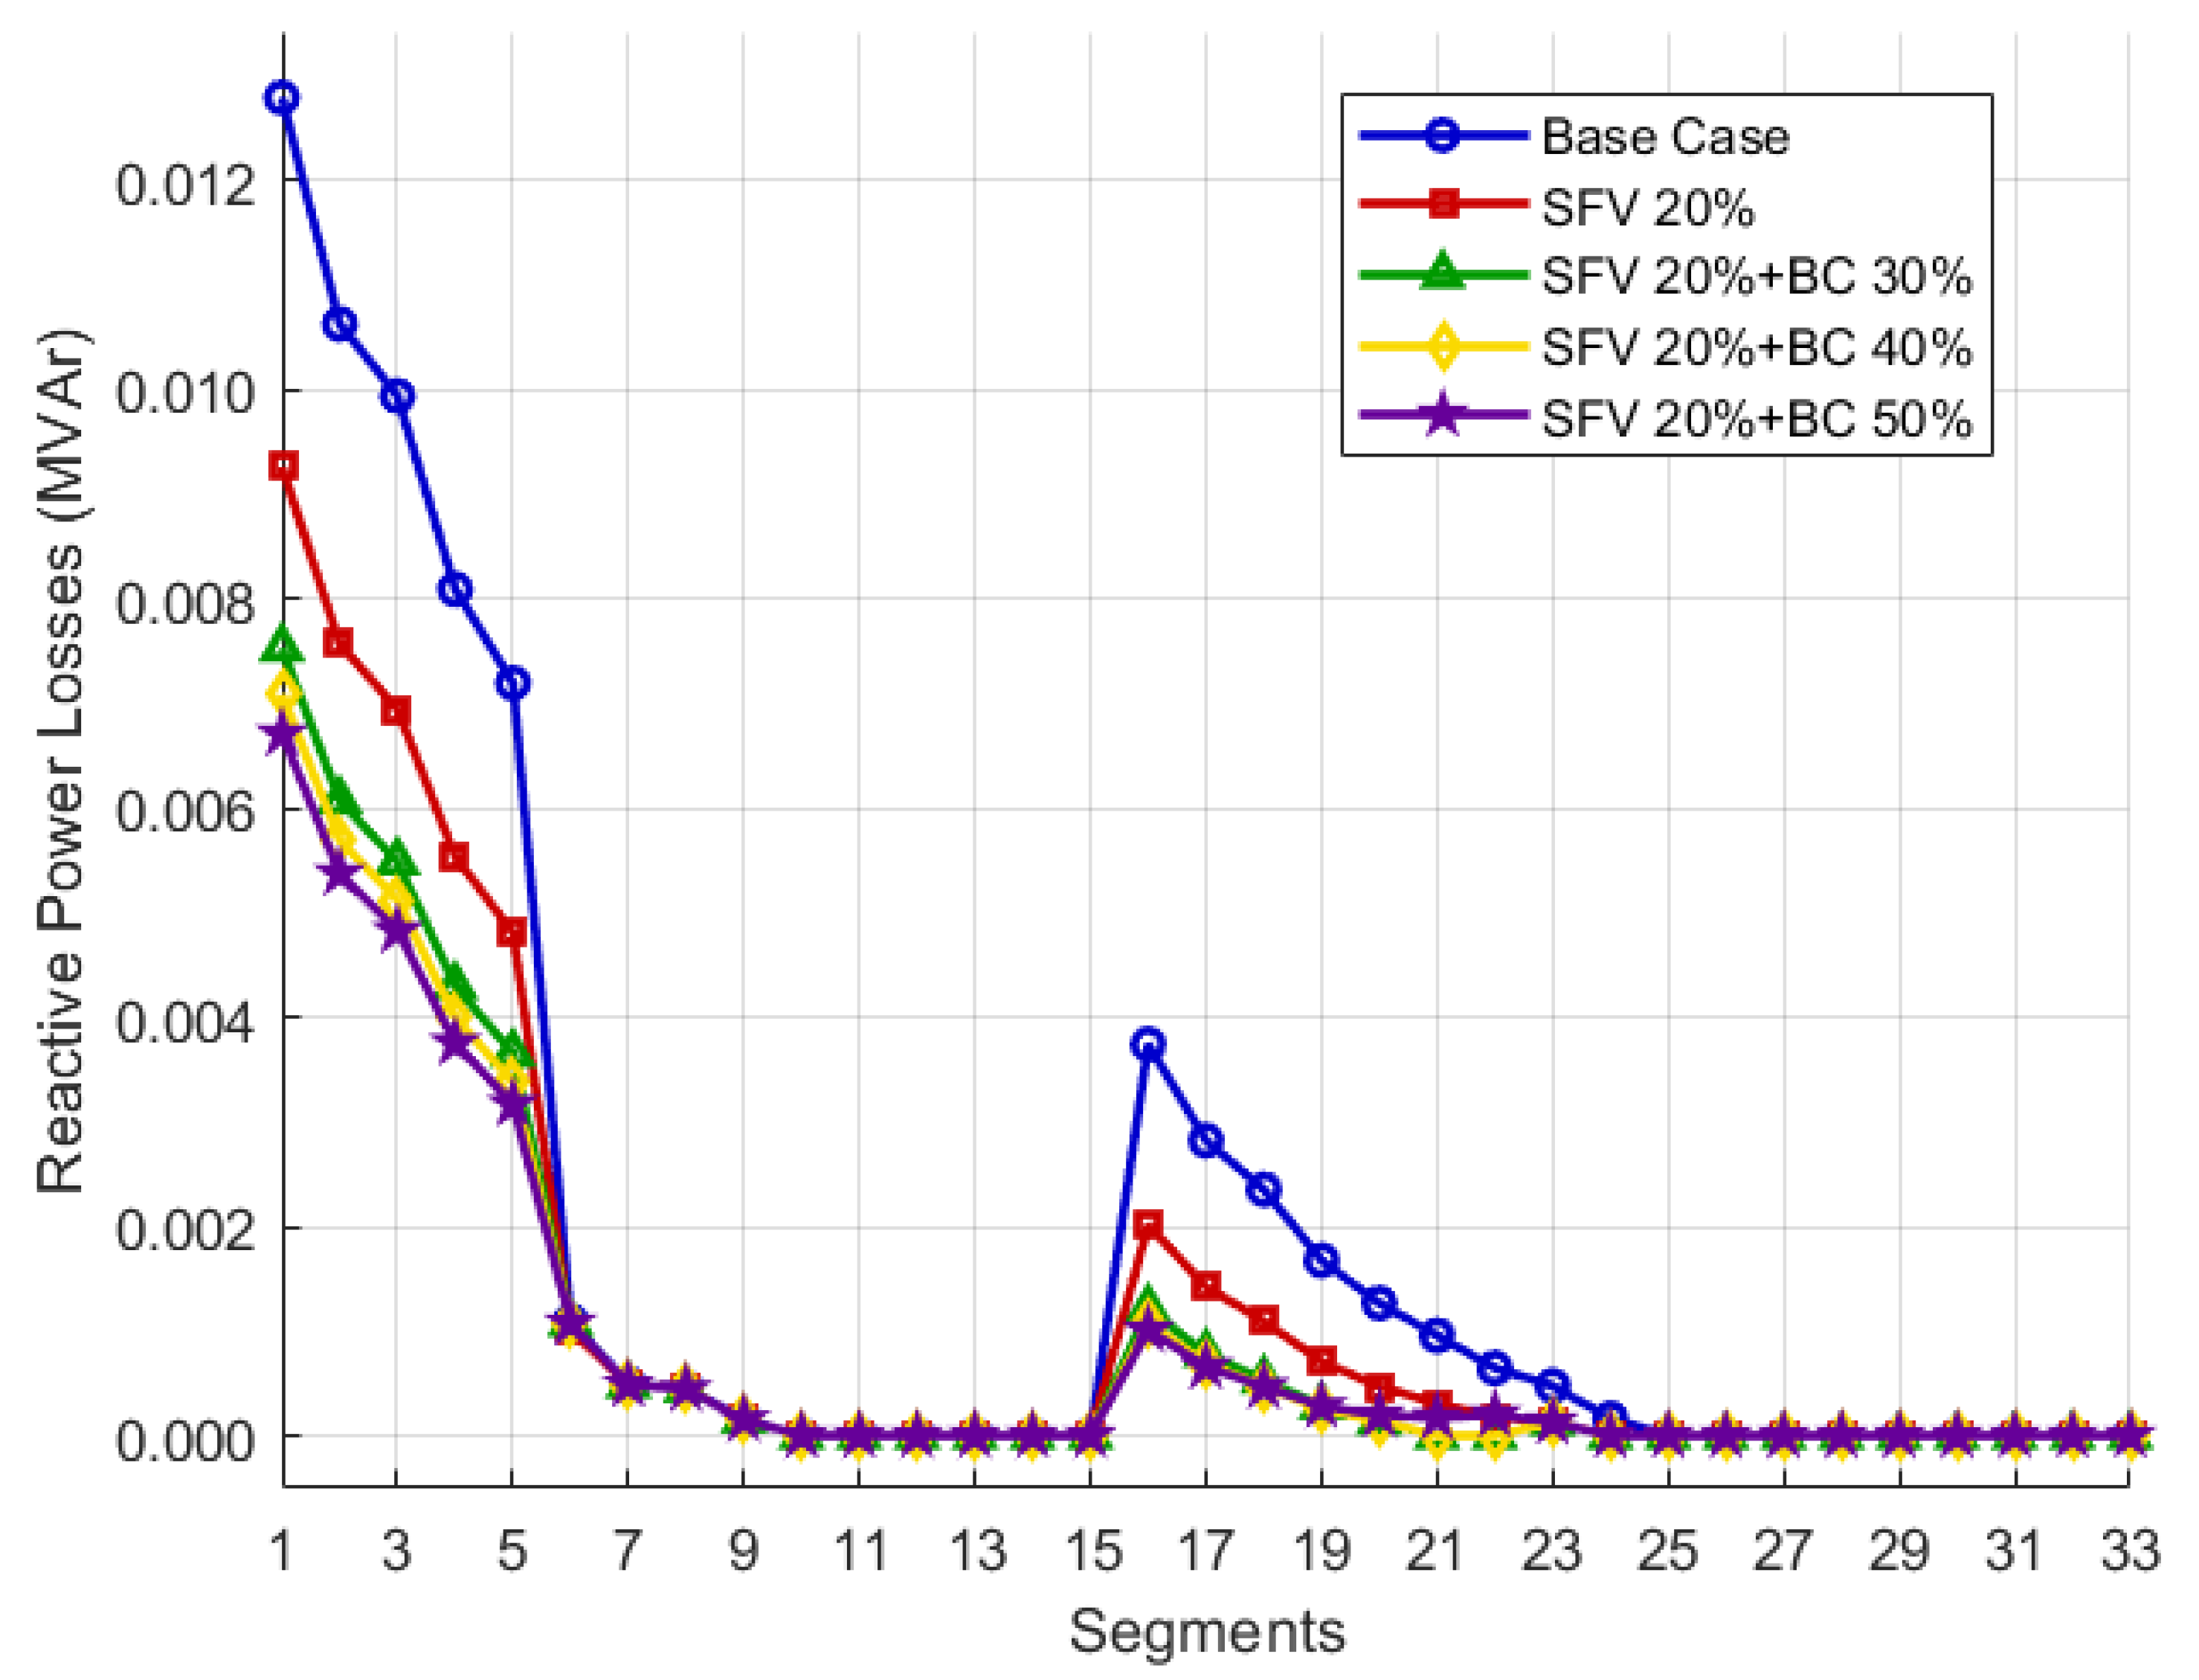
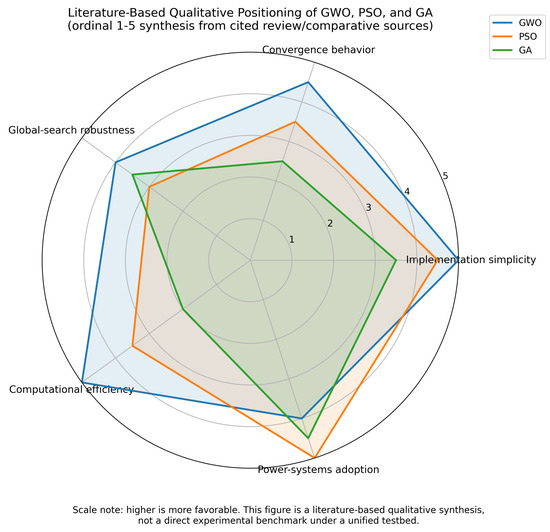
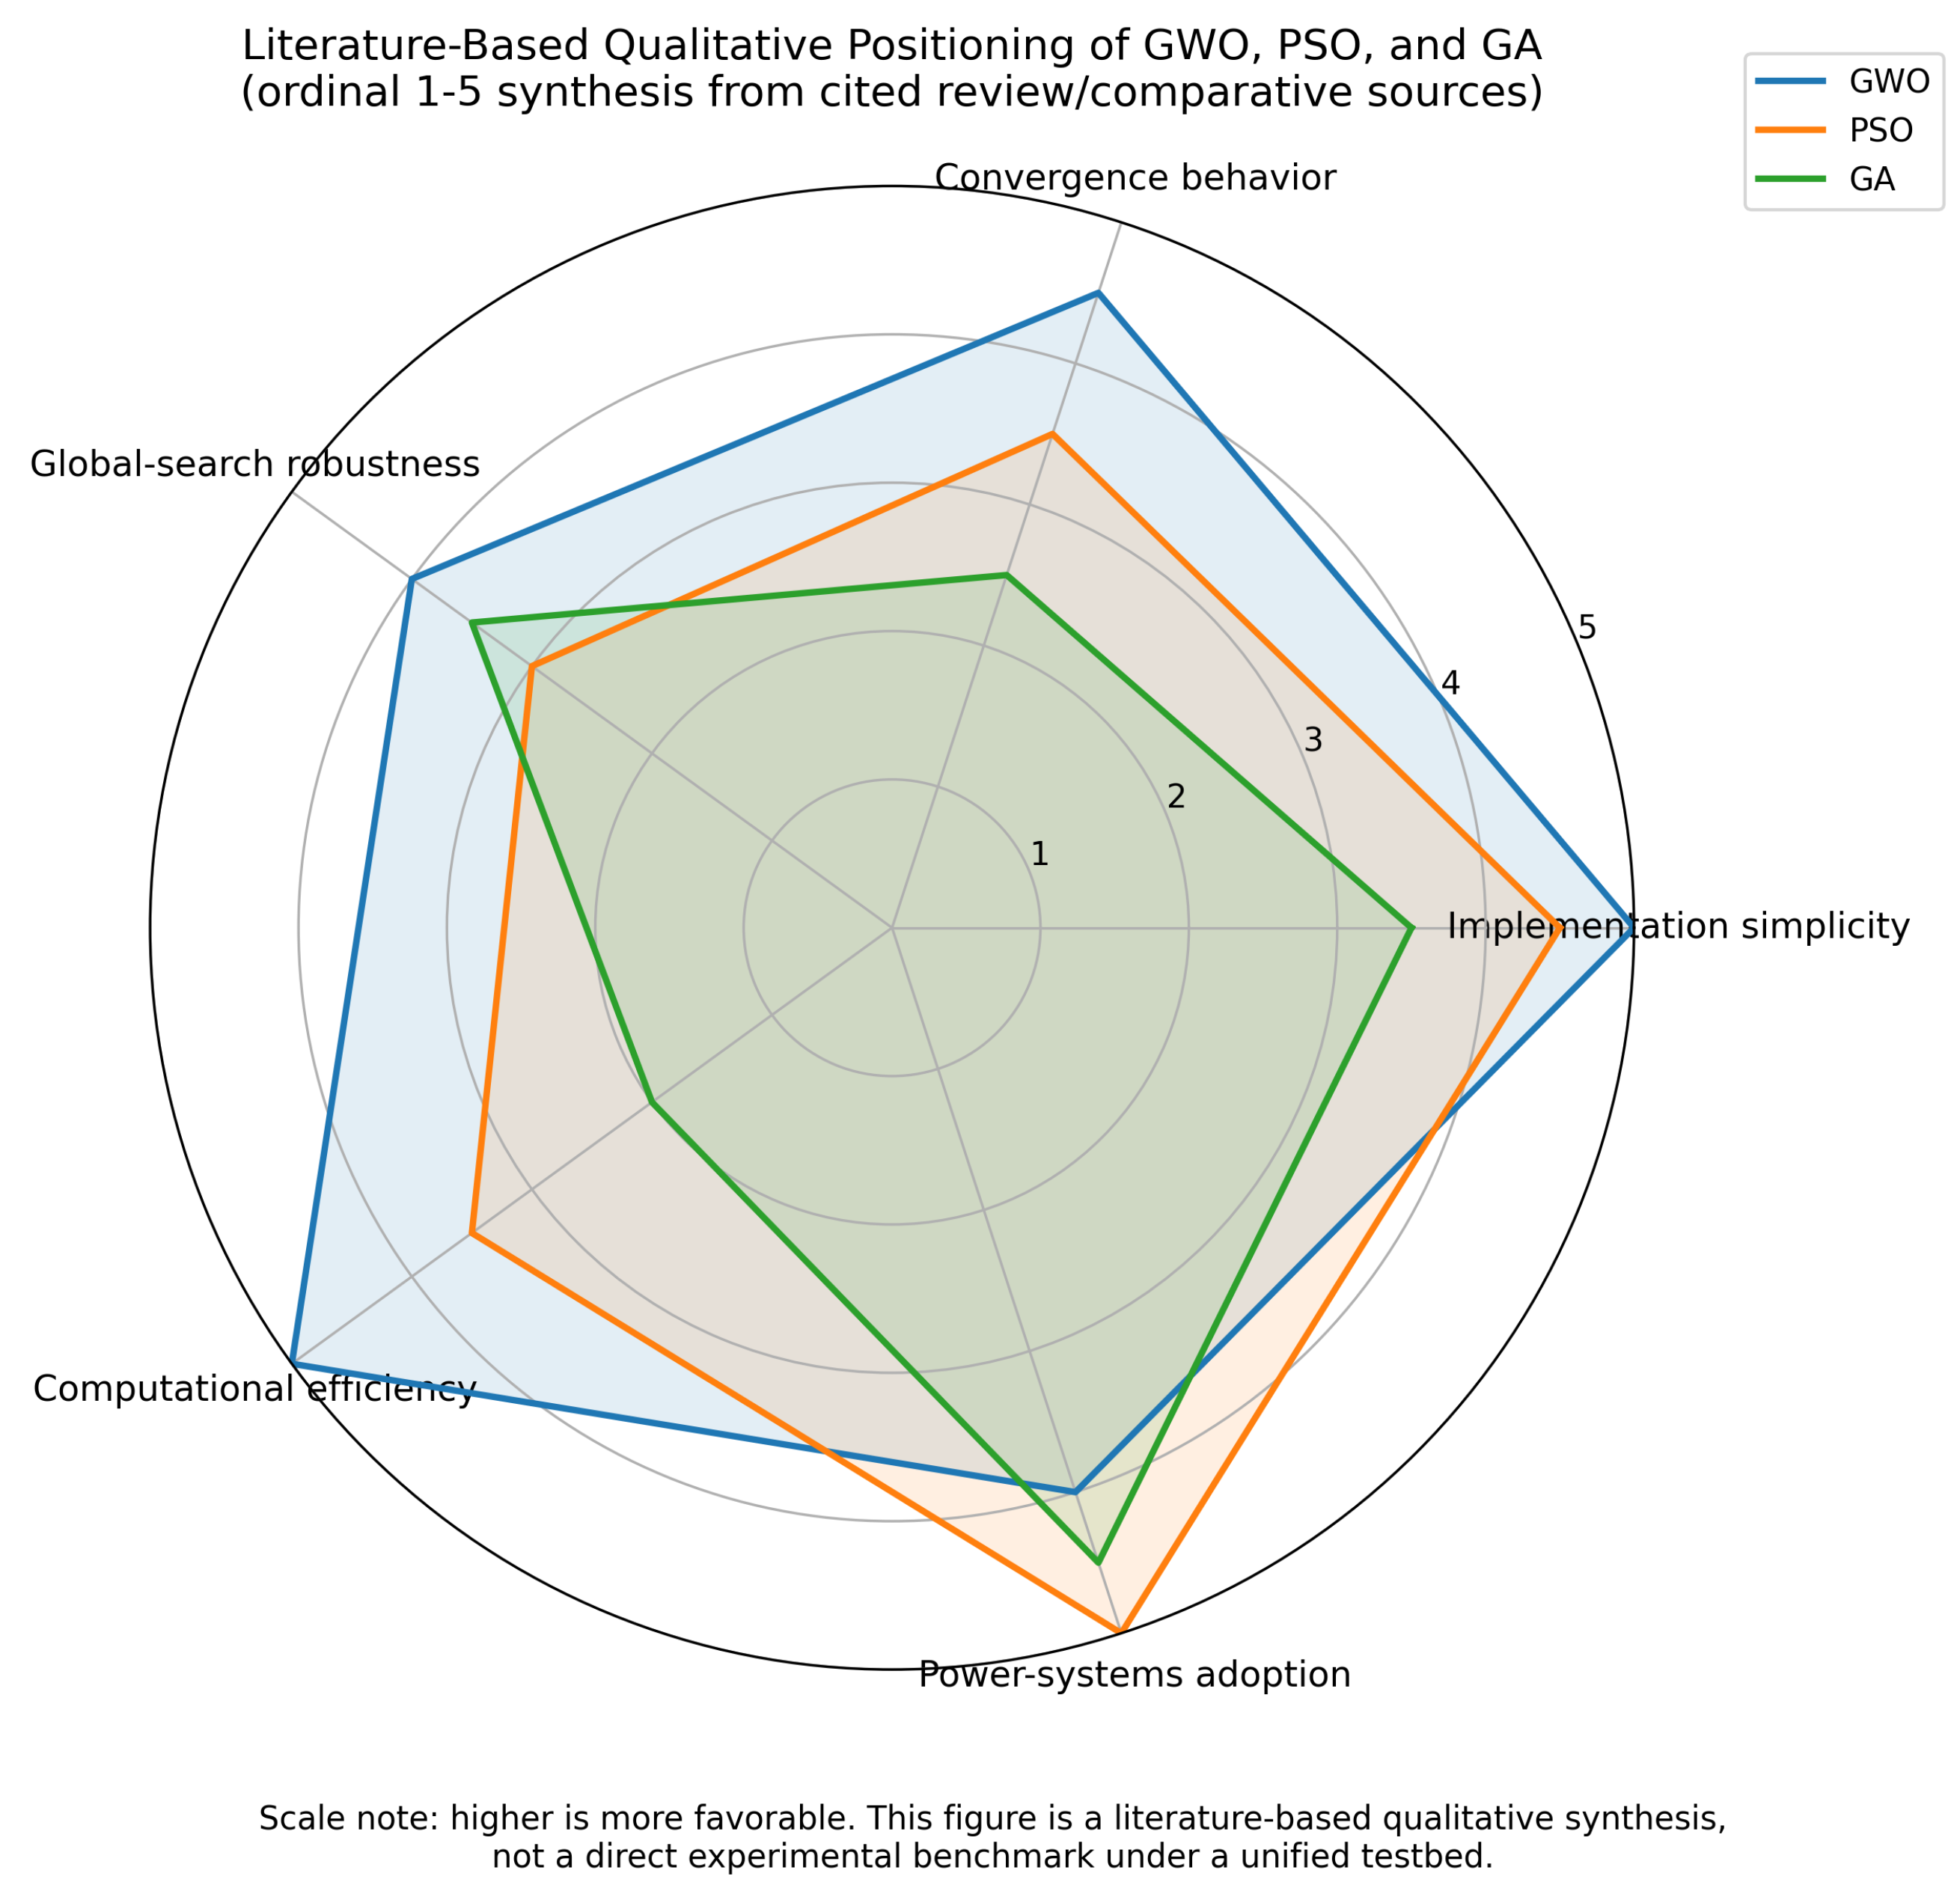
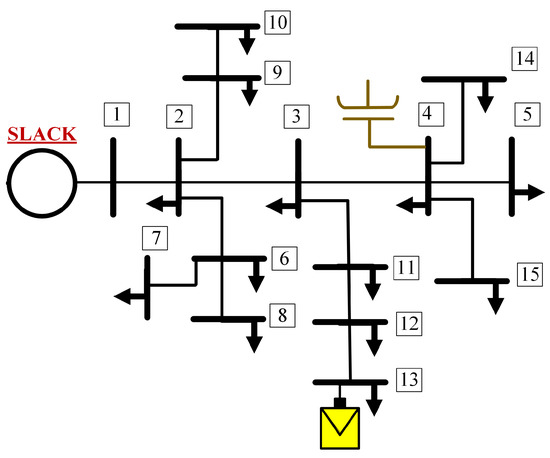
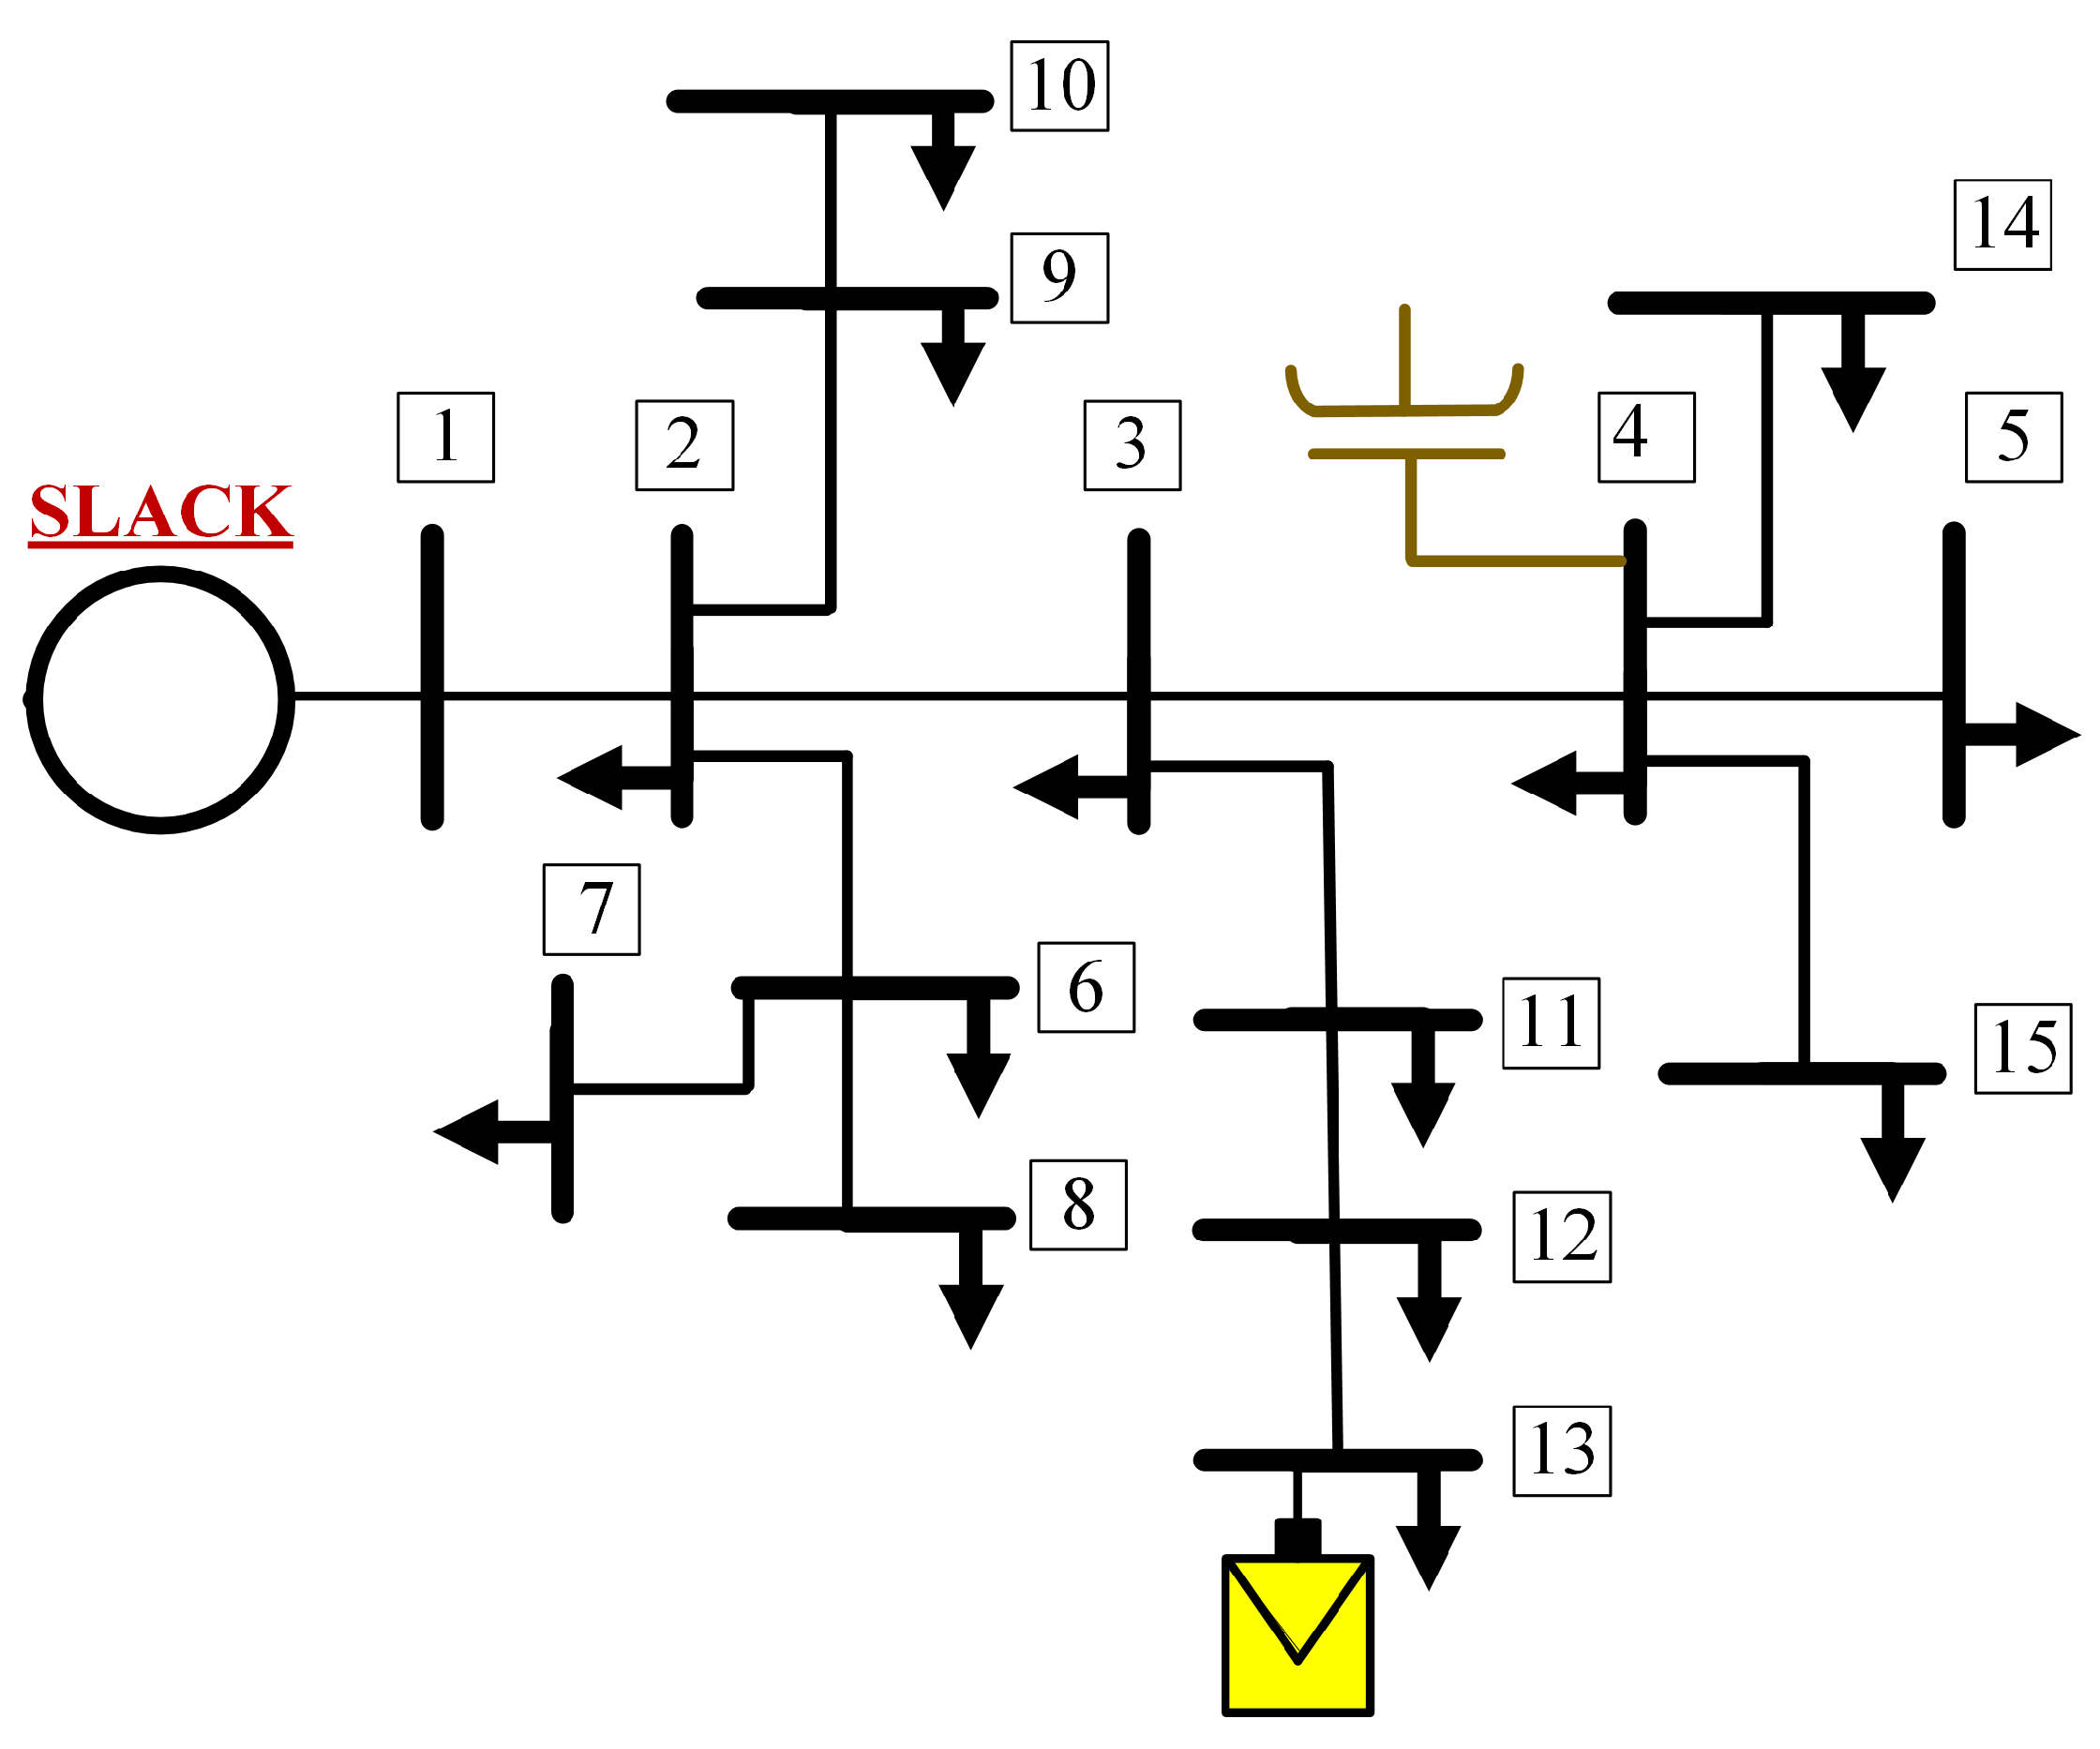
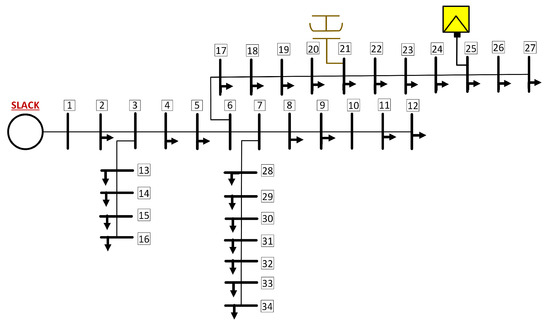
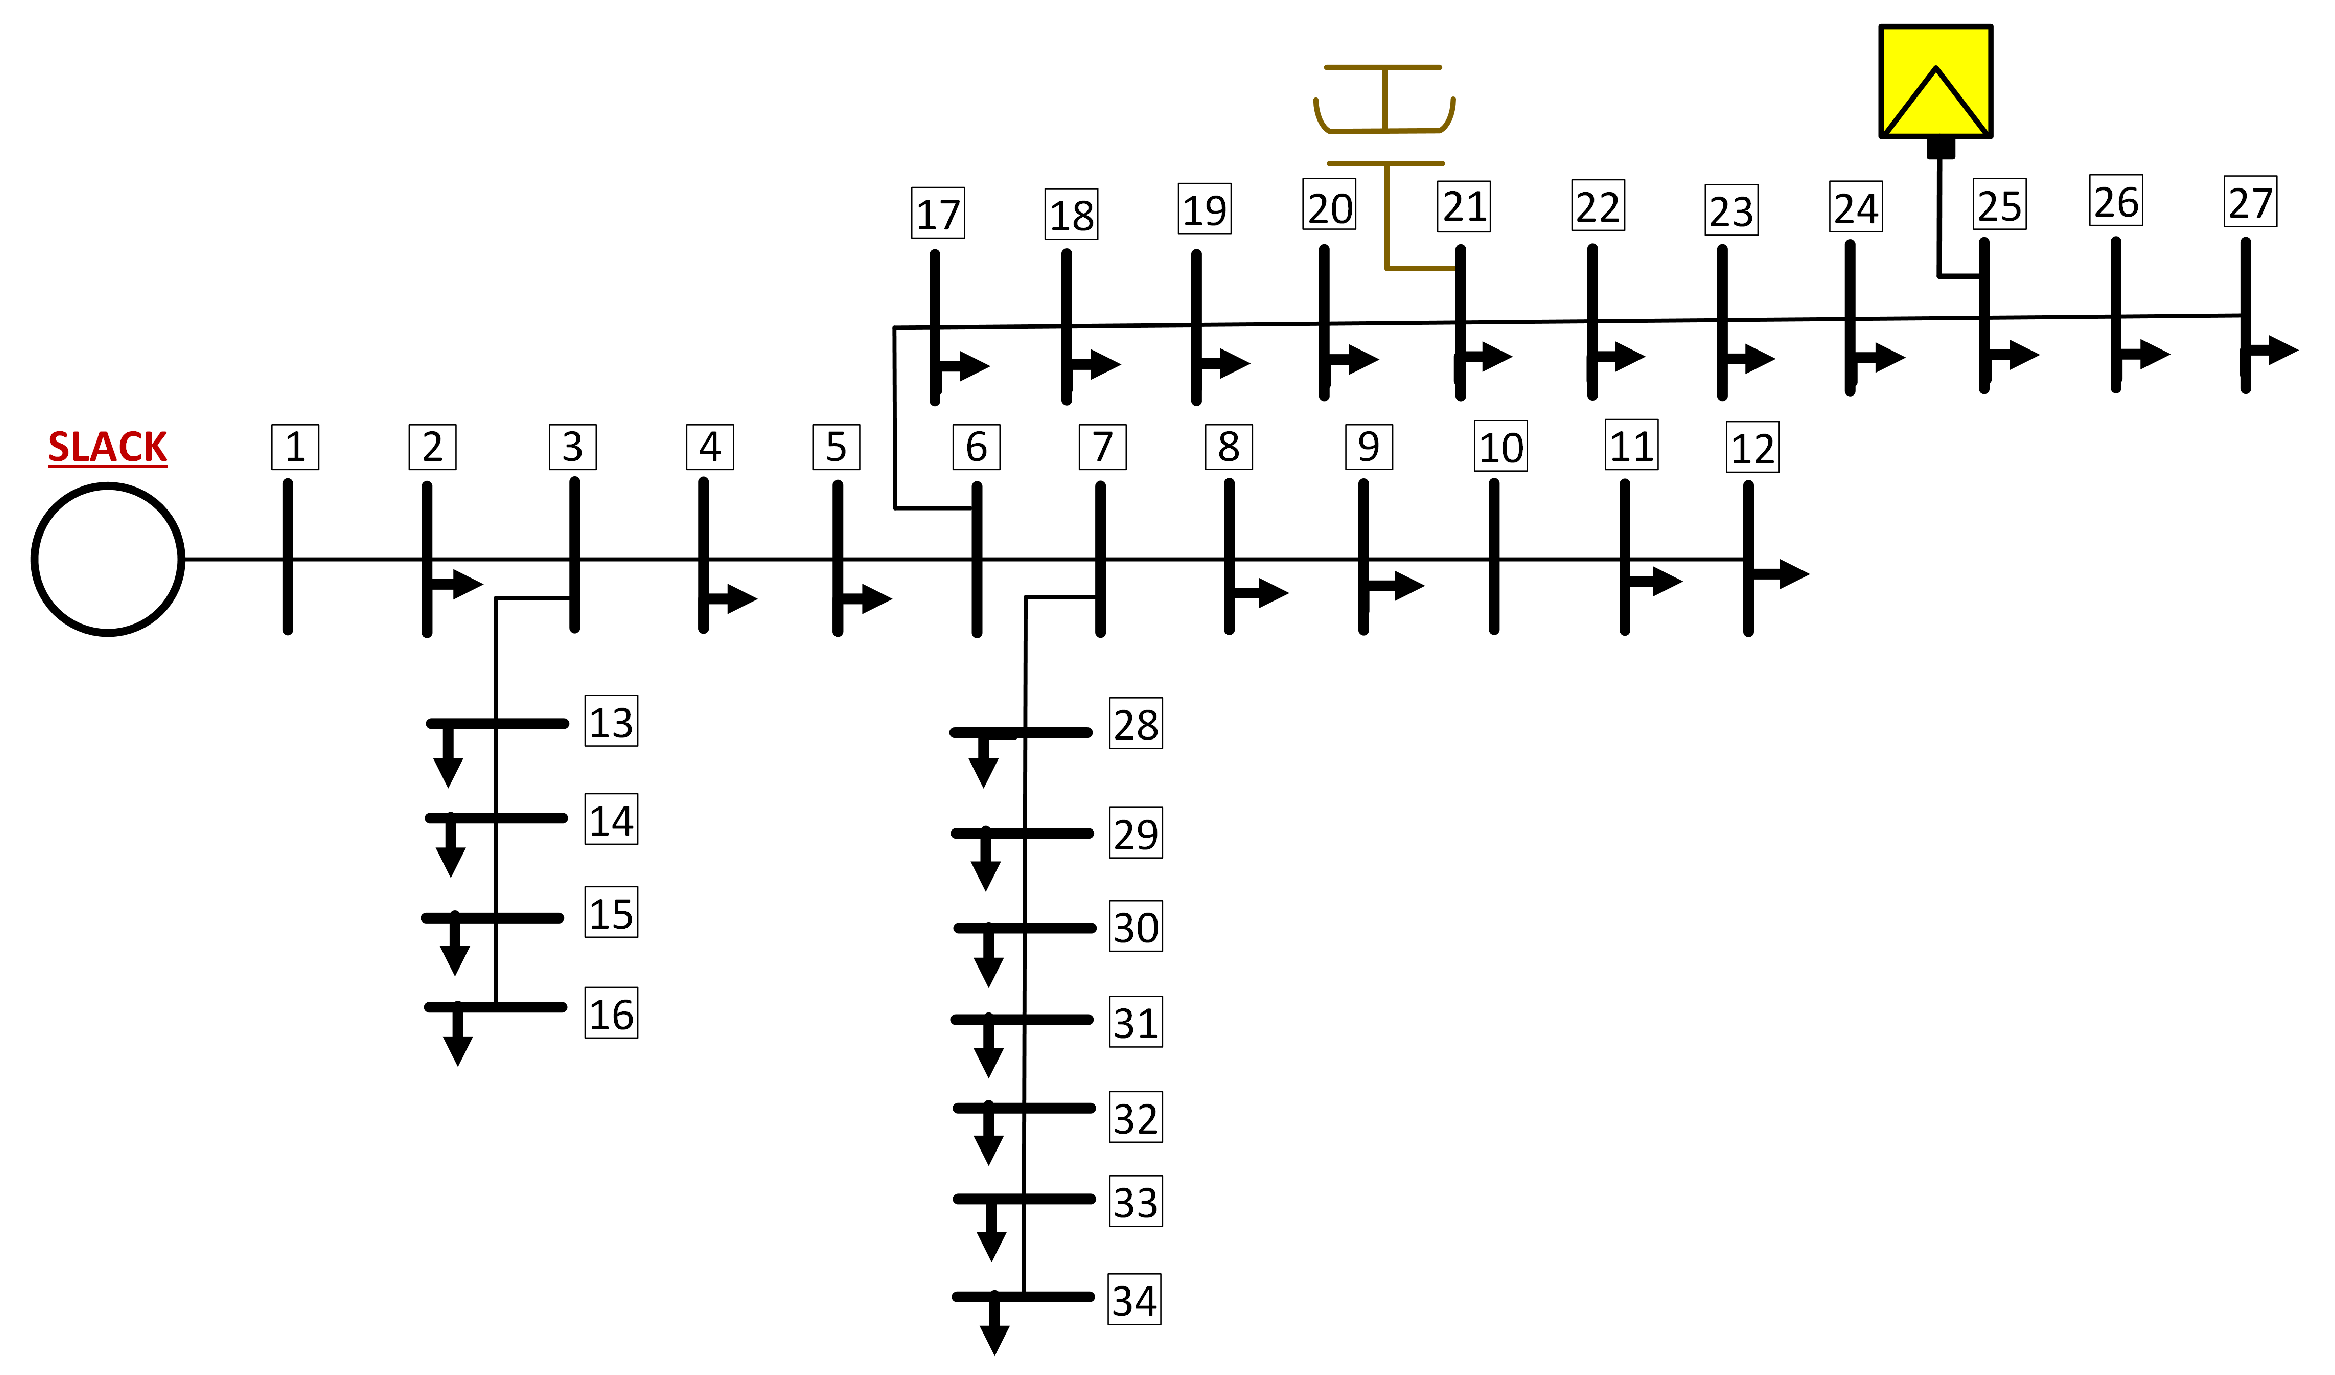
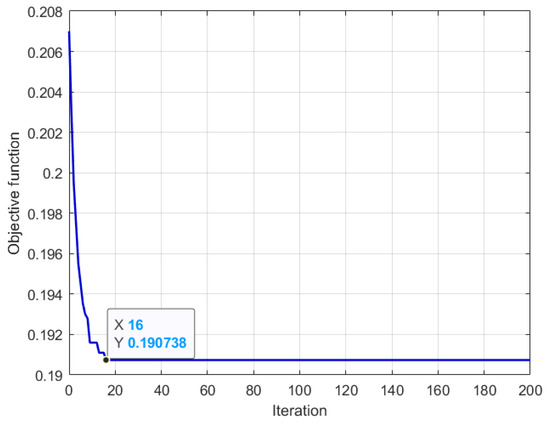
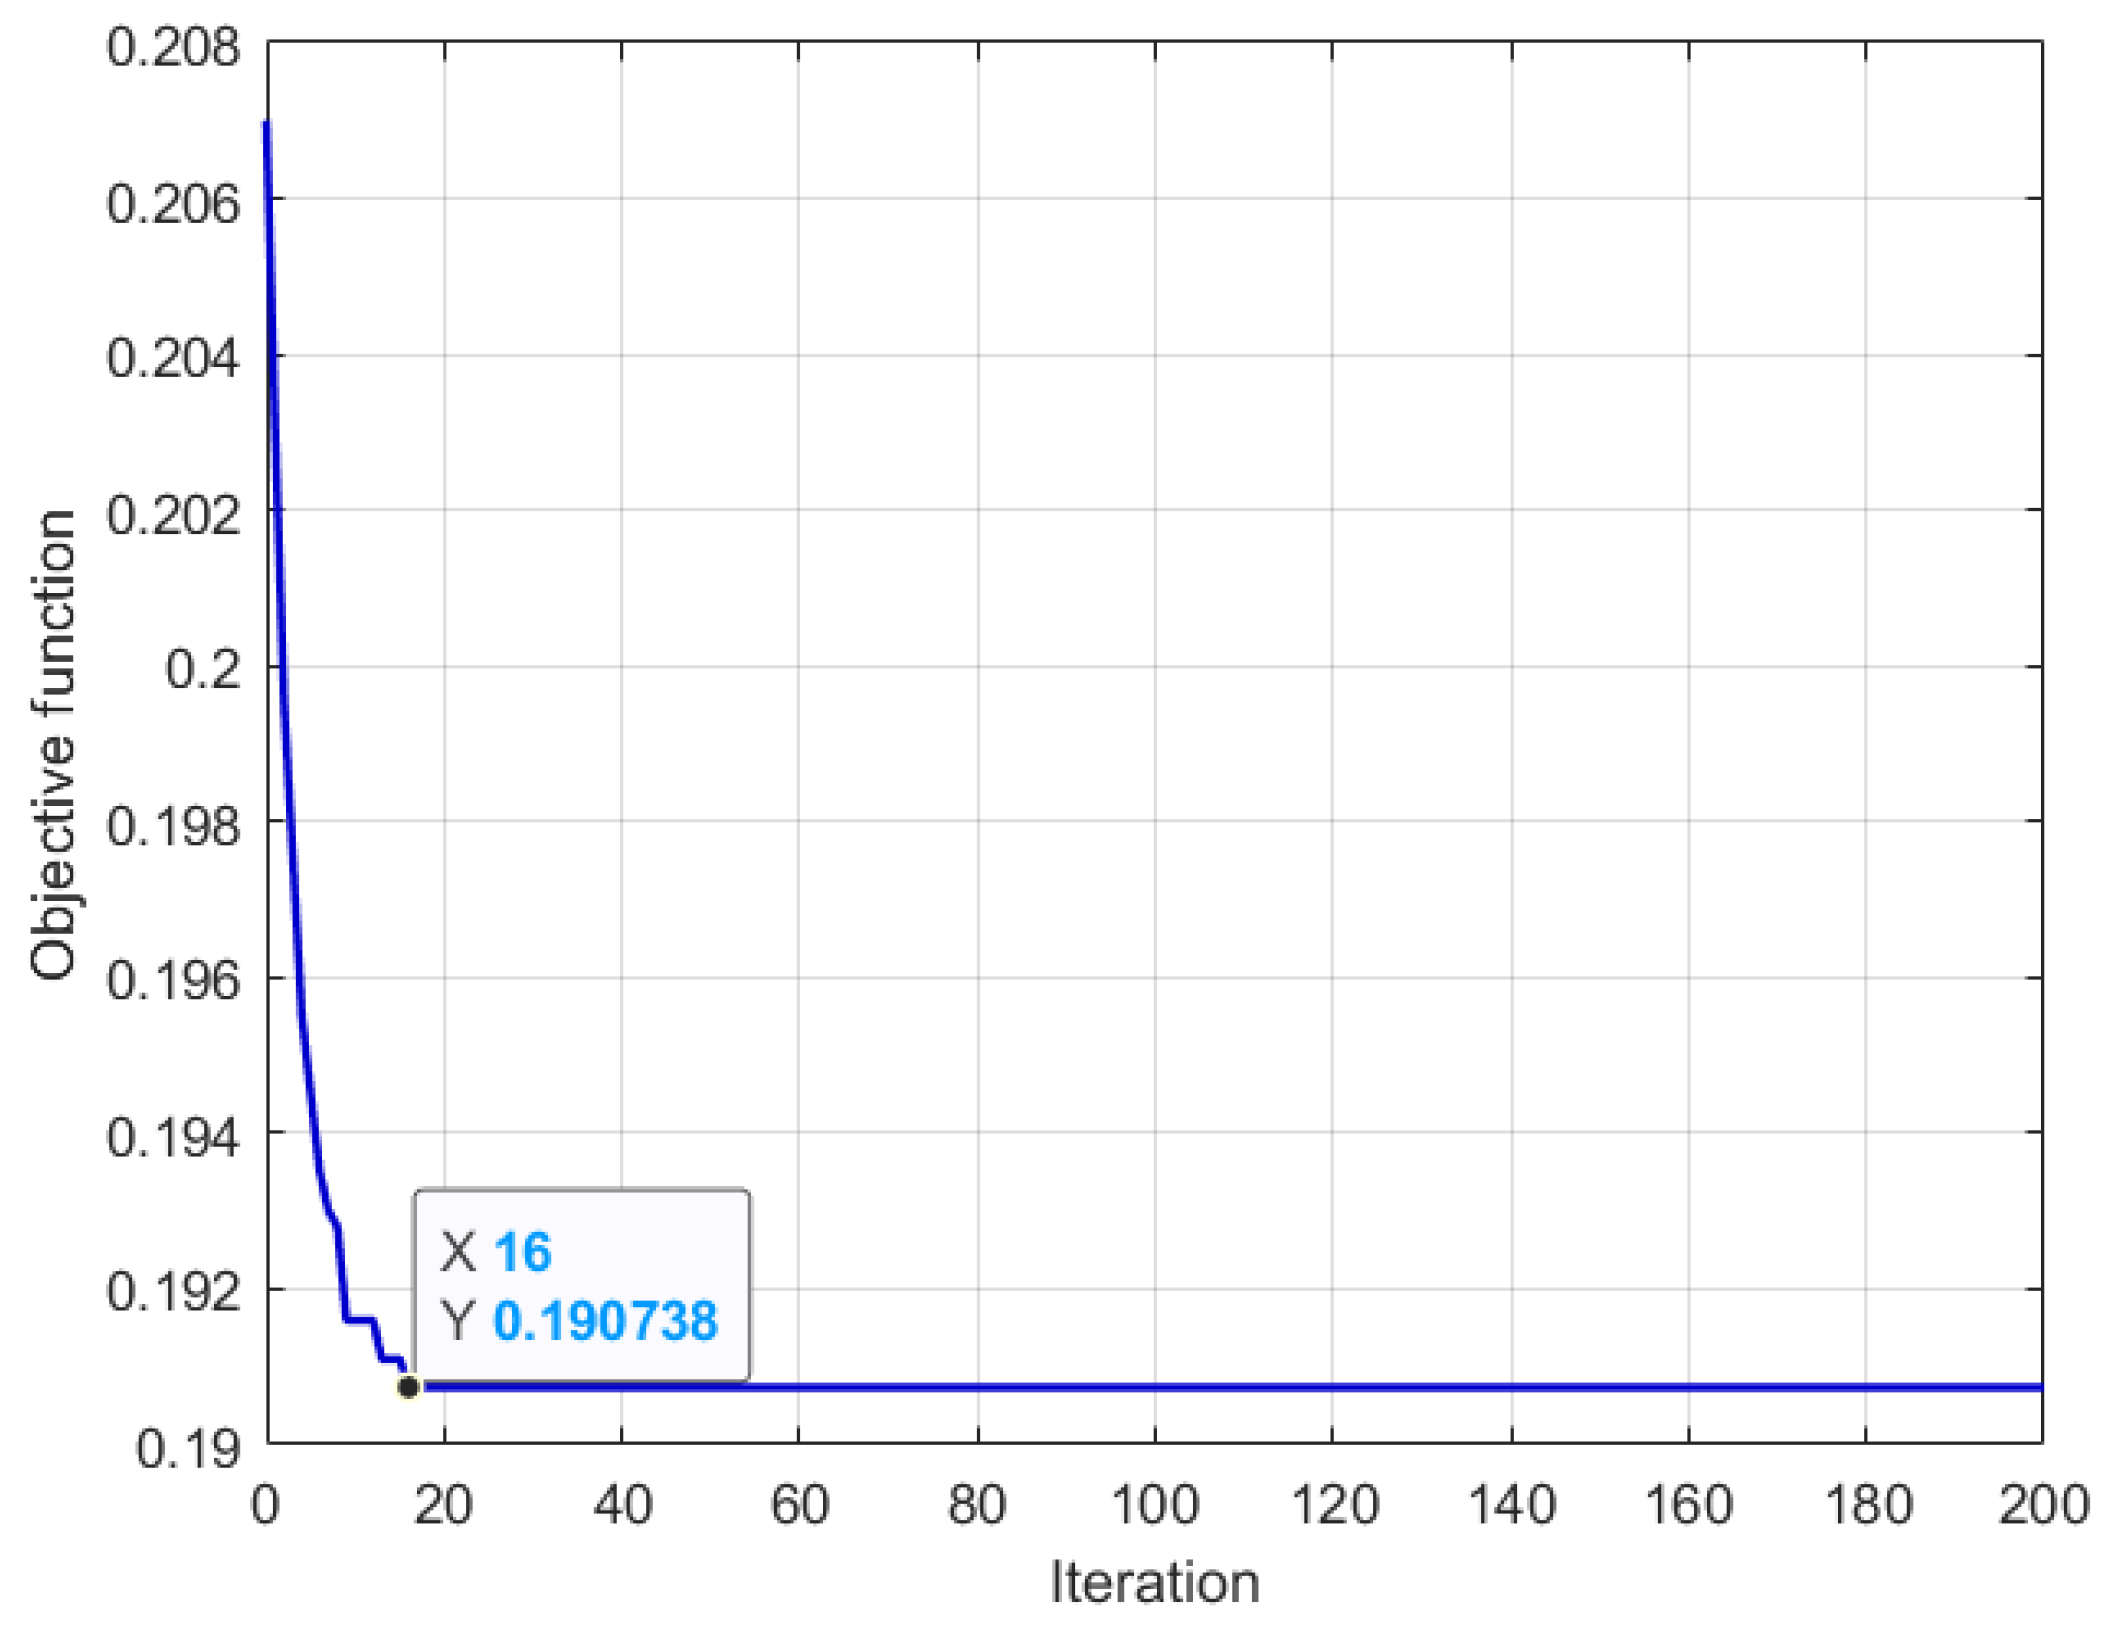
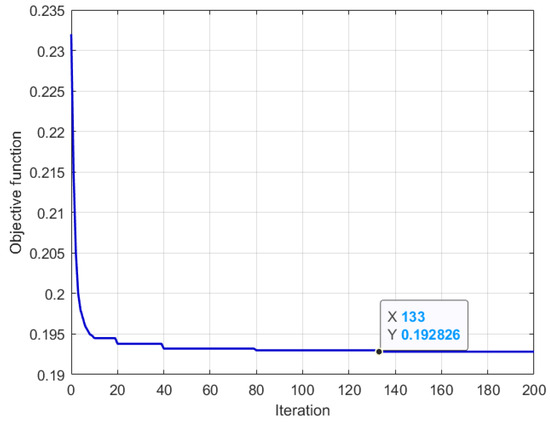
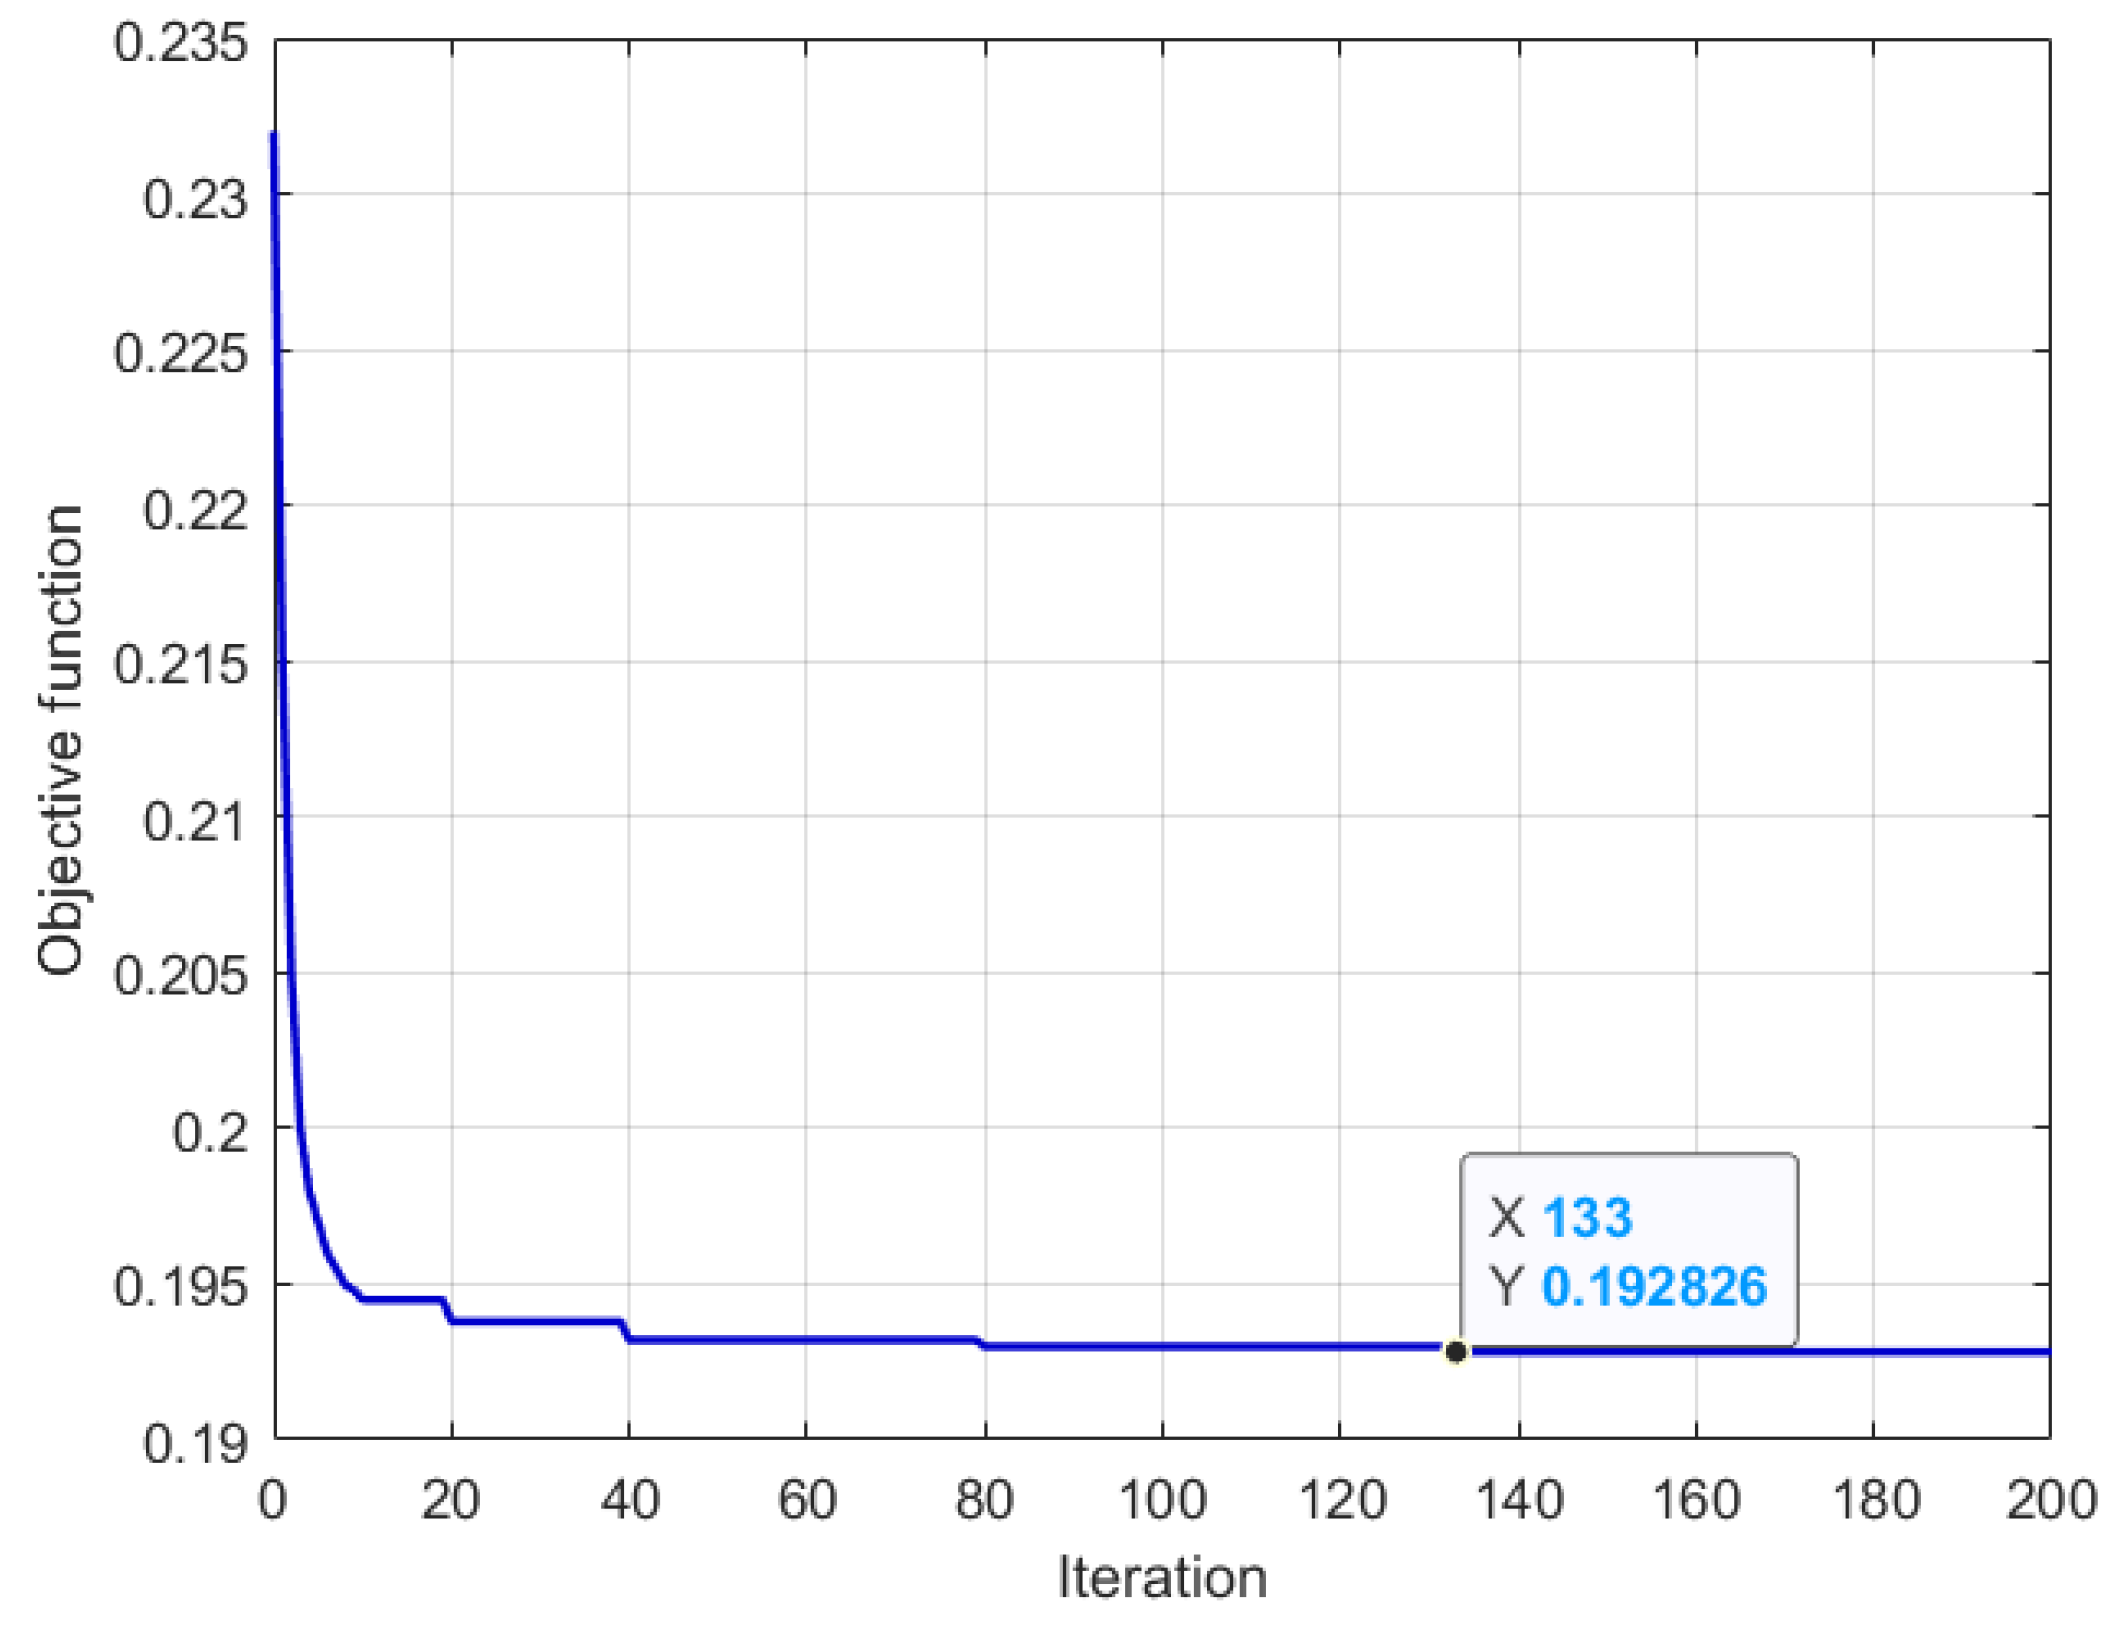
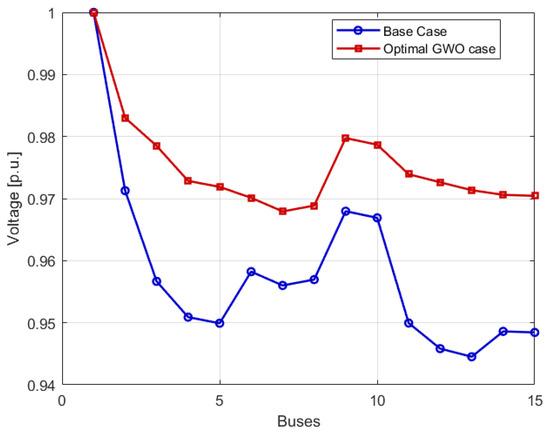
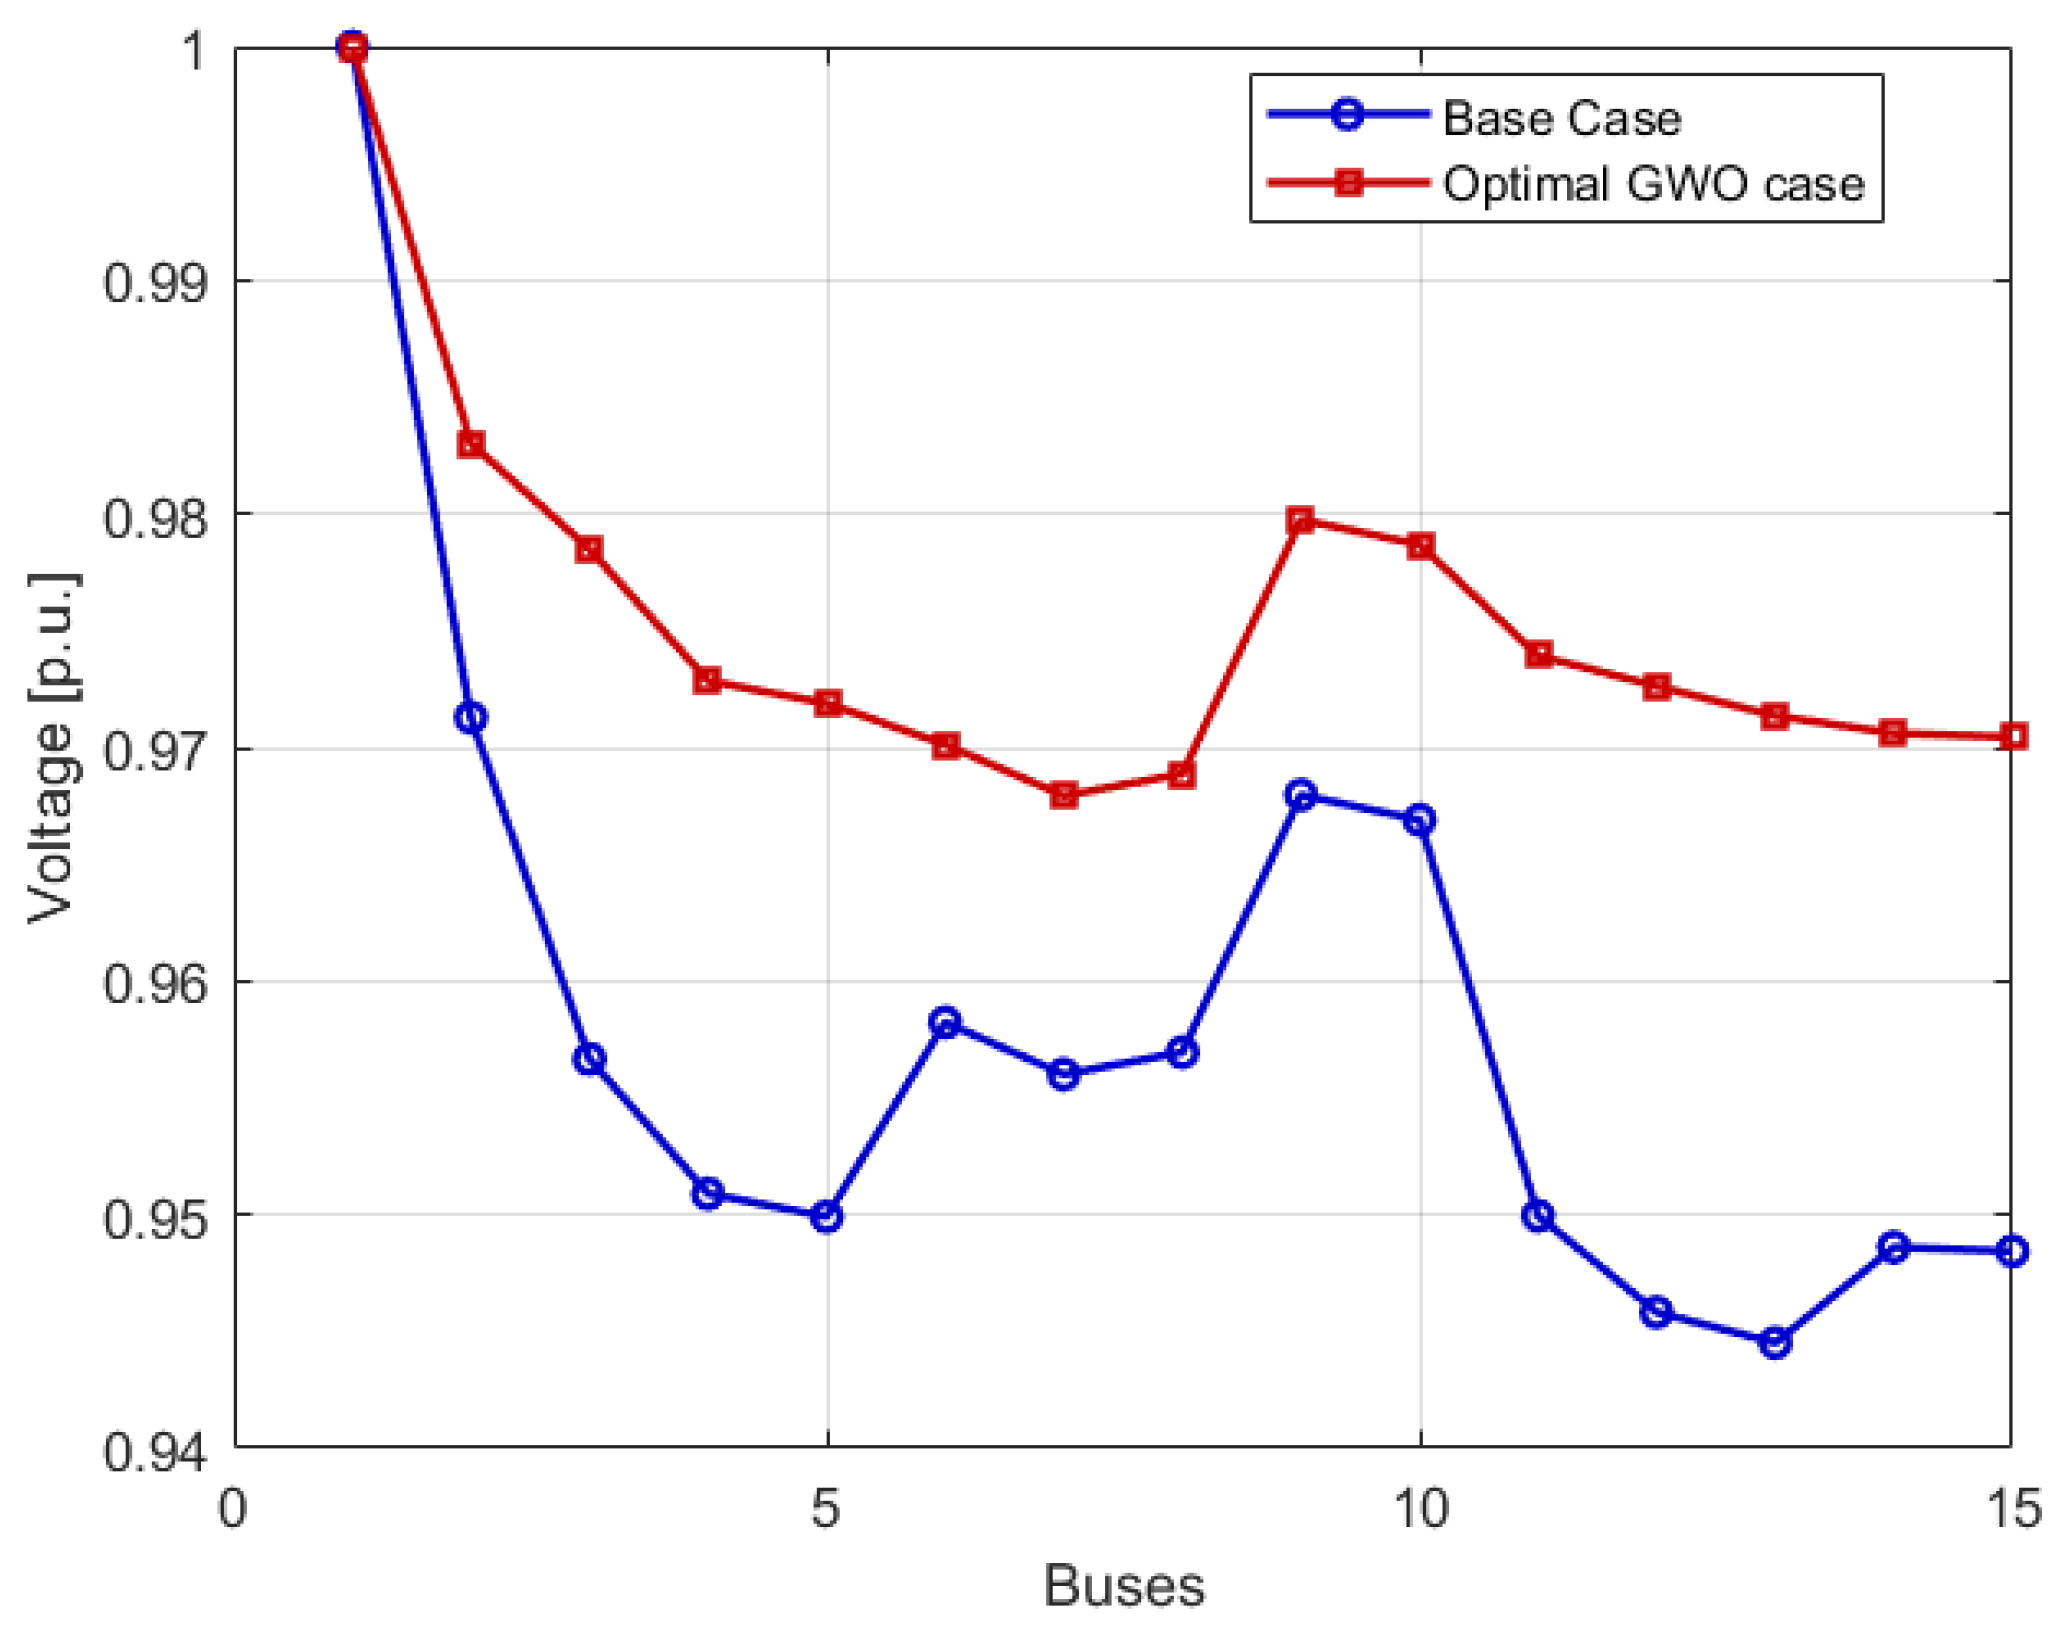
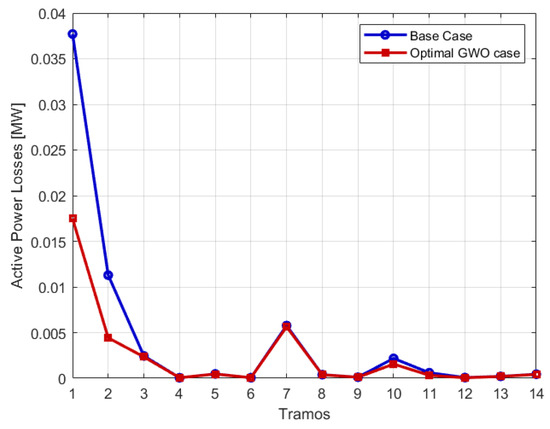
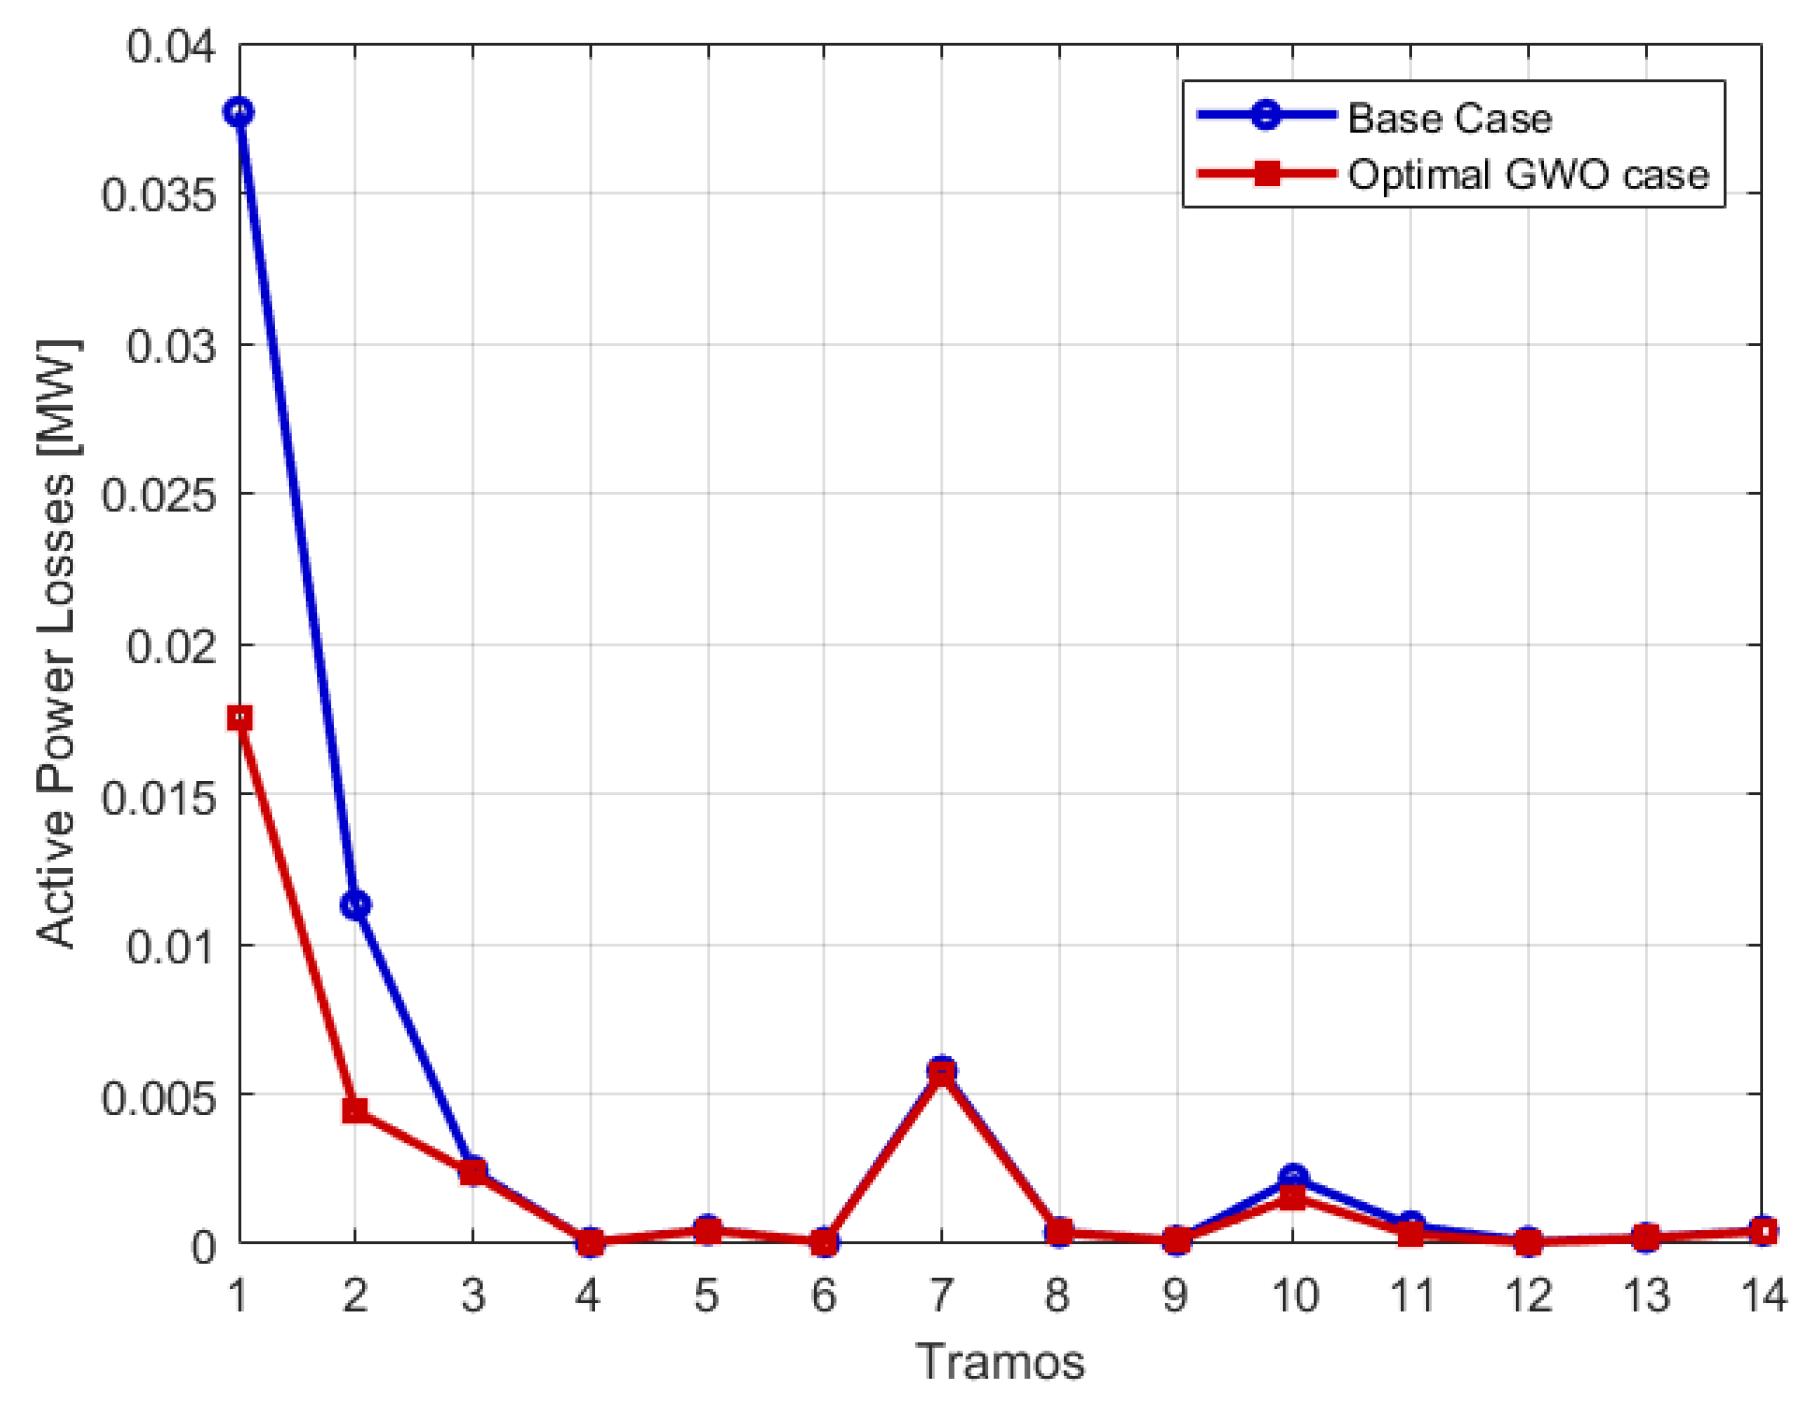
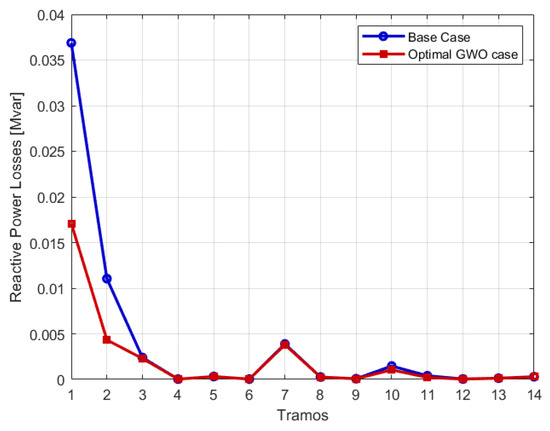
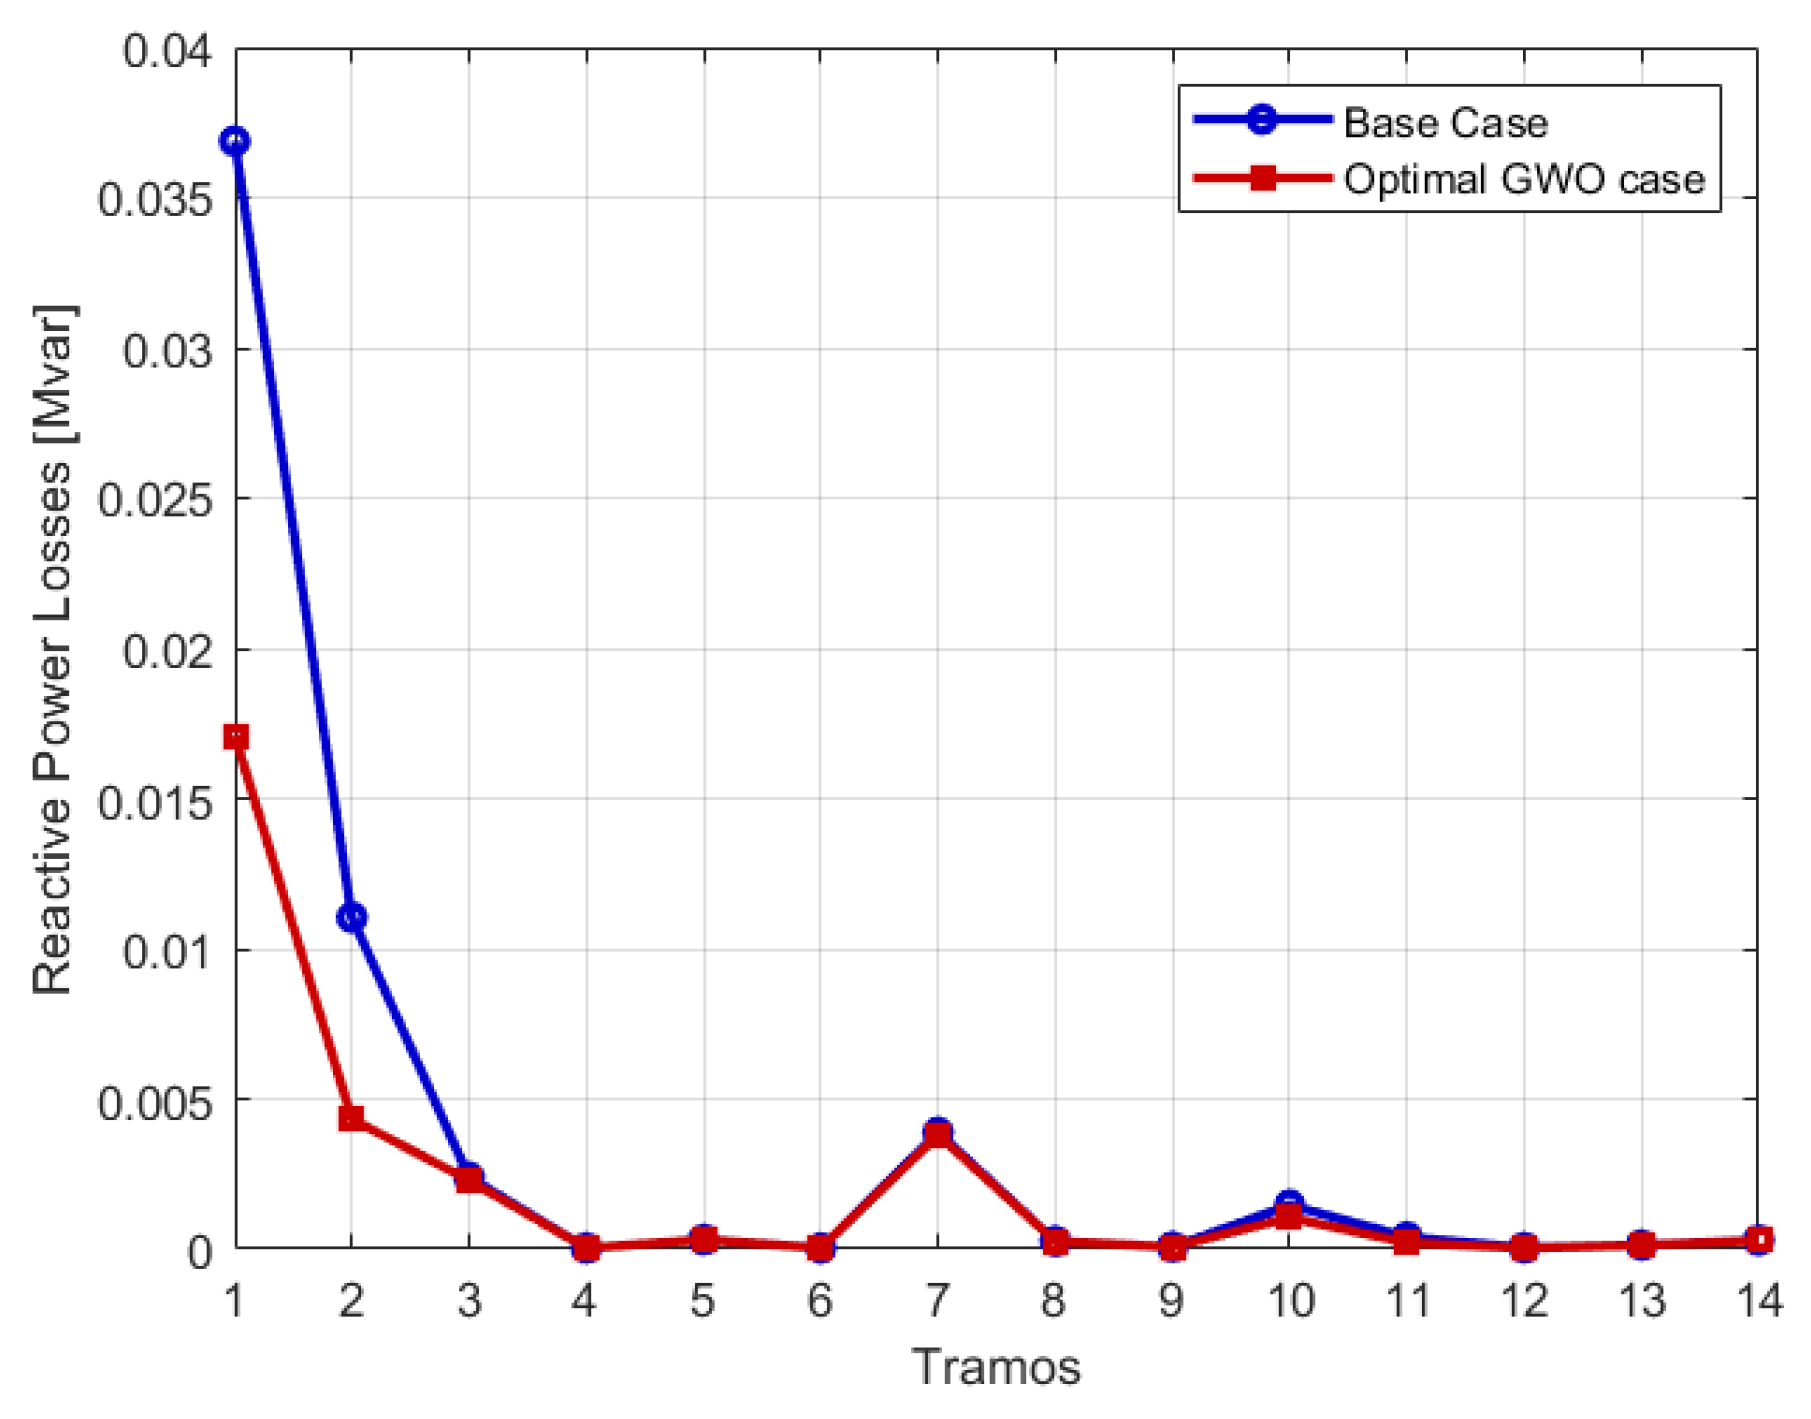
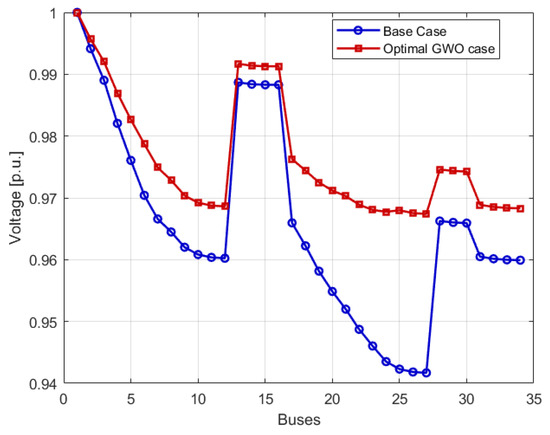
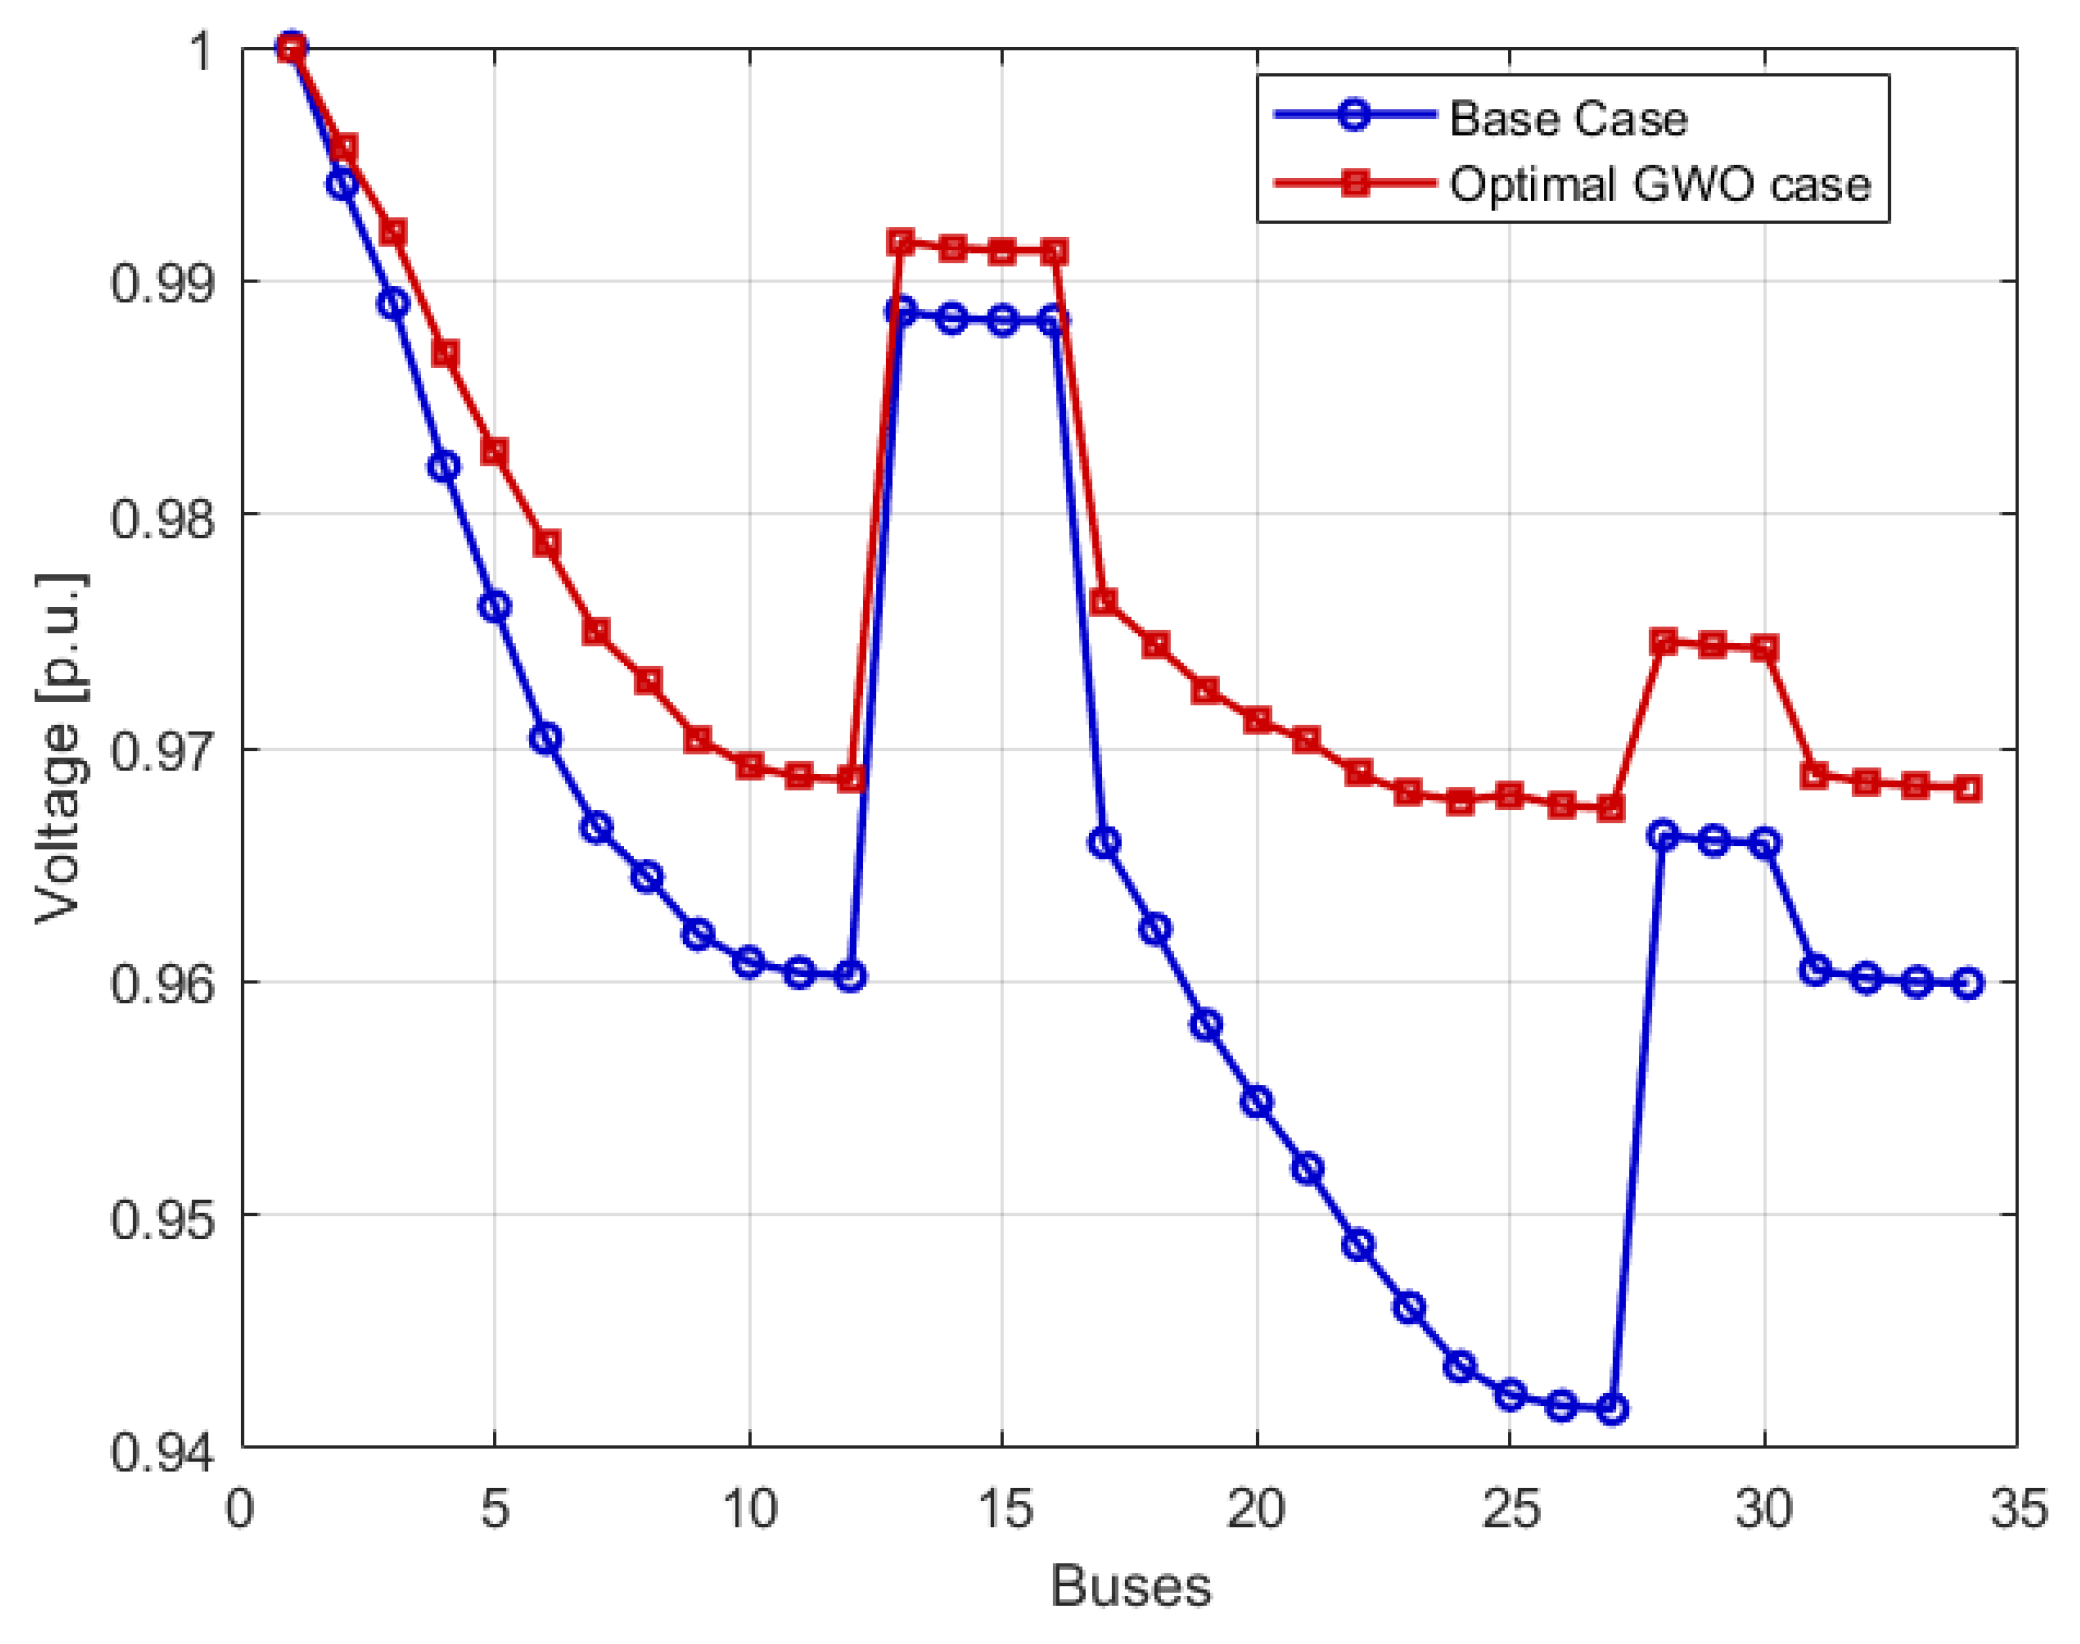
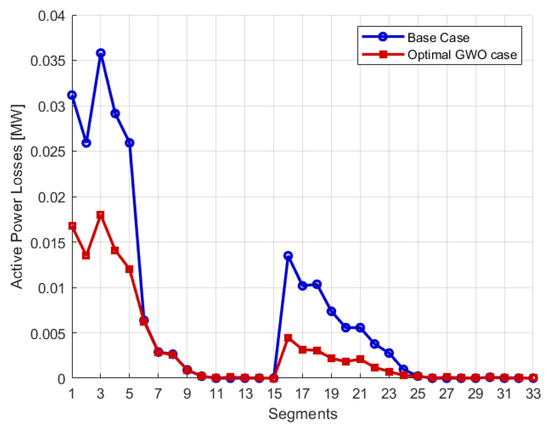
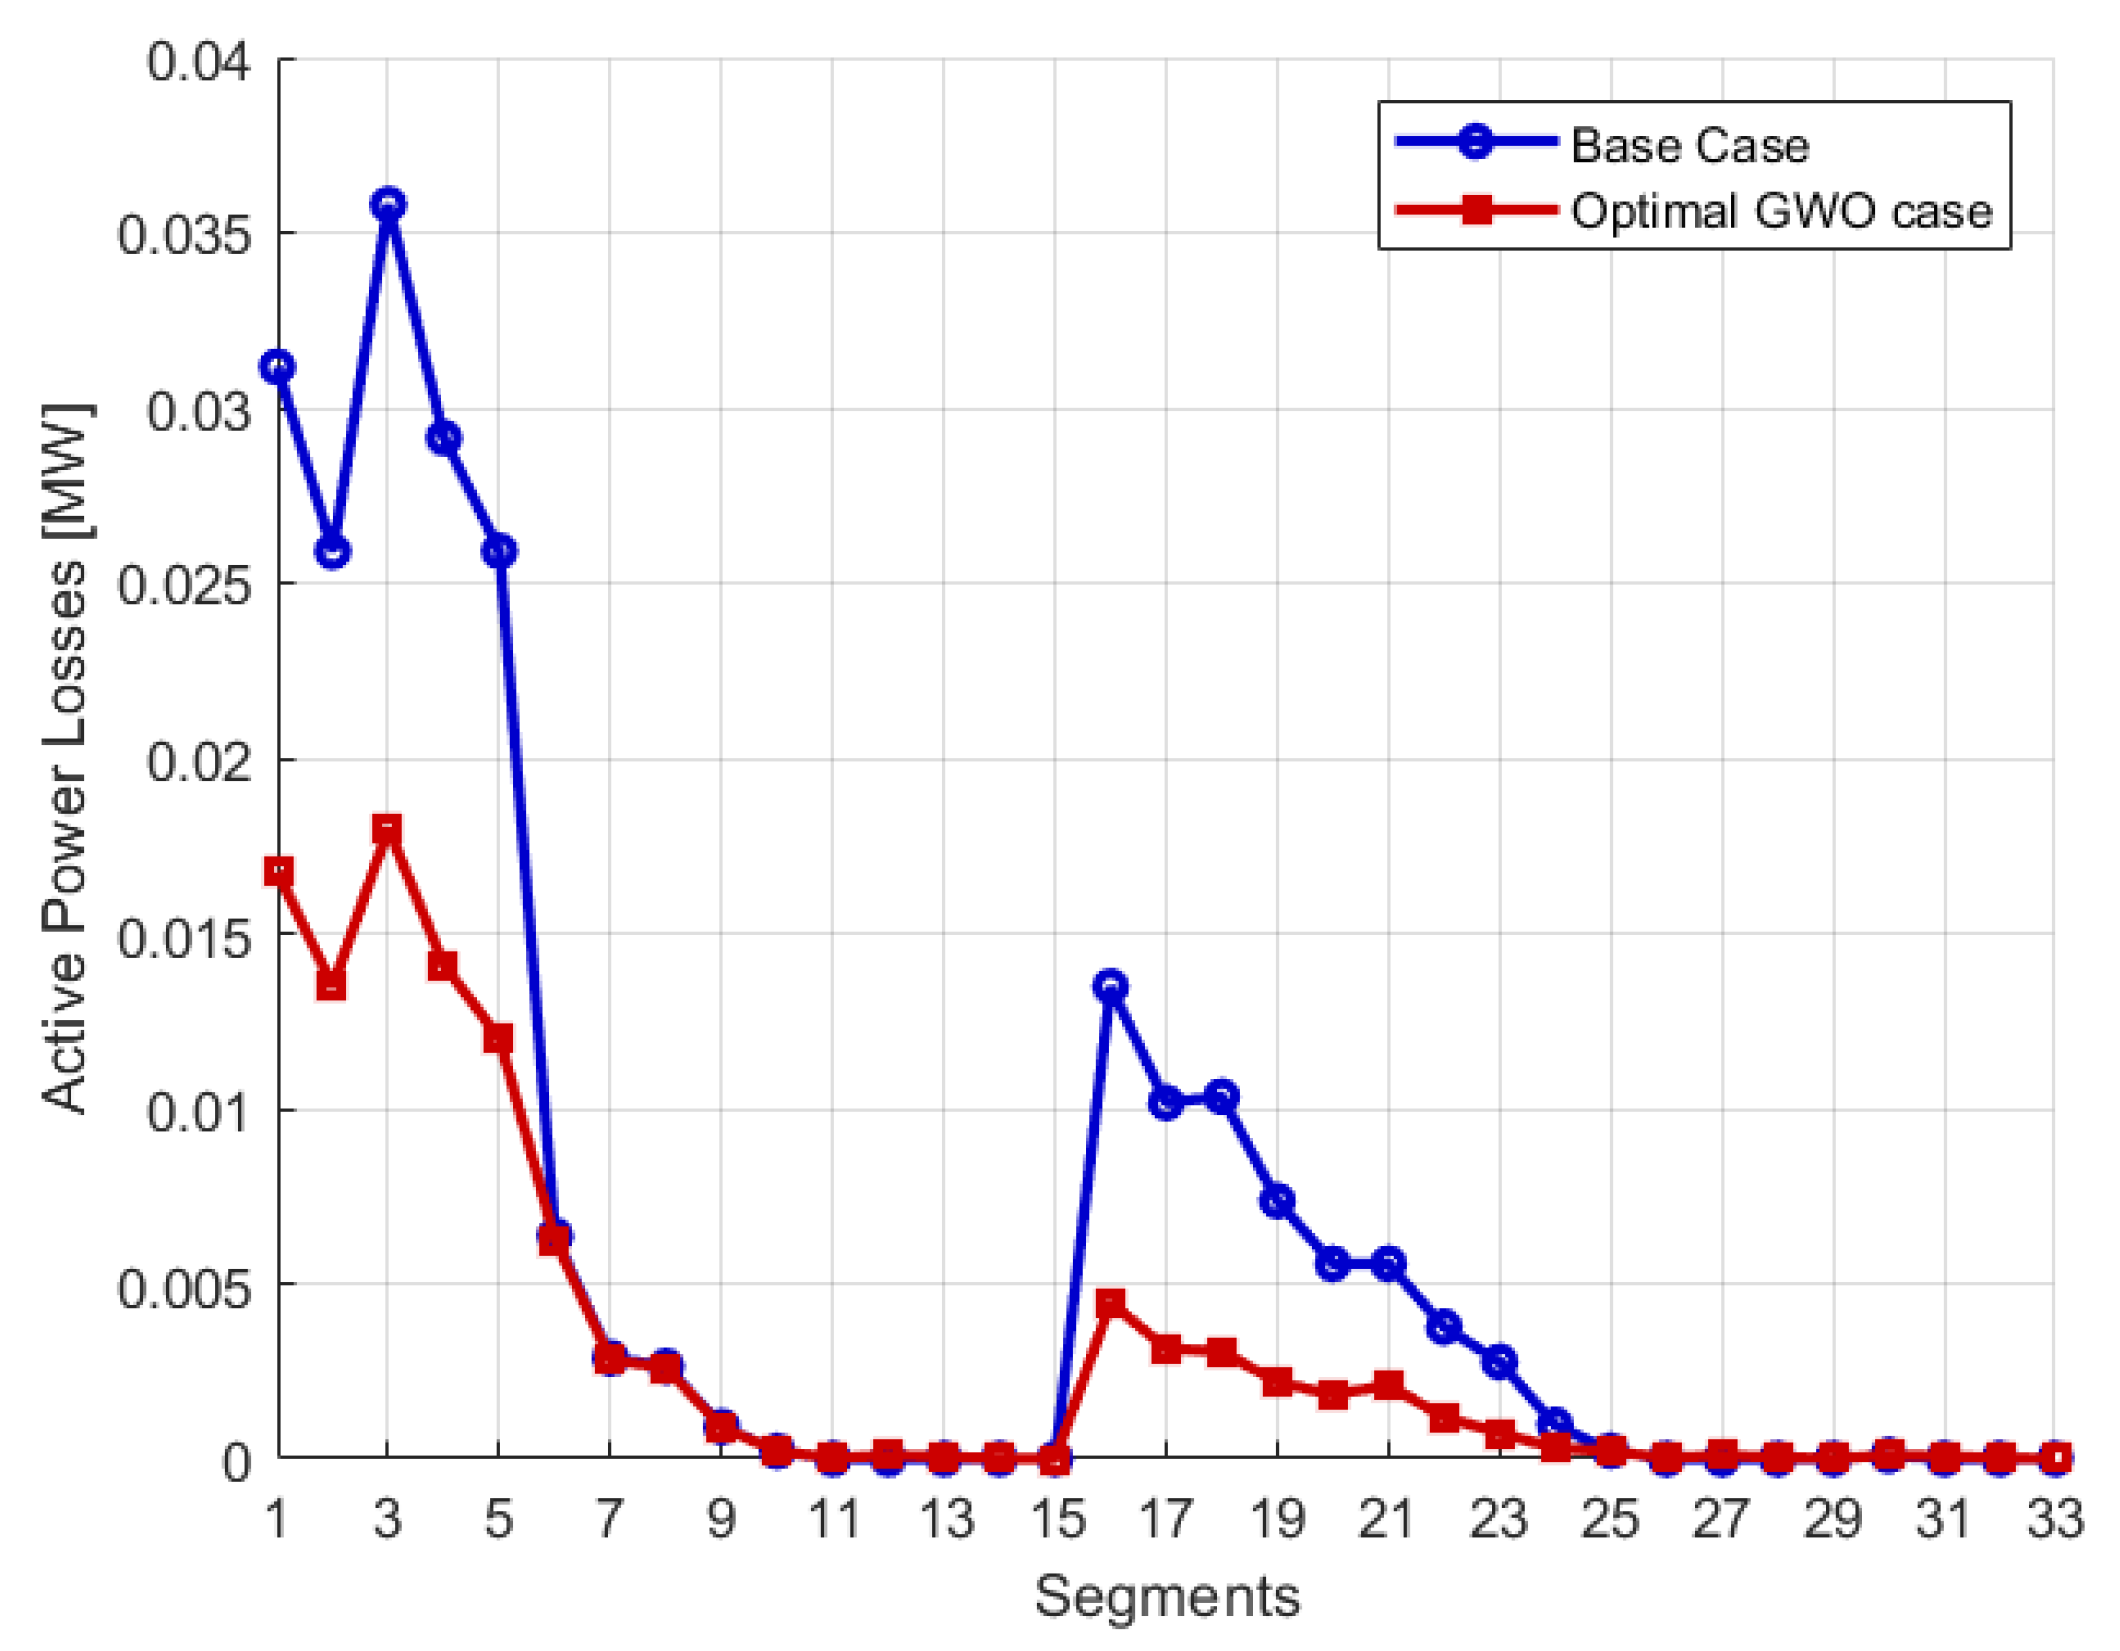
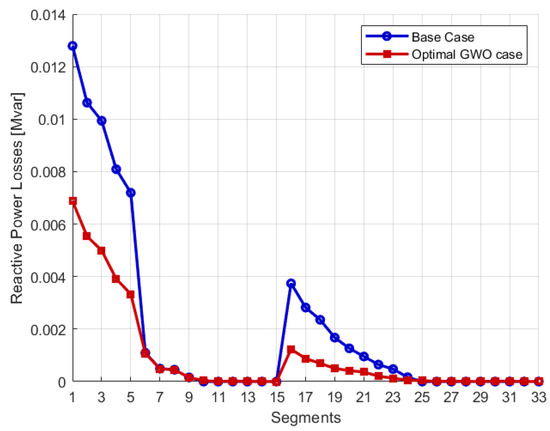
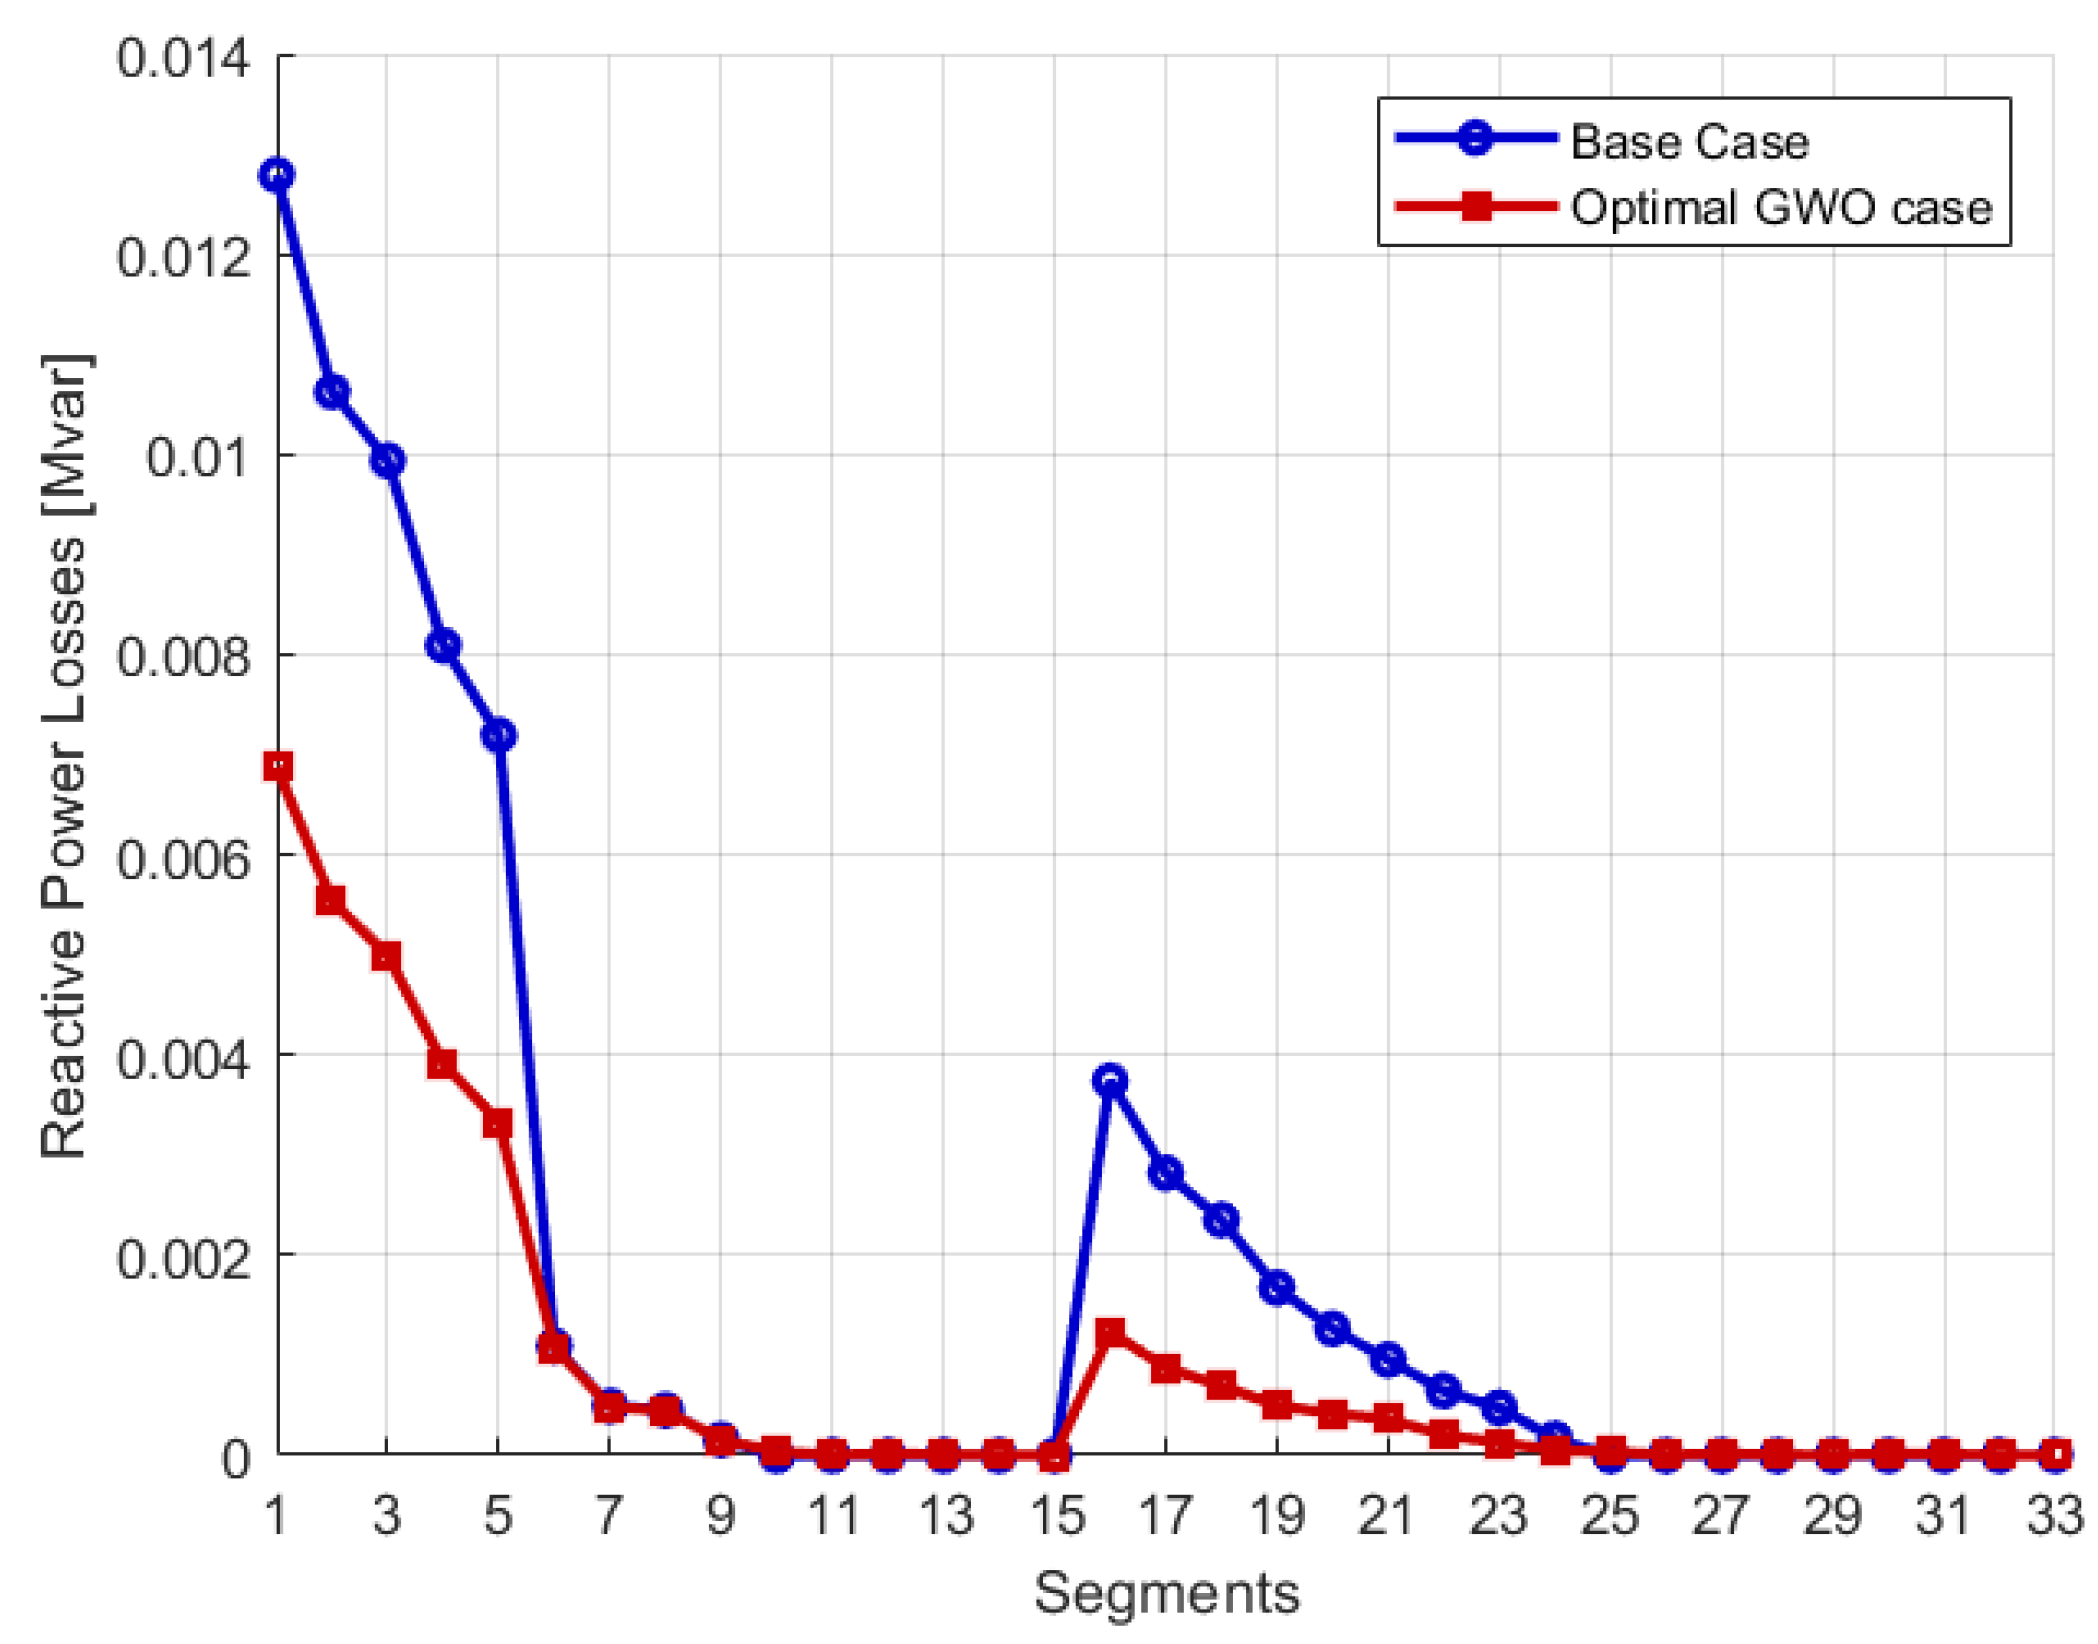

Disclaimer/Publisher’s Note: The statements, opinions and data contained in all publications are solely those of the individual author(s) and contributor(s) and not of MDPI and/or the editor(s). MDPI and/or the editor(s) disclaim responsibility for any injury to people or property resulting from any ideas, methods, instructions or products referred to in the content. |
© 2026 by the authors. Licensee MDPI, Basel, Switzerland. This article is an open access article distributed under the terms and conditions of the Creative Commons Attribution (CC BY) license.