Author Contributions
Conceptualization, C.K. and V.D.S.; methodology, V.D.S., P.Z. and A.K.; validation, C.K., V.D.S., P.Z., A.K. and C.S.; formal analysis, V.D.S., P.Z. and A.K.; investigation, V.D.S., P.Z., C.S. and A.K.; resources, C.K., V.D.S., P.Z. and A.K.; data curation, C.K., V.D.S., P.Z. and A.K.; writing—original draft preparation, C.K., V.D.S., P.Z. and A.K.; writing—review and editing, V.D.S., P.Z., A.K. and C.K.; supervision, C.S. All authors have read and agreed to the published version of the manuscript.
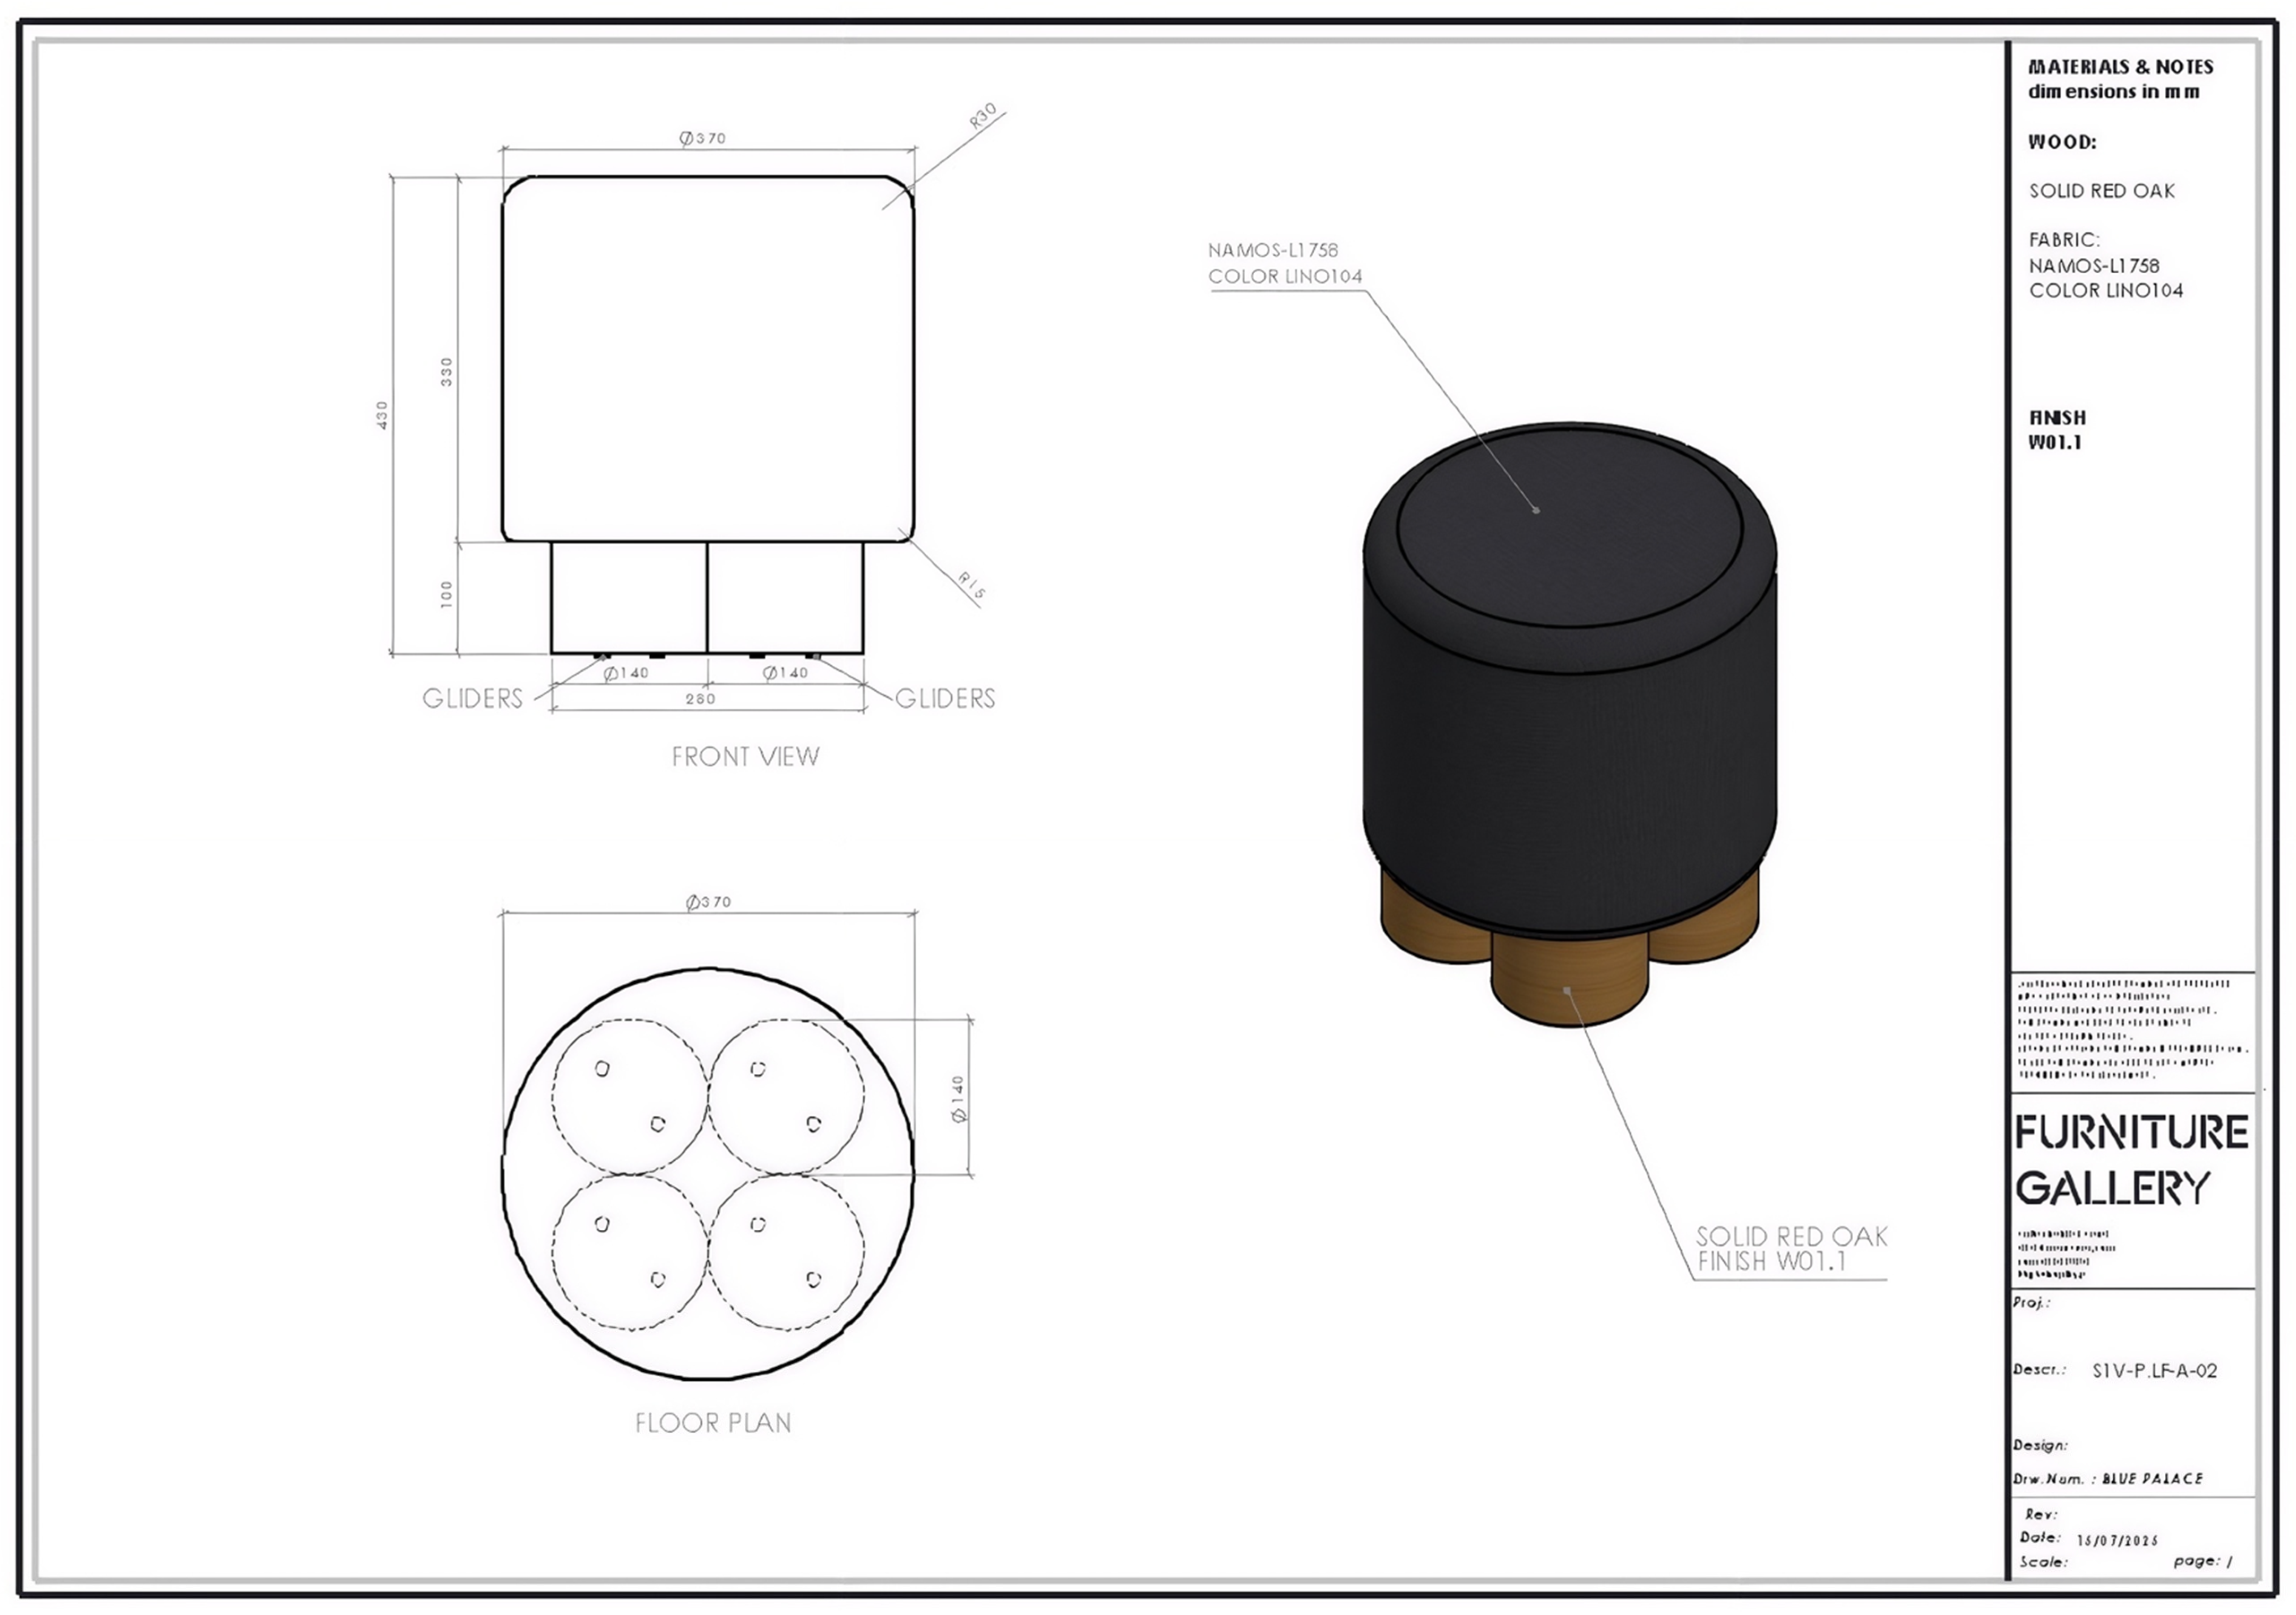
Figure 1.
Approved Client Drawing of the baseline scenario.
Figure 1.
Approved Client Drawing of the baseline scenario.
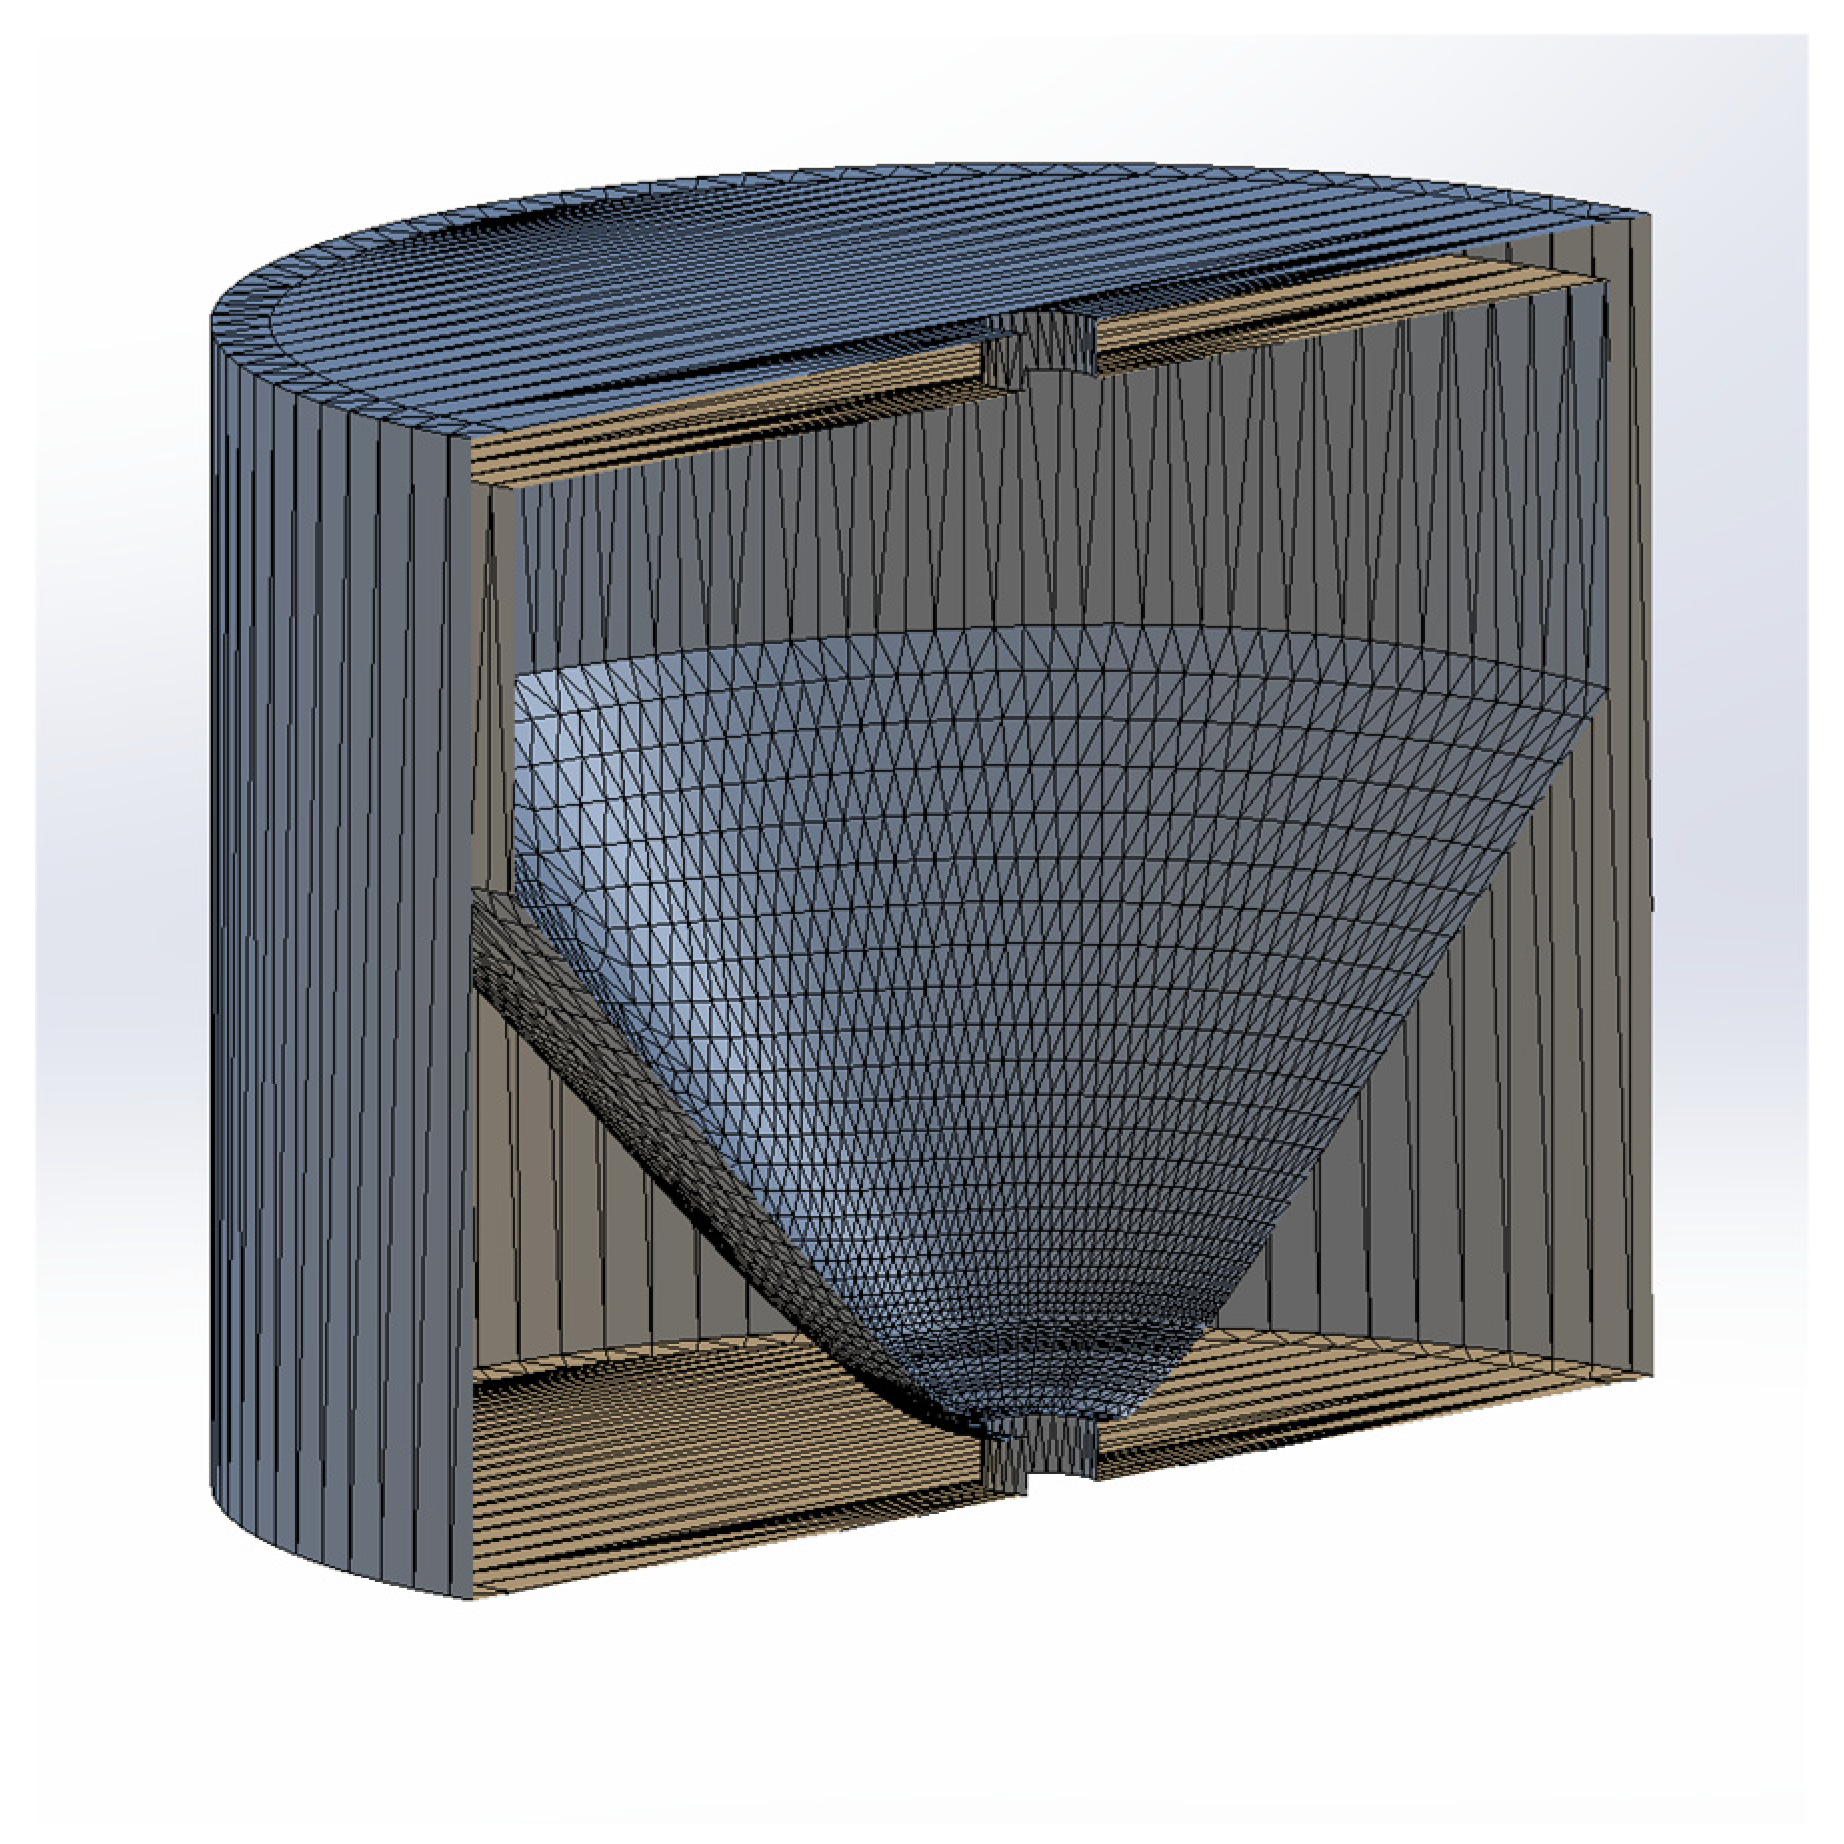
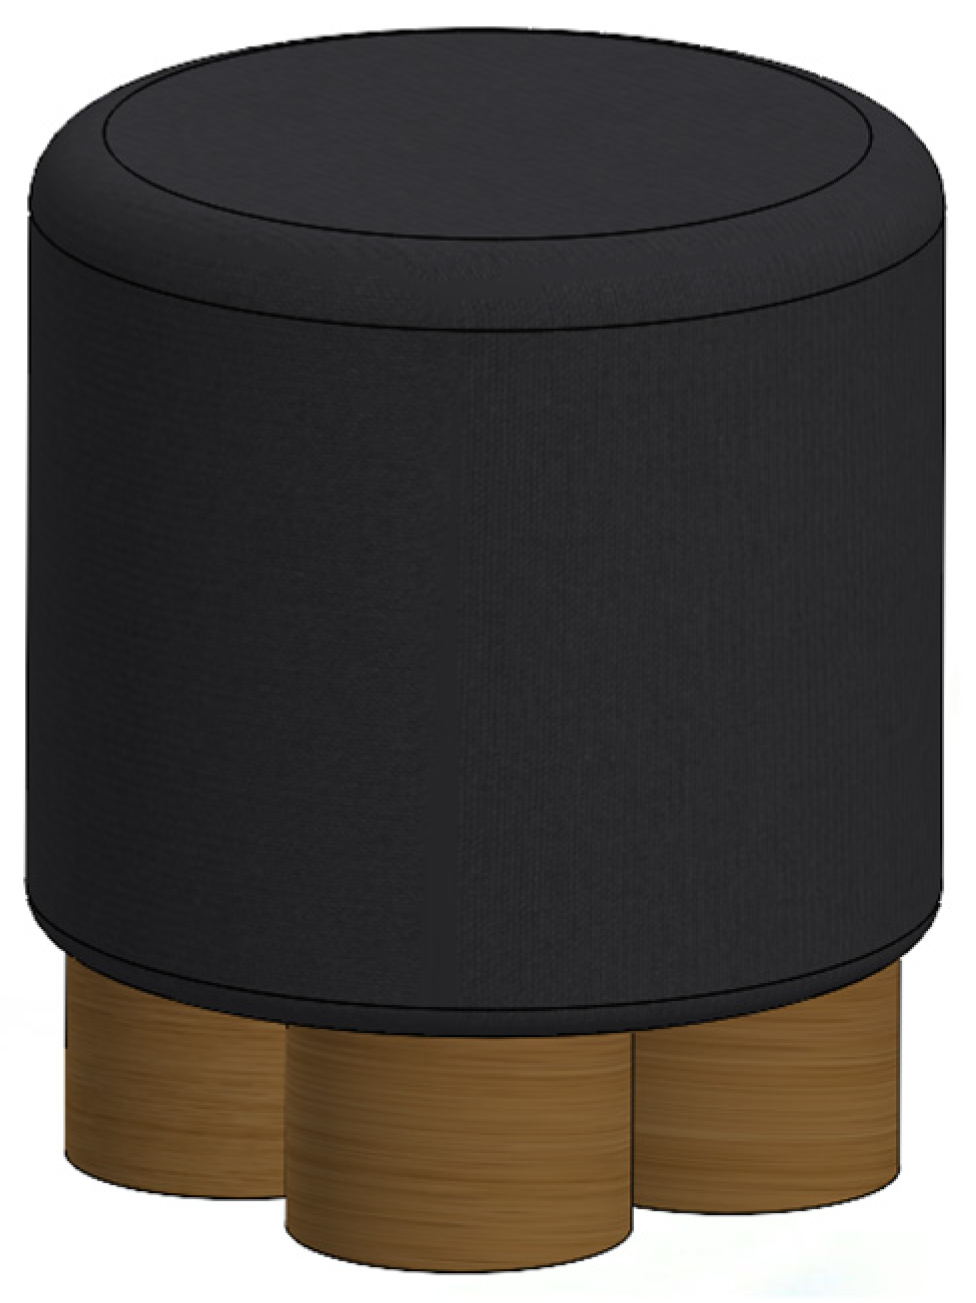
Figure 2.
Three-dimensional CAD representation of the conventional wooden stool (baseline scenario).
Figure 2.
Three-dimensional CAD representation of the conventional wooden stool (baseline scenario).
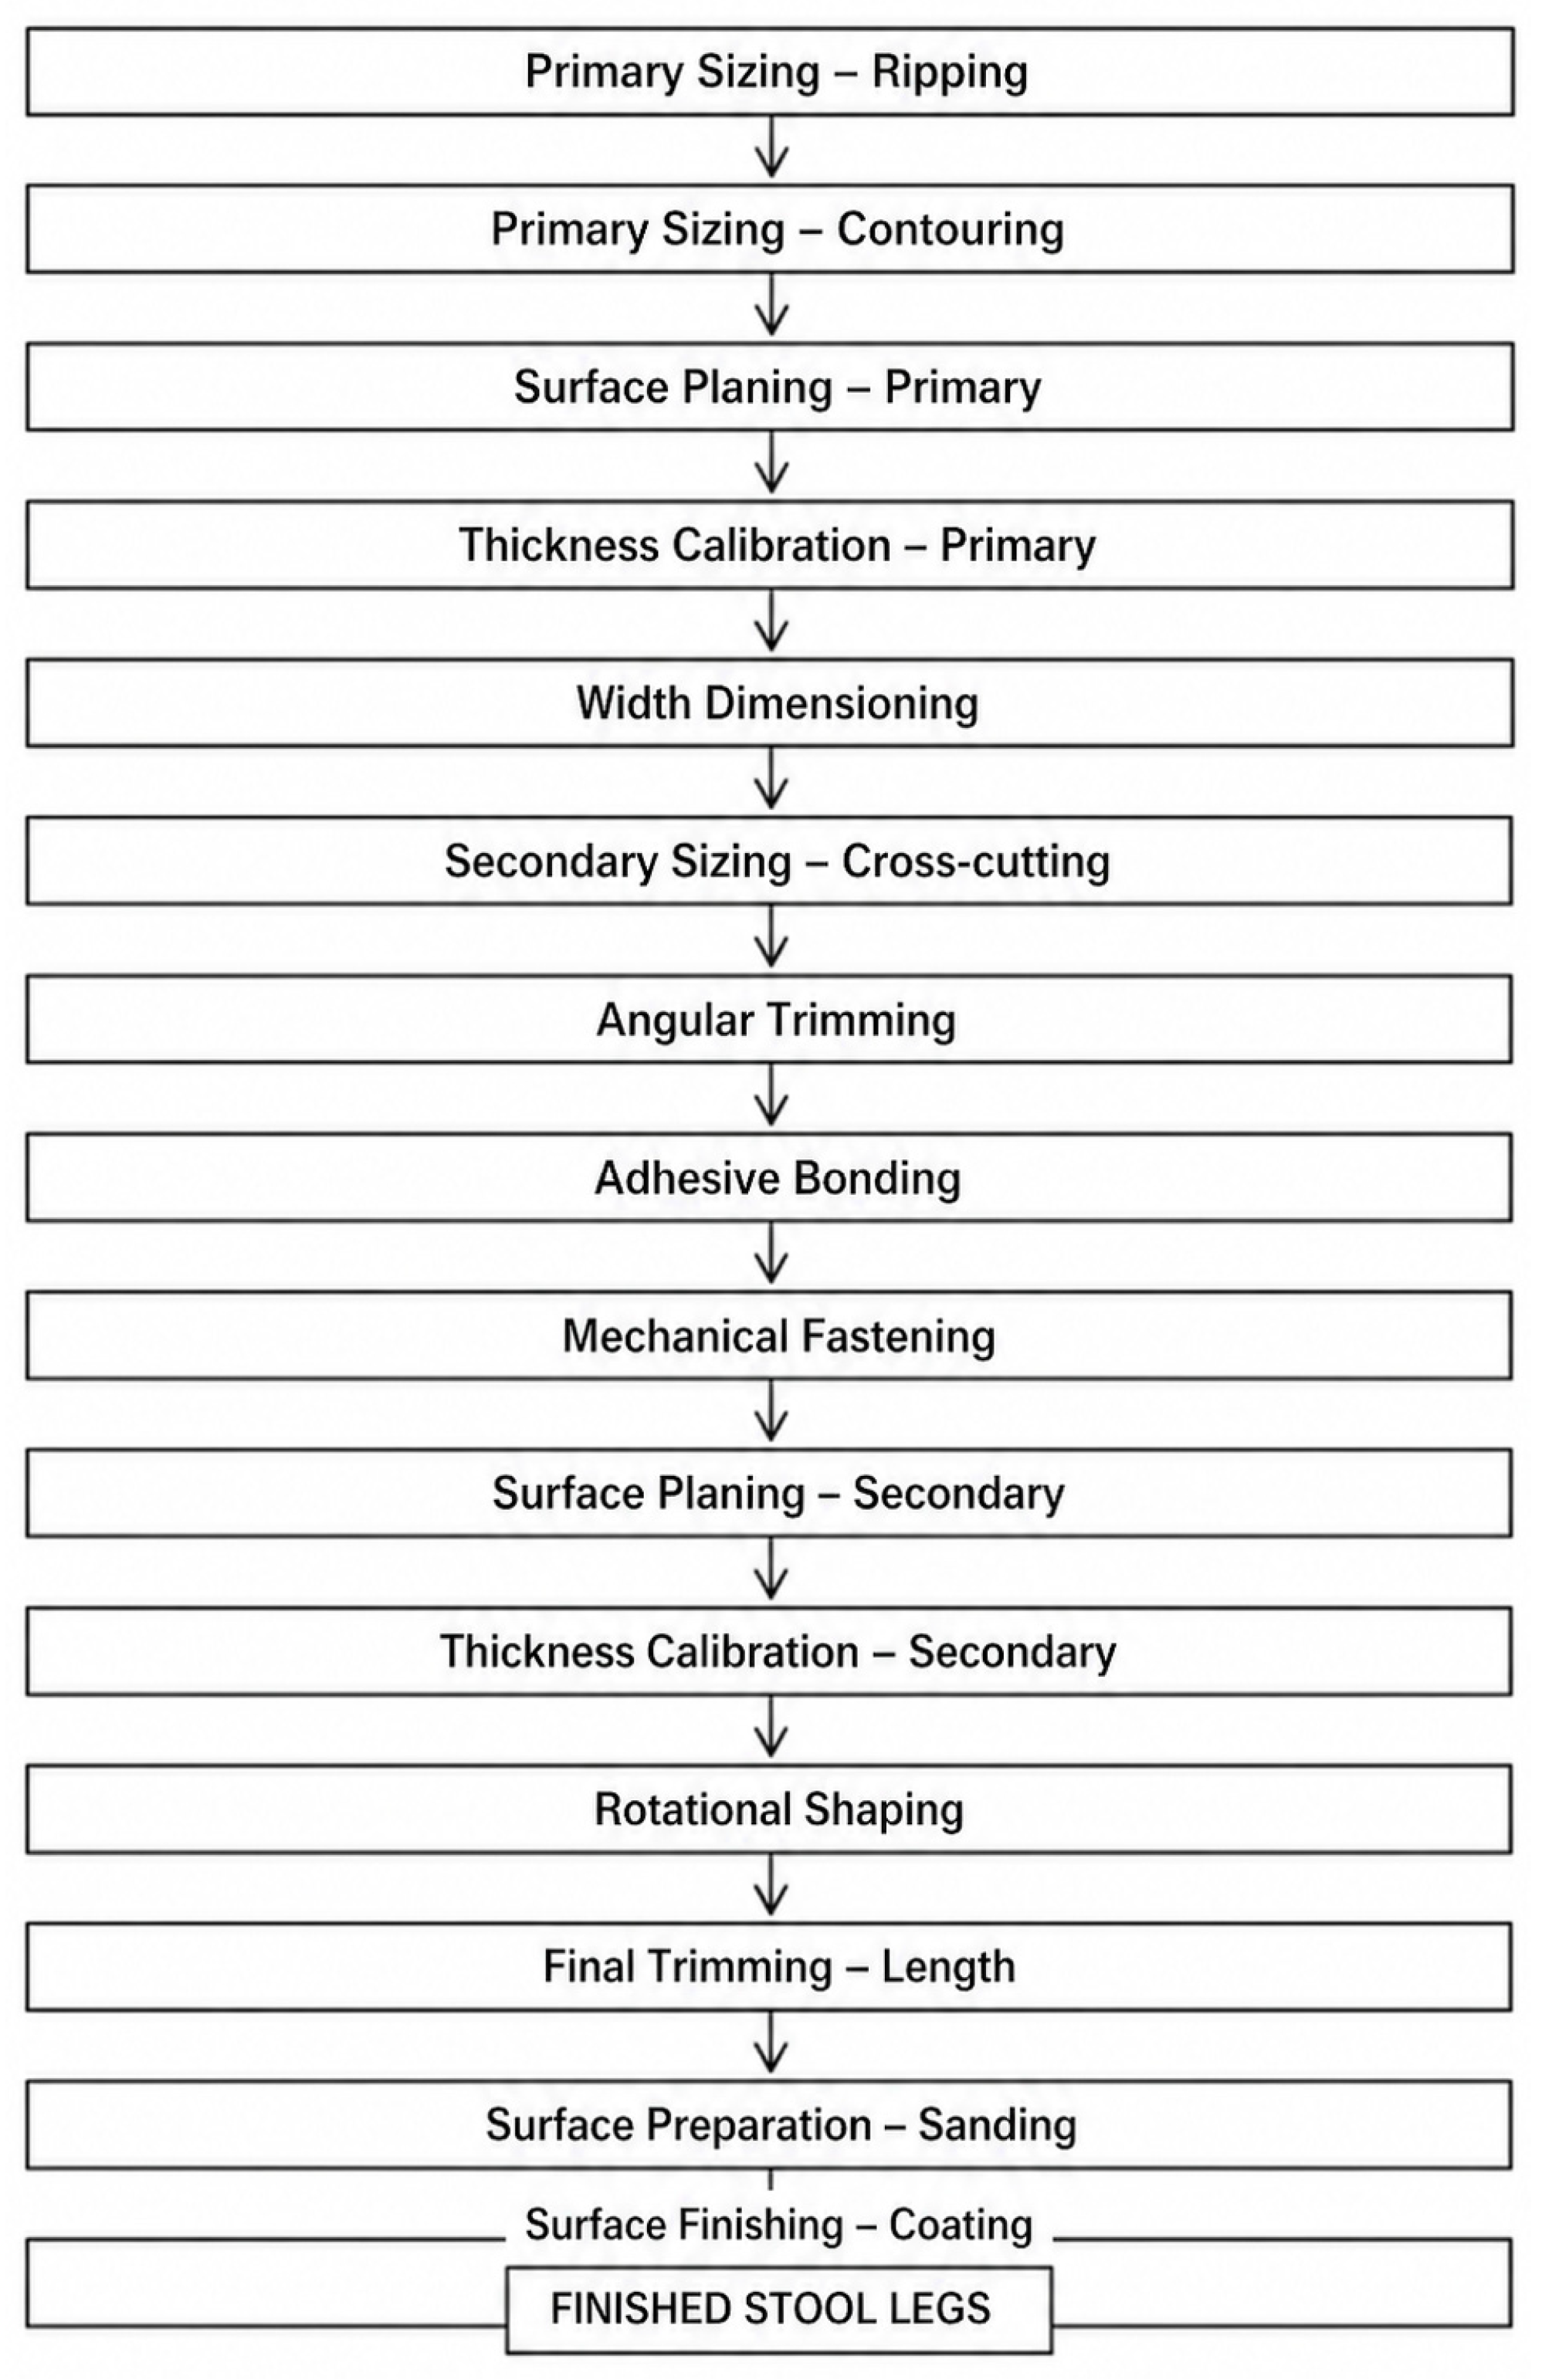
Figure 3.
Manufacturing workflow of the baseline scenario.
Figure 3.
Manufacturing workflow of the baseline scenario.
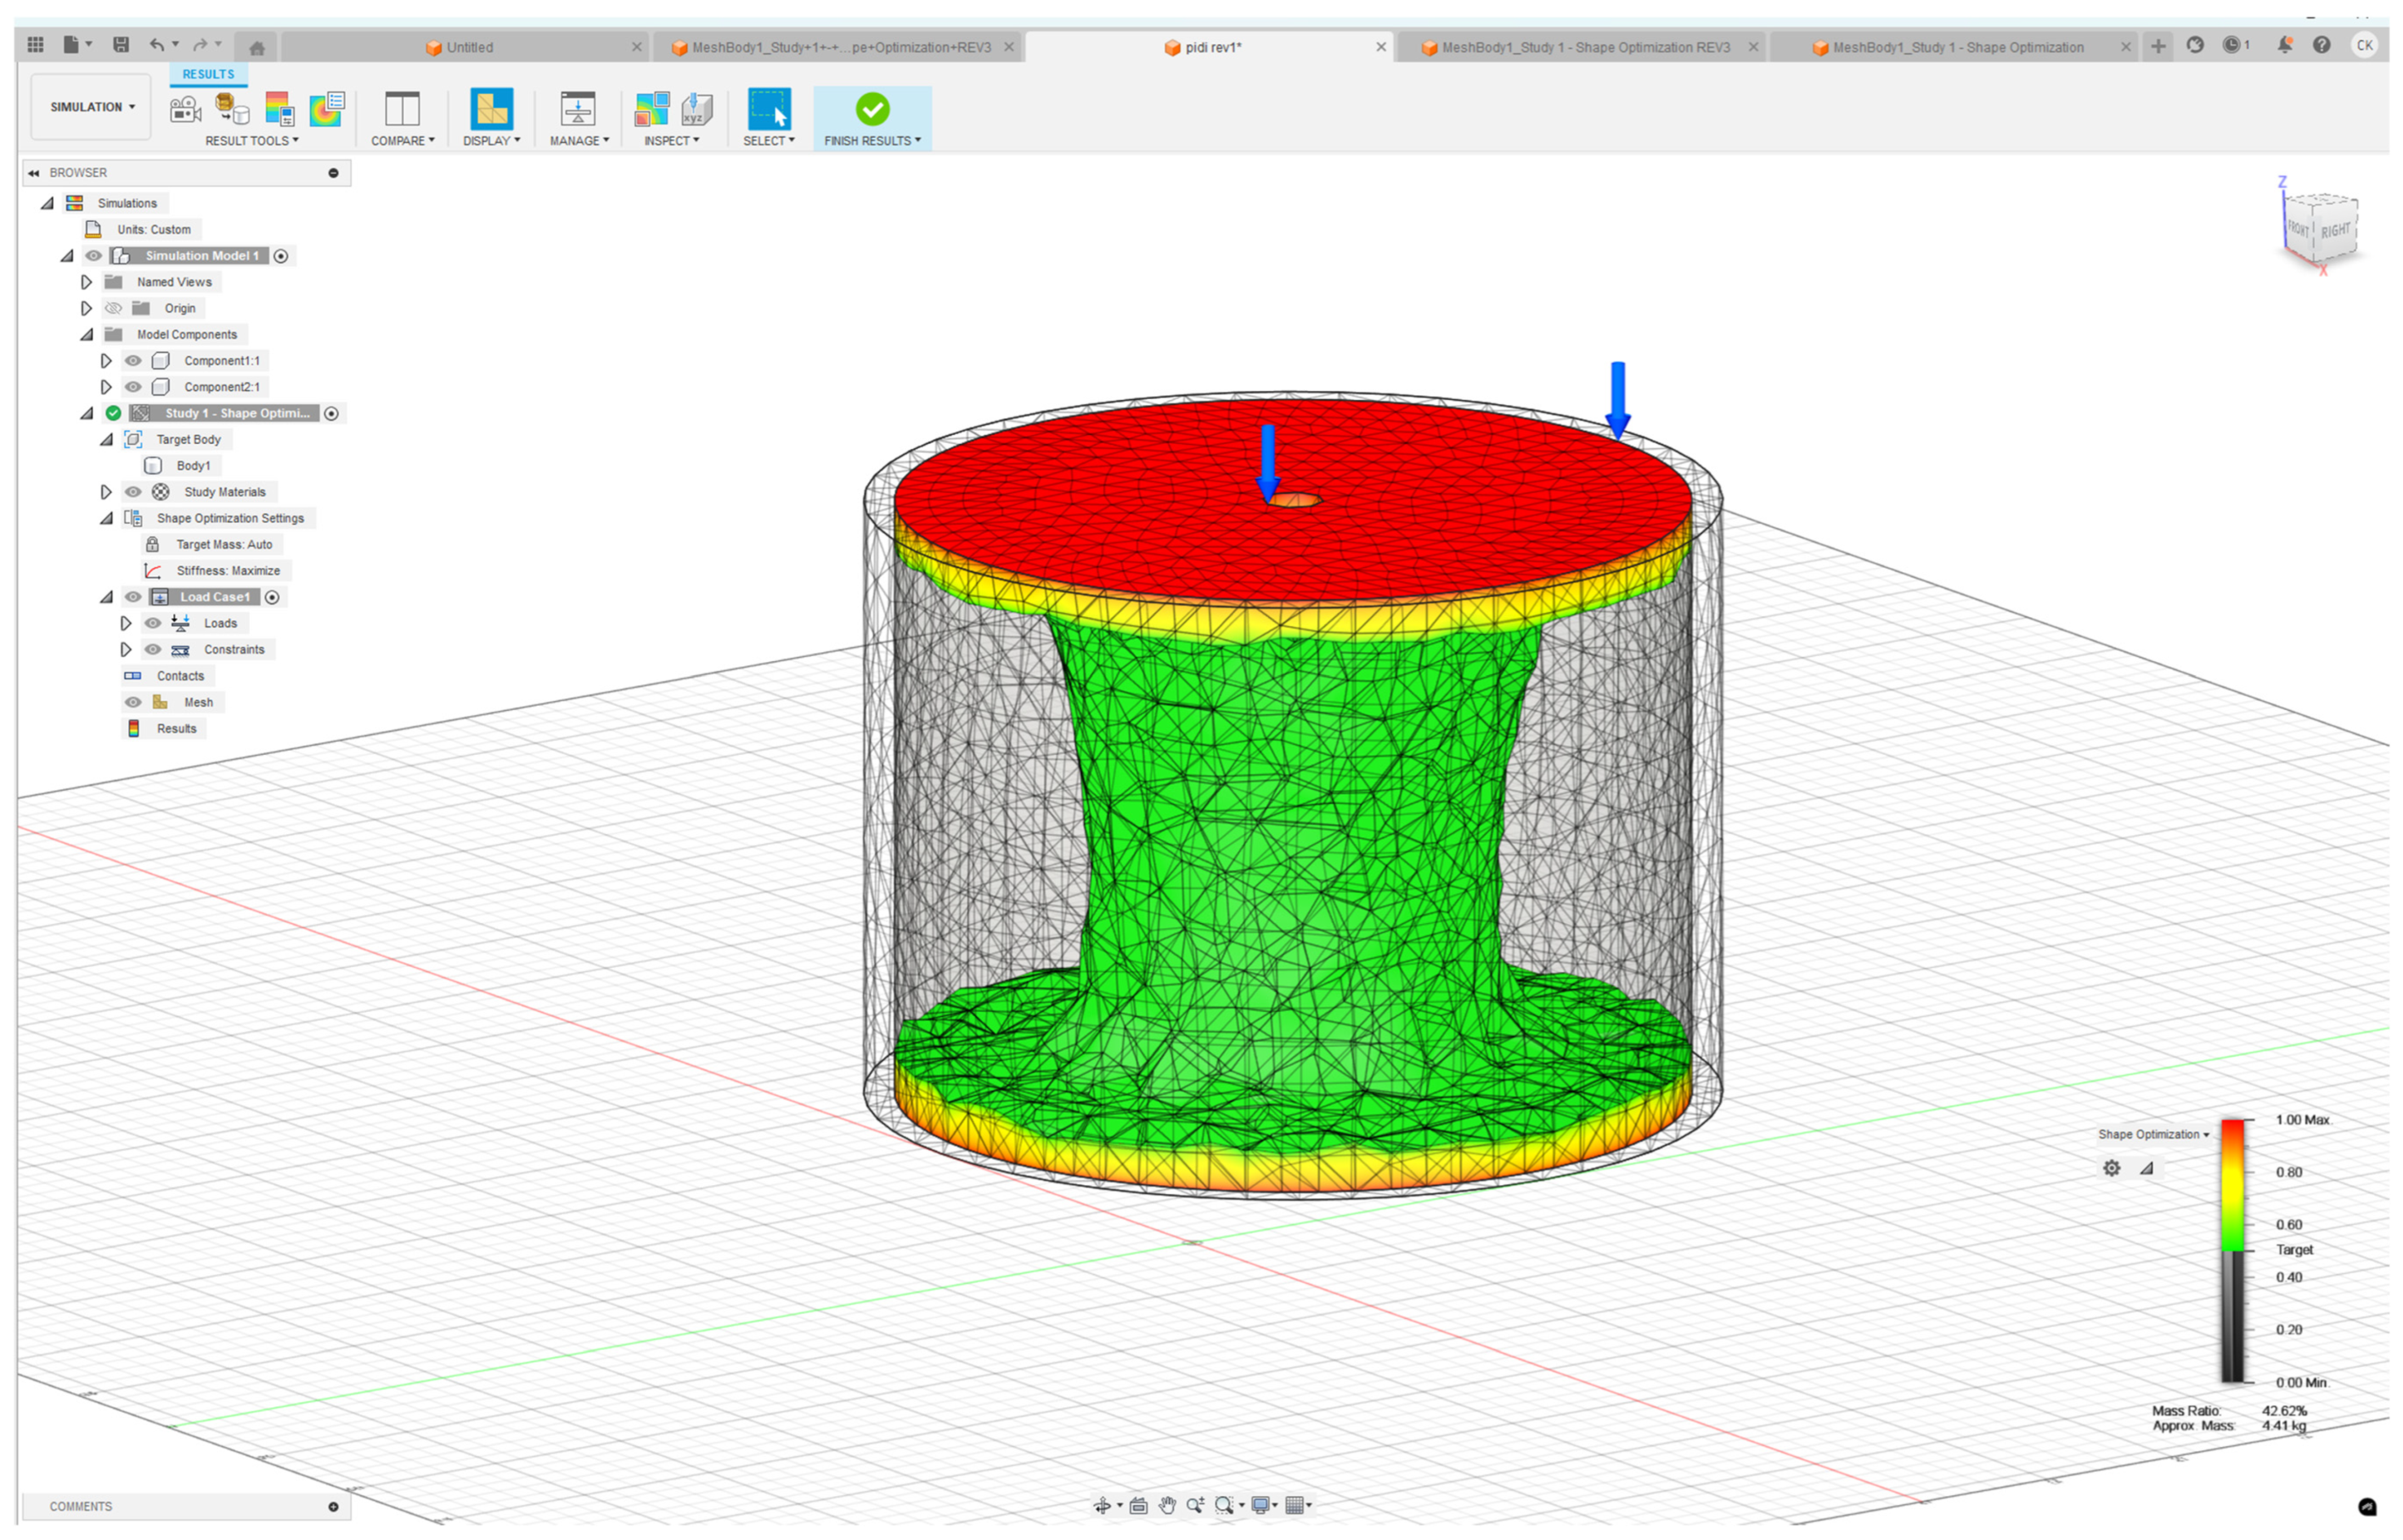
Figure 4.
TO results in Fusion 360.
Figure 4.
TO results in Fusion 360.
Figure 5.
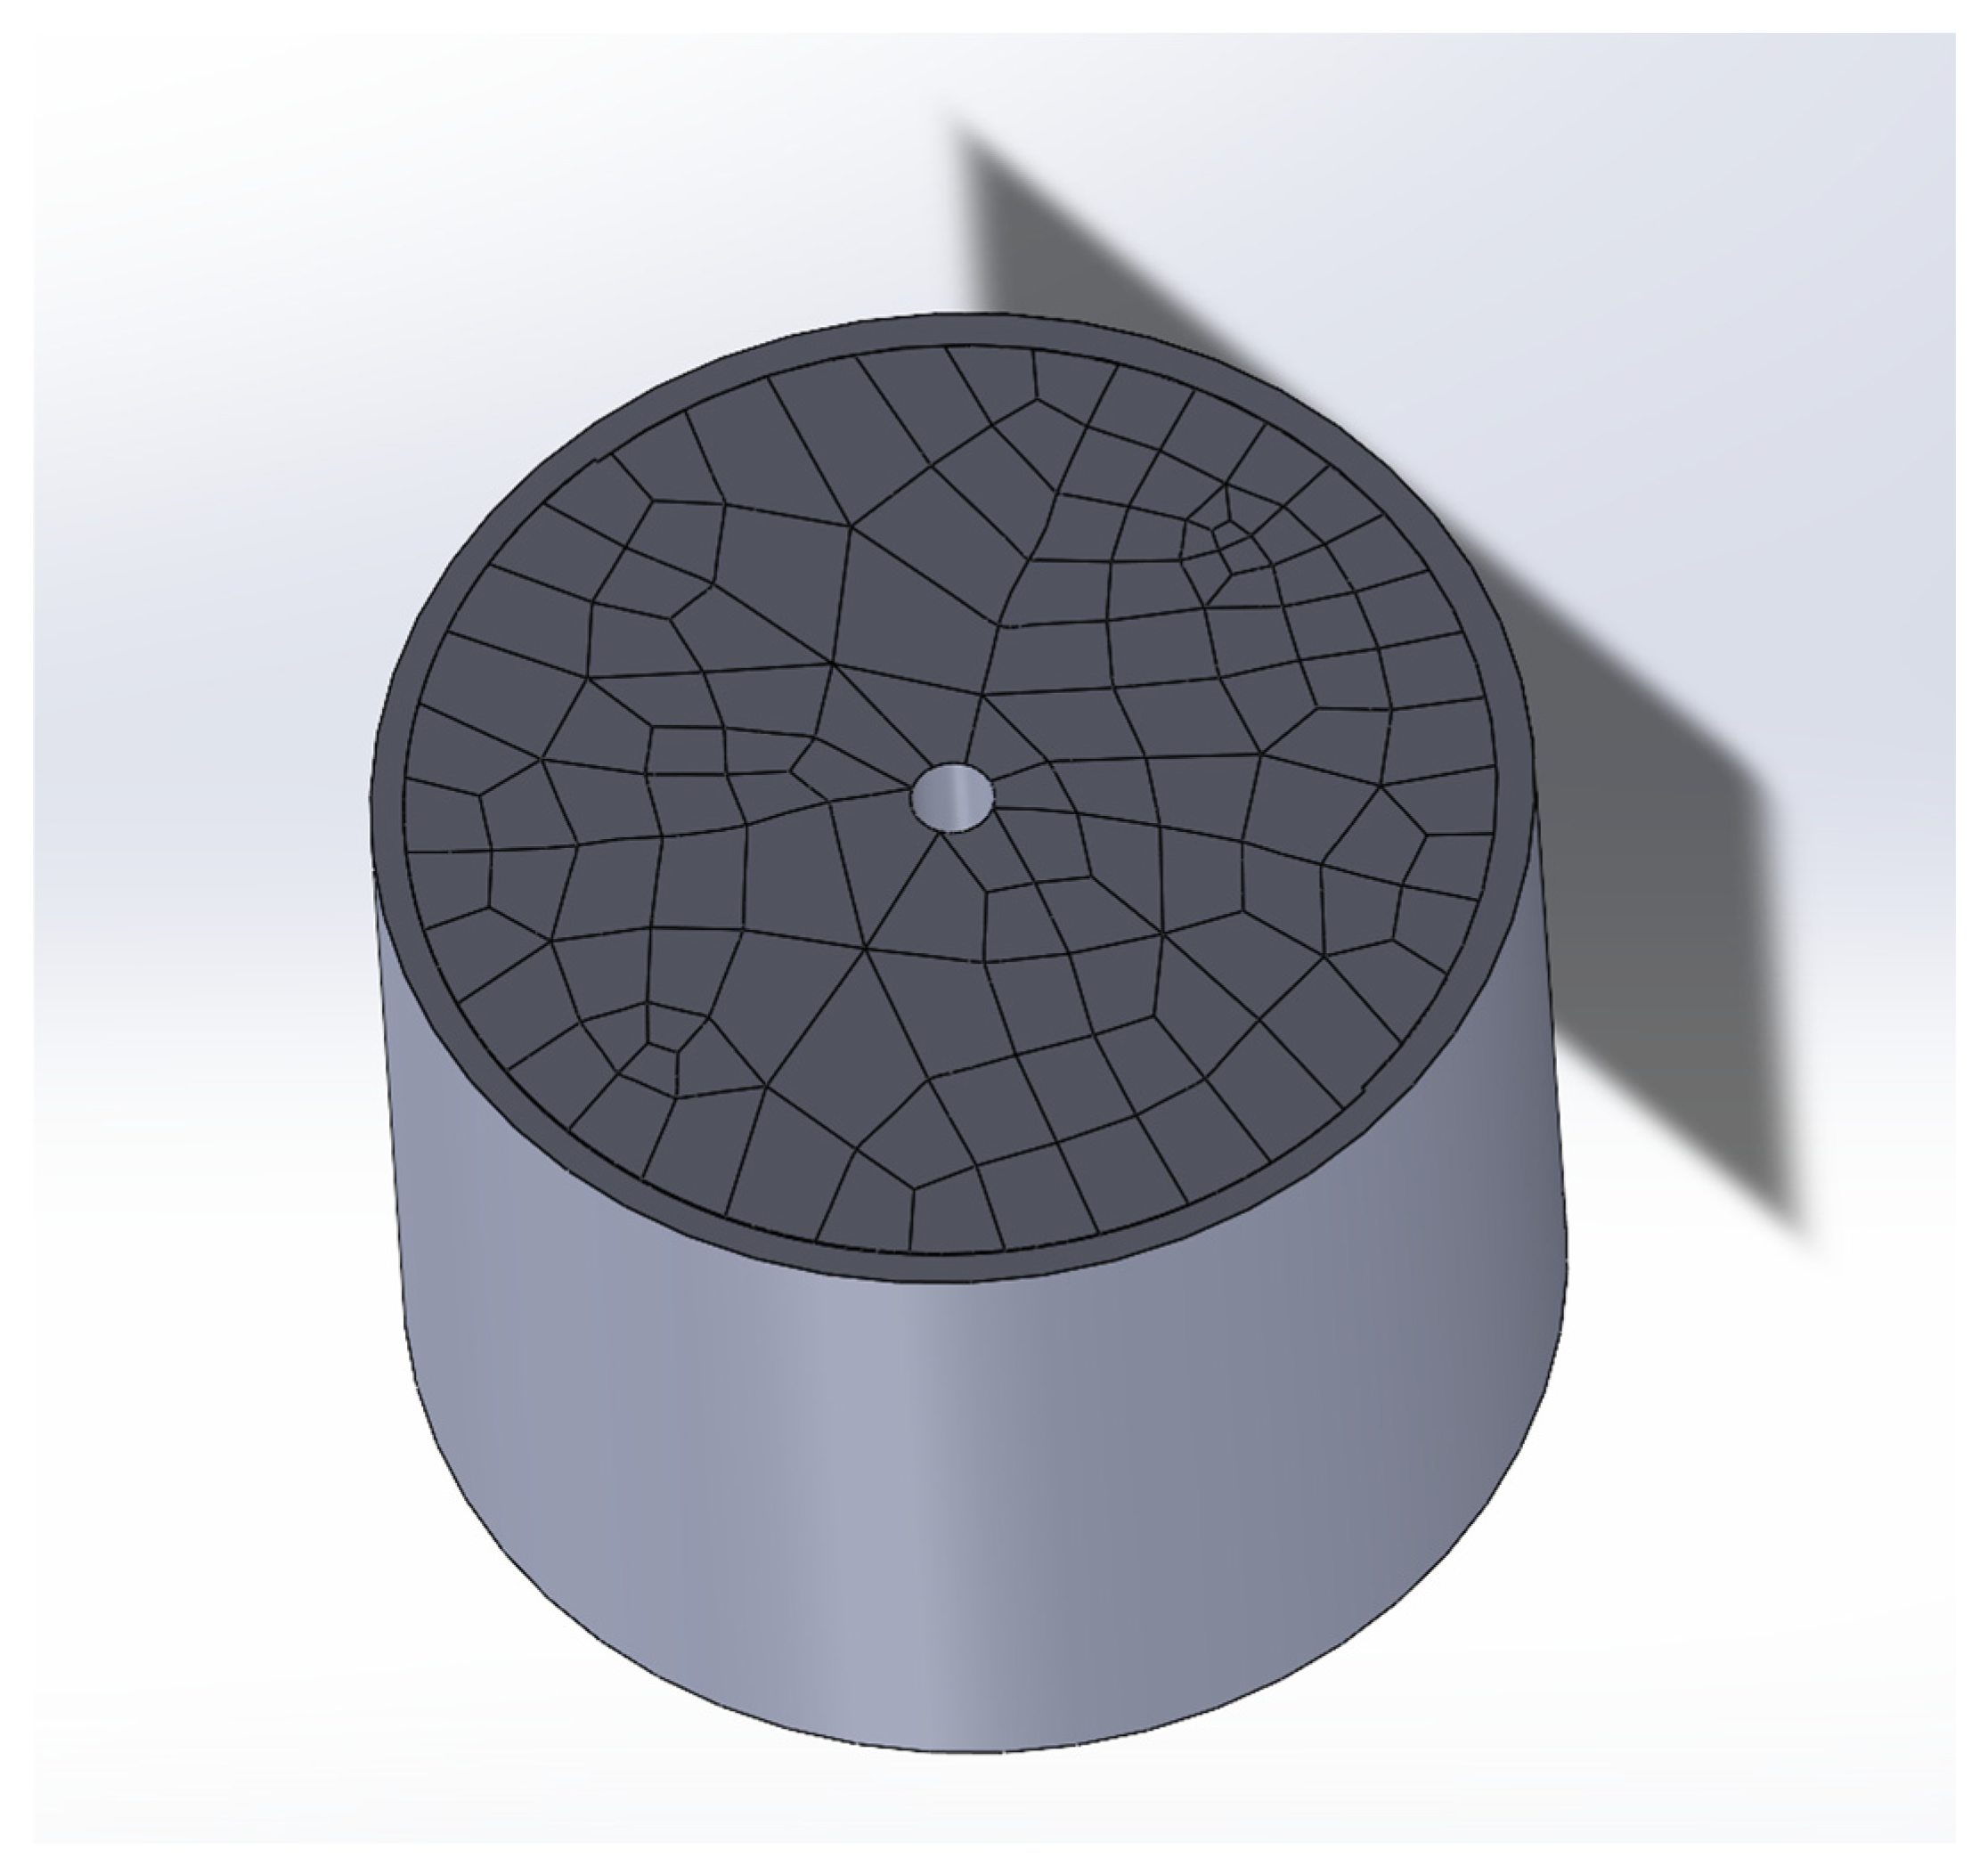
Final part in CAD.
Figure 5.
Final part in CAD.
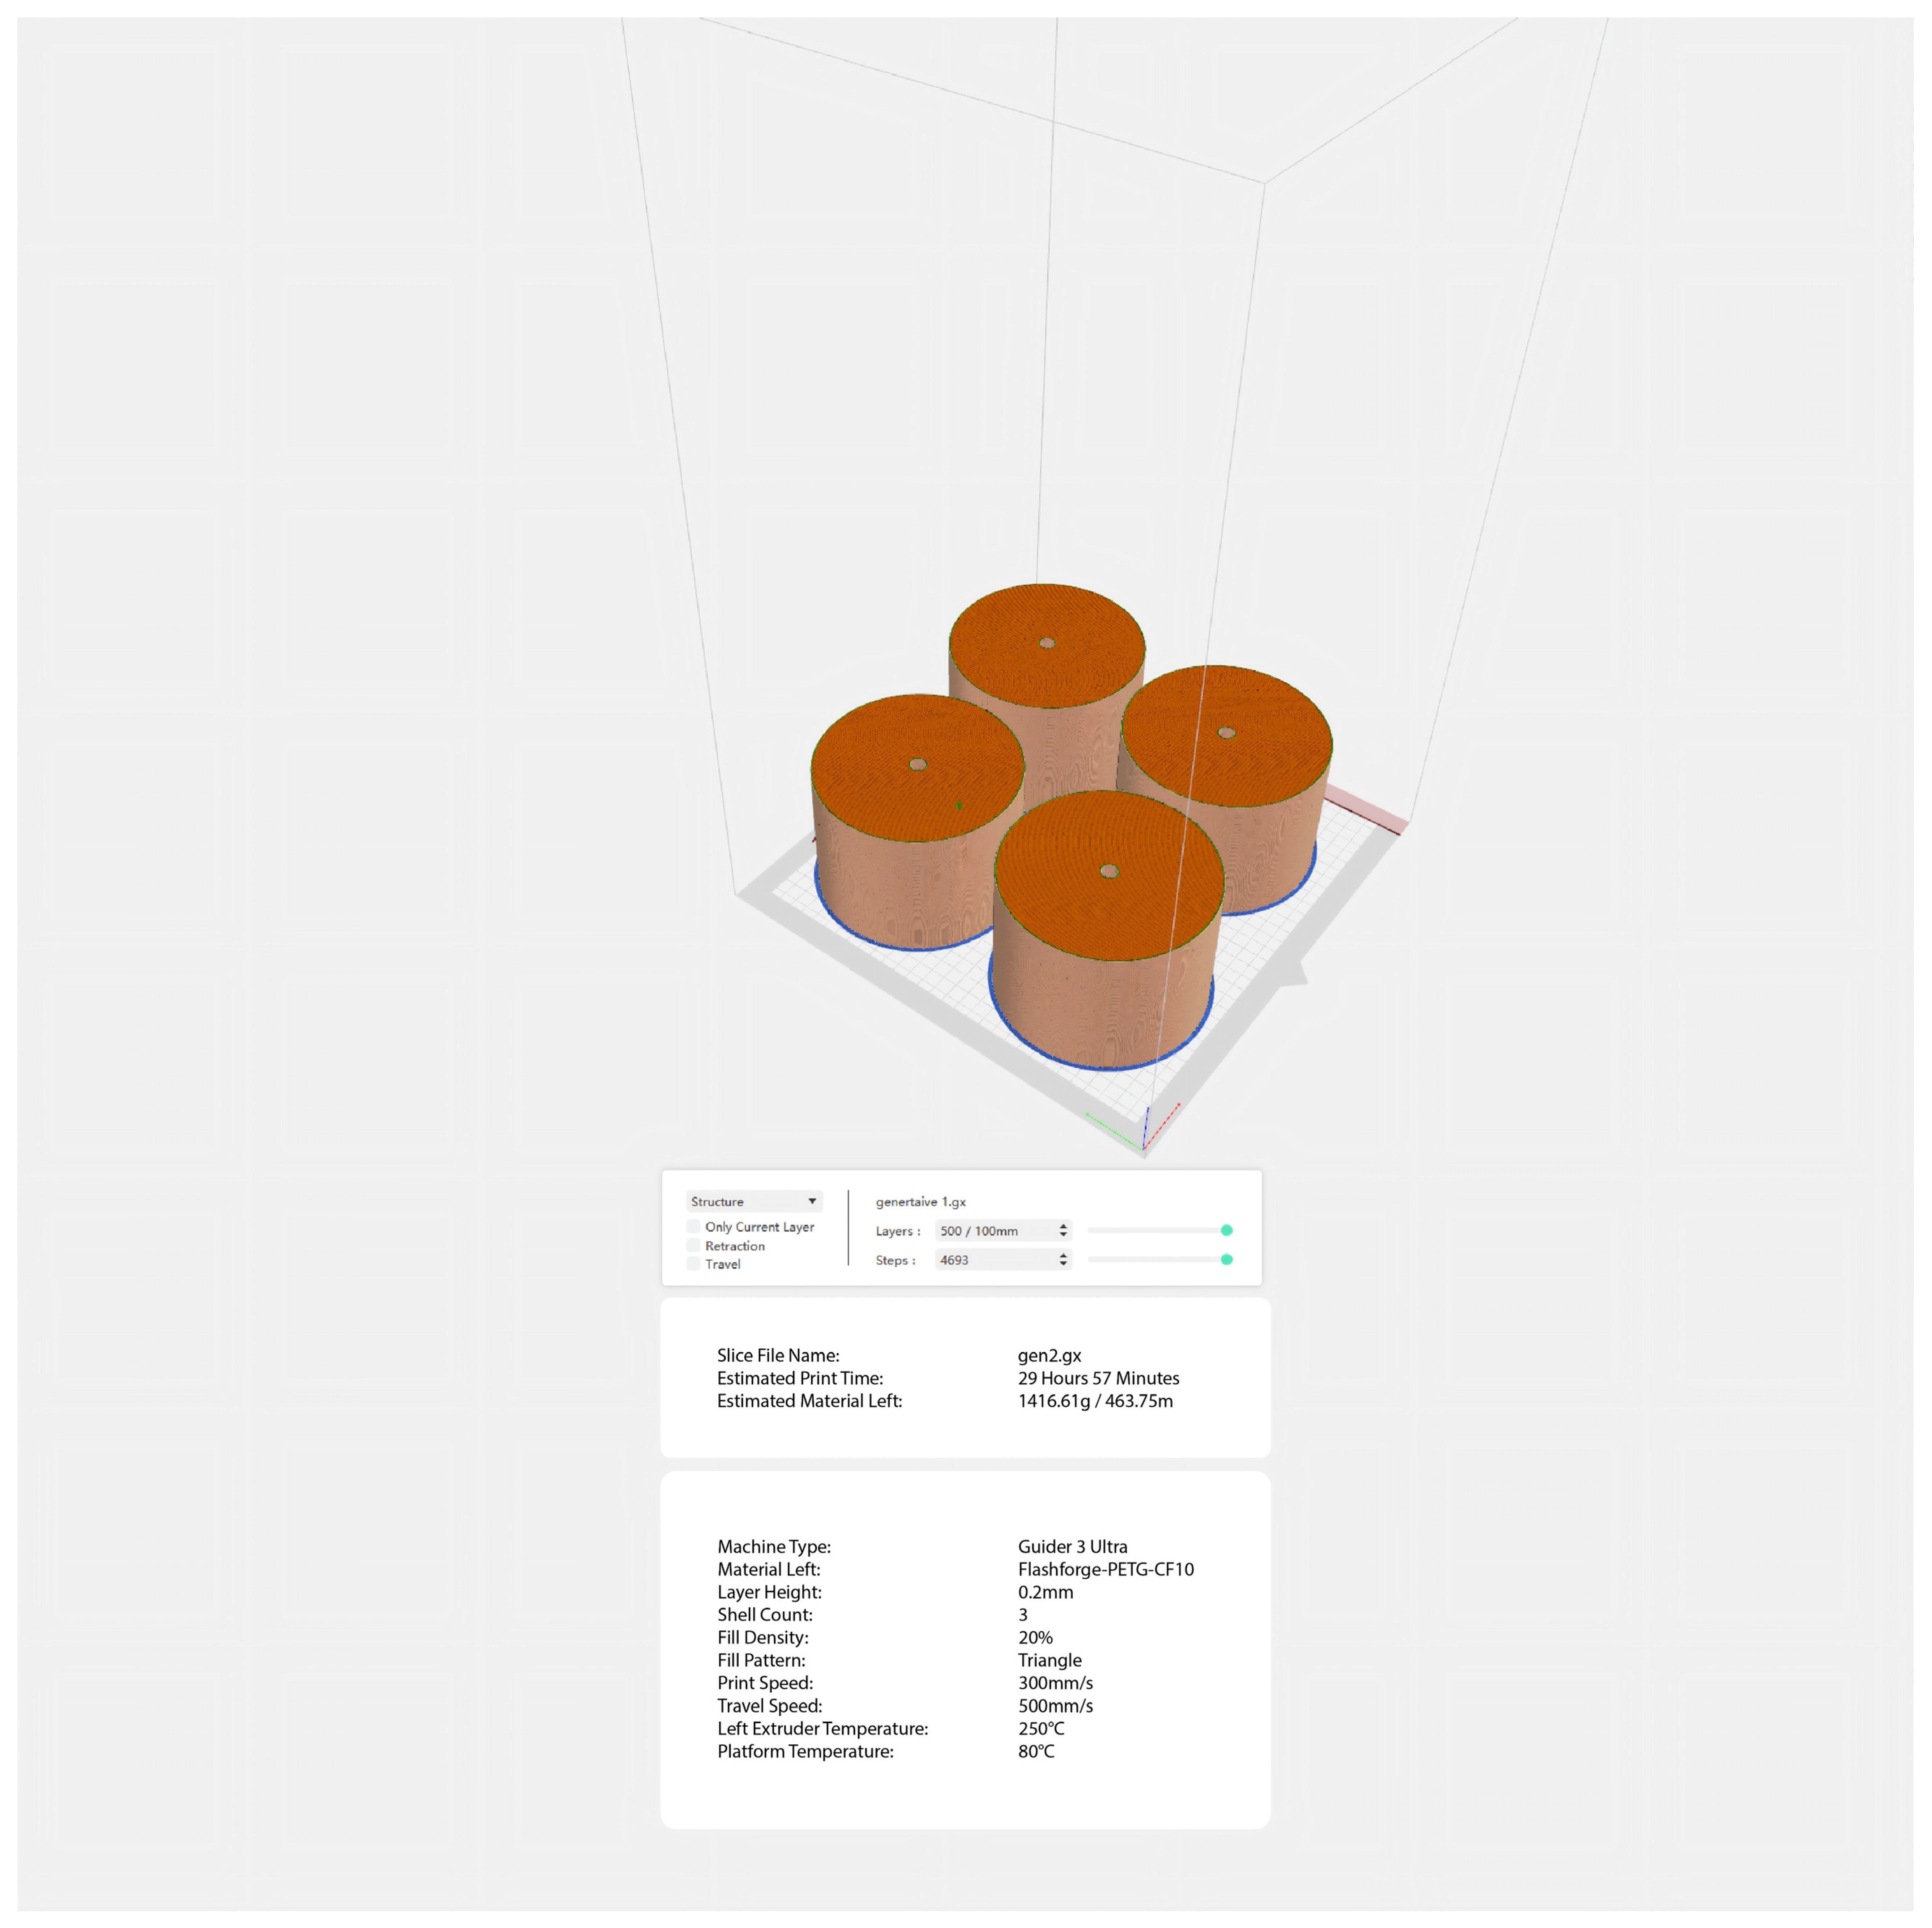
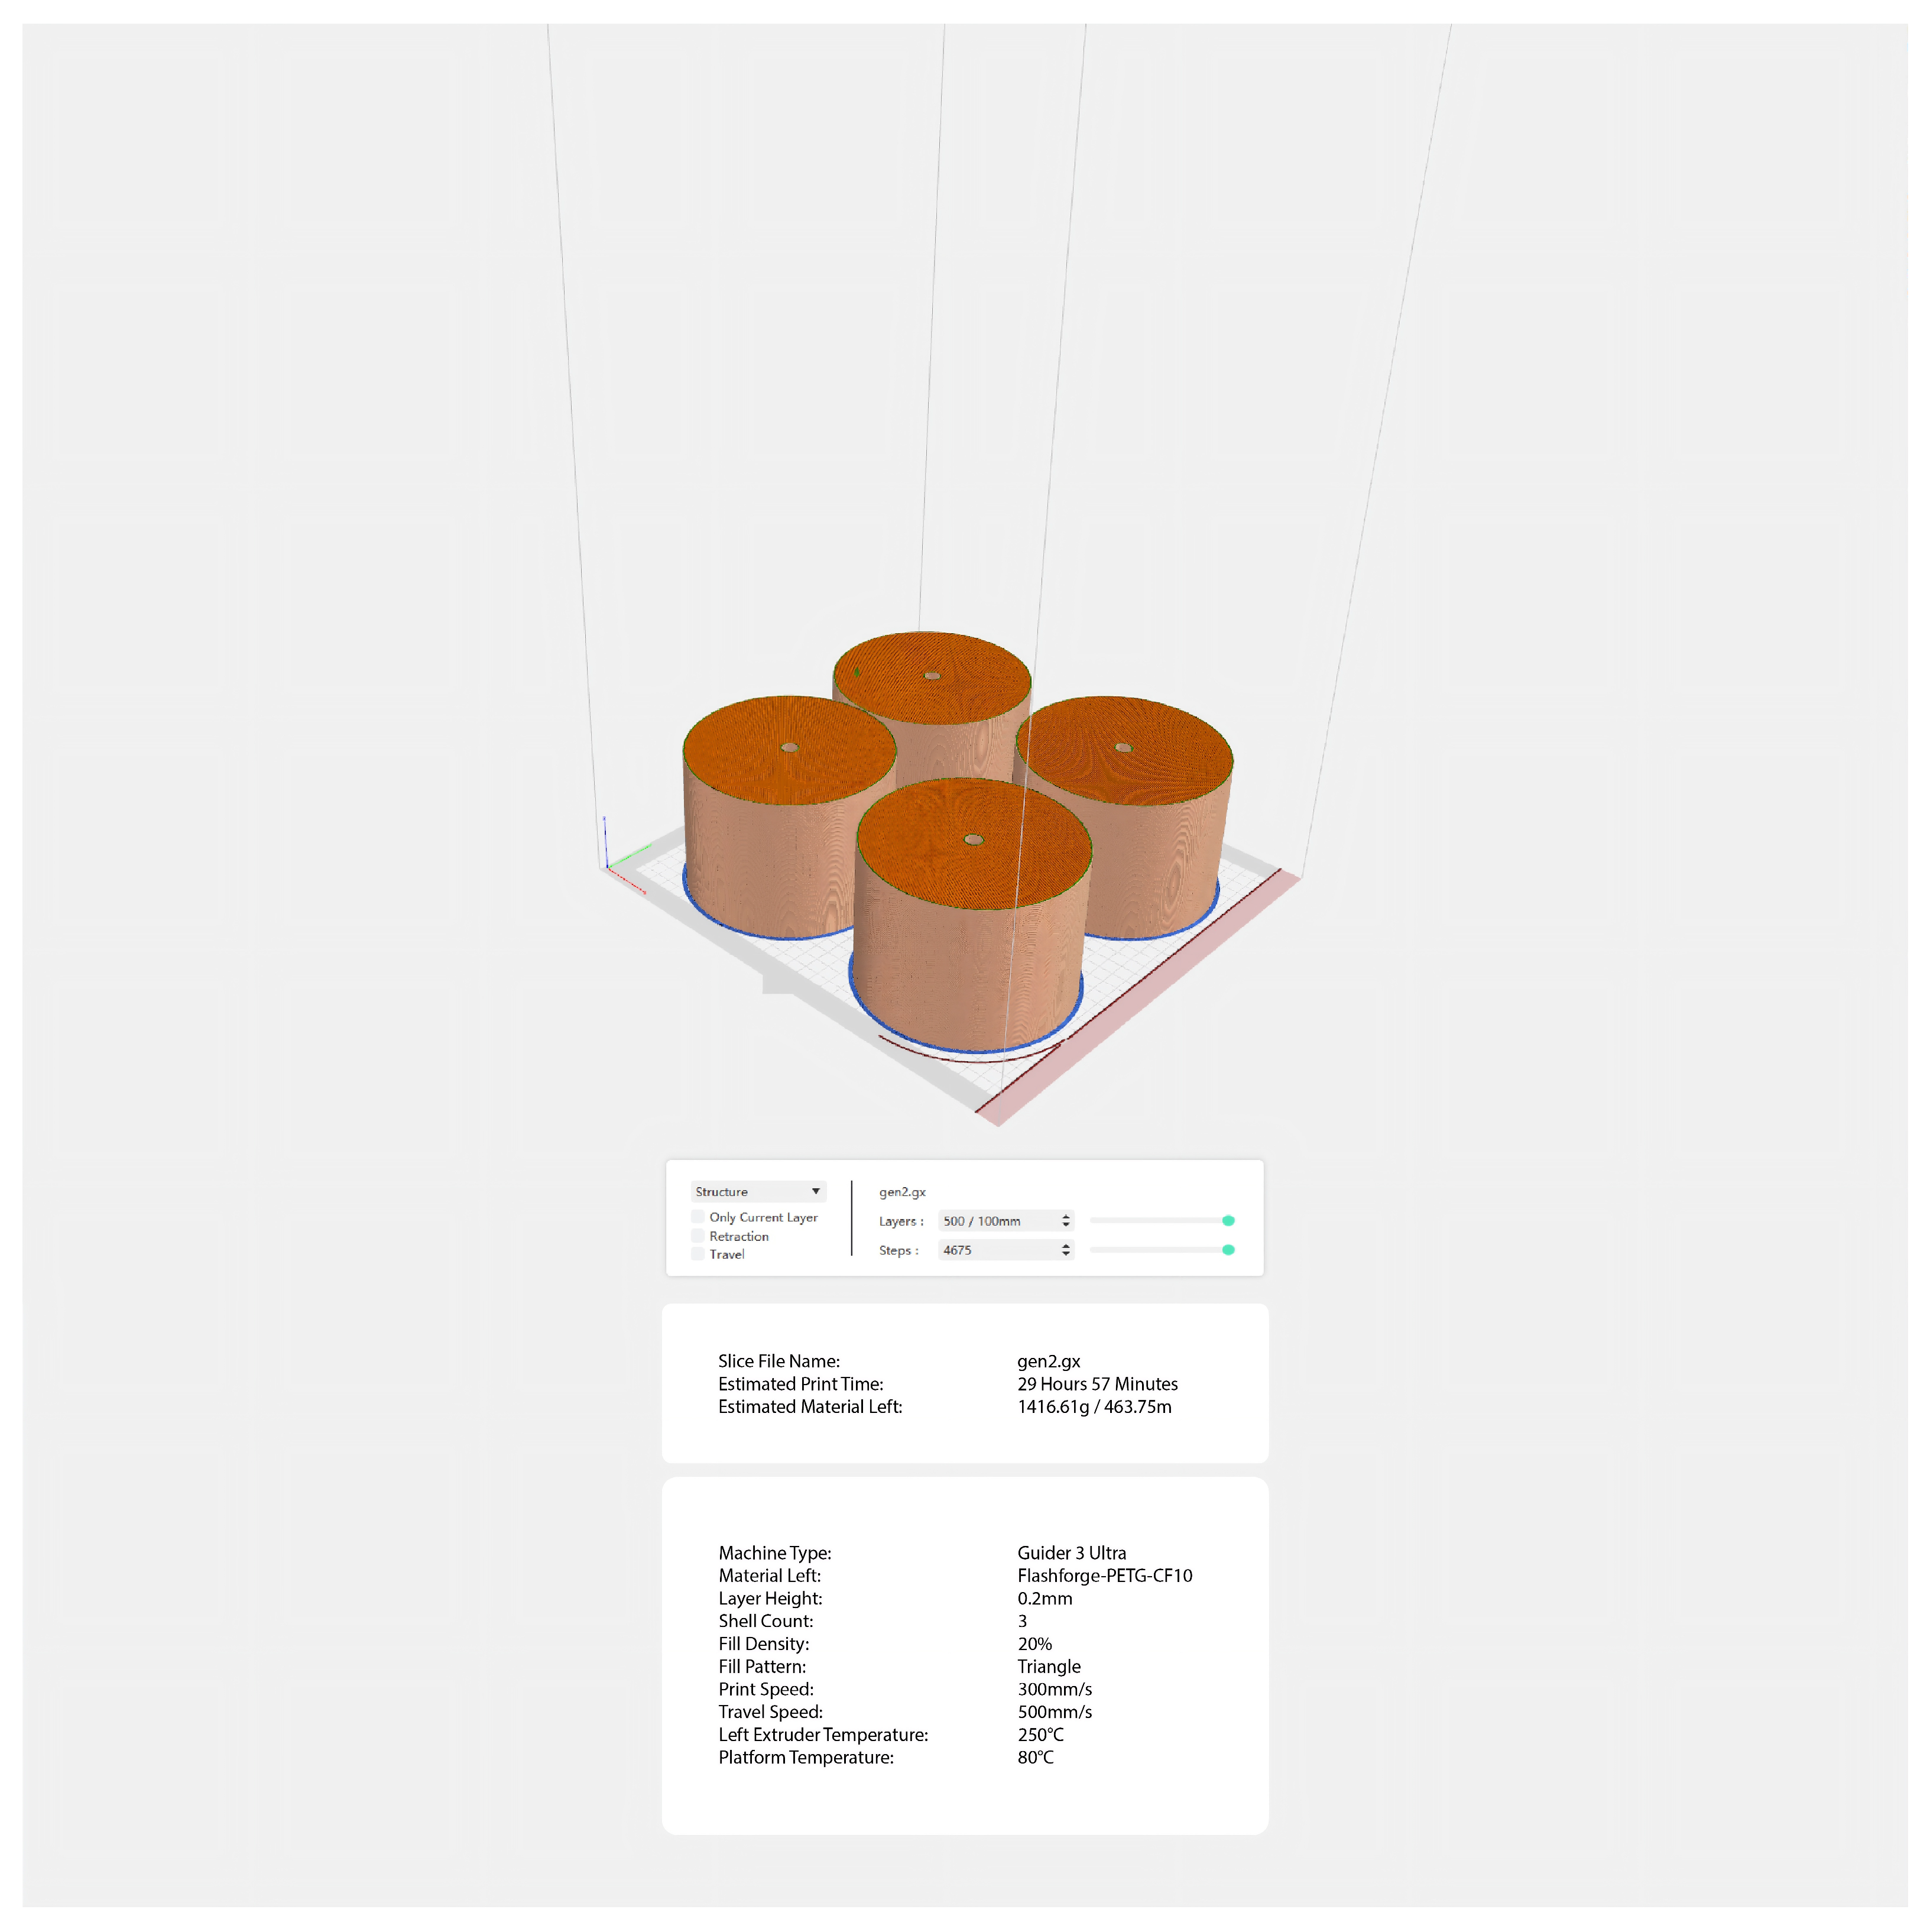
Figure 6.
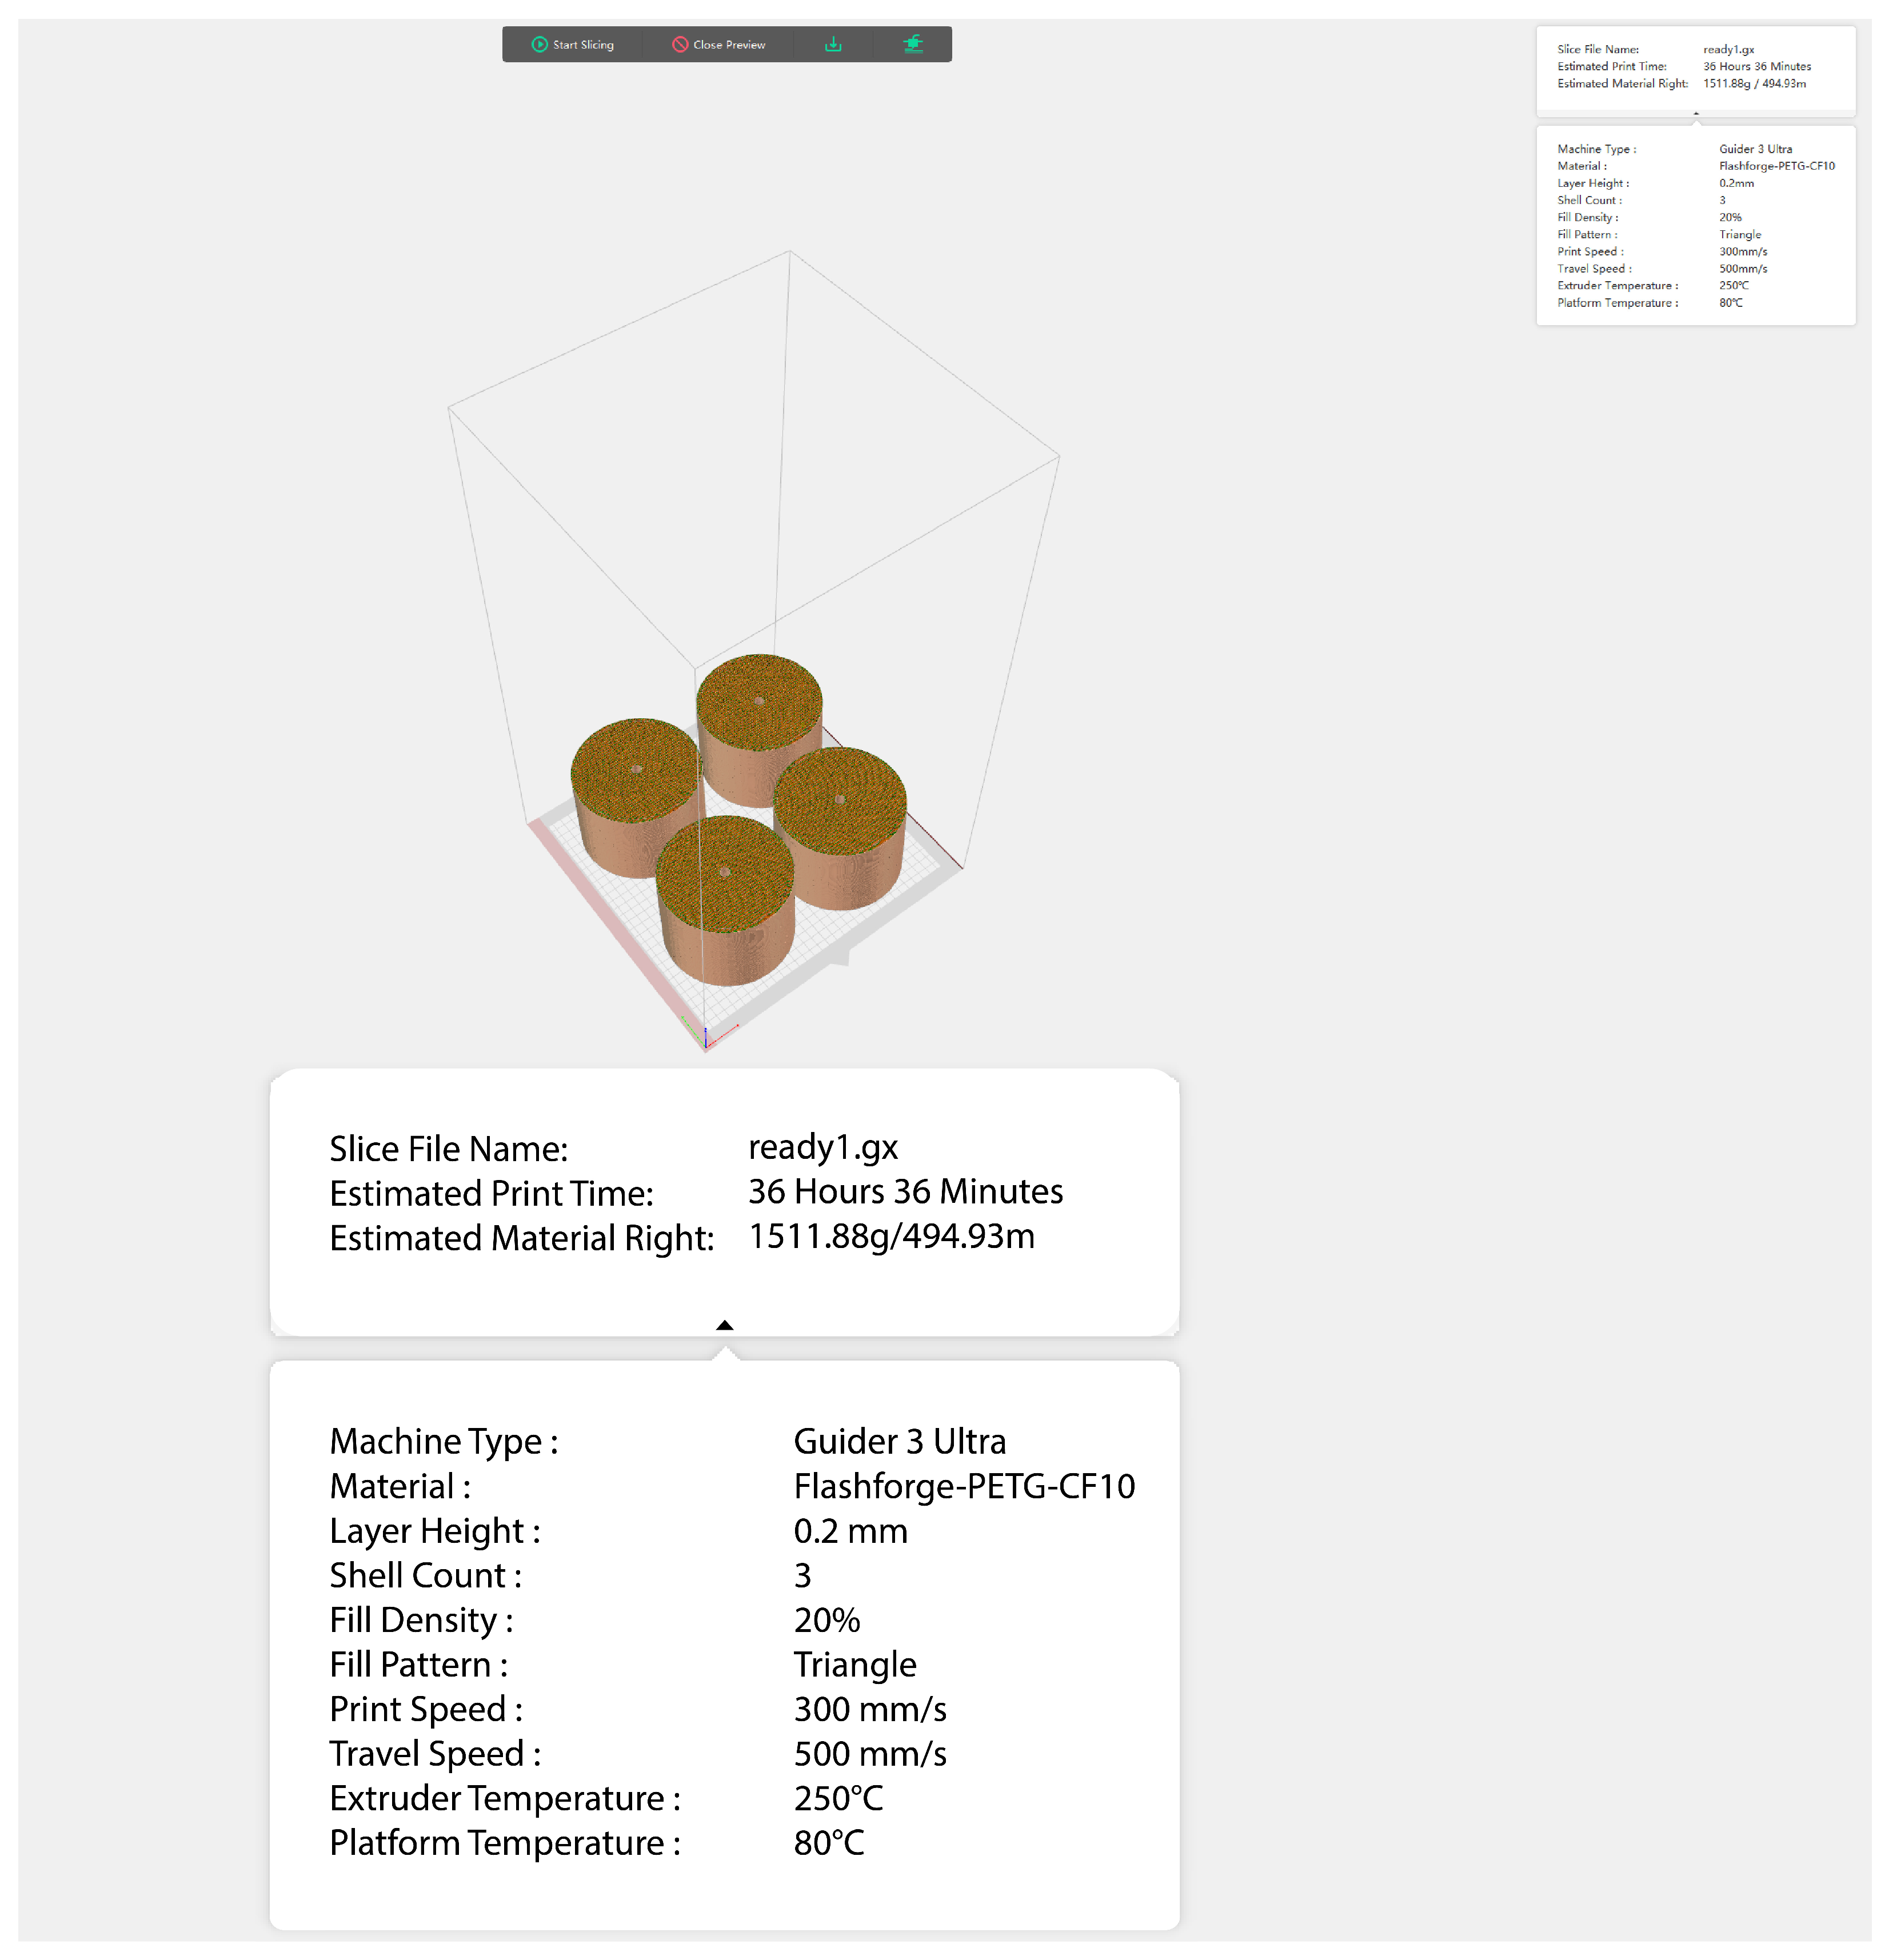
Slicing results of the TO scenario legs.
Figure 6.
Slicing results of the TO scenario legs.
Figure 7.
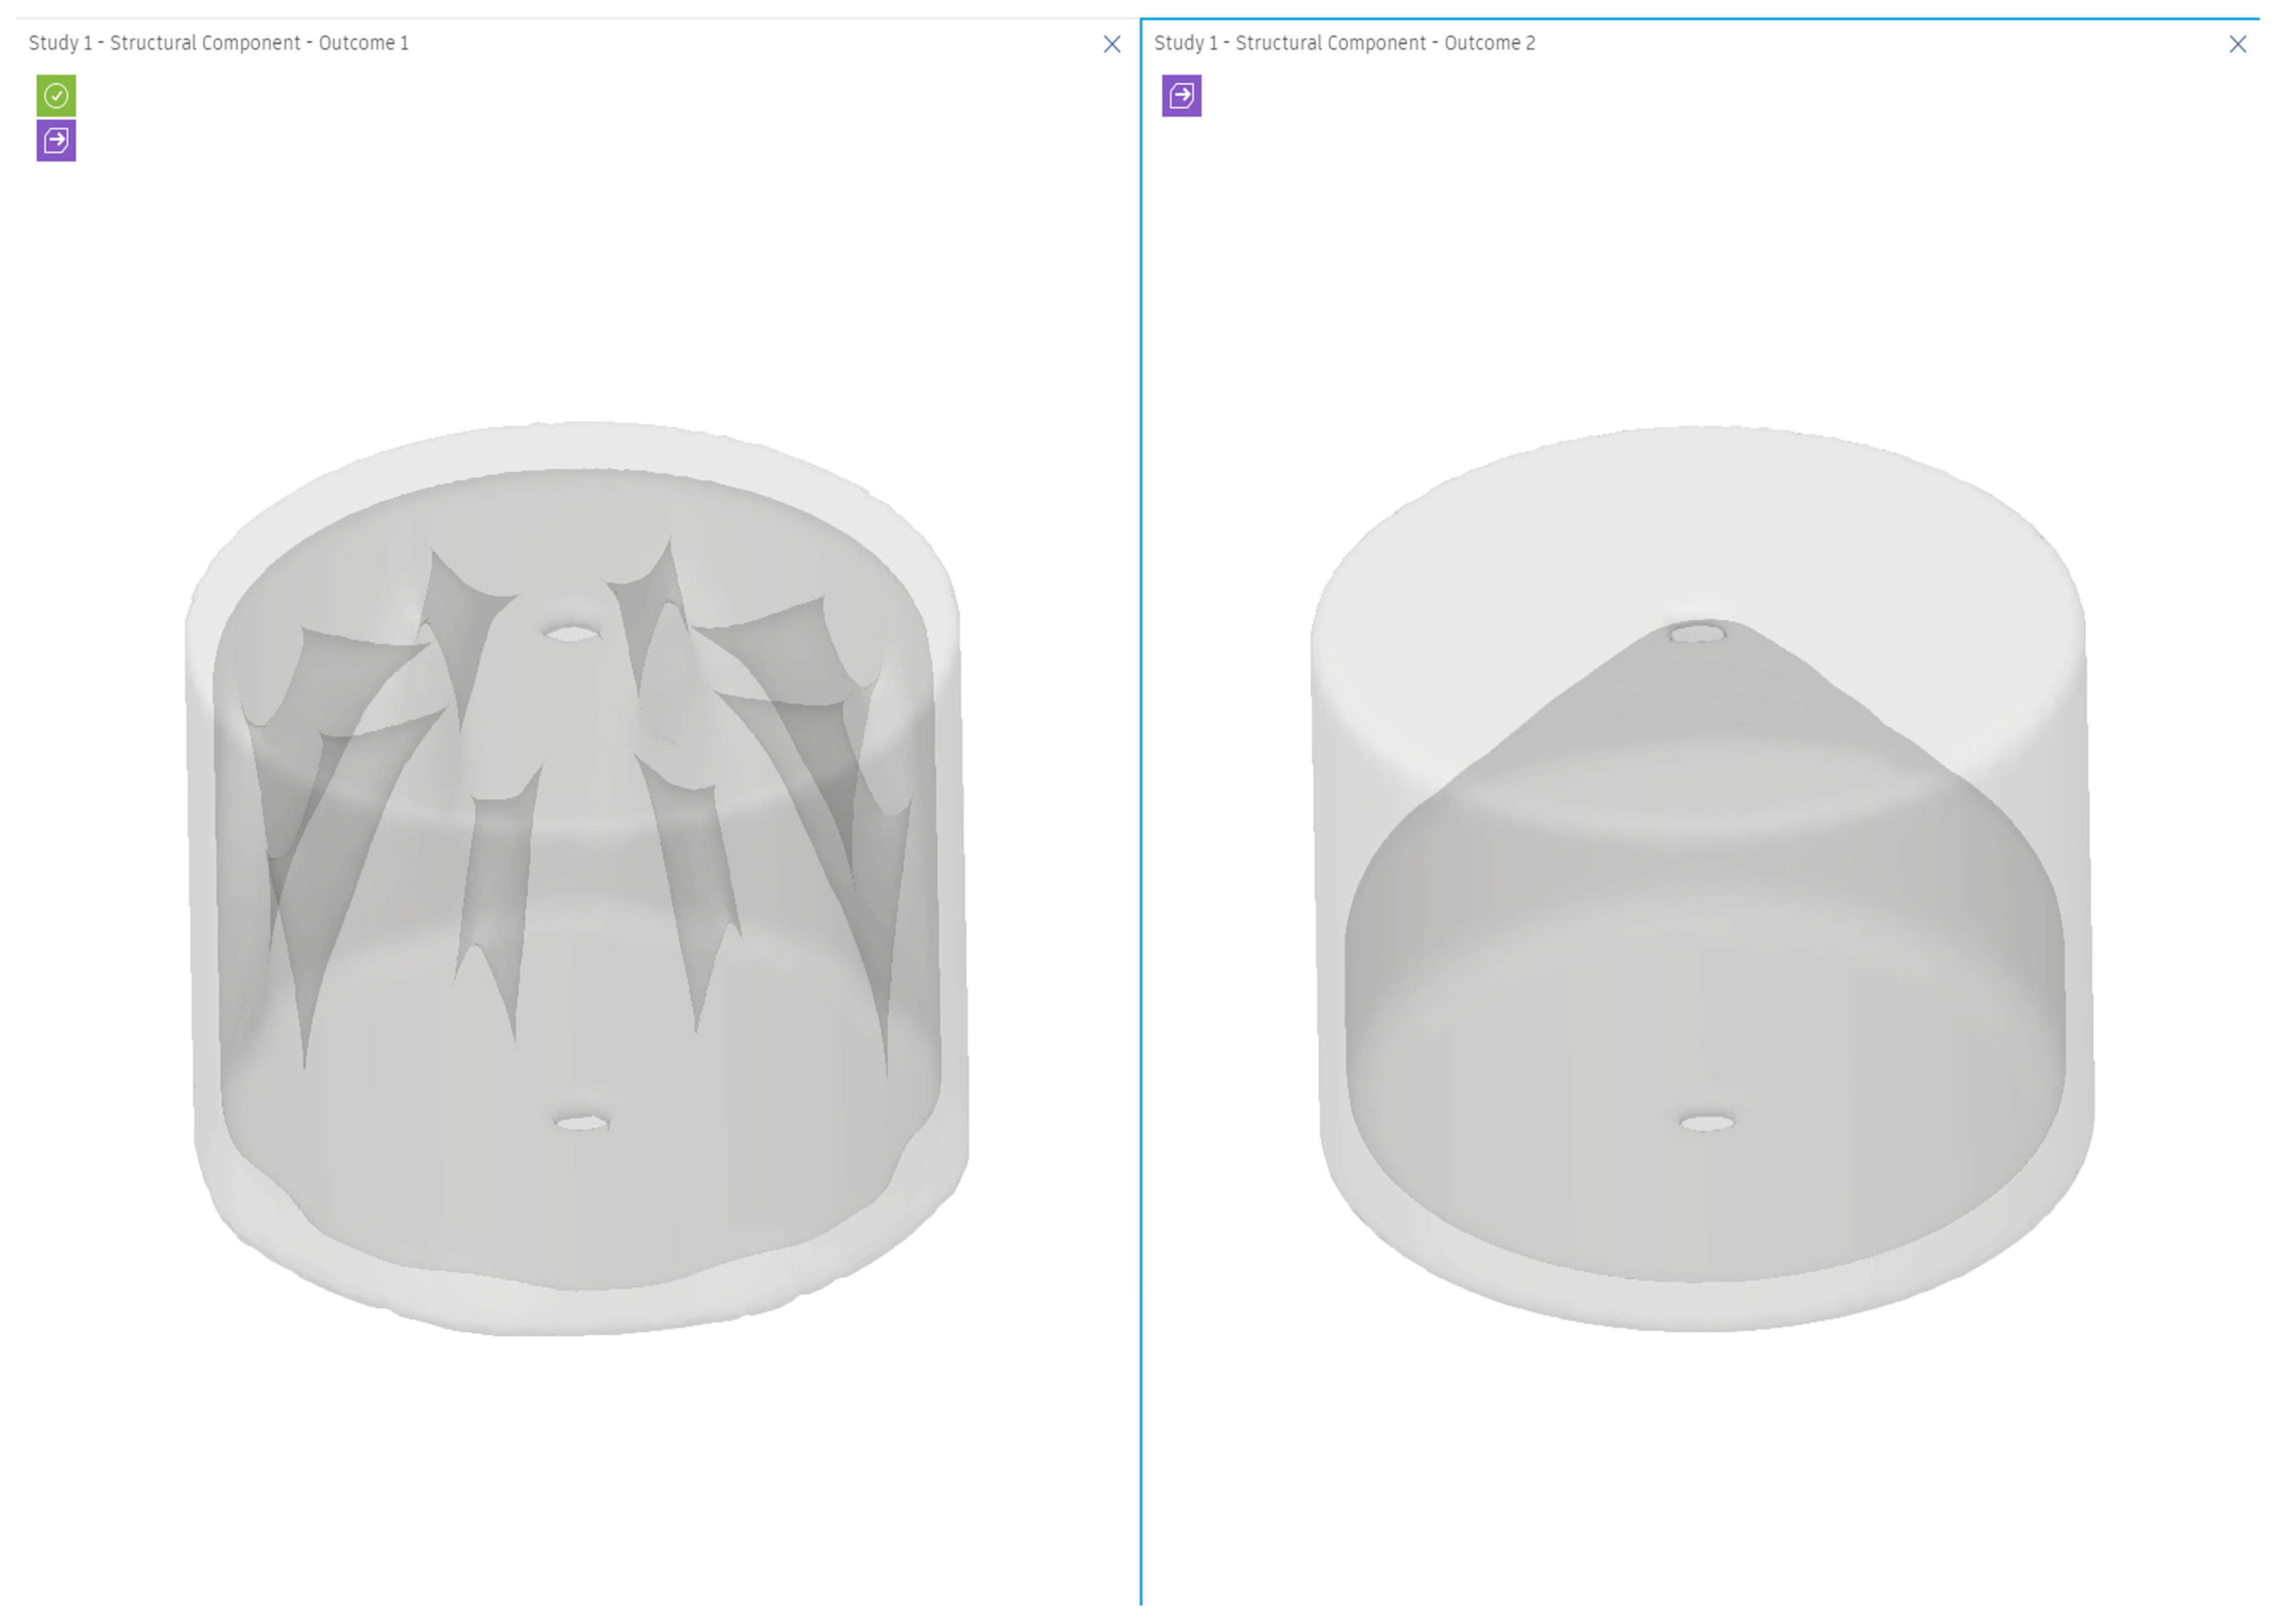
GD Results in Fusion 360.
Figure 7.
GD Results in Fusion 360.
Figure 8.
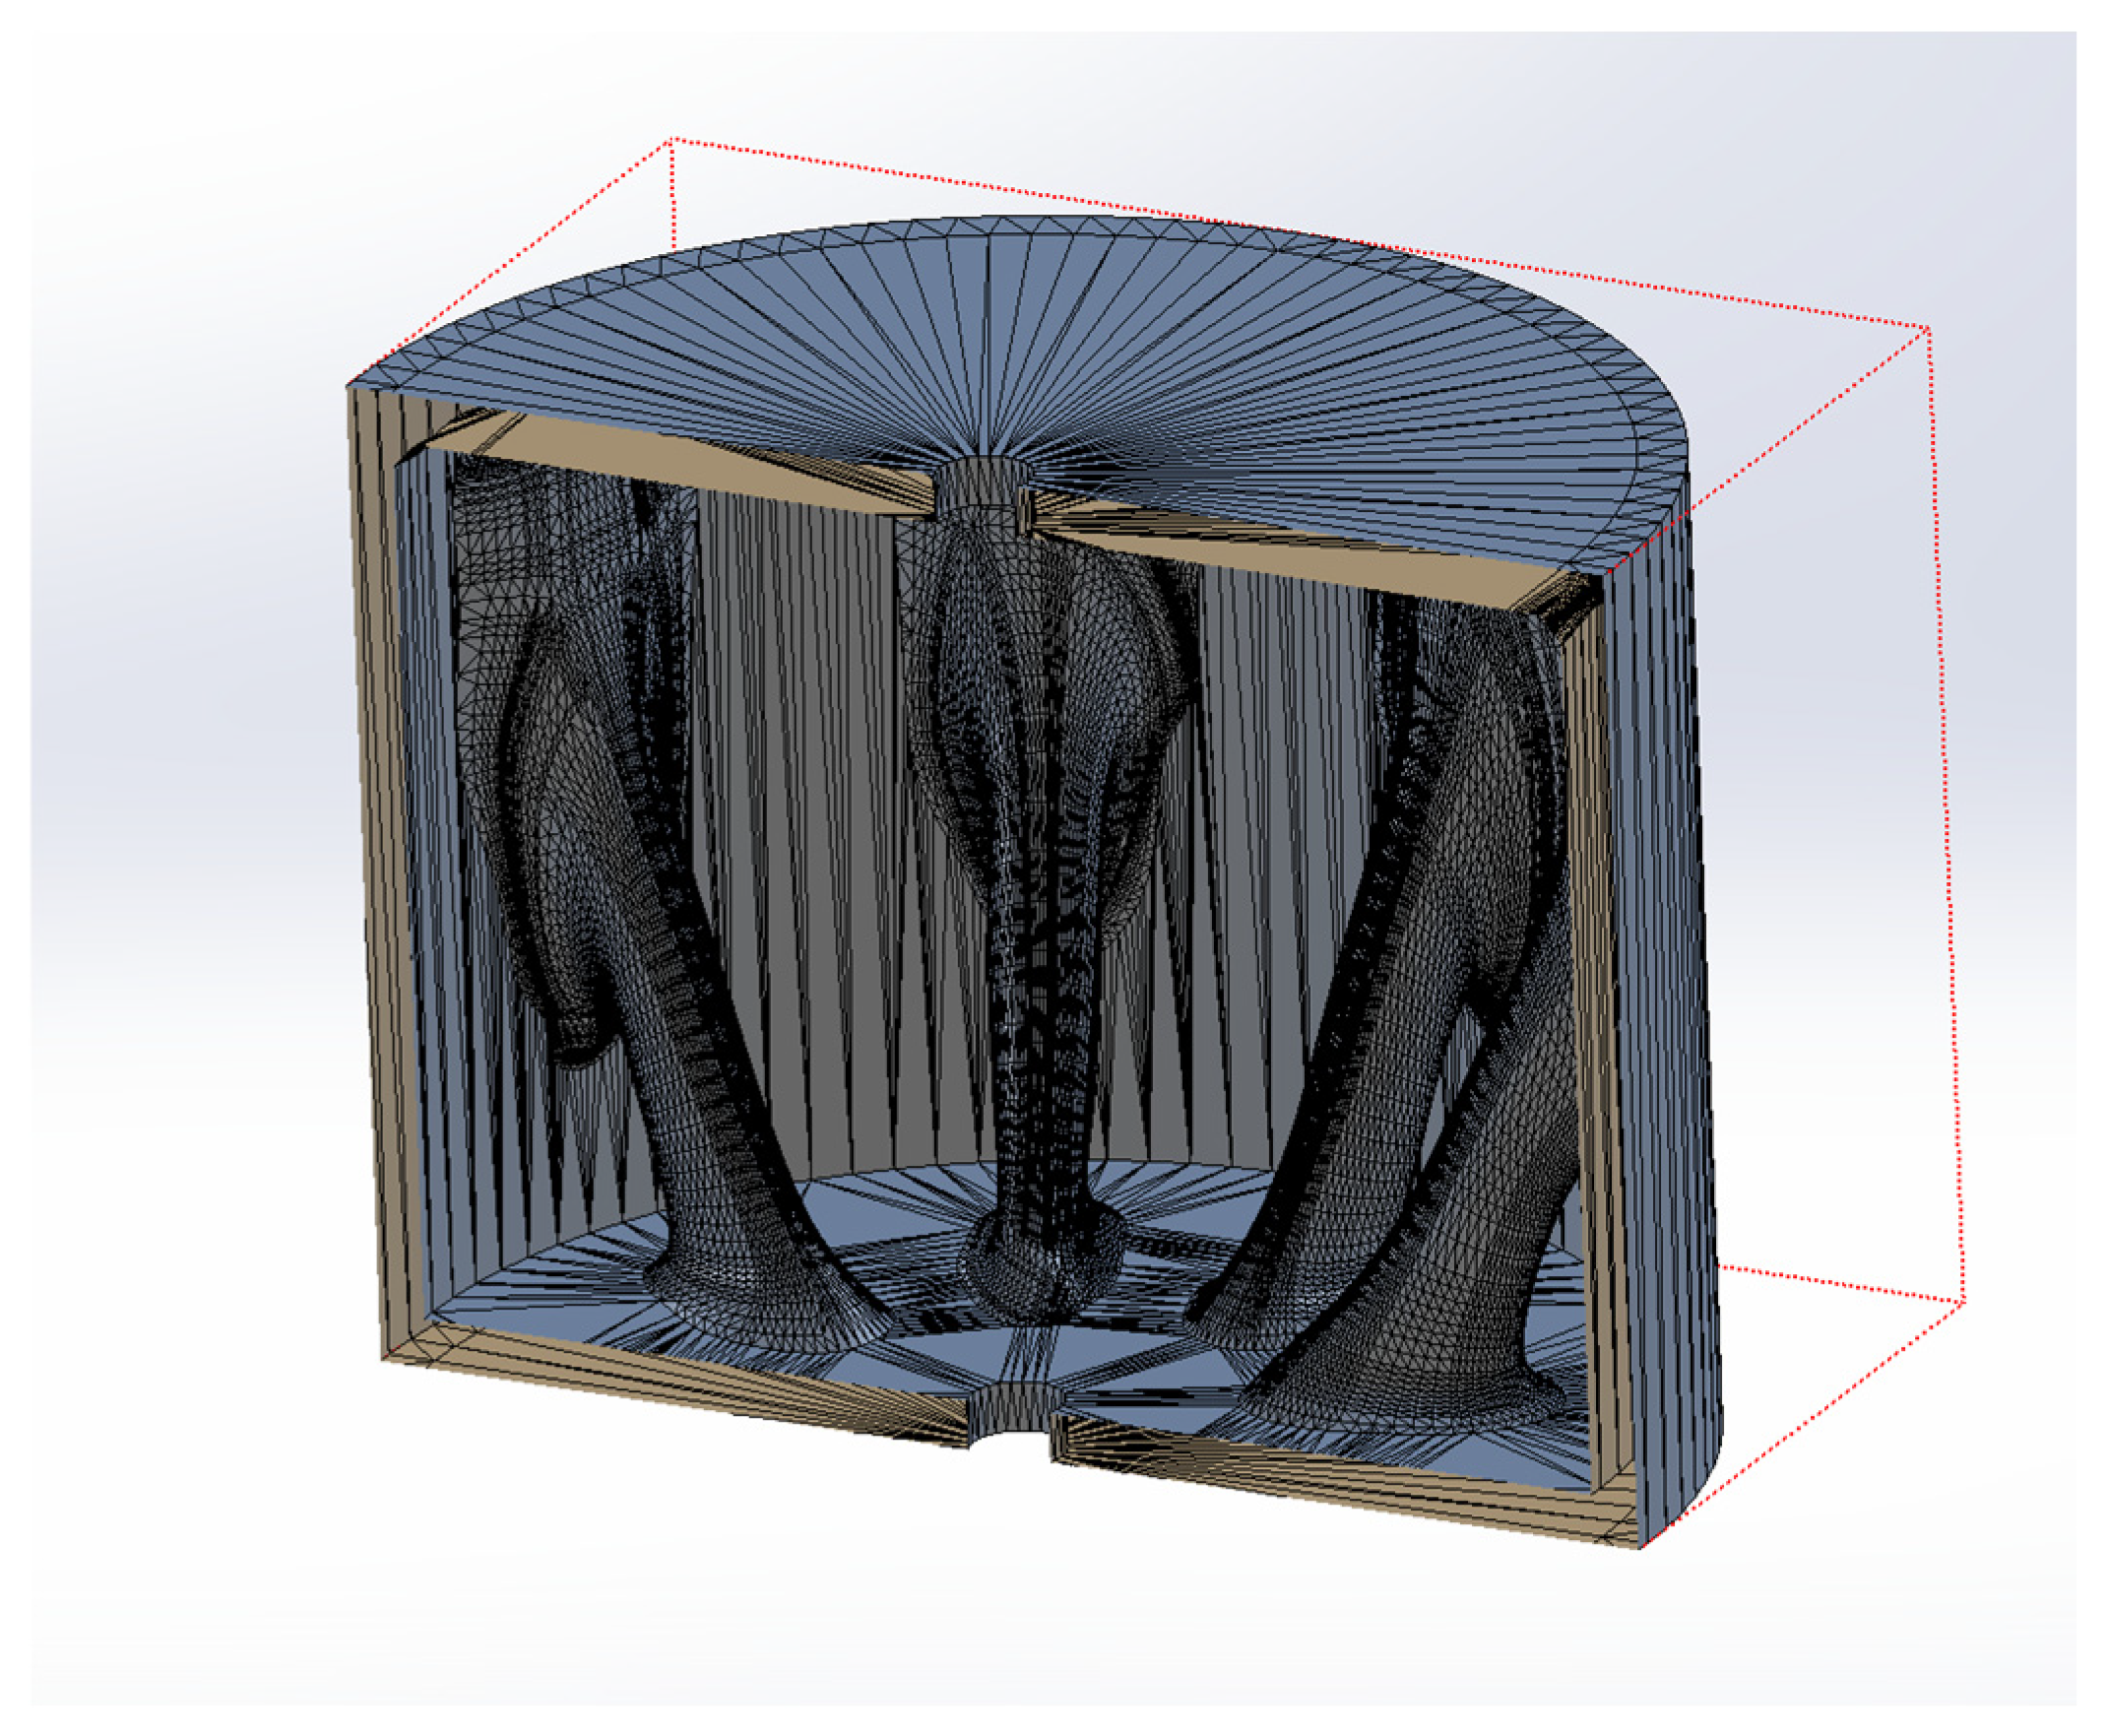
Cross section of GD of GD Outcome 1.
Figure 8.
Cross section of GD of GD Outcome 1.
Figure 9.
Cross section of GD of GD Outcome 2.
Figure 9.
Cross section of GD of GD Outcome 2.
Figure 10.
Slicing results of GD Outcome 1.
Figure 10.
Slicing results of GD Outcome 1.
Figure 11.
Slicing results of GD Outcome 2.
Figure 11.
Slicing results of GD Outcome 2.
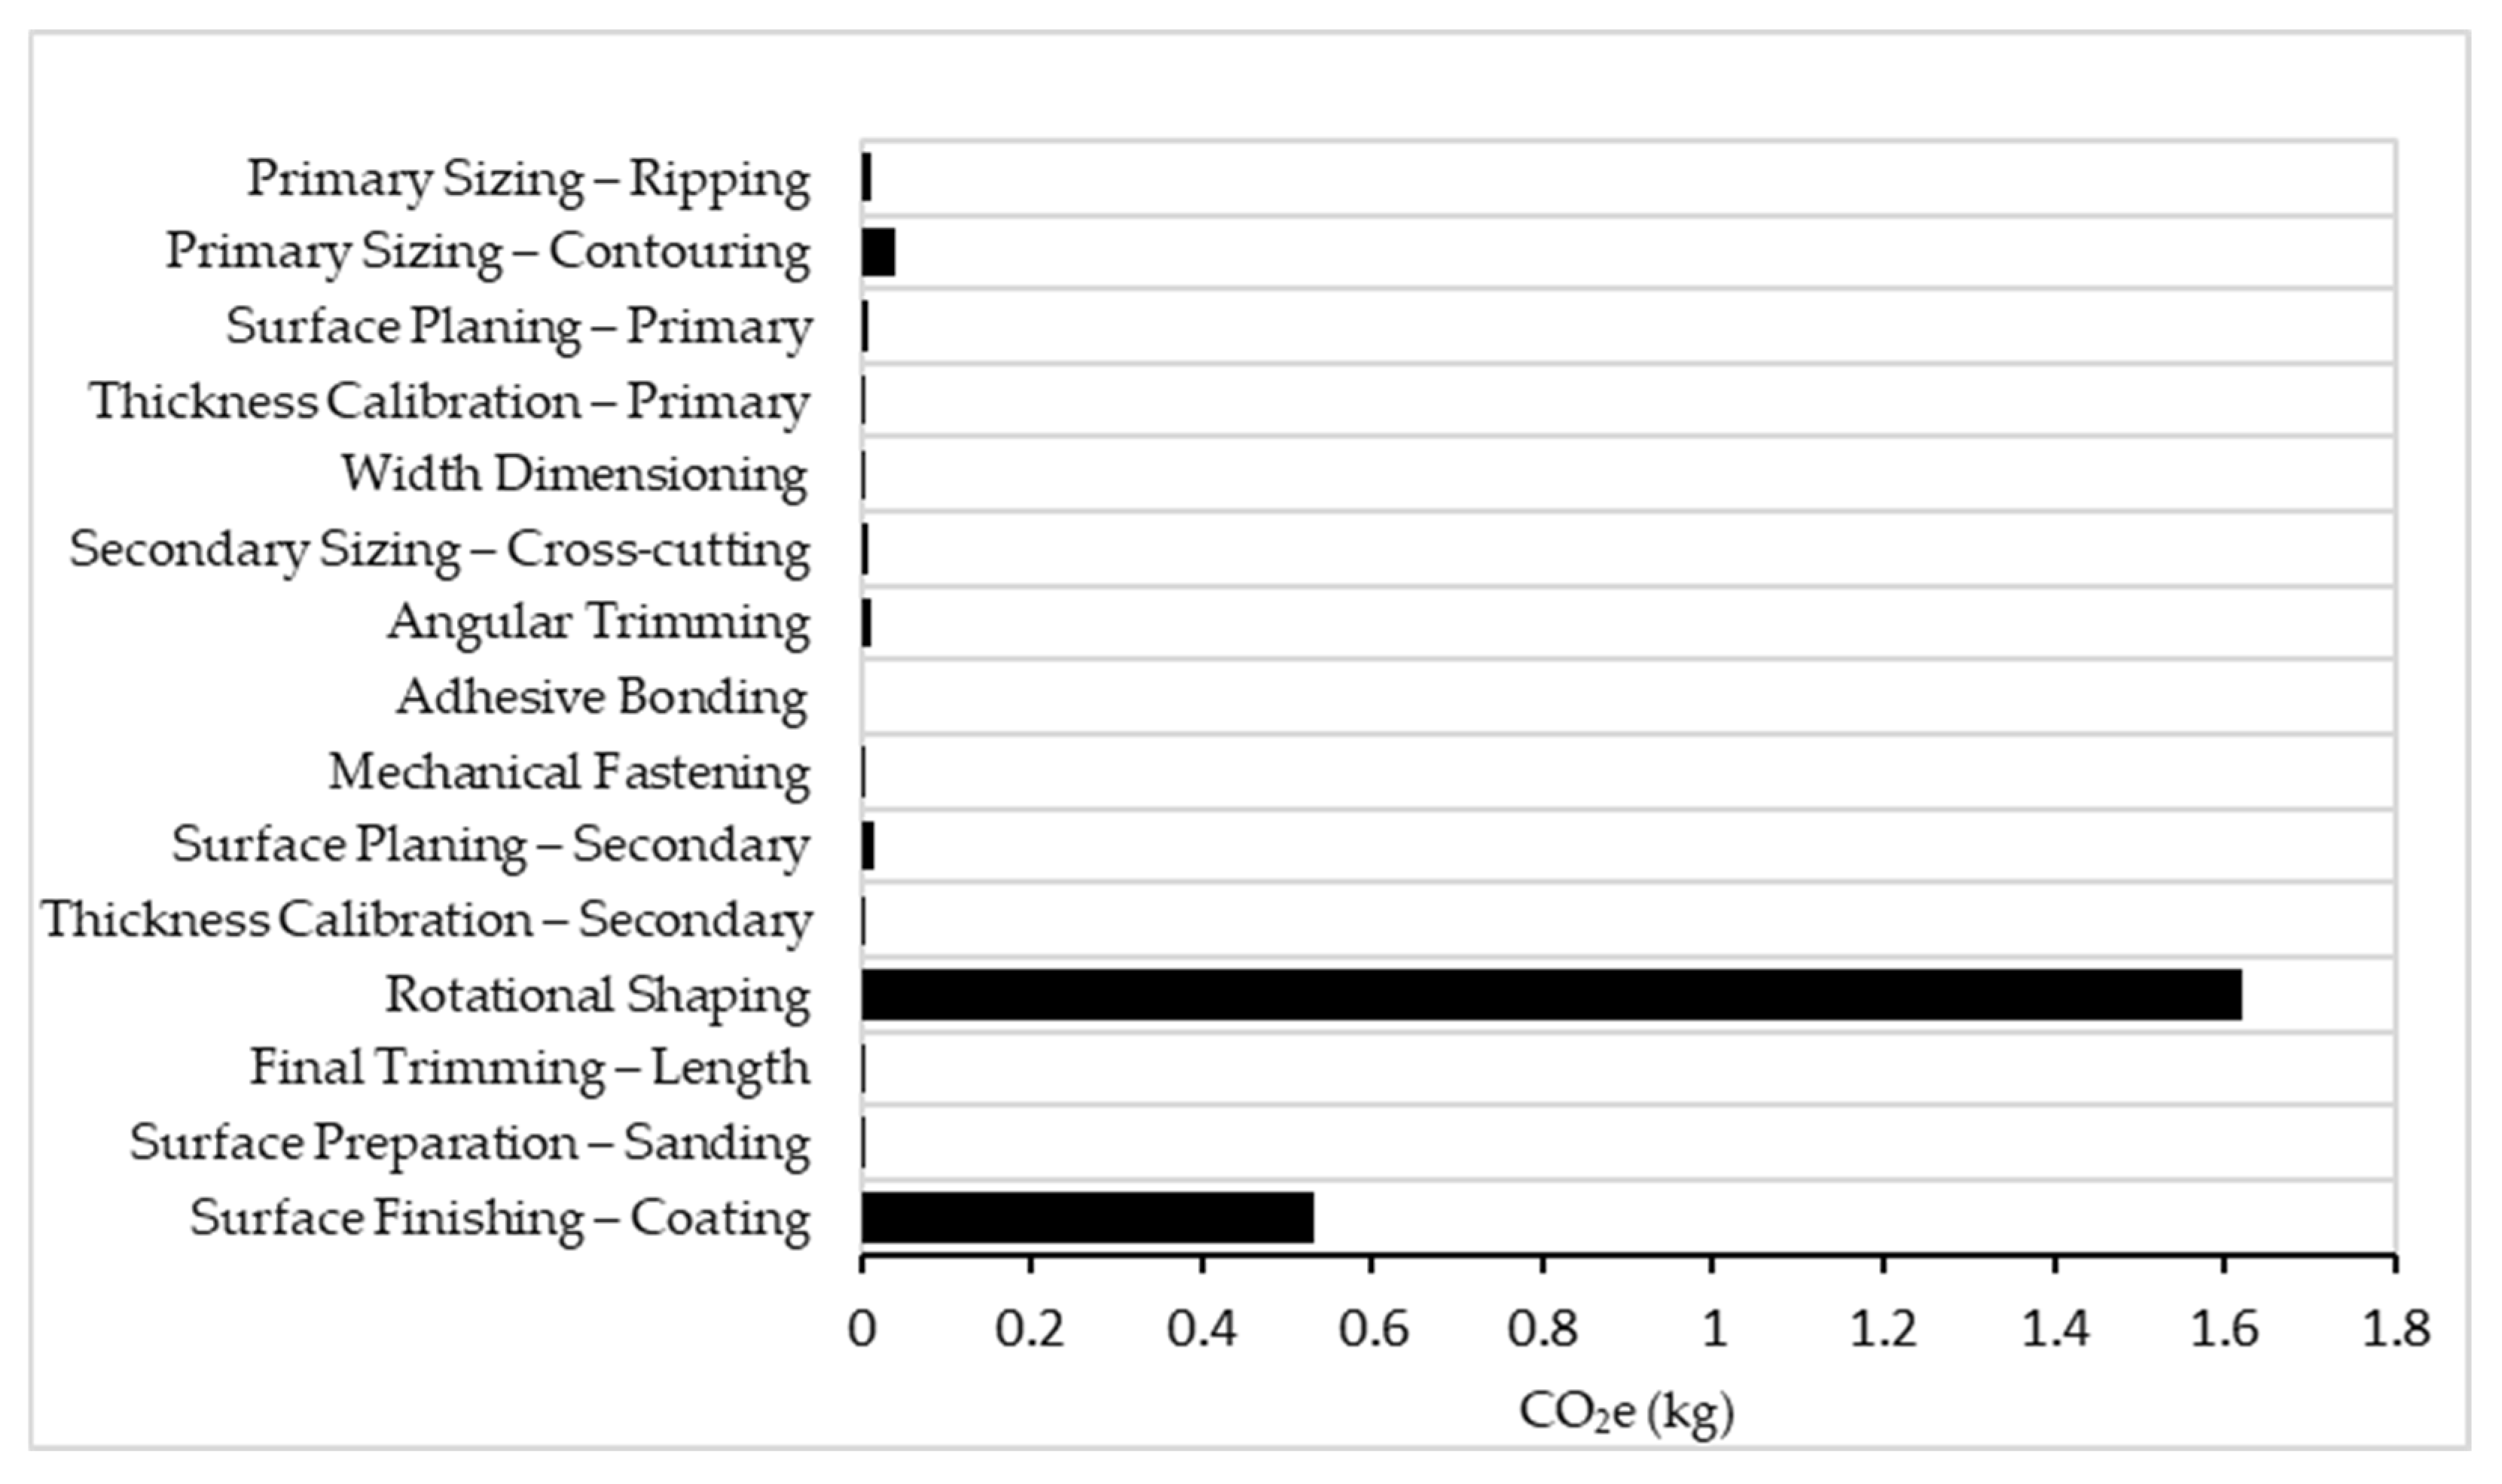
Figure 12.
CO2 Emissions per process stage.
Figure 12.
CO2 Emissions per process stage.
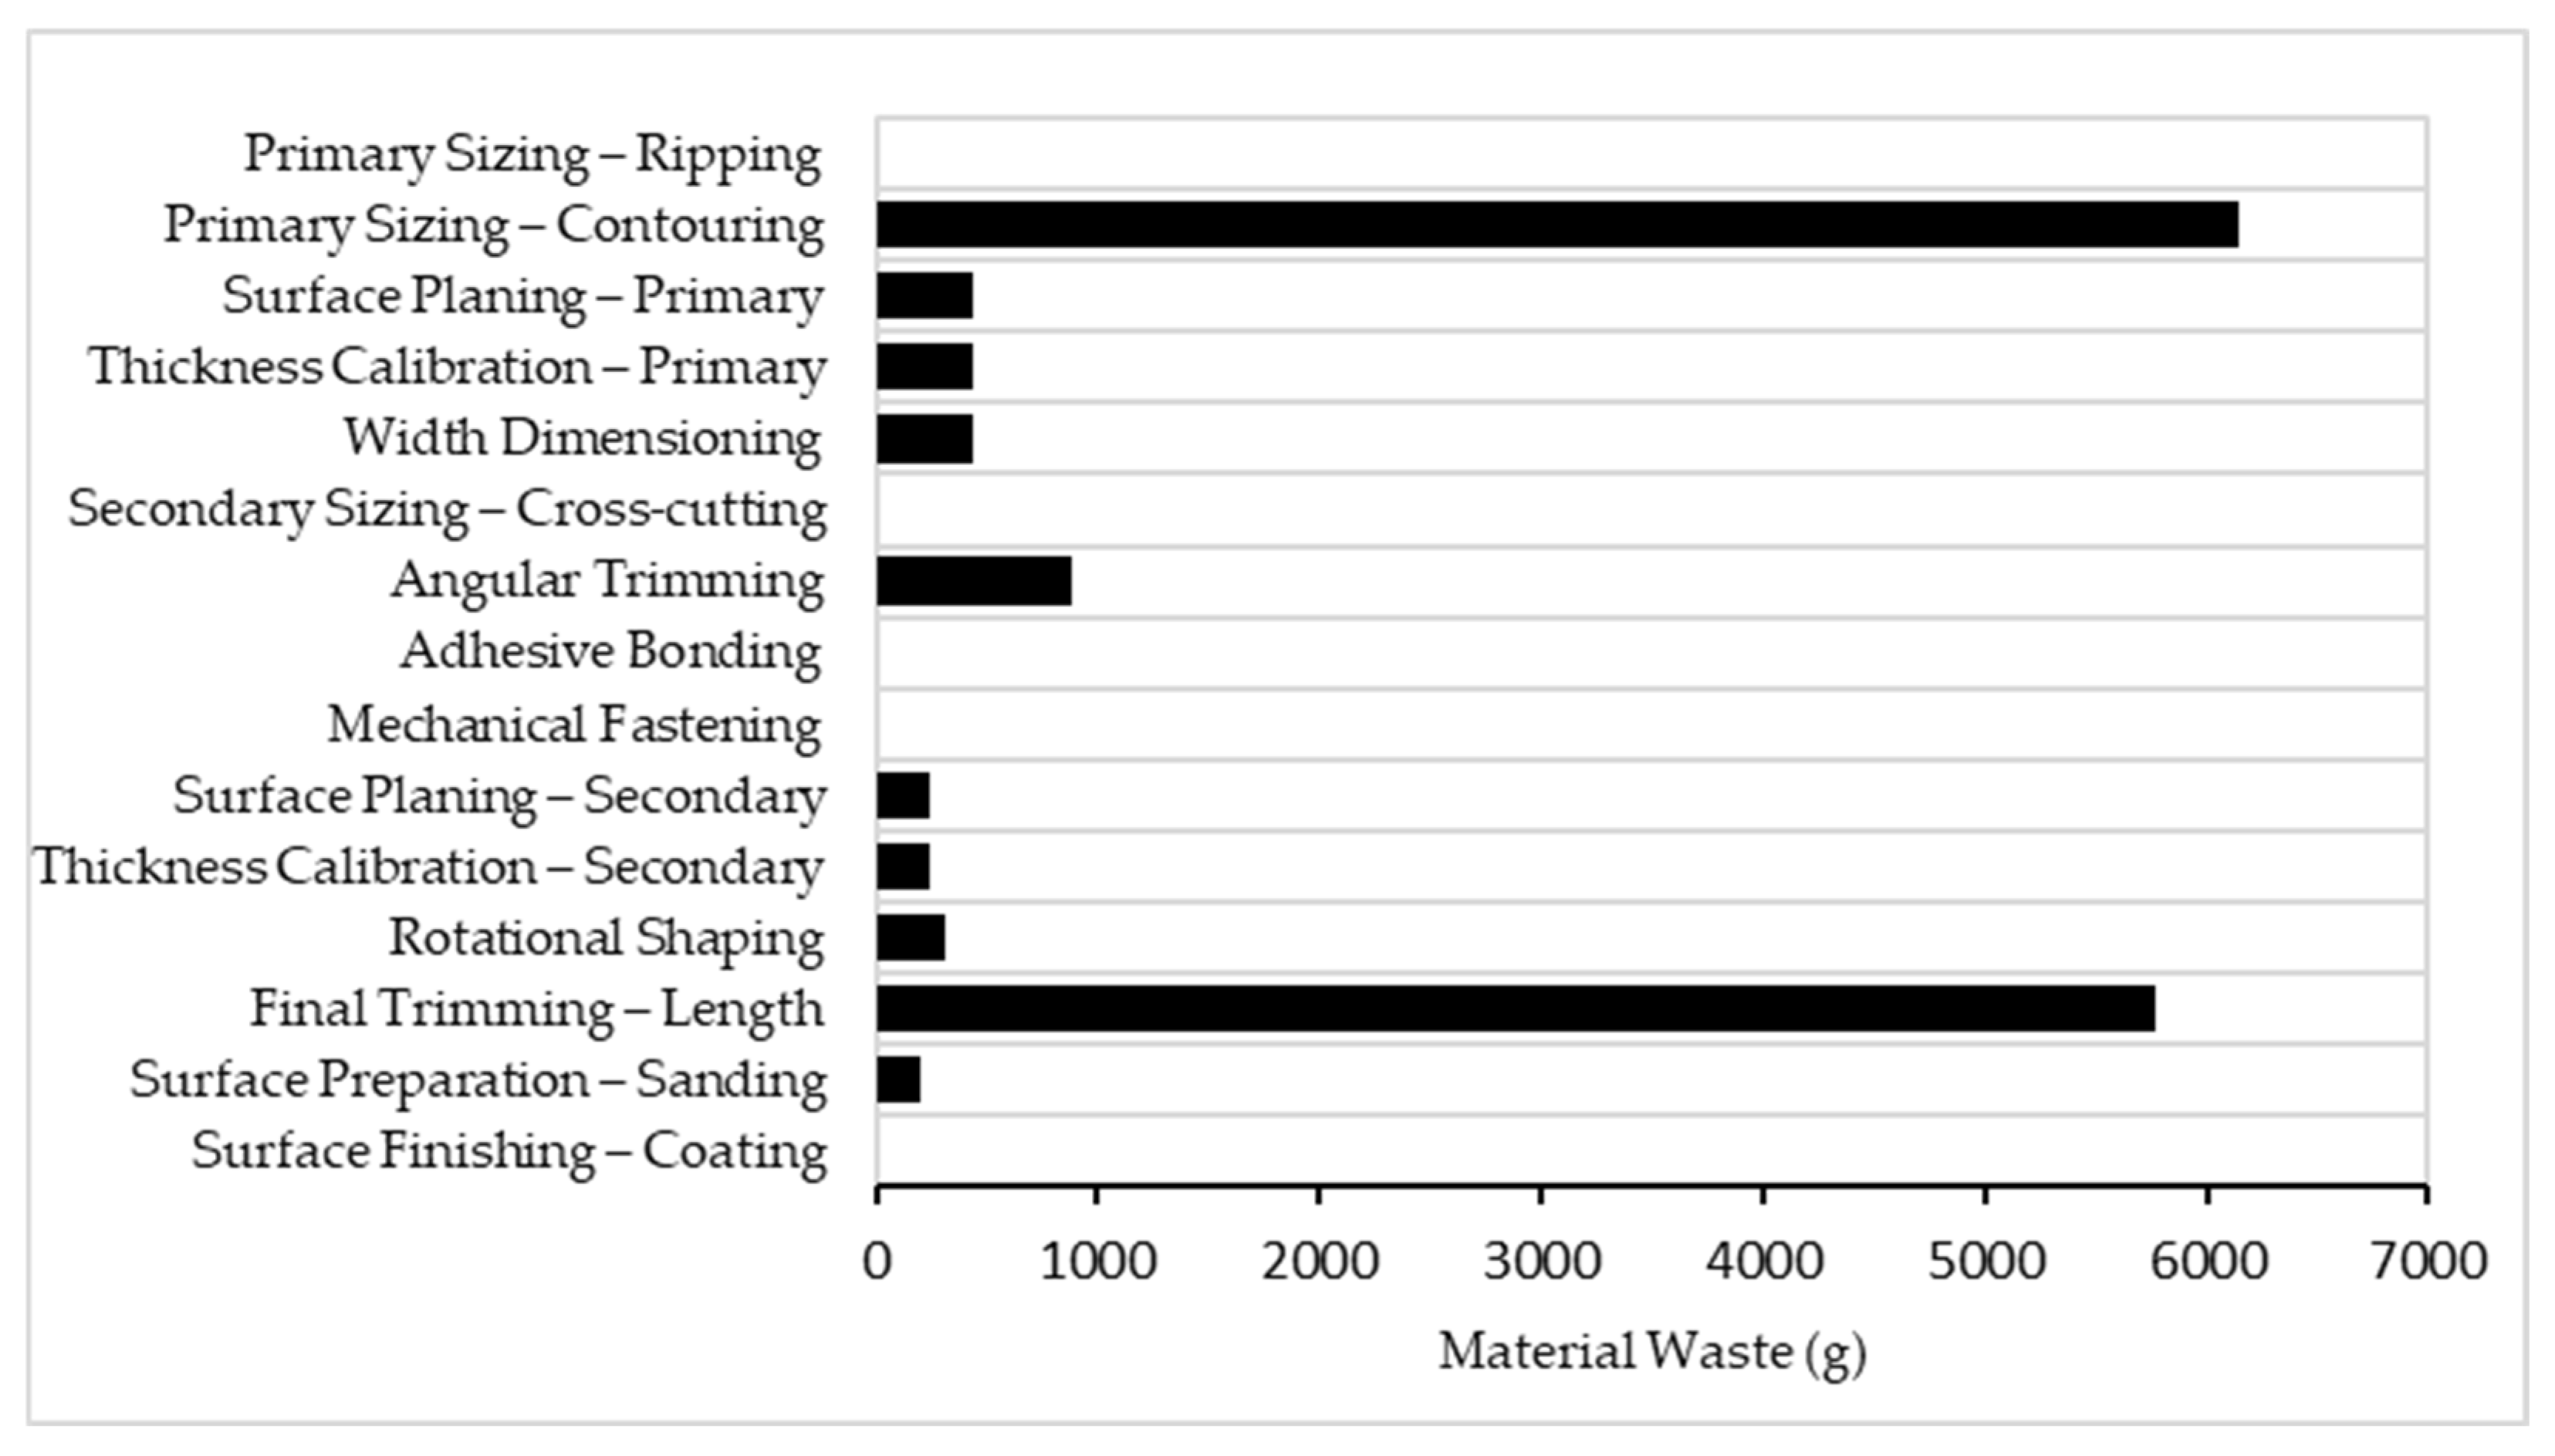
Figure 13.
Material Waste per process stage.
Figure 13.
Material Waste per process stage.
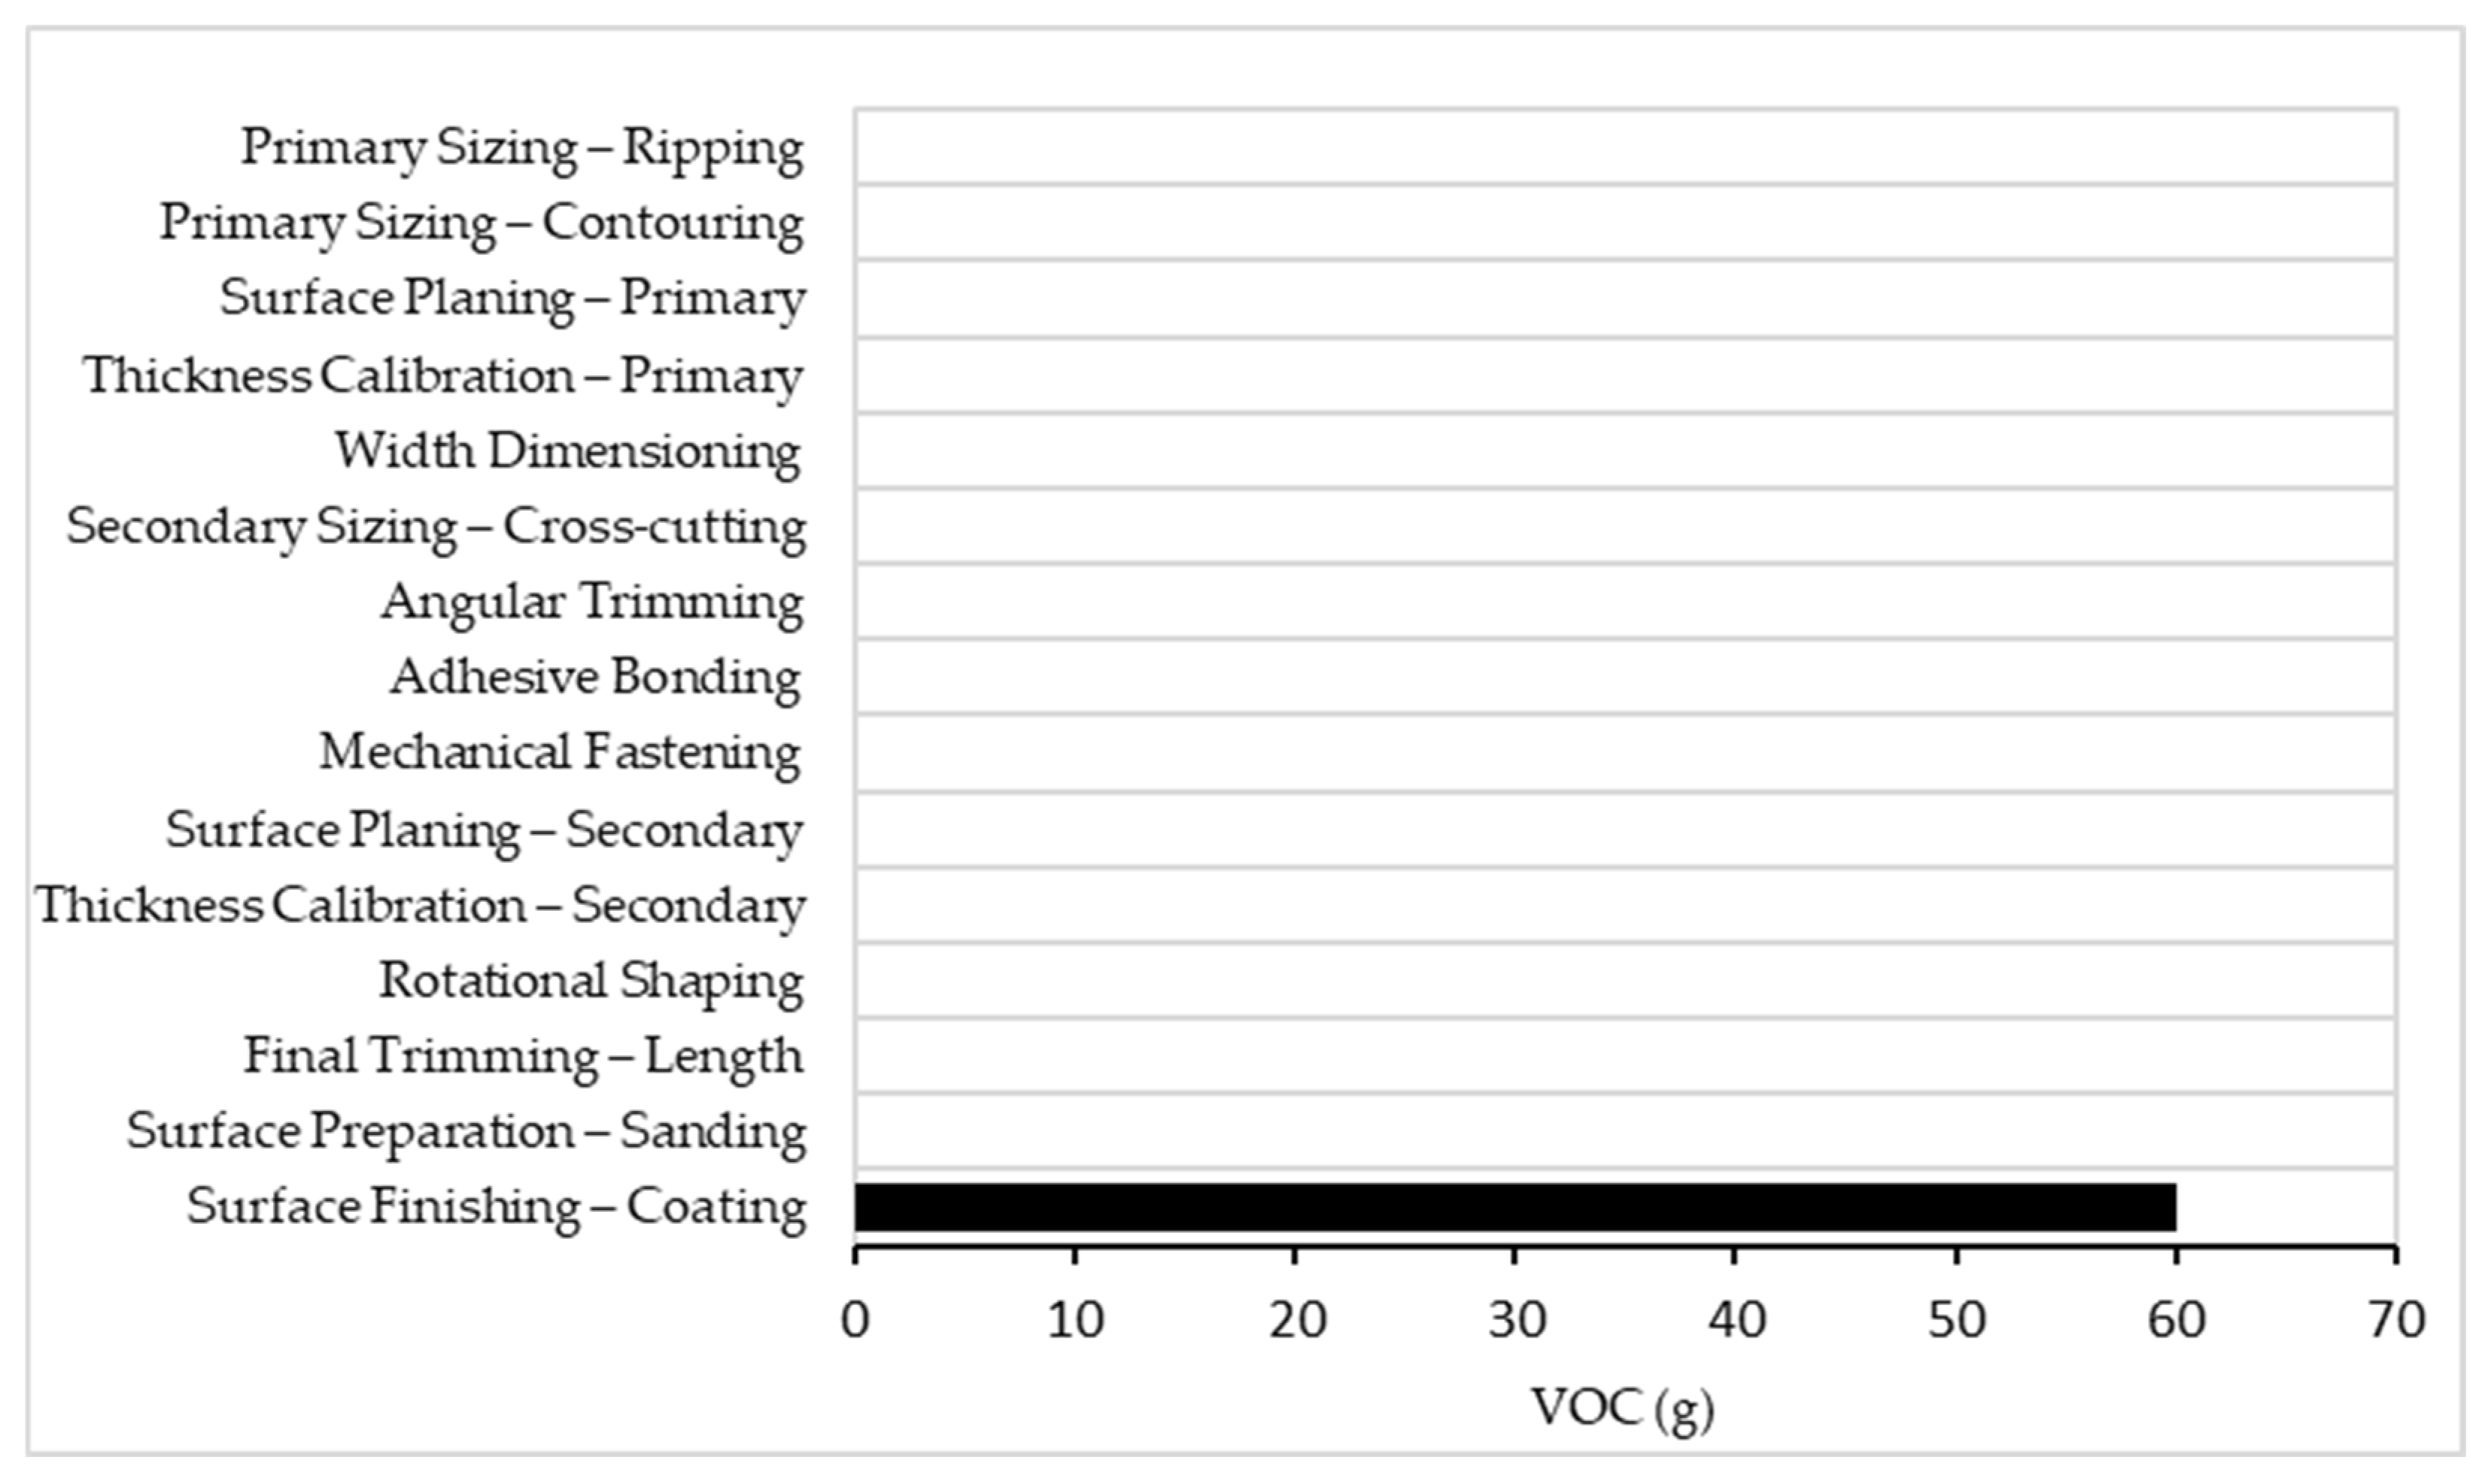
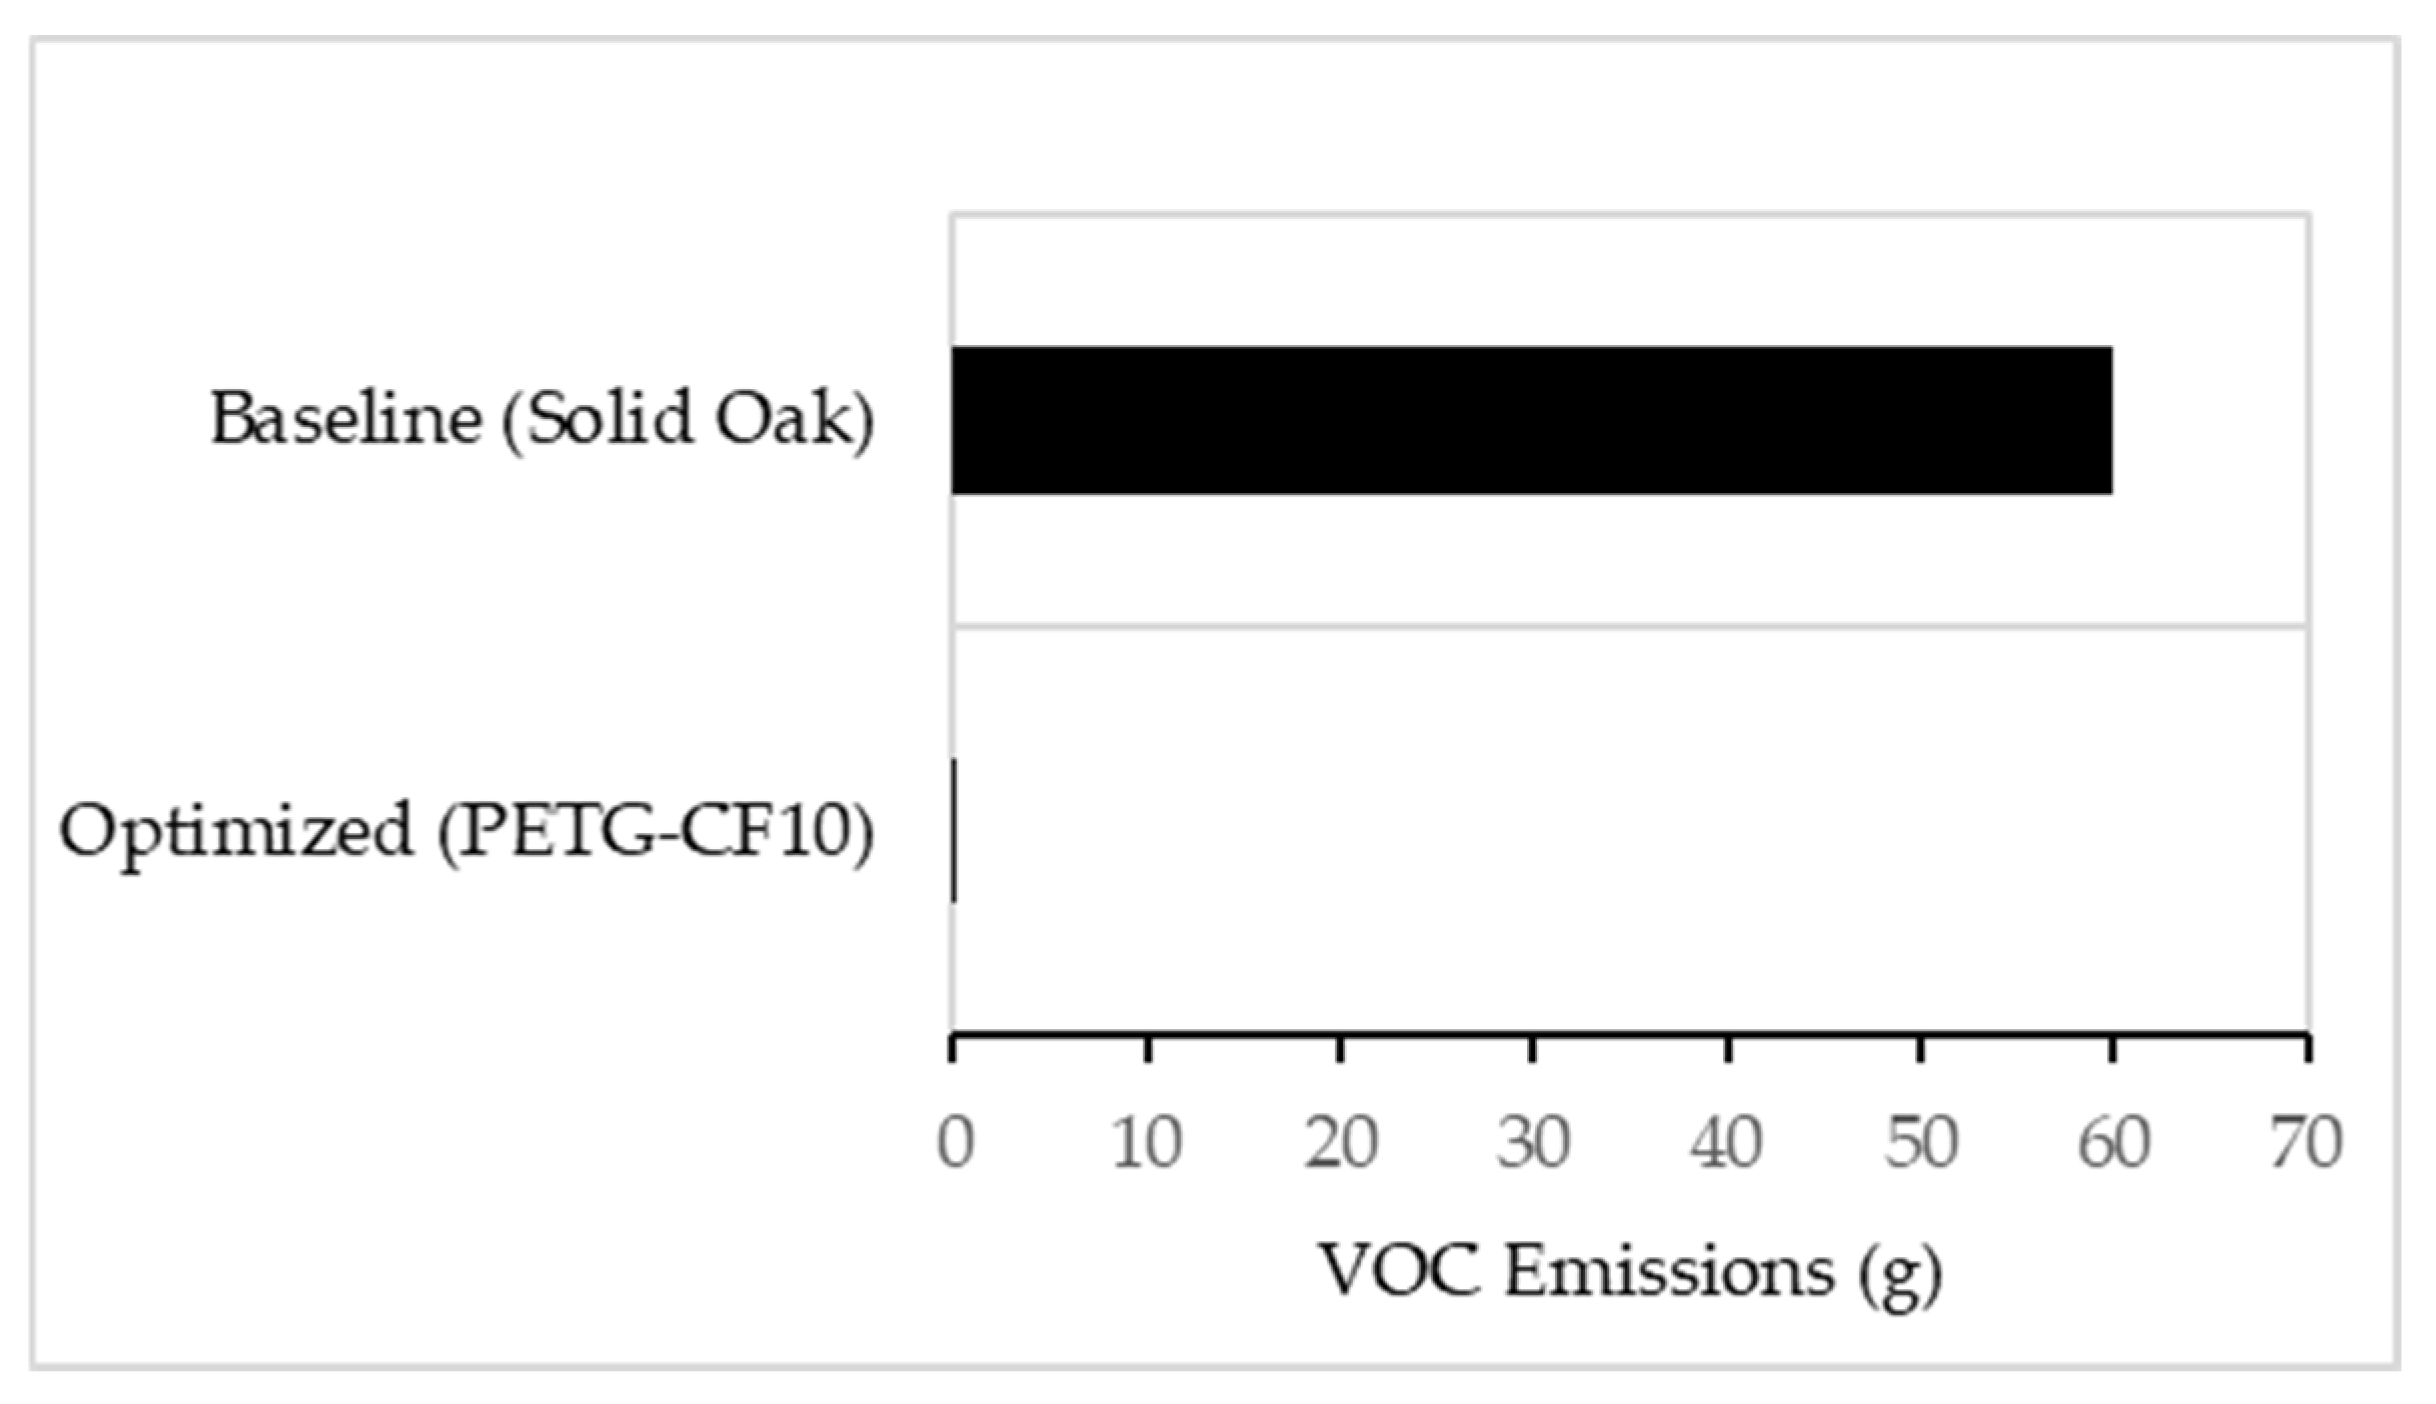
Figure 14.
VOC Emissions per process stage.
Figure 14.
VOC Emissions per process stage.
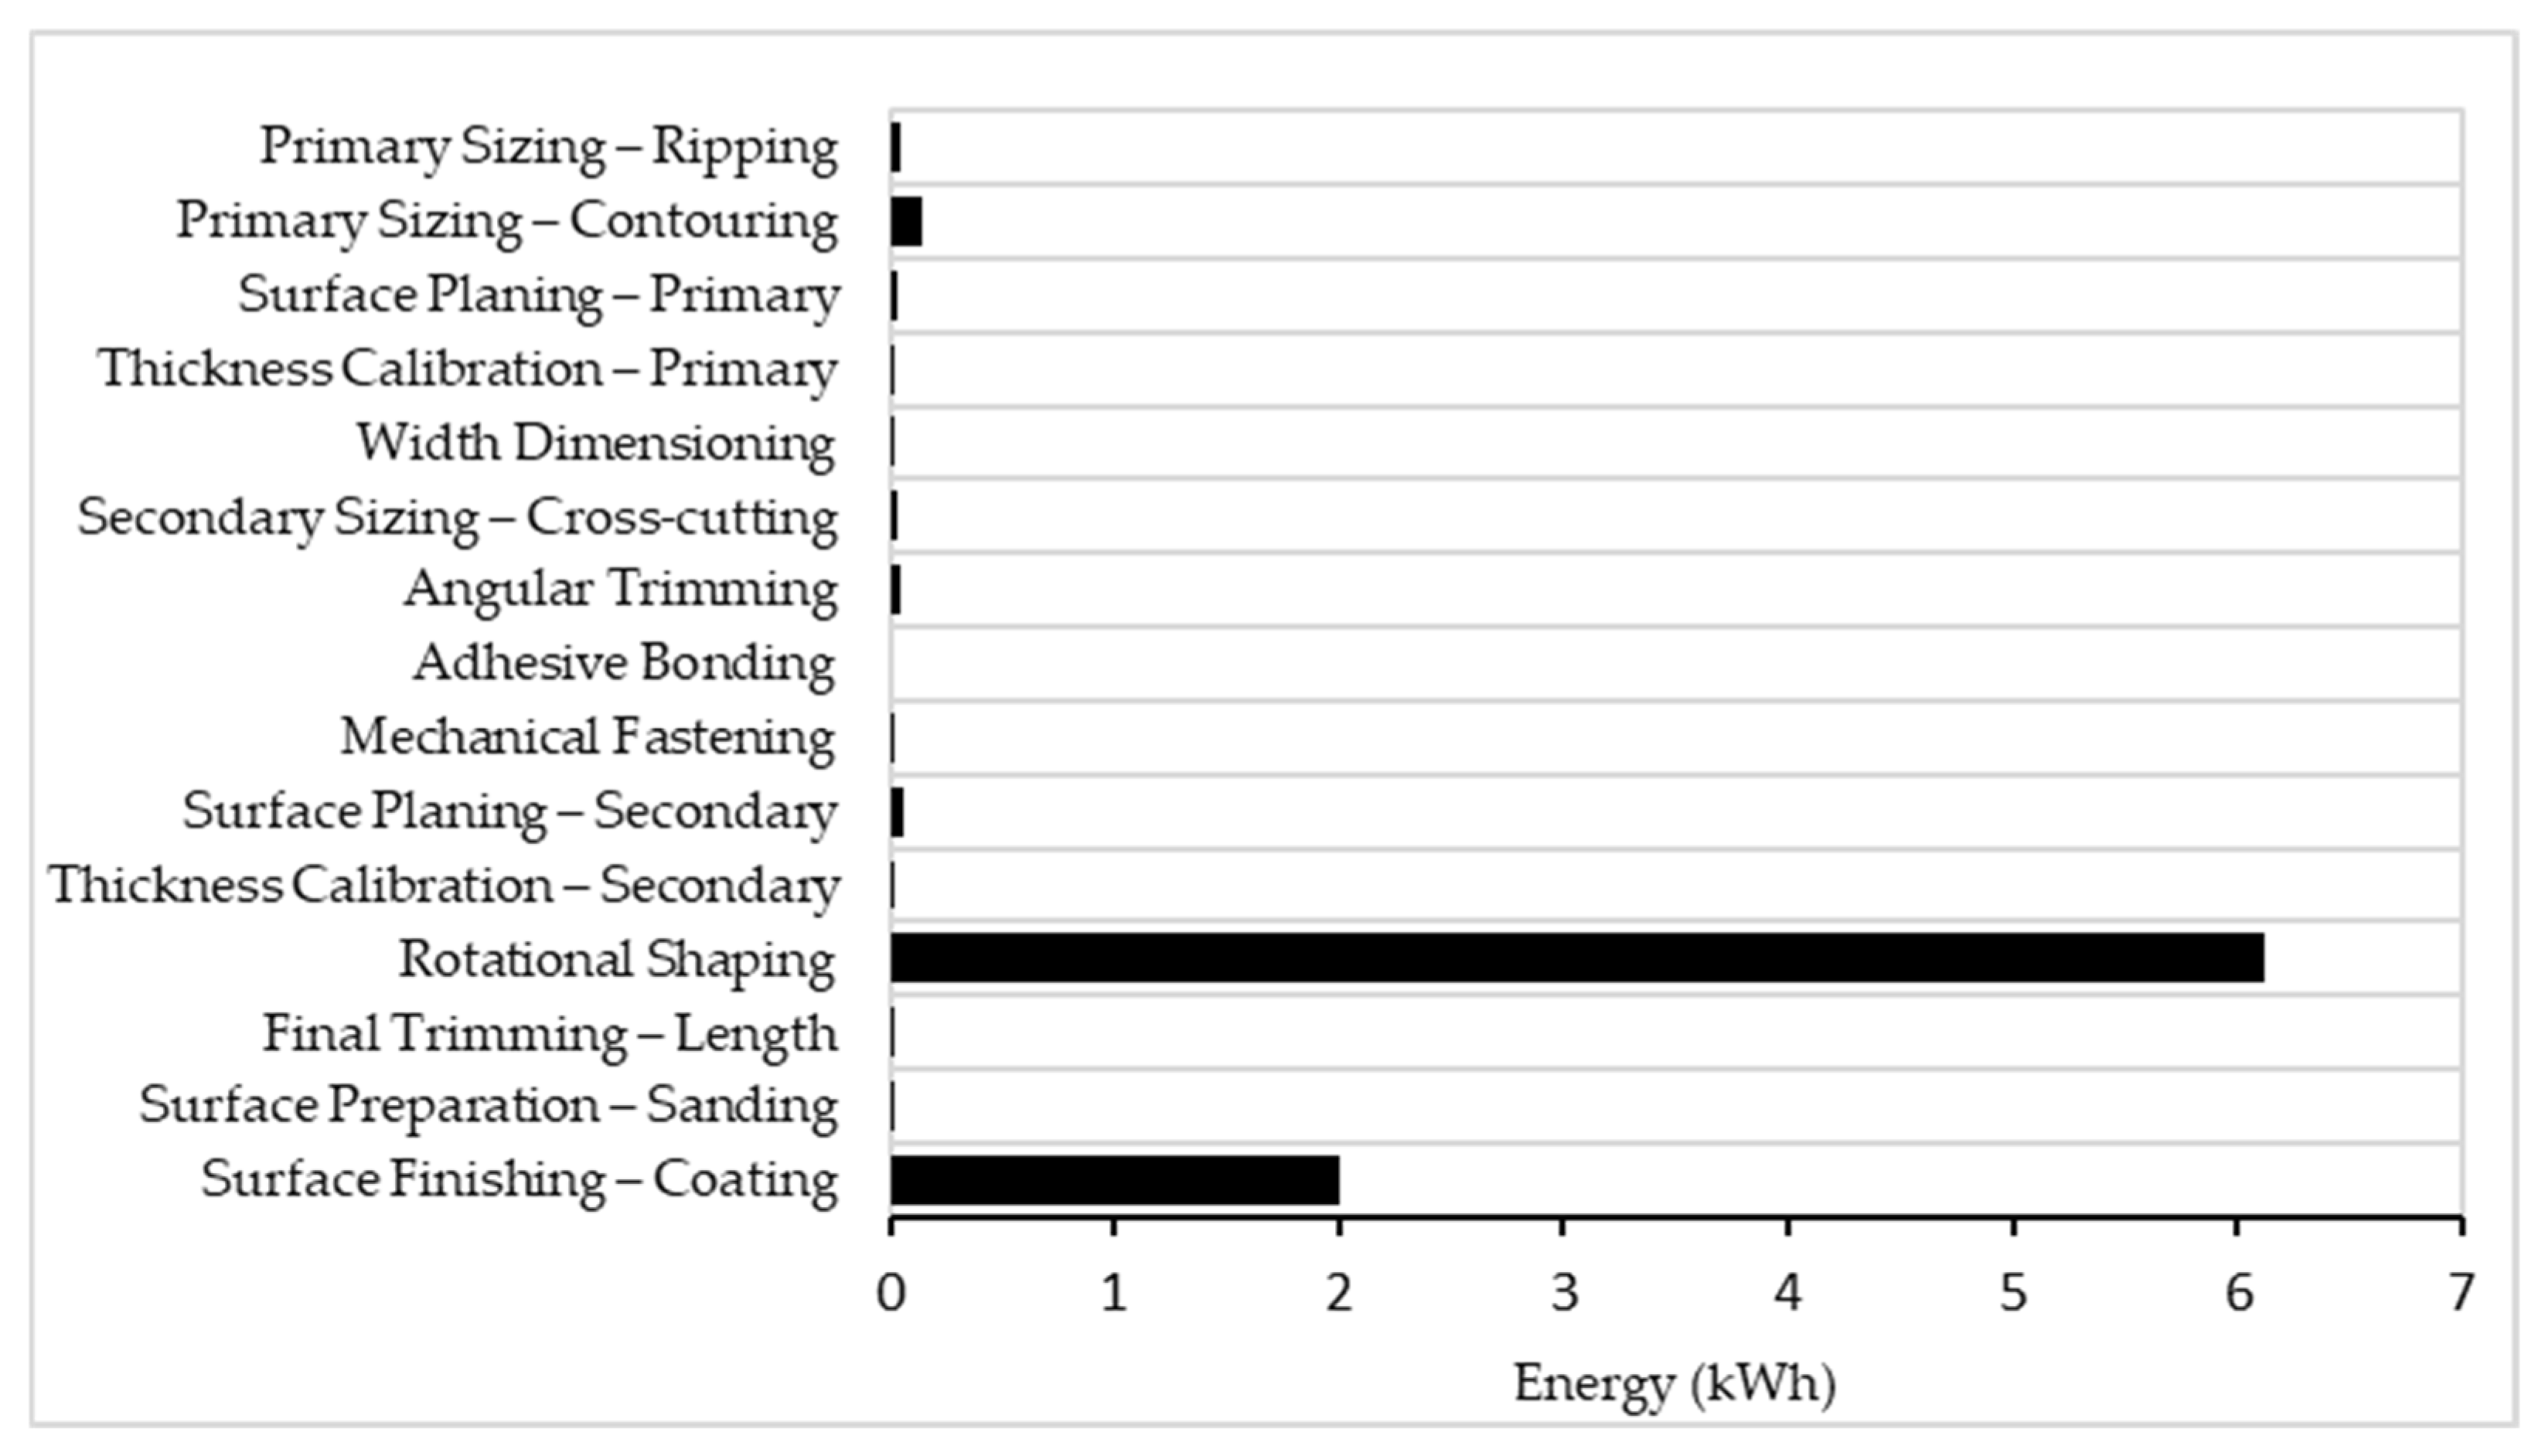
Figure 15.
Energy Consumption per process stage.
Figure 15.
Energy Consumption per process stage.
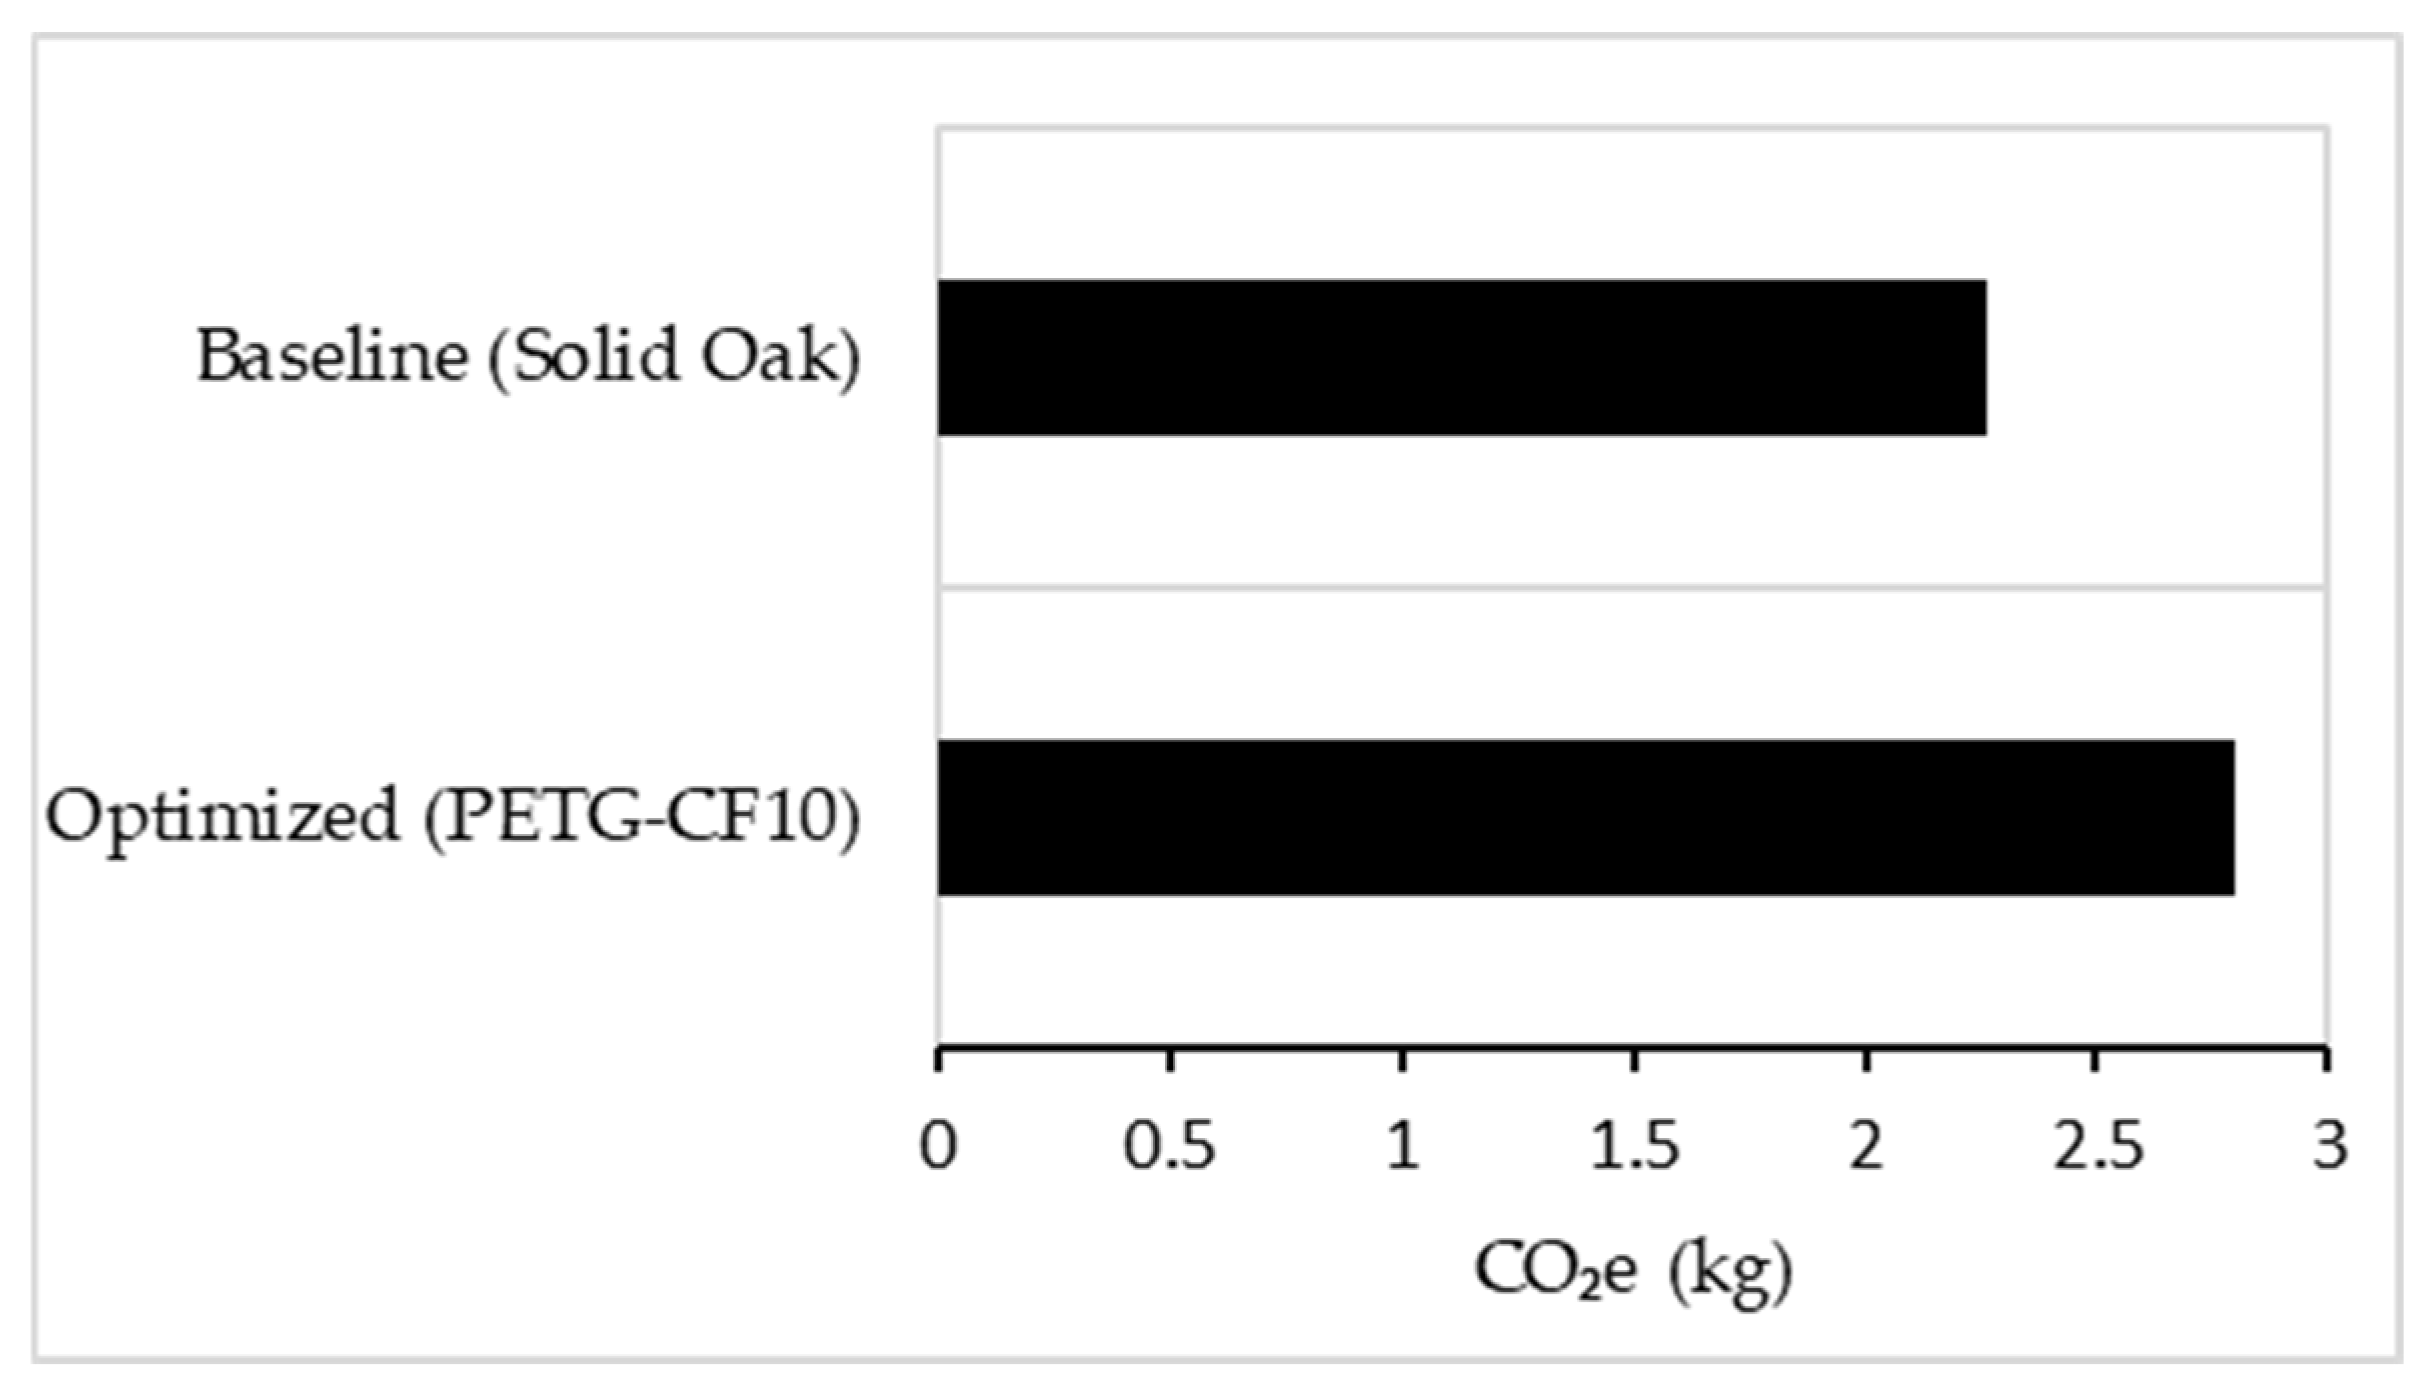
Figure 16.
Comparative CO2e emissions between the Baseline and TO scenario.
Figure 16.
Comparative CO2e emissions between the Baseline and TO scenario.
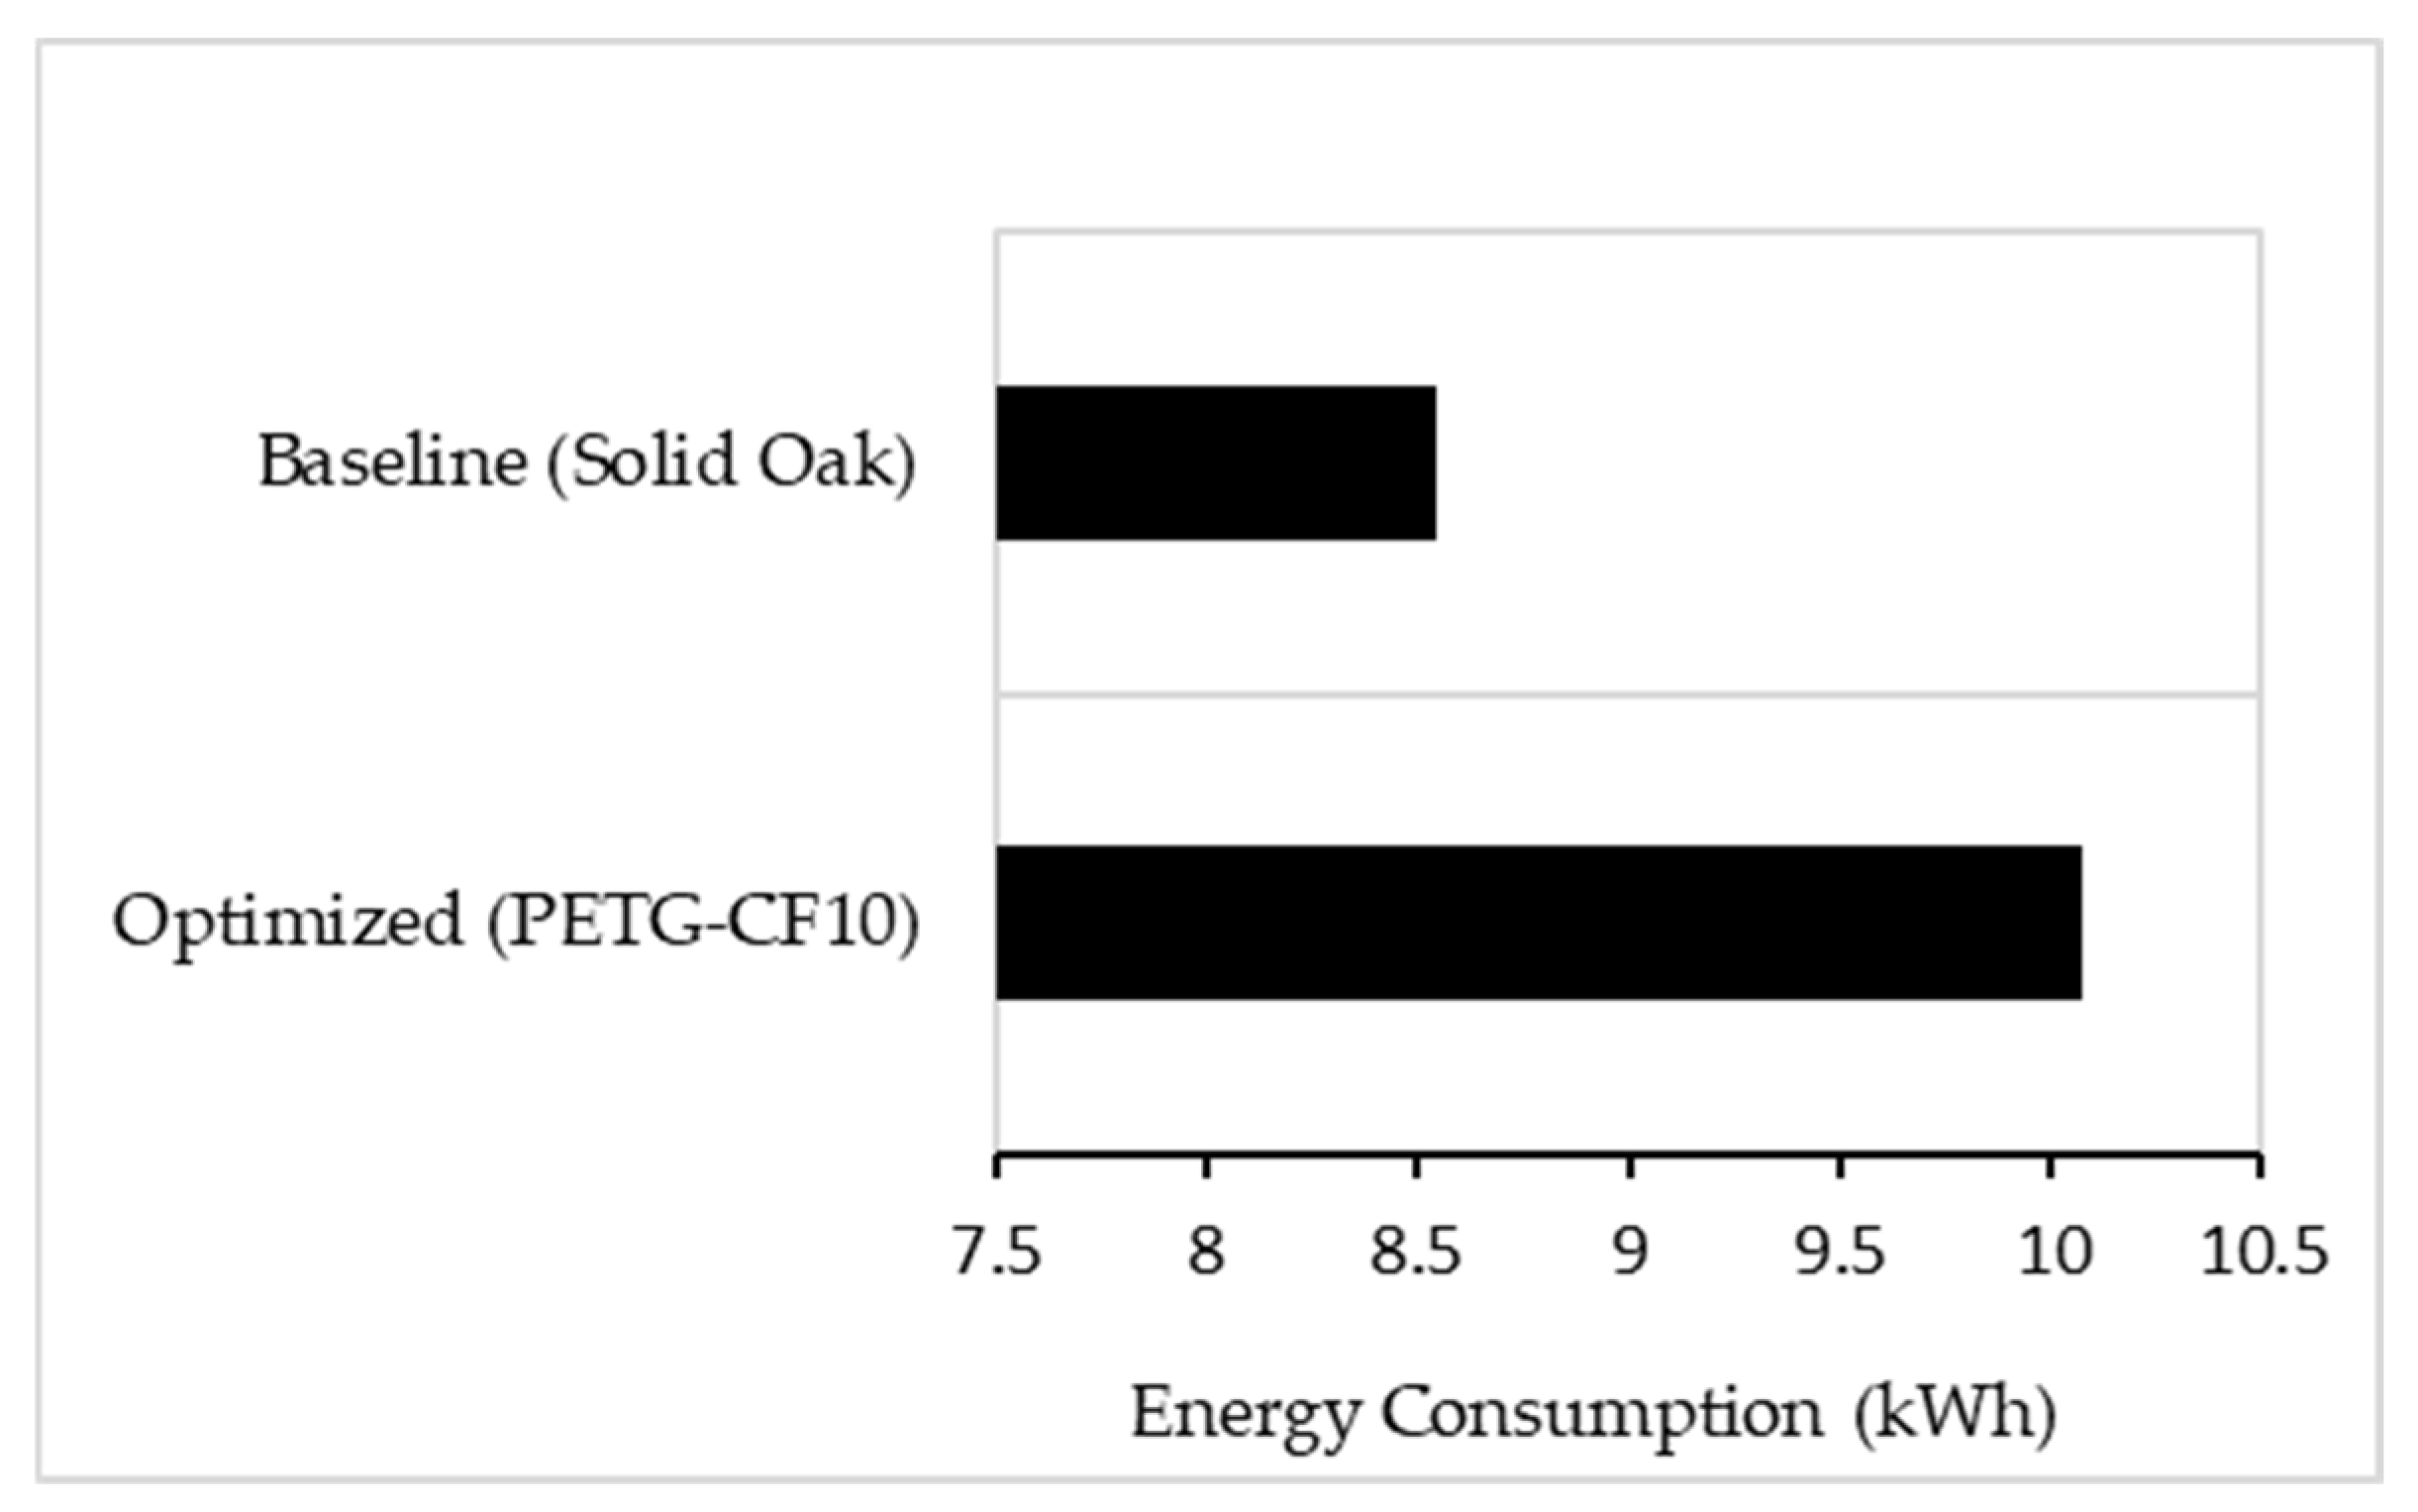
Figure 17.
Comparative energy consumption between the Baseline and TO scenario.
Figure 17.
Comparative energy consumption between the Baseline and TO scenario.
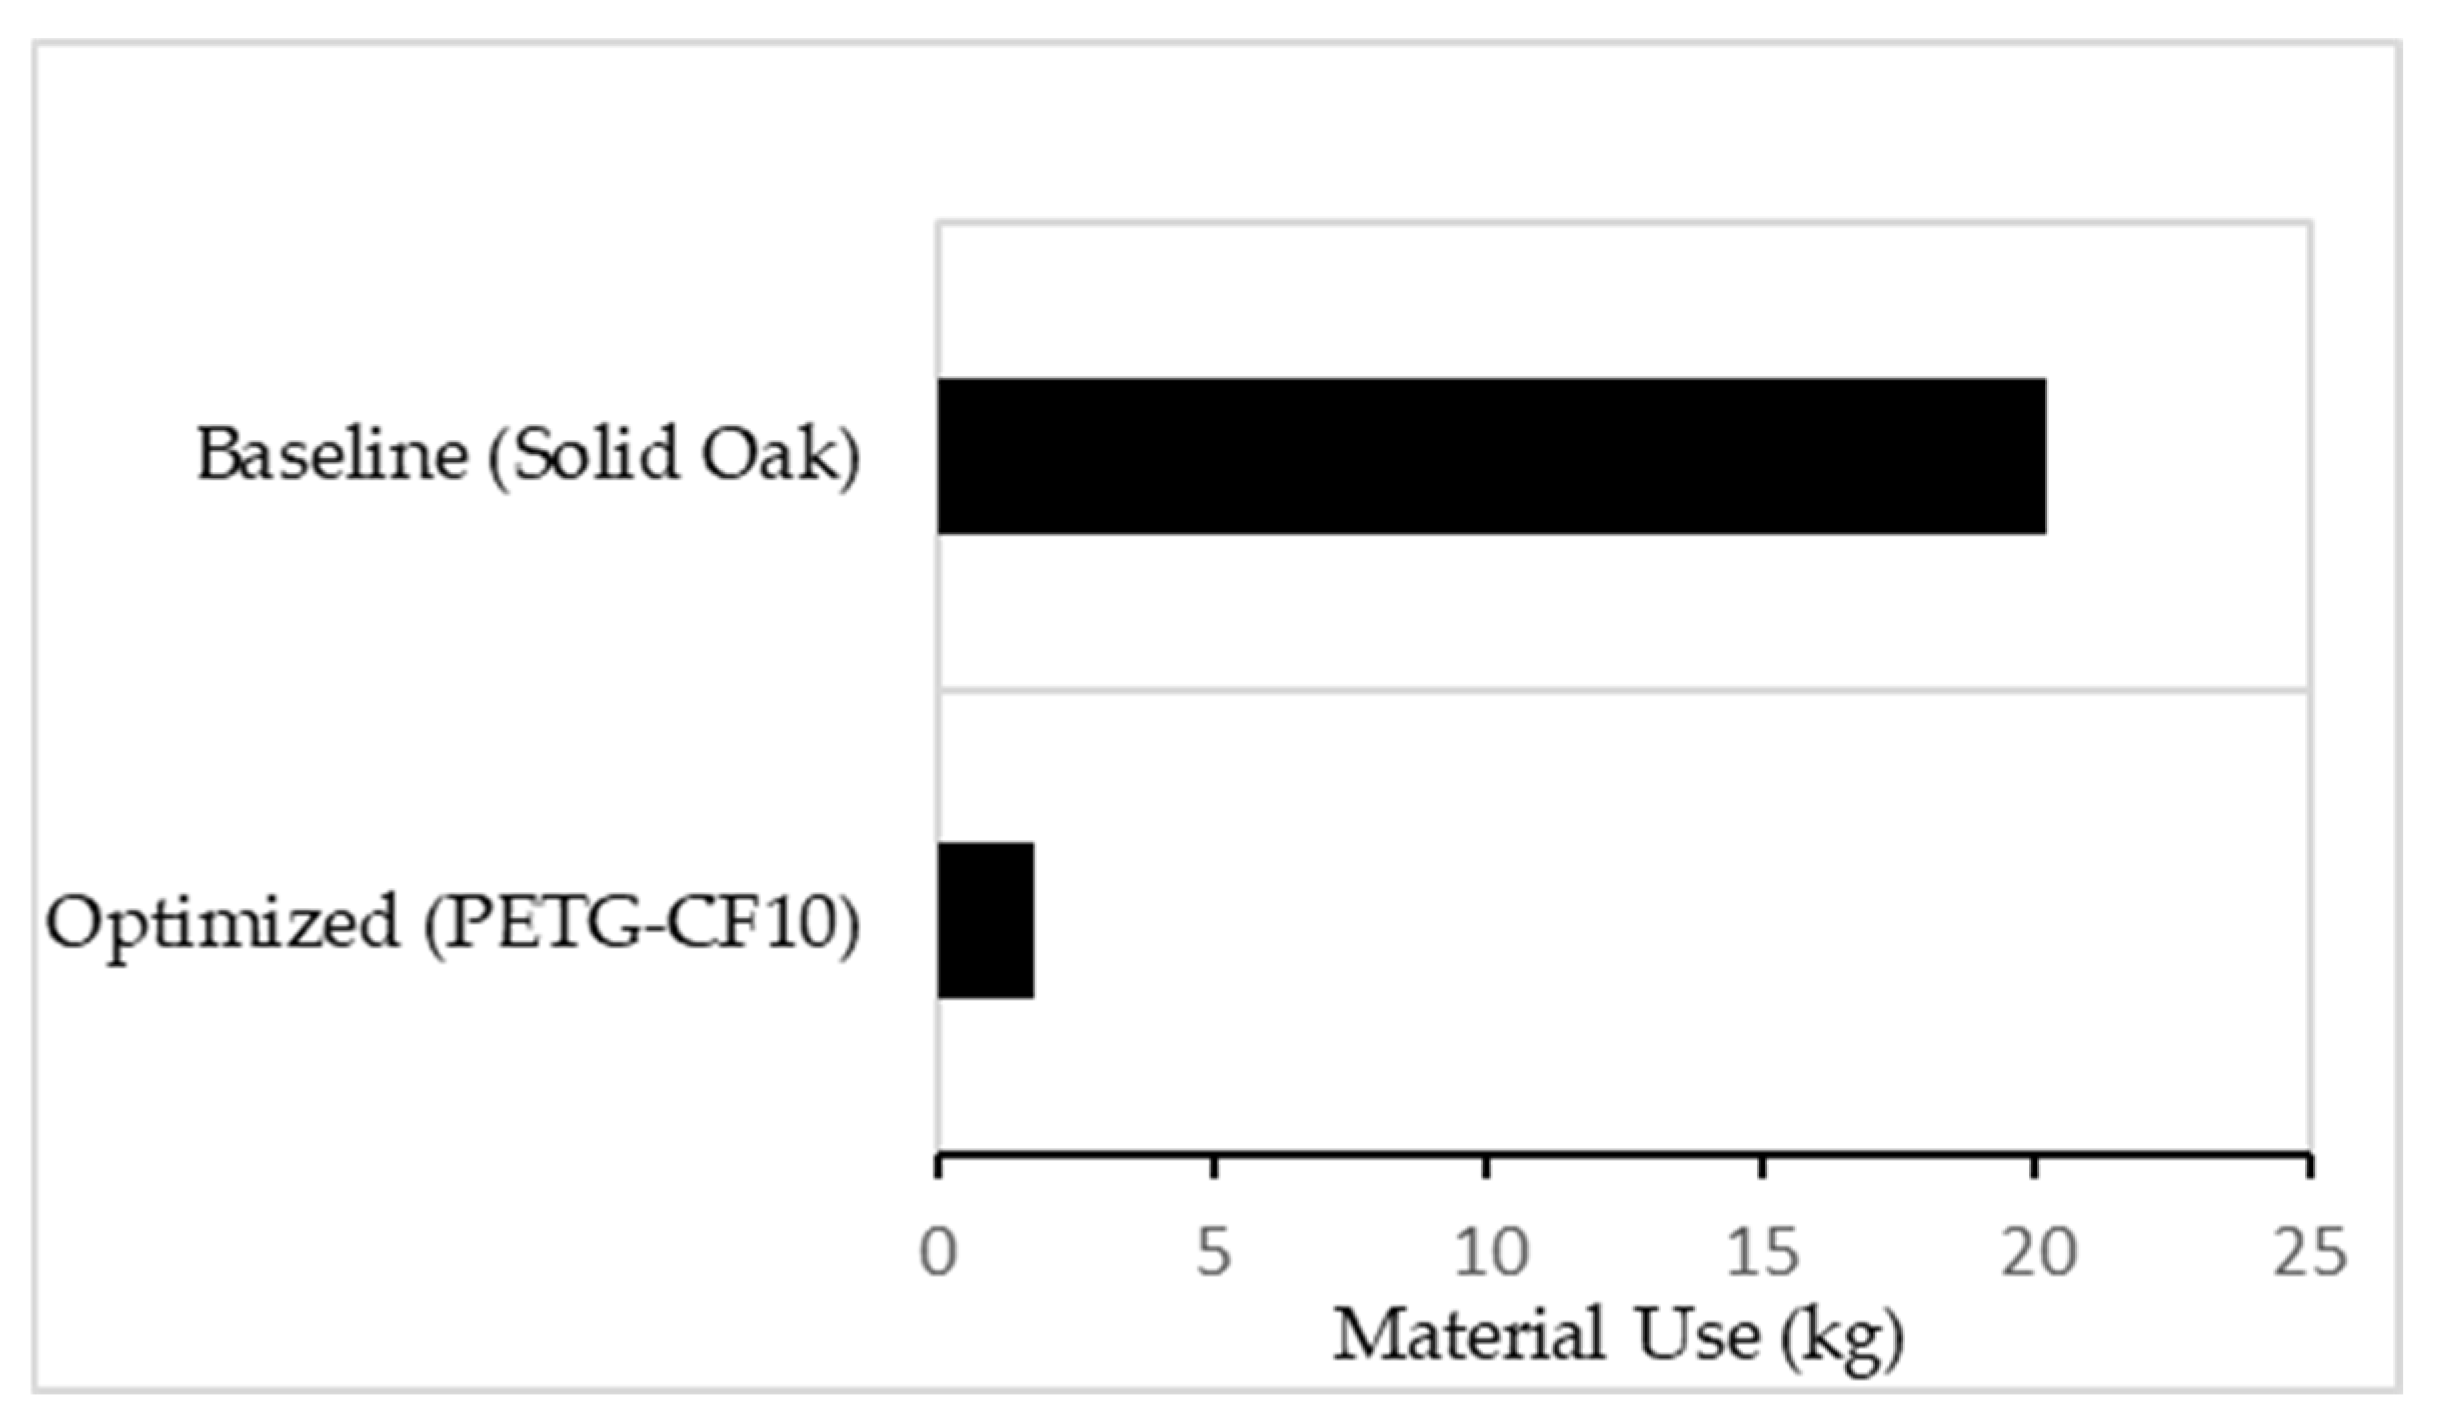
Figure 18.
Comparative material use between the Baseline and TO scenario.
Figure 18.
Comparative material use between the Baseline and TO scenario.
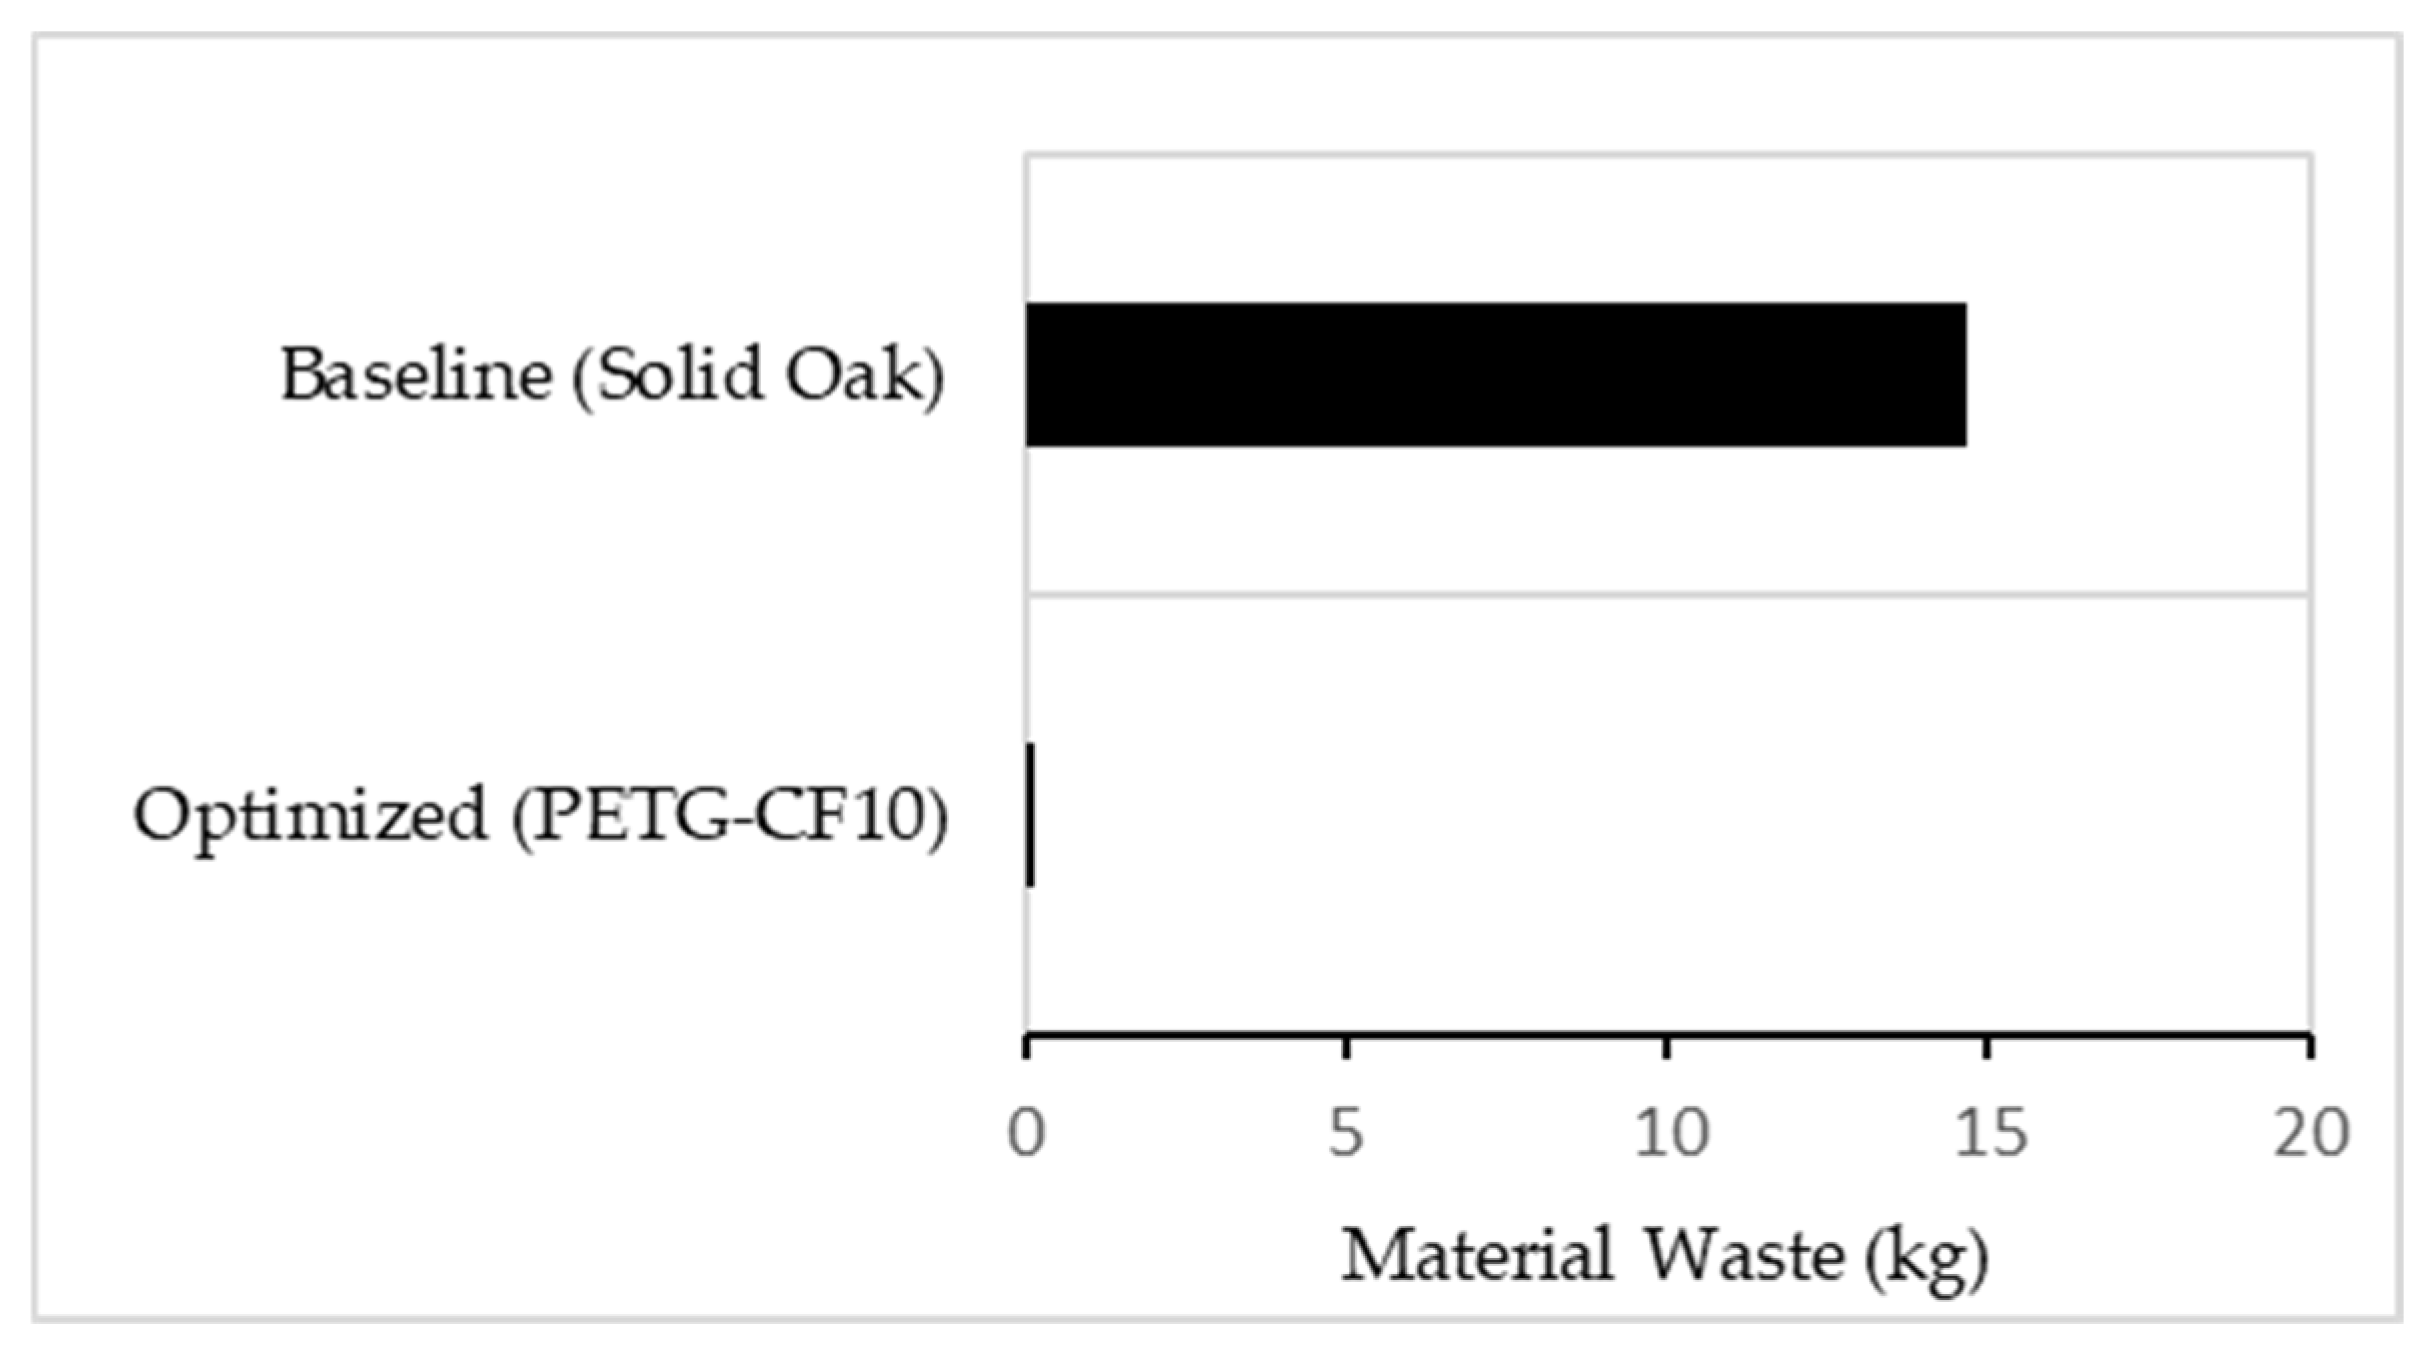
Figure 19.
Comparative material waste between the Baseline and TO scenario.
Figure 19.
Comparative material waste between the Baseline and TO scenario.
Figure 20.
Comparative VOC emissions between the Baseline and TO scenario.
Figure 20.
Comparative VOC emissions between the Baseline and TO scenario.
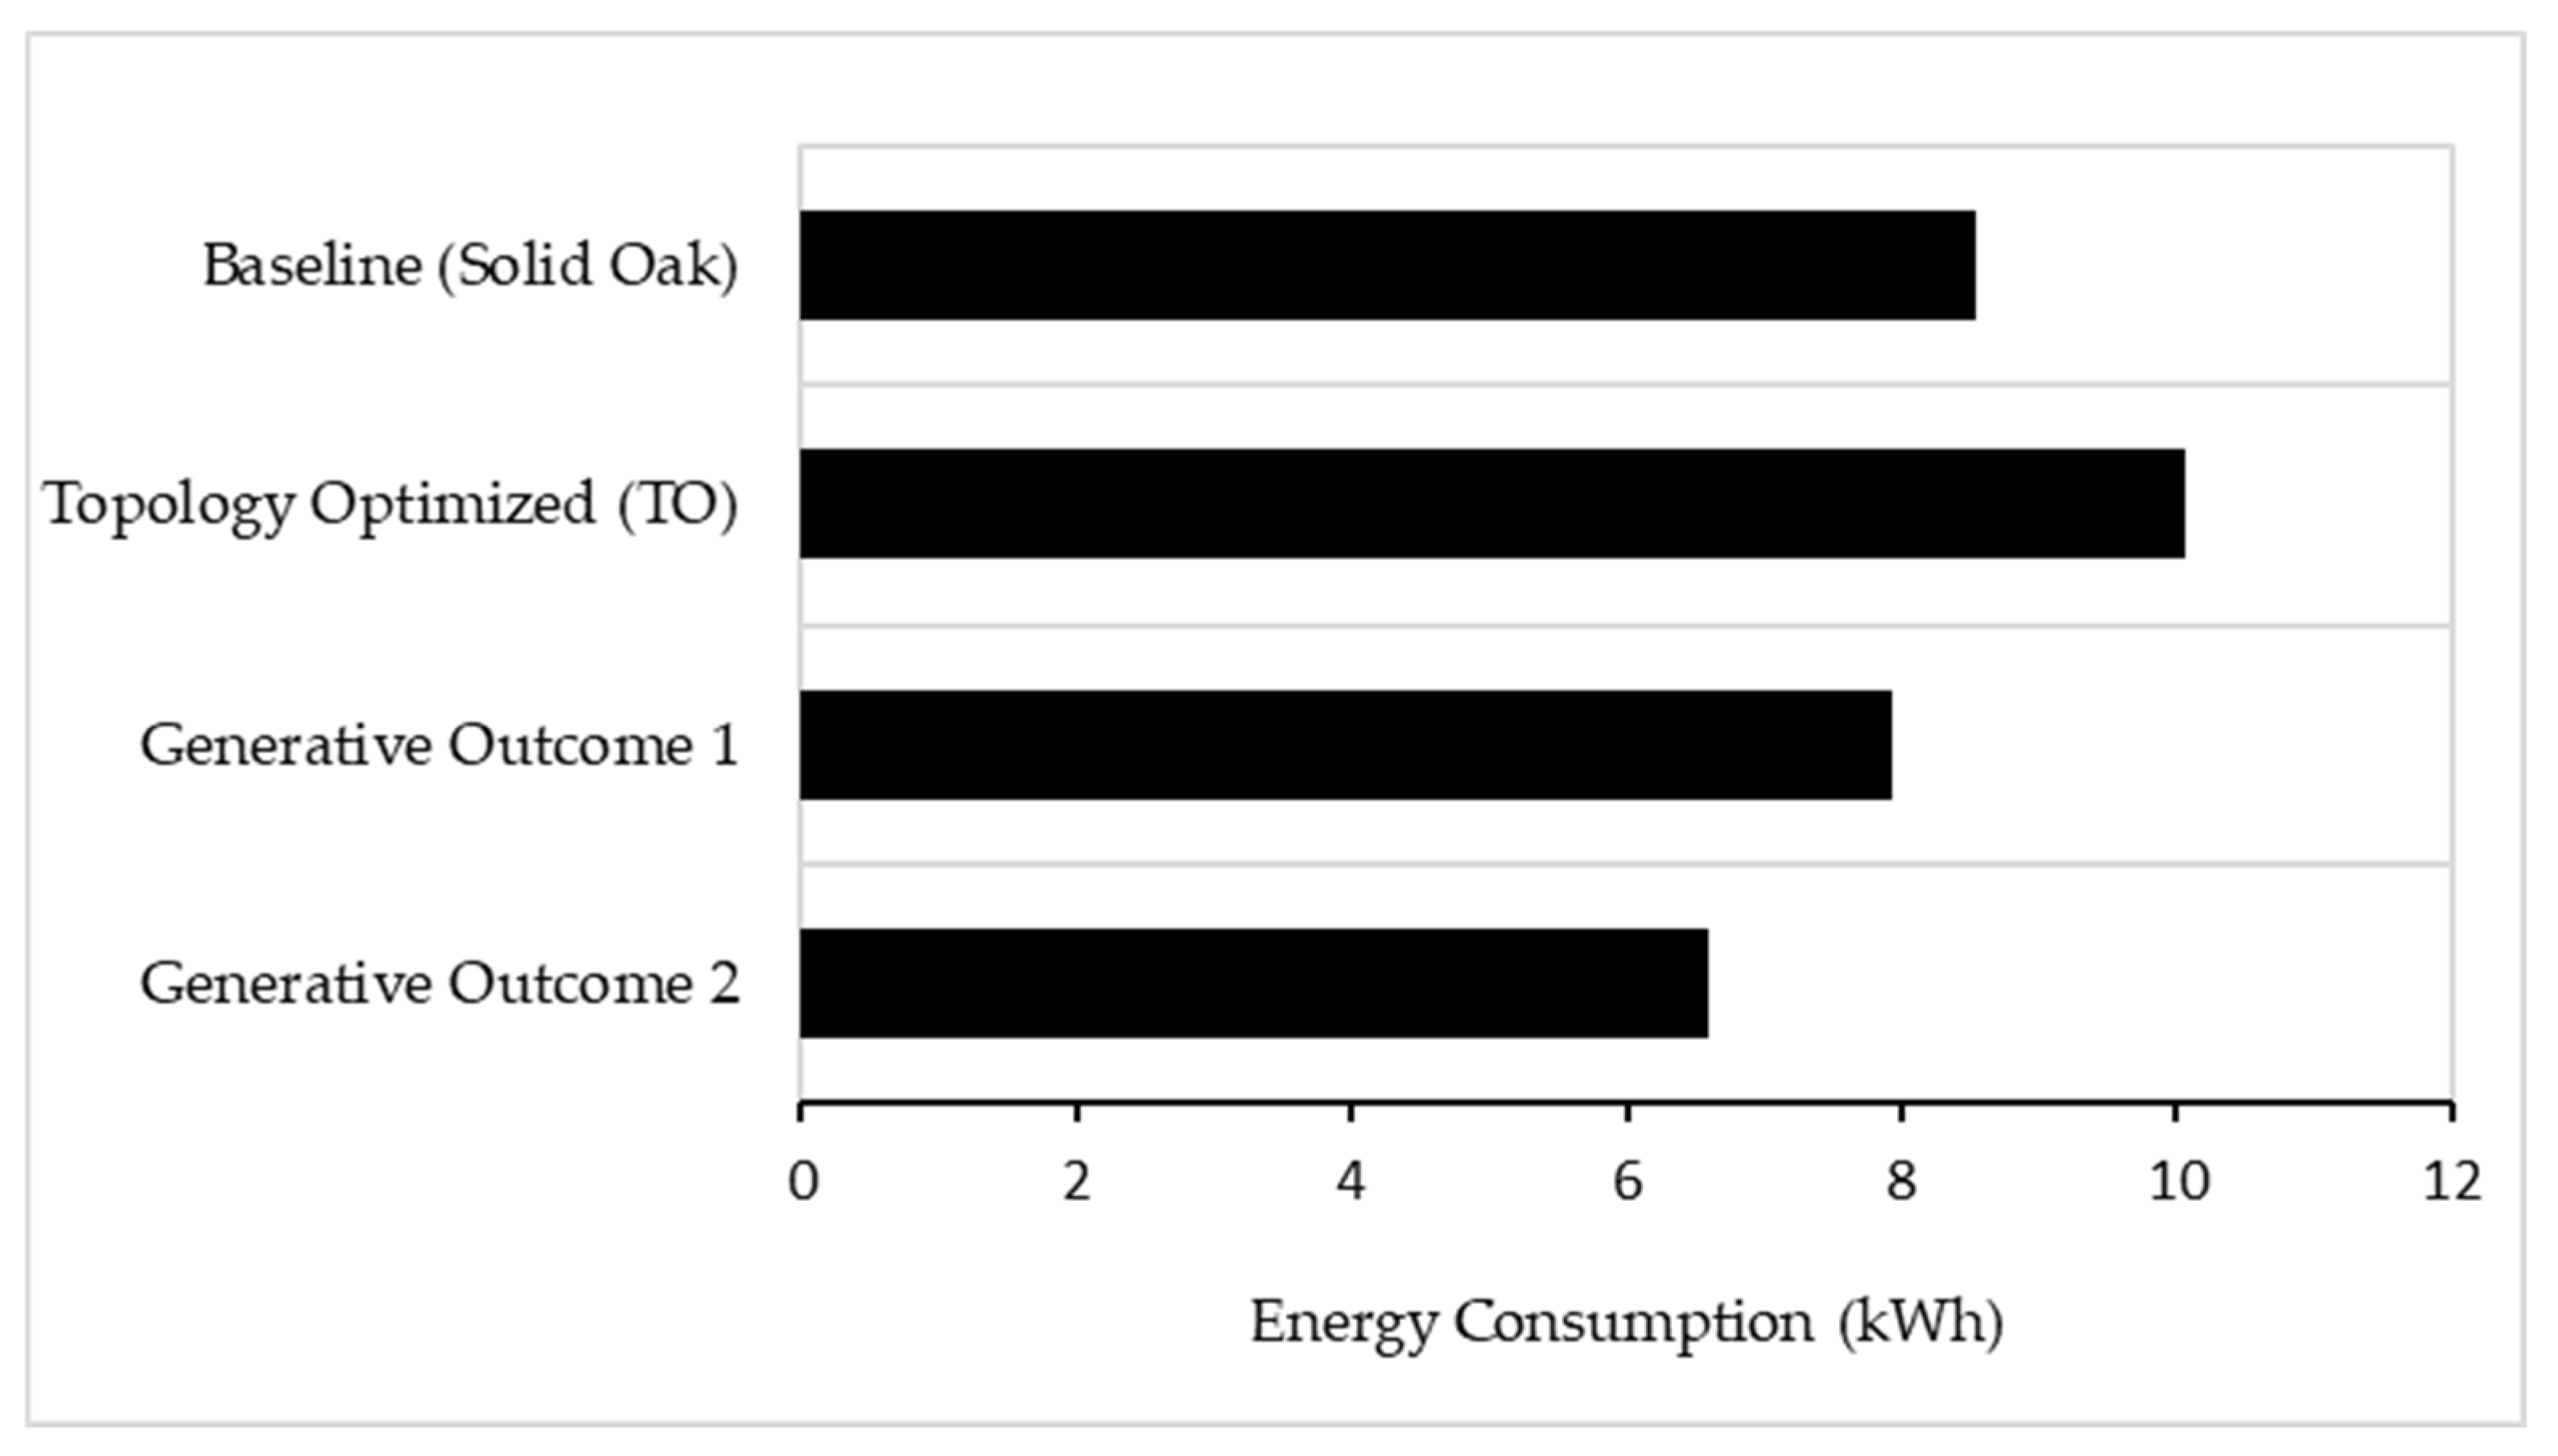
Figure 21.
Comparative energy consumption across all examined design scenarios.
Figure 21.
Comparative energy consumption across all examined design scenarios.
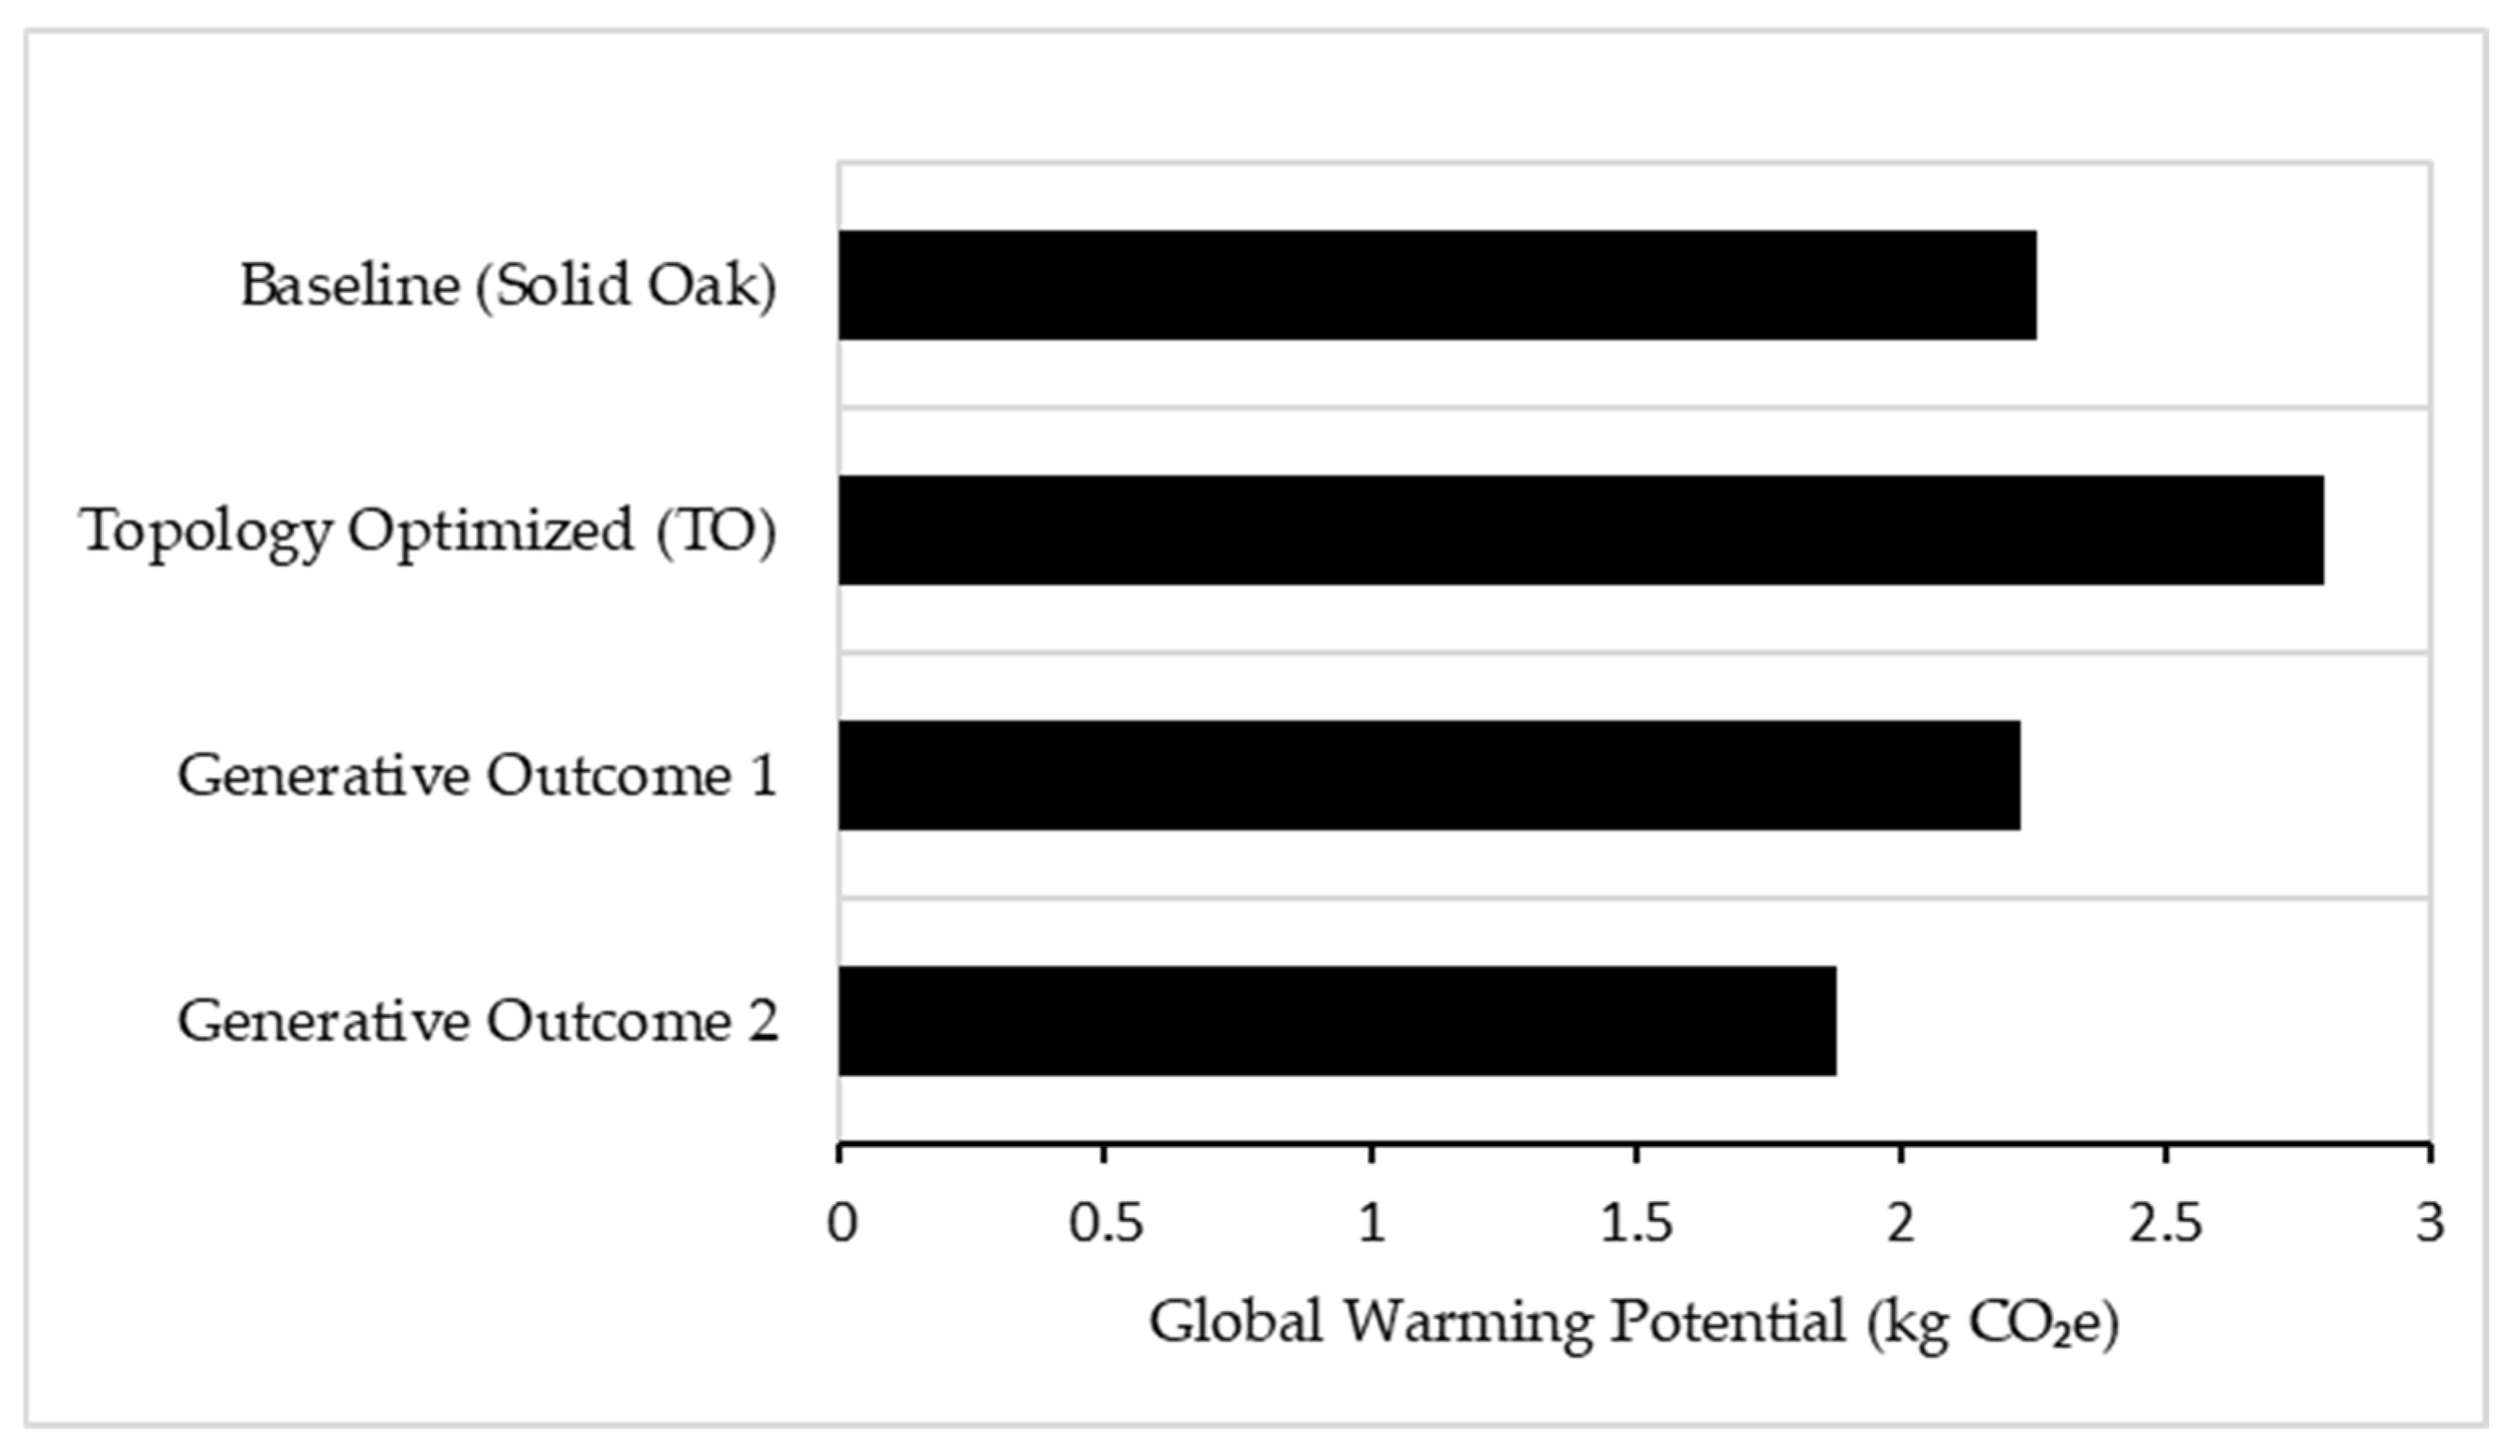
Figure 22.
Comparative Global Warming Potential expressed in CO2e across all examined design scenarios.
Figure 22.
Comparative Global Warming Potential expressed in CO2e across all examined design scenarios.
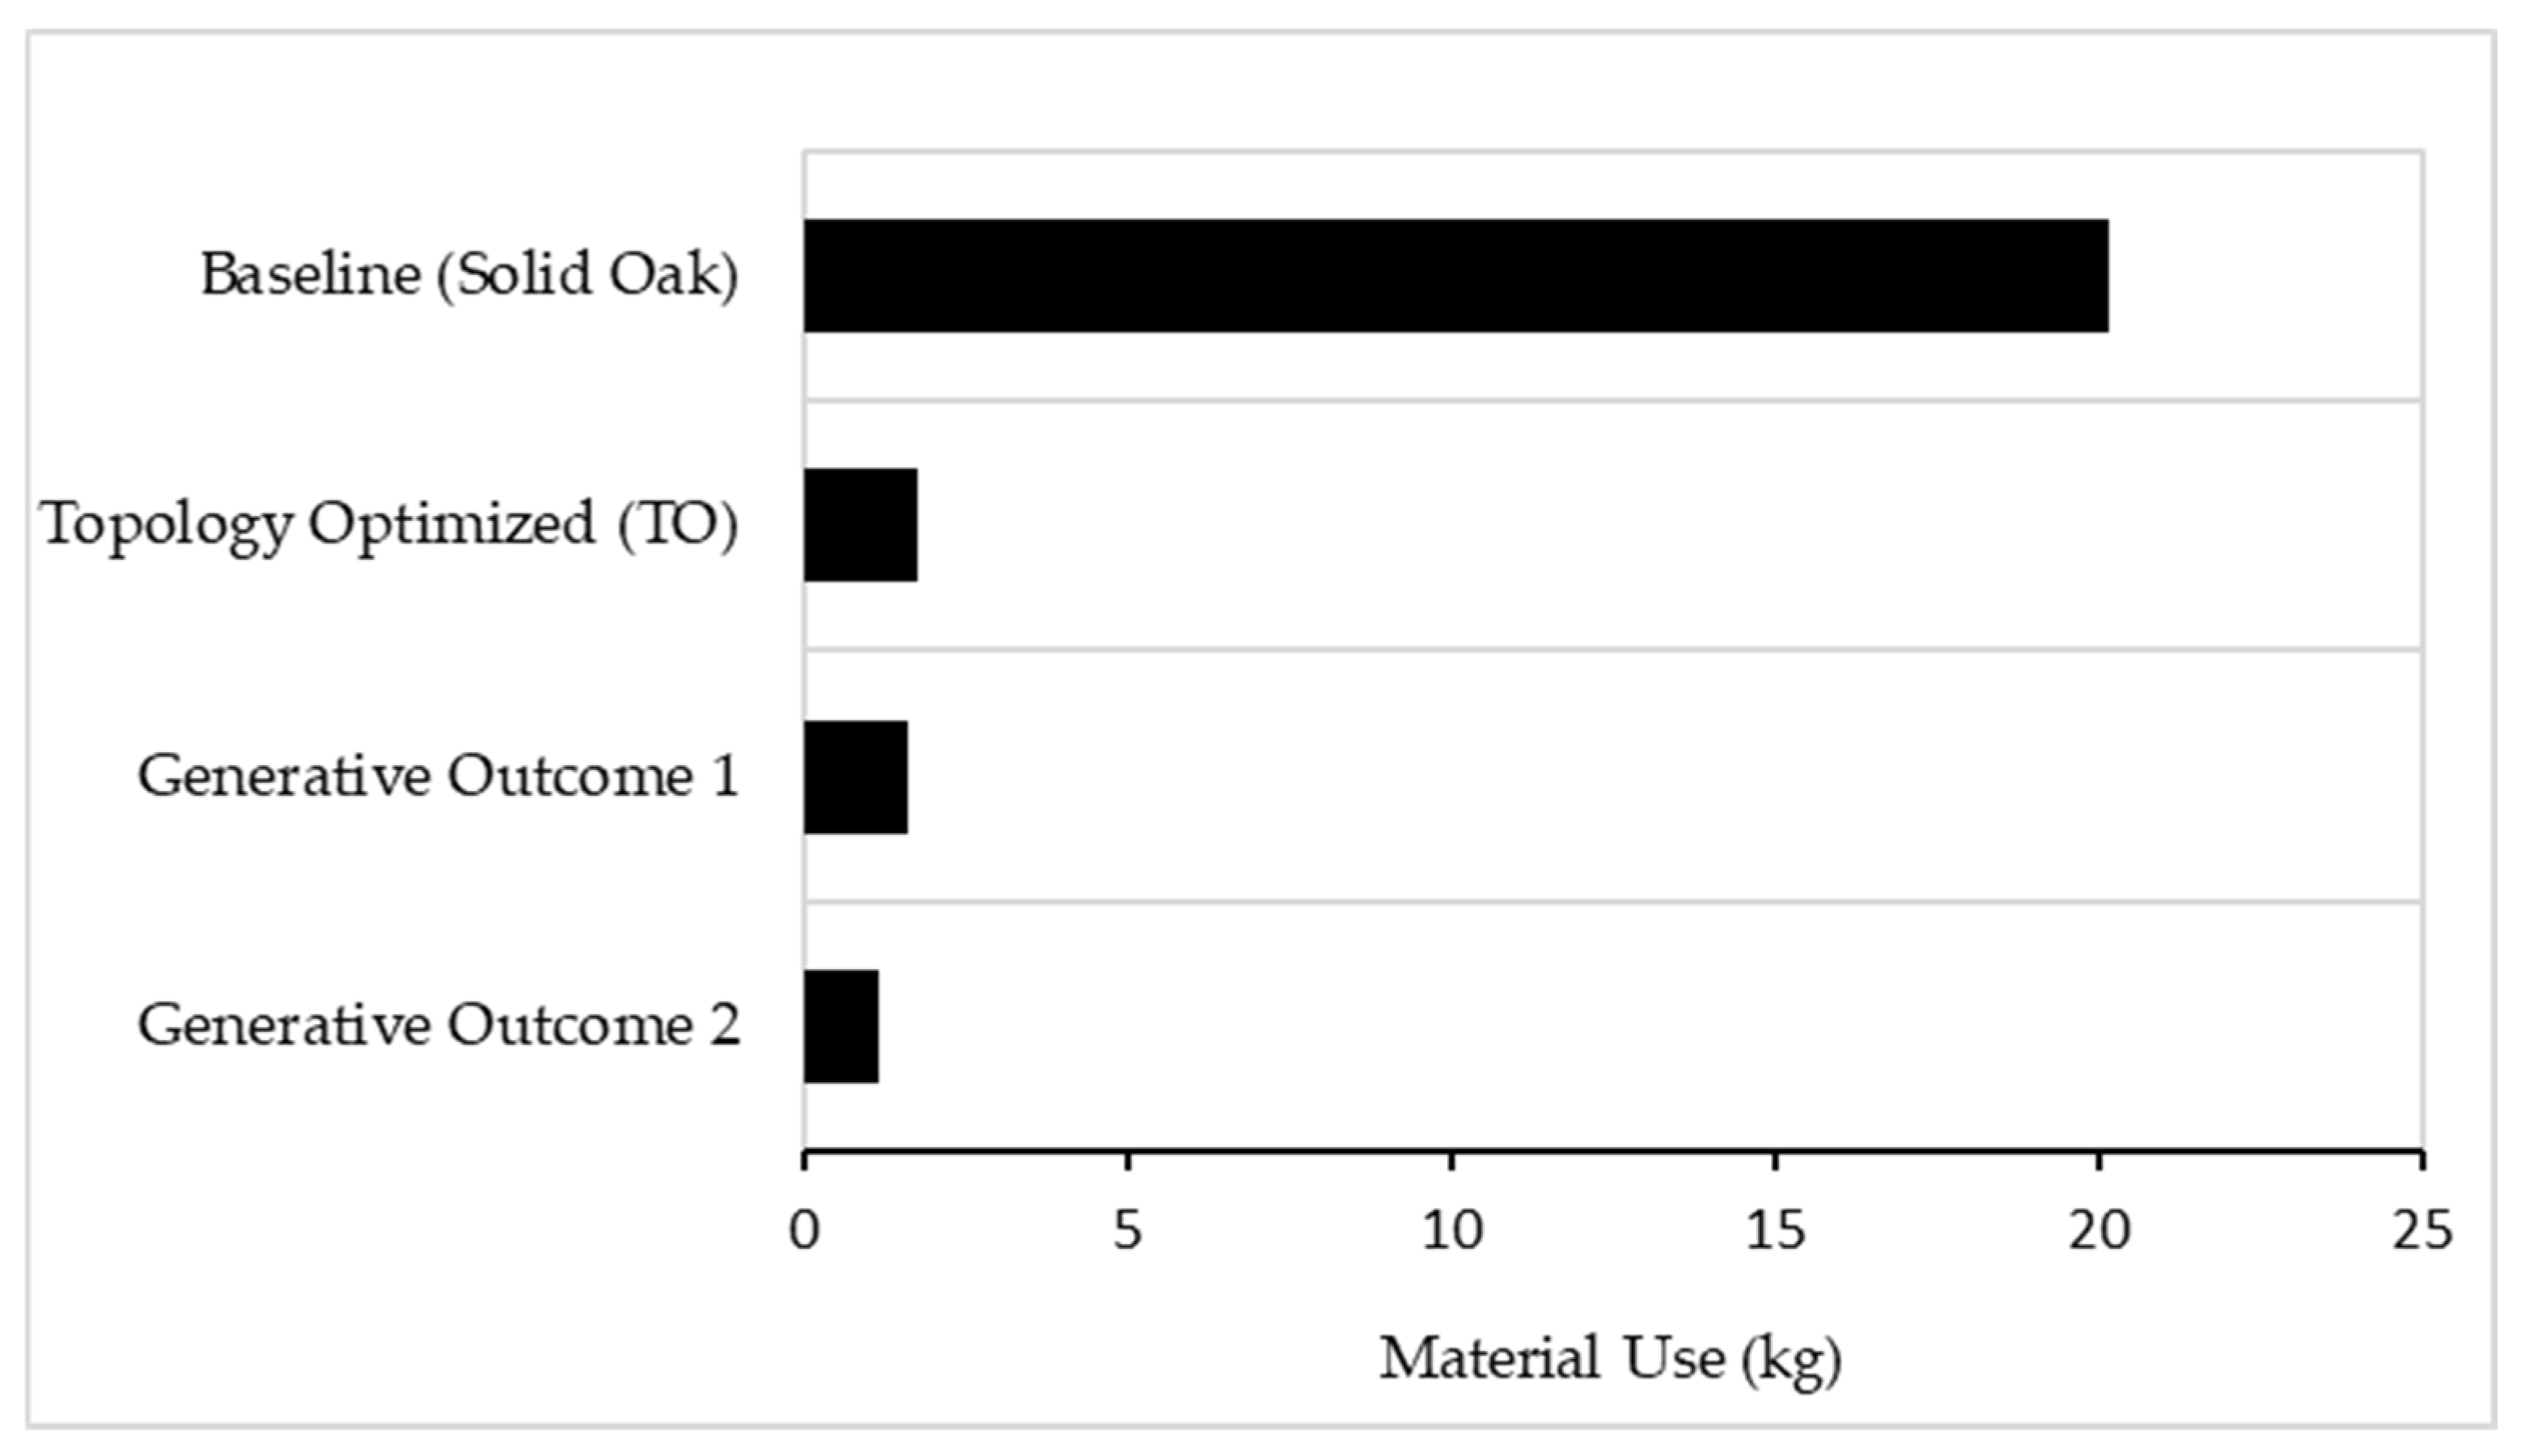
Figure 23.
Comparative material usage across all examined design scenarios.
Figure 23.
Comparative material usage across all examined design scenarios.
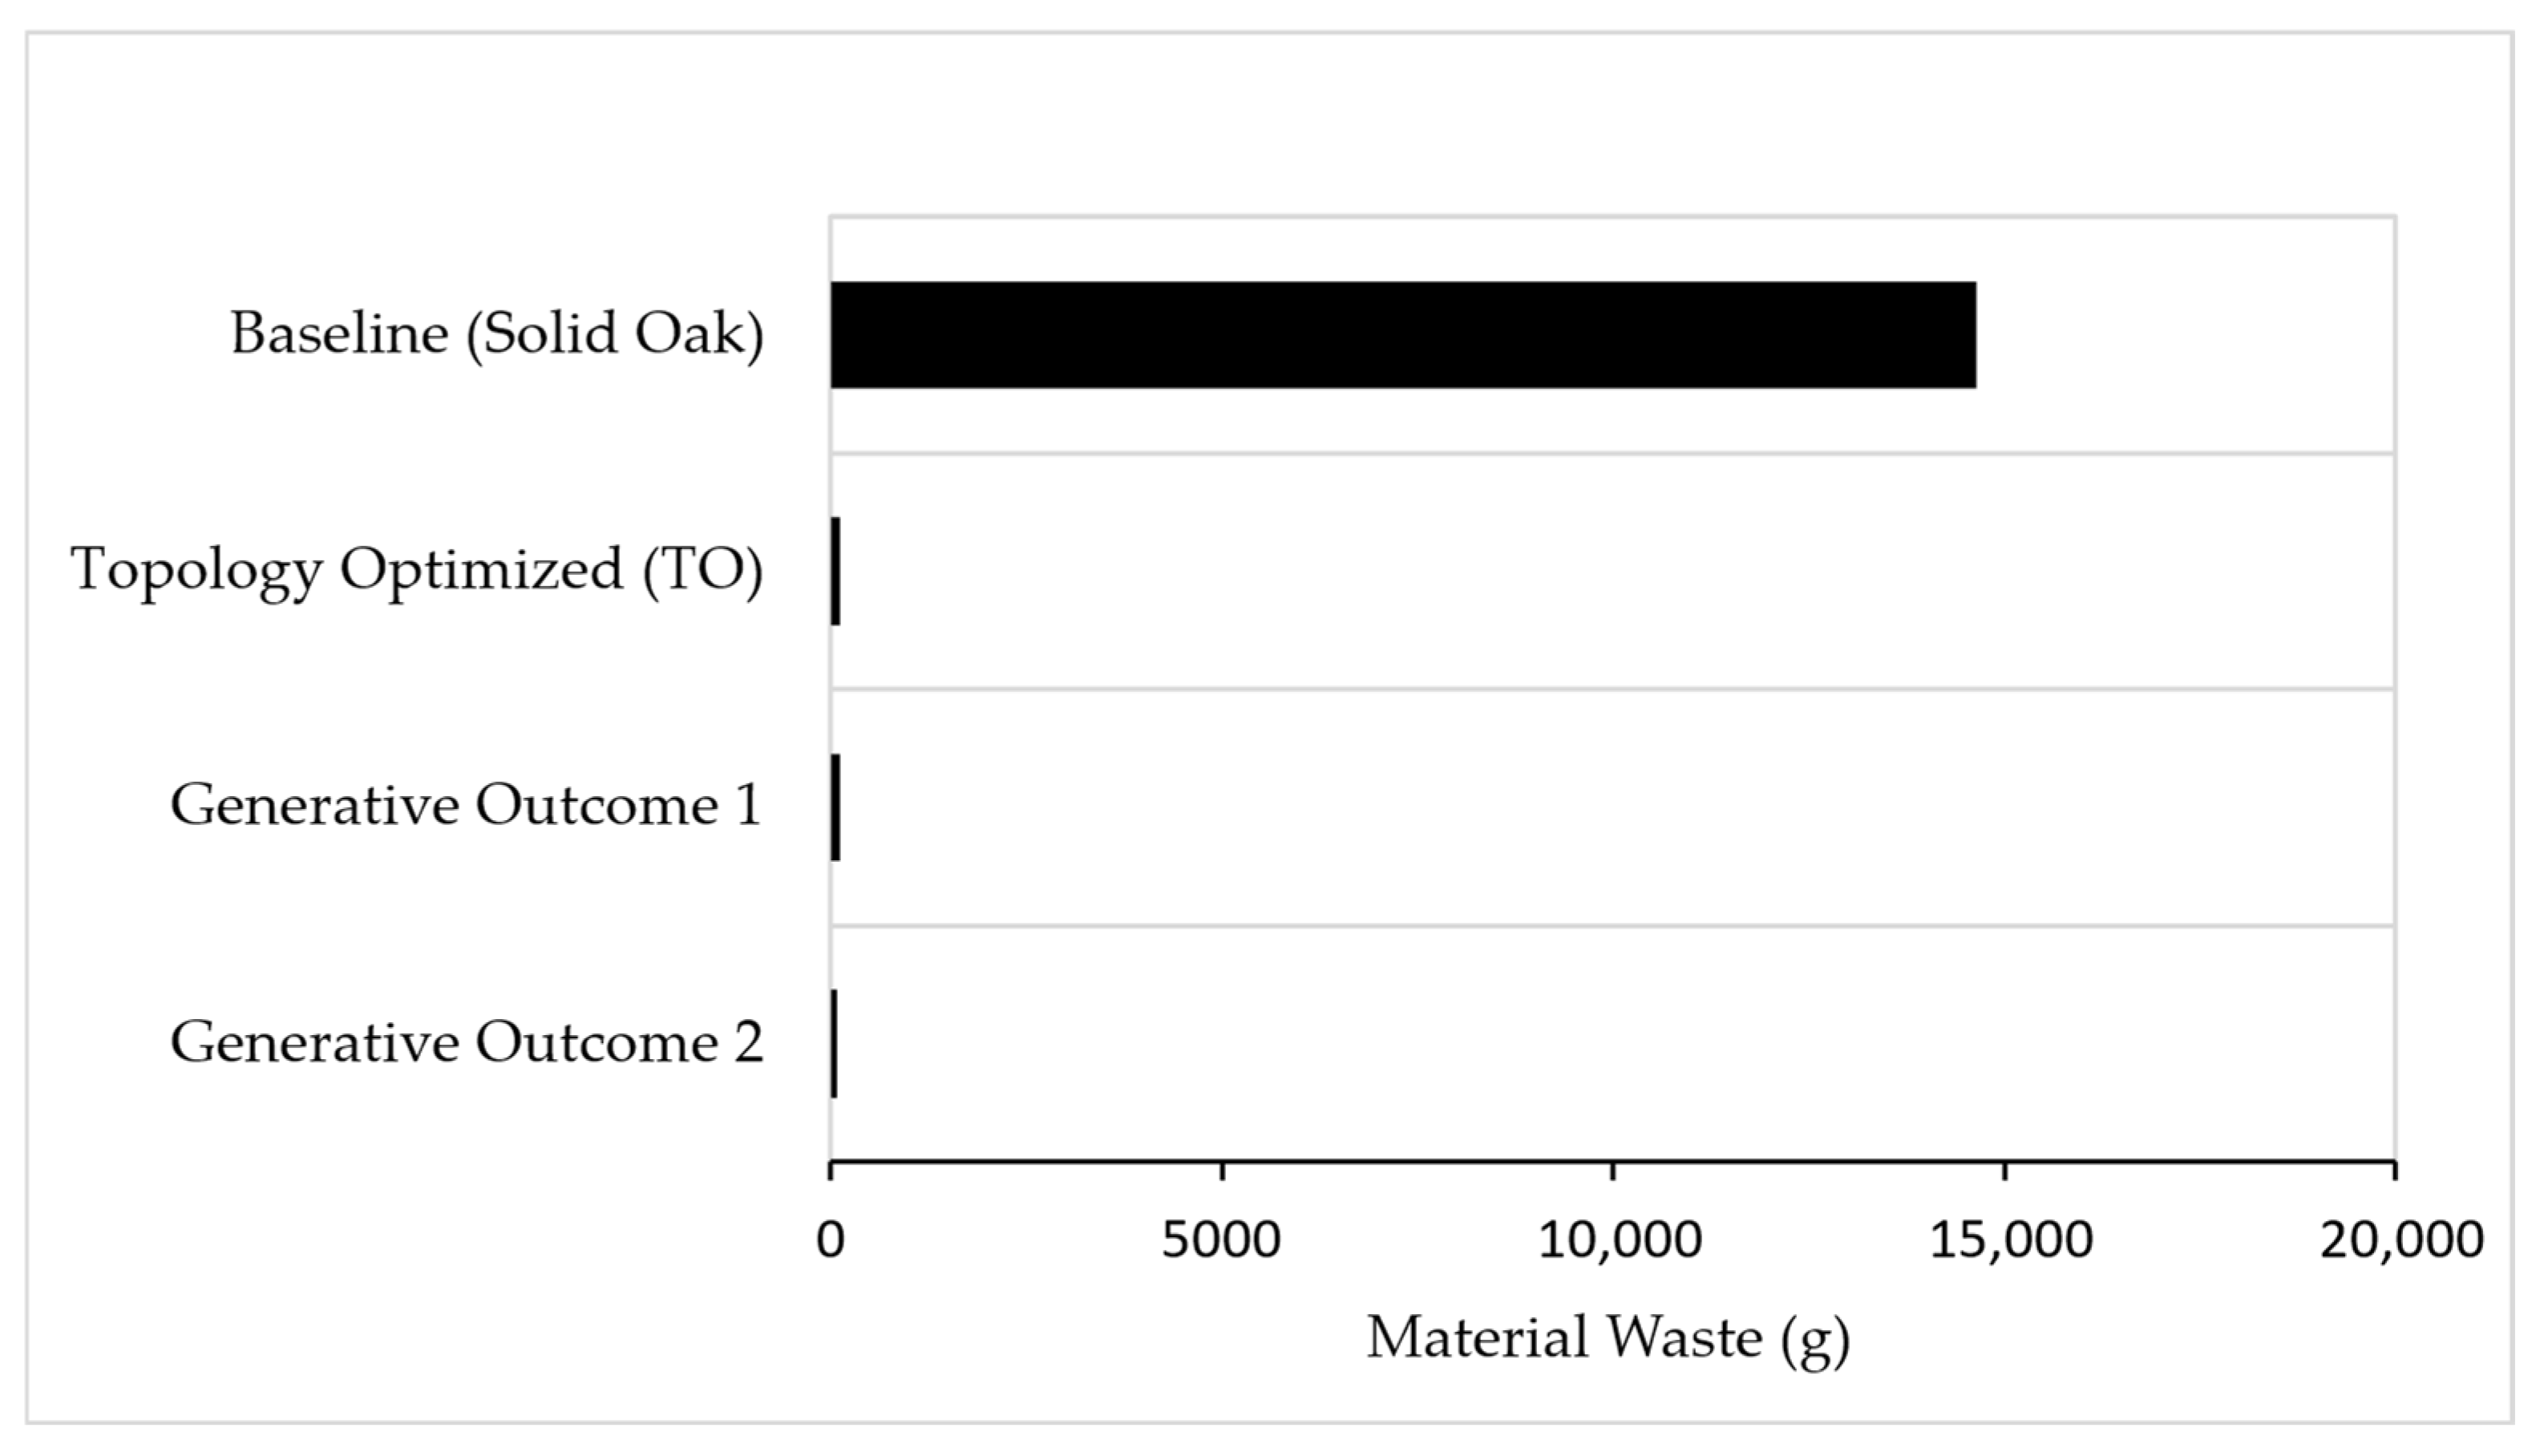
Figure 24.
Comparative material waste across all examined design scenarios.
Figure 24.
Comparative material waste across all examined design scenarios.
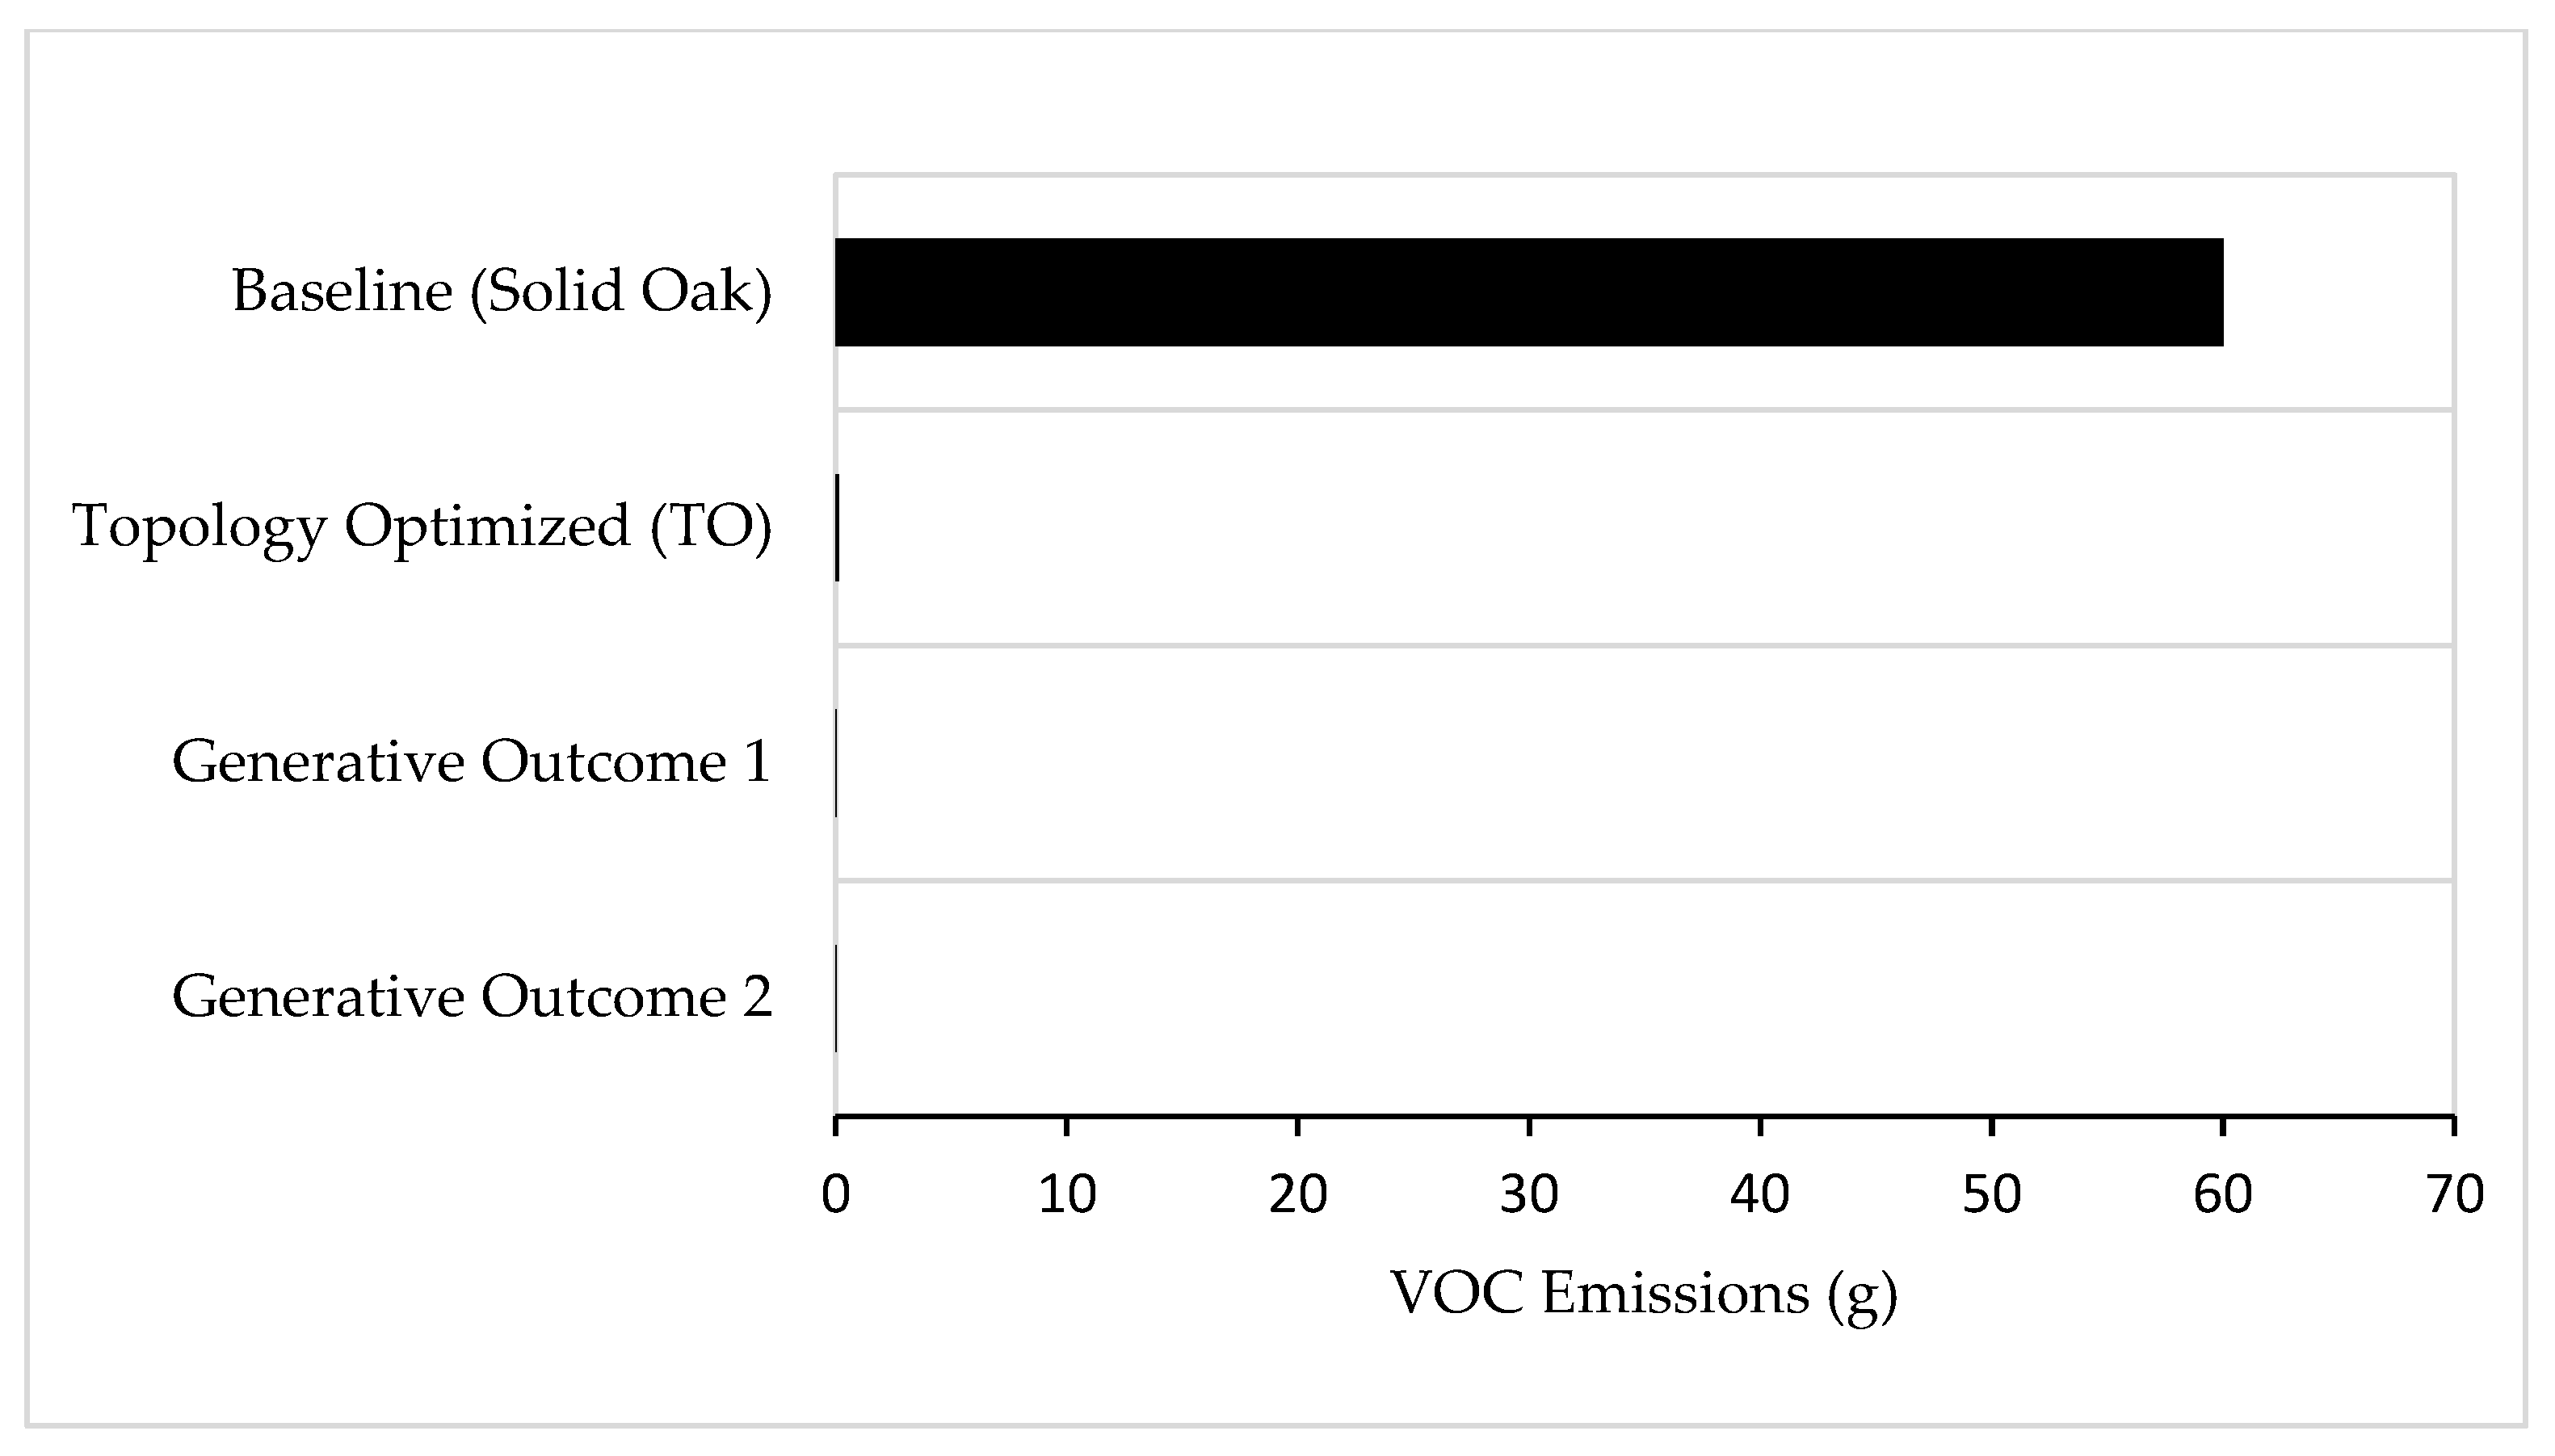
Figure 25.
Comparative VOC emissions across all examined design scenarios.
Figure 25.
Comparative VOC emissions across all examined design scenarios.
Figure 26.
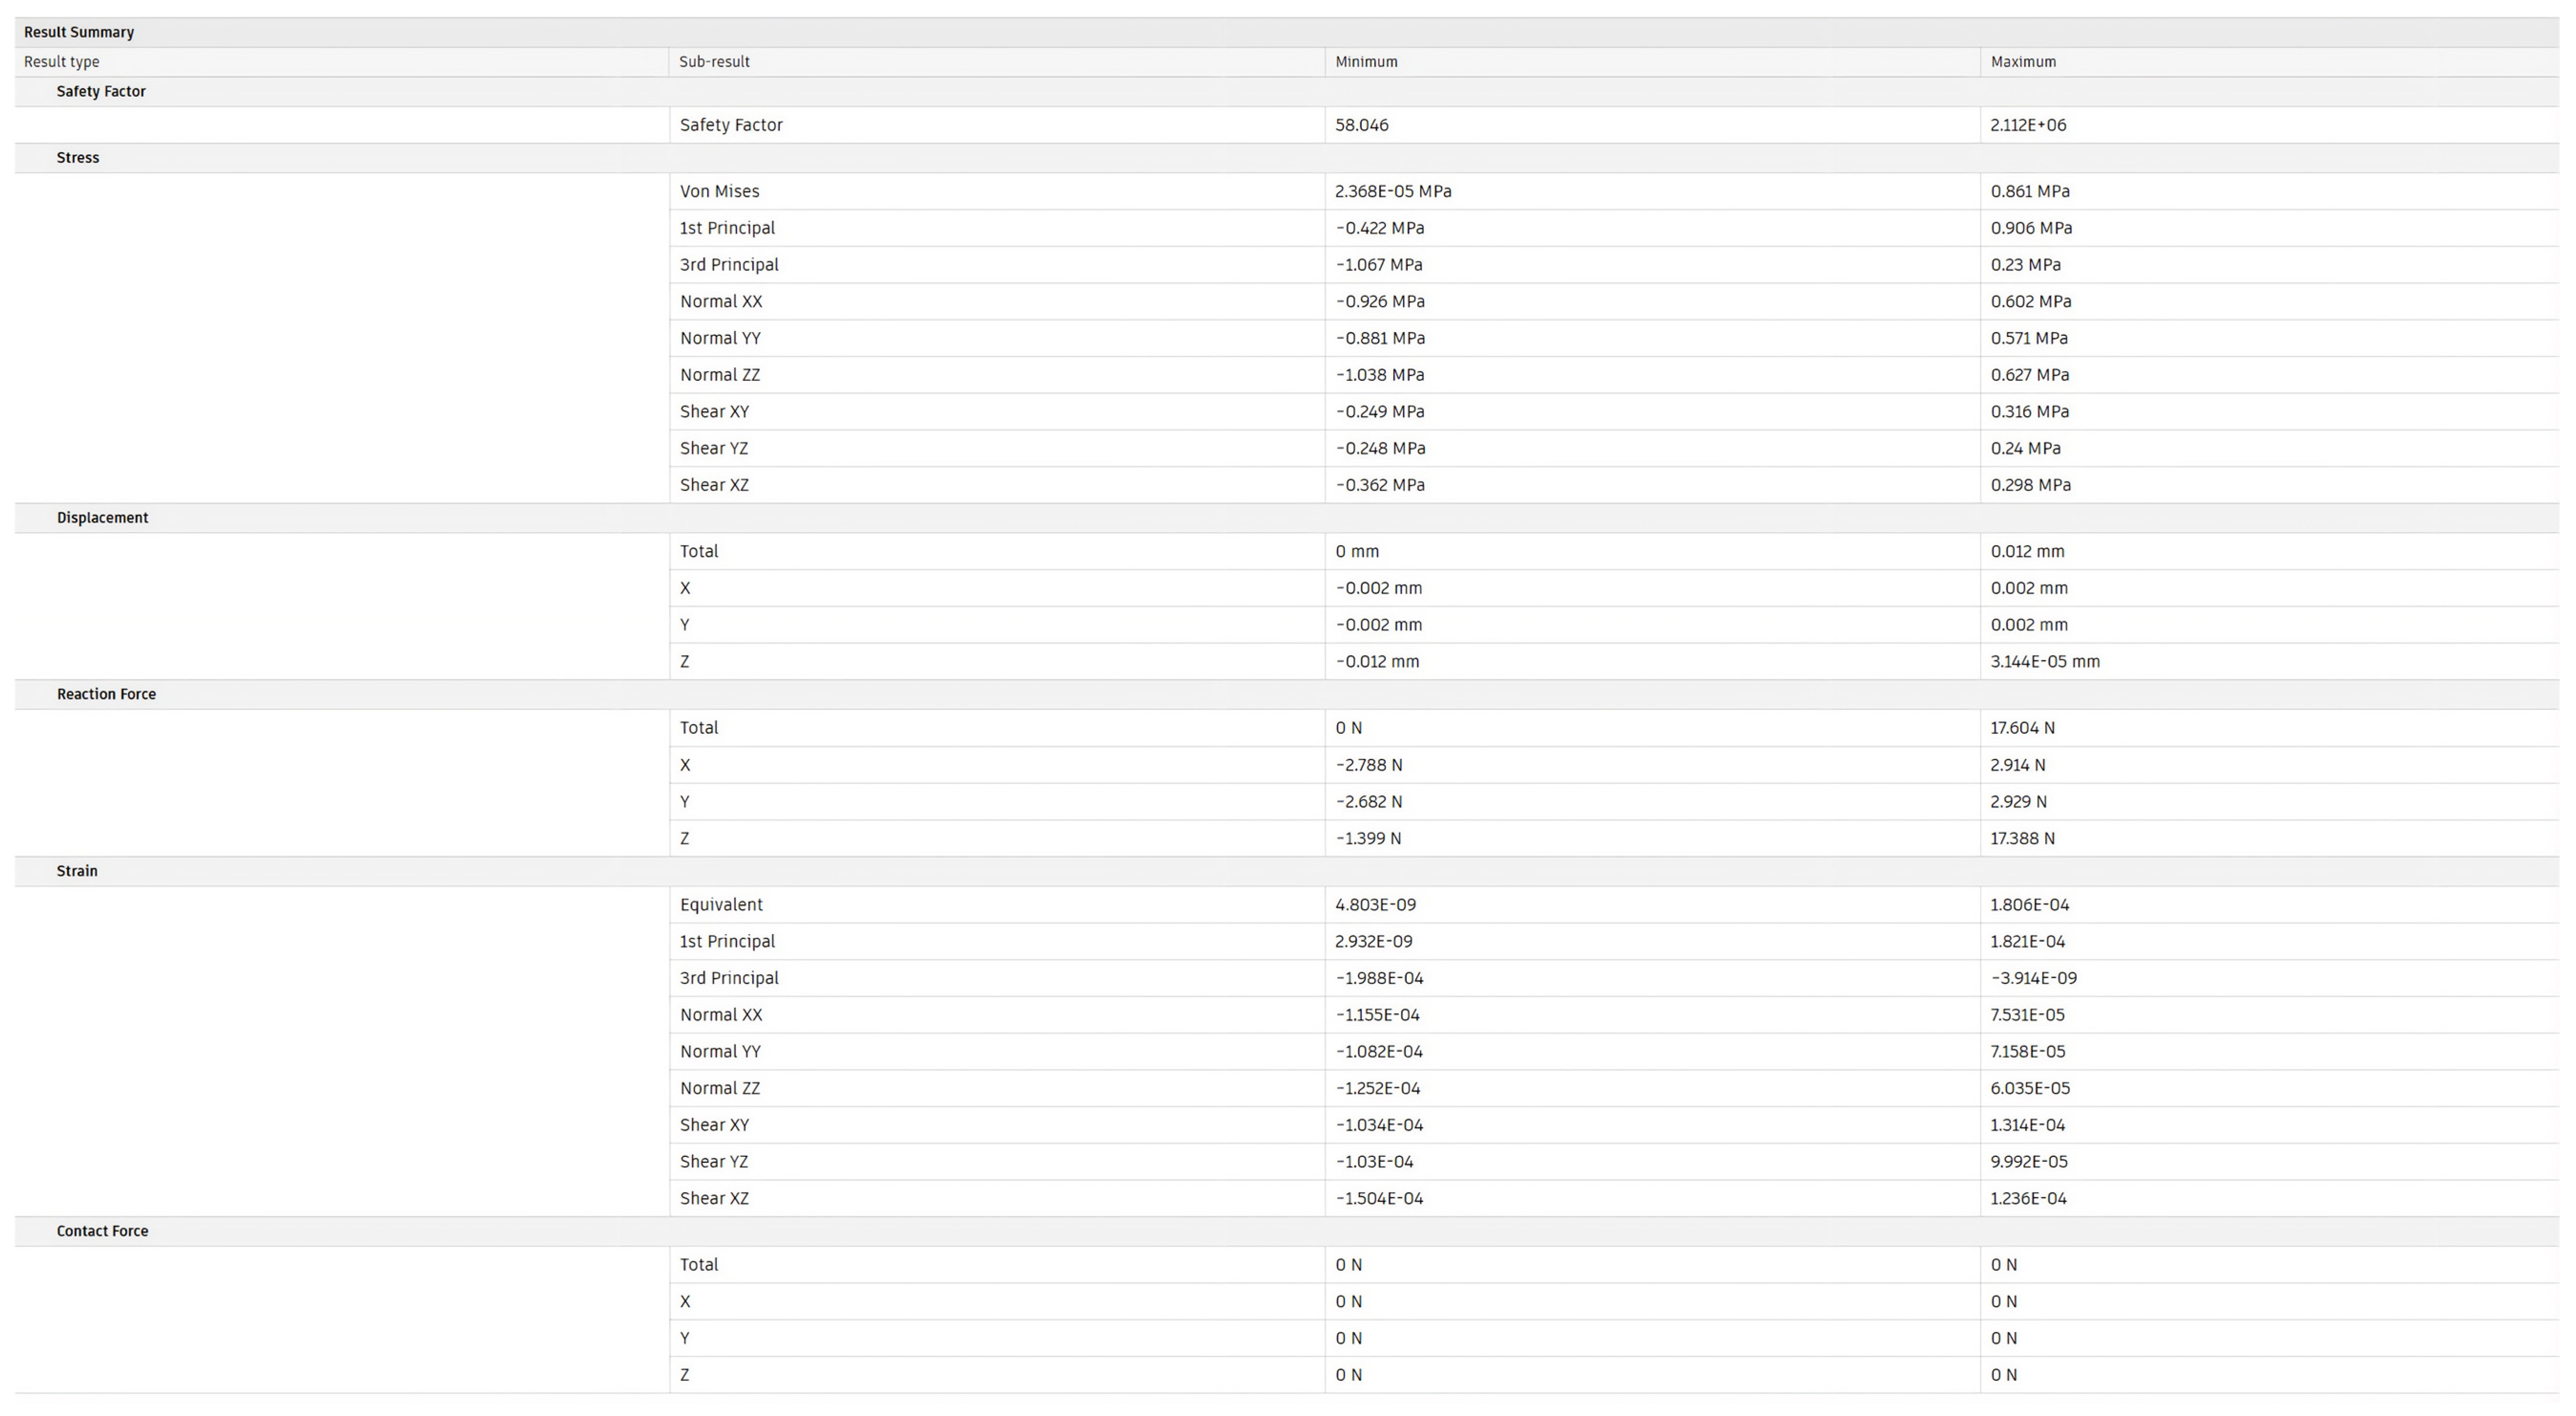
Study report of GD outcome 1.
Figure 26.
Study report of GD outcome 1.
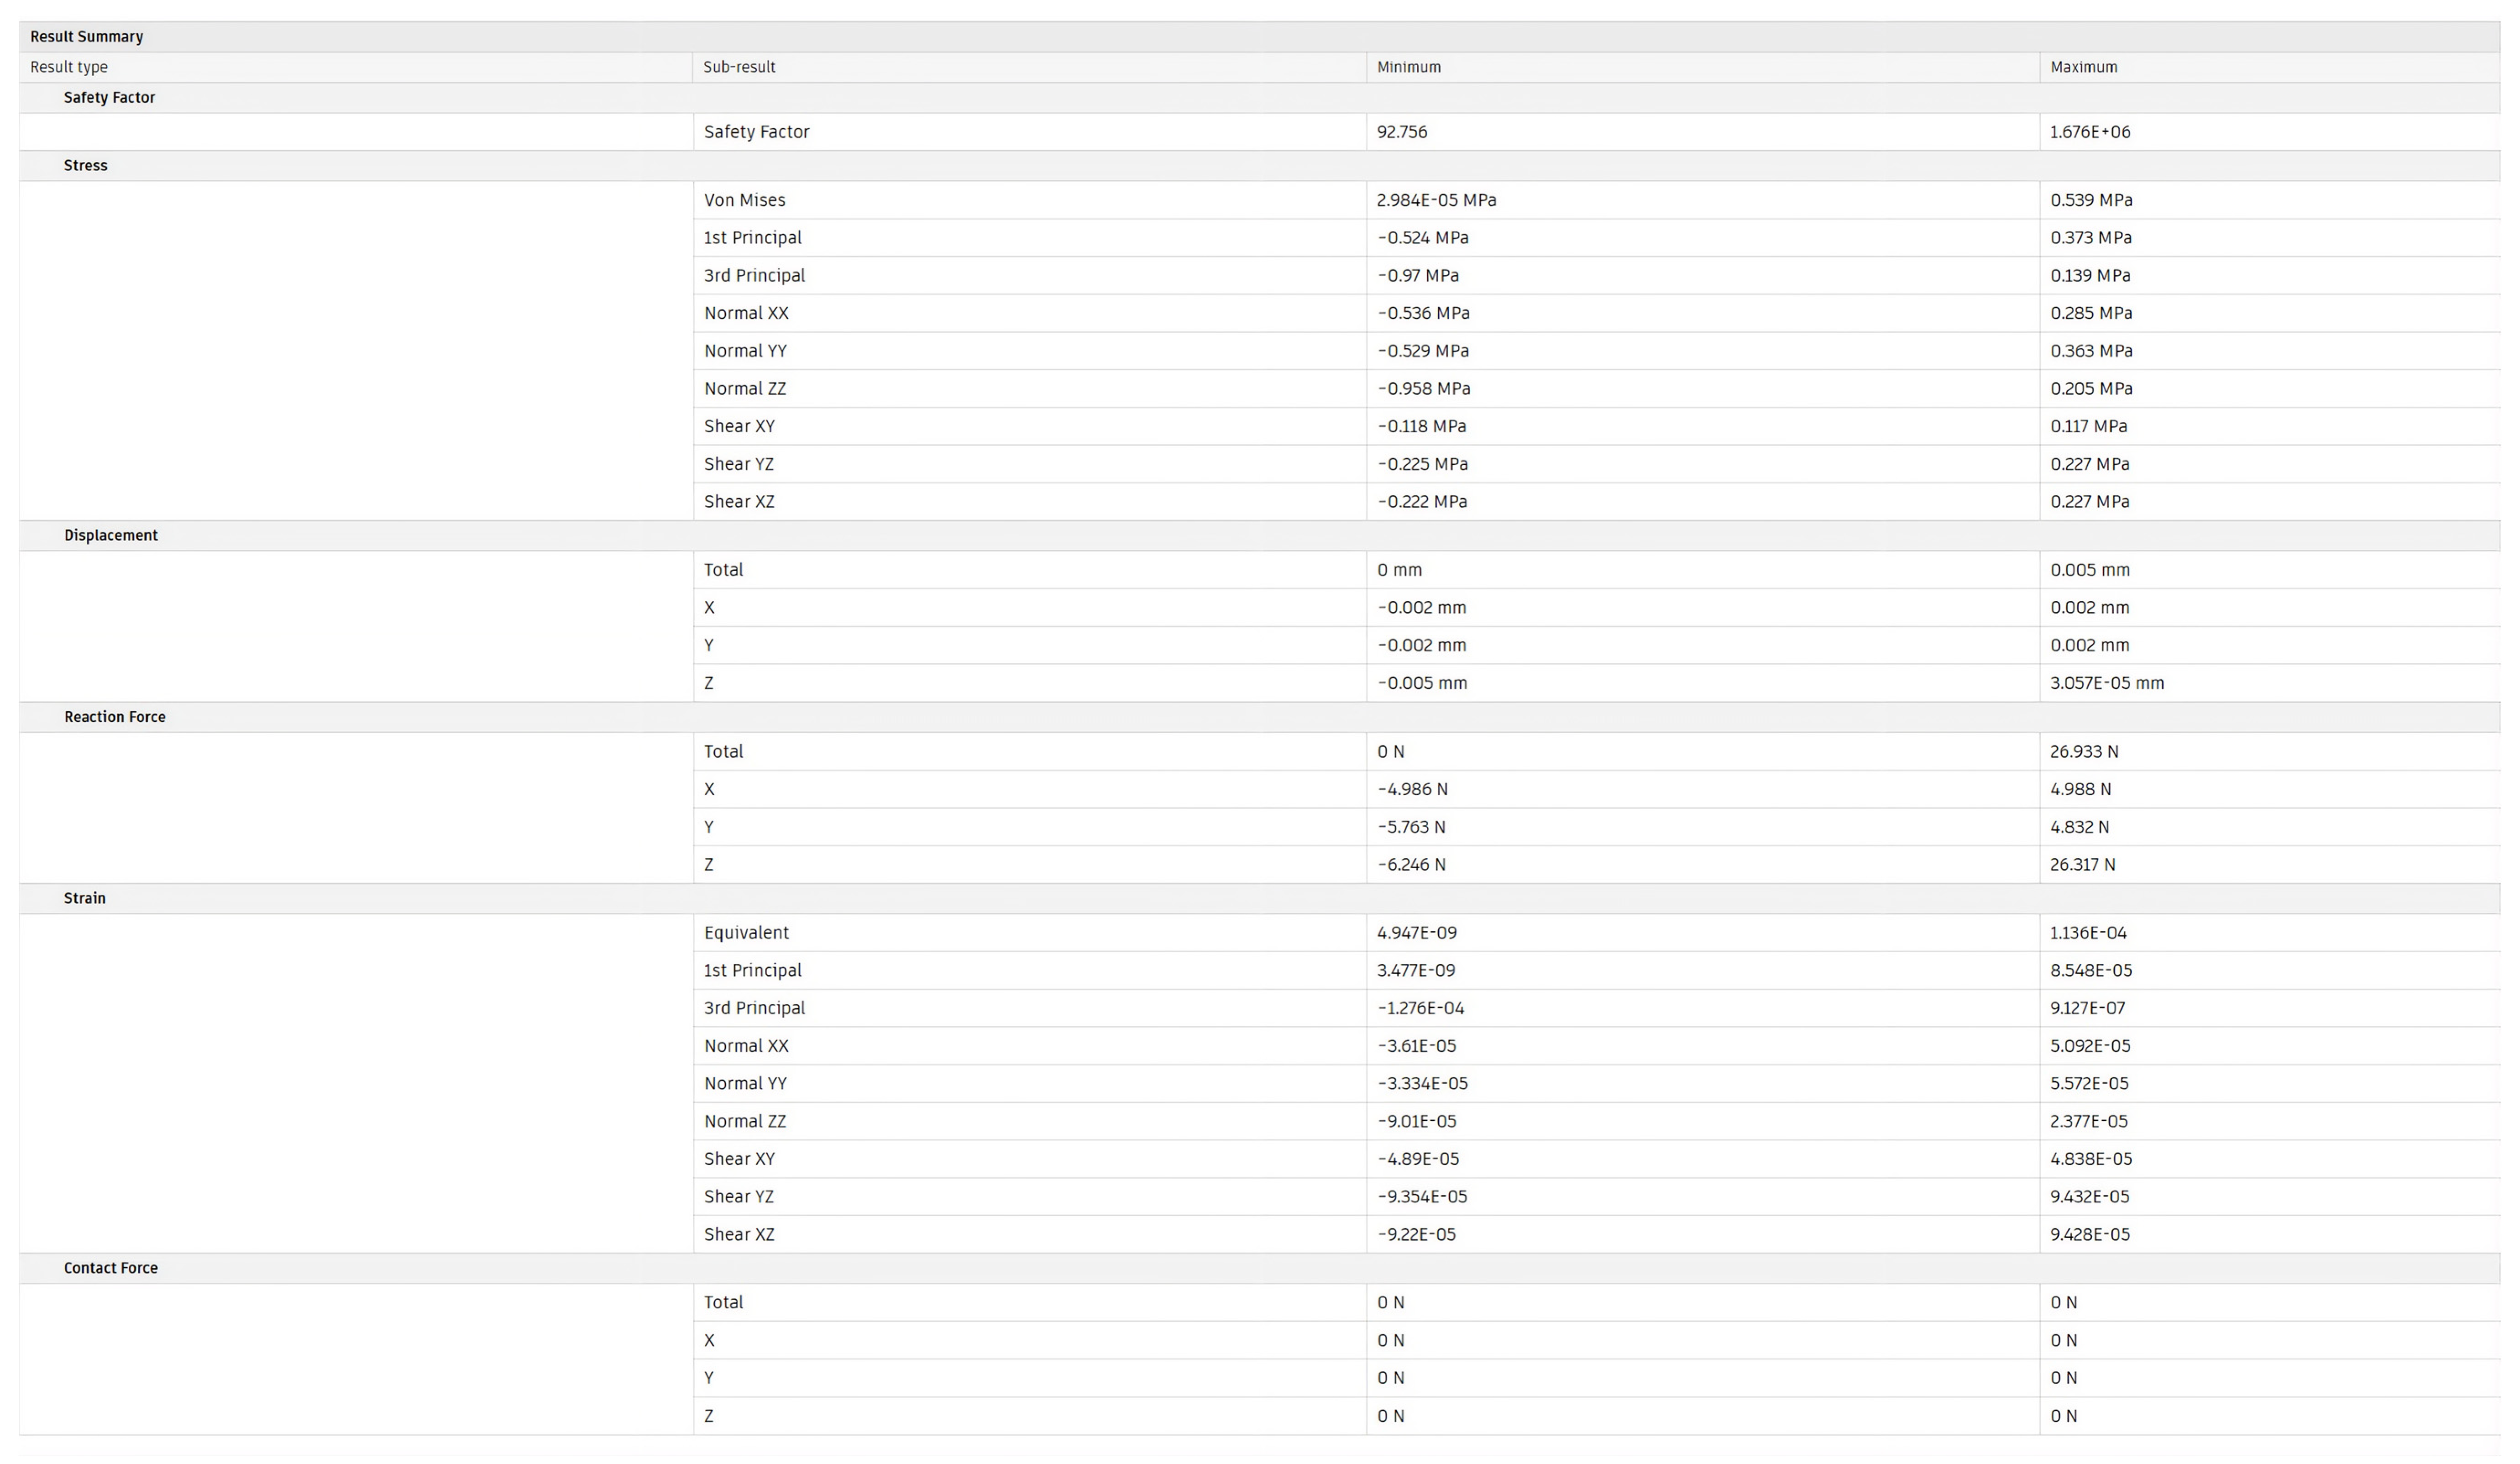
Figure 27.
Study report of GD outcome 2.
Figure 27.
Study report of GD outcome 2.
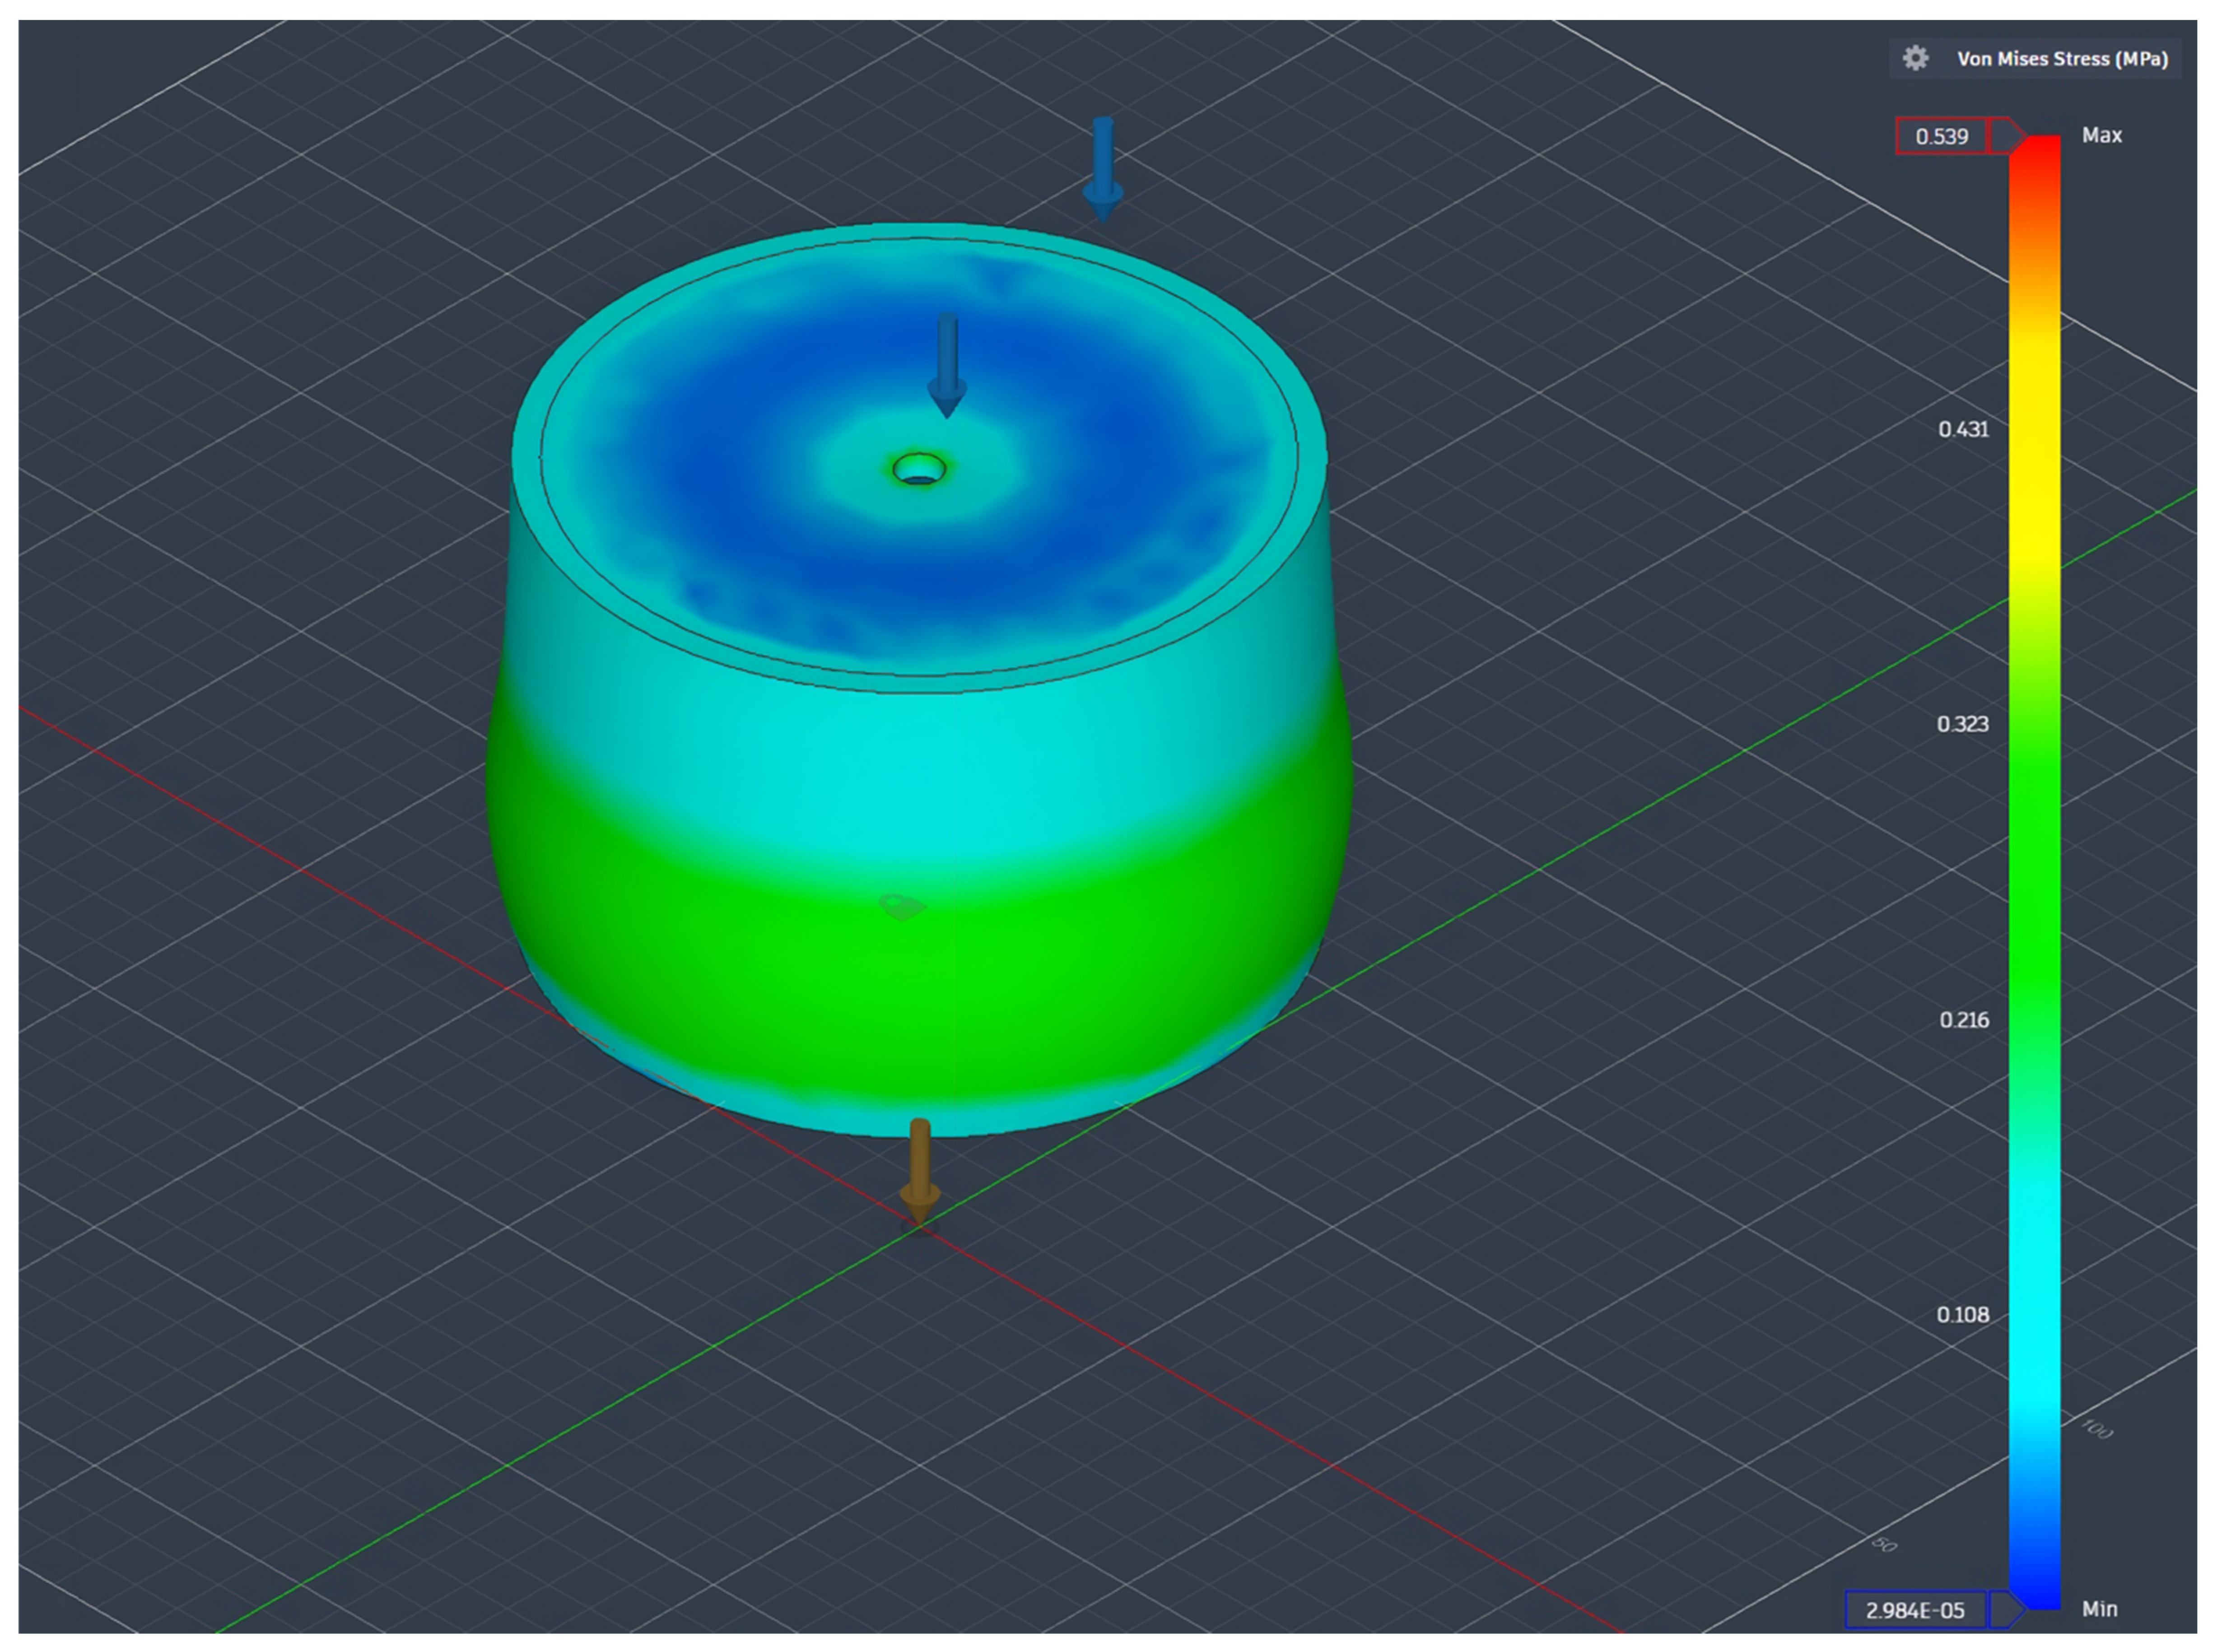
Figure 28.
Structural validation of GD Outcome 2 via static stress analysis showing Von Mises stress distribution.
Figure 28.
Structural validation of GD Outcome 2 via static stress analysis showing Von Mises stress distribution.
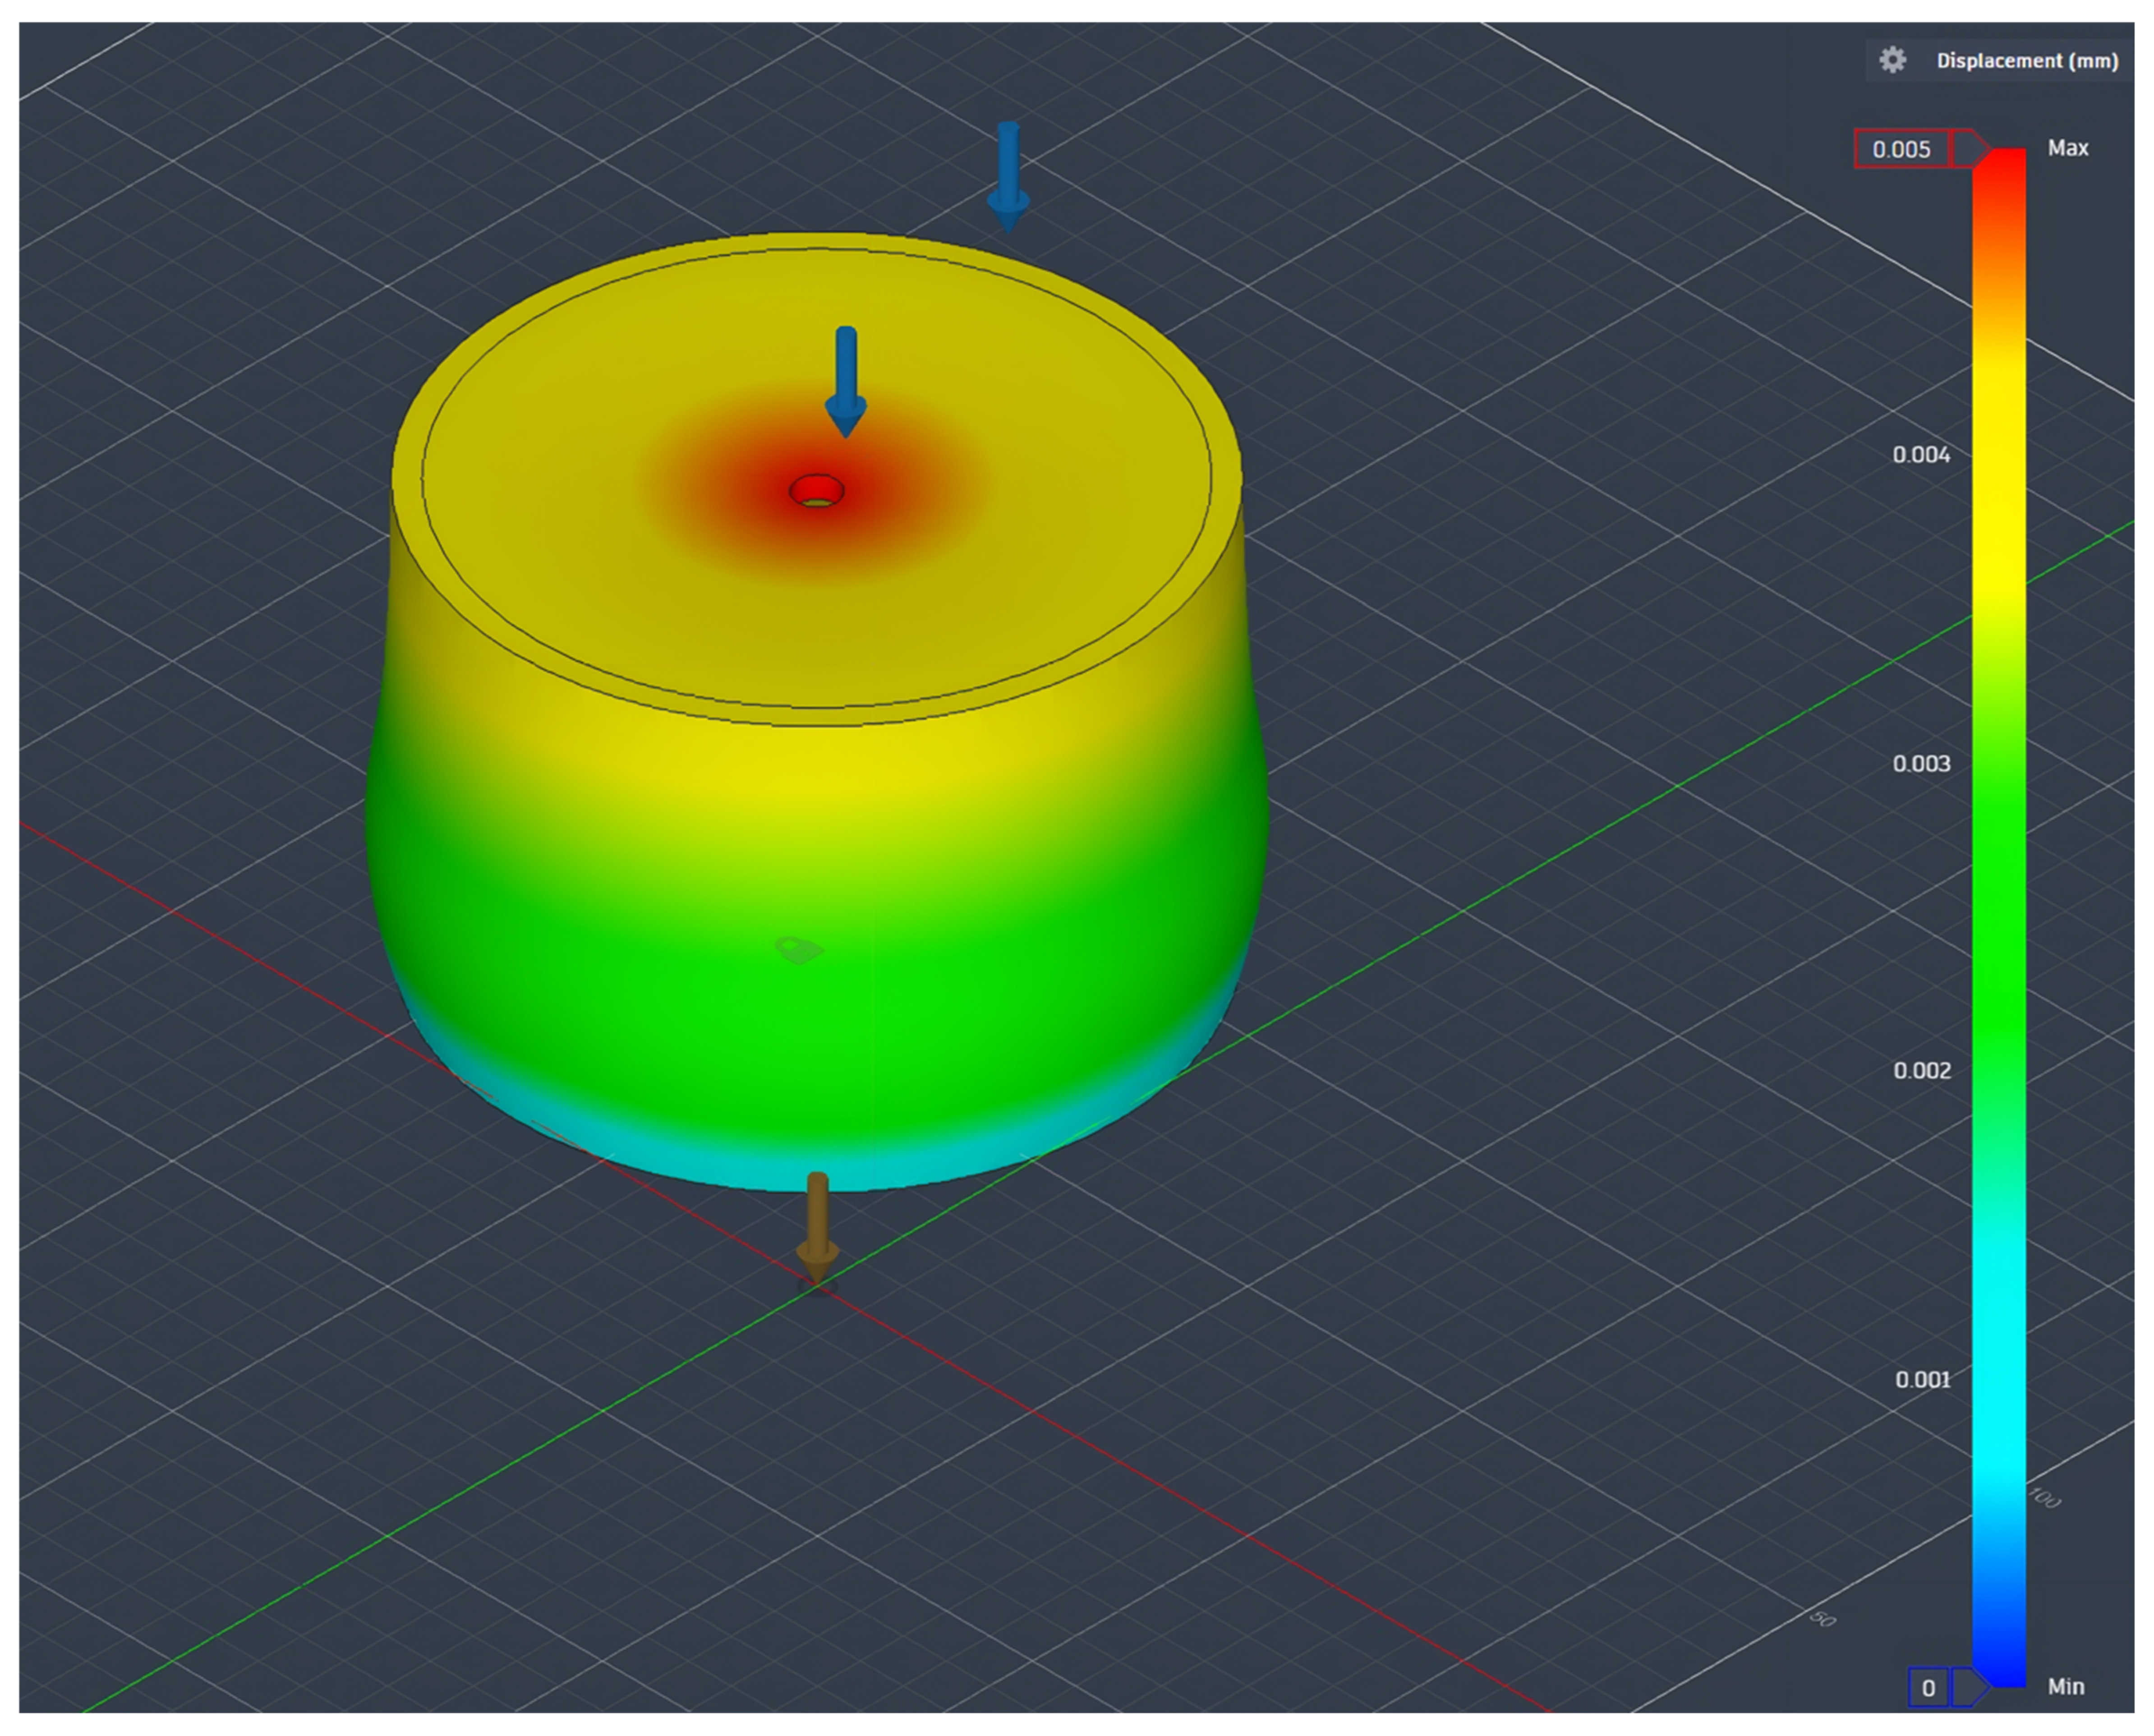
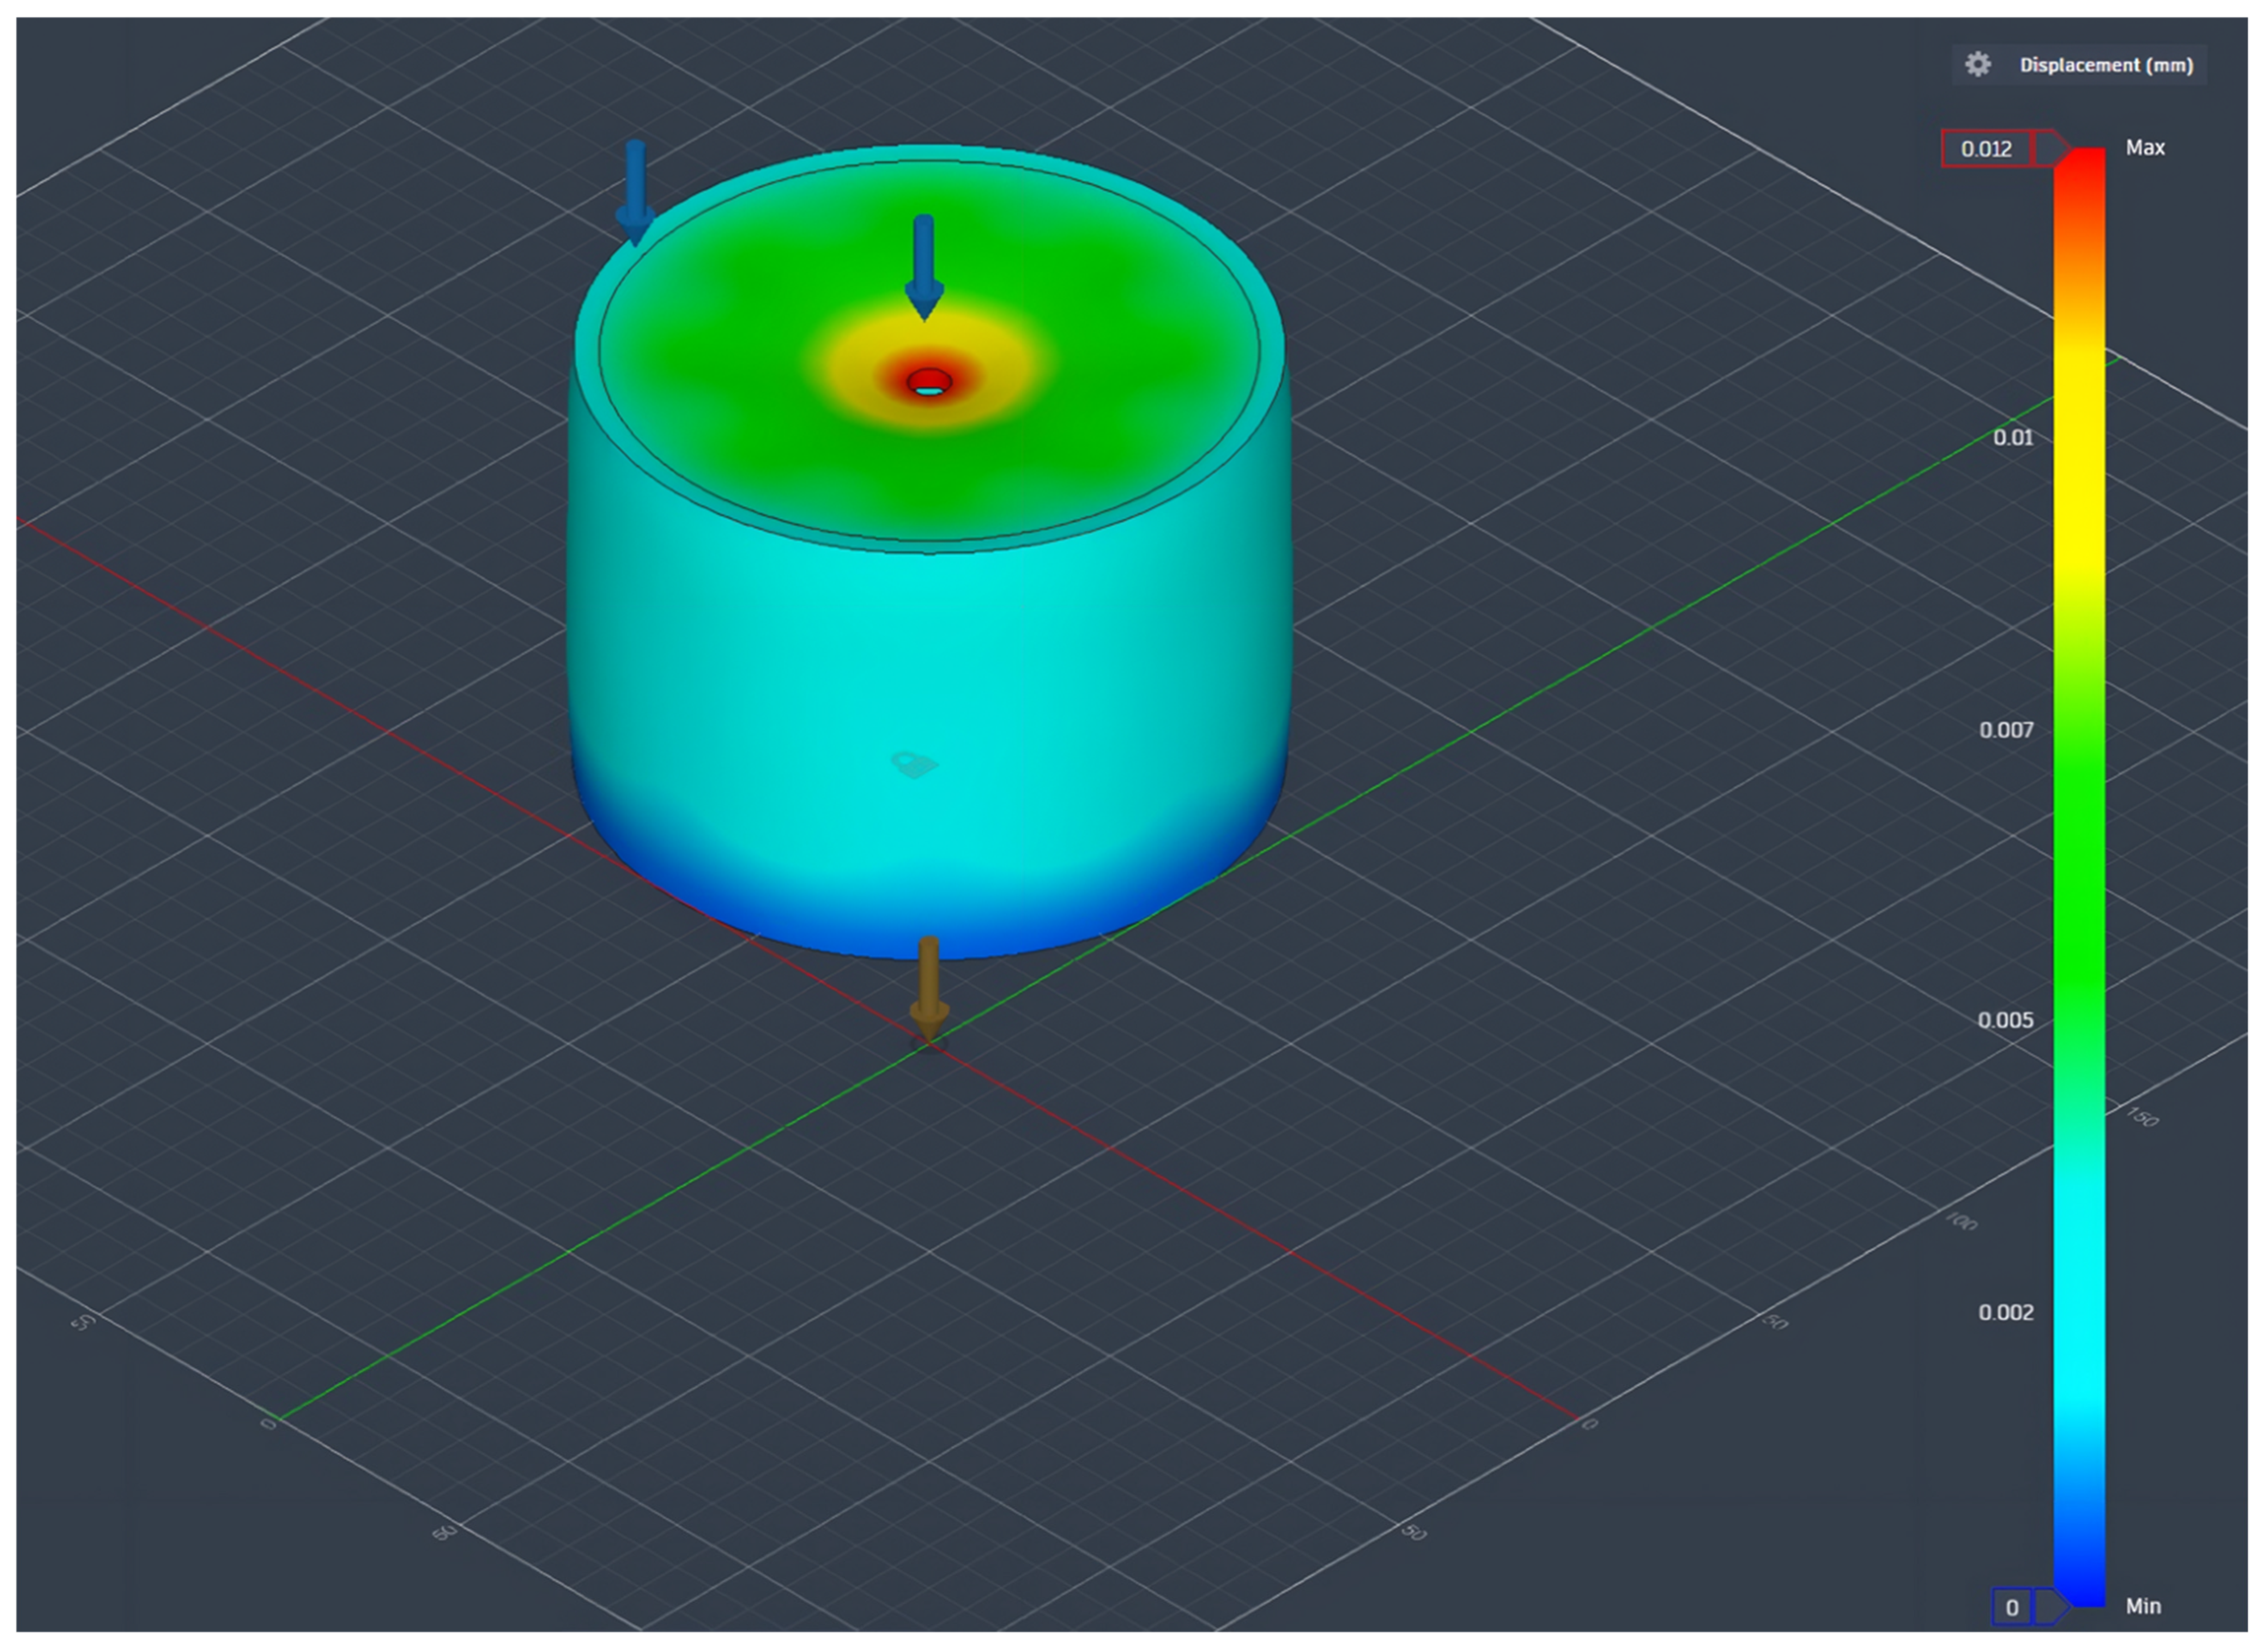
Figure 29.
Static displacement analysis for GD Outcome 2.
Figure 29.
Static displacement analysis for GD Outcome 2.
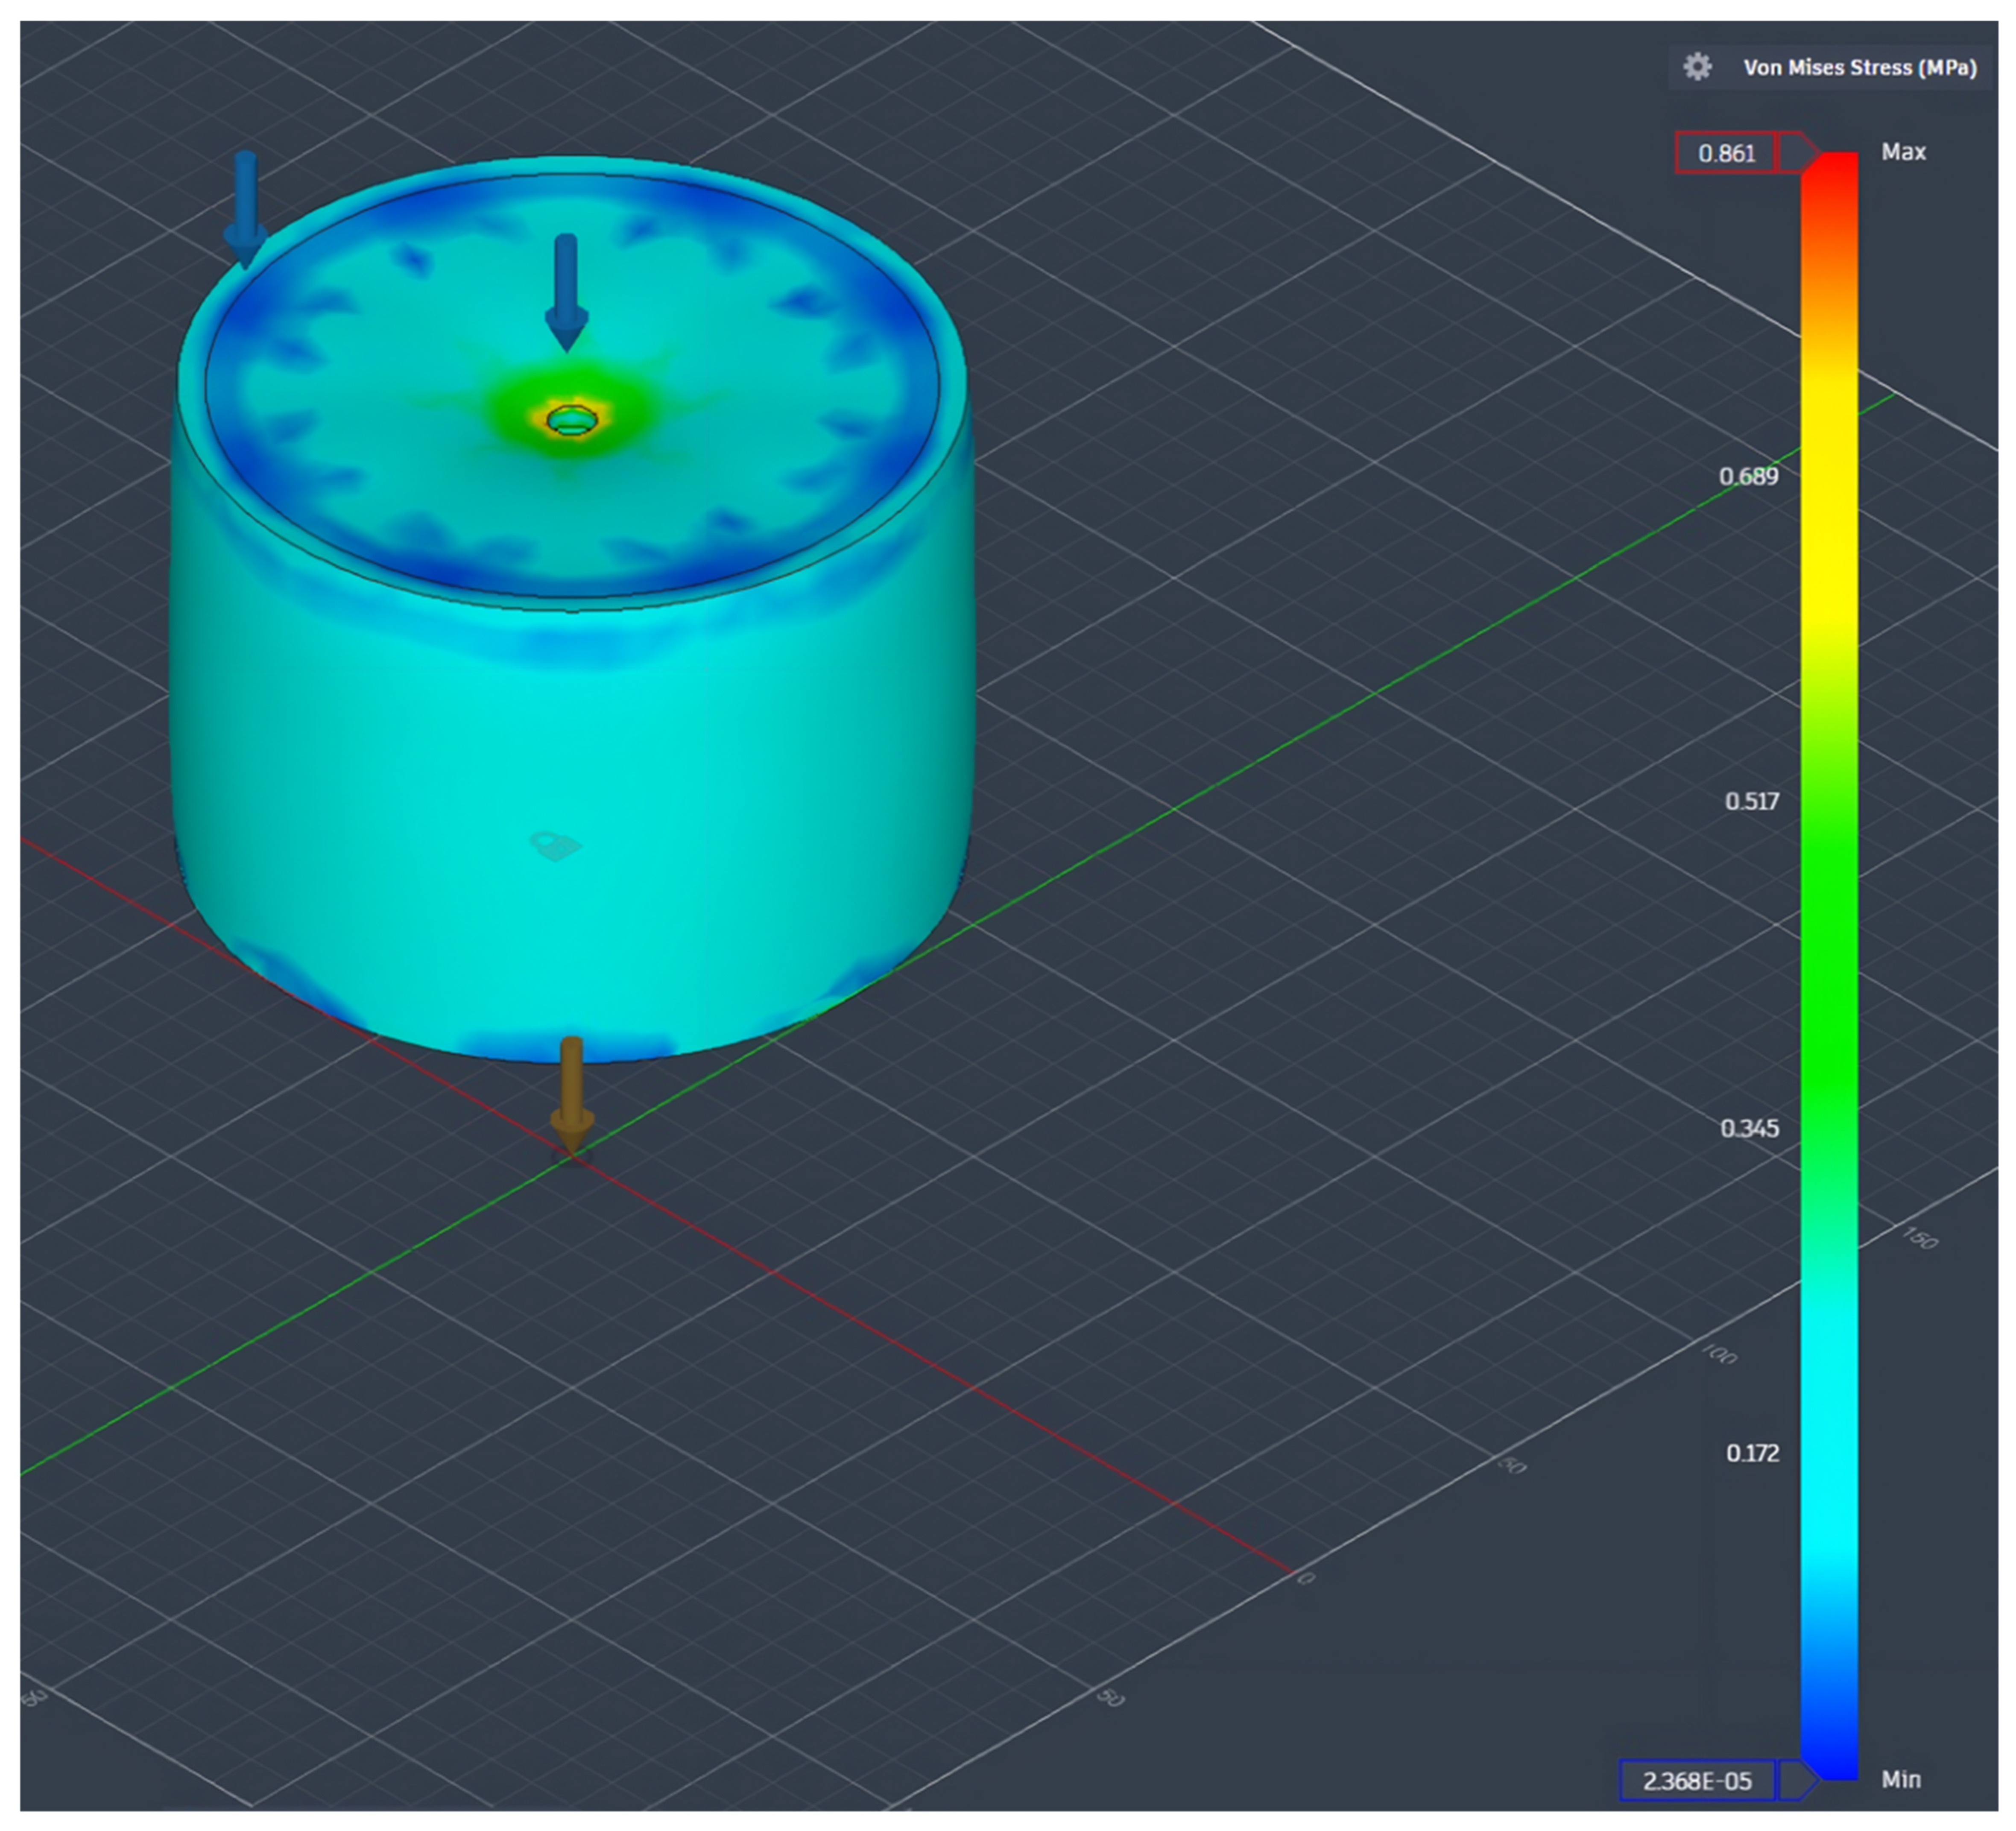
Figure 30.
Structural validation of GD Outcome 1 via static stress analysis showing Von Mises stress distribution.
Figure 30.
Structural validation of GD Outcome 1 via static stress analysis showing Von Mises stress distribution.
Figure 31.
Static displacement analysis for GD Outcome 1.
Figure 31.
Static displacement analysis for GD Outcome 1.
Table 1.
LCI and process-level environmental impacts for the baseline scenario (4 legs).
Table 1.
LCI and process-level environmental impacts for the baseline scenario (4 legs).
| Process | Energy (kWh) | CO2e (kg) | Material Waste (g) | VOC Emissions (g) |
|---|
| Initial Cutting | 0.05 | 0.01325 | 0 negligible | 0 |
| Length Reduction | 0.15 | 0.03975 | 6143 landfills | 0 |
| First Planing | 0.0292 | 0.00774 | 439 recycled | 0 |
| First Thicknessing | 0.00833 | 0.00221 | 439 recycled | 0 |
| Thicknessing—Width Calibration | 0.0167 | 0.00443 | 439 recycled | 0 |
| Secondary Cutting | 0.0333 | 0.00883 | 0 | 0 |
| Miter Sawing | 0.0417 | 0.01105 | 878 landfills | 0 |
| Gluing | 0 | 0 | 0 | 0 |
| Screwing | 0.00139 | 0.00037 | 0 | 0 |
| Second Planing | 0.0582 | 0.01542 | 236 recycled | 0 |
| Second Thicknessing | 0.0167 | 0.00443 | 236 recycled | 0 |
| Lathe Turning | 6.12 | 1.62180 | 312 landfills | 0 |
| Final Cutting | 0.0111 | 0.00294 | 5332 kept/reuse | 0 |
| Sanding | 0.00291 | 0.00077 | 196 landfills | 0 |
| Lacquering | 2 | 0.53000 | 0 | 60 |
| Total | 8.53953 | 2.26298 | 14,650 | 60 |
Table 2.
Summary of aggregated environmental impacts for the baseline scenario.
Table 2.
Summary of aggregated environmental impacts for the baseline scenario.
| Impact Category | Value | Main Sources |
|---|
| Global Warming Potential | 2.26 kg CO2e | Electricity consumption, lacquering |
| Energy Consumption | 8.54 kWh | Lathe turning, lacquering |
| Material Waste | ~14.65 kg Total cumulative loss | Sawing, turning, sanding |
| VOC Emissions | ~60 g | Lacquering (3 coats) |
| Material Use | ~20.18 kg Raw Plank/Gross Input | (230 × 78 × 1500 mm segment; ρ ≈ 0.75 g/cm3) |
Table 3.
Summary of model set-up for TO of the stool leg.
Table 3.
Summary of model set-up for TO of the stool leg.
| Feature/Element | Function & Justification |
|---|
| Single-leg simulation | Due to symmetry, reduces computational cost by 75% without loss of fidelity. |
| 334 N vertical force | 1/4 of user weight (136 kg), consistent with EN 1728 and ANSI/BIFMA X5.4. |
| No gravitational field | Omitted to isolate vertical static load; avoids redundant loading. |
| Dual-body model | Separates printable core from preserved veneer surface. |
| Outer 5 mm shell | Enables veneer adhesion and contributes to stress distribution. |
| Central hole (Ø10 mm) | Preserved for mounting/mechanical fixation. |
| Bottom surface (Flat) | Fully fixed constraint simulating ground contact. |
Table 4.
FDM Slicing and Fabrication Parameters.
Table 4.
FDM Slicing and Fabrication Parameters.
| Parameter | Value | Rationale/Source |
|---|
| Nozzle/Bed Temp | 250 °C/80 °C | Optimized for CF-PETG flow and adhesion. |
| Layer Height | 0.2 mm | Balance between resolution and structural strength. |
| Print Speed | 300 mm/s | High-speed batch production (Guider 3 Ultra). |
| Infill Density | 20% (Triangle) | Optimal load distribution with minimal mass. |
| Shell Count | 3 | Ensures surface integrity for stress distribution. |
Table 5.
Environmental impact results for the Topology-Optimized (TO) stool legs.
Table 5.
Environmental impact results for the Topology-Optimized (TO) stool legs.
| Impact Category | Value | Primary Contributors |
|---|
| Global Warming Potential | 2.8 kg CO2e | Electricity use, veneer production |
| Energy Consumption | 10.07 kWh | Printer power demand |
| Material Use | 1.76 kg total | PETG-CF10 filament, oak veneer |
| Material Waste | ~121 g | Support/brim material |
| VOC Emissions | <0.15 g | PETG-CF10 extrusion |
Table 6.
Environmental impact results for GD Outcome 1 (4 legs).
Table 6.
Environmental impact results for GD Outcome 1 (4 legs).
| Impact Category | Value | Primary Contributors |
|---|
| Global Warming Potential | ~2.23 kg CO2e (2.10 + 0.13) | Electricity use, veneer production |
| Energy Consumption | 7.93 kWh | Printer power demand |
| Material Use | 1.357 kg PETG-CF10 + 0.246 kg oak veneer | Filament, veneer application |
| Material Waste | ~108 g | Support/brim material |
| VOC Emissions | ~0.15 g | PETG-CF10 extrusion, adhesive |
Table 7.
Environmental impact results for GD Outcome 2 (4 legs).
Table 7.
Environmental impact results for GD Outcome 2 (4 legs).
| Impact Category | Value | Primary Contributors |
|---|
| Global Warming Potential | ~1.88 kg CO2e (1.75 + 0.13) | Electricity use, veneer production |
| Energy Consumption | 6.60 kWh | Printer power demand |
| Material Use | 0.933 kg PETG-CF10 + 0.246 kg oak veneer | Filament, veneer application |
| Material Waste | ~74.6 g | Support/brim material |
| VOC Emissions | ~0.15 g | PETG-CF10 extrusion, adhesive |
Table 8.
Comparative summary of total manufacturing energy consumption across all design scenarios.
Table 8.
Comparative summary of total manufacturing energy consumption across all design scenarios.
| Scenario | Energy Consumption (kWh) |
|---|
| Baseline (Solid Red Oak/CNC) | 8.54 |
| Topology Optimized (TO) | 10.07 |
| Generative Design (GD)—GD Outcome 1 | 7.93 |
| Generative Design (GD)—GD Outcome 2 | 6.60 |
Table 9.
Comparative summary of Global Warming Potential across all design scenarios.
Table 9.
Comparative summary of Global Warming Potential across all design scenarios.
| Scenario | CO2e Emissions (kg CO2e) |
|---|
| Baseline (Solid Red Oak/CNC) | 2.26 |
| Topology Optimized (TO) | 2.8 |
| Generative Design (GD)—GD Outcome 1 | 2.23 |
| Generative Design (GD)—GD Outcome 2 | 1.88 |
Table 10.
Comparative summary of total material usage across all design scenarios.
Table 10.
Comparative summary of total material usage across all design scenarios.
| Scenario | Material Use (Kg) |
|---|
| Baseline | 20.18 (Red Oak) |
| Topology Optimized (TO) | 1.76 (PETG-CF10 + Oak Veneer) |
| Generative Design (GD)—GD Outcome 1 | 1.60 (PETG-CF10 + Oak Veneer) |
| Generative Design (GD)—GD Outcome 2 | 1.18 (PETG-CF10 + Oak Veneer) |
Table 11.
Comparative summary of material waste generated per design scenario.
Table 11.
Comparative summary of material waste generated per design scenario.
| Scenario | Material Waste (g) |
|---|
| Baseline | 14,650 |
| Topology Optimized (TO) | ~121 |
| Generative Design (GD)—GD Outcome 1 | ~108 |
| Generative Design (GD)—GD Outcome 2 | ~75 |
Table 12.
Comparative summary of VOC emissions per scenario.
Table 12.
Comparative summary of VOC emissions per scenario.
| Scenario | VOC Emissions (g) |
|---|
| Baseline | ~60 |
| Topology Optimized (TO) | <0.15 |
| Generative Design (GD)—GD Outcome 1 | <0.15 |
| Generative Design (GD)—GD Outcome 2 | <0.15 |
Table 13.
Summary comparison of environmental performance across all scenarios.
Table 13.
Summary comparison of environmental performance across all scenarios.
| Impact Category | Minimum Impact Scenario | Maximum Impact Scenario |
|---|
| Energy use | Gen 2 (6.6 kWh) | TO (10.07 kWh) |
| CO2 Emissions | Gen 2 (1.88 kg CO2e) | TO (2.8 kg CO2e) |
| Material use | Gen 2 (0.933 kg + ~0.246 kg veneer) | Baseline (20.18 kg red oak) |
| Waste | Gen 2 (~75 g) | Baseline (~14.65 kg) |
| VOC emissions | Gen 1 Gen 2 (~0.15 g from adhesive) | Baseline (~60 g from lacquer and glue) |
Table 14.
Sensitivity analysis of CO2e emissions under ±20% uncertainty.
Table 14.
Sensitivity analysis of CO2e emissions under ±20% uncertainty.
| Scenario | Measured CO2e (kg) | +20% Error (Worst Case) | Ranking Robustness |
|---|
| Baseline (Wood) | 2.26 | 2.26 (Measured) | Still Higher than Gen 2 |
| TO scenario | 2.80 | 3.36 | Remains Worst Performer |
| Gen GD Outcome 1 | 2.23 | 2.68 | Sensitive to Ranking Shift |
| Gen GD Outcome 2 | 1.88 | 2.25 | Remains Best Performer |
Table 15.
Finite Element Analysis (FEA) results summary for GD Outcome 1 and 2.
Table 15.
Finite Element Analysis (FEA) results summary for GD Outcome 1 and 2.
| Parameter | GD Outcome 1 | GD Outcome | Safety Comparison |
|---|
| Max Von Mises Stress | 0.861 | 0.539 | >17× lower than min. Z-strength |
| Max Displacement | 0.012 | 0.005 | Negligible structural deflection |
| Min. Safety Factor | 58.05 | 92.76 | Exceeds furniture safety standards |
| Max Equivalent Strain | 1.801 × 10⁻⁴ | 1.150 × 10³ | Within elastic material limits |



 ,
,