


Abstract
Objectives: Local positioning systems (LPSs) used in indoor team sports generate a large number of external load variables, often exceeding practical monitoring capacity. The redundancy and overlap among these variables make it difficult to identify the most informative metrics for performance analysis and load management. This study aimed to reduce the dimensionality of external load variables derived from LPS data and to identify data-driven external-load observation profiles using principal component analysis and clustering techniques. Methods: A total of 188 observations from indoor team sports (basketball, handball, and futsal) were analyzed. Continuous external load variables were standardized and subjected to principal component analysis (PCA), with component retention based on a ≥90% cumulative explained variance threshold. K-means clustering was applied in both the full standardized feature space and the PCA-reduced space. The optimal number of clusters was determined using silhouette analysis and the elbow method. Agreement between clustering solutions was assessed using Adjusted Rand Index (ARI) and Normalized Mutual Information (NMI). Cluster characteristics were further examined using descriptive statistics and variable separation analysis. Results: The first two principal components explained 53.7% of the total variance, representing high-intensity external load and neuromuscular load dimensions, while 12 components were required to exceed 90% cumulative explained variance. Clustering analysis consistently identified three moderately separated clusters in both the full and PCA-reduced spaces. The PCA-based solution demonstrated improved separation (silhouette = 0.362) compared to the full-space solution (silhouette = 0.319). Agreement between clustering approaches was high (ARI = 0.981; NMI = 0.971), indicating that dimensionality reduction largely preserved the main clustering structure within the analyzed dataset. The most discriminative variables included jump load, acceleration load, metabolic power, and anaerobic activity distance. Conclusions: A large set of external load variables can be reduced into interpretable latent dimensions that support exploratory external-load profile identification. The combination of PCA and clustering provides an exploratory and structure-preserving framework for summarizing complex external-load datasets and identifying latent load dimensions. These findings may assist future monitoring strategies; however, the practical utility of the identified profiles requires prospective validation before implementation in training-load management.
1. Introduction
Historically, monitoring training load has been essential to designing training structures such as the annual training cycle, mesocycles, microcycles, training sessions, and drills [1,2,3,4,5,6,7,8,9]. Over the years, sports scientists have used tools such as rating of perceived exertion, heart rate indices, and work output indices [10,11,12,13,14,15,16]. The need to record and monitor training load led to the development of systems for tracking internal and external load, which, in combination with individualized capabilities, led to adaptations of the human biological system in response to training stimuli [17,18]. In recent years, high-technology systems have been developed for data recording and analysis. These systems are based on inertial measurement units (IMUs), local positioning systems (LPSs), and global positioning systems (GPSs), with the first two increasingly used as preferred methods in indoor team sports [16,19,20,21,22,23].
Load monitoring plays a dual role in sports science. On the one hand, it helps distribute work within training cycles to maximize athletic performance; on the other hand, by managing load, it aims to reduce the risk of injury [5,23,24,25,26]. Essentially, it seeks to answer how much training is sufficient to stimulate biological adaptations at a higher level of homeostasis while maintaining a low likelihood of injury. In recent years, with technological advancements, IMU and LPSs used in indoor team sports have enabled analysis of training load across the three movement axes, within intensity zones, and through quantified metrics such as total distance and training load. Compared with the recent past, when subjective measurements and internal load indices were evaluated, the number of variables that can serve as criteria for monitoring load has increased significantly.
The use of LPS and IMU systems in indoor sports after 2017, combined with advances in artificial intelligence and data analytics, has led to a substantial increase in the number of external load variables that can be monitored. Modern tracking systems can generate dozens of metrics simultaneously, capturing different aspects of movement, intensity, and mechanical load [27,28]. While this enhances the capacity to quantify performance, it also creates a practical challenge, as many of these variables are highly correlated and provide overlapping information [29]. As a result, practitioners often face an excess of data without clear guidance on which variables are most informative. Traditional approaches frequently rely on arbitrary variable selection and are limited in their ability to handle high-dimensional and interdependent data. In parallel with the expansion of tracking technologies, machine learning approaches have increasingly been applied in sports performance analysis [30].
Supervised learning methods have mainly been used for prediction tasks such as injury risk estimation, fatigue detection, match outcome prediction, and player classification. Ferraz et al. highlighted that recent research has increasingly focused on predicting performance, fatigue, and injuries using tracking-system data and combined external and internal load metrics [23]. Similarly, studies in team sports have employed supervised models to estimate perceived exertion, wellness status, and performance outcomes from GPS and LPS data [31]. Despite the growing application of predictive analytics, most supervised approaches focus on outcome prediction rather than on understanding the underlying structure and relationships among load variables [32,33]. In parallel, several studies have applied principal component analysis (PCA), clustering methods, and other unsupervised approaches to identify playing styles, tactical patterns, and latent performance structures in team sports. Recent reviews have shown that PCA is the most frequently used dimensionality-reduction technique in sports analytics and is often combined with clustering algorithms to classify teams according to playing style characteristics and tactical behaviors [34,35]. Previous applications have primarily focused on match statistics, event-based indicators, and tactical-performance variables, particularly in soccer, with substantially less attention given to external-load data derived from athlete-tracking technologies [34,35]. Furthermore, methodological heterogeneity in feature selection, preprocessing procedures, and reporting practices has limited the comparability and generalizability of findings across studies [34,35]. Consequently, less attention has been given to dimensionality reduction and the identification of latent performance constructs through unsupervised and exploratory approaches such as principal component analysis and clustering applied specifically to high-dimensional LPS-derived external-load datasets in indoor team sports. In this context, data-driven methods such as principal component analysis and clustering offer a systematic way to reduce dimensionality, identify underlying performance structures, and support exploratory external-load profile identification [34,35].
In recent years, in indoor sports, many studies have monitored variables such as accelerations, decelerations, training load based on these two, and distance covered in intensity zones. The two major categories of variables are those related to participation time and expressing the intensity of athletic activity, and those expressing an overall load, calculated as cumulative load [16,20,22,23]. Thus, the question arises as to whether it is useful to monitor all load indicators and how sports scientists should use them. In the literature to date, sports scientists, based on theoretical backgrounds, arbitrarily select monitoring variables. However, the relationships among the variables have not yet been investigated. Examining the relationships between variables and grouping them may reduce the number of parameters to monitor, making data monitoring and interpretation easier, supporting exploratory grouping of external-load observations, and, by extension, a better training structure.
The research hypothesis of the study was that the high-dimensional external-load variables provided by an indoor local positioning system contain redundant and interrelated information that can be summarized into a smaller number of latent dimensions. Accordingly, this study aimed to reduce the dimensionality of external training-load data obtained from a local positioning system in indoor team sports by combining correlation analysis, principal component analysis, and clustering methods. Specifically, the study sought to (i) identify core latent external-load dimensions and (ii) explore whether observation-level external-load profiles could be identified to support more interpretable monitoring and future hypothesis generation. Importantly, the purpose of the present study was not to develop athlete-classification models or training-prescription systems, but rather to explore the latent structure of LPS-derived external-load variables and generate interpretable hypotheses for future research.
2. Materials and Methods
2.1. Experimental Design
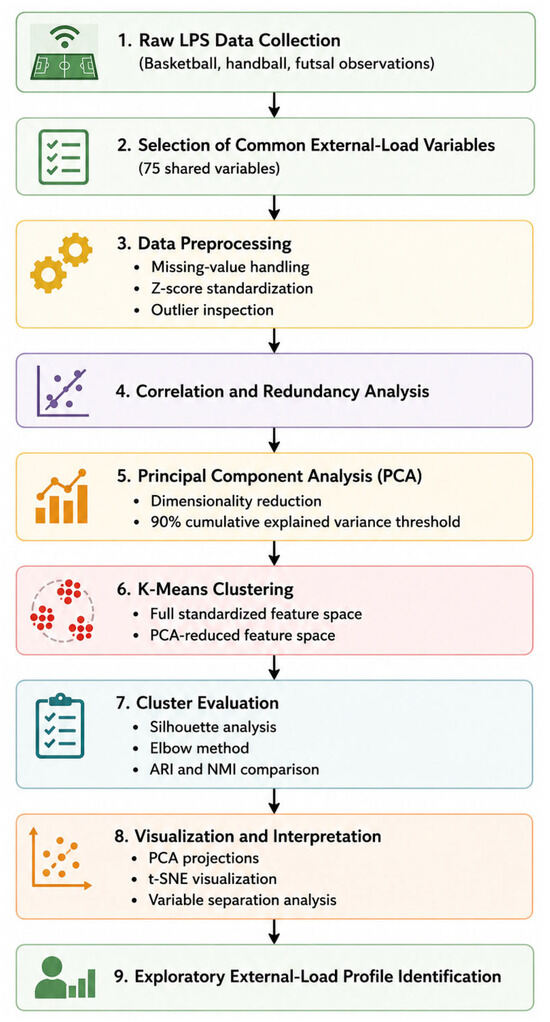
The central methodological aim was to determine whether the large set of variables provided by the LPS could be reduced into a smaller number of interpretable external-load dimensions. Therefore, the analysis did not use a predefined target variable or supervised classification outcome. Instead, the study applied an unsupervised analytical framework designed to identify latent relationships among variables, reduce redundancy, and identify exploratory observation-level external-load profiles (Figure 1).
Figure 1.
Schematic overview of the analytical workflow used in the present study. The pipeline included LPS data collection, preprocessing and standardization of external-load variables, dimensionality reduction using principal component analysis, clustering in both full and PCA-reduced spaces, cluster evaluation, and exploratory external-load profile interpretation.
This approach was selected because practitioners are often required to interpret numerous overlapping external-load indicators, many of which may reflect similar physiological or mechanical demands. Therefore, the present study adopted an observational, data-driven design to investigate the underlying structure of external-load variables derived from a local positioning system (LPS) in indoor team sports. External-load data were collected under match-play conditions from basketball, futsal, and handball athletes. Specifically, two matches were conducted for each sport, resulting in a total of six analyzed matches. The participating teams were local competitive teams from the wider university region, and all participants were active athletes regularly engaged in organized training and competition. In total, 188 player observations were recorded. Data collection took place during the competitive period of each sport, specifically during weeks without additional match obligations, while athletes maintained their regular training schedules. This approach was adopted to ensure that the recorded external-load responses reflected representative match-play demands while minimizing the potential influence of fixture congestion or accumulated competitive fatigue.
Inclusion criteria were active participation in organized basketball, handball, or futsal; absence of injury at the time of data collection; and full participation in the monitored match-play conditions. Observations with incomplete, corrupted, or technically invalid tracking data were excluded. The study was approved by the Institutional Ethics Committee of the Department of Physical Education and Sport Science, Democritus University of Thrace (Protocol No: DUTH/EHDE/38826/966; approval date: 31 January 2025), and all participants provided written informed consent before participation.
All games were performed under official or official-like competitive conditions according to the standard rules of each sport. Although movement demands naturally differed between basketball, handball, and futsal, all observations represented intermittent indoor team-sport activity characterized by repeated accelerations, decelerations, changes in direction, and high-intensity actions.
2.2. Local Positioning System Data Collection
External load was monitored using a Local Positioning System (Kinexon GMBH, Munich, Germany) suitable for indoor team-sport environments. The system consists of 18 antennas mounted on the ceiling of the University Indoor Sports Facility, a central computer unit that functions as the main hub for communication between the antennas and the transmitters, and for data storage and processing. The system is based on Ultra-Wideband radio signal technology and achieves positional accuracy of <10 cm. The data frequency is 20 Hz. During the measurements, the researchers monitored the data in real time, which allowed them to prevent potential data loss due to technical issues. The athletes wore sensors which, for handball and futsal, were placed in a special vest between the shoulder blades, while for basketball players they were attached with a special clip at hip level, close to the athletes’ center of mass. The Kinexon sensor, in addition to communicating with the 18 antennas, contains an accelerometer (100 Hz), magnetometer, and gyroscope (200 Hz), enabling it to record movements along the three axes of motion. LPS and inertial-based technologies allow practitioners to quantify external load in sports with multidirectional, intermittent, and highly variable movement patterns. In the present analysis, the resulting dataset contained about 200 variables. However, because the study included games from three different sports, data were recorded and analyzed only for the 76 common variables.
2.3. Dataset
The final dataset comprised 188 observations from indoor team-sport athletes. Each observation represented an external load profile derived from LPS monitoring during match or match-like conditions. The dataset included athletes from basketball, handball, and futsal, enabling the analysis to capture a broad range of movement patterns in indoor sports. Because the objective of the study was exploratory dimensionality reduction rather than predictive modeling, observations from all sports were pooled into a common analytical framework. This approach was selected to maximize variability in external-load responses and to investigate whether common latent structures could emerge across indoor team-sport environments.
Only continuous external load variables were included in the principal component and clustering analyses. Variables containing only missing values were excluded, while missing values in the retained continuous variables were replaced using the median of the corresponding variable. This preprocessing step was used to preserve the sample size while minimizing the influence of extreme values. All continuous variables were then standardized before analysis to ensure that variables measured on different scales contributed equally to the multivariate procedures.
2.4. Statistical Analysis
All analyses were performed using Python 3.11. The statistical workflow was developed as a reproducible unsupervised machine-learning pipeline. First, the dataset was imported and cleaned. Empty fields were converted into missing values, and each variable was inspected to determine whether it should be treated as continuous or categorical. Continuous variables were retained for dimensionality reduction and clustering because the main objective was to investigate the structure of quantitative external load indicators.
Before multivariate analysis, all continuous variables were standardized using z-score normalization. Standardization was necessary because the dataset contained variables expressed in different units, such as meters, minutes, counts, watts, kilocalories, and arbitrary load units. Without scaling, variables with larger numerical ranges would have dominated the PCA and clustering solutions. Continuous variables were also inspected for extreme values after standardization. Observations were not removed solely because of statistical extremeness unless they reflected clear recording errors or corrupted tracking data, in order to preserve the natural variability of match-play demands.
Principal component analysis was then applied to the standardized dataset. PCA was used to identify latent dimensions underlying the original external load variables and to reduce redundancy among highly related metrics. All principal components were initially computed, and the cumulative explained variance was examined. The number of retained components was determined dynamically using a 90% cumulative explained variance threshold. This threshold was selected to ensure that the PCA-reduced representation retained most of the information contained in the original dataset while still achieving meaningful dimensionality reduction. As a result, the clustering analysis was performed on a reduced feature space that preserved the dominant variance structure of the original variables.
The correlation structure of the variables was inspected before PCA to confirm substantial inter-variable redundancy and multicollinearity, supporting the suitability of dimensionality-reduction analysis. The mean absolute inter-variable correlation was 0.351, while 166 variable pairs demonstrated strong correlations (|r| > 0.80). PCA suitability was additionally assessed using the Kaiser–Meyer–Olkin (KMO) measure and Bartlett’s test of sphericity. The overall KMO value was 0.831, indicating good sampling adequacy, while Bartlett’s test was significant (χ2 = 77,588.18, p < 0.001), confirming that the correlation matrix differed significantly from an identity matrix and supporting the suitability of the dataset for PCA.
The interpretation of each principal component was based on variable loadings. For each component, the variables with the highest absolute loadings were examined and used to assign a practical meaning to the new latent dimension. This step was essential because PCA generates mathematical components that require physiological and sport-specific interpretation. Components were therefore labeled according to the dominant type of external load represented by their strongest contributing variables.
K-means clustering was subsequently applied using two parallel approaches. First, clustering was performed in the full standardized feature space. Second, clustering was repeated in the PCA-reduced space using the retained principal components. This dual approach allowed comparison between the original high-dimensional variable structure and the reduced-dimensional representation. For both approaches, the number of clusters was evaluated across k values from 2 to 10. Cluster quality was assessed using inertia and the silhouette score. Inertia was used to examine within-cluster compactness through the elbow method, whereas the silhouette score was used to quantify the balance between within-cluster cohesion and between-cluster separation.
The optimal number of clusters was selected as the k value that maximized the silhouette score. After final clustering, the agreement between the full-space and PCA-space solutions was quantified using the Adjusted Rand Index and Normalized Mutual Information. These indices were used to determine whether dimensionality reduction preserved the underlying clustering structure. A high agreement between the two solutions would indicate that PCA reduced the number of variables without materially altering the main pattern of external-load profiles. K-means clustering was selected because the aim was to identify compact centroid-based groupings in a continuous standardized feature space and to allow direct comparison between clustering in the original and PCA-reduced spaces. However, because K-means assumes approximately spherical clusters and may be sensitive to initialization and outliers, the resulting profiles were interpreted as exploratory rather than definitive classifications. To improve reproducibility, clustering was performed using fixed random-state initialization, and sensitivity checks across multiple random seeds were used to examine cluster stability.
To support interpretation, cluster sizes, descriptive statistics, and variable separation scores were calculated. Variable separation was assessed using the mean absolute deviation of each cluster mean from the global mean. This analysis identified the variables that contributed most strongly to differences between clusters. In addition, t-SNE was used as a nonlinear dimensionality reduction method to project observations onto two dimensions and visually explore the spatial organization of the observations and clustering structure.
2.4.1. PCA Interpretation Strategy
The PCA results were interpreted by examining the signed and absolute loadings of the original variables on each retained component. The first principal component was interpreted as a high-intensity external load dimension because it was mainly defined by anaerobic activity distance, high-speed distance and time, very-high acceleration load, sprints, accelerations, and exertions. The second component reflected a contrast between medium acceleration load and low-speed volume on one side, and deceleration and jump-load variables on the other. This component was therefore interpreted as a neuromuscular load versus a low-intensity volume dimension.
The third principal component primarily represented overall exposure and workload volume, as it was characterized by time on the playing field, total distance, low-speed distance and time, metabolic work, and low-intensity acceleration-load variables. The fourth component represented maximal speed and sprint-related performance, with high loadings for very-high sprints, high accelerations, very-high and extreme speed distance, and high-speed activity. The fifth component reflected a metabolic-mechanical contrast, with opposing contributions from maximal metabolic power, jump-related variables, and high acceleration-load variables.
This interpretation enabled the PCA solution to be translated into interpretable external-load dimensions rather than being treated solely as a mathematical reduction procedure. In this way, the study identified not only fewer variables but also broader external load constructs that may be easier for practitioners to monitor and interpret.
2.4.2. Cluster Interpretation Strategy
Clusters were interpreted by combining three sources of information: their positions in the PCA space, the variables with the highest separation scores, and their consistency across the full-space and PCA-reduced clustering solutions. This integrated approach was used to avoid interpreting clusters based on a single statistical output. Instead, each cluster was interpreted as an exploratory external-load profile emerging from multiple complementary analyses.
The PCA plots were used to determine whether clusters were separated mainly along PC1, PC2, or both. The variable separation analysis was then used to identify which original external load metrics differed most between groups. Finally, the agreement between the full-space and PCA-space solutions was examined to determine whether the identified profiles were stable after dimensionality reduction. Together, these analyses provided a complete explanation of how the reduced PCA dimensions, original external load variables, and final external-load profiles were connected.
3. Results
3.1. PCA and Dimensional Structure of the Data
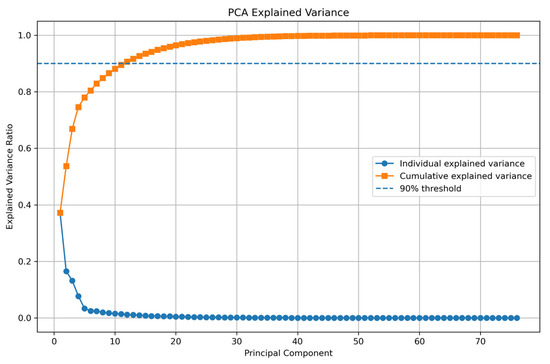
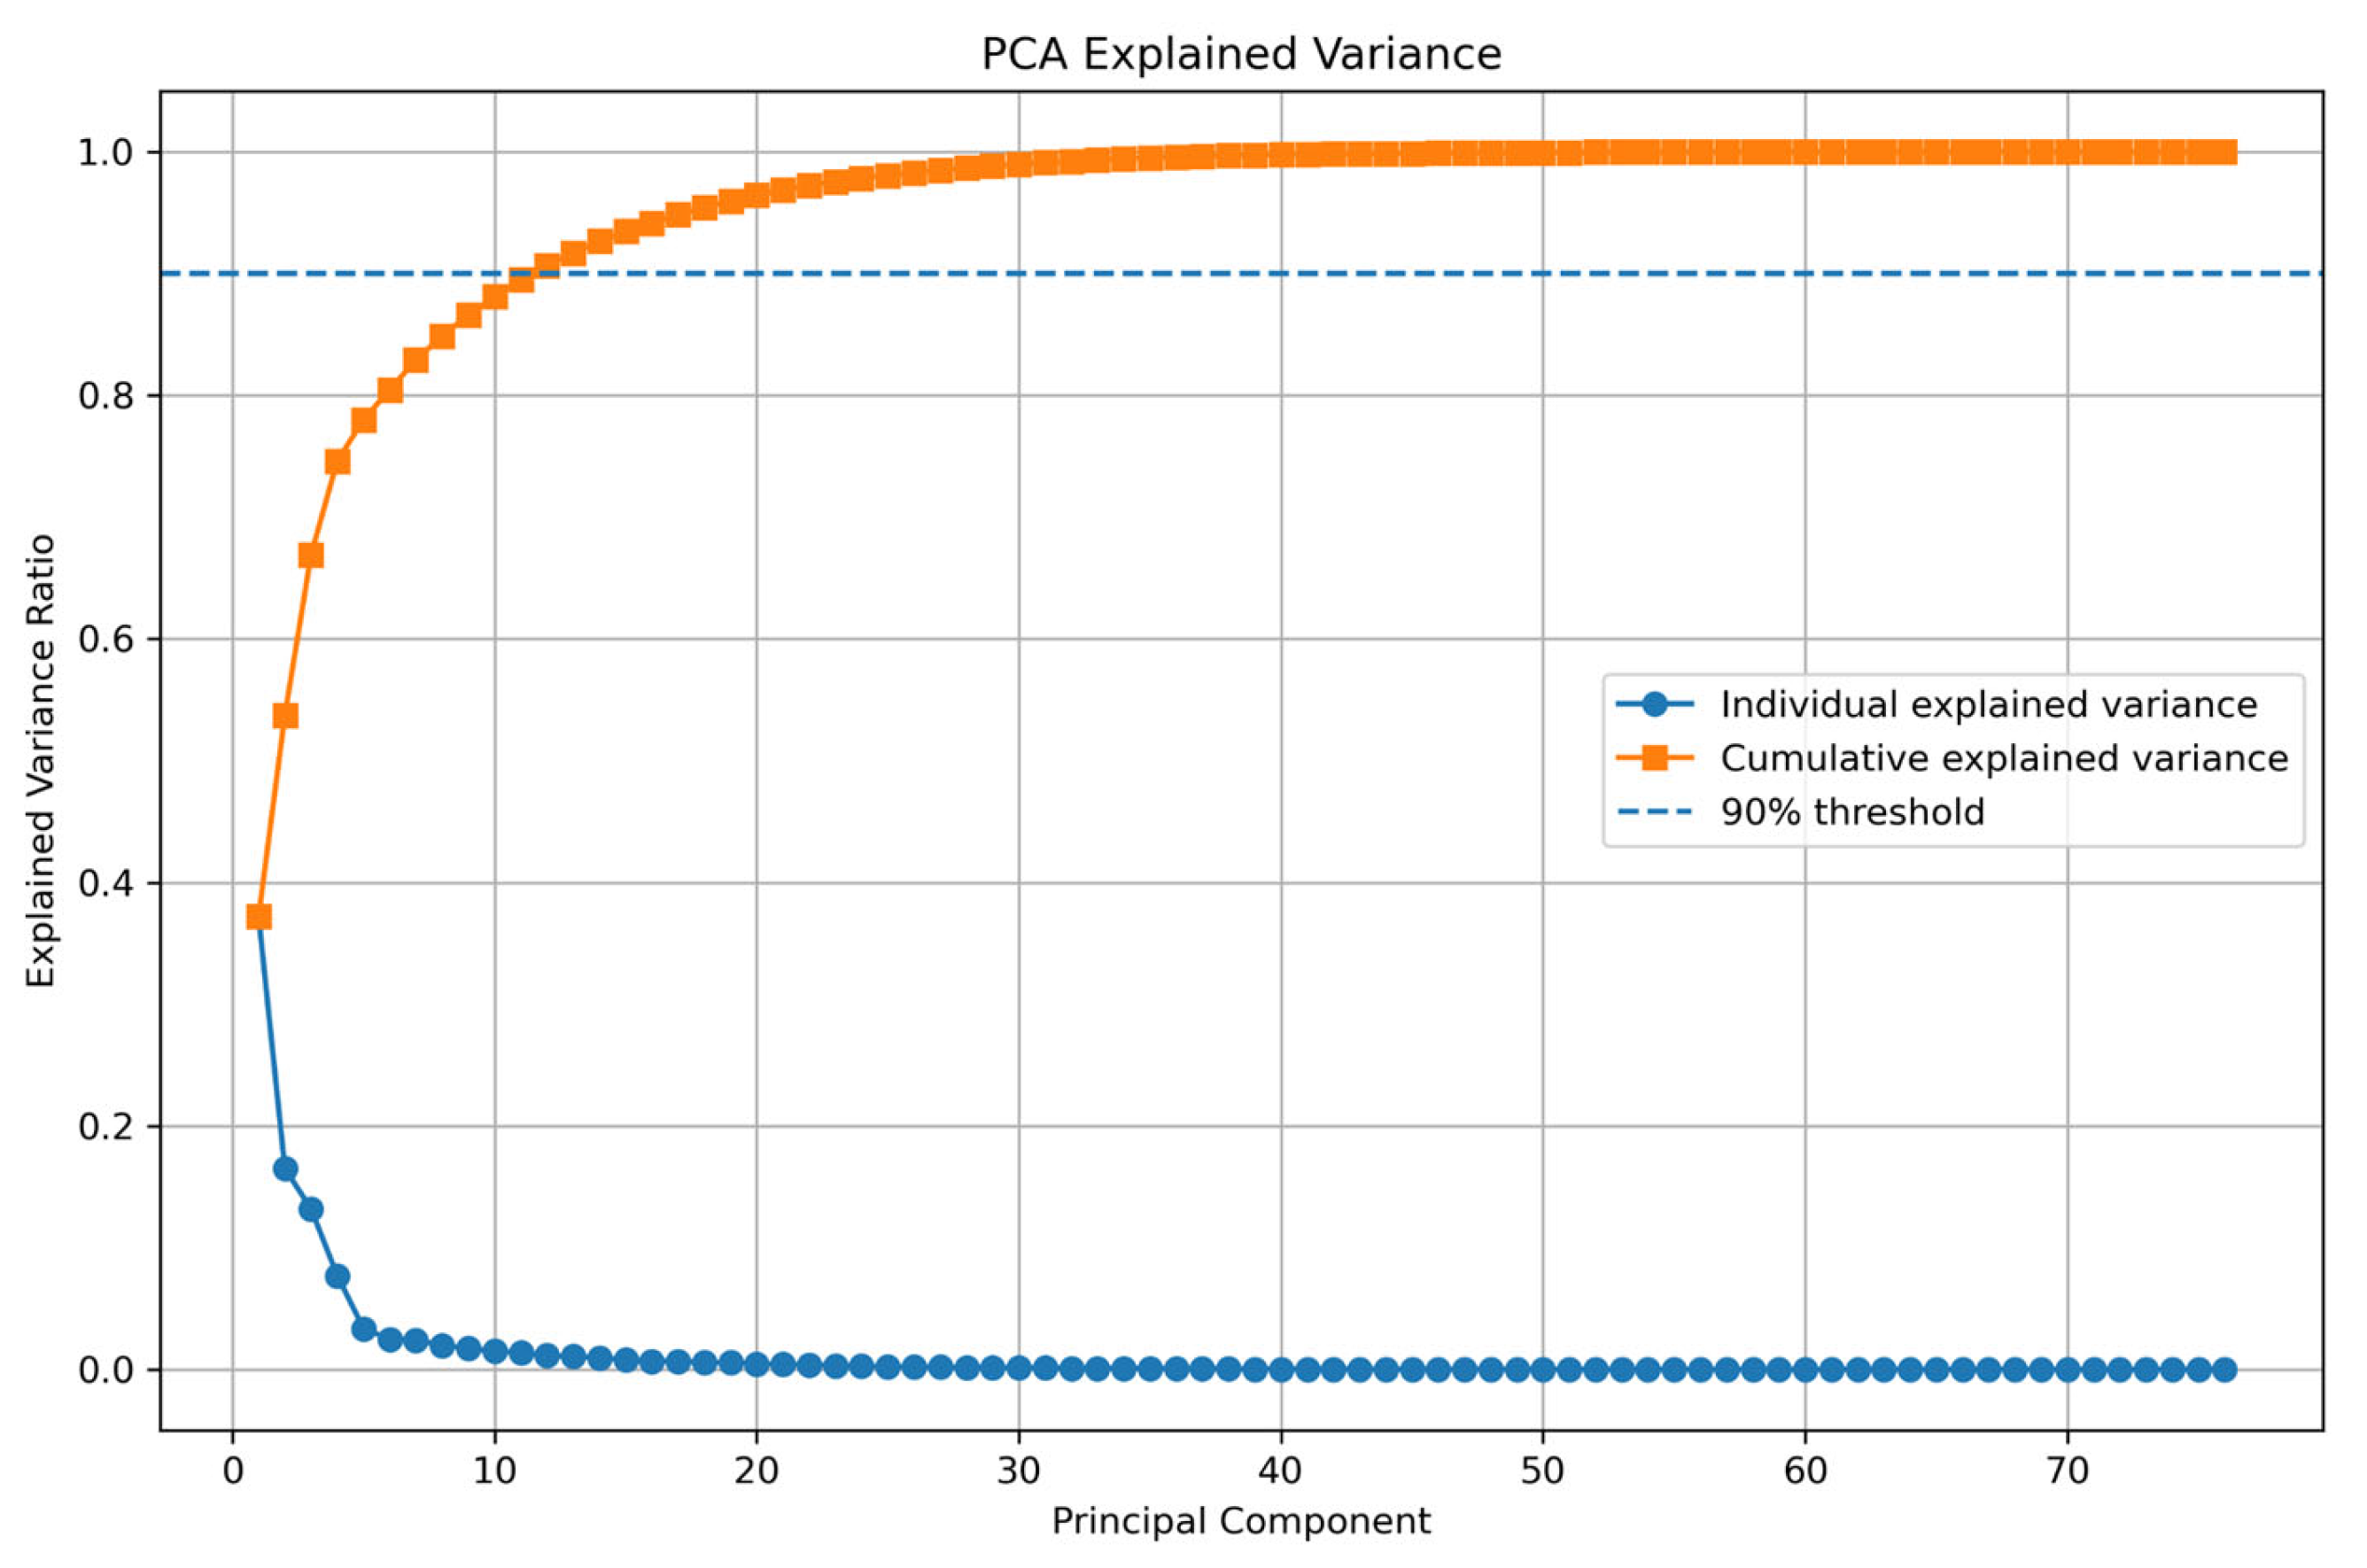
Principal component analysis revealed that the first principal component (PC1) explained 37.2% of the total variance, while the second component (PC2) accounted for 16.5%. Together, the first two components explained 53.7% of the total variance, whereas the first three components explained 66.9%. To reach the predefined threshold of 90% cumulative explained variance, 12 principal components were required, accounting for 90.6% of the variance (Table 1). These findings indicate that, despite the large number of original variables, a substantial proportion of the variance structure in the dataset is captured by a relatively small number of latent dimensions (Figure 2).
Table 1.
Explained variance for the first 12 principal components.
Figure 2.
PCA explained variance and cumulative explained variance.
To further interpret the latent structure of the data, the loadings of the original variables on each principal component were examined (Appendix A). Because the first five principal components accounted for approximately 78.0% of the total variance and provided the clearest practical interpretation, these components were summarized in Table 2.
Table 2.
Top loadings and interpretation of principal components.
Although 12 principal components were retained to satisfy the predefined ≥90% cumulative explained variance threshold, the interpretation focused primarily on the first five components. These first five components accounted for approximately 78.0% of the total variance and represented the most interpretable and practically meaningful dimensions of the dataset. In contrast, components 6–12 each contributed only a small additional proportion of variance, ranging approximately from 1.1% to 2.5%, and were retained mainly to preserve the overall structure of the data for PCA-based clustering. Therefore, the first five components were used for substantive interpretation, whereas all 12 retained components were used in the reduced-space clustering analysis to ensure that the dimensionality-reduced representation preserved at least 90% of the original information.
3.2. Cluster Visualization in PCA Space
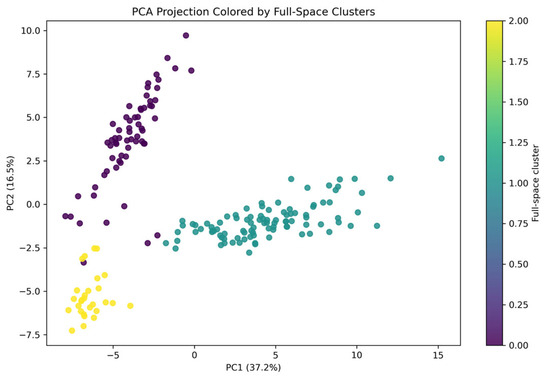
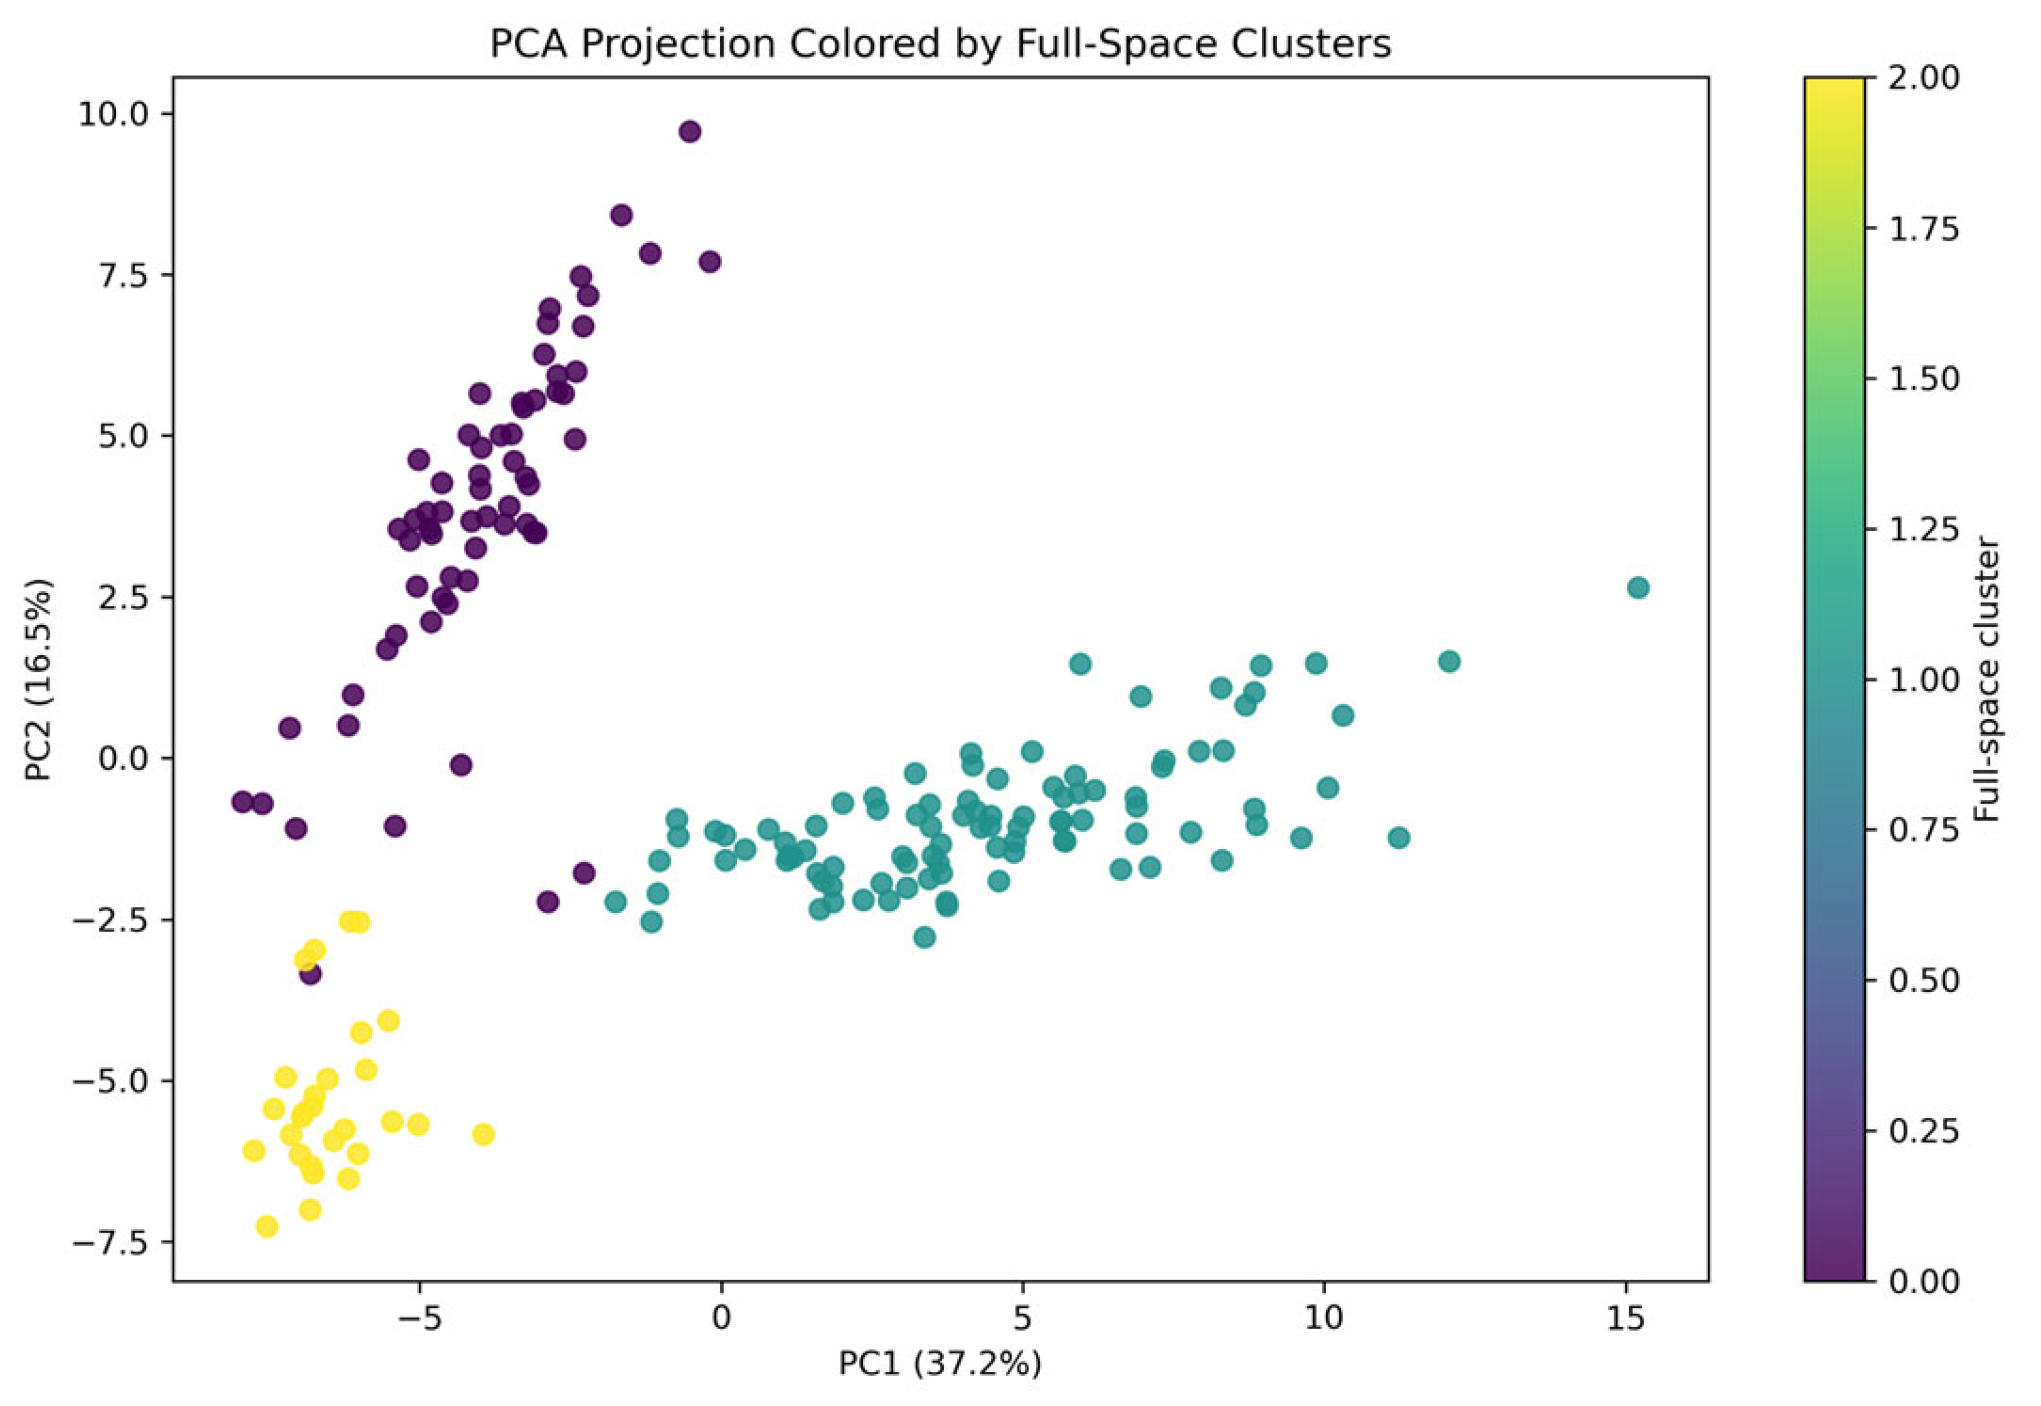
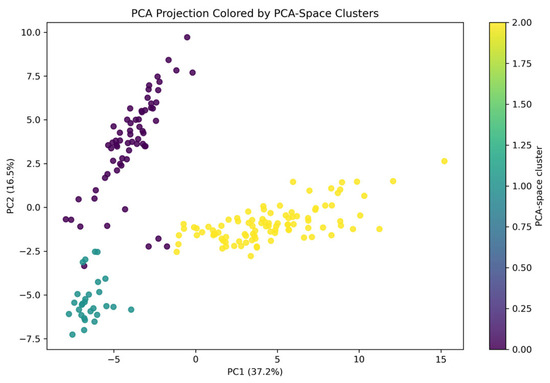
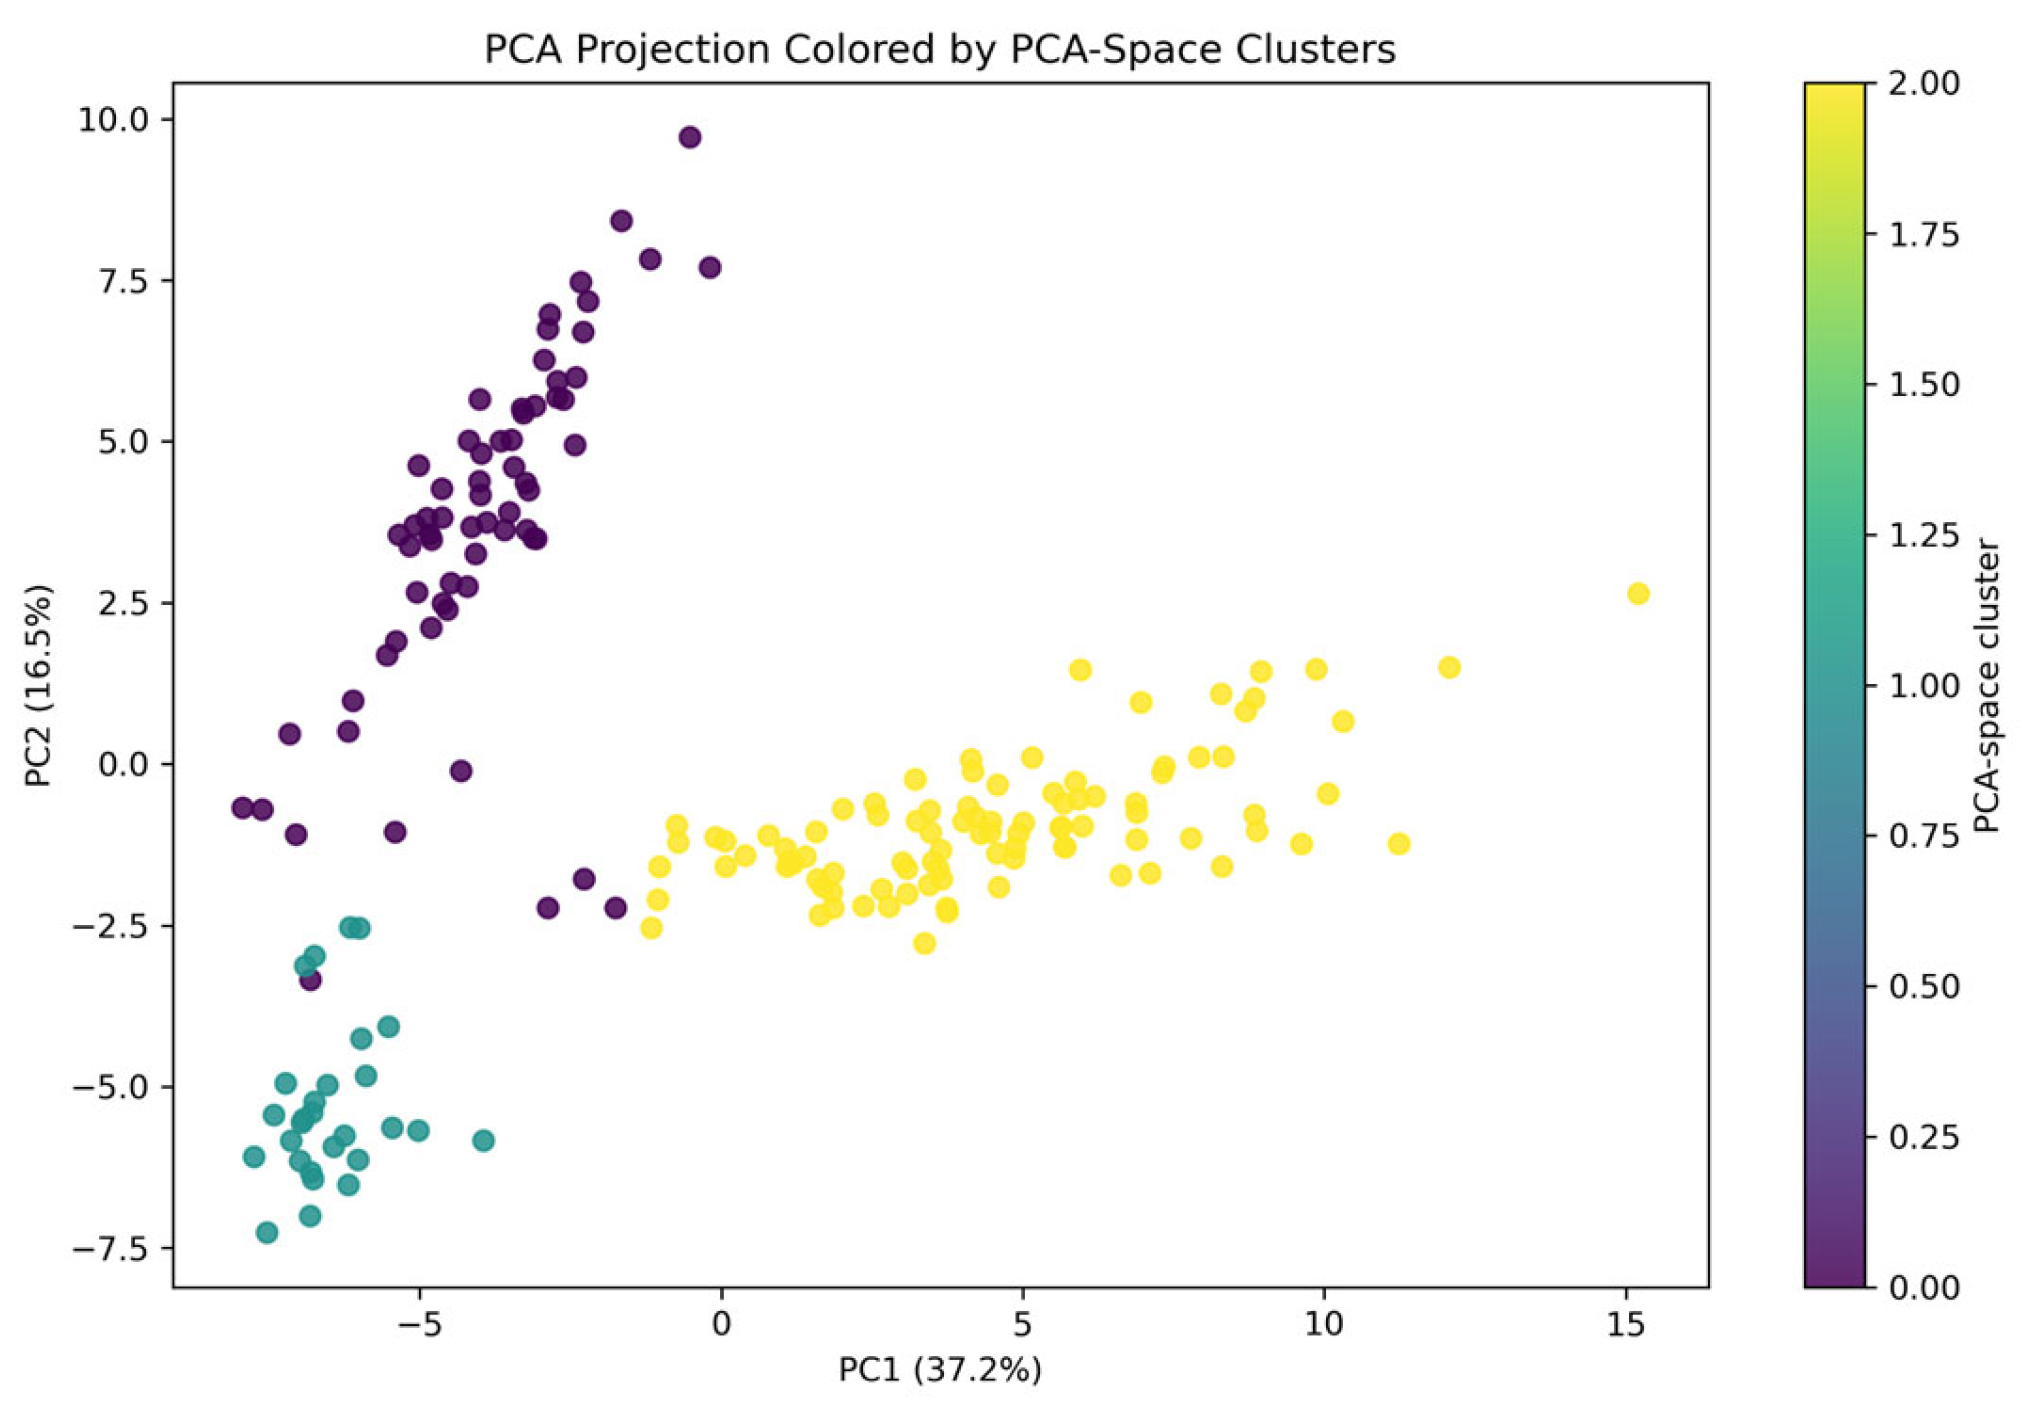
Projection of the observations onto the first two principal components revealed a visually apparent but moderately separated three-cluster pattern (Figure 3 and Figure 4). One cluster was primarily located along positive values of PC1, whereas the remaining two clusters were positioned at more negative values of PC1 and were mainly differentiated along PC2. This geometric configuration suggests that PC1 represents a dominant axis of variation, likely associated with overall load or intensity, while PC2 contributes to the differentiation of sub-profiles within lower-intensity observations.
Figure 3.
Projection of observations onto the first two principal components (PC1 and PC2), colored according to clustering performed in the full standardized feature space. PC1 primarily reflects high-intensity external load characteristics, whereas PC2 is mainly associated with neuromuscular and low-intensity volume dimensions. The visualization illustrates the moderate separation of the three exploratory external-load profiles.
Figure 4.
Projection of observations onto the first two principal components (PC1 and PC2), colored according to clustering performed in the PCA-reduced feature space. The PCA-space clustering solution demonstrated a similar grouping structure to the full-space clustering solution, supporting the preservation of the main clustering structure after dimensionality reduction.
3.3. Clustering Results and Model Comparison
The PCA adequacy diagnostics supported the suitability of the dataset for dimensionality reduction, with a KMO value of 0.831 and a significant Bartlett’s test of sphericity (p < 0.001).
The analysis of 188 observations indicated that the optimal clustering solution comprised three clusters in both the full standardized feature space and the PCA-reduced space.
PCA-reduced solution showed moderately improved separation, with a higher silhouette score (0.362) than the full-space solution (0.319). These values indicate moderate rather than strong cluster separation, which is expected in biological and sports-performance datasets where movement demands often vary along continuous rather than sharply discrete patterns.
Agreement between the two clustering solutions was high, with an Adjusted Rand Index (ARI) of 0.981 and a Normalized Mutual Information (NMI) of 0.971. These findings suggest that dimensionality reduction preserved the main clustering structure within the present dataset. (Table 3 and Table 4).
Table 3.
Summary of clustering and PCA metrics.
Table 4.
K selection metrics across full and PCA spaces.
3.4. Selection of the Number of Clusters
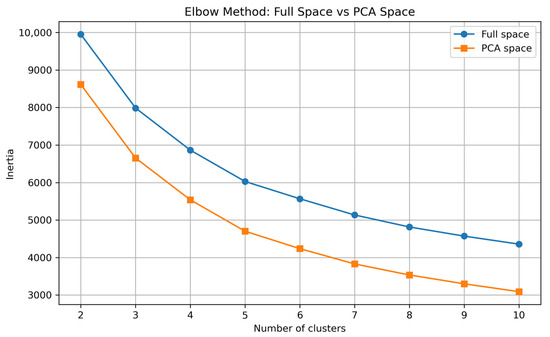
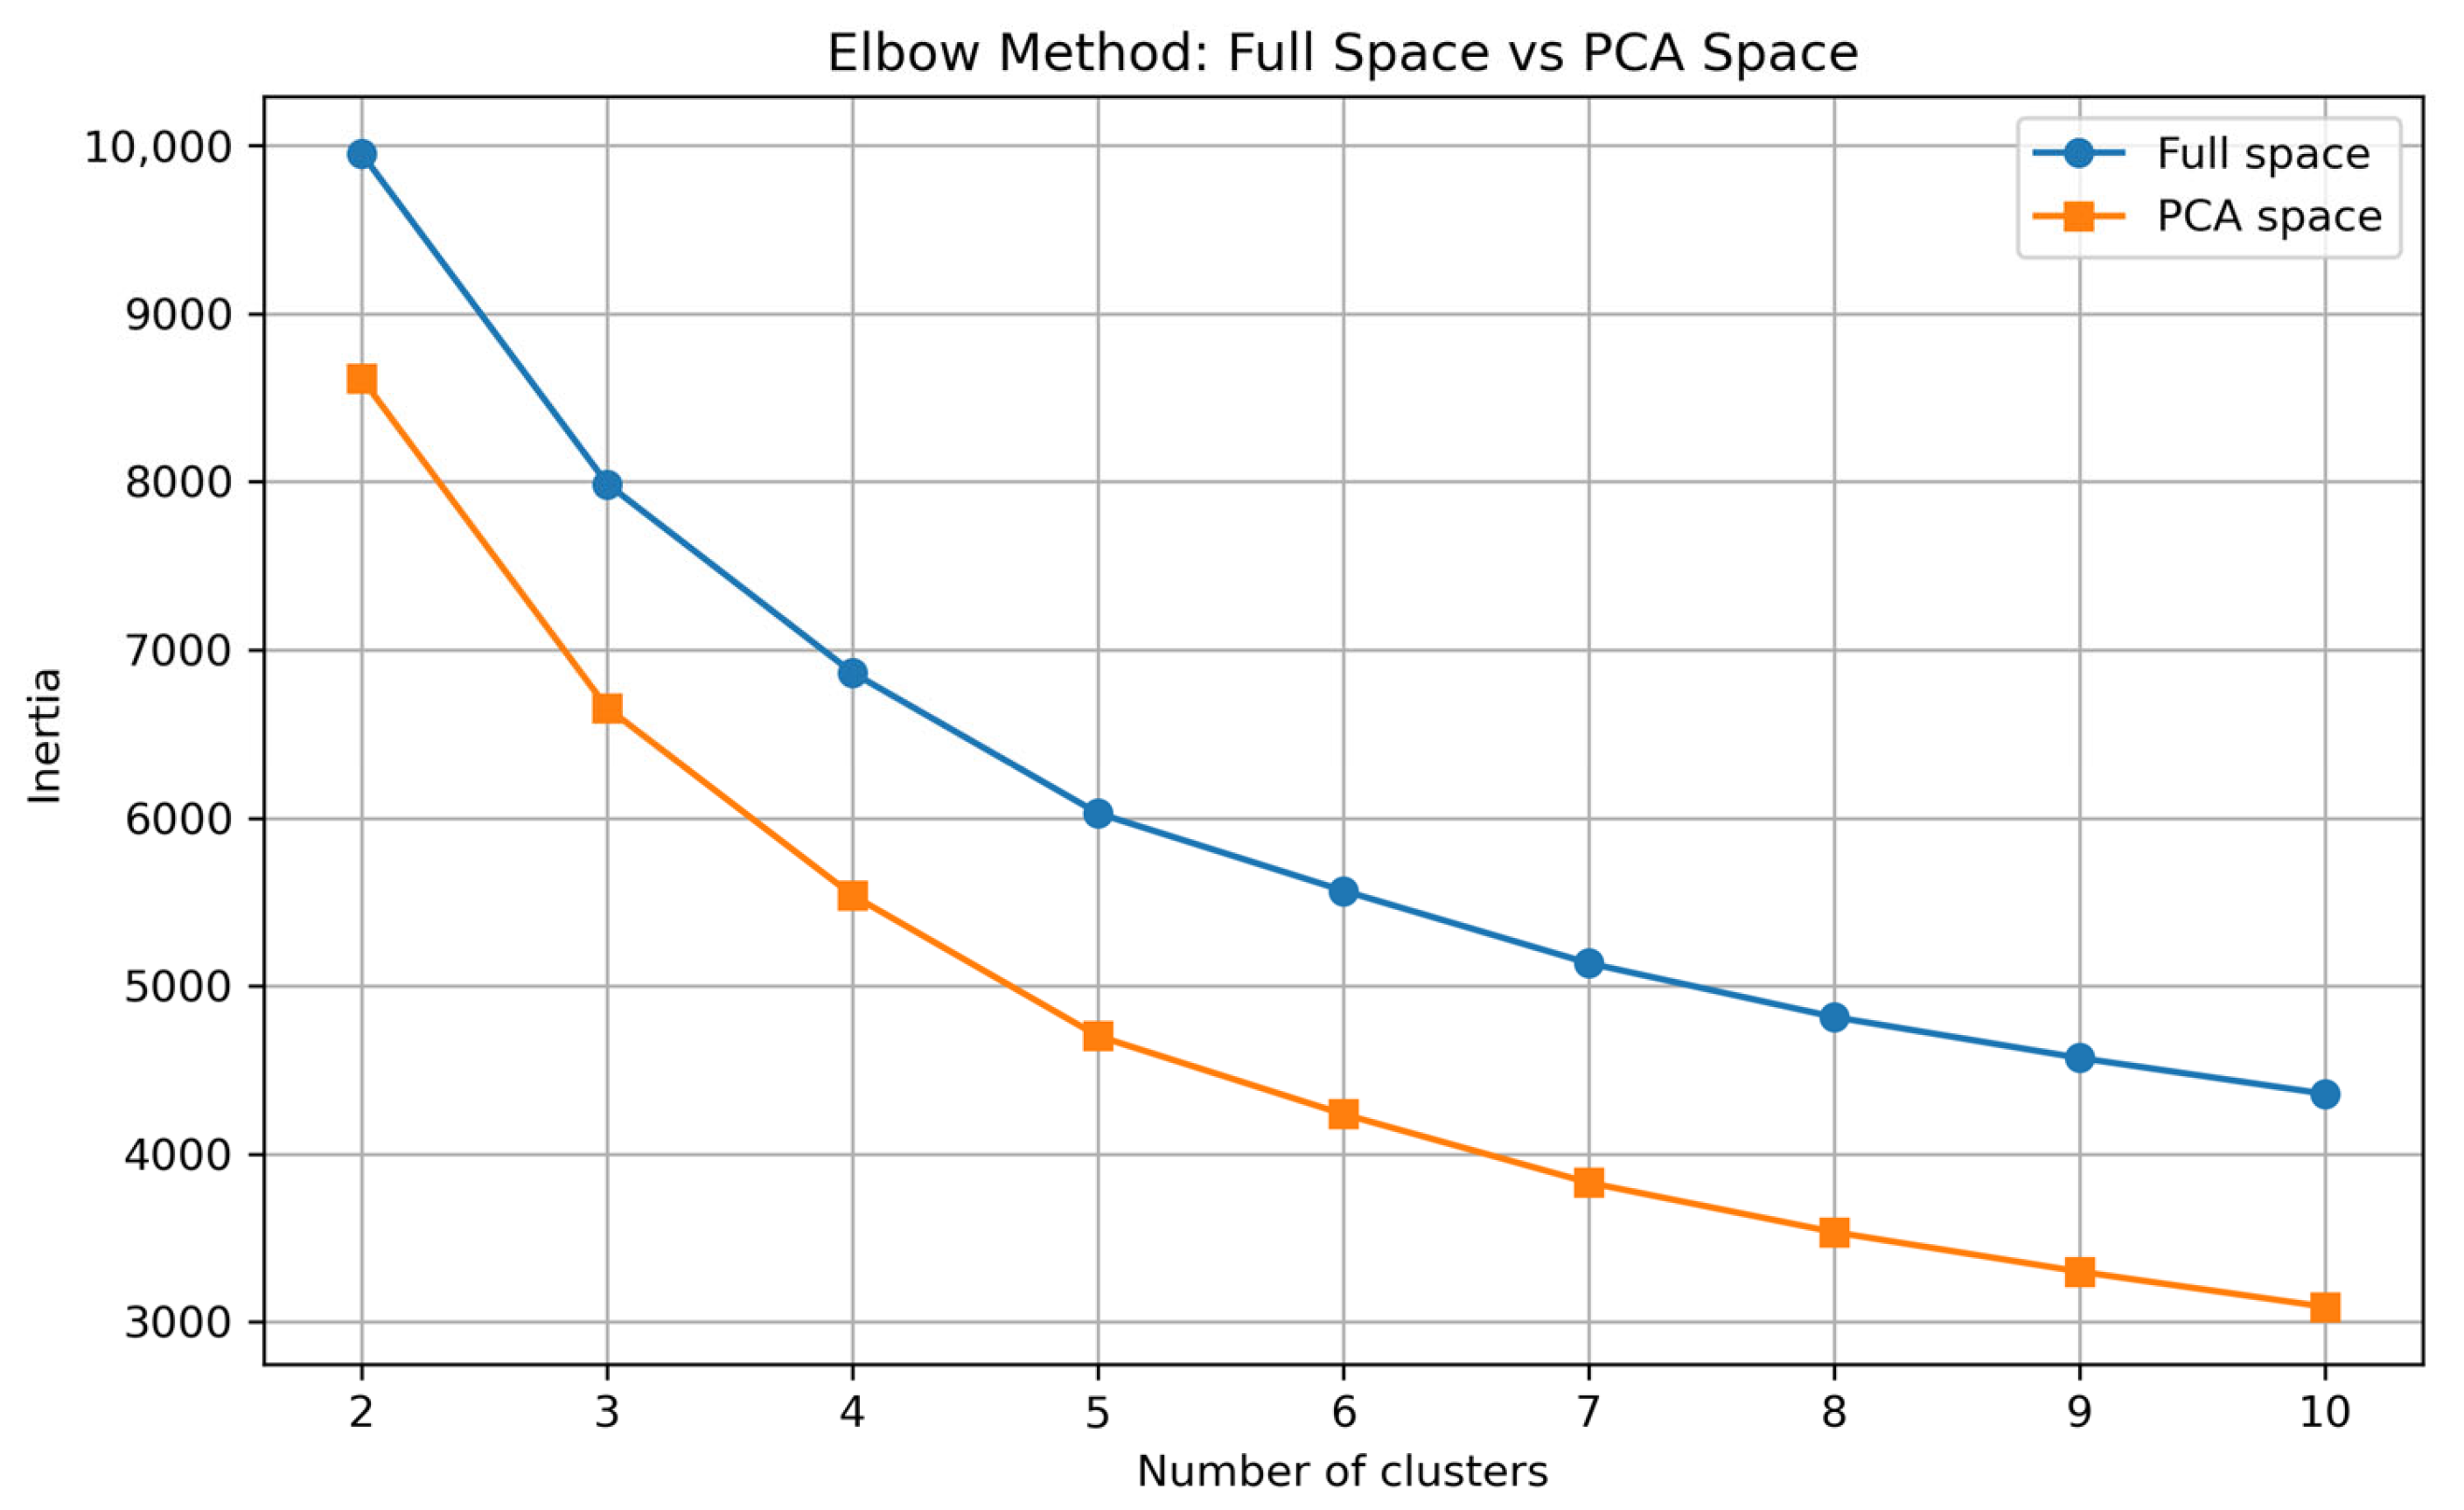
The elbow method showed a gradual decrease in inertia as the number of clusters increased from k = 2 to k = 10 (Figure 5). The largest reduction occurred in the initial steps, with a noticeable inflection point around k = 3–4 clusters. This suggests that adding more clusters beyond this point yields diminishing returns in within-cluster compactness. In the PCA-reduced space, inertia values were consistently lower than in the full feature space, as expected due to the projection onto a lower-dimensional subspace that retains most of the informative variance while reducing noise.
Figure 5.
Elbow-method comparison between clustering performed in the full standardized feature space and the PCA-reduced space. Inertia decreased progressively as the number of clusters increased, with a noticeable inflection point around k = 3–4 clusters, supporting the selection of a three-cluster solution.
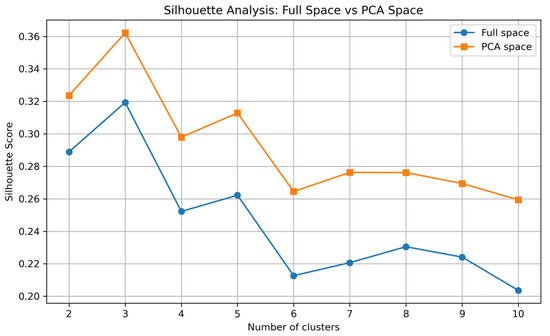
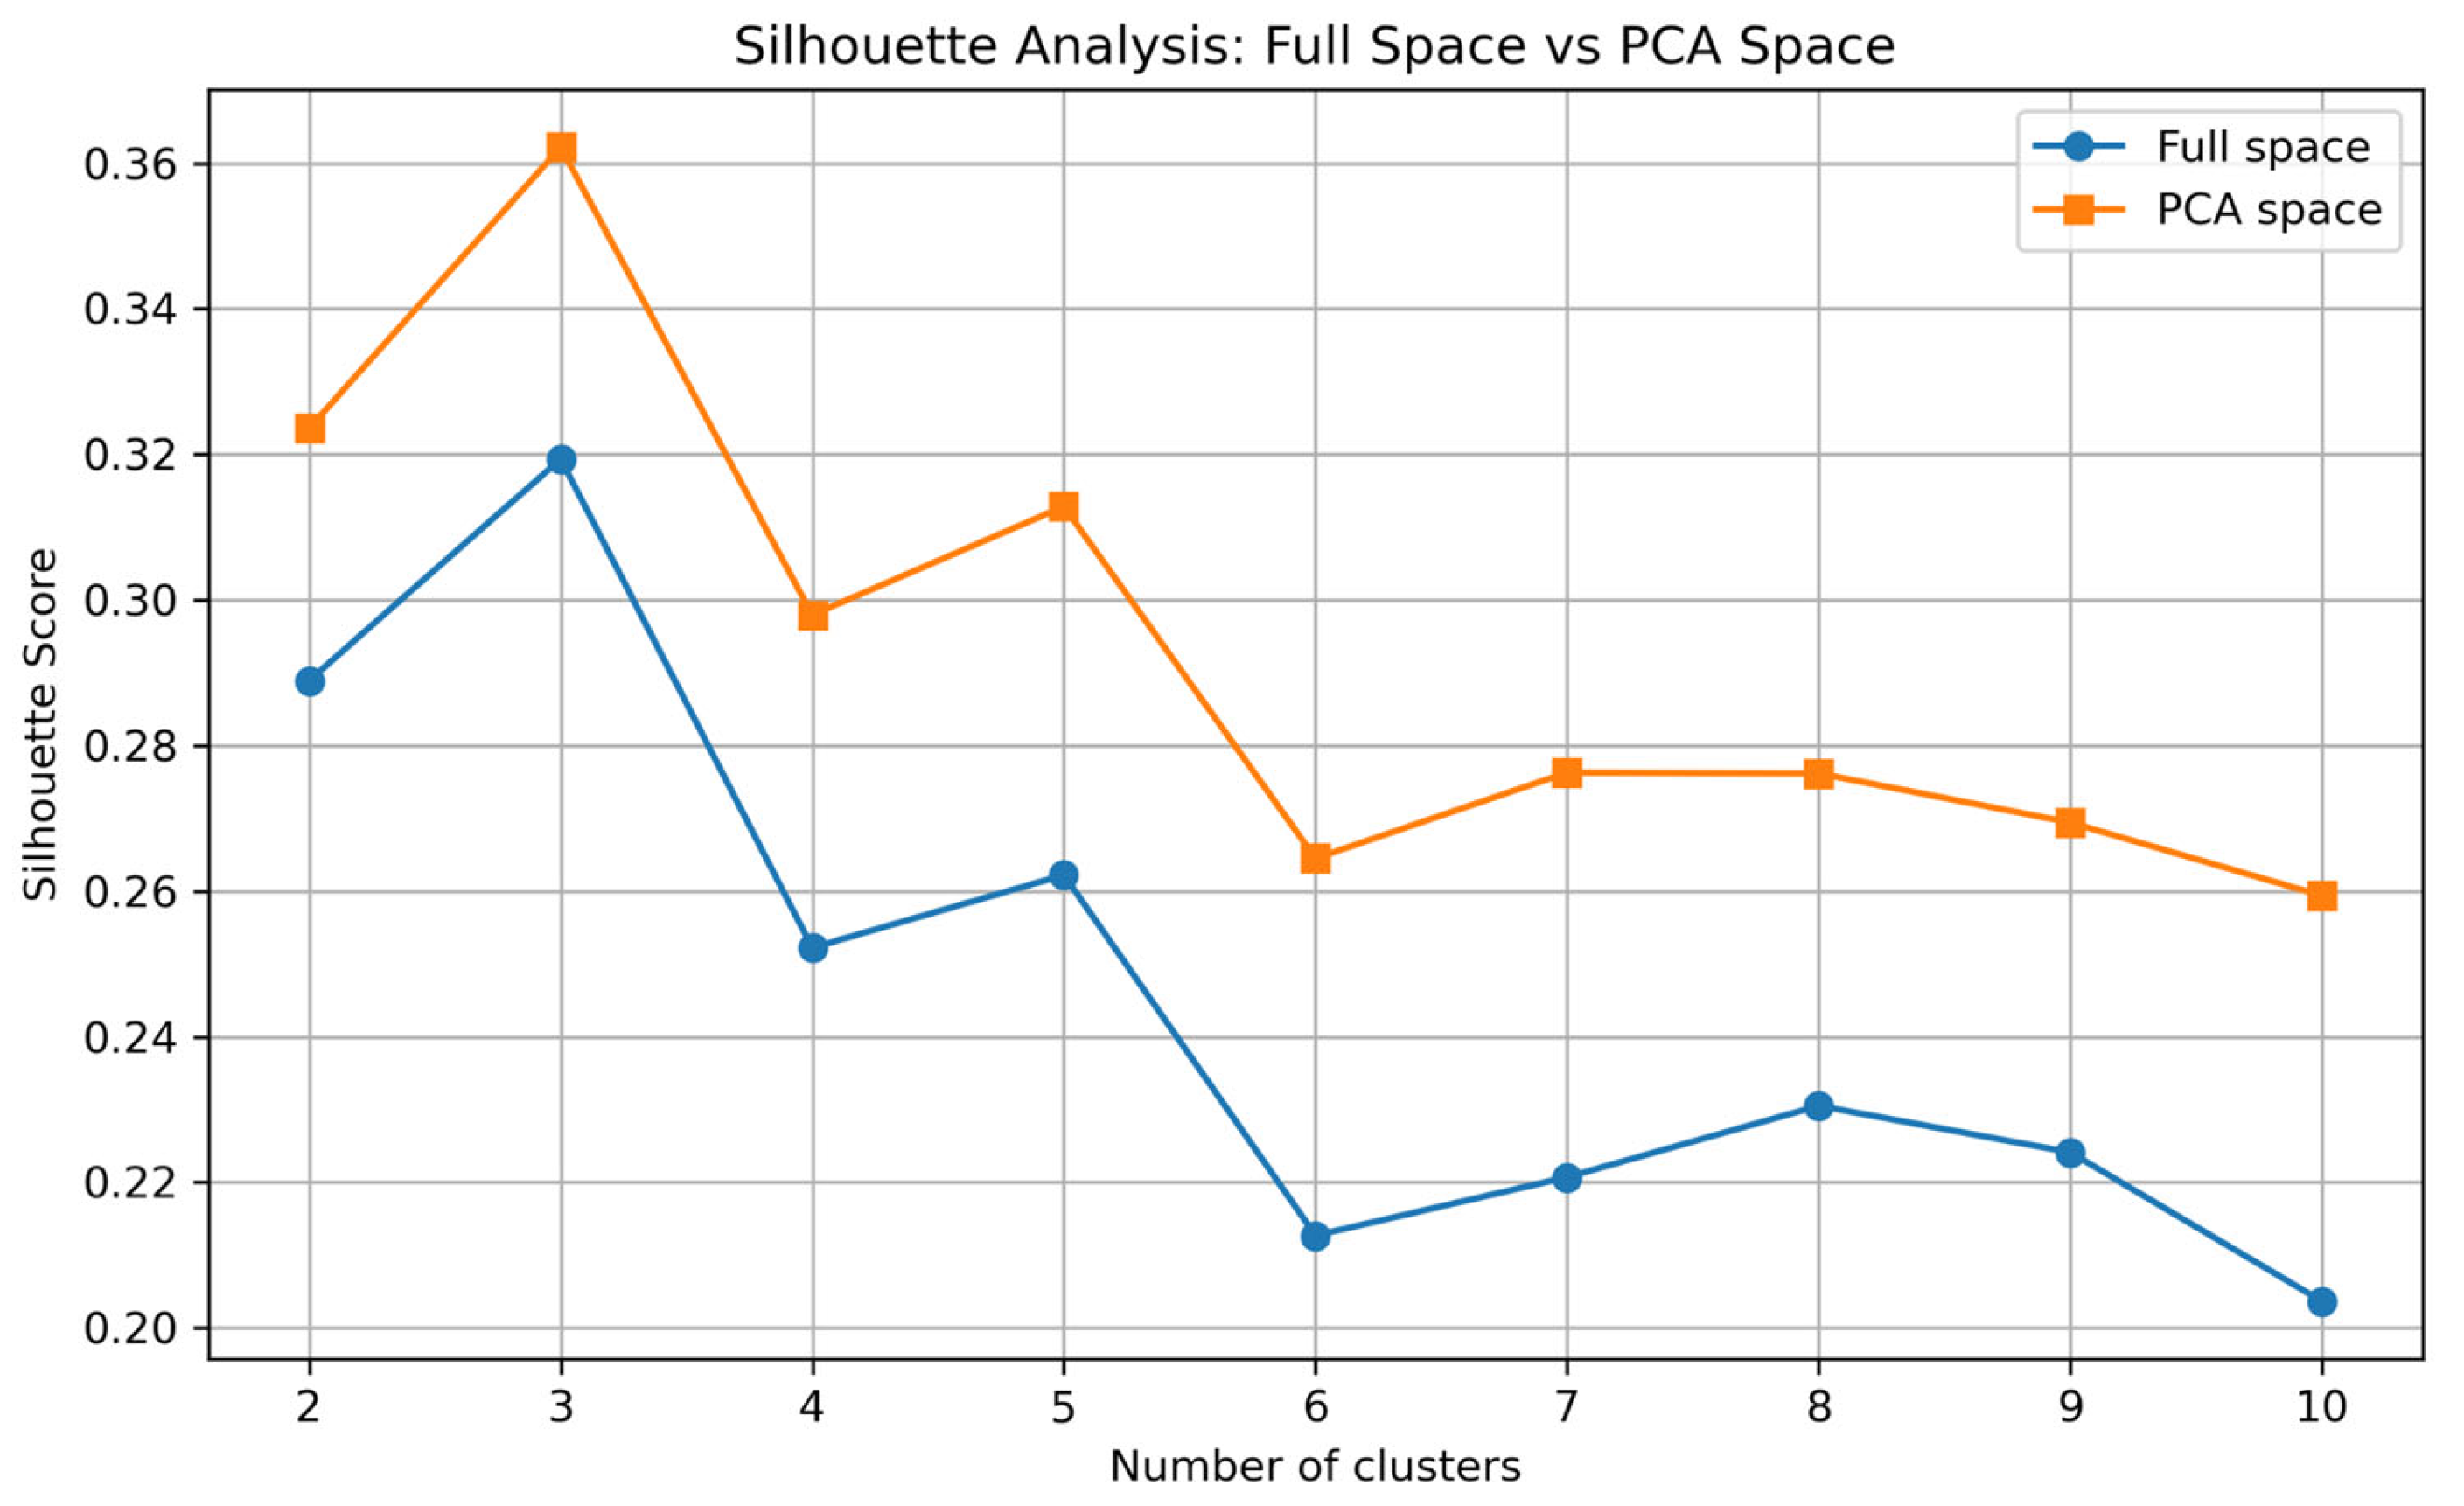
Silhouette analysis provided a clearer criterion for selecting the optimal number of clusters. The highest silhouette score in the full space (0.319) and in the PCA-reduced space (0.362) was observed at k = 3 (Figure 6). Moreover, the PCA-based solution consistently outperformed the full-space solution across most k values, indicating that dimensionality reduction improved the expression of the cluster structure. Based on these findings, a three-cluster solution was selected for further interpretation.
Figure 6.
Silhouette-score comparison between clustering performed in the full standardized feature space and the PCA-reduced space across different numbers of clusters (k = 2–10). The highest silhouette values were observed at k = 3 in both analytical spaces, indicating moderate but optimal cluster separation for the three-cluster solution.
The cluster-size distribution was highly consistent between the full-space and PCA-space solutions. In the full-space clustering, the three clusters included 64, 96, and 28 observations, whereas in the PCA-space clustering, the corresponding clusters included 65, 95, and 28 observations (Table 5 and Table 6). Therefore, the only difference between the two solutions was the reassignment of a single observation between the two larger clusters, while the smallest cluster remained unchanged. This further supports the stability of the clustering structure and indicates that dimensionality reduction did not meaningfully alter the underlying grouping of observations.
Table 5.
Cluster sizes in full-space clustering.
Table 6.
Cluster sizes in PCA-space clustering.
Furthermore, it should be noted that cluster labels (e.g., Cluster 0, 1, and 2) are arbitrarily assigned by the clustering algorithm and do not correspond directly between the full-space and PCA-space solutions. The numerical labeling depends on the initial centroid assignment and the order in which clusters are identified during the K-means procedure. Therefore, cluster indices should not be interpreted as representing the same group across different clustering approaches. Instead, comparisons between solutions should be based on cluster characteristics and membership rather than label numbering.
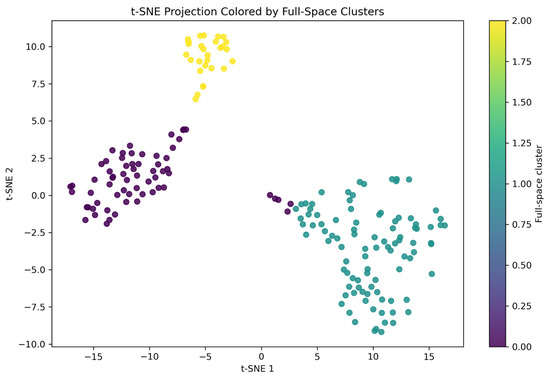
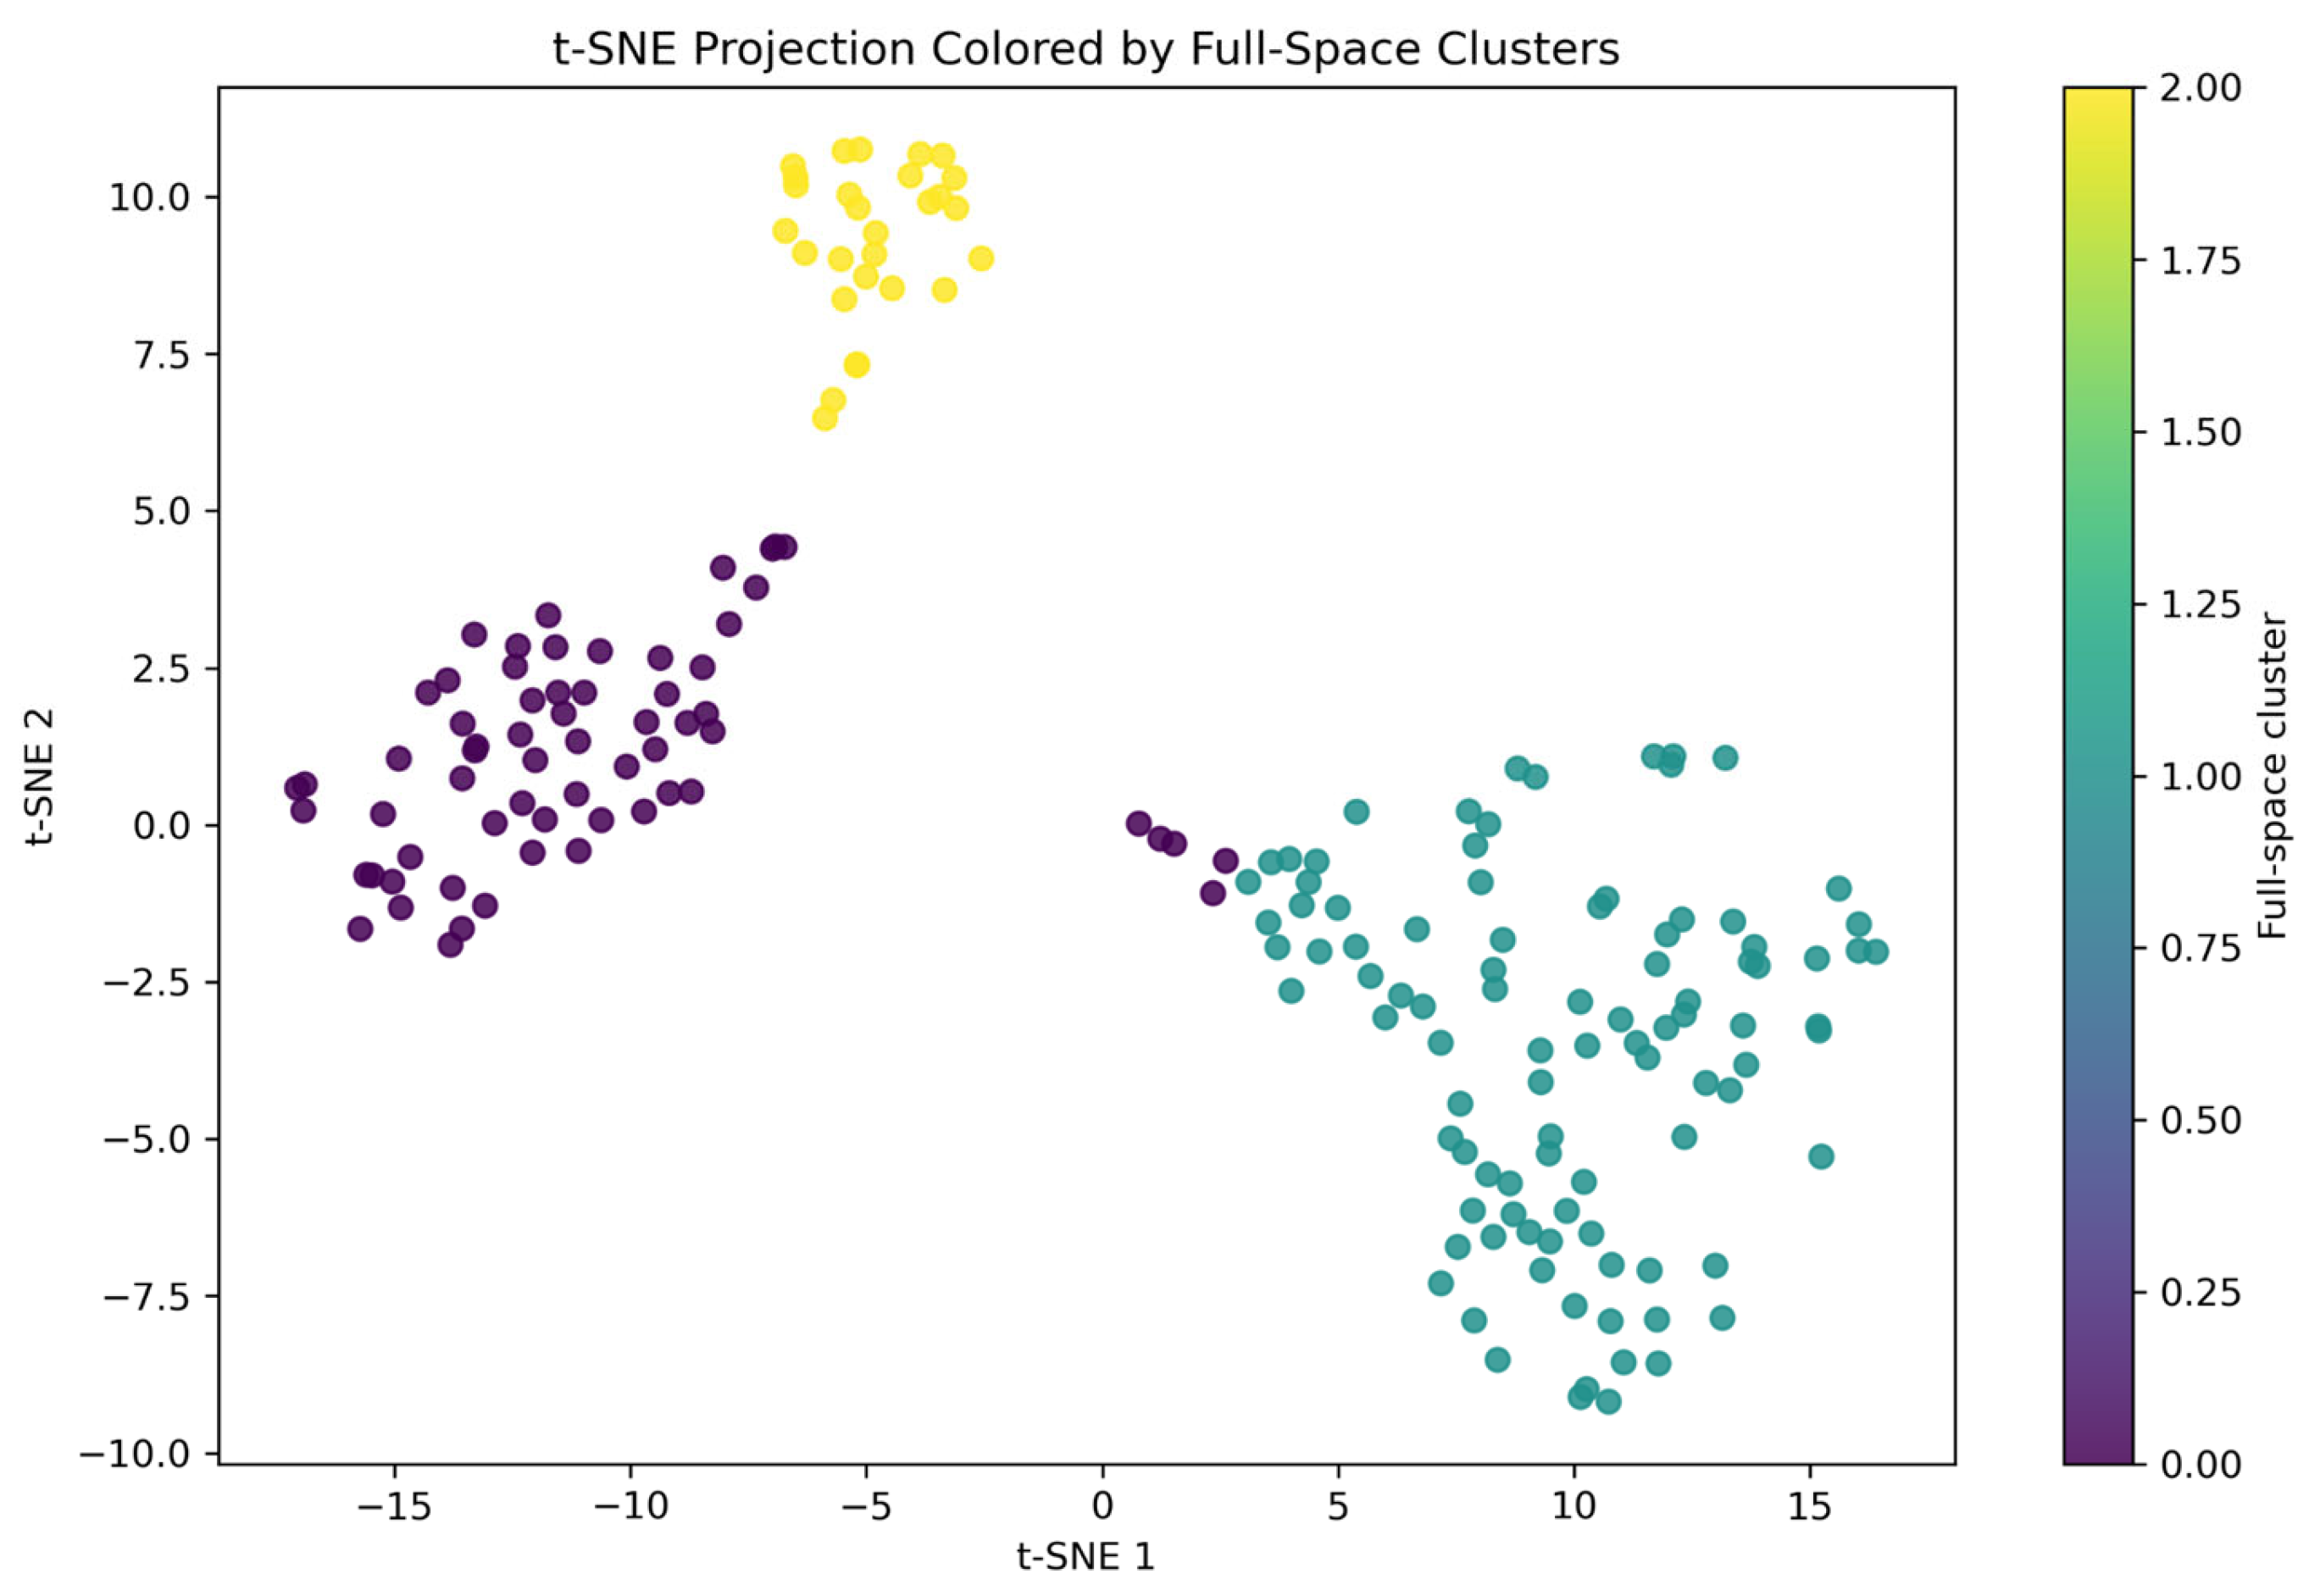
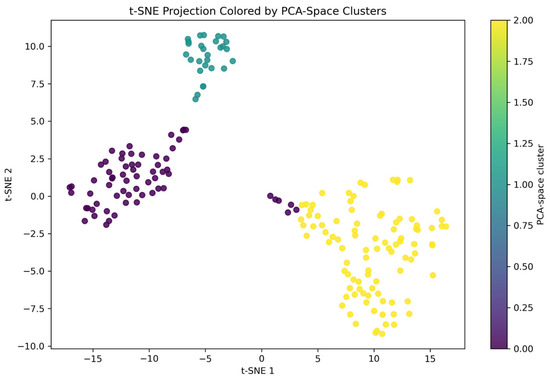
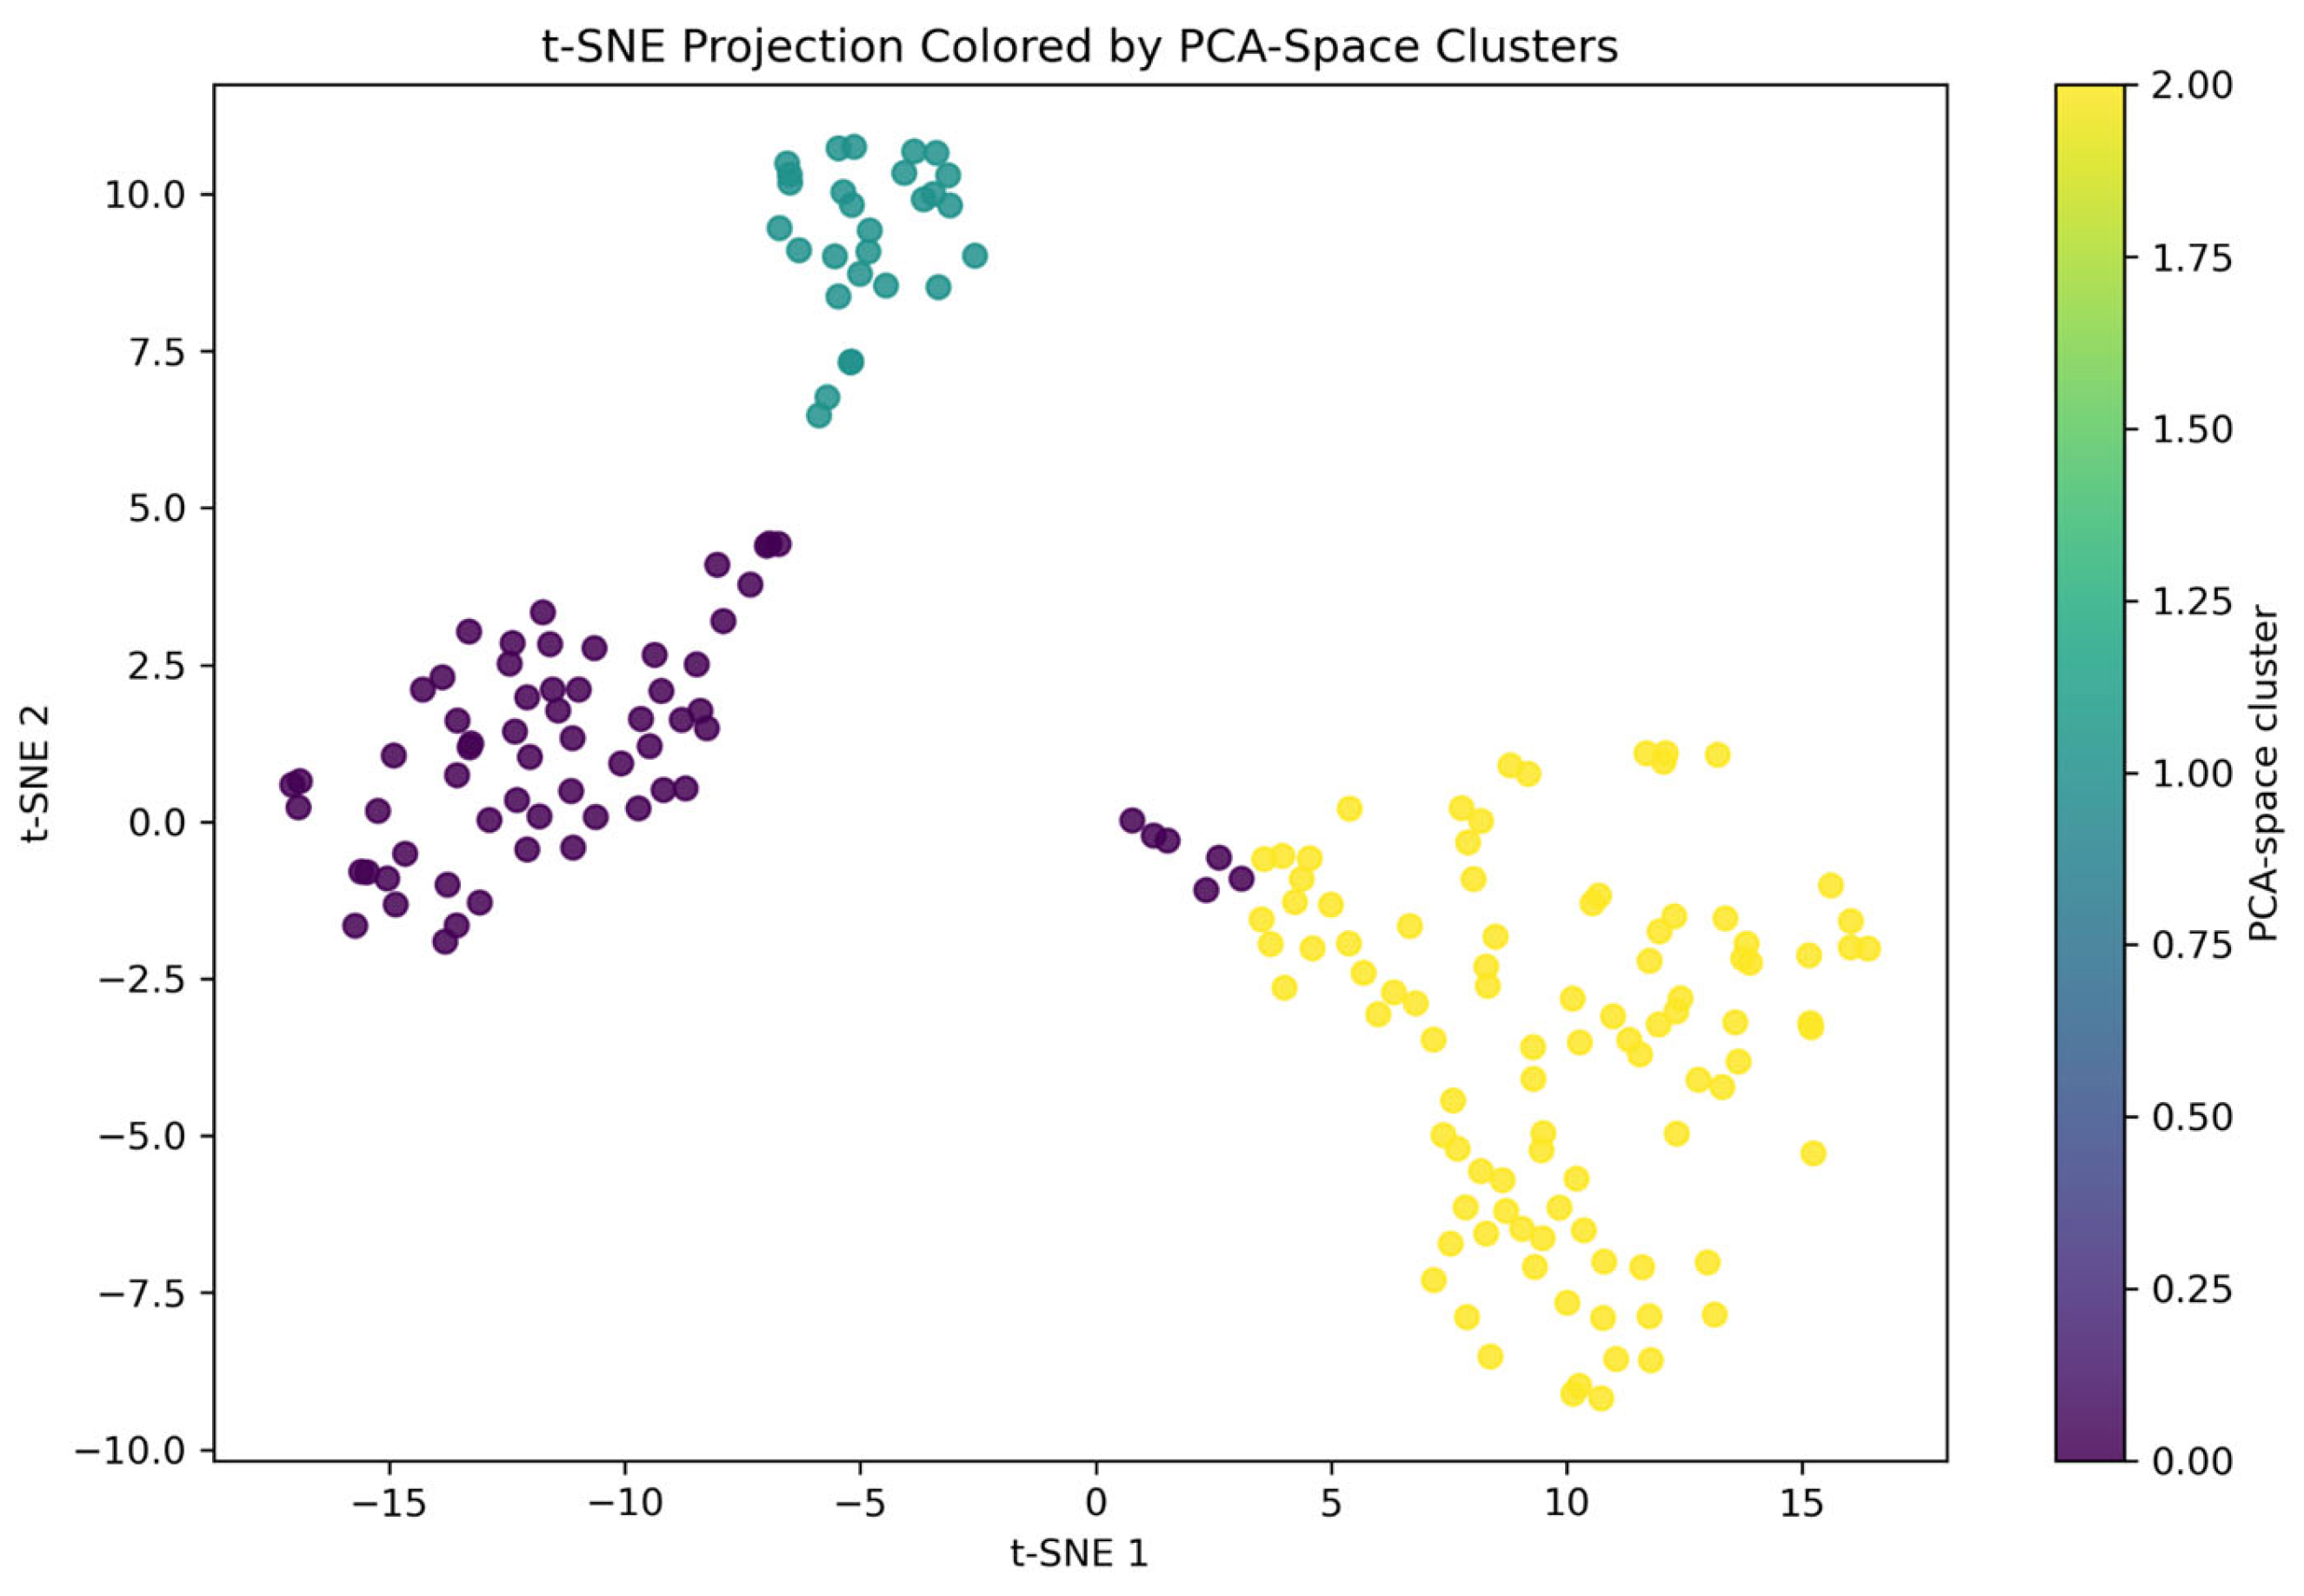
3.5. t-SNE Visualization of Clustering Structure
The t-SNE projections were used as nonlinear two-dimensional visualizations of the data structure. In both representations, the observations showed a visually apparent three-group pattern with limited overlap. However, t-SNE was used only as a qualitative visualization tool and not as an independent validation method for cluster validity. Because nonlinear projection methods may exaggerate apparent separation depending on hyperparameter selection, these plots should be interpreted cautiously and only as supportive visual summaries of the clustering results (Figure 7 and Figure 8).
Figure 7.
Two-dimensional t-SNE projection of observations colored according to clustering performed in the full standardized feature space. The figure provides a qualitative visualization of the clustering structure and should not be interpreted as an independent validation of cluster validity.
Figure 8.
Two-dimensional t-SNE projection of observations colored according to clustering performed in the PCA-reduced feature space. The visualization demonstrates a similar spatial grouping pattern to the full-space clustering solution while serving only as a qualitative representation of the data structure.
3.6. Variables Separating the Clusters
The analysis of separating variables was based on the mean absolute deviation of each cluster mean from the global mean of the corresponding variable (Table 7 and Table 8). In both clustering approaches, Jump Load (J) emerged as the most influential variable, with a separation score exceeding 5293 units. Other highly discriminative variables included high-intensity metrics such as Acceleration Load in the very high zone, maximal metabolic power, Acceleration Load in the low zone, and Anaerobic Activity distance.
Table 7.
Top 10 separating variables for full-space clustering.
Table 8.
Top 10 separating variables for PCA-space clustering.
The fact that the same variables appeared among the top contributors in both the full-space and PCA-based clustering solutions indicates that cluster interpretation is stable and not dependent on the chosen analytical space.
3.7. Integrated Interpretation
The principal component structure and clustering results were closely aligned, indicating that the identified clusters emerged directly from the dataset’s dominant latent dimensions. Specifically, the primary separation between clusters occurred along PC1, which represents high-intensity external load, while secondary differentiation was observed along PC2, reflecting neuromuscular load characteristics.
This interpretation is further supported by the variable separation analysis, in which the most discriminative variables, such as jump load, acceleration load, and anaerobic activity, correspond to those with the highest loadings on the first two principal components. These findings suggest that the clustering structure is driven by a combination of intensity-related and neuromuscular performance factors. Although the three profiles demonstrated consistent statistical separation within the present dataset, they should not be interpreted as distinct athlete types. Instead, they represent exploratory groupings within a continuous external-load spectrum.
4. Discussion
In an era of rapid technological advances in load monitoring that generate large volumes of data, the primary aim of this study was to reduce the dimensionality of external load variables derived from an LPS and to explore observation-level external-load profiles using an unsupervised data-driven approach [16,23,27,28,36]. The findings suggest that highly interrelated external-load variables can be summarized into a smaller number of interpretable latent dimensions, which may support more efficient and transparent load monitoring in indoor team sports [27,28,29].
An important methodological implication of the present study is that dimensionality reduction, when applied carefully, preserves the data’s intrinsic structure rather than distorting it [27,29]. This was demonstrated by directly comparing clustering solutions obtained in the full standardized feature space and the PCA-reduced space. The exceptionally high agreement between the two solutions (ARI = 0.981; NMI = 0.971), combined with the nearly identical cluster-size distributions and minimal reassignment of observations, indicates that the reduced representation retains the essential characteristics of the original dataset. This finding is relevant for both data analysts and practitioners, as it suggests that dimensionality reduction can simplify complex datasets while preserving the main structure of the analyzed data [28,29,37,38]. In this context, PCA should be considered an exploratory structure-reduction technique rather than a validation method for athlete profiling [29,38]. Consequently, the comparison between full-space and reduced-space clustering supports the internal consistency of the identified observation-level profiles within the present dataset, but external validation remains necessary.
The PCA results provided a clear and interpretable representation of the latent structure of external load [29,38]. Specifically, the first principal component, explaining 37.2% of the variance, was dominated by high-intensity variables such as anaerobic activity, high-speed running, sprint actions, and very high acceleration load. This component can be interpreted as a global high-intensity external load axis, reflecting the overall explosive and metabolically demanding aspects of performance. The second principal component, explaining an additional 16.5% of the variance, captured a distinct dimension related to neuromuscular load and movement dynamics, characterized by variables such as decelerations and jump-related metrics, in contrast to lower-intensity volume indicators. Together, these components accounted for more than half of the total variance, indicating that external load in indoor team sports can be largely described by a combination of intensity-driven and neuromuscular factors [16,22,29,38]. It is important to clarify that the distinction between component retention and component interpretation is central to the methodological approach of this study. Twelve principal components were retained to exceed the 90% explained variance threshold and to ensure that the PCA-reduced clustering solution preserved the essential structure of the original dataset. However, the first five components explained approximately 78% of the total variance and captured the most coherent and practically interpretable external-load dimensions. The remaining components each contributed only a small additional percentage of variance and appeared to represent more specific or residual aspects of movement behavior. For this reason, they were included in the clustering procedure to avoid unnecessary information loss, but the practical interpretation was concentrated on the first five components. An additional consideration is that the identified latent dimensions emerged from the statistical structure of the analyzed dataset and may therefore vary across sports, competitive levels, monitoring technologies, and analytical procedures. Consequently, the dimensions identified in the present study should not be assumed to represent universal constructs of external load, but rather preliminary data-driven representations that require replication in independent samples.
Importantly, the clustering structure was directly aligned with these principal components. The primary separation between clusters occurred along PC1, suggesting that differences in high-intensity load represent the dominant factor distinguishing performance profiles. Secondary differentiation along PC2 further separated observations based on neuromuscular demands and movement characteristics. This strong alignment between PCA and clustering suggests that the identified clusters reflect structured patterns within the dataset rather than purely random algorithmic partitioning. For data analysts, this highlights the importance of combining unsupervised learning techniques to move beyond purely descriptive metrics and toward interpretable latent structures [28,35,38]. The three-cluster solution may be interpreted as three exploratory external-load profiles rather than as arbitrary statistical groups. The smallest cluster (approximately 15% of observations) appears to represent the most demanding high-intensity profile, characterized by markedly elevated acceleration-load, anaerobic activity, and sprint-related variables. In contrast, the largest cluster was associated with more moderate and cumulative workload characteristics, including total distance and low-speed activity. The remaining cluster demonstrated a mixed neuromuscular profile with stronger contributions from jump-related and deceleration variables. This distribution suggests that the identified profiles may reflect distinct movement-demand patterns rather than simple differences in overall activity volume. Specifically, based on the PCA structure, the variable separation analysis, and the spatial distribution of the observations, the first profile appears to represent observations characterized by higher high-intensity external load. This profile is mainly associated with greater values in variables related to anaerobic activity, high-speed distance, sprinting actions, and very high acceleration load, corresponding primarily to the positive direction of PC1. From a practical perspective, this profile may reflect athletes or match periods with greater explosive and metabolically demanding activity. A second profile appears to represent observations with comparatively lower high-intensity load but greater contribution from overall volume and lower-intensity activity. This profile is consistent with the contribution of PC3 and variables such as total distance, low-speed distance, time on the playing field, and metabolic work. Although these observations may not be characterized by the highest explosive demands, they still represent meaningful cumulative workload and should not be interpreted as having low importance from a monitoring perspective. The third profile appears to be distinguished more strongly by neuromuscular and mechanical load characteristics, including jump load, decelerations, and acceleration-related variables. This profile is particularly relevant in indoor team sports, where repeated braking, changes in direction, jumping, and short accelerative efforts are central to performance demands. Therefore, the three profiles may be understood as representing different combinations of high-intensity output, cumulative workload, and neuromuscular-mechanical stress. Importantly, these profiles were observed in both the full standardized feature space and the PCA-reduced space, with nearly identical cluster-size distributions and very high agreement indices. This supports the view that the profiles are not artifacts of dimensionality reduction, but consistent patterns within the analyzed dataset.
The variable separation analysis further reinforced this interpretation. Jump Load emerged as the most discriminative variable across both clustering approaches, followed by acceleration load, metabolic power, and anaerobic activity distance. These variables are all associated with high mechanical and metabolic stress, indicating that cluster differentiation is primarily driven by high-intensity and neuromuscular load characteristics [16,20,22,29]. The consistency of these findings across both analytical spaces confirms the robustness of the results and suggests that a small subset of variables can effectively capture the dataset’s structure [28,29,37]. The separation of the two axes and their contribution to explaining the data is consistent with the nature of indoor team sports. These sports are, by definition, intermittent, with periods of high intensity followed by periods of lower intensity [11,14,16]. A key characteristic of these sports is the change in direction, accelerations and decelerations, and, overall, high-intensity actions across all three movement axes [16,21,39,40]. Between them, the sports present differences; for example, in basketball, more actions are required in the vertical axis, expressed through parameters such as jump load, whereas in futsal and handball, greater emphasis is placed on the horizontal axis, where accelerations and decelerations over short time intervals are the decisive performance factors [16,20,22,29,39,40].
The t-SNE projections provided an additional qualitative visualization of the clustering structure in a nonlinear low-dimensional space [41]. In both representations, the observations showed a visually apparent three-group pattern with relatively limited overlap. However, because t-SNE is primarily a visualization technique and may exaggerate apparent separation depending on hyperparameter selection, these projections should not be interpreted as independent validation of cluster validity [28,37].
From a research and applied perspective, many studies in recent years have focused on identifying the key parameters that determine athletic performance and, ultimately, match outcomes [16,23,35]. The parameters that are particularly recognized in futsal and handball are the ability to perform a high number of accelerations and decelerations within short time periods, as well as the ability to perform sprints [39,40]. However, it is also clear that indoor load monitoring systems show high validity for positional data and for variables related to the total number of accelerations, decelerations, and high-intensity actions, while they demonstrate lower accuracy in determining maximal accelerations, decelerations, and maximal speed [42,43,44,45]. The results of the present study suggest exploratory external-load profiles that also incorporate parameters related to athletes’ maximal capacities. The inclusion of athletes from different sports helps increase the sample’s dispersion and supports the identification of exploratory external-load profiles. Essentially, to our knowledge, few studies have explored observation-level external-load profiling in indoor team sports using LPS-derived data [42,43,44,45]. Nevertheless, although the results are in line with the nature of these sports, they should be interpreted with caution, as the axes derived include parameters with relatively low validity [42,43,44,45].
From a practical perspective, the present findings should be interpreted as hypothesis-generating rather than immediately actionable. Although the identified dimensions and profiles may assist practitioners in summarizing complex monitoring datasets, their usefulness for decision-making, athlete management, and training prescription has not yet been prospectively demonstrated. Modern tracking systems generate numerous external load variables, many of which provide redundant information [28,29,37]. Monitoring all available metrics is not only impractical but may also obscure meaningful insights. The present study suggests that these variables can be summarized into a smaller number of interpretable dimensions, primarily high-intensity load, neuromuscular load, and overall workload volume, thereby allowing practitioners to focus on the most informative aspects of performance [28,29,37]. Building on this and on the basis that load monitoring has dual significance in sport, as it is involved in both maximizing performance and reducing injury risk, and in guiding the return-to-play process for injured athletes [3,5,6,46], the development of hybrid parameters, calculated from multiple variables without losing the original information, might better explain the relationship between load and outcomes [27,28,38]. However, the practical value of the identified dimensions remains to be established. Longitudinal monitoring of these three dimensions within long-term training planning, together with the examination of their relationships with performance outcomes, injury occurrence, and markers of maladaptation or overtraining, may help determine whether the proposed framework provides meaningful advantages for athlete monitoring and decision-making.
The parameters used so far in the literature relate to accelerations, decelerations, and high-intensity actions and stem mainly from studies in soccer and American football, and to a lesser extent in futsal and handball, while research in basketball is almost nonexistent [16,19,20,22,24,25,26,39,40]. Based on the present study’s data, it appears that the identified latent dimensions group high-intensity actions within common external-load structures, creating specific profiles; however, variables of moderate or low intensity, which also contribute to the athletes’ overall load, likewise help explain the data. Longitudinal monitoring of load within each athlete profile may potentially highlight different parameters associated with both performance maximization and injury risk reduction [6,18,46]. The results of this preliminary study can contribute to the development of exploratory external-load profiles in indoor team sports. Nevertheless, for these profiles to be used prospectively, field studies are needed to demonstrate their practical utility. At this stage, it is recommended that they be monitored alongside the indicators already used by coaches, and that they complement current monitoring practice only if longitudinal studies confirm their importance.
Additionally, the identification of different external-load patterns suggests that observations may respond differently to similar movement demands based on their load characteristics. However, the present findings should not be interpreted as validated individualized monitoring or training-prescription models. Instead, they provide an exploratory framework that may support future hypothesis generation and longitudinal investigation of individualized responses to training and competition demands. From a data science perspective, this reinforces the value of unsupervised learning methods for discovering hidden patterns in complex performance data [28,29,35,38].
Despite these strengths, several limitations should be acknowledged. First, the dataset included observations from multiple indoor sports, which may introduce variability related to sport-specific movement demands [16,39,40]. While this broadens the ecological scope of the findings, future studies could investigate whether similar dimensional structures emerge within individual sports. It should be mentioned that the inclusion of athletes from different indoor sports was intentional, as the objective of the study was not to derive sport-specific profiles, but rather to investigate whether common latent external-load structures emerge across indoor team sports characterized by intermittent multidirectional activity. Therefore, the identified dimensions should be interpreted as exploratory shared indoor-sport load patterns within the present dataset, rather than as generalized or sport-specific performance signatures. Second, the analysis was limited to external load variables and did not incorporate internal load measures such as heart rate, perceived exertion, or physiological responses. Integrating internal and external load data could provide a more comprehensive understanding of athlete stress and adaptation [3,6,12,13]. Third, in the model used to explain the data and to create external-load profiles, variables were included whose validity is debatable. Parameters such as maximal acceleration, deceleration, and speed show lower validity when assessed with LPSs [42,43,44,45]. Nevertheless, they were used because they represent commonly monitored variables in indoor team-sport load analysis, and the technology used to evaluate them is currently among the most commonly used and practically applicable technologies available for indoor monitoring.
Furthermore, the unsupervised nature of the analysis means that the identified clusters were not directly linked to performance outcomes or injury risk. Although the clusters may reflect interpretable external-load structures, their practical significance would be strengthened by examining their relationship with match performance, fatigue, or injury incidence [3,5,6,46]. Future research should therefore explore the predictive value of these profiles and assess their applicability in real-world performance and health monitoring contexts. Finally, while PCA and clustering effectively reduced dimensionality and improved interpretability, alternative machine learning approaches, such as nonlinear dimensionality reduction or model-based clustering, may provide additional insights into the structure of external load data [27,35,41]. Future work could compare different analytical techniques and evaluate their relative performance in identifying meaningful external-load profiles.
Additionally, the sample size of the present study was relatively modest compared with the dimensionality of the dataset, which may influence PCA stability, clustering reproducibility, and external generalizability. Nevertheless, the PCA adequacy metrics and the stability analyses across random seeds supported the internal consistency of the dimensionality-reduction and clustering procedures within the present dataset. Furthermore, no external validation cohort was available, and repeated-measures longitudinal modeling was not performed. Consequently, the temporal stability and individual responsiveness of the identified external-load profiles remain unknown and should be investigated in future longitudinal studies.
Moreover, K-means clustering assumes compact and approximately spherical cluster structures and may be sensitive to initialization procedures, outliers, and covariance structure. In addition, contextual variables such as playing position, tactical role, match status, opponent characteristics, and situational game demands were not incorporated into the present analysis. Future research should therefore examine whether the identified latent dimensions and exploratory external-load profiles remain stable when these contextual and sport-specific factors are considered. Furthermore, observations were analyzed at a single time point without repeated longitudinal measurements. Therefore, the stability of the identified dimensions and profiles across different phases of the season, training cycles, or competitive contexts remains unknown and should be examined in future longitudinal studies.
5. Conclusions
The present study suggests that high-dimensional external-load datasets obtained from indoor-sport local positioning system monitoring can be reduced into a smaller number of interpretable latent dimensions while preserving the main structure of the analyzed data. The combination of principal component analysis and clustering identified exploratory observation-level external-load profiles mainly characterized by high-intensity, neuromuscular, and cumulative workload dimensions. These findings support the potential usefulness of data-driven dimensionality-reduction approaches for simplifying complex monitoring datasets and improving the interpretability of external-load information in indoor team sports. However, the identified dimensions and profiles should be considered exploratory statistical constructs that describe patterns within the present dataset. Their translational value for athlete monitoring, performance optimization, injury prevention, and return-to-play decision-making remains to be established through prospective longitudinal validation studies. Future longitudinal and prospective studies are required to determine whether these latent dimensions and external-load profiles are associated with fatigue, recovery dynamics, injury risk, adaptation, or competitive performance outcomes.
Author Contributions
Conceptualization, C.K., I.K. and A.C.; methodology, C.K., I.K., A.G. and A.C.; software, C.K., I.K., A.D. and P.A.; validation, D.P., A.A., D.B., P.F., N.Z., P.M., M.M. and A.C.; formal analysis, C.K., I.K., A.A., P.F., T.S., M.P., A.D. and A.C.; investigation, C.K., I.K., A.A., D.B., P.F., T.S., N.Z., M.M., A.G. and A.C.; data curation, C.K., D.P., A.A., P.F., T.S., A.D., P.A., N.Z. and A.C.; writing—original draft preparation, C.K., I.K., D.P., A.A., D.B., P.F., T.S. and P.A.; writing—review and editing, M.P., A.D., N.Z., P.M., M.M., A.G. and A.C.; visualization, C.K., M.P., PA. and P.M.; supervision, A.C.; project administration, A.C.; funding acquisition, A.C. All authors have read and agreed to the published version of the manuscript.
Funding
This research received funding from the project, which is co-funded by the European Union—NextGenerationEU through the Recovery and Resilience Facility (RRF) for the period 2022–2025, with the contribution of the National Public Investment Programme (PIP) and national resources covering VAT (DLS-ΥΠ3ΤA–0559995). In the abstract, all the DLS consortium members participated.
Institutional Review Board Statement
The study was conducted in accordance with the Declaration of Helsinki and approved by the Ethics Committee of the Department of Physical Education and Sport Science, Democritus University of Thrace (Protocol No: DUTH/EHDE/38826/966; approval date: 31 January 2025).
Informed Consent Statement
Written informed consent has been obtained from the participants’ parents or legal guardians to publish this paper.
Data Availability Statement
The data presented in this study are available on request from the corresponding author due to privacy and ethical reasons.
Acknowledgments
The authors have reviewed and edited the output and take full responsibility for the content of this publication.
Conflicts of Interest
The authors declare no conflicts of interest.
Appendix A
Table A1.
Loading of PCA factors.
References
- Issurin, V. Block Periodization versus Traditional Training Theory: A Review. J. Sports Med. Phys. Fit. 2008, 48, 65–75. [Google Scholar]
- Bompa, T.O.; Buzzichelli, C.A. Periodization: Theory and Methodology of Training, 6th ed.; Human Kinetics: Champaign, IL, USA, 2019; ISBN 978-1-4925-4480-7. [Google Scholar]
- Impellizzeri, F.M.; Marcora, S.M.; Coutts, A.J. Internal and External Training Load: 15 Years On. Int. J. Sports Physiol. Perform. 2019, 14, 270–273. [Google Scholar] [CrossRef] [PubMed]
- Issurin, V.B. New Horizons for the Methodology and Physiology of Training Periodization. Sports Med. 2010, 40, 189–206. [Google Scholar] [CrossRef] [PubMed]
- Gabbett, T.J. The Training—Injury Prevention Paradox: Should Athletes Be Training Smarter and Harder? Br. J. Sports Med. 2016, 50, 273–280. [Google Scholar] [CrossRef] [PubMed]
- Bourdon, P.C.; Cardinale, M.; Murray, A.; Gastin, P.; Kellmann, M.; Varley, M.C.; Gabbett, T.J.; Coutts, A.J.; Burgess, D.J.; Gregson, W.; et al. Monitoring Athlete Training Loads: Consensus Statement. Int. J. Sports Physiol. Perform. 2017, 12, S2161–S2170. [Google Scholar] [CrossRef] [PubMed]
- Fox, J.L.; Scanlan, A.T.; Stanton, R. A Review of Player Monitoring Approaches in Basketball: Current Trends and Future Directions. J. Strength Cond. Res. 2017, 31, 2021–2029. [Google Scholar] [CrossRef] [PubMed]
- Mujika, I.; Halson, S.; Burke, L.M.; Balagué, G.; Farrow, D. An Integrated, Multifactorial Approach to Periodization for Optimal Performance in Individual and Team Sports. Int. J. Sports Physiol. Perform. 2018, 13, 538–561. [Google Scholar] [CrossRef] [PubMed]
- Sosa Marín, C.; Alonso-Pérez-Chao, E.; Schelling, X.; Lorenzo, A. How to Optimize Training Design? A Narrative Review of Load Modulators in Basketball Drills. Appl. Sci. 2025, 15, 3816. [Google Scholar] [CrossRef]
- Scanlan, A.T.; Wen, N.; Tucker, P.S.; Dalbo, V.J. The Relationships Between Internal and External Training Load Models During Basketball Training. J. Strength Cond. Res. 2014, 28, 2397–2405. [Google Scholar] [CrossRef] [PubMed]
- Ben Abdelkrim, N.; El Fazaa, S.; El Ati, J. Time-Motion Analysis and Physiological Data of Elite under-19-Year-Old Basketball Players during Competition. Br. J. Sports Med. 2007, 41, 69–75; discussion 75. [Google Scholar] [CrossRef] [PubMed]
- Foster, C.; Rodriguez-Marroyo, J.A.; de Koning, J.J. Monitoring Training Loads: The Past, the Present, and the Future. Int. J. Sports Physiol. Perform. 2017, 12, S22–S28. [Google Scholar] [CrossRef] [PubMed]
- Foster, C.; Florhaug, J.A.; Franklin, J.; Gottschall, L.; Hrovatin, L.A.; Parker, S.; Doleshal, P.; Dodge, C. A New Approach to Monitoring Exercise Training. J. Strength Cond. Res. 2001, 15, 109–115. [Google Scholar] [CrossRef]
- McInnes, S.E.; Carlson, J.S.; Jones, C.J.; McKenna, M.J. The Physiological Load Imposed on Basketball Players during Competition. J. Sports Sci. 1995, 13, 387–397. [Google Scholar] [CrossRef] [PubMed]
- Buchheit, M.; Allen, A.; Poon, T.K.; Modonutti, M.; Gregson, W.; Di Salvo, V. Integrating Different Tracking Systems in Football: Multiple Camera Semi-Automatic System, Local Position Measurement and GPS Technologies. J. Sports Sci. 2014, 32, 1844–1857. [Google Scholar] [CrossRef] [PubMed]
- Russell, J.L.; McLean, B.D.; Impellizzeri, F.M.; Strack, D.S.; Coutts, A.J. Measuring Physical Demands in Basketball: An Explorative Systematic Review of Practices. Sports Med. 2021, 51, 81–112. [Google Scholar] [CrossRef] [PubMed]
- Poulios, A.; Fatouros, I.G.; Mohr, M.; Draganidis, D.; Deli, C.K.; Papanikolaou, K.; Sovatzidis, A.; Nakopoulou, T.; Ermidis, G.; Tzatzakis, T.; et al. Post-Game High Protein Intake May Improve Recovery of Football-Specific Performance during a Congested Game Fixture: Results from the PRO-FOOTBALL Study. Nutrients 2018, 10, 494. [Google Scholar] [CrossRef] [PubMed]
- Gabbett, T.J.; Oetter, E. From Tissue to System: What Constitutes an Appropriate Response to Loading? Sports Med. 2024, 55, 17–35. [Google Scholar] [CrossRef] [PubMed]
- Akenhead, R.; Nassis, G.P. Training Load and Player Monitoring in High-Level Football: Current Practice and Perceptions. Int. J. Sports Physiol. Perform. 2016, 11, 587–593. [Google Scholar] [CrossRef] [PubMed]
- Svilar, L.; Castellano, J.; Jukic, I. Comparison of 5vs5 Training Games and Match-Play Using Microsensor Technology in Elite Basketball. J. Strength Cond. Res. 2019, 33, 1897–1903. [Google Scholar] [CrossRef] [PubMed]
- Irid, Y.; Hutin, J.; Toussaint, J.-F.; Sedeaud, A. Exploring the Most Demanding Scenarios in Elite Youth Basketball: A Comprehensive Analysis across Playing Positions and Time Windows. Biol. Sport 2025, 42, 37–47. [Google Scholar] [CrossRef] [PubMed]
- Pantazis, D.; Stampoulis, T.; Balampanos, D.; Avloniti, A.; Kokkotis, C.; Aggelakis, P.; Protopapa, M.; Draganidis, D.; Emmanouilidou, M.; Retzepis, N.-O.; et al. Comparing Workloads Among Different Age Groups in Official Masters’ Basketball Matches: Implications for Physical Activity. Appl. Sci. 2025, 15, 4547. [Google Scholar] [CrossRef]
- Ferraz, A.; Duarte-Mendes, P.; Sarmento, H.; Valente-Dos-Santos, J.; Travassos, B. Tracking Devices and Physical Performance Analysis in Team Sports: A Comprehensive Framework for Research—Trends and Future Directions. Front. Sports Act. Living 2023, 5, 1284086. [Google Scholar] [CrossRef] [PubMed]
- Caparrós, T.; Casals, M.; Solana, Á.; Peña, J. Low External Workloads Are Related to Higher Injury Risk in Professional Male Basketball Games. J. Sports Sci. Med. 2018, 17, 289–297. [Google Scholar] [PubMed]
- Hulin, B.; Gabbett, T.; Lawson, D.; Caputi, P.; Sampson, J. The Acute: Chronic Workload Ratio Predicts Injury: High Chronic Workload May Decrease Injury Risk in Elite Rugby League Players. Br. J. Sports Med. 2016, 50, 231–236. [Google Scholar] [CrossRef] [PubMed]
- Nobari, H.; Mainer-Pardos, E.; Denche Zamorano, A.; Bowman, T.G.; Clemente, F.M.; Pérez-Gómez, J. Sprint Variables Are Associated with the Odds Ratios of Non-Contact Injuries in Professional Soccer Players. Int. J. Environ. Res. Public Health 2021, 18, 10417. [Google Scholar] [CrossRef] [PubMed]
- Rojas-Valverde, D.; Gómez-Carmona, C.D.; Gutiérrez-Vargas, R.; Pino-Ortega, J. From Big Data Mining to Technical Sport Reports: The Case of Inertial Measurement Units. BMJ Open Sport Exerc. Med. 2019, 5, e000565. [Google Scholar] [CrossRef] [PubMed]
- Ryan, S.; Kempton, T.; Coutts, A.J. Data Reduction Approaches to Athlete Monitoring in Professional Australian Football. Int. J. Sports Physiol. Perform. 2021, 16, 59–65. [Google Scholar] [CrossRef] [PubMed]
- Stone, J.D.; Merrigan, J.J.; Ramadan, J.; Brown, R.S.; Cheng, G.T.; Hornsby, W.G.; Smith, H.; Galster, S.M.; Hagen, J.A. Simplifying External Load Data in NCAA Division-I Men’s Basketball Competitions: A Principal Component Analysis. Front. Sports Act. Living 2022, 4, 795897. [Google Scholar] [CrossRef] [PubMed]
- Reis, F.J.J.; Alaiti, R.K.; Vallio, C.S.; Hespanhol, L. Artificial Intelligence and Machine Learning Approaches in Sports: Concepts, Applications, Challenges, and Future Perspectives. Braz. J. Phys. Ther. 2024, 28, 101083. [Google Scholar] [CrossRef] [PubMed]
- Tsenos, M.; Kokkotis, C.; Draganidis, D.; Alibertis, N.; Pantazis, D.; Tsimeas, P.; Poulios, A.; Zaras, N.; Malliou, P.; Tsaousidis, I.; et al. Injury Prediction and Risk Modelling in Team Sports Using Artificial Intelligence and Sensor-Based Monitoring: A Scoping Review. J. Funct. Morphol. Kinesiol. 2026, 11, 204. [Google Scholar] [CrossRef] [PubMed]
- Plakias, S.; Kokkotis, C.; Mitrotasios, M.; Armatas, V.; Tsatalas, T.; Giakas, G. Identifying Key Factors for Securing a Champions League Position in French Ligue 1 Using Explainable Machine Learning Techniques. Appl. Sci. 2024, 14, 8375. [Google Scholar] [CrossRef]
- Moustakidis, S.; Plakias, S.; Kokkotis, C.; Tsatalas, T.; Tsaopoulos, D. Predicting Football Team Performance with Explainable AI: Leveraging SHAP to Identify Key Team-Level Performance Metrics. Future Internet 2023, 15, 174. [Google Scholar] [CrossRef]
- Plakias, S.; Moustakidis, S.; Kokkotis, C.; Tsatalas, T.; Papalexi, M.; Plakias, D.; Giakas, G.; Tsaopoulos, D. Identifying Soccer Teams’ Styles of Play: A Scoping and Critical Review. J. Funct. Morphol. Kinesiol. 2023, 8, 39. [Google Scholar] [CrossRef] [PubMed]
- Gu, L.; Wang, W.; Plakias, S.; Zhang, S. Playing Style Identification in Team Sports: A Systematic Review from Statistical Dimensionality Reduction to Unsupervised Machine Learning. Int. J. Sports Sci. Coach. 2025, 20, 2742–2761, Erratum in Int. J. Sports Sci. Coach. 2026, 21, 1259, https://doi.org/10.1177/17479541251386160. [Google Scholar] [CrossRef]
- Rico-González, M.; Oliveira, R.; Palucci Vieira, L.H.; Pino-Ortega, J.; Clemente, F.M. Players’ Performance during Worst-Case Scenarios in Professional Soccer Matches: A Systematic Review. Biol. Sport 2022, 39, 695–713. [Google Scholar] [CrossRef] [PubMed]
- Rojas-Valverde, D.; Gutiérrez-Vargas, J.C.; Sánchez-Ureña, B. Sport Readaptation: Where Do We Draw the Lines Between Professionals? Front. Sports Act. Living 2019, 1, 62. [Google Scholar] [CrossRef] [PubMed]
- Rojas-Valverde, D.; Pino-Ortega, J.; Gómez-Carmona, C.D.; Rico-González, M. A Systematic Review of Methods and Criteria Standard Proposal for the Use of Principal Component Analysis in Team’s Sports Science. Int. J. Environ. Res. Public Health 2020, 17, 8712. [Google Scholar] [CrossRef] [PubMed]
- Bassek, M.; Raabe, D.; Memmert, D.; Rein, R. Analysis of Motion Characteristics and Metabolic Power in Elite Male Handball Players. J. Sports Sci. Med. 2023, 22, 310–316. [Google Scholar] [CrossRef] [PubMed]
- Illa, J.; Fernandez, D.; Reche, X.; Serpiello, F.R. Positional Differences in the Most Demanding Scenarios of External Load Variables in Elite Futsal Matches. Front. Psychol. 2021, 12, 625126. [Google Scholar] [CrossRef] [PubMed]
- van der Maaten, L.; Hinton, G. Viualizing Data Using T-SNE. J. Mach. Learn. Res. 2008, 9, 2579–2605. [Google Scholar]
- Alt, P.S.; Baumgart, C.; Ueberschär, O.; Freiwald, J.; Hoppe, M.W. Validity of a Local Positioning System during Outdoor and Indoor Conditions for Team Sports. Sensors 2020, 20, 5733. [Google Scholar] [CrossRef] [PubMed]
- Pino-Ortega, J.; Oliva-Lozano, J.M.; Gantois, P.; Nakamura, F.Y.; Rico-González, M. Comparison of the Validity and Reliability of Local Positioning Systems against Other Tracking Technologies in Team Sport: A Systematic Review. Proc. Inst. Mech. Eng. Part P J. Sports Eng. Technol. 2022, 236, 73–82. [Google Scholar] [CrossRef]
- Conte, D. Validity of Local Positioning Systems to Measure External Load in Sport Settings: A Brief Review. Hum. Mov. 2020, 21, 30–36. [Google Scholar] [CrossRef]
- Rico-González, M.; Los Arcos, A.; Clemente, F.M.; Rojas-Valverde, D.; Pino-Ortega, J. Accuracy and Reliability of Local Positioning Systems for Measuring Sport Movement Patterns in Stadium-Scale: A Systematic Review. Appl. Sci. 2020, 10, 5994. [Google Scholar] [CrossRef]
- Blanch, P.; Gabbett, T.J. Has the Athlete Trained Enough to Return to Play Safely? The Acute:Chronic Workload Ratio Permits Clinicians to Quantify a Player’s Risk of Subsequent Injury. Br. J. Sports Med. 2016, 50, 471–475, Correction in Br. J. Sports Med. 2019, 53, e6. https://doi.org/10.1136/bjsports-2015-095445corr1. [Google Scholar] [CrossRef] [PubMed]

Disclaimer/Publisher’s Note: The statements, opinions and data contained in all publications are solely those of the individual author(s) and contributor(s) and not of MDPI and/or the editor(s). MDPI and/or the editor(s) disclaim responsibility for any injury to people or property resulting from any ideas, methods, instructions or products referred to in the content. |
© 2026 by the authors. Licensee MDPI, Basel, Switzerland. This article is an open access article distributed under the terms and conditions of the Creative Commons Attribution (CC BY) license.