Abstract
Tailing dams are commonly used to safely store tailings without damaging the environment. Sand tailings (also called Sediment tailings) usually have a high water content and hence undergo consolidation during their placement. As the sediment tailings are usually placed above the ground water level, the degree of saturation and permeability of the sediment tailing is associated with the unsaturated condition due to the presence of negative pore-water pressure or suction. Current practices normally focus on the analyses saturated conditions. However, this consolidation process requires the flow of water between saturated and unsaturated zones to be considered. The objective of this study is to investigate the stability and consolidation of sediment tailings for the construction of road pillars considering the water flow between saturated and unsaturated zones. The scope of this study includes the unsaturated laboratory testing of sediments and numerical analyses of the road pillar. The results show that the analyses based on saturated conditions overestimate the time required to achieve a 90% degree of consolidation. The incorporation of the unsaturated soil properties is able to optimize the design of slopes for road pillars into steeper slope angles.
1. Introduction
Many major tailing dams have experienced failures in the past 30 years. Some researchers [1,2] indicate that the failure of tailing dams have contributed to catastrophic damages to environments. Several previous studies have indicated that the failures of tailing dams are normally attributed to the concurrent factors, such as: slope stability problems, bearing capacity failures, liquefactions due to earthquake and the effect of rainfall [3,4,5,6,7,8]. Some tailing dams are constructed using sand with high water content [3,9]. Hence, the sand is hydraulically placed to build the containment dam. Based on soil mechanics theory, sand as a coarse particle has high permeability under fully saturated conditions [10,11]. However, sand may have very low permeability under unsaturated conditions [12,13]. As a result, there may be some delay in the draining process of water within the sand layer during construction stages.
Sediment transport may be encountered during the water flow with high velocity within the high permeability materials. Two-phase flow is usually subjected to a complex mixture between the solid and fluid phases. It is complex to mathematically model, in particular when one considers the unsaturated conditions of the sediments [14,15,16]. Seepage, consolidation and stability analyses for sand tailing have been performed historically by either assuming that the soil to be completely dry, or the entire fill layer undergoing consolidation [17]. Ito and Azam [18] developed a 1-D consolidation model to estimate the behavior of sand tailing during the filling process. However, this method does not take into account the unsaturated soil mechanics principles during the construction of sand tailing. The unsaturated state of these materials may develop as a result of them being situated either above a water table or due to percolation of water down to the soil beneath the tailing because of gravity force during construction stage. In both cases, an unsaturated zone will be formed within the formation of the slope during the filling process [19]. In the unsaturated zone, the pore-water pressure within the soil becomes negative with respect to the atmospheric pressure. The negative pore-water pressure or matric suction contributes to the additional shear strength and improvement to the overall stability of the slope [20,21]. However, the permeability will drop significantly and the unsaturated zone will have very low permeability which delay the dissipation of excess pore water pressure from the saturated zone.
The objective of this study is to investigate the stability and consolidation of sand tailings road pillars constructed using the hydraulically deposited coarse sand tailings by considering the flow of water between saturated and unsaturated zones. The scope of this works includes (1) the experimental works in the laboratory to determine the saturated and the unsaturated properties of the soils and materials used in this study; (2) the assessment of the consolidation characteristics of the road pillars in order to determine the time required for full settlement to occur using Seep/W and Sigma/W [22]; (3) the determination of the design (slope angle) of road pillars to ensure the required factor of safety with respect to the additional backfilling of sediment tailings adjacent to the already constructed road pillars using Slope/W [23].
2. Saturated and Unsaturated Laboratory Testing
This study is part of the project to evaluate the feasibility of constructing road pillars using hydraulically placed coarse sand tailings as part of the rehabilitation of the Fingerboards Mineral Sands Project [24]. The road pillar is targeted to be constructed to a height of 51 m in Glenaladale, Victoria, Australia. The project lies within the Glenaladale Deposit that occurs within unconsolidated sediments and contains heavy minerals such as zircon, rutile, ilmenite and rare-earth bearing minerals (monazite and xenotime). The project represents the first phase of mineral sands production (up to 20 years) from the Glenaladale Deposit. The project area, which targets what is known as the Fingerboards resource area, is approximately 1675 ha and of this approximately 1250 ha is expected to be mined.
The construction of the road pillars is planned to use the mine sand from nearby area using only hydraulically deposited sandy tailings [24]. The index properties of the sand materials is presented in Table 1. In terms of ASTM D2487-10 [25], the classification of the coarse sand in terms of the unified soil classification system (USCS) is “SC” which stands for a clayey sand. The settling tests [26] were carried out using a sand slurry prepared at 70% solids. Two tests were used, the first with no drainage and the second with bottom drainage provided. The final settled dry densities are 1.37 and 1.40 for the tests without and with drainage, respectively. The tests show that the coarse sand settles within 4 h for bottom-drained tests. The compaction test was also performed using standard proctor method following ASTM D4253-00 [27] to obtain the maximum dry density (ρdry) and the optimum water content (wopt) of the sand. The ρdry and wopt are 1.465 t/m3 and 20.5%, respectively.

Table 1.
Index properties of sand tailing.
The water retention curve was obtained using axis translation technique with pressure plate supported with 15 bar ceramic disc following ASTM D6838-02 [28]. The laboratory data best-fit line was fitted using the Fredlund and Xing equation [29]. The water retention curve and the fitting parameter can be seen in Figure 1. The saturated volumetric water content, the air-entry value, the residual suction and the residual volumetric water content of the sand specimen are 0.5, 7 kPa, 40 kPa and 0.05, respectively.
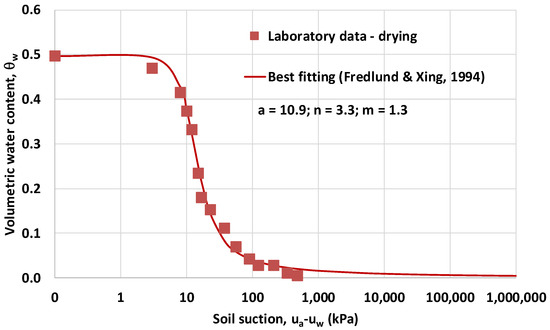
Figure 1.
Water retention curve for sand.
The saturated permeability, ks (5.78 × 10⁻⁶ m/s as shown in Table 1) was determined using a constant head laboratory method [30,31]. This is a lower permeability compared with typical poorly graded coarse sand that can range from 10−4 to 10−5 m/s [10]. The reason for this is the higher percentage of plastic fines contained in the sands of 31%. The unsaturated permeability of the sand specimen (Figure 2) was determined using statistical model following procedure presented in Satyanaga et al. [32]. The results from the oedometer test is presented in Figure 3. As the soil is hydraulically filled, the over consolidation ratio is assumed to be 1. The initial void ratio is calculated to be 0.96. The lambda (λ) and Kappa (κ) are 0.0165 and 0.0026, respectively based on the formulas shown in Equations (1) and (2).
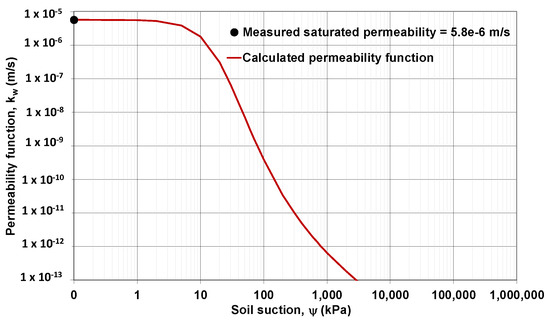
Figure 2.
Permeability function of sand.
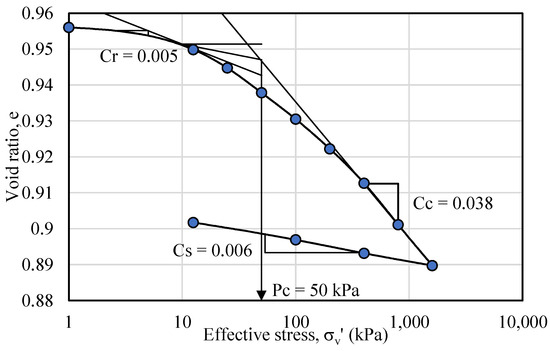
Figure 3.
Consolidation curve from Oedometer testing for soil under saturated condition.
In Equations (1) and (2), cc is defined as compression index whereas cs is defined as swelling index. In Sigma/W, it is possible to simulate the variations in the Young modulus (E′) as a function of effective stress using the elastic-plastic model (w/PWP Change) [18]. The Young modulus for incorporation in Sigma/W (under effective stress material model Elastic-Plastic) was obtained by first determining the coefficient of compressibility (mv) from the oedometer test to determine the constrained modulus (Eoed) (Equation (3)).
In Equation (3), mv is defined as coefficient of compressibility. From the Eoed, E′ can be calculated using Equation (4).
One set of the saturated oedometer testing with soil suction equals to 0 (Figure 3) and three sets of the unsaturated oedometer testing under three different soil suctions (7 kPa, 17 kPa and 42 kPa) were performed on the sand specimen. For the saturated oedometer test result, the effective stress is simply calculated from the applied load (σv) on each loading step. Based on the unsaturated oedometer test results, the effective stress is calculated as the applied load plus the applied soil suction. A spline function is then used to represent (best fit) the four oedometer test results as shown in Figure 4. Consolidated undrained triaxial test with pore-water pressure measurement was conducted to determine the shear strength parameters of the soil. Based on the triaxial test results, the effective cohesion (c’) is 0 kPa and the effective friction angle (φ’) is 34°.
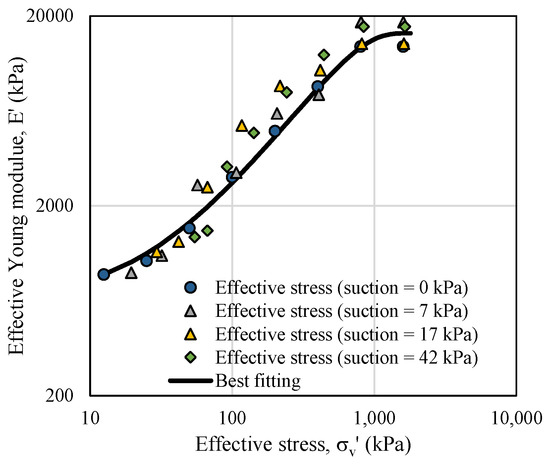
Figure 4.
Change in Young Modulus (E′) due to the change in effective stress.
3. Method of Analyses
The numerical analyses in this study consist of 1-D consolidation and 2-D consolidation analyses using Sigma/W, seepage analyses using Seep/W and slope stability analyses using Slope/W [33,34]. Sigma/W is a finite element software for analyzing deformation of soils whereas Slope/w is a limit equilibrium software for analyzing stability of slope. The finite element mesh had a mesh size of approximately 0.01 m in order to obtain accurate results from deformation and transient seepage analyses. The pore-water pressures variations from Seep/W were exported to Slope/w to obtain factor of safety for every time increment in the analyses. The pore-water pressures were calculated in Seep/W for every time step at each node of the finite element mesh.
1-D (coupled stress) consolidation analyses were conducted to calibrate the numerical model and parameters before proceeding with 2-D analyses; to estimate the settlement and the rate of consolidation due to the dissipation of excess pore-water pressure and due to the generation of soil suction; and to determine appropriate filling rate. Three sets of parametric studies were carried based on 1-D analyses as summarized in Table 2. The modified cam clay model was selected in the analyses since it can simulate the actual nonlinear stress-strain behavior of the soil [35].
Table 2.
Parametric studies carried out based on 1-D analyses.
In the beginning of the unsaturated analyses in Cases 1 and 2, the placement of the filling materials generated the excess pore-water pressures. As the water flowed to the in-situ soil materials, the pore-water pressure dissipated and slowly became negative as the top of fill material was located above the ground water table which is assumed to be at the ground level. The settlement was then contributed due to consolidation settlement (when the excess pore-pressure dissipated to 0 kPa) and shrinkage settlement (when the pore-water pressure goes below 0 kPa). In Sigma/W, both consolidation and shrinkage settlement were calculated based on effective stress principle. The saturated analysis in case 3 was carried out to understand the contribution of soil suction in determining the rate of settlement of the filling materials.
The numerical model only allowed instantaneous placement of filling materials. Therefore, the road pillar model (51 m high) was divided into 10 layers to understand the characteristics of pore-water pressure changes with time for every 5 m filling materials. Two different scenarios were used to determine the time step for every 5 m filling materials. In the first scenario, 1 day was required to complete every 5 m filling process except it is required 10 days for the last filling process. In the second scenario, every 5 m filling materials were consolidated until the pore-water pressure reached hydrostatic condition. Settlement analyses were carried out by first obtaining the settlement at the node located at the top of the filling materials at each stage. The total settlement is equal to the summation of the settlement obtained from the top node at each filling stage (the settlement of the node after the next filling stage was ignored).
The 2-D deformation and stability analyses were conducted with the following objectives: to investigate the effect of slope angle on the settlement of the road pillar and to analyse the stability of the road pillar under different slope angle. The width of the crest of the road pillar is maintained at 63 m for different inclinations of road pillar. This study focuses on the construction of road pillar with the following slope angles: 25°and 30°. For both geometries, the stability analyses were performed with the assumption of the presences of tailing materials at one side of the road pillar.
4. One Dimensional (1-D) Numerical Analyses
The soil model was divided into 11 regions. The first region represented the in-situ soil material while the other 10 regions represented the filling materials. Every region had 5 m height except the last region had 6 m height. Thus, the total height of the filling materials was 51 m as shown in Figure 5a. The filling materials were placed in stages, on top of each other and the whole soil column was constrained laterally at the side while it was fixed at the bottom. The in-situ soil consists of gravel layer with Young modulus (E′) equal to 200 MPa as obtained from Oedometer testing data [24] and high permeability. Therefore, no excess pore-water pressure was generated in the in-situ soil.
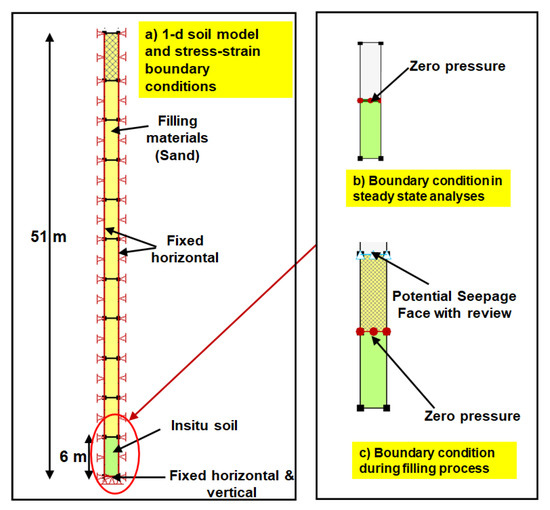
Figure 5.
Soil model and boundary condition.
Steady state condition was first generated using Seep/W based on steady state analyses. In the steady state analyses, zero pressure boundary condition (pressure head equals to 0 kPa) was simulated at the top of the in-situ soil (Figure 5b). Afterward, in-situ analyses in Sigma/W were conducted to generate the initial stress of the in-situ soil. Coupled stress analysis was conducted using Sigma/W to simulate the hydraulic filling process. As the hydraulic boundary condition, potential seepage face with review (to simulate the runoff on the surface of the soil) the was applied at the top of the soil layer while zero pressure was applied at the top of the in-situ soil as shown in Figure 5c. In the saturated analyses under case 3, the hydraulic boundary condition for steady state analyses was the same as the unsaturated analyses in cases 1 and 2. However, zero pressure boundary condition was applied at the top of the filling material (instead of seepage review) and at the top of the in-situ soil during the filling stage.
In numerical analyses of case 1, a 1-day time step was applied on the simulation of each fill layer while 10- day time steps was applied on the simulation of the last fill layer. This is to ensure that the total settlement has reached equilibrium condition. The total settlement of the entire fill materials at each step is shown in Figure 6. It is shown that at the end of the filling stage, the settlement is 2.68 m with the final distribution of pore-water pressure is shown in Figure 7. It can be seen that the excess pore-water pressure near the surface (within 40–50 m) has dissipated quickly since the negative pore-water pressure was developed within this layer due to the flow of water into the deeper layer.
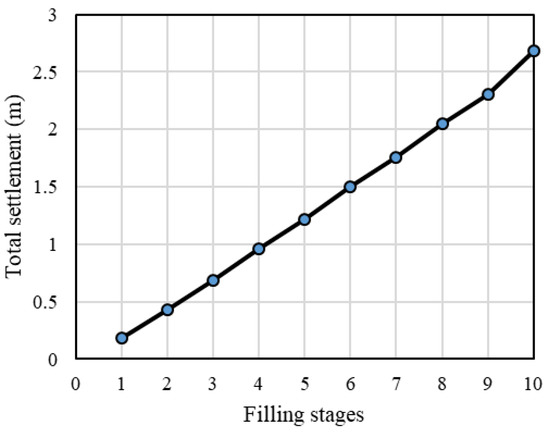
Figure 6.
Total settlement of the fill materials for case 1.
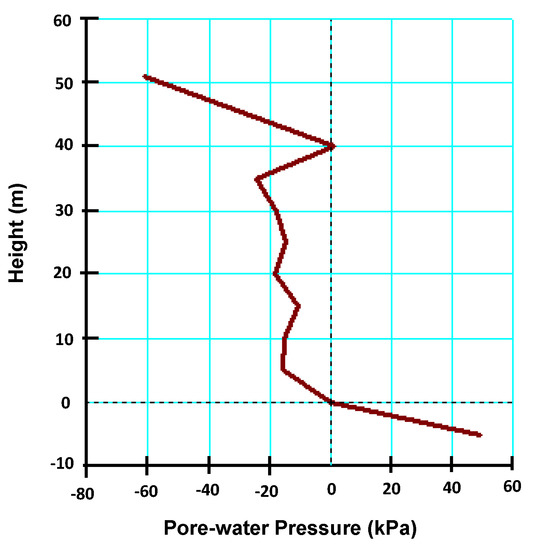
Figure 7.
Final distribution of pore-water pressure at the last filling stage for case 1.
Numerical analysis in case 2 was carried out to determine the required time for the negative pore-water pressure to reach the equilibrium condition. The node under scrutiny is the top node of the fill as this node has the highest negative pore-water pressure. The degree of consolidation (Uz) is commonly used to determine appropriate time to determine when the consolidation has been completed (Equation (5)).
where Δu0 is the initial excess pore-water pressure due to the applied load, Δuw is the current excess pore-water pressure. The applied load always caused the pore-water pressure at the top node to reach zero and then slowly went to pore-water pressure at equilibrium/hydrostatic condition (ueq) (Equation (6)).
where GWL was the ground water level which was set to zero in the numerical model and γw is the unit weight of water (9.81 kN/m3). Δu0 was defined for the node located at the top of the fill (Equation (7)). Δuw can be defined using Equation (8).
where u0 is the pore-water pressure after application of load which was always equals to zero for the top node while uw is the pore-water pressure for the node which was changing with time.
Figure 8 shows the example of changes in pore-water pressure of the top node on different filling stage. It can be seen that a reasonable waiting time can be achieved for 0–5 m fill (95 days to reach Uz = 95%) and 5–10 m fill (2.5 years to reach Uz = 95%). However, for 10–15 m fill, it required 10 years to reach Uz = 80% and 32 years to reach Uz = 95%. At the final fill layer (45–51 m), it requires 1600 years to reach Uz = 80% and 3400 years to reach Uz = 95%. Based on this analysis, it was not reasonable to wait for the pore-water pressure to reach equilibrium prior to applying the next load.
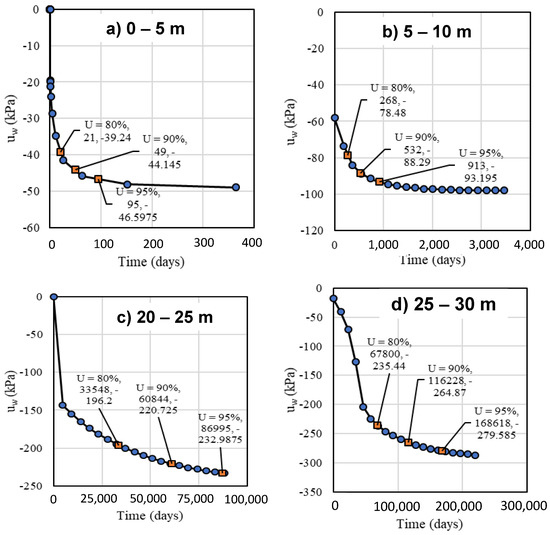
Figure 8.
Time required for the negative pore-water pressure to reach equilibrium in each filling stage.
The settlement from case 2 can be considered as the final total settlement, the average degree of consolidation (Uave) can be calculated using Equation (9).
where scase1 is the total settlement at case 1 while scase2 is the total settlement at case 2. The Uave of case 1 is 85%.
In order to fully dissipate all excess pore-water pressures, every filling stage duration in case 3 was extended for two days. Figure 9 shows the comparison of total settlement between cases 1, 2 and case 3. It can be seen that case 3 has the least settlement due to ignoring the effect of negative pore-water pressure which contributing to the additional settlement. The comparisons of analyses time for cases 1, 2 and 3 are presented in Table 3. Based on the three simulation results from 1-D consolidation analyses, the model used in the unsaturated analyses of case 1 was used in 2-D numerical analysis. In addition, the filling stage was decided to be 5 m/stage with every stage being completed in 1 day.
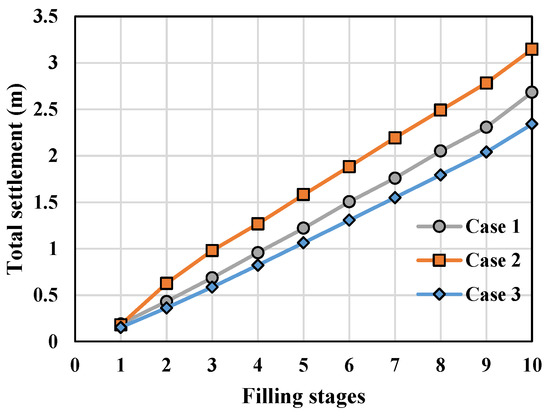
Figure 9.
Comparison of total settlement from analyses of case 1, case 2 and case 3.
Table 3.
Analyses time for each stage in Case 1, Case 2 and Case 3.
2-D Numerical Analysis
Figure 10 shows the 2-D finite element model of the road pillar. Stability analysis of the 2-D model was carried using simplified Bishop model in Slope/W. No tension crack was considered, and the slip surface was determined based on grid and radius method [11]. The results of the consolidation and stability analyses of the road pillar with different inclinations are presented in this section. The slope stability analysis was carried out for every time step to consider the effect of PWP dissipation in the stability of the fill layer. This analysis models the road pillar in both X and Z directions and seepage can flow in two directions, vertically and laterally. For each of the three geometries, three scenarios were considered in the 2-D stability analyses. In scenario 1, the stability analyses were carried out to investigate the stability of road pillar only. In scenario 2, the stability analyses were conducted to study the stability of road pillar with the assumption of the presences of tailing materials at one side of the road pillar. In scenario 3, the stability analyses were performed to investigate the stability of road pillar with the assumption of the presence of 4.5 m high of water at one side of the road pillar. The numerical models for scenario 1, scenario 2 and scenario 3 are presented in Figure 10.
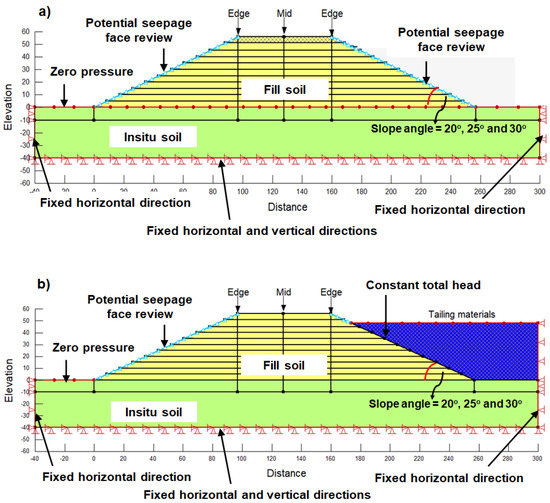
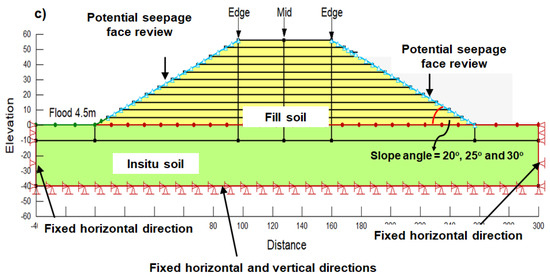
Figure 10.
2-D finite element model for analyses of (a) scenario 1; (b) scenario 2 and (c) scenario 3.
Consolidation settlements at the midpoint and edge of the model based on scenario 1 (Figure 10a) were compared with the results from the 1-D consolidation analyses. The finite element model was separated into the in-situ soil and the filling material. The filling material soil was separated into 11 regions which are 0–5 m, 5–10 m, 10–15 m, 15–20 m, 20-25 m, 25–30 m, 30–35 m, 35–40 m, 40–45 m, 45–51 m and 51–56 m. The soil model and properties of in-situ soil and fill soil followed those used as input in 1-D consolidation analysis of case 1. Every filling layer was consolidated for 1 day with 10 time steps and 2.4 h for each step. The in-situ soil was fixed at horizontal and vertical directions as shown in Figure 10. The zero pressure boundary condition was applied at the interface between the in-situ soil and the fill soil while the potential seepage face with review was applied at the slope surface of the fill layer as shown in Figure 10.
The total settlement at the end of the construction located at the edge and the mid of the crest for the three geometries are summarized in Table 4. The results present that the differential settlement is around ±0.01m for all cases. The settlement at the middle and the edge of the crest of the fill layer for the three geometries were compared with the one from 1-D analysis as shown in Figure 11. The results of the 1-D and 2-D consolidation settlement analyses are comparable as they follow similar trends. In addition, all the final pore-water pressures at the middle of the model at the end of stage 11 or after 56 m filling have become negative for all geometries (Figure 12).
Table 4.
Summary of the total settlement from 2-D numerical analyses.
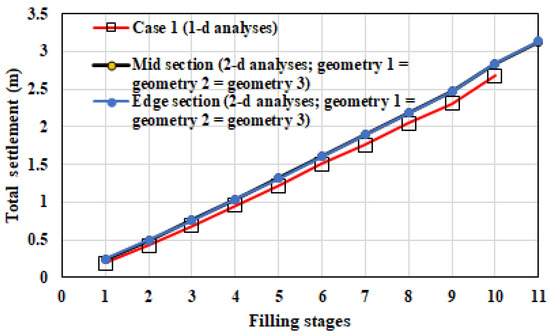
Figure 11.
Comparisons of total settlement from 1-d analyses (based on Case 1) and 2-d analyses (based on three different geometries).
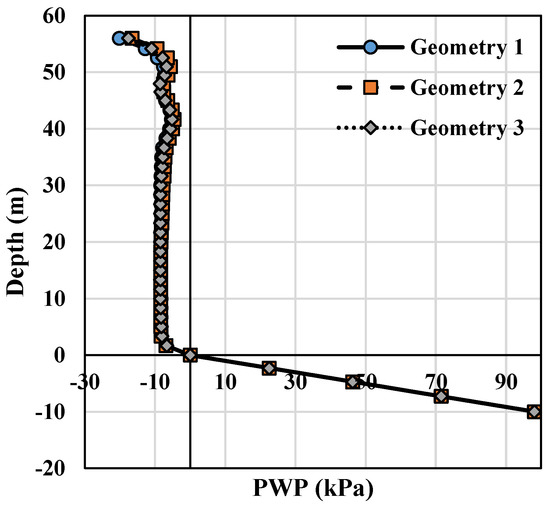
Figure 12.
Pore-water pressure profiles at the end of stage 11 for geometry 1, geometry 2 and geometry 3.
The results from stability analyses of scenario 1 are presented in Figure 13. It is shown that the critical condition is observed when the fill layer has just been placed. As the pore-water pressure dissipated, the factor of safety slowly increases. It is shown that geometry 3 has lower factor of safety compare to other geometries. The lowest factor of safety is observed when the first fill is just placed (0–5 m) with factor of safety = 1.15. The factor of safety increases to 1.73 within 2.4 h. For the rest of the simulations, all factor of safety values are higher than 1.3. The final factor of safety of the road pillar is 1.344 which considered to be the minimum in terms of the design acceptance criteria [36].
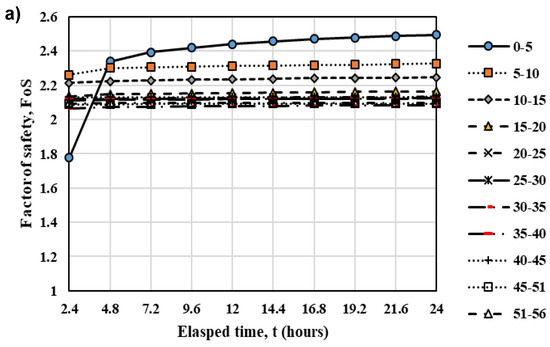
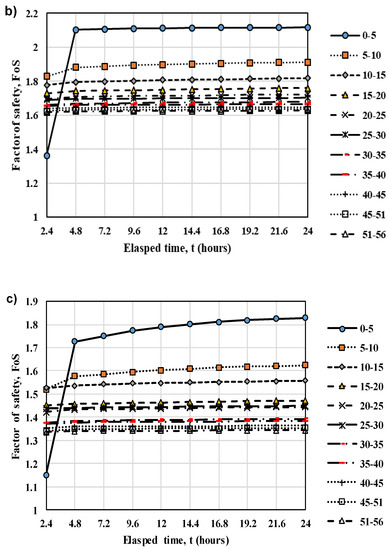
Figure 13.
Variations of factor of safety with time based on stability analyses of scenario 1 for (a) geometry 1; (b) geometry 2 and (c) geometry 3.
In the stability analyses of scenario 2, the tailing sediment was assumed to be present at one side of the embankment. Given that the tailing material was assumed the same as the road pillar material, the tailing material was considered to be instantaneously placed at one side of the road pillar and then consolidated for 1 year based on 12 time steps. Constant total head was applied at the boundary between road pillar and tailing materials to model the groundwater table in the numerical analysis (Figure 10). The stability of the opposite side of road pillar is checked using the same method used for checking the stability of 56 m of road pillar only. In this model, the pore-water pressure of the tailing sediment can be negative as shown in Figure 14. Essentially, the backfilled tailings is allowed to dewater and therefore both the road pillar and the tailings becomes unsaturated. Figure 15 shows the variations in safety factor with time for scenario 2. The difference was not significant over 1 year duration and the most critical condition was generated from the stability analysis of slope with 30o slope angle with factor of safety is about 1.34 to 1.35.
Figure 14.
Distribution of pore-water pressures due to the placement of tailing material without zero pressure boundary condition applied on top of the tailing material (Approach 2).
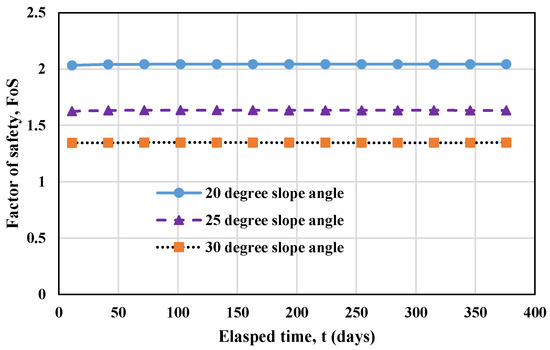
Figure 15.
Variations of factor of safety with time.
In the anticipation of climate change, the additional stability analyses under extreme rainfall conditions were carried out. A 4.5 m water flooding above the pit floor event is assumed at one side of road pillar in the model. This rainwater is sufficient to model a 1% annual exceedance probability (AEP) 72 h rainfall event (421 mm of rainfall) on a slope of 5% with a bund at the toe and 100% runoff coefficient [24]. A constant total head of 4.5 m is applied at one side of the road pillar over 1 year duration. Figure 16 shows the variations in factor of safety based on the stability analyses for Scenario 3. Geometry 3 (30° slope angle) shows the most critical condition which has a factor of safety around 1.35.
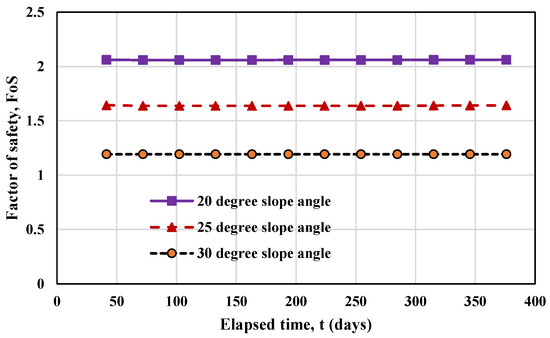
Figure 16.
Variations of factor of safety with time based on stability analyses for scenario 3.
Based on the numerical analyses results, it is shown that ignoring the effect of negative pore-water pressure will underestimate the settlement of the fill materials. However, it is not reasonable to wait for the entire pore-water pressures to reach equilibrium since it took a very long time (>6000 years). In addition, based on case 1 simulation, 1 day waiting time for each of the filling stage was sufficient for the degree of consolidation to reach 85% and thus the model based on case 1 was recommended. The filling of 51 m contributes to a total settlement of 3.1 m. Hence, the final elevation of the road pillar based on 1-D analyses is 51 − 3.1 m = 47.9 m.
The results from stability analyses indicate that the incorporation of unsaturated soil properties help to optimize the design of slope. The slope still has high factor of safety although the inclination is increased to 30° slope angle which has been evaluated under three different conditions, without rainfall and tailing sediment, with tailing sediments and with rainfall loading. The lowest factor of safety of slope with 30° slope angle is around 1.35 under maximum rainfall loading.
It can be seen the factor of safety of 30° slope angle (1.35) in Figure 16 is lower than that from Figure 13c (1.82). The factor of safety of of 25° slope angle (1.70) in Figure 16 is lower than that from Figure 13b (2.13). The factor of safety of of 20° slope angle (2.10) in Figure 16 is lower than that from Figure 13b (2.50). The comparisons of factor of safety between Figure 13 and Figure 16 indicate the importance of maintaining the unsaturated conditions of the slope. If there is potential of flooding next to the road pillar, it is recommended to provide the appropriate drainage within the structure itself, such as: horizontal drains; geodrain and surface drain to ensure the water can be drained out properly in the case flooding occur due to the effect of climate change.
5. Conclusions
The key conclusions can be summarized as follows:
- Laboratory testing has shown that the coarse sand tailings has a 34% (by mass) of medium plastic fines (<0.075 mm), This is higher than conventional coarse sand tailings and has resulted in the sand having a lower permeability and lower shear strength then normal poorly graded coarse sand.
- Numerical consolidation modelling using both 1-D and 2-D showed that despite the higher fines content, the hydraulically deposited coarse sand tailings will be able to consolidate very rapidly and that a degree of consolidation of 85% is achievable within days. The results from numerical analyses also indicated that it is important to incorporate the unsaturated soil mechanics principles in the consolidation analyses. The ignorance of the unsaturated soil mechanics principles will generate less settlement in the consolidation analyses.
- In terms of the stability modelling, the minimum FOS for embankment slope angles up to and including 30° is 1.35. This value is higher than minimum factor of safety of 1. It shows that the hydraulically placed method to stack the fill materials in the road pillars naturally can achieve a higher slope angle if the unsaturated soil properties is included in the analyses.
- The appropriate drainage should be provided within the embankment to maintain the unsaturated condition and to ensure the stability of the embankment under heavy rainfall loadings.
Author Contributions
A.S., S.-W.M. and J.R.K. conceptualized the study; A.S., M.W. and Q.Z. implemented data processing under the supervision of J.R.K. and S.-W.M.; the original draft of the manuscript was written by A.S., M.W. and Q.Z. with editorial contributions from S.-W.M., J.P. and J.R.K.; the funding acquisition was made by J.R.K. All authors have read and agreed to the published version of the manuscript.
Funding
This research was funded by Nazarbayev University, grant number SOE2017004. The authors are grateful for this support. Any opinions, findings, and conclusions or recommendations expressed in this material are those of the author(s) and do not necessarily reflect the views of the Nazarbayev University.
Acknowledgments
The Authors would like to express sincere gratitude for the tremendous advice from Harianto Rahardjo and outstanding assistance from Ken Mercer for the opportunity to obtain the experimental data for the study.
Conflicts of Interest
The authors declare no conflict of interest.
References
- Liu, R.; Liu, J.; Zhang, Z.; Borthwick, A.; Zhang, K. Accidental water pollution risk analysis of mine tailings ponds in Guanting reservoir Watershed, Zhangjiakou city, China. Int. J. Environ. Res. Public Health 2015, 12, 15269–15284. [Google Scholar] [CrossRef] [PubMed]
- Vogel, A. Failures of dams—Challenges to the present and the future. In IABSE Symposium Report; International Association for Bridge and Structural Engineering: Zürich, Switzerland, 2013; pp. 178–185. [Google Scholar] [CrossRef]
- Azam, S.; Li, Q. Tailings dam failures: A review of the last one hundred years. Geotech. News 2010, 28, 50–54. [Google Scholar]
- Rico, M.; Benito, G.; Salgueiro, A.R.; Díez-Herrero, A.; Pereira, H.G. Reported tailings dam failures: A review of the European incidents in the worldwide context. J. Hazard Mater. 2008, 152, 846–852. [Google Scholar] [CrossRef] [PubMed]
- Glotov, V.E.; Chlachula, J.; Glotova, L.P.; Little, E. Causes and environmental impact of the gold-tailings dam failure at Karamken, the Russian Far East. Eng. Geol. 2018, 245, 236–247. [Google Scholar] [CrossRef]
- Cambridge, M.; Shaw, D. Preliminary reflections on the failure of the Brumadinho tailings dam in January 2019. Dams Reserv. 2019, 29, 13–123. [Google Scholar] [CrossRef]
- Villavicencio, G.; Espinace, R.; Palma, J.; Fourie, A.; Valenzuela, L. Failures of sand tailings dams in a highly seismic country. Can. Geotech. J. 2014, 51, 449–464. [Google Scholar] [CrossRef]
- Wei, Z.; Yin, G.; Wang, J.; Wan, L.; Li, G. Design, construction and management of tailings storage facilities for surface disposal in China: Case studies of failures. J. Waste Manag. Res. 2013, 31, 106–112. [Google Scholar] [CrossRef]
- Chen, R.; Ding, X.; Ramey, D.; Lee, I.; Zhang, L. Experimental and numerical investigation into surface strength of mine tailings after biopolymer stabilization. Acta Geotech. 2016, 11, 1075–1085. [Google Scholar] [CrossRef]
- Holtz, R.D.; Kovacs, W.D.; Sheahan, T.C. An Introduction to Geotechnical Engineering; Pearson: New York, NY, USA, 2011; p. 864. ISBN 9780132496346. [Google Scholar]
- Satyanaga, A.; Rahardjo, H.; Hua, C.J. Numerical simulation of capillary barrier system under rainfall infiltration. ISSMGE Int. J. Geoengin. Case Hist. 2019, 5, 43–54. [Google Scholar] [CrossRef]
- Fredlund, D.G.; Rahardjo, H. Soil Mechanics for Unsaturated Soil; John Wiley: New York, NY, USA, 1993; p. 517. [Google Scholar] [CrossRef]
- Rahardjo, H.; Kim, Y.; Gofar, N.; Satyanaga, A. Analyses and design of steep slope with GeoBarrier System under heavy rainfall. Geotext. Geomembr. 2020, 48, 157–169. [Google Scholar] [CrossRef]
- Pu, J.H.; Wallwork, J.T.; Khan, M.A.; Pandey, M.; Pourshahbaz, H.; Satyanaga, A.; Hanmaiahgari, P.R.; Gough, T. Flood suspended sediment transport: Combined modelling from dilute to hyper-concentrated flow. Water 2021, 13, 379. [Google Scholar] [CrossRef]
- Pu, J.H.; Hussain, K.; Shao, S.-D.; Huang, Y.-F. Shallow sediment transport flow computation using time-varying sediment adaptation length. Int. J. Sediment Res. 2014, 29, 171–183. [Google Scholar] [CrossRef][Green Version]
- Pu, J.H.; Huang, Y.; Shao, S.; Hussain, K. Three-gorges dam fine sediment pollutant transport: Turbulence SPH model simulation of multi-fluid flows. J. Appl. Fluid Mech. 2016, 9, 1–10. [Google Scholar] [CrossRef]
- Liu, K.; Yin, J.H.; Chen, W.B.; Feng, W.Q.; Zhou, C. The stress–strain behaviour and critical state parameters of an unsaturated granular fill material under different suctions. Acta Geotech. 2020, 15, 3383–3398. [Google Scholar] [CrossRef]
- Rodríguez, R.; Muñoz-Moreno, A.; Caparrós, A.V.; García-García, C.; Brime-Barrios, A.; Arranz-González, J.C.; Rodríguez-Gómez, V.; Fernández-Naranjo, F.J.; Alcolea, A. How to prevent flow failures in tailings dams. Mine Water Environ. 2021, 40, 83–112. [Google Scholar] [CrossRef]
- Ito, M.; Azam, S. Large-strain consolidation modeling of mine waste tailings. Environ. Syst. Res. 2013, 2, 7. [Google Scholar] [CrossRef]
- Rahardjo, H.; Kim, Y.; Satyanaga, A. Role of unsaturated soil mechanics in geotechnical engineering. Int. J. Geo-Eng. 2019, 10, 1–23. [Google Scholar] [CrossRef]
- Satyanaga, A.; Rahardjo, H. Role of unsaturated soil properties in the development of slope susceptibility map. Proc. Inst. Civ. Eng. Geotech. Eng. 2020. [Google Scholar] [CrossRef]
- Rahardjo, H.; Satyanaga, A.; Leong, E.C.; Ng, Y.S.; Foo, M.D.; Wang, C.L. Slope failures in Singapore due to rainfall. In Proceedings of the 10th Australia New Zealand Conference on Geomechanics “Common Ground”, Brisbane, Australia, 21–24 October 2007; Volume 2, pp. 704–709. [Google Scholar]
- Rahardjo, H.; Satyanaga, A.; Harnas, F.R.; Leong, E.C. Use of dual capillary barrier as cover system for a sanitary landfill in Singapore. Indian Geotech. J. 2016, 46, 228–238. [Google Scholar] [CrossRef]
- Kalbar Resources Ltd. Evaluation of the Stability and Consolidation of Hydraulically Placed Coarse Sand Tailings Road Pillars; Kalbar Resources Ltd.: Bairnsdale, Australia, 2020; p. 69. [Google Scholar]
- ASTM D2487-17. Standard Practice for Classification of Soils for Engineering Purposes (Unified Soil Classification System); ASTM International: West Conshohocken, PA, USA, 2017. [Google Scholar]
- ASTM D4254-16. Standard Test Methods for Minimum Index Density and Unit Weight of Soils and Calculation of Relative Density; ASTM International: West Conshohocken, PA, USA, 2016. [Google Scholar]
- ASTM D4253-00. Standard Test Methods for Maximum Index Density and Unit Weight of Soils Using a Vibratory Table; ASTM International: West Conshohocken, PA, USA, 2006. [Google Scholar]
- ASTM D6838-02. Standard Test Methods for the Soil-Water Characteristic Curve for Desorption Using Hanging Column, Pressure Extractor, Chilled Mirror Hygrometer, or Centrifuge; ASTM International: West Conshohocken, PA, USA, 2008. [Google Scholar]
- Rahardjo, H.; Satyanaga, A.; Mohamed, H.; Ip, S.C.Y.; Rishi, S.S. Comparison of soil-water characteristic curves from conventional testing and combination of small-scale centrifuge and dew point methods. J. Geotech. Geol. Eng. 2019, 37, 659–672. [Google Scholar] [CrossRef]
- Head, K.H. Manual of Soil Laboratory Testing; Pentech Press: London, UK, 1986. [Google Scholar]
- Zhai, Q.; Rahardjo, H.; Satyanaga, A. A pore-size distribution function based method for estimation of hydraulic properties of sandy soils. Eng. Geol. 2018, 246, 288–292. [Google Scholar] [CrossRef]
- Satyanaga, A.; Rahardjo, H.; Koh, Z.H.; Mohamed, H. Measurement of a soil-water characteristic curve and unsaturated permeability using the evaporation method and the chilled-mirror method. J. Zhejiang Univ. Sci. A 2019, 20, 368–375. [Google Scholar] [CrossRef]
- Paul, S.; Oppelstrup, J.; Thunvik, R.; Magero, J.M.; Ddumba Walakira, D.; Cvetkovic, V. Bathymetry development and flow analyses using two-dimensional numerical modeling approach for Lake Victoria. Fluids 2019, 4, 182. [Google Scholar] [CrossRef]
- Liu, E.; Yu, H.S.; Deng, G.; Zhang, J.; He, S. Numerical analysis of seepage–deformation in unsaturated soils. Acta Geotech. 2014, 9, 1045–1058. [Google Scholar] [CrossRef]
- Qubain, B.S.; Li, J.; Change, K.E. Coupled consolidation analysis of field instrumented preloading program. J. Geotech. Geonvironmental Eng. 2014, 140, 04013048. [Google Scholar] [CrossRef]
- Department of Transport and Main Roads, Queensland, Australia. Manual for Geotechnical Design Standard—Minimum Requirements; Department of Transport and Main Roads: Queensland, Australia, 2020; p. 44.


Publisher’s Note: MDPI stays neutral with regard to jurisdictional claims in published maps and institutional affiliations. |
© 2021 by the authors. Licensee MDPI, Basel, Switzerland. This article is an open access article distributed under the terms and conditions of the Creative Commons Attribution (CC BY) license (https://creativecommons.org/licenses/by/4.0/).