


Abstract
This research-related study examines the relevance of mud pulse telemetry (MPT) systems and their intersection with drilling performance, focusing on data transmission signal propagation performance and overall operation under different drilling parameters conditions, with an additional focus on drilling fluid flow rate and downhole pressure conditions. The novelty of this study lies in the investigation of adjustments to drilling operating parameters that could potentially improve the transmission of telemetry signals during drilling, in real time, without requiring mechanical or functional modifications to the MPT system itself. Improvements on transmission performance in situations where the data rate may be limited are also addressed, presenting an alternative through possible propagation velocity improvements to counterbalance it. A detailed chronological technical scientific literature review details important parts on analyses of pressure pulse propagation velocities focused on data transmission. A systematic experimental approach was developed and put into practice to evaluate the MPT systems in regard to tendencies on transmission performances, emphasizing pressure pulse propagation velocity. The laboratory-scale experiments were conducted at the Institute of Drilling Engineering and Fluid Mining (IBF) from the Technical University Bergakademie Freiberg (TUBAF), namely the Flow-loop Research Facility, to assess the impact of fluid flow rate (and subsequent pressure) on data transmission efficiency. Experimental results demonstrate that increasing the flow rate significantly speeds up signal propagation. In the performed experiments, for the mud siren configuration, increasing the flow rate from 15 to 25 m3/h improved the data transmission performance by approximately, at minimum, 18%, while for the positive mud pulse system, an increase in flow rate from 11.5 to 14 m3/h resulted in a propagation velocity rise of about 19%. The results also showed that higher concentrations of glycerin in the working fluid reduced the propagation velocity, confirming the influence of the fluid’s rheological properties on telemetry performance. At the end, in the presented case study, for 6 bps data rate configurations and for a transmission of a 40-bit string, it was demonstrated that the propagation time from downhole to the surface could potentially represent approximately 40% of the total time demanded for transmitting the desired information (generation plus propagation time). It was verified that an increment of 0.02208 m3/s (350 gpm) could lead to shortening eventual surveying procedures by 1–2 s, and that it could equally represent 1.137 bps. This is a relevant outcome, since, without any physical or functional alteration to the MPT system, one could have the data transmission performance improved, an approach not yet analyzed in the literature nor at the industrial park. These results, added to the detailed literature investigation and interaction with field personnel, indicate that the drilling fluid flow rate is a critical operational parameter affecting both the telemetry signal transmission speed and the overall drilling efficiency. Increasing the flow rate can reduce survey transmission time and decrease operational exposure to drilling hazards, such as drill string sticking. The results provide quantitative information applicable in optimizing measurement-drilling telemetry and help support the development of integrated drilling optimization strategies that balance drilling performance with real-time data transmission assurance in deep drilling operations.
1. Contextualization
Considering the economic and technological development in a global perspective, as well as the population growth rate experienced over recent decades, oil and gas will still be in demand for the next few years as a consequence of energy demand increase, even if they are continuously losing protagonismus as a primary source of energy. However, continued oil and gas exploitation in previous decades has led to the depletion of some accessible conventional reserves [1]. These facts have driven the petroleum industry to explore challenging environments and accumulations bound to complex formations, including some unconventional ones, and deep environments, among others, requiring more caution and consistent monitoring/controlling of well construction [2,3].
Currently, the drilling process is responsible for one of the largest costs in the exploration and development of hydrocarbon-related reservoirs [4,5], which face several challenges [6,7,8,9]. Some similarities have been observed in activities involving geothermal systems and natural hydrogen accumulations, where drilling remains significantly costly, emphasizing the importance for improvements of operational efficiency through new methods, techniques and/or field applicable technologies. Recent studies on green hydrogen production in Brazil highlight the role of energy infrastructure planning, resource availability, and process optimization; these factors may also intersect with concerns to subsurface-related activities [10,11].
In the context of subsurface operations, data transmission technologies are a must, and high-downhole transmission data rates [12,13] have been gaining importance, also considering the continuous and growing reach of deeper geo-energy systems. Thus, improvements in real-time data transmission technologies became even more crucial for well drilling, which support safer and proper operation while making real-time decisions also for drilling optimization and automation more practically feasible [4,14]. To date, real-time information/data that are transmitted from downhole to the surface, while drilling for well construction activities, have as a source two main well-industry-known systems: (a) measurement while drilling (MWD); and (b) logging while drilling (LWD).
The MWD system (or tools) can be set up and arranged for measuring several data, including downhole tools status, in situ direction and inclination, downhole pressure/temperature [15], downhole weight-on-bit (DWOB), downhole torque (DTOR), and downhole drill string rotary speed (also known as collar rotary speed, CRPM), among others, and is the main responsible for providing downhole power in some cases and for transmitting the MWD/LWD-gathered information to the surface (telemetry data transmission). Likewise, the LWD systems are aimed at measuring geological formation details (e.g., geomechanical/petrophysical information) and trapped fluid information and some other relevant particulars [15,16]. MWD/LWD are crucial tools for a safe and efficient drilling process [17,18], enabling accuracy while drilling and eventual operational improvements, as well as overall operating time management [1].
Currently, telemetry data transmission technologies in the MWD systems can be grouped into (a) wireless and (b) wired systems [1,19,20]. Wired telemetry systems are commonly drill strings equipped with data transmission lines and eventually integrated sensors, enabling cabled real-time communication along the drill string [1,12,20]. The wireless data transmission methods are commonly divided into three main groups: mud pulse telemetry (MPT), electromagnetic telemetry (EMT), and acoustic telemetry (AT) [1,12,20]. Wired telemetry systems are still considered an innovative technology that can provide high-speed transmission with high data rate in terms of bits transmitted per second; however, its use is limited due to the need for special drill strings (expensive and not available everywhere), high maintenance costs, operational limitations, and eventual short service life [1,15,20,21]. In contrast, wireless telemetry systems are an efficient method which is cost-effective and easier to operate but still may present some fragilities in deep and complex drilling environments, as well as a lower capacity in terms of data transmission rate when compared to wired telemetry systems [3,22,23].
Exploration and effective drilling activities have long acknowledged the need for in-time downhole information available at the surface for real-time decision making [4]. In addition to supporting increasing drilling efficiency, it significantly contributes to reducing response time to unexpected downhole events [4,20] and is essential for operational safety. In these contexts, this paper aims to investigate the influence of drilling fluid flow rate on mud pulse telemetry data transmission, focusing on information reliability by means of effective mud pulse (waves) propagation speed analyses. To achieve this objective, the paper first provides a focused review of data transmission methods and operational characteristics of MWD technologies, highlighting existing limitations and knowledge gaps related to operational drilling parameters. Subsequently, experiments were carried out at the Flow-loop Research Facility of the Institute of Drilling Engineering and Fluid Mining (IBF), TU Bergakademie Freiberg (TUBAF), in Freiberg, Germany, to quantify the effect of FLOW under controlled conditions and to evaluate its impact on signal transmission performance. It enabled the evaluation of operational parameters that may improve telemetry performance without requiring modifications to the mechanical design or function of MPT systems.
2. Data Transmission Methods and Related General Operational Features
2.1. Electromagnetic Telemetry
Electromagnetic telemetry (EMT) is a wireless method that uses electromagnetic waves to transmit data from downhole to the surface using mainly the surrounding geological formation as an intermediating medium [6]. This method has attracted some attention, since it does not depend on the drilling fluid in use, has a simpler structure in comparison to other methods with no moving parts, accommodates transmission needs when using highly aerated drilling fluids, enables data transmission during connections when pumps are off (different from mud pulse telemetry technologies, which is drilling-fluid-flow-dependent), and is suitable for underbalanced operations [6,22,24,25]. EMT also presents some important limitations [4,26,27,28,29,30]: (a) it can require batteries to supply electrical power to the downhole transmitters and eventual repeaters in use; (b) it can be vulnerable to a single repeater failure, which would stop communication entirely; and (c) it presents signal attenuation dependency on formation properties, water presence and distance (well depth), among others. From the literature, it has been recognized that EMT operates with low frequencies below 30 Hz and with transmission rates that can reach up to 100 bps (depending on the environment, formation resistivity and hardware arrangements, such as repeater systems) [4,27]. However, despite some advantages, due to certain limitations, it has not been widely used for deepwater drilling operations [28,29,31,32].
2.2. Acoustic Telemetry
Acoustic telemetry (AT) is a method that utilizes mechanically generated acoustic waves to transmit downhole data to the surface through the drill string walls [6,28]. It has been under investigation since the 1940s and, currently, it is not considered mature enough to be applied in deep drilling. It has been limited to medium depth (up to around 2500 m) [4,5,31]. Despite presenting considerable data transmission rates that can reach hundreds of bits per second, it provides a low signal-to-noise ratio (SNR) at the surface, given its susceptibility to signal attenuation also related to the drill string geometry and length itself [31,33,34]. For this reason and other details, repeaters are necessary to amplify the AT signals, intensifying system construction, maintenance complexity and costs [31,34]. In addition, the bit-rock and borehole wall interactions cause disturbances that affect data transmission [33], imposing some limitations for deep and harsh drilling environments. Specific research on AT was developed with support from the private and public sector with participation of the IBF/TUBAF (Freiberg, Germany). An AT system was developed, built and successfully tested, entitled SPWD-BUSData II [35].
2.3. Wired Drill-Pipe Telemetry
An alternative method to high-downhole data transmission rates is wired drill-pipe telemetry (WDP), which is capable of transmitting thousands of bits per second [6,28,33,36]. WDP is one of the most promising telemetry systems in today’s industry [37] and across the energy sector. High-downhole data transmission rates can improve the drilling accuracy in real time, helping to ensure a more efficient and safer operation [38]. This method was first tested in the field in 2003 and commercially applied a few years later and was impressive with its potential support in reducing drilling time, considerably expanding the quality and quantity of information available at surface while drilling [4,31,39,40,41,42,43]. Despite these facts, it requires specialized wired drill-pipes that are both costly (not available everywhere) and are susceptible to damage [28,33]. The risk of short circuits in narrow boreholes and wire breakage and abrasion-related wear [22,23,25,36,44] can potentially lead to eventual connection loss along the drill string [5], losing communication between the bottom of the well and the surface. Since such vulnerabilities can lead to non-productive time linked to necessary interventions in the operation, it has been considered still unsuitable for deep wells.
2.4. Mud Pulse Telemetry
MPT is generally the method chosen for high-tier projects (complex and usually expensive operations) [15,45], such as the operations involving the Brazilian Pre-salt. MPT does not require special changes to be made in the drill string to make itself functional [1] and can be adequately used with a wide variety of mud types [20], being somewhat dependent on the rheological properties of the drilling fluids in use, and it is not very suitable for aerated or foam-based drilling fluids. The MPT method makes use of controlled standpipe pressure variation originated at downhole to transmit information to the surface, and it can also apply signal modulation techniques, e.g., modulating amplitude, phase and frequency [4]. This system can be further categorized into three groups according to the type/form of the generated signals (pressure pulses or waves, as from the literature): negative pulse, positive pulse, and continuous pulse [12,16,46]. In an MPT system, a valve is opened or closed for a certain period of time inside the drill string (attached to the MWD tool), temporarily implying a kind of obstruction to the flow of drilling fluid from the surface to the bottom of the well, which consequently induces a standpipe pressure variation [2], which then “propagates” from the bottom of the well (from the MWD tool) to the surface and is felt at the surface by the pressure sensors.
The MPT negative pulser uses a dump valve that allows a controlled release of drilling mud from the drill string into the annulus, causing a decrease in pressure within the drill string. When the valve closes, the drill string pressure returns to its initial level. On the other hand, an MPT positive pulser uses a valve that partially restricts the drilling fluid flow area within the drill string, causing a standpipe pressure increase upstream of the pulser valve. When the pulser valve reopens (or when the restriction is removed), the drilling fluid flow cross-section area returns to its original value, so that the standpipe pressure and the one experienced by the surface pressure sensor tend to return to their original levels [2]. In an MPT continuous wave mud pulse system, a so-called mud siren is used to generate the downhole pressure waves [47]. The mud siren has a rotary valve made of a rotor and a stator, which is driven by an electric motor [15,20,47,48]. Rotation (or oscillation) causes variations in the drilling mud flow cross-section area by changing the relative position of the cross-section of a rotary/oscillatory rotor to the stator [16,20,47], ultimately generating the continuous-wave pressure signals [12,17,47].
Finally, the downhole information undergoes noise reduction and decoding, which is, at the end, used to adjust the drilling strategy in real time, and is widely used in the energy sector [12,13,42] due to its operational reliability, superior cost-effectiveness [13], and important adaptability [47]. Although providing considerable data rates in terms of transmitted bits per second, the signal strength of continuous-wave MPT systems is usually lower than positive pulse MPT types [49], and, consequently, it is more sensitive to downhole noise [16]. Drilling environments demanding lost circulation material (LCM) also limit the utilization of continuous-wave MPT systems due to its susceptibility to clogging. In general, some inconveniences seen in MPT systems are: vulnerability to interference from mud pump noise, presence of reflection noise, and signal instability with high-viscosity fluids [34,47], as well as poor performance (due to hydraulic dependence) in underbalanced drilling operations and/or those related to aerated/foam-related drilling fluids, given the presence of compressible gaseous fluids [3,25,30,31,34,50].
3. Overview of MWD Technologies Used by Service Companies
To optimize the drilling processes and ensure safer and more efficient operations, several technologies and solutions have been developed by service companies such as SLB (formerly Schlumberger), Halliburton, Baker Hughes, Weatherford, Scientific Drilling International, and NOV (formerly National Oilwell Varco), among others. These companies, among potentially other offered services and products, provide solutions involving MWD/LWD real-time well monitoring and analyses, which are essential for well construction in a general sense, well placement and real-time operational decisions [51]. MWD systems make use of accelerometers, magnetometers and gyroscopes to determine borehole inclination and azimuth during drilling operations [52], while LWD systems incorporate various sensors to measure downhole essential exploratory-related information, embracing, for instance, details on the geological formation being drilled and eventual trapped fluid information, among others (e.g., gamma rays, resistivity, formation bulk density, and pore pressure, among others) [51].
Halliburton, through its GyroSta™ Service advertisement entitled “Faster Surveys and Precise Measurements for more Accurate Well Placement”, details the technology, highlighting that Operators companies have been seeking greater speed and accuracy in terms of real-time data transmission, presenting it as a robust long-lasting solution capable of providing faster surveys [53]. The QuickPulse™ Automated Directional Gamma Service, which operates with flow rates ranging from 0.03785 m3/s to 0.07571 m3/s (600 to 1200 gpm) for 0.2159 m (8.5 in.) tools, promises a mud pulse telemetry (MPT) system with data transmission rates of up to 2 bps at depths of 4500 m and a capability for effective survey transmission from downhole to surface within 24 s [54]. The Quasar Pulse® M/LWD service is applicable to high-temperature-reservoir-related operation (up to 200 °C) [55], which makes it eventually suitable for high-temperature locations related to the Pre-salt reservoir layers in Brazil (mainly hard carbonate rocks). Finally, Halliburton’s JetPulse® is considered to be a high-data-transmission-rate technology by operating with differential pulse position modulation (DPPM); it has been able to reach up to 20 bps in specific conditions and 11 bps in a 3500 m deep field test run in Brazil [56].
Baker Hughes, through its announcement of MWD services, emphasizes how drilling environments are becoming deeper, hotter, more severe, and more complex, demanding greater reliability. Its NaviTrak HR solution, as an MPT based tool, has an integrated battery, enabling surveys to be taken with no flow (zero or minimum flow rate), making surveys possible while making the connections (saving operational time), and operates with data transmission rates of up to 6 bps [57,58]. The aXcelerate™ PLUS has been advertised as a fast MPT system combined with a wired drill-pipe (WDP) technology capable of transmitting bottom-hole data at rates of up to 40 bps without compression, working with a flow rate range of approximately 0.00946–0.05678 m3/s (150–900 gpm) [57]. The Baker’s XACT™ is an acoustic telemetry (AT) service solution and claims to be capable of functioning for a variety of depth and environmental conditions and is formation- and drilling-fluid-independent, which, among other details, ensures in-time downhole data and reliable continuous surveys [57,59]. Other solutions offered by the company include electromagnetic telemetry (EMT) and also combined MPT and EMT technologies aiming to improve the reliability and continuity of real-time information, since one system can replace the other during situations of operational constraints or even issues [57,60].
SLB, with its MWD Telescope solutions, is applicable for complex operations, including deep waters and high-temperature environments (up to 200 °C), ensuring reliable surveys and considerably high data rate transmissions from downhole to surface. The Telescope ICE OD 0.17145 m (6.75 in.) tool, indicated for high-temperature environments, operates with a flow rate of 0.01735–0.05047 m3/s (275–800 gpm) and MPT frequency of 0.5–13.5 Hz [61]. The Telescope technology in general operates with a frequency ranging from 0.5 to 24 Hz and with data transmission rates of up to 12 bps (maximum of 3 bps at 10,000 m). For the MWD Telescope, the time required for the entire bit string related to the survey information to be sent and transmitted from the bottom of the well to the surface is data-rate-dependent as follows: 69 s, 77 s or 89 s, respectively, if configured with 12 bps, 6 bps or 3 bps [61,62]. SLB also provides, among other technologies, the TrueMax solution, which combines EMT and MPT in one piece of equipment, enabling transmission at data rates of 24 and 2 bps, respectively [63].
Weatherford MWD solutions claim to be applicable in harsh operations, including wells subjected to heavy vibration, considerable LCM content, and high flow rates, among others [64]. With its EMT solutions, it guarantees continuous real-time data transmission while drilling, independent of most rig operations and drilling fluid properties [65]. It is highlighted that EMT technology was applied in the field, allowing for a saving of approximately 4 min per survey taken, totalizing approximately 5 (five) hours in a specific well [65]. The company also provides MPT solutions, such as the HeatWave® Extreme services, applicable to drilling activities in environments with temperature reaching 200 °C, and the HyperPulse™, designed to drill with LCM presence and drilling fluids with high density [65].
NOV has, as its main MWD solution driver, MPT solutions. The Teledrift ProPulse™ service makes use of positive pulses, while the Tolteq iSeries MWD technologies is based on continuous pulses, operating with up to 4 bps and having a flow rate ranging from 0.01262 to 0.07571 m3/s (200 to 1200 gpm) [66,67,68]. Scientific Drilling has EMT and MPT solutions in play. The MPT technologies use positive mud pulsers able to achieve up to 5 bps, operate with flow rate from 0.02524 to 0.09464 m3/s (400 to 1500 gpm) for 0.2413 m (9.5 in.) tools, and deliver a survey time of 18.2 s, and they can operate up to 177 °C. The EMT technologies operate with up to 0.09464 m3/s (1500 gpm) with 0.2413 m OD (9.5 in.) tools, delivering up to 14 bps and a survey time of 6.2 s [69].
The KeyDrill Hybrid EM/MP MWD system combines the mud pulse system with the electromagnetic (EM) system. This equipment operates with frequencies from 3 to 18 Hz and a data rate from 1 to 6 bps. Additionally, it can operate at temperatures from −20 to 175 °C and maximum pressures of 137.9 MPa (20,000 psi) [70]. Drill-Tek Twin EM systems enable the simultaneous operation of mud pulse and EM telemetry. In addition, it allows for flexibility in running either mud pulse or EM independently (operational needs are dependent). In relation to data transmission, the system operates at a frequency of 2 to 10 Hz and data rate up to 10 bps [71]. The Terre-Flex Multi-Channel MWD system is an intelligent MWD system that selects the best data transmission path, whether EM or mud pulse. This system can operate at frequencies ranging from 1 to 32 Hz and a data rate of 16 and 32 bps. This system is designed to withstand temperatures greater than 175 °C [72].
Bamisebi and Reich (2022) [73] investigated a new hybrid mud pulse telemetry system (HMPT) that combines mud pulser and mud sirens in different configurations. In the experiments with mud pulses and mud sirens, the results showed a possible increase in data transmission rate and the possibility of splitting the information to be transmitted. The mud siren, which enables a higher data rate, could be designated to transmit critical data, while the positive pulser could be used for sending information with a lesser update rate. The use of two sirens was also verified, enabling various transmission options with different frequencies and modulation schemes. In the series arrangement, the signals generated higher interference compared to the parallel arrangement, which was considered more suitable. In terms of structure, the series configuration showed a better form for manufacturing, whereas the parallel configuration would be more complex. Bamisebi and Reich (2025) [74] continued the investigation of HMPT through the multi-frequency mud siren concept, focusing on increasing the data transmission rate. Numerical simulations, followed by experiments in the IBF/TUBAF Flow-loop facility, showed that series and parallel configurations delivered higher signal strength than single MPT, and that, by using two mud sirens with different carrier frequencies, one would have the opportunity to double the transmitted data rate. Nevertheless, such a system has not been commercialized in the industry, and it does not focus on data propagation velocity, but on data rate.
In the context presented, it is pertinent to highlight that companies and some practical related research emphasizes that ensuring the most accurate and rapid information transmission possible is essential for decision making as well as maintaining functionality in complex and deep environments. Additionally, MWD new tendencies claim higher data rates and eventual forms to guarantee faster surveys; and the present research focuses on propagation speed improvements (agile information transmission) based on drilling parameters without mechanical or function modification to MPT systems.
In this sense, flow rate, apart from being important for assuring data transmission, also may affect the drilling performance itself by means of improving or decreasing the penetration rate. The flow rate influences jet impact force beneath the drill-bit as well as the overall differential pressure, and is detailed in the following article topic.
4. Influence of Drilling Parameter FLOW (Flow Rate) on Drillability and Data Transmission
4.1. Influence of Flow Rate on Drilling Performance
Considering the advancements of the drilling operations over recent decades, drilling optimization and efficiency improvements have been seen as crucial. Drilling fluid, often referred to as simply “mud,” is critical to the success and safety of drilling and well construction processes. The main functions are: primary safety barrier, well control, cutting transport, downhole pressure management, mechanical stability, isolation between wellbore and geological rock formation itself, lubrication, cooling of downhole drilling tools and drill-bit, and assisting in enabling the information available from downhole for interpretation (cuttings and real-time data transmission) [43].
To perform all those functions, rheology and property adjustments in the drilling mud are to be considered, including viscosity, density, and fluid loss capabilities, among others. These can be adjusted as necessary through additives and inhibitors: xanthan gum, carboxymethyl cellulose (CMC), and hydroxyethyl cellulose (HEC) are some examples [43]. Additionally, the related drilling mud pressure exerted at the bottom-hole must be high enough to prevent the influx of formation fluids by overbalanced operations (known in the industry as a kick) and transport the cuttings to the surface, avoiding, for instance, the blocking of the annular space and drill-bit surroundings. However, the borehole pressure must not exceed the formation fracturing pressure (the boundary of fracturing the formation with the consequence, among others, of drilling fluid losses), which can also compromise well integrity. This balance is ensured by controlling the pressure along the bottom-hole, driven mainly by the mud weight and secondarily by the flow rate [75,76].
Due to the influence of the drilling mud on the drilling process, researchers started to analyze the effects of drilling fluid on ROP. Thus, Warren et al. (1984) [77] and Warren (1987) [78] identified some interesting characteristics about the drilling fluid flow velocity ejecting from the drill-bit nozzles. The researchers defined three different regions, as shown in Figure 1. Zone one, the so-called free jet zone, has been characterized by a cone of moving fluid that expands along the x-axis, losing energy as the particles disperse. Zone two, the so-called impingement zone, is considered the region of where maximum pressure is applied against the formation. Zone three represents the radial portion of the fluids followed by partial lateral formation contact.
Figure 1.
Schematic effect of fluid velocity ejecting from the drill-bit nozzles. Source: Adapted from [75,77].
Al-Rubaii et al. (2022) [79] performed specific tests verifying drilling fluid flow behaviors just beneath the drill-bit to investigate the effect of flow rate, jet nozzle velocity, and jet impact force on rate of penetration (ROP), as shown in Figure 2.
Figure 2.
Effect of (a) jet impact force on ROP and (b) flow rate on ROP.
As shown in Figure 2a, the results demonstrate that, as the jet impact force increases, the ROP also improves significantly. A clear trend can be observed in Figure 2b, whereby increasing flow rate led to an ROP improvement, given that all other drilling parameters and also the formation remained unchanged. This suggests that higher flow rates allow achieving greater ROP due to improved bottom-hole cleaning [76,77,78,79] and, eventually, the effect implied by a more significant jet impact force against the formation, helping in effective rock penetration.
However, tests performed by Cunningham and Eenink (1959) [80], Allawi et al. (2025) [81], Fattah, El-Katatney and Dahab (2010) [82] and Robinson and Ramsey (2001) [83], demonstrated that the ROP is also considerably dependent on the differential pressure felt downhole (pressure difference between the borehole downhole pressure and the formation pore pressure), as exemplified through Figure 3 [80,81,82,83].
Figure 3.
Effect of differential pressure on ROP. Source: Adapted from [80,81,82,83].
Figure 3 shows that increased differential pressure results in a decrease in ROP. The unwanted increasing differential pressure occurs when the total downhole pressure exceeds the desired pressure relative to formation pore pressure (also influenced by the flow rate if dynamic condition is considered) and, consequently, also potentializes the retention of cuttings downhole (chip hold-down effect). Thus, although higher flow rates may improve cleaning and help rock penetration given the intensification of jet impact force against the geological formation being drilled, it adds pressure to the bottom-hole environment, negatively influencing the ROP.
Several other researchers investigated the effect of hydraulics on the drilling process. For instance, hydraulic energy was also used to modify the mechanical specific energy (MSE) mathematical model presented by Teale (1965) [84]. Armenta et al. (2009) [85] included the axial, torsional, and hydraulic related-energy (e.g, pressure drop across the drill-bit and flow rate influence) in their model and called it hydro-mechanical-specific energy.
Nascimento (2016) [75] conducted research to analyze possibilities in terms of optimization for the Pre-salt operations in the South Atlantic Ocean using mathematical modeling techniques. The methodology involved combining ROP modeling and MSE analysis based on a variety of datasets from Pre-salt drilled wells, more specifically from carbonate rock reservoir layers. The simulations yielded the following drilling mechanic parameters as ideal to guarantee an optimum drilling activity in these regions based on the data used: flow rate of 0.04732 m3/s (750 gpm) (from a window of 0.03785–0.05994 m3/s, 600–950 gpm), WOB of 38.3 kN (8.6 klbf), and rotary speed of 120 rpm. By adjusting the coefficients of the Bourgoyne and Young ROP mathematical model to the Pre-salt specificities, it was possible to establish a model allowing verification of potential operational savings [62]. Considering that activities in these Pre-salt fields can cost more than 1.3 million USD/day, drilling optimization and efficiency analyses are shown to be highly relevant, wherein minimum efficiency improvements may have important economic impacts [75].
Oliveira et al. (2021) [86], using data from the Pre-salt drilling, analyzed the influence of flow rate on ROP. The results showed a direct relation between the increase in flow rate and a higher ROP. In some specific situations, an increase in flow rate from 600 to 750 gpm (0.03785 to 0.04732 m3/s) and from 750 to 800 gpm (0.04732 to 0.05047 m3/s) made a positive variation possible in terms of ROP, approximately improving it on average by 2.8 m/h and 0.8 m/h, respectively. Therefore, although it was verified that other mechanical drilling parameters were kept constant, without any other external influence besides the flow rate, some other factors may have contributed to this variation along with the flow rate. However, the flow rate increase can influence the downhole pressure, which implies a possible downhole differential pressure variation. For the dataset analyzed, the jet impact force was more significant than the downhole differential pressure influence on ROP, so that an increase in flow rate allowed for an increase in the penetration rate.
Mantegazini et al. (2025) [8] analyzed the effect of input drilling parameters on ROP, including flow rate. For this, the researchers employed a field dataset related to a Pre-salt drilling operation in the South Atlantic Ocean [87,88]. The results showed that increasing the flow rate by 0.01262 m3/s (200 gpm) (from approximately 0.03785 to 0.05047 m3/s, from 600 to 800 gpm), keeping the other parameters unchanged and for the same geological formation layer, better ROP performance was obtained, eventually, mainly due to improved cleaning efficiency and cutting transport, thereby also reducing drill-bit stickiness and other related events or operational problematics.
4.2. Influence of Drilling Parameters on MPT Data Transmission
In the 1980s, Carter (1986) [89] verified, experimentally and theoretically, several approaches concerning mud pulse propagation. Some interesting studies were developed involving MPT systems, initially approaching the importance of MWDs and related performances of data transmission for well monitoring and analysis, and for evaluating geological formation systems. The propagation velocity of the mud pulse and some signal attenuation relationships were examined through experiments with the following general setup: flow circuit 2883 m (9460 ft) long, with a drill string inside diameter (ID) of 0.09246 m (3.64 in.) and MPT system settable up to 25 Hz, and a flow rate of 0.01262 m3/s (200 gpm). The experiments were conducted with three different fluids (representing drilling fluids): (a) water, (b) water-based mud and (c) oil-based mud, each fluid with a specific viscosity and density. The pressure pulse propagation velocity of the generated MPT pressure pulses was shown to depend on several factors, such as the drill string ID and type (material), as well as the characteristics of the working fluid. It was emphasized that longitudinal and/or radial (lateral) displacements/elongations of the drill string during the transmission of pressure pulses interfere in the pulse propagation velocities. It was highlighted that, in real operations, longitudinal and lateral restraints in terms of elongation may be applied, given the stiffness of the drill string and the frictional force applied longitudinally to it by the geological formation when drilling [89]. It was concluded that one should expect an increase in pressure pulse attenuation as a response to increasing pressure pulsing frequency as well as over distance traveled by the pulse. In terms of propagation velocity, it was verified that, in pure water, it would travel faster than in a WBM fluid and, lastly, in an OBM drilling fluid, respectively and approximately as follows: 1493 > 1478 > 1385 m/s (normal temperature and pressure—NTP conditions) [89].
Bai et al. (2005) [90] conducted experimental tests on the changing trend of the propagation velocity of pressure pulses (pressure waves) and pressure pulse attenuation responses in a bubbly flow. It was verified that the propagation velocity of the pressure pulse decreased with the increase in the gas volume fraction, as well as for higher pulsing frequency. However, the downward trend of the propagation velocity gradually slowed down when the bubble volume fraction was higher than 5%. In the same context, the higher the bubble content and the pulsing frequency (57 to 314 Hz), higher the attenuation coefficient of the pressure pulses. The experiments showed that the fluid flow velocity (with a counter flow direction regarding the direction of propagation of the pressure pulses) did not really influence the final effective velocity of the pulse being propagated. The coefficient of attenuation considers, among other characteristics, the fluid viscosity and also pulse propagation velocity. The propagation velocity was computed through the cross-correlation of the distance and time demanded to travel between two pressure sensors installed for running the experiments [89,90].
Li et al. (2012) [91] evaluated MPT-system-related pressure pulse propagation velocity and signal attenuation in multiphase drilling fluids with a focus on gas hold-ups (fraction of volume occupied by the gas phase in a gas–liquid multiphase fluid). For the analyses, field activities developed along the Well NP1-89 were considered in the Jidong Oilfield, Nanpu Block, Onshore China. It was addressed that, up to that year, many studies were focusing on single-phase and only a few on multiphase fluid environments. It was emphasized that gas hold-up was a key driver for attenuation coefficient increase and pressure pulse propagation velocity diminishment [91]. It was demonstrated that the higher the system pressure, the smaller the impact of the same amount of gas (on the drilling fluid) in reducing the velocity of the propagation of the pressure pulse, although the greater the amount of gas, the lower the velocity of pressure pulse propagation. In the same context, it was demonstrated that increasing the MPT operational frequency would gradually increase the pulse propagation velocity, evidencing a considerable increasing shift around 100 Hz, but not much considering the known used frequencies in the industry, which have been up to 24 Hz. For instance, for the interval ranging up to 10 Hz and for a system with approximately 10% gas hold-up, one could expect a possible increase in data transmission propagation velocity of up to about 0.9 m/s And, for a system with approximately 2.5% gas hold-up, the results show that, by increasing the system pressure by 2 MPa (8 to 10 MPa), pressure pulse propagation velocity would increase by approximately 132 m/s (from 220 to 352 m/s). The compressibility implied in such a multiphase drilling fluid (drilling mud) and the interchange/interaction between the fluid phases present, as well as energy absorption by present gases (bubbles, void fractions) were considered to drive the emphasized harm to data transmission as per the presented research. It also addressed the fact that one should expect the attenuation rate of a pressure pulse in drilling mud to be much lower in high system pressure, but still higher for higher gas hold-up content [91].
Li et al. (2016) [92] investigated pressure pulse propagation and attenuation characteristics in wellbore gas–liquid two-phase flow. Considering that previous investigations were addressing only air–water systems and that, essentially, drilling fluid in drilling engineering is a typical viscous fluid, it was stressed that it would be important to perform some experiments considering a more viscous fluid, as well as to consider the influences of temperature on the analyses. The research and analysis considered a mixture of water (liquid phase) and nitrogen (void fraction, circulating gas) and a gas–liquid modelling accounting, besides some other details, for wall shear force (frictional force between flowing fluid and the pipe wall) and gravitational effect [92]. Analyses were performed in terms of gas quantity, system pressure, angular frequency, and temperature on pressure pulse propagation velocity and strength attenuation. A case study was considered an underbalanced operation with aerated drilling fluid. It was found that the pressure pulses’ velocity of propagation is strongly dependent on system temperature, system pressure, and fluid gas content. It was verified that higher system pressures and lower temperatures are beneficial for increasing pressure pulses’ velocity of propagation and that it also tends to reduce pressure pulse attenuation. Some specific examples detailed in the article indicate that an increase in system pressure from 2 to 6 MPa could lead to an increase of approximately 40 m/s in data propagation velocity. By increasing the temperature, one should expect a decrease in propagating velocity due to an eventual decrease in the fluid density (which indirectly shows that fluid density would influence pressure pulse propagation velocity). It can also be concluded that depth would have an influence on propagation velocity. The tests were conducted by making use of a vertical stainless steel pipe of 0.0508 m (2 in.) ID, two pressure sensors approximately 1.3 m apart from each other, and MPT frequencies of 50, 251 and 271 Hz. Simulations considered a fluid with Bingham-like fluid behavior, with viscosity of 18 mPa.s and density of 1049 kg/m3 [92].
Wu et al. (2020) [93] verified in his research a mathematical model for analyzing the characteristics of downhole continuous pressure wave signals, naming it drilling fluid continuous wave (DFCW). It elaborates that, in the industry, if the mud pulse pressure pulses detected on the surface are weak, the wrong drilling parameters or no drilling parameters may be obtained, which may lead to some accidents or serious situations along the drilling operation [93]. It analyzed, mathematically, the DFCW general and specific waveform characteristics, stating that, for automatic drilling stages, it is important to transmit downhole information to the surface as quickly as possible and in real time during the operation. The research concluded that, with an increase in well depth, the intensity of the DFCW transmitted reaching the surface will decrease. It stressed that the wave (pressure pulses) propagation velocity is related to drilling fluid density and bulk modulus, developing experiments varying it from 1000 to 1500 m/s, known as propagation velocity expected in the industrial field. Among other results, the article concluded that, as the pressure pulse velocity increases, the period of the amplitude–frequency transmitted by the DFCW becomes larger (it increased) [93].
Li et al. (2022) [94] verified pressure wave propagation characteristics and the application effects of measurement-while-drilling pressure pulses for early gas kick detection. The article basically understands gas kick as a gas holdup within the drilling fluid and in the annulus, deriving some understanding for characterizing the detection based on pressure wave alteration/changes. It analyses MPT pressure pulse propagation time within the drill string and in the annulus, considering gas kick events. It determines that, when a gas kick occurs, the pressure wave travelling through the annulus would slow down if compared with the conventional one within the drill string, so that the lagging between them, when receiving at the surface, could, potentially, indicate a gas kick [94]. As a result, it states that, for a higher system pressure, the pressure pulse propagation velocity would be increased so that, at greater depth, the wave speed would be increased. For example, the article details that, for 0.06% gas content, one could expect an increase in data propagation speed from 110 to 250 m/s (an increase of about 140 m/s), as a response to system pressure increase from 0.176 to 0.732 MPa. It also indicates that the higher the gas kick content (amount of gas presence or gas holdup), the lower the propagation velocity of the pressure pulse [94]. The main reason stated for the velocity change in the presence of gases (gas kick) is that the gas volume fraction at a given depth increases the compressibility of the gas–liquid two-phase fluid and, therefore, the energy dissipation of the pressure wave when propagating through it. It also indicates that, in offshore operations, given the temperature alteration from downhole to the surface, in particular, when reaching the sea level, one should expect a considerable variation in the pressure wave that is propagated originally downhole, but this specification was not analyzed in this paper [94]. In drilling operations, the presence of gas void fractions can significantly affect pressure pulse telemetry performance because of overall compressibility alteration in the circulating fluid, potentially attenuating pressure pulses and changing propagation velocity. The case study considered real operations in the Shizigou Formation in western Qaidam Basin, Western China, which is a gas potential exploratory location. Some results were drawn based on the following operational parameters: MD 5000 m, drilling fluid density of 1430 kg/m3, drilling fluid viscosity of 12.41 mPa.s, flow rate of approximately 0.015142 m3/s (240 gpm), system temperature of 27 °C, and MPT continuous wave frequency of approximately 74 Hz. The time spent within the drill string to travel from downhole (5000 m) to surface and the pressure pulse propagation velocity was of about 4 s and 1250 m/s, respectively.
Qu et al. (2023) [95] showed that different factors affect MPT continuous wave pressure pulses, analyzing and discussing the transmission characteristics involved. They state that an increase in transmission distance intensifies signal attenuation and deformation during transmission, and eventually affects the efficiency of related exploration operations [95]. They reinforce that viscosity and frequency are the main drivers for pressure pulse signal attenuation. They also explain that the surface roughness and size of drill strings can affect the pressure pulse transmission velocity and the signal attenuation, which is more evident in long-distance transmissions. It was understood that most of the attenuation of the pressure pulses comes from friction within the mud particles themselves and the interaction between them and the drill-pipe (drill string) walls. They detail that signal attenuation is also related to the MPT frequency, as well as the drilling fluid properties (e.g., type, composition, viscosity and compressibility). The authors used Lamb’s law and the related equations to determine the quantitative relationship between continuous pulse signal intensity and transmission distance in a multiphase fluid mixture with gas. Pressure pulse propagation velocity decreases and the attenuation’s degree of the signal increases with the increase in gas content. Given the change in well depth, in situ variation in mud density along the drilling fluid column within the drill string is expected. The higher the downhole pressure, the greater the influence of gas phase content on pressure pulse propagation velocity, and the greater the expected attenuation of the signal. The lesser the compressibility experienced, the more rigid it is, and so the pressure pulse propagation velocity increases. With the increase in mud density and compressibility, the signal transmission velocity decreases [95]. In the article, a reference propagation velocity is considered to be around 1169 m/s. Flow rate varied between 0.01514 and 0.02997 m3/s (240–475 gpm), and MPT frequency was settable up to 30 Hz. As an outcome from the graphs presented, they show, among other interesting results, that, for 0.5% of gas phase content in a multiphase fluid, one could expect a pressure pulse propagation velocity increase from 981 to 1223 m/s (242 m/s) for a system pressure increase of 5 MPa (10 to 15 MPa) and that temperature would have influence on it but with variation not considered to be relevant for the moment (variation of about 50 °C reflects in approx. 0.0003 m/s).
Han et al. (2024) [12] studied transient flow theory (i.e., with pressure and velocity variation over time) attached to the complexities of the downhole MPT system by means of a continuous wave pulse generator. They affirm that, for MPTs, the strength and quality of the pressure wave signals generated are to be considered key and the most important, as they directly determine the success or failure of data transmission. After the experiments and analyses were performed, the authors suggest that, by increasing the flow rate (approx. 0.02019–0.02997 m3/s, 320–475 gpm), the total system pressure also increases, and that, in the field, for weaker signals, one should consider increasing the flow rate, which would also increase the generated pulse amplitude (amplitude induced by the mud pulse tool increases with the square of drilling fluid flow rate) [12]. On the other hand, it is suggested that a higher flow rate may increase MPT erosion, leading to early tool eventual failure, emphasizing the need to select an appropriate flow rate and an essentially needed amplitude. They indicate that drilling fluid density influences the pressure wave intensity linearly, but to a minor degree (increasing density increases pressure wave intensity, maintaining the waveform unchanged and decreasing the pressure pulse propagation velocity) [12]. They indicate that viscosity does not present any influence in the amplitude of the generated pressure wave (affected mainly by fluid compressibility), but it greatly influences the rate of amplitude attenuation (the higher the viscosity, the faster it will be attenuated over distance). For continuous wave pressure pulses, the frequency does not influence the effective amplitude of the generated signal, but it has a great influence on the attenuation rate of the signal (the higher the frequency, the higher the attenuation will be over distance).
Namuq (2013) [87] developed MPT-related research at TUBAF/IBF Flow-loop. He stated that downhole-generated pressure pulses would reach the surface after a delay in time equal to the mud pulse travel time in the drilling mud column inside the drill string [87]. Berro (2018) [96] stated that, in terms of pressure pulse propagation velocity, one should take into account and consider that the drilling mud inside the drill string is a very complex transmission channel and that several parameters affect the telemetry pressure wave during its propagation. The author elaborated that pressure pulse propagation velocity in drilling fluids has been registered to range from 1000 to 1600 m/s and that, for the presented research analyses, 1300 m/s was used as a reference.
In the context presented, it is important to elaborate that a multiphase flow is mostly common in the annulus and not really within the drill string and downhole. In the field, the drilling fluid (drilling mud) is normally degassed before being pumped, and, downhole, considering the elevated pressure, gases/bubbles tend to dissolve, so they are unlikely to be present in high percentages. As from field personnel and conversations with representatives of energy-related service companies, one should take into consideration the presence of a variety of IDs and sudden obstruction within the drill string along the bottom-hole assembly (BHA), so a gas volume fraction of more than 3% would not be common in a deep drilling operation.
Finally, regarding data propagation velocity from downhole to surface, from the details already presented, this can be resumed as follows. Carter (1986) [89] detailed that the data propagation velocity was about 1385 m/s for a specific OBM, and that would be less if compared to WBM and other configurations of drilling fluids. Berro (2018) [96] indicated 1300 m/s and Qu et al. (2023) [95] 1169 m/s as a reference for data propagation velocities, while Wu et al. (2020) [93] considered the interval between 1000 and 1500 m/s to be reasonable propagation velocities for field applications. In terms of system pressure influence on variation of propagation velocities, Li et al. (2012) [91] indicated a possible increase of 132 m/s in response to a system pressure change of about 2 MPa (2.5% gas fraction), Qu et al. (2023) [95] indicated 242 m/s for 5 MPa (0.5% gas fraction), and Li et al. (2022) [94] indicated a possible 140 m/s velocity variation for a 0.556 MPa pressure change (0.06% gas fraction).
5. Laboratory-Scale Experimental Setup, Materials and Methods
5.1. Experimental System and Details (Flow-Loop)
To investigate the influence of flow rate on MPT data transmission (effective signal amplitude attenuation and pressure pulse propagation velocity), experiments were conducted at the Flow-loop Test Facility, located at the Institute of Drilling Engineering and Fluid Mining (IBF), Technical University Bergakademie Freiberg (TUBAF), in Freiberg, Germany [2,14,48,87,96]. A schematic of the experimental setup of the /IBF/TUBAF Flow-loop is shown in Figure 4.
Figure 4.
IBF/TUBAF Flow-loop in its updated setup and arrangement performed in 2025.
As shown in Figure 4, the TUBAF/IBF Flow-loop uses fluid stored in a tank with a capacity of 1 [m3] (1000 L) as working fluid (i.e., representing the drilling fluid), ideally operational with up to 80% capacity. A system pump (i.e., representing the mud pump), and a maximum flow rate capacity of 40 m3/h (approx. 0.01111 m3/s or 176 gpm) are used and placed next to the fluid tank.
Although the maximum flow rate of the Flow-loop (176 gpm) is lower than the typical flow rates used in field drilling operations (some cases 300–1200 gpm), the hydrodynamic behavior still can be analyzed independently of the physical scale. In both cases, turbulent flow regimes predominate. Thus, the trends observed in the Flow-loop can represent the system’s behavior tendency in real drilling activity.
TUBAF/IBF Flow-loop is built mainly with a uPVC (unplasticized polyvinyl chloride or commercially “rigid PVC”) and with a minor transparent portion, which allows for the visual investigation of the signal generation. The circuit has a total length of 90.5 m and supports a maximum operating pressure of 10 bars (approx. 1 MPa or 145 psi). The whole circuit can be divided overall into three pipeline tubing general grouped sections, each with unique dimensional properties matched to particular experimental goals/needs, as follows:
- Section 1: this section has the largest segment to accommodate the MPT system (positive mud pulser and siren) and includes an exterior diameter of 110 mm, a wall thickness of 10 mm, and an internal diameter of 100 mm.
- Section 2: this section includes pipeline tubing with an exterior diameter of 90 mm, a wall thickness of 9 mm, and an internal diameter of 81 mm, representing an intermediate section between the MPT system and the drill string itself.
- Section 3: this section represents the general wellbore drill string (from surface to downhole) and includes pipeline tubing with an external diameter of 63 mm, a wall thickness of 6 mm, and an internal diameter of 57 mm.
From the pump, the fluid first passes through the actuator system (for possible noise implications, if desired, not used in the presented experiments), then through the flow meter (magnetic type) and, subsequently, through the three pressure sensors P1/P2/P3, with an operating range of up to 6 bar (0.6 MPa or 87 psi). The system also includes shut-off valves to allow for MPT system change/replacement, eventual pipeline tubing maintenance, and other purposes, which also support minimizing fluid loss or leakage.
The experimental setup also includes a dedicated measuring cabin, where a TUBAF/IBF in-house already developed LabVIEW software can be used to control the system and collect the experimental data [87,96]. Computer hardware is used to run the software as well as to present the necessary experiment-related information on a display. All the measurements are recordable for later procedural tracking and for processing purposes [87,96].
5.2. Fluid Properties and Flow Characteristics
For the experiments, four different fluids were used. The properties were measured in the TUBAF/IBF drilling fluid laboratory. Tap water from Freiberg, Germany (Fluid #1), and mixtures of the same tap water with glycerin (Vegetable Glycerol 99.5% pure—Propan-1,2,3-triol, with relative density of 1.2620–1.2636 by 20 °C) were used in the following proportions: WG 60-40 % (Fluid #2), WG 50-50 % (Fluid #3) and WG 40-60 % (Fluid #4). The experiments were carried out during spring and summer, with temperatures ranging approximately between 28 and 30 °C. To characterize the working fluid, it was considered for water (ρ = 995.80 kg/m3, μ = 0.8075 mPa.s).
Flow rates were used ranging from 11.5 to 25 m3/h, applied in specific experimental steps and goals. The flow rate interval of 11.5 to 14 m3/h was chosen for the positive mud pulser analyses, while 15, 20 and 25 were chosen for the mud siren analyses. These intervals were chosen due to some experimental limitations and showed to be very consistent and sufficient for the analyses and conclusions drawn.
The experiments were performed by making use of controlled single-phase liquid as the working fluid in the Flow-loop facility and a mixture of two different types of fluids, water and glycerin. Specific gas content and multiphase flow effects were not introduced intentionally in the experimental system. The major purpose was to verify and confirm tendencies that could lead to confirmation that flow rate, or pressure system variation, could potentially affect propagation velocity, regardless of details regarding related void fractions. A detailed view on compressibility variations due to free gas is recognized as a relevant factor in field-scale drilling operations but has been outside the scope of the present experimental investigation.
5.3. Experimental Procedure, MPT Configuration and Data Analyses
The experimental procedure consisted of carefully controlling and measuring flow conditions, activating the MPT system, and systematically repeating measurements to ensure data reliability. The volumetric flow rate was adjusted and monitored using calibrated instruments to maintain target values throughout each test.
The positive mud pulser had a configured time slot of 0.5 s, sending a bit sequence of “0 0 1 0 0 1 0 0 1 0 0” (11-bit sequence), representing a data rate of 2 bps. The mud siren had a configuration of 11 Hz with a time slot of 1 s sending the bit sequence “0 1 0 1 0 1 0” (7-bit sequence), representing a data rate of 1 bps.
In terms of signal processing, in order to more accurately evaluate the dynamic behavior of the pressure signals and identify the characteristic frequencies associated with the pump operation, noises and the effective desired pressure pulses, Fast Fourier Transform (FFT) analysis is used, supporting in filtering the signals for further detailed analyses.
Based on the experimental configuration already described, the received and read pressure signals were processed to determine the propagation velocity of pressure pulses between sensors. The following section presents the results of this analysis and discusses how operational parameters, such as flow rate, as well as fluid properties, may impact telemetry signal propagation.
6. Results and Discussions
The results presented in this section follow the analytical workflow described in the methodology, focusing on the determination of pressure pulse propagation velocity under different hydraulic conditions, and verify tendencies experienced for the velocity in relation to flow rate variations.
6.1. Pressure Pulse Propagation Velocity Versus Flow Rate
In the present study, the analysis focuses specifically on the propagation velocity of pressure pulses along the transmission path. Other signal characteristics, such as signal amplitude variations or signal-to-noise ratio (SNR), are not evaluated, as the objective is to quantify and see tendencies regarding the influence of drilling operational parameters on pulse travel time between sensors.
In the experiments performed, the propagation velocity is obtained by measuring the wave propagation delay (Δt) between the same generated pulse event recorded at the sensors P2 and P3 (closer to the MPT) and the sensor P1 (closer to the pump), and then dividing the distances between the sensors by the recorded time delay (Δt): 27.8 m (P1–P2) and 30.5 m (P1–P3). This method provides an estimate of the effective propagation velocity of pressure pulses under specific operating conditions for the carried out experiments. For the experiments, different fluids along with different configurations of positive pressure pulser and mud siren as MPT systems were used.
Figure 5 presents an illustrative example of what would be a filtered pressure signals obtained from sensors P1 and P3, where characteristic peaks can be identified and used to determine the inter-sensor delay required for the velocity calculation.
Figure 5.
Illustrative example for the Method for determining the time interval for calculating the pressure pulse propagation velocity.
The comparison of these pressure signals across the two sensors (P1 and P3 curve, Figure 5) provides a clear representation of propagating time verified experimentally. This is the basis for exploring the relationships between Δt and how flow rate (and, subsequently, system pressure) may impact the pulse’s propagation velocity.
The relationship for the pulse propagation velocity and flow rate was investigated, considering flow rates of 15, 20, and 25 m3/h, as shown in Figure 6. The results indicate that increasing the flow rate promotes an increase in propagation velocity, highlighting the influence of flow rate and related implied pressure on signal propagation behavior.
Figure 6.
Mud siren (Fluid #4 WG 40-60% and 11 Hz): (a) P1–P2, (b) P1–P3.
In Figure 6a, it is shown that increasing the flow rate from 15 m3/h to 25 m3/h resulted in an increase in propagation velocity (transmission speed) from approx. 209.95 ± 8.94 m/s to 274.63 ± 9.77 m/s. Statistical analysis indicated that flow rate exerts a highly significant influence on the data propagation velocity. Effect size (η2 = 0.93) showed that 93.70% of the observed variability in data propagation velocity can be explained by the variation in flow rate, characterizing an extremely strong effect of this variable in the analyzed system. The model presented an R2 = 0.79, which means that about 79.80% of the data propagation velocity variability is explained by the flow rate. Additionally, the results showed an increase of approximately 6.33 m/s for every 1 m3/h increase in flow rate.
Similar results can be seen in Figure 6b, where the increase in flow rate from 15 m3/h to 25 m3/h resulted in an increase in data propagation velocity from approx. 209.68 ± 11.18 m/s to 265.76 ± 5.26 m/s. Effect size (η2 = 0.91) showed that 91.60% of the observed variability in data propagation velocity can be explained by the variation in flow rate. The model presented an R2 = 0.88, which means that about 88.20% of the data propagation velocity variability is explained by the flow rate. Additionally, the results showed an increase of approximately 5.60 m/s for every 1 m3/h increase in flow rate. More statistical information is available in Table A1 and Table A2 (Appendix A).
Similar behavior was also observed for the positive mud pulser (Figure 7). In this case, the propagation velocity was investigated considering flow rates of 11.5 to 14 m3/h (0.00319 to 0.00389 m3/s). The fluid used was tap water, Fluid #1. The results show that increasing the flow rate also promotes an increase in the propagation velocity, confirming the trend observed in the other systems analyzed with mud siren and Fluid #4 (Figure 6).
Figure 7.
Positive mud pulser (Fluid #1 tap water, time slot 0.5 s, 2 bps): (a) P1–P2, (b) P1–P3.
In Figure 7a, a similar behavior was observed, where the propagation velocity increases from approx. 168.16 ± 3.31 m/s to 220.02 ± 15.05 m/s with the increase in flow rate from 11.5 to 14.0 m3/h, respectively. η2 = 0.66 and R2 = 0.62 showed that 66.60 and 62.40% of observed variability in data propagation velocity can be explained by the variation in flow rate. Additionally, the results showed an increase of approximately 22.80 m/s for every 1 m3/h increase in flow rate.
Figure 7b also showed that the propagation velocity increases with flow rate, increasing from approx. 196.02 ± 11.52 m/s to 265.08 ± 1.15 m/s with the increase in flow rate from 11.5 to 14.0 m3/h, respectively. η2 = 0.73 and R2 = 0.68 showed that 73.00 and 68.30% of observed variability in data propagation velocity can be explained by the variation in flow rate. Additionally, the results showed an increase of approximately 32.76 m/s for every 1 m3/h increase in flow rate. Overall, the results demonstrate that flow rate has an influence on propagation velocity, although moderate in some cases. More statistical information is available in Table A3 and Table A4 (Appendix A).
These results reinforce that the propagation velocity has a direct dependence on the flow rate (linked to the system pressure), regardless of the type of MPT system in play. It also shows that, regardless of the fluid type used, flow rate (and then pressure) influences MPT pulse propagation velocity. Similar results were found by researchers at TUBAF/IBF previously, such as Namuq (2013) [74,87], who obtained a propagation velocity of 462 m/s at a flow rate of 35 m3/h (0.00972 m3/s) with tap water (Fluid #1). These results provide a quantitative foundation for further discussion of the implications of transmission speed in mud pulse telemetry performance.
6.2. Pressure Pulse Propagation Velocity Versus Fluid Characteristics
To investigate the effect of glycerin concentration and, therefore, fluid properties on pressure pulses propagation velocity, experiments were conducted using 03 (three) mixtures with different proportions of water and glycerin (Figure 8): Fluid #2 (WG 60-40 %), Fluid #3 (WG 50-50 %) and Fluid #4 (WG 40-60 %).
Figure 8.
Mud siren (15 m3/h, Fluid #2/#3/#4, 11 Hz): (a) P1–P2, (b) P1–P3.
Figure 8 shows the variation in pressure pulse propagation velocity as a function of increasing glycerin percentage in the mixture, considering concentrations of 40, 50, and 60%. Figure 8a,b show a consistent trend of decreasing speed with increasing glycerin concentration, indicating the direct influence of the fluid’s properties.
In Figure 8a, the propagation velocity progressively decreases from approx. 294.02 ± 7.42 m/s to 262.31 ± 5.79 m/s and, subsequently, to 209.95 ± 8.94 m/s as the glycerin concentration increases from 40 to 50 and 60%, respectively. η2 = 0.96 and R2 = 0.94 showed that 96.40 and 94.50% of observed variability in data propagation velocity can be explained by the glycerin concentration. Additionally, the results showed a decrease of approximately 4.20 m/s for each 1% increase in glycerin concentration.
Similar behavior is observed in Figure 8b, where the propagation velocity progressively decreases from approx. 288.85 ± 3.13 m/s to 239.54 ± 6.40 m/s and, subsequently, to 209.68 ± 11.18 m/s for the same concentrations and MPT configuration. η2 = 0.95 and R2 = 0.93 showed that 95.80 and 93.90 % of observed variability in data propagation velocity can be explained by the glycerin concentration. Additionally, the results showed a decrease of approximately 3.95 m/s for each 1% increase in glycerin concentration. These results show that increasing the glycerin concentrations in the mixture causes a significant reduction in propagation velocity, reinforcing the inverse relationship between its concentration and propagation velocity, regardless of the experimental configuration represented in the analyses. More statistical information is available in Table A5 and Table A6 (Appendix A).
These results are consistent with experiments already carried out previously, as per Carten (1986) [89], Li et al. (2016) [92] and Wu et al. (2020) [93], where it was demonstrated that the properties of the drilling fluid have a direct impact on the propagation velocity of pressure pulses and that OBM and synthetic oil-based mud (SOBM) drilling fluids can reflect worse the propagation velocity compared to WBM drilling fluids.
6.3. Industry Application and Assessment
Nascimento (2016) [75] summarized drilling optimization studies, focusing on drilling operations in the south region of the Atlantic Ocean, where detailed analyses of several Pre-salt wells were verified. As already detailed, drilling operational costs can reach 1.3 MM USD/Day. The high cost has been linked to several factors, such as overall well complexities and unexpected events (drilling fluid losses, pipe sticking, survey repeating procedures), as well as to the low penetration rate (0.5–7.5 m/h) [75].
For a case study based on Well #C, the main drilling and operational specifications, based on field and industry-related data and the drilling units, are: coastal distance of 120 km, water depth of 1800 m, drilling interval in Pre-salt (carbonate rocks) of 4487–5313 m, PDC drill-bit size of 0.31115 m (12.25 in.), temperature range within 80–110 °C, MWD tool flow specification ranging from 0.03785 to 0.07577 m3/s (600 to 1200 gpm), operating flow rate ranging from 0.03785 to 0.05993 m3/s (600 to 950 gpm), and operating ECD 10.17–10.33 ppg.
From operational drilling data and field information, it was possible to extract an approximate relationship between pressure changes/variations in the drill string and flow rate under conditions where the drill-bit was off-bottom. Similar operational off-bottom situations are observed when developing surveying procedures. It was found that, for the final and carbonate section of the well, a flow rate change of 1 gpm would reflect in about 2.4 psi in the standpipe (drill string) pressure variation. And, despite the unique hydraulic design found in drilling activities, based on the technical scientific review already presented, 145 psi standpipe pressure reflects at 48 m/s in terms of pressure pulse propagation velocity. Ultimately, understanding that, during the operation, there is normally no specific way to control the internal drill string pressure other than the dynamic influence one may have from the drilling parameter flow rate, a 1 gpm raise reflected in a 0.79444 m/s improvement in terms of pressure pulse propagation velocity.
This increment in standpipe pressure through flow rate would guarantee faster data transmission by increasing the related pressure pulse propagation velocity (without, however, increasing the data rate), as per the studies already presented throughout this article. For this particular well under analysis, the operating flow rate range was defined between 600 and 950 gpm (600 is also the switch-on threshold of the MWD tool), translated into approximately 250 m/s of propagation velocity improvement window. And, since synthetic oil-based mud (SOBM) is the drilling fluid in play, one could consider a potential variation in data transmission velocity to vary between 1000 and 1250 m/s.
Survey procedures provide vital information during drilling as the activity advances in depth, allowing the operating team to understand the bottom of the well primarily in terms of inclination and direction. At least, for each weight-to-weight (W2W) stand connection during drilling (approx. 60–90 ft or 18–27 m), such survey procedures are performed before returning on-bottom and beginning drilling. One can understand that the basic survey string information/data package can have about 40-bit string in some configurations (accounting for the identification and for the information itself) and also that, for deep wells, a low data rate may be used by companies (3–6 bps).
Equations (1)–(3) show how to calculate the total time required for the transmission of the desired information sequence from the bottom of the well to the surface. The equations consider the time required to generate the entire bit sequence (e.g., 40-bit informational string), as well as the time required for the data (bits and/or pressure pulses) to propagate throughout the entire drilled path:
where:
- Tt: total data transmission time s;
- Tg: total data generation time s;
- Tp: total data propagation time s;
- Vp: data (pressure pulse) propagation velocity m/s;
- MD: total propagating distance or well measured depth m;
- Nbit: data frame length or total number of bits [bits];
- BPS: speed of bits being generated or data rate in bits per seconds bps.
Table 1 and Table 2 detail the time demanded for generating and transmitting a sequence of 40 bits from a depth of 5313 m, with an MPT configured with 3 and 6 bps, demanding around 0.33 and 0.17 s, respectively, for generating one single bit (or pressure pulse).
Table 1.
Examples and data transmission time for different agility and 3 bps—Well #C.
Table 2.
Examples and data transmission time for different agility and 6 bps—Well #C.
As seen in Table 1 and Table 2, using a flow rate of 775 gpm instead of 600 gpm would provide an improvement in data transmission time of approximately 3.17% and 4.93% for 3 bps and 6 bps MPT system configuration, respectively. Similarly, for a flow rate of 950 gpm, an improvement of 5.69% and 8.87% would be expected, respectively, for 3 bps and 6 bps MPT system configuration.
Additionally, according to Table 1, with 3 bps and flow rate of 775 gpm instead of 600 gpm, one could potentially reduce the surveying procedure time by approximately 0.5903 s. With 6 bps and flow rate of 950 gpm (Table 2), a reduction of approximately 1.0626 s would be expected. In these scenarios, it is important to note that a variation of 0.02208 m3/s (350 gpm), when with 6 bps, can potentially represent an equivalent quantitative improvement of about 1.137 bps in terms of data rate, which is considerable. And, this is very relevant, since, for some specific deep drilling operations, MPT systems would present a limited and low data rate, which could be counter-balanced by adjusting and increasing the flow rate during the operation, as demonstrated.
As energy-related service companies state, at certain depths, the effective real-time data rate adjustments are limited given pressure pulse attenuation, restringing them to low bits-per-second configurations. So, altering the flow rate (as a drilling parameter) to reduce drilling time and operational vulnerability (static exposure and pipe sticking) through a more agile survey procedure, for instance, is shown to be an interesting general strategy. In this context, knowing that the Pre-salt well operations can reach 1.3 [MM USD/day] and considering the results shown for Well #C, for a survey procedure, a reduction of approximately 1–2 s is expected, increasing the flow rate, which can potentially provide a cost saving of about 30 [USD] for each survey procedure.
7. Conclusions
This research-related study experimentally evaluated data transmission for drilling operations in respect to two different MPT systems, positive mud pulser and mud siren. The analyses were developed based on controlled laboratory conditions, focusing on the transmission characteristics of pressure pulses (data) as a function of flow rate and different fluids. The analyses mainly addressed data assurance by means of pressure pulse propagation delay and pressure pulse propagation velocity.
Flow rate (and subsequent pressure) was identified as a critical factor in signal variation. From the measured propagation delays, data propagation velocities were calculated for each flow rate. Results showed that velocities increase with flow rate for both MPT systems (mud pulser and mud siren). The data propagation velocity increased from 209.95 ± 8.94 m/s to 274.63 ± 9.77 m/s (P1–P2) and from 209.68 ± 11.18 m/s to 265.76 ± 5.26 m/s (P1–P3) with the flow rate increasing from 15 m3/h to 25 m3/h using the mud siren. Similar behavior was also seen using the positive mud pulse. The data propagation velocity increased from 168.16 ± 3.31 m/s to 220.02 ± 15.05 m/s (P1–P2) and from 196.02 ± 11.52 m/s to 265.08 ± 1.15 m/s (P1–P3) with the flow rate increasing from 11.5 m3/h to 14.0 m3/h.
Additionally, across the four different fluids used in the experiments, increasing the proportion of glycerin in the mixtures led to a clear decrease in data propagation velocity, i.e., the higher the viscosity, the lower the propagation velocity. The data propagation velocity progressively decreases from 294.02 ± 7.42 m/s to 209.95 ± 8.94 m/s (P1–P2), and from 288.85 ± 3.13 m/s to 209.68 ± 11.18 m/s (P1–P3), as the glycerin concentration increases from 40 to 60%.
From the literature and after the experiments had been carried out, it was concluded that, by increasing the system pressure through the flow rate as a drilling parameter, one should expect to have the propagation velocity increased, which, in drilling operations, can also be implied by varying the flow rate during the operation. An increase in flow rate allows for faster data propagation from downhole to surface, reducing surveying time and also vulnerability to undesired operation-related events (for instance, pipe-sticking events).
In the presented case study, for 6 bps data rate configurations and for the transmission of a 40-bit string, it was demonstrated that the propagation time from downhole to the surface could potentially represent approximately 40% of the total time demanded for transmitting the desired information (generation plus propagation time). It was verified that an increment of 0.02208 m3/s (350 gpm) could lead to shortening eventual surveying procedures by 1–2 s, and that it could equally represent 1.137 bps if compared to the data rate. Additionally, it would reduce costs by about 30 [USD] for each single survey procedure.
It should be noted that the present study considers controlled single-phase flow conditions, since the purpose was to verify overall impact and tendencies between the analyzed parameters and variables. In field drilling operations, multiphase flow conditions and gas void fractions may alter some properties of the drilling fluid and, consequently, influence pressure pulse propagation behavior. This has been carefully detailed through the literature review presented. Future investigations will address these effects experimentally in order to extend the present findings to more complex downhole flow environments. How drilling parameters may affect and influence signal attenuation rate and SNR signal-to-noise ratio will also be taken into account in future verifications.
These findings reinforce the importance of considering both hydraulic conditions and system configuration when designing and evaluating telemetry tools. Moreover, they support the development of multi-objective optimization strategies that simultaneously improve mechanical drilling performance and data transmission efficiency, especially in operations where real-time data reliability is critical. This dual focus becomes even more relevant when considering the broader context of the energy sector.
Author Contributions
Conceptualization: A.N., G.H.R.d.S. and D.Z.M.; writing—original draft: A.N., D.Z.M. and G.H.R.d.S.; supervision, funding acquisition: A.N., M.R. and F.G.M.; methodology, experiment: A.N. and G.H.R.d.S.; validation: A.N., D.Z.M. and G.H.R.d.S.; writing—review and editing: A.N., D.Z.M., G.H.R.d.S., M.R. and F.G.M. All authors have read and agreed to the published version of the manuscript.
Funding
This research was financed by the Coordenação de Aperfeiçoamento de Pessoal de Nível Superior (CAPES, Brazil)—Finance Code 001; by the Alexander von Humboldt Foundation (AvH, Germany); and by the Portugal national funds through FCT/MECI: LEPABE, UID/00511/2025 (https://doi.org/10.54499/UID/00511/2025), UID/PRR/00511/2025 (https://doi.org/10.54499/UID/PRR/00511/2025) and ALiCE, LA/P/0045/2020 (https://doi.org/10.54499/LA/P/0045/2020).
Data Availability Statement
The data used to support the conclusions of this study are not fully available upon request from the corresponding authors. Some data, due to the confidentiality involved and because they may represent sensitive industrial information, cannot be disclosed.
Acknowledgments
Acknowledgement of the support of the PRH-ANP/Fapesp 34 FEG/UNESP (Brazil), the Institute of Drilling Engineering and Fluid Mining, TU Bergakademie Freiberg (Germany) and the Laboratory for Process Engineering, Environment, Biotechnology and Energy (LEPABE), University of Porto (Portugal).
Conflicts of Interest
The authors declare no conflicts of interest to report regarding the present study.
Appendix A
Table A1.
Descriptive statistics.
Mean velocity is the mean data propagation velocity, Std_dev is the standard deviation, CV is the coefficient of variation, SEM is the standard error of the mean, CI_lower is the confidence interval—lower bound, and CI_upper is the confidence interval—upper bound.
Table A2.
Statistical model.
Table A3.
Descriptive statistics.
Table A4.
Statistical model.
Table A5.
Descriptive statistics.
Table A6.
Statistical model.
References
- Zhang, J.; Sha, Z.; Tu, X.; Zhang, Z.; Zhu, J.; Wei, Y.; Qu, F. Noise Cancellation Method for Mud Pulse Telemetry Based on Discrete Fourier Transform. J. Mar. Sci. Eng. 2025, 13, 75. [Google Scholar] [CrossRef] [Scilit]
- Berro, M.J.; Reich, M. Laboratory Investigations of a Hybrid Mud Pulse Telemetry (HMPT)—A New Approach for Speeding up the Transmitting of MWD/LWD Data in Deep Boreholes. J. Pet. Sci. Eng. 2019, 183, 106374. [Google Scholar] [CrossRef] [Scilit]
- Wu, Y.; Tian, R.; Wang, F.; Li, J.; Wang, B.; Chen, X.; Pang, D. Electromagnetic Telemetry Signal Denoising: An Interference Elimination via Parameter Estimation. Geoenergy Sci. Eng. 2024, 237, 212831. [Google Scholar] [CrossRef] [Scilit]
- Mwachaka, S.M.; Wu, A.; Fu, Q. A Review of Mud Pulse Telemetry Signal Impairments Modeling and Suppression Methods. J. Pet. Explor. Prod. Technol. 2019, 9, 779–792. [Google Scholar] [CrossRef] [Scilit]
- de Almeida, I.N., Jr.; Antunes, P.D.; Gonzalez, F.O.C.; Yamachita, R.A.; Nascimento, A.; Goncalves, J.L. A Review of Telemetry Data Transmission in Unconventional Petroleum Environments Focused on Information Density and Reliability. J. Softw. Eng. Appl. 2015, 8, 455–462. [Google Scholar] [CrossRef]
- Bello, O.; Perozo, N.; Huseynov, P.; Grijalva-Meza, O.; Asgharzadeh, A.; Holzmann, J.; Oppelt, J. A Simplified Framework and Performance Analysis for While-Drilling Telemetry Systems in Underbalanced Drilling Operations. Environ. Earth Sci. 2018, 77, 512. [Google Scholar] [CrossRef] [Scilit]
- Mantegazini, D.Z.; Nascimento, A.; Dornelas, V.F.; Mathias, M.H. Analysis and Multi-Objective Optimization of the Rate of Penetration and Mechanical Specific Energy: A Case Study Applied to a Carbonate Hard Rock Reservoir Based on a Drill Rate Test Using Play-Back Methodology. Appl. Sci. 2024, 14, 2234. [Google Scholar] [CrossRef] [Scilit]
- Mantegazini, D.Z.; Guzman, R.; Nascimento, A.; Hugo Mathias, M.; Joel Romero Guzman, O.; Reich, M. Optimization of Rate of Penetration and Mechanical Specific Energy Using Response Surface Methodology and Multi-Objective Optimization. Appl. Sci. 2025, 15, 1390. [Google Scholar] [CrossRef] [Scilit]
- Nascimento, A.; Mantegazini, D.Z.; Mathias, M.H.; Reich, M.; Hunt, J.D. O&G, Geothermal Systems, and Natural Hydrogen Well Drilling: Market Analysis and Review. Energies 2025, 18, 1608. [Google Scholar] [CrossRef] [Scilit]
- Romeu da Silva, G.H.; Nascimento, A.; Nascimento, D.; Hunt, J.D.; Mathias, M.H. Analysis of the Sugarcane Biomass Use to Produce Green Hydrogen: Brazilian Case Study. Appl. Sci. 2025, 15, 1675. [Google Scholar] [CrossRef] [Scilit]
- Romeu da Silva, G.H.; Nascimento, A.; Baum, C.D.; Nascimento, N.; Mathias, M.H.; Amro, M. Renewable Energy Perspectives: Brazilian Case Study on Green Hydrogen Production. AIMS Energy 2025, 13, 449–470. [Google Scholar] [CrossRef] [Scilit]
- Han, H.; Xue, L.; Sun, L.; Sheng, W.; Fan, H.; Wang, Z. A Transient Flow Analysis Method for High-Rate Mud Pulse Telemetry in Rotary Steerable System. Geoenergy Sci. Eng. 2024, 232, 212392. [Google Scholar] [CrossRef] [Scilit]
- Han, H.; Xue, L.; Sun, L.; Sheng, W.; Shi, X. Study on the Continuous Wave Bit Reflection Mechanism in Mud Pulse Telemetry. Geoenergy Sci. Eng. 2024, 241, 213139. [Google Scholar] [CrossRef] [Scilit]
- Namuq, M.A.; Reich, M. Laboratory Experiments on Pressure Wave Propagation in Drill Strings (Mud Pulse Telemetry). Oil Gas 2010, 36, 119–125. [Google Scholar]
- Jarrot, A.; Gelman, A.; Kusuma, J. Wireless Digital Communication Technologies for Drilling: Communication in the Bits\/s Regime. IEEE Signal Process. Mag. 2018, 35, 112–120. [Google Scholar] [CrossRef]
- Qu, F.; Zhang, Z.; Hu, J.; Xu, J.; Wang, S.; Wu, Y. Adaptive Dual-Sensor Noise Cancellation Method for Continuous Wave Mud Pulse Telemetry. J. Pet. Sci. Eng. 2018, 162, 386–393. [Google Scholar] [CrossRef] [Scilit]
- Jia, M.; Geng, Y.; Yan, Z.; Zeng, Q.; Wang, W.; Yue, Y. Channel Modelling and Characterization for Mud Pulse Telemetry. AEU-Int. J. Electron. Commun. 2023, 165, 154654. [Google Scholar] [CrossRef] [Scilit]
- Ma, D.; Shi, Y.; Zhang, W.; Liu, G. Design of Acoustic Transmission along Drill Strings for Logging While Drilling Data Based on Adaptive NC-OFDM. AEU-Int. J. Electron. Commun. 2018, 83, 329–338. [Google Scholar] [CrossRef] [Scilit]
- Jia, J.; Su, Y.; Shen, Y.; Hu, G.; Zhang, L.; Sheng, L. Signal Transmission Capability Improvement of a Telemetry Drill String Using the Reflected Signal at the Transmission Line Termination. Math. Probl. Eng. 2020, 2020, 7391530. [Google Scholar] [CrossRef] [Scilit]
- Shao, J.; Yan, Z.; Han, S.; Li, H.; Gao, T.; Hu, X.; Wei, C. Differential Signal Extraction for Continuous Wave Mud Pulse Telemetry. J. Pet. Sci. Eng. 2017, 148, 127–130. [Google Scholar] [CrossRef] [Scilit]
- Klotz, C.; Bond, P.; Wasserman, I.; Priegnitz, S. A New Mud Pulse Telemetry System for Enhanced MWD/LWD Applications. In Proceedings of the IADC/SPE Drilling Conference, Orlando, FL, USA, 4–6 March 2008; Volume 2, pp. 949–953. [Google Scholar] [CrossRef] [Scilit]
- Kumar, L.S.; Han, W.K.; Guan, Y.L.; Sun, S.; Lee, Y.H. Optimal Energy Transfer Pipe Arrangement for Acoustic Drill String Telemetry. IEEE Trans. Geosci. Remote Sens. 2014, 52, 6999–7007. [Google Scholar] [CrossRef] [Scilit]
- Florence, F.R.; Burks, J. New Surface and Down-Hole Sensors Needed for Oil and Gas Drilling. In Proceedings of the 2012 IEEE International Instrumentation and Measurement Technology Conference Proceedings, Graz, Austria, 13–16 May 2012; pp. 670–675. [Google Scholar] [CrossRef] [Scilit]
- Lin, J.; Li, Z.; Xing, S.; Li, X.; Huang, H.; Xu, F. Theory and Analysis of Influencing Factors of Electromagnetic Wave Wireless Transmission in Cased Wells. In Proceedings of the 2024 14th International Symposium on Antennas, Propagation and EM Theory (ISAPE), Hefei, China, 23–26 October 2024. [Google Scholar] [CrossRef] [Scilit]
- Wu, Y.; Wang, F.; Li, J.; Wang, B.; Pang, D. Wireless Electromagnetic Telemetry for Metal Cased Wells: A Novel Approach with Comprehensive Channel Analysis. Geoenergy Sci. Eng. 2024, 233, 212573. [Google Scholar] [CrossRef] [Scilit]
- Liu, K. Model and Control Method of a Downhole Electromagnetic Transmitter for EM-MWD System. J. Pet. Sci. Eng. 2020, 192, 107210. [Google Scholar] [CrossRef] [Scilit]
- Harrison, W.H.; Mazza, R.L.; Rubin, L.A.; Yost, A.B. Air-Drilling, Electromagnetic, MWD System Development. In Proceedings of the IADC/SPE Drilling Conference, Houston, TX, USA, 27 February–2 March 1990; Volume 485–495, p. 19970. [Google Scholar] [CrossRef]
- Pagtalunan, J.; Parmar, K.; Kim, S.; Moon, B.; Park, S.S. Experimental Study on Repeater-Free Acoustic Telemetry for Downhole Operations. J. Pet. Sci. Eng. 2021, 202, 108551. [Google Scholar] [CrossRef] [Scilit]
- Schnitger, J.; Macpherson, J. Signal Attenuation for Electromagnetic Telemetry Systems. In Proceedings of the SPE/IADC Drilling Conference and Exhibition, Amsterdam, The Netherlands, 17–19 March 2009; Volume 1, pp. 128–136. [Google Scholar] [CrossRef] [Scilit]
- Chen, J.; Zeng, S.; Dong, Q.; Huang, Y. Rapid Simulation of Electromagnetic Telemetry Using an Axisymmetric Semianalytical Finite Element Method. J. Appl. Geophys. 2017, 137, 49–54. [Google Scholar] [CrossRef] [Scilit]
- Li, H.; Liang, J.; Li, C.; Li, G.; Meng, Y.; Yang, P.; Liu, J.; Xu, L. A Novel Method to Improve Mud Pulse Telemetry Performance during Gaseated Underbalanced Drilling. J. Pet. Sci. Eng. 2022, 213, 110400. [Google Scholar] [CrossRef] [Scilit]
- Gao, L.; Finley, D.; Gardner, W.; Robbins, C.; Linyaev, E.; Moore, J.; Memarzadeh, M.; Johnson, D. Acoustic Telemetry Can Deliver More Real-Time Downhole Data in Underbalanced Drilling Operations. In Proceedings of the IADC/SPE Drilling Conference, Miami, FL, USA, 21–23 February 2006; pp. 485–490. [Google Scholar] [CrossRef]
- Mostaghimi, H.; Pagtalunan, J.R.; Moon, B.; Kim, S.; Park, S.S. Dynamic drill string Modeling for Acoustic Telemetry. Int. J. Mech. Sci. 2022, 218, 107043. [Google Scholar] [CrossRef] [Scilit]
- Li, C.; Xu, Z. A Review of Communication Technologies in Mud Pulse Telemetry Systems. Electron 2023, 12, 3930. [Google Scholar] [CrossRef] [Scilit]
- GFZ. SPWD-BUSData II. Available online: https://www.gfz.de/en/section/geomechanics-and-scientific-drilling/projects/completed-projects/spwd-busdata-ii-2013-2015 (accessed on 10 December 2025).
- Ali, T.H.; Sas, M.; Hood, J.A.; Lemke, S.R.; Srinivasan, A.; McKay, J.; Fereday, K.S.; Mondragon, C.; Townsend, S.C.; Edwards, S.T.; et al. High Speed Telemetry Drill Pipe Network Optimizes Drilling Dynamics and Wellbore Placement. In Proceedings of the IADC/SPE Drilling Conference, Orlando, FL, USA, 4–6 March 2008; Volume 2, pp. 727–734. [Google Scholar] [CrossRef] [Scilit]
- Sui, D.; Sukhoboka, O.; Aadnøy, B.S. Improvement of Wired Drill Pipe Data Quality via Data Validation and Reconciliation. Int. J. Autom. Comput. 2018, 15, 625–636. [Google Scholar] [CrossRef] [Scilit]
- Jia, J.; Su, Y.; Shen, Y.; Wang, L.; Zhang, L.; Ling, Y. Circuit Modeling and Signal Transmission Analysis of Inductive Coupler in Wired Drill Pipe. Math. Probl. Eng. 2021, 2021, 5538419. [Google Scholar] [CrossRef] [Scilit]
- Nygaard, V.; Jahangir, M.; Gravem, T.; Nathan, E.; Evans, J.; Christensen, H.; Reeves, M.; Wolter, H.; Hovda, S. A Step Change in Total System Approach through Wired Drillpipe Technology. In Proceedings of the IADC/SPE Drilling Conference, Orlando, FL, USA, 4–6 March 2008; Volume 2, pp. 1183–1195. [Google Scholar] [CrossRef] [Scilit]
- Namuq, M.A.; Hasso, E.A.; Jamal, M.A.; Namuq, K.A.; Yu, Y. Simulation and Modeling of Data Transmission Process in Boreholes Using Intelligent Drill Pipe for a Laboratory Experiment. Modelling 2024, 5, 1961–1979. [Google Scholar] [CrossRef] [Scilit]
- Allen, S.; McCartney, C.; Hernandez, M.; Reeves, M.; Baksh, A.; MacFarlane, D. Step-Change Improvements with Wired-Pipe Telemetry. In Proceedings of the SPE/IADC Drilling Conference and Exhibition, Amsterdam, The Netherlands, 17–19 March 2009; Volume 2, pp. 832–845. [Google Scholar] [CrossRef] [Scilit]
- Yan, Z.; Geng, Y.; Wei, C.; Wang, T.; Gao, T.; Shao, J.; Hu, X.; Yuan, M. Design of a Continuous Wave Mud Pulse Generator for Data Transmission by Fluid Pressure Fluctuation. Flow Meas. Instrum. 2018, 59, 28–36. [Google Scholar] [CrossRef] [Scilit]
- Li, B. Optimization of Drilling Fluid Flow Rates—A Study of the Drilling Fluid Flow Rates and Annular Pressure in Horizontal Directional Drilling. Master’s Thesis, University of Alberta, Edmonton, AB, Canada, 2023. [Google Scholar] [CrossRef]
- Li, C.; Ding, T. Signal Wireless Transmission Behaviors along the drill string Using Extensional Stress Waves. In Proceedings of the 2010 IEEE International Conference on Intelligent Computing and Intelligent Systems ICIS, Xiamen, China, 29–31 October 2010; Volume 2, pp. 541–545. [Google Scholar] [CrossRef] [Scilit]
- Hutin, R.; Tennent, R.W.; Kashikar, S.V. New Mud Pulse Telemetry Techniques for Deepwater Applications and Improved Real-Time Data Capabilities. In Proceedings of the SPE/IADC Drilling Conference, Amsterdam, The Netherlands, 27 February–1 March 2001. [Google Scholar] [CrossRef]
- Malekizadeh, A.; Afarideh, H.; Sahraeian, M.; Esmaeili Sani, V.; Mohamadian, M. A Precise Method to Improve the Mechanical Properties of the Mud Pulse Telemetry in Order to Manufacture a Positive Mud Pulse Telemetry System. Arab. J. Sci. Eng. 2021, 46, 7047–7056. [Google Scholar] [CrossRef] [Scilit]
- Jiang, S.; Yan, Z.; Sun, R.; Wang, Z.; Sun, H. Study on Signal Decomposition-Based Pump Noise Cancellation Method for Continuous-Wave Mud Pulse Telemetry. Geoenergy Sci. Eng. 2023, 228, 211948. [Google Scholar] [CrossRef] [Scilit]
- Namuq, M.A.; Reich, M.; Bernstein, S. Continuous Wavelet Transformation: A Novel Approach for Better Detection of Mud Pulses. J. Pet. Sci. Eng. 2013, 110, 232–242. [Google Scholar] [CrossRef] [Scilit]
- Wilson, M.; Findlay, A.; D’Amico, J.; Savtchouk, A.; Lagowski, J.; Xu, Z.; Yang, R.; Guo, T. Experimental Study on the Role of Parameters Affecting Surface Recombination and Emitter Passivation. In Proceedings of the 2014 IEEE 40th Photovoltaic Specialist Conference (PVSC), Denver, CO, USA, 8–13 June 2014; pp. 713–718. [Google Scholar] [CrossRef] [Scilit]
- Gutierrez-Estevez, M.A.; Krueger, U.; Krueger, K.A.; Manolakis, K.; Jungnickel, V.; Jaksch, K.; Krueger, K.; Mikulla, S.; Giese, R.; Sohmer, M.; et al. Acoustic Broadband Communications over Deep Drill Strings Using Adaptive OFDM. In Proceedings of the 2013 IEEE Wireless Communications and Networking Conference (WCNC), Shanghai, China, 7–10 April 2013; pp. 4089–4094. [Google Scholar] [CrossRef] [Scilit]
- ROGTEC. Technology Roundtable: MWD, Measurement While Drilling. Available online: https://www.rogtecmagazine.com/technology-roundtable-mwd/ (accessed on 15 September 2025).
- ERDOSMILLER. The Ultimate Guide to MWD: Everything You Need to Know. Available online: https://www.erdosmiller.com/mwd-the-ultimate-guide (accessed on 15 September 2025).
- HALLIBURTON. GyroStar—Faster Surveys and Precise Measurements for More Accurate Well Placement. Available online: https://cdn.brandfolder.io/VUJJLY3X/at/7h2qm7c7gt8pwtvn839bfcj/GyroStar-Gyro-While-Drilling-Service.pdf (accessed on 5 January 2026).
- HALLIBURTON. QuickPulse™—Quick and Reliable Downhole Information for Faster Well Delivery. Available online: https://cdn.brandfolder.io/VUJJLY3X/at/q1w1gd-1gn0og-d05p50/QuickPulse-Automated-Directional-Gamma-Service-Specs.pdf (accessed on 5 January 2026).
- HALLIBURTON. Quasar Pulse® M/LWD Service—Formation Evaluation Measurements in Extreme-Temperature Environments. Available online: https://www.halliburton.com/en/products/quasar-pulse-m-lwd-service (accessed on 5 January 2026).
- HALLIBURTON. JetPulse® High-Speed Telemetry Service—Fast Delivery of Real-Time Data for Drilling Efficiency, Optimal Well Placement, and Effective Decision Making—Drilling Efficiency with Telemetry. Available online: https://www.halliburton.com/en/products/jetpulse (accessed on 5 January 2026).
- BAKER HUGHES. Measurement While—Drilling—Services. Available online: https://www.bakerhughes.com/drilling/measurementwhiledrilling-services (accessed on 6 January 2026).
- BAKER HUGHES. NaviTrak HR Highly Reliable MWD Service. Available online: https://www.bakerhughes.com/sites/bakerhughes/files/2020-07/NaviTrak-HR-saved-2m-usd-na-cs.pdf (accessed on 6 January 2026).
- BAKER HUGHES. XACT Downhole Acoustic Telemetry Service. Available online: https://www.bakerhughes.com/drilling/measurementwhiledrilling-services/telemetry-services/xact-downhole-acoustic-telemetry-service (accessed on 7 January 2026).
- BAKER HUGHES. Directional Measurement-While-Drilling Services. Available online: https://www.bakerhughes.com/drilling/measurementwhiledrilling-services/directional-measurementwhiledrilling-services (accessed on 7 January 2026).
- SLB. Telescope ICE. Ultra HT MWD Service. Available online: https://www.slb.com/-/media/files/drilling/product-sheet/telescope-ice-ultraht-mwd-ps.pdf (accessed on 8 January 2026).
- SLB. Orion II. TELEMETRY PLATFORM Running MWD and LWD Services to Drill Faster and Further. Available online: https://www.slb.com/-/media/files/drilling/product-sheet/orion-ii-mwd-ps.pdf (accessed on 8 January 2026).
- SLB. TruMax. Unconventional Dual MWD Service. Available online: https://www.slb.com/-/media/feature/products/data-sheets/trumax_data_sheet.pdf (accessed on 8 January 2026).
- Weatherford. Measurement While Drilling Achieve Accurate Directional Surveys in Any Drilling Environment. Available online: https://www.weatherford.com/drilling-and-evaluation/drilling-services/measurement-while-drilling/ (accessed on 9 January 2026).
- Weatherford. MWD and Surveying Services. Available online: https://www.weatherford.com/documents/brochure/products-and-services/drilling/mwd-and-surveying-services/ (accessed on 9 January 2026).
- NOV. Teledrift ProPulse MWD Tool. Achieve Stabilized Vertical Drilling with Our Positive-Pulse Measurement-While-Drilling Tool. Available online: https://assets.nov.com/NCP4N68N/at/qc511j-4adi7s-l083t/Teledrift_ProPulse_Tool_Specification.pdf (accessed on 10 January 2026).
- NOV. Tolteq iSeries MWD System. An MWD Platform with Simplified Design and Legacy Compatibility. Available online: https://www.nov.com/products/teledrift-propulse-mwd-tool (accessed on 10 January 2026).
- NOV. Tolteq iSeries MWD Platform. Tolteq iSeries Measurement While Drilling System Spec Sheet. Available online: https://assets.nov.com/NCP4N68N/at/hpr78ntngmw7wtfzbxwfrkr/Tolteq_iSeries_Measurement_While_Drilling_System_Spec_Sheet.pdf (accessed on 10 January 2026).
- SCIENTIFIC DRILLING. Scientific Drilling. SDI’s Next-Generation Mud Pulse MWD System MWD Systems. Available online: https://scientificdrilling.com/technology-services/measurement-while-drilling/mwd-systems/ (accessed on 10 January 2026).
- KEYDRILL. EM-MWD & Hybrid Telemetry Kit. Available online: https://www.keydrill.com/products/total-solutions/em-mwd-hybrid-telemetry-kit/ (accessed on 12 January 2026).
- EPCO Solutions Inc. Drill-Tek Twin EM Systems. Available online: https://epcosolutions.net/drill-tek-twin-em-systems (accessed on 12 January 2026).
- MWDPLANET. Terre-Flex Multi-Channel MWD System. Available online: https://mwdplanet.ca/terre-flex-multichannel-telemetry-system/ (accessed on 13 January 2026).
- Bamisebi, A.J.; Reich, M. Increasing Data Rate for Mud Pulse Telemetry: Innovative Concepts & Tools Developed. In Geo-Energy-Systems and Subsurface Technologies—Key Elements Towards a Low Carbon World; DGMK/ÖGEW Frühjahrstagung: Münster, Germany, 2022; Available online: https://dgmk.de/app/uploads/2022/06/DGMK_2022-1.pdf (accessed on 13 January 2026).
- Bamisebi, A.J.; Reich, M. Multi-frequency mud siren simulation and experiment for increasing data transmission rate in mud pulse telemetry. Discov. Appl. Sci. 2025, 7, 600. [Google Scholar] [CrossRef] [Scilit]
- Nascimento, A. Mathematical Modeling for Drilling Optimization in Pre-Salt Sections: A Focus on South Atlantic Ocean Operations. Master’s Thesis, Universidade Estadual Paulista—UNESP, São Paulo, Brazil, 2016. [Google Scholar]
- Mohammadsalehi, M.; Malekzadah, N. Application of New Hole Cleaning Optimization Method within All Ranges of Hole Inclinations. In Proceedings of the International Petroleum Technology Conference, Bangkok, Thailand, 15–17 November 2011; Volume 1, pp. 68–75. [Google Scholar] [CrossRef] [Scilit]
- Warren, T.M.; Winters, W.J. The Effect of Nozzle Diameter on Jet Impact for a Tricone Bit. Soc. Pet. Eng. J. 1984, 24, 9–18. [Google Scholar] [CrossRef] [Scilit]
- Warren, T. Penetration Rate Performance of Roller Cone Bits. SPE Drill. Eng. 1987, 2, 9–18. [Google Scholar] [CrossRef] [Scilit]
- Al-Rubaii, M.M.; Elkatatny, S.; Gajbhiye, R.; Alafnan, S.; Glatz, G.; Al-Yami, A.; Haq, B. A New Rate of Penetration Model Improves Well Drilling Performance. In Proceedings of the SPE Symposium: Unconventionals in the Middle East—From Exploration to Development Optimisation, Manama, Bahrain, 23–24 March 2022. [Google Scholar] [CrossRef] [Scilit]
- Cunningham, R.A.; Eenink, J.G. Laboratory Study of Effect of Overburden, Formation and Mud Column Pressures on Drilling Rate of Permeable Formations. Trans. AIME 1959, 217, 9–17. [Google Scholar] [CrossRef] [Scilit]
- Allawi, R.H.; Al-Mudhafar, W.J.; Abbas, M.A.; Wood, D.A. Leveraging Boosting Machine Learning for Drilling Rate of Penetration (ROP) Prediction Based on Drilling and Petrophysical Parameters. Artif. Intell. Geosci. 2025, 6, 100121. [Google Scholar] [CrossRef] [Scilit]
- Fattah, K.A.; El-Katatney, S.M.; Dahab, A.A. Potential Implementation of Underbalanced Drilling Technique in Egyptian Oil Fields. In Proceedings of the International Oil and Gas Conference and Exhibition in China, Beijing, China, 8–10 June 2010; Volume 1, pp. 703–721. [Google Scholar] [CrossRef]
- Robinson, L.; Ramsey, M. Are You Drilling Optimized or Spinning Your Wheels. In Proceedings of the 2001 AADE National Drilling Technical Conference, Houston, TX, USA, 27–29 March 2001; AADE: Houston, TX, USA, 2001; pp. 1–11. Available online: https://www.aade.org/application/files/2015/7304/5772/AADE_31.pdf (accessed on 13 January 2026).
- Teale, R. International Journal of Rock Mechanics and Mining Sciences & Geomechanics Abstracts; Pergamon: Oxford, UK, 1965; pp. 57–73. [Google Scholar]
- Armenta, M. Identifying Inefficient Drilling Conditions Using Drilling-Specific Energy. In Proceedings of the SPE Annual Technical Conference and Exhibition, Denver, CL, USA, 21–24 September 2008; Volume 7, pp. 4409–4424. [Google Scholar] [CrossRef] [Scilit]
- Oliveira, L.S.R.; Nascimento, A.; Mantegazini, D.; Nascimento, N. Drilling Optimization of Petroleum Wells: A Data Analysis of the Drilling Fluid flow rate Influence in ROP. Lat. Am. J. Energy Res. 2021, 8, 59–66. [Google Scholar] [CrossRef] [Scilit]
- Namuq, M.A. Simulation and Modeling of Pressure Pulse Propagation in Fluids Inside Drill Strings. Ph.D. Thesis, Technische Universität Bergakademie Freiberg, Freiberg, Germany, 2013; 114p. [Google Scholar]
- Nascimento, A.; Romeu da Silva, G.H.; Naeini, M.S.; Röentzsch, S.; Reich, M. Smart systems applied to access of geo-energy related natural resources: A new approach aiming for effective drilling efficiency improvement based on specific drilling parameters. In DGMK/ÖGEW Spring Conference 2025—Conference Report; DGMK—Deutsche Wissenschaftliche Gesellschaft für Erdöl, Erdgas Und Kohle e.V.: Hamburg, Germany, 2025; pp. 281–288. [Google Scholar]
- Carter, A.J. Experimental and Theoretical Study of Mud Pulse Propagation. Master’s Thesis, Graduate Faculty Louisiana State University, Department of Petroleum Engineering, Baton Rouge, LA, USA, 1986. [Google Scholar]
- Bai, B.F.; Huang, F.; Guo, L.J.; Wang, X.Y. Propagation of pressure wave for bubbly flow in vertical upward tube. Nucl. Power Eng. 2005, 26, 323–326. [Google Scholar]
- Li, H.; Li, G.; Meng, Y.; Shu, G.; Zhu, K.; Xu, X. Attenuation law of MWD pulses in aerated drilling. Pet. Explor. Dev. 2012, 39, 250–255. [Google Scholar] [CrossRef] [Scilit]
- Li, H.; Chen, R.; Li, X.; Meng, Y.; Zhu, L.; Zhao, J. Investigation of pressure wave propagation and attenuation characteristics in wellbore gas-liquid two-phase flow. J. Nat. Gas Sci. Eng. 2016, 35, 1088–1100. [Google Scholar] [CrossRef] [Scilit]
- Wu, J.; Zhou, B.; Qin, D.; Wang, R. Mathematical model and analysis of characteristics of downhole continuous pressure wave signal. J. Pet. Sci. Eng. 2020, 186, 106706. [Google Scholar] [CrossRef] [Scilit]
- Li, X.; Zhang, J.; Tang, X.; Li, C.; Li, B.; Wang, Y.; Zhao, Z. Propagation characteristics and application effects of measurement-while-drilling pressure wave for early gas-kick detection. J. Loss Prev. Process Ind. 2022, 76, 104741. [Google Scholar] [CrossRef] [Scilit]
- Qu, J.; Xue, Q.; Lu, J. Analysis on the change characteristics of waveform during the transmission of continuous wave mud pulse signal. Alex. Eng. J. 2023, 80, 594–608. [Google Scholar] [CrossRef] [Scilit]
- Berro, M.J. Mouhammed Jandal Berro Development and Testing of Alternative Methods for Speeding up the Hydraulic Data Transmission in Deep Boreholes TU Bergakademie Freiberg. Ph.D. Thesis, Faculty of Geosciences, Geoengineering and Mining of the Technische Universität Bergakademie Freiberg, Institute of Drilling Engineering and Fluid Mining, Freiberg, Germany, 2018. [Google Scholar]
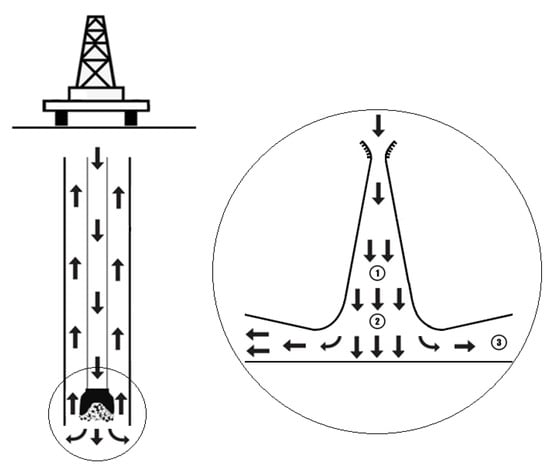
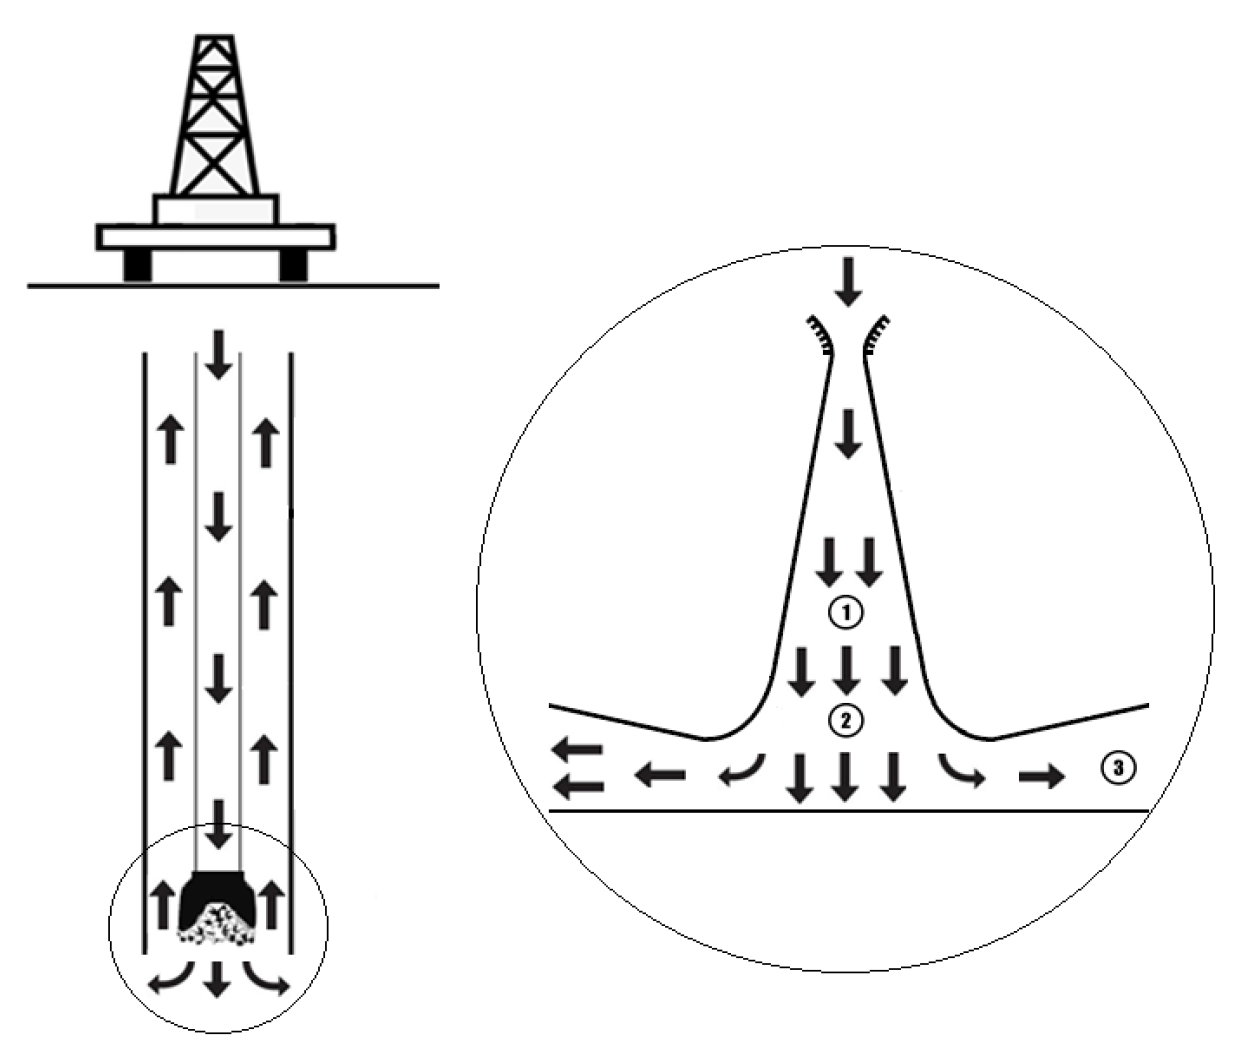
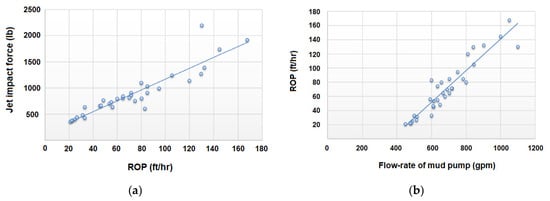
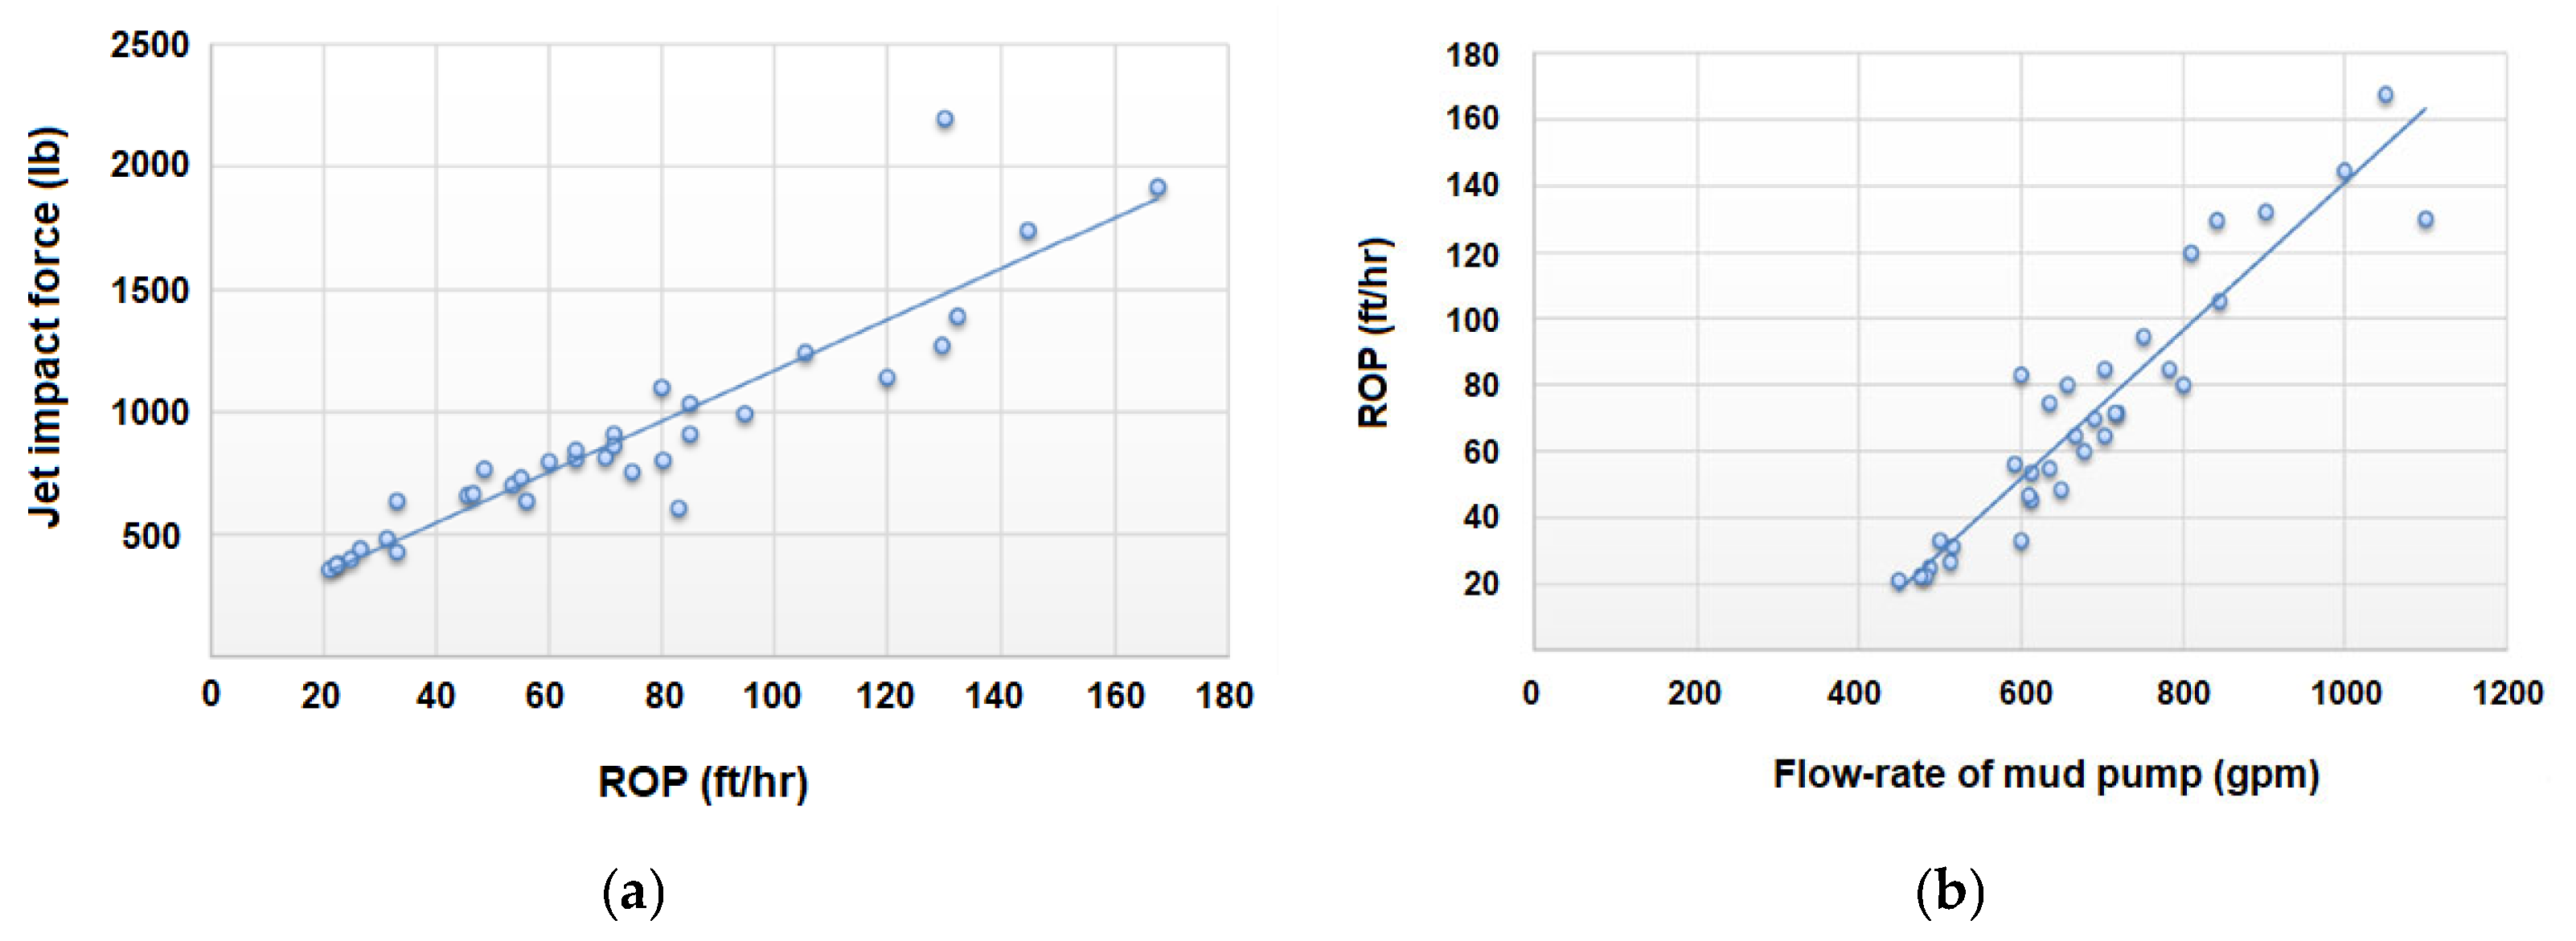
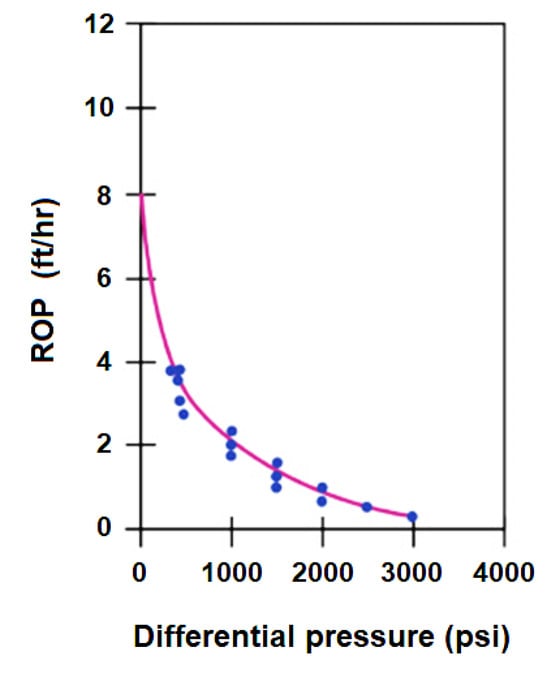
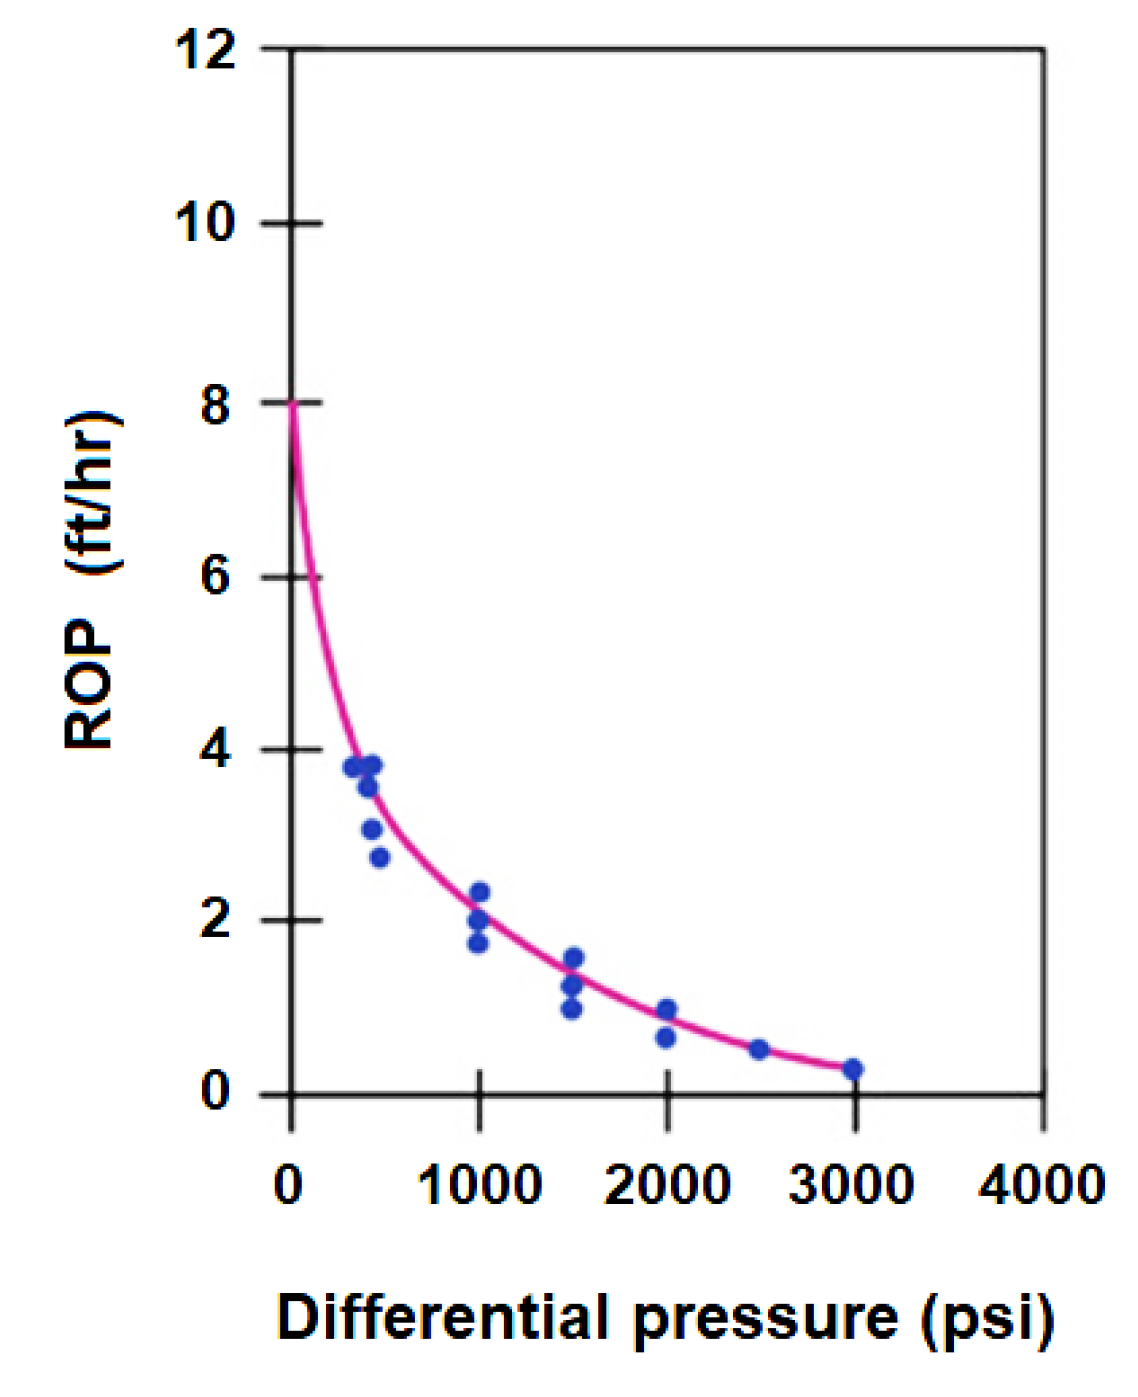
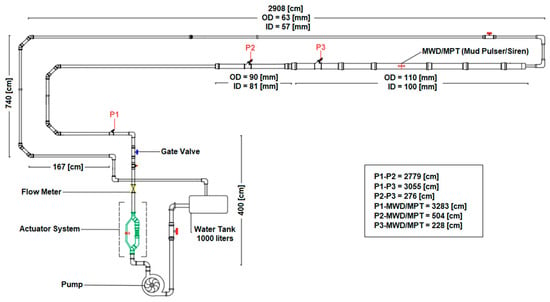
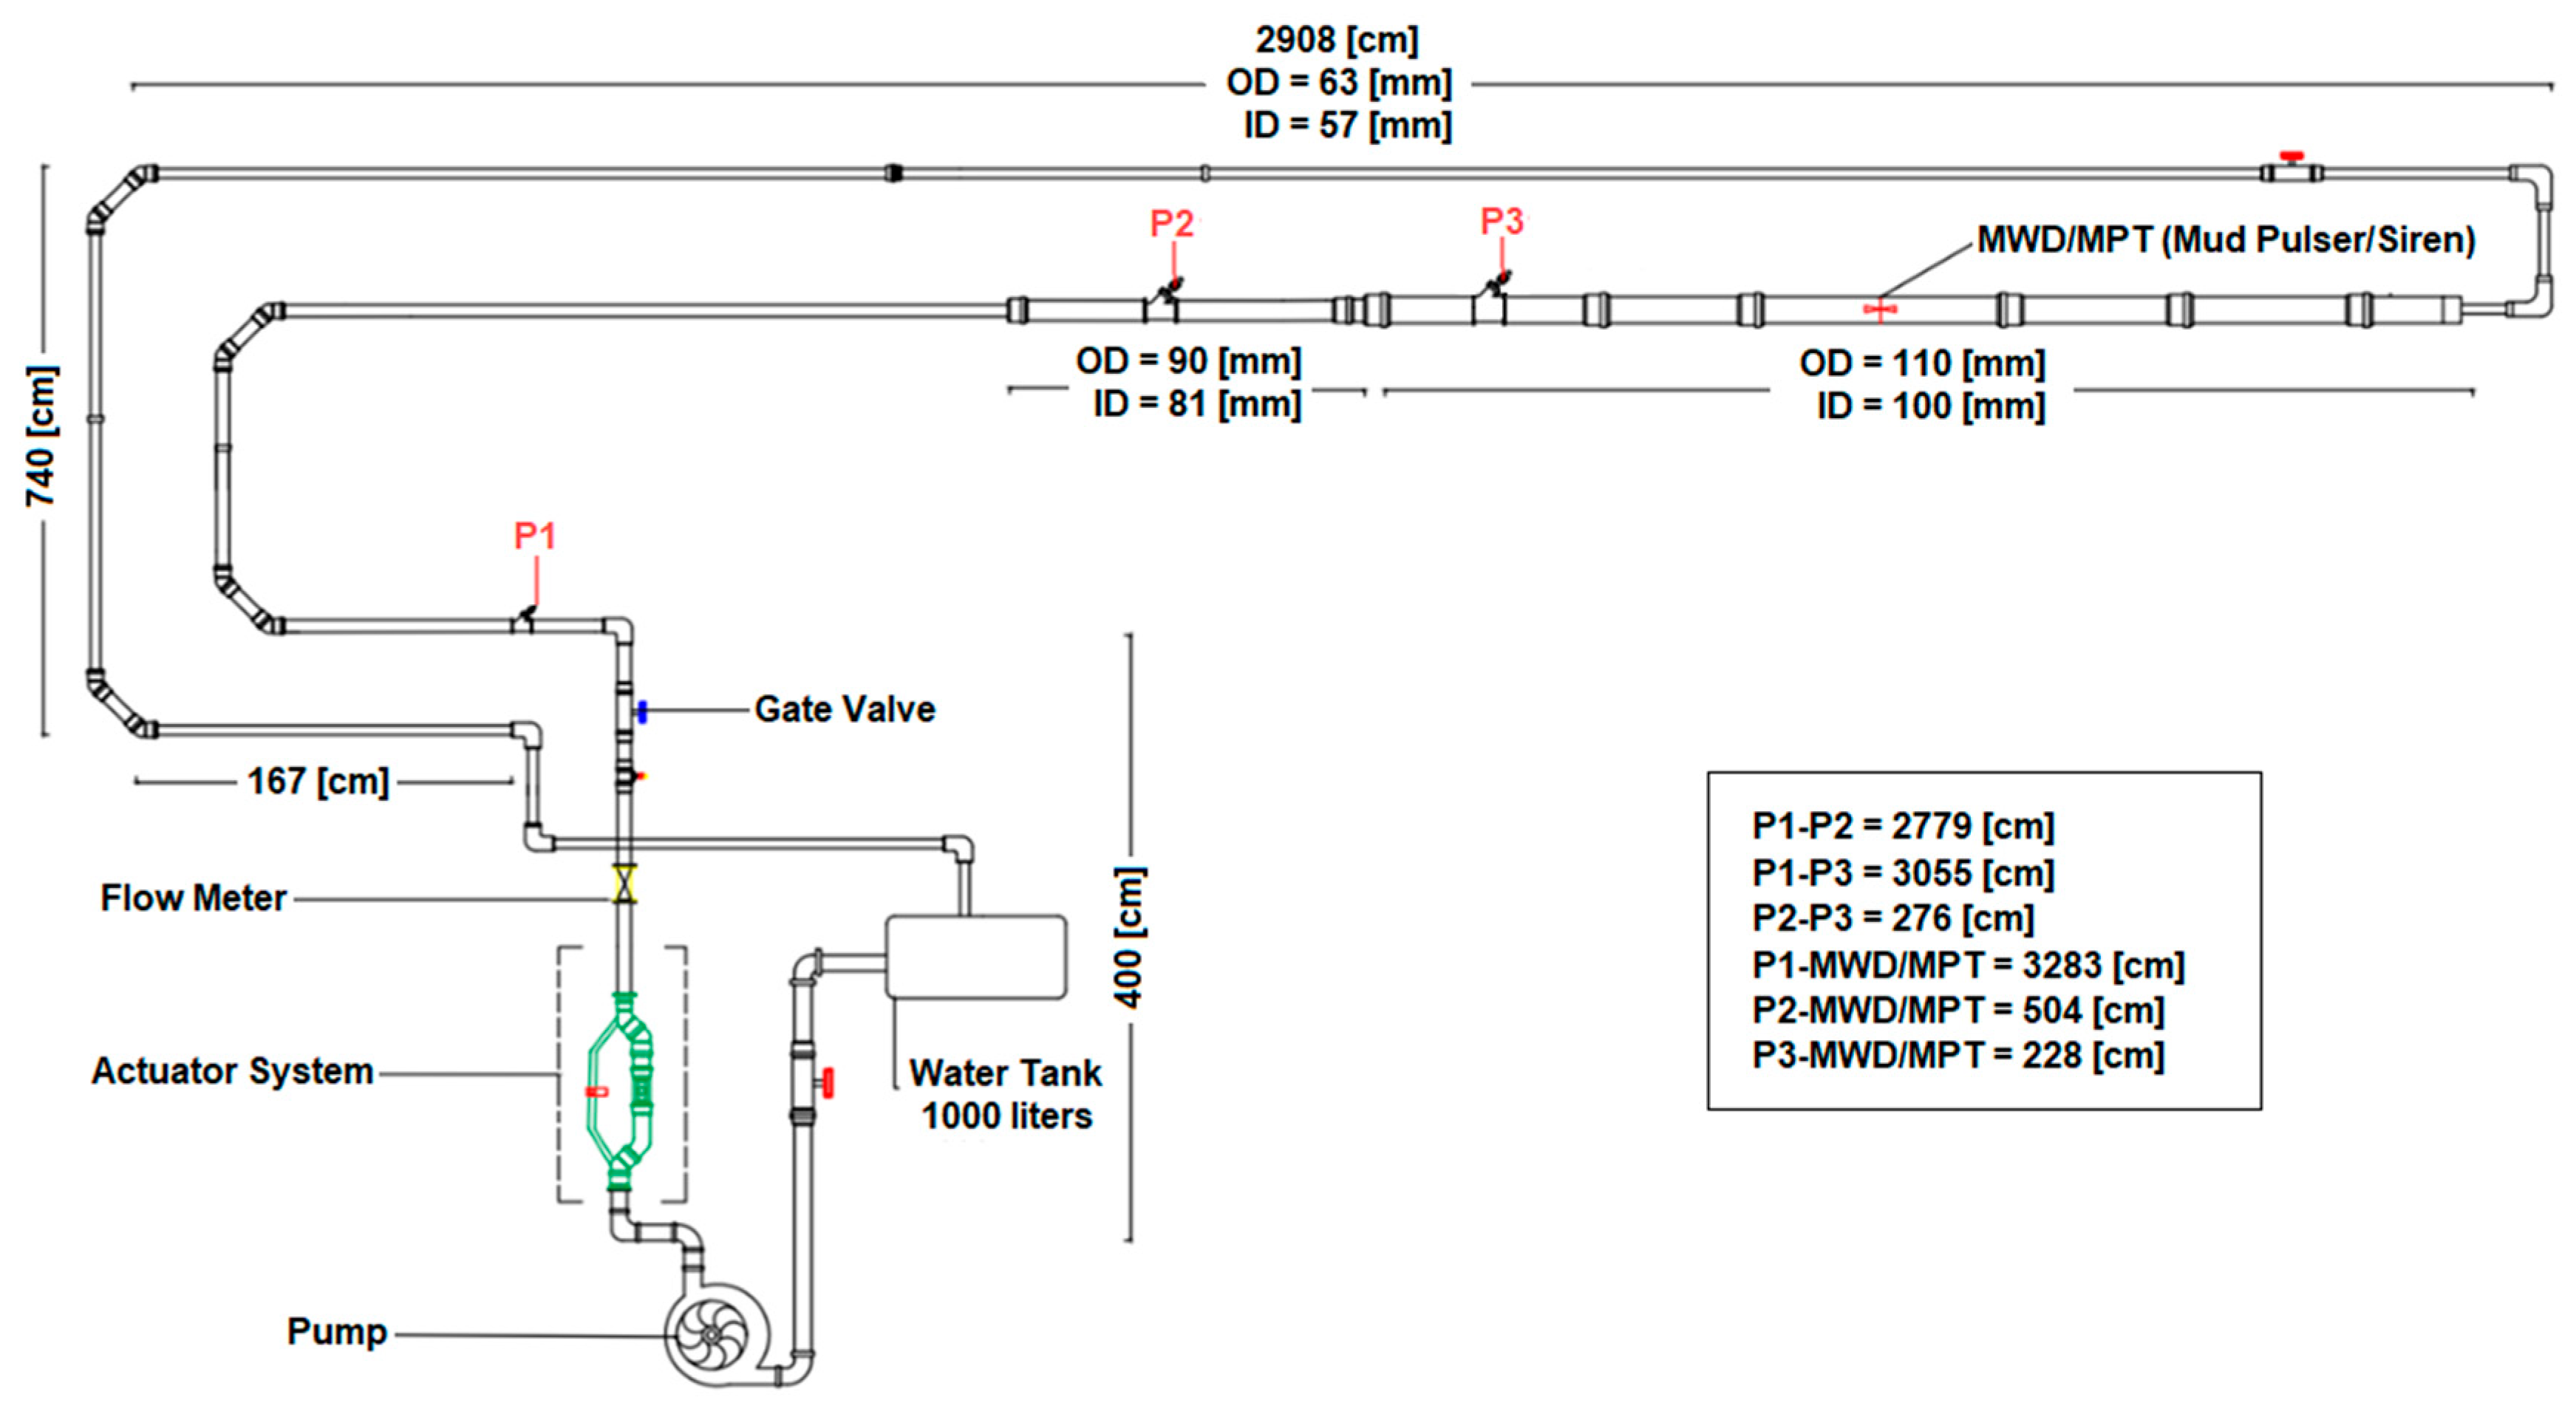
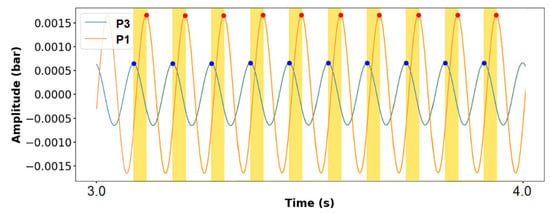
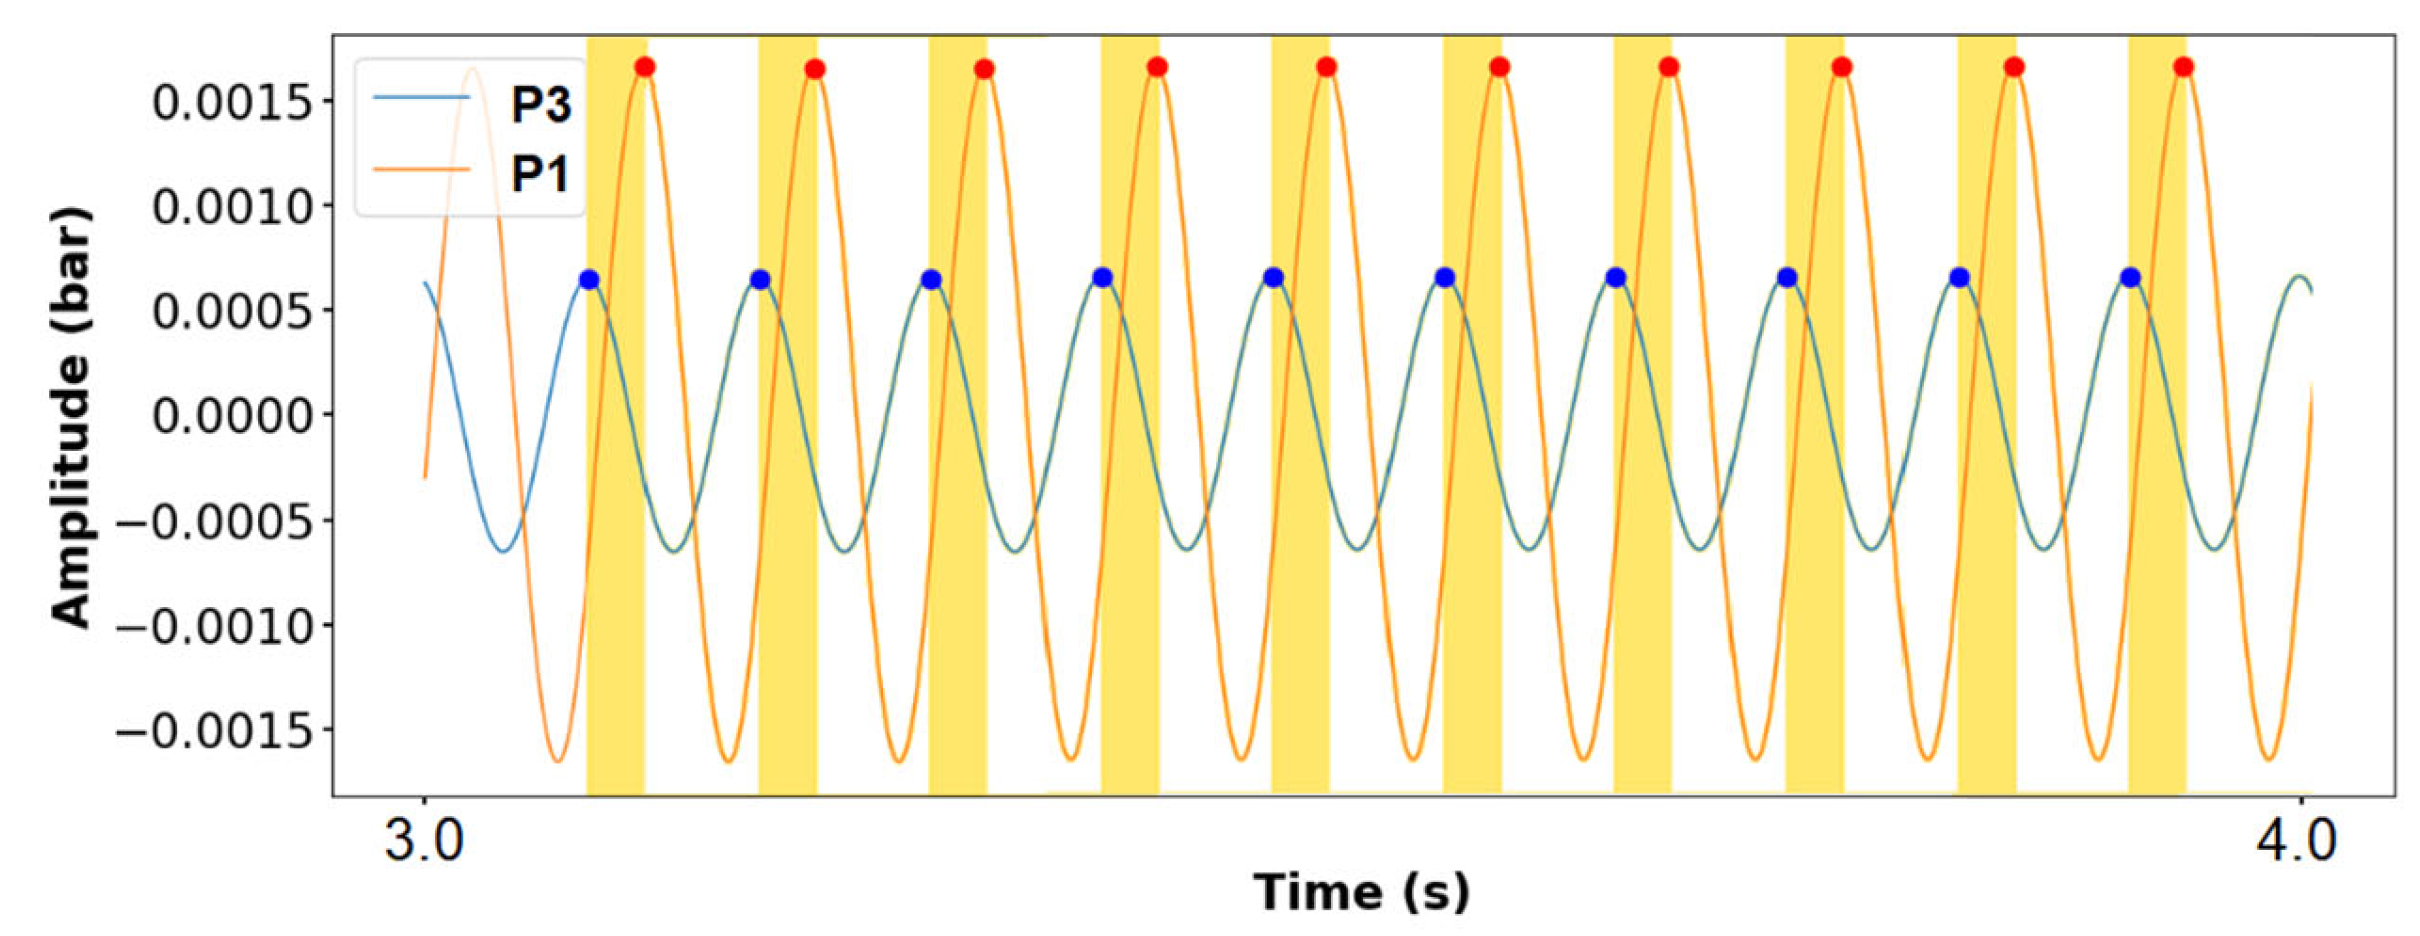
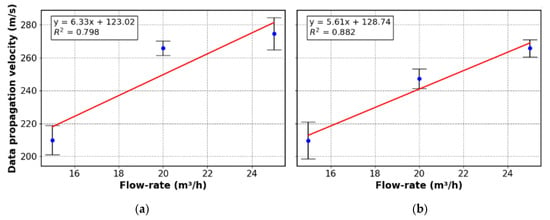
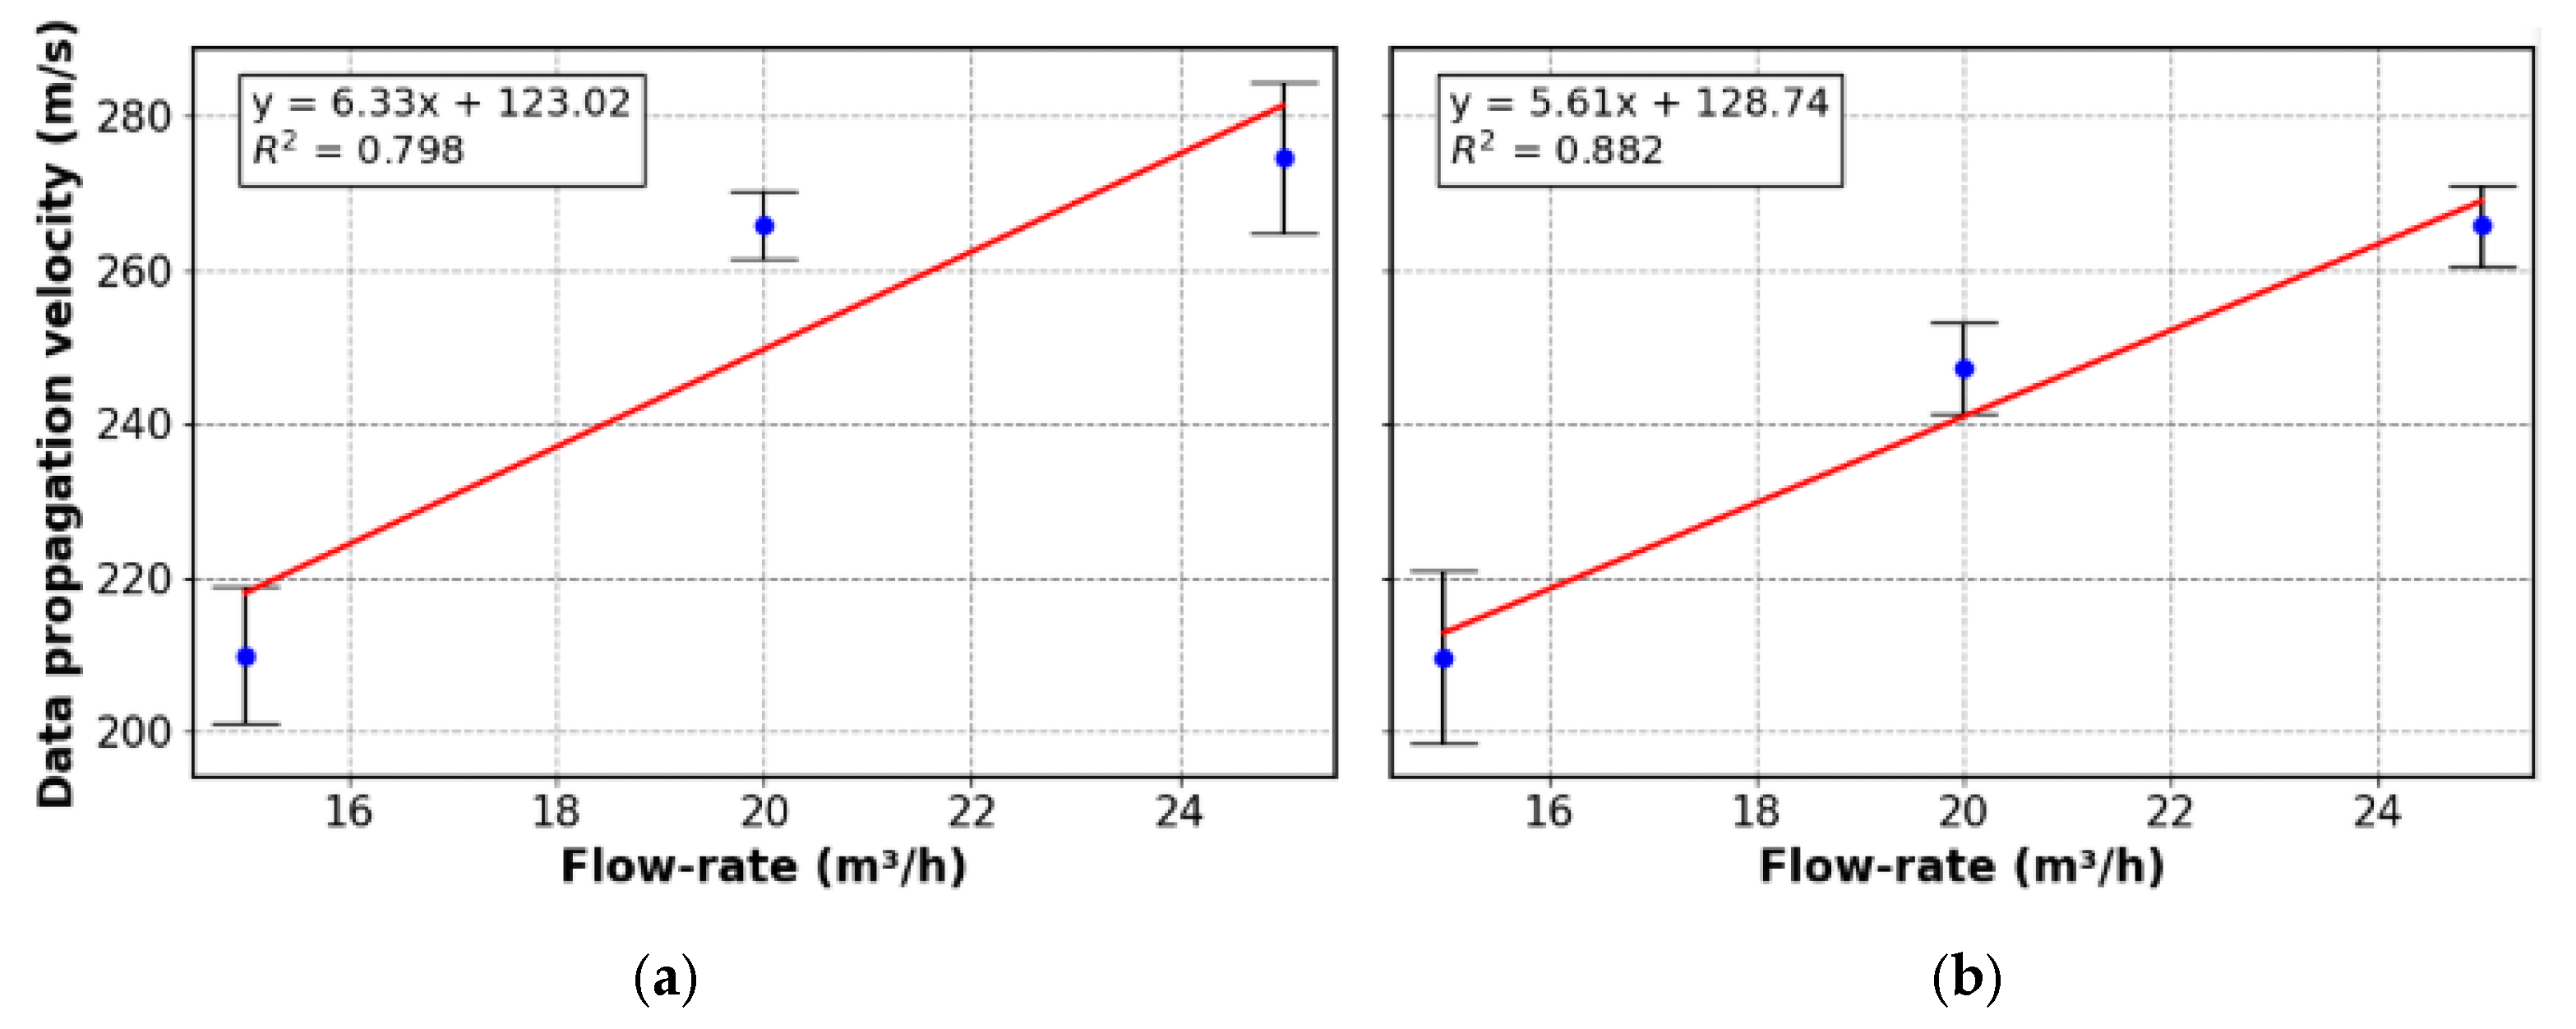
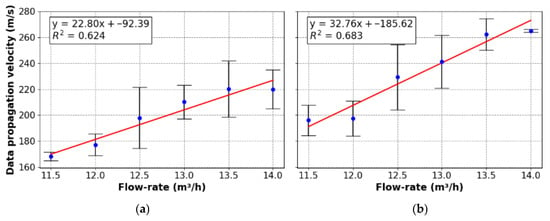
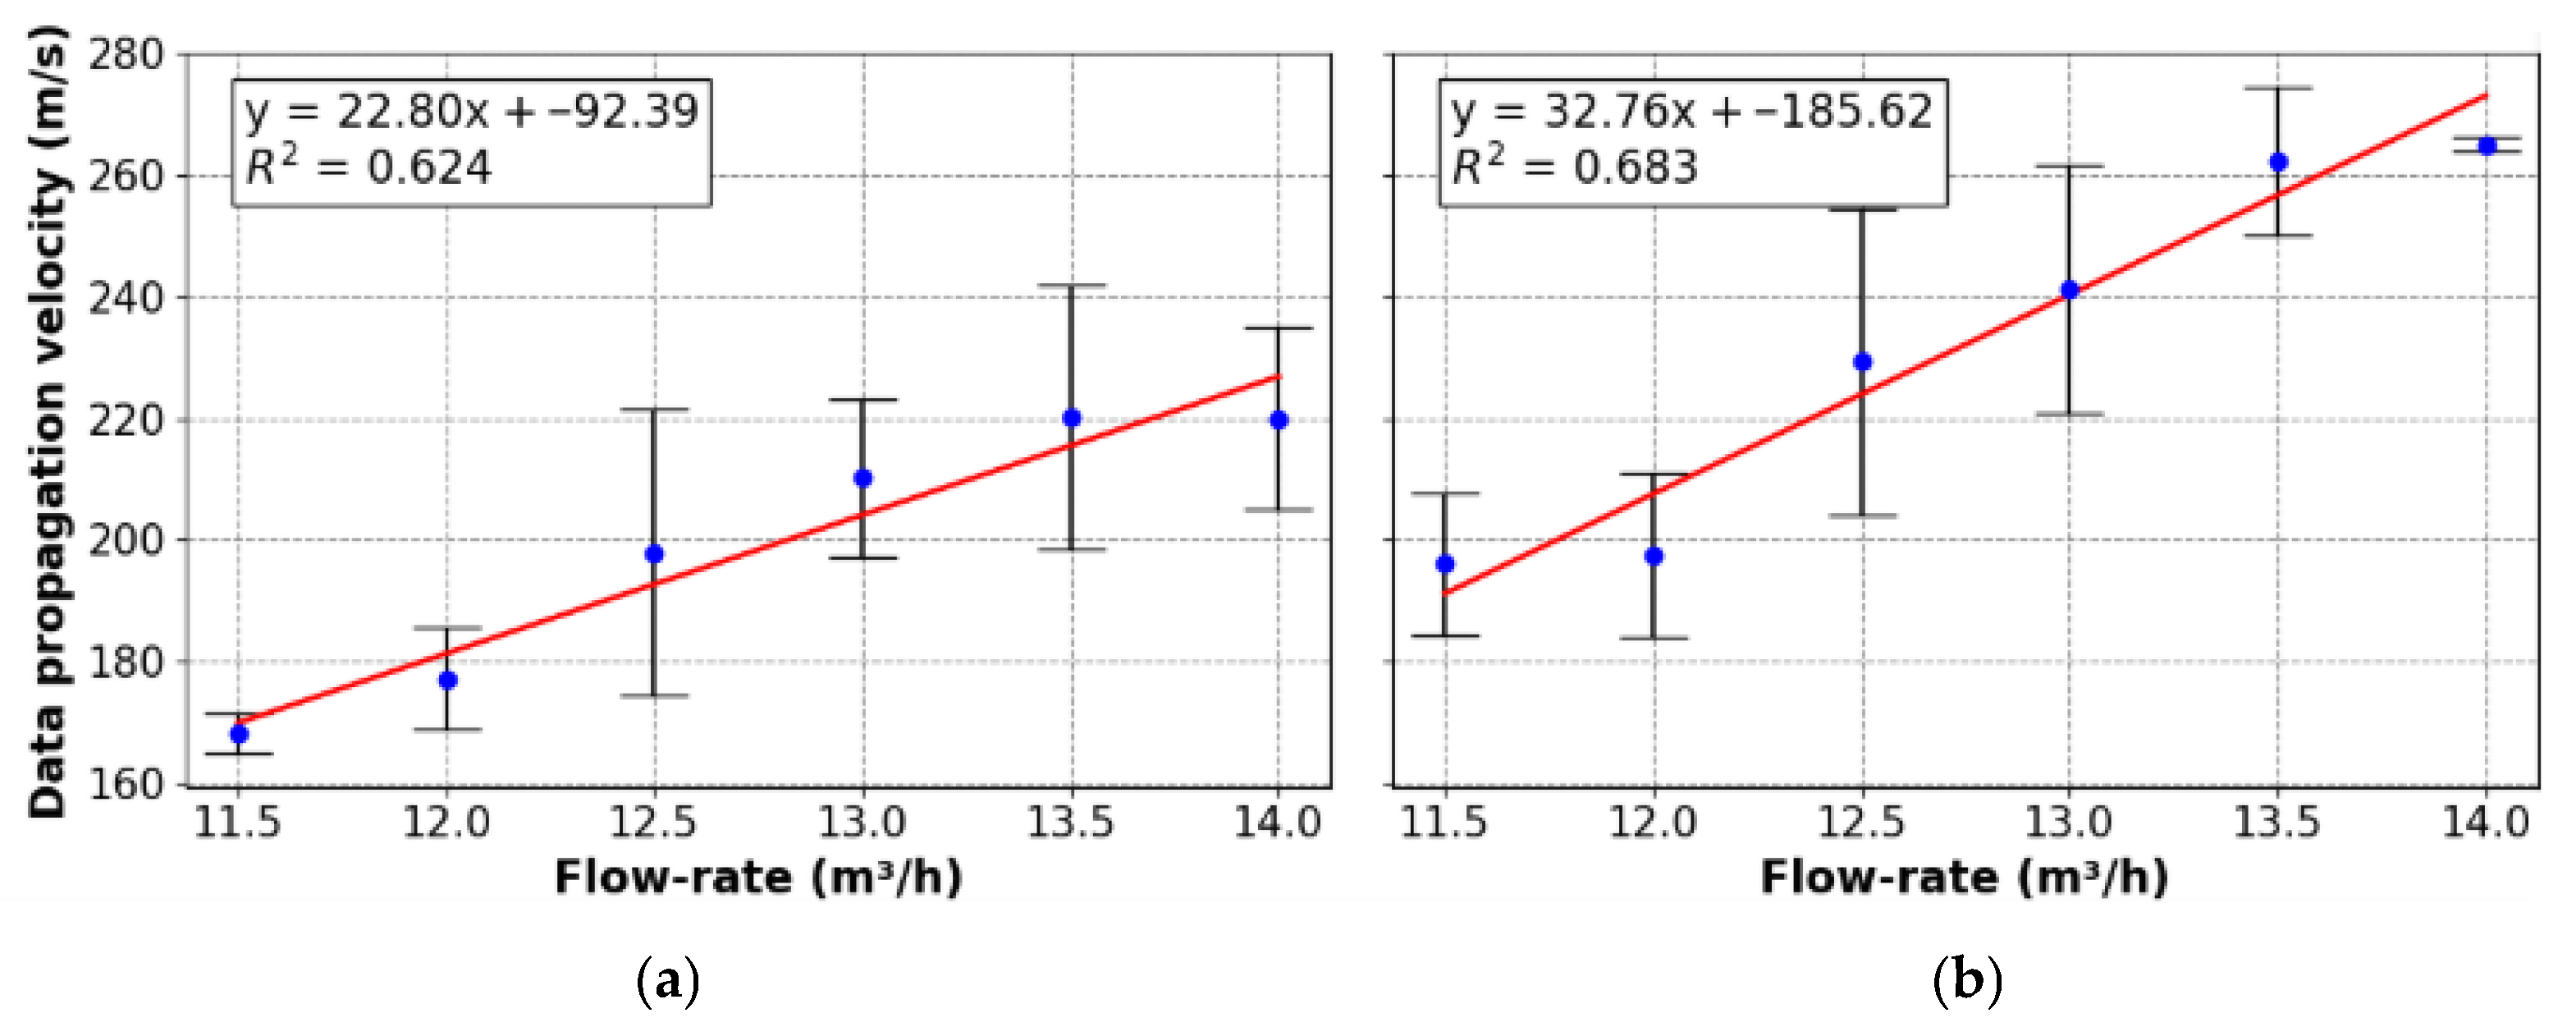
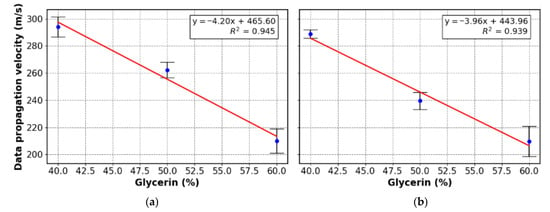
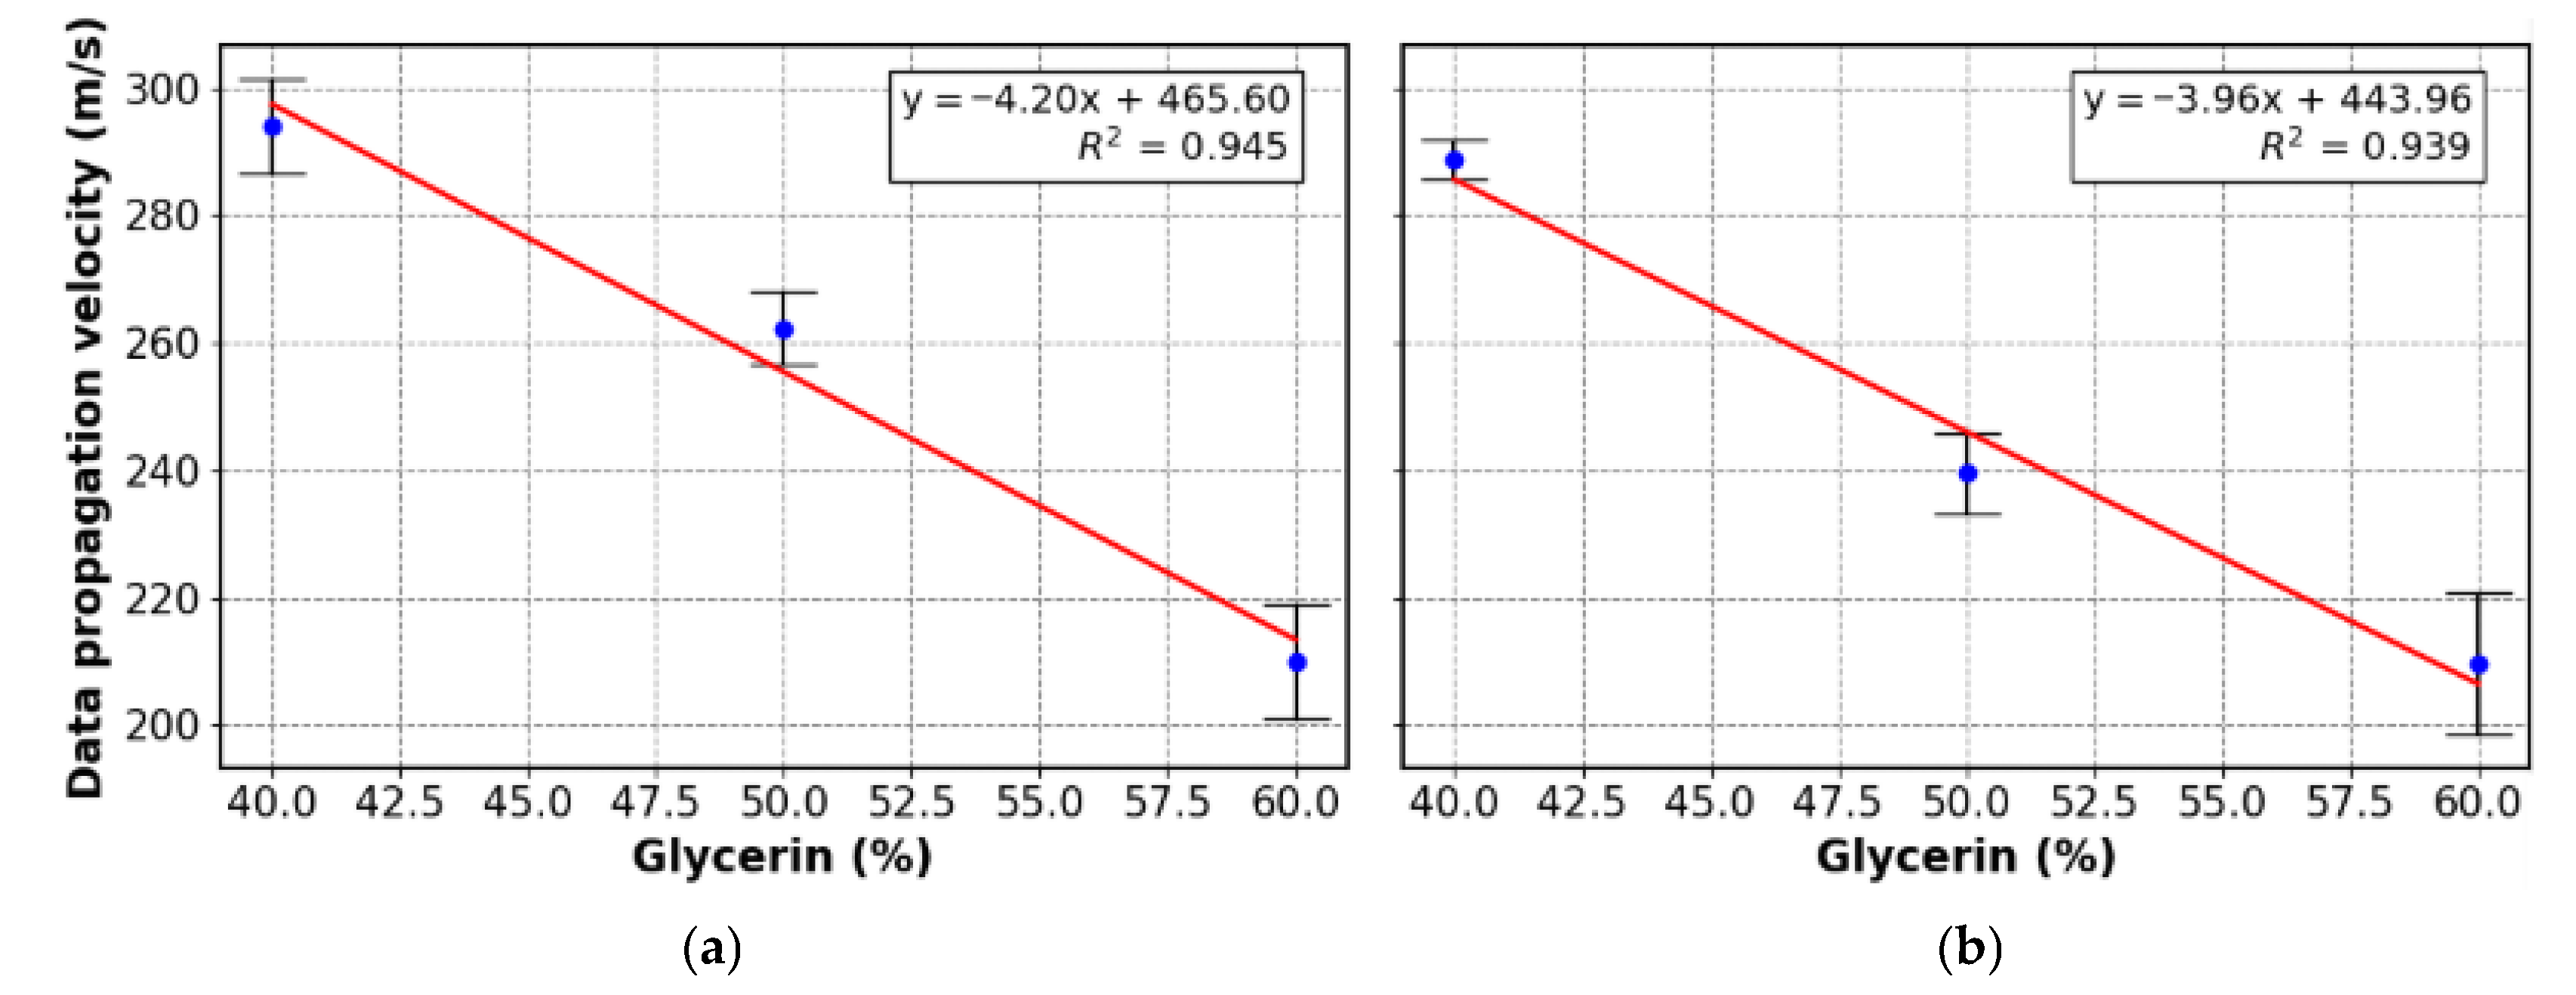

Disclaimer/Publisher’s Note: The statements, opinions and data contained in all publications are solely those of the individual author(s) and contributor(s) and not of MDPI and/or the editor(s). MDPI and/or the editor(s) disclaim responsibility for any injury to people or property resulting from any ideas, methods, instructions or products referred to in the content. |
© 2026 by the authors. Licensee MDPI, Basel, Switzerland. This article is an open access article distributed under the terms and conditions of the Creative Commons Attribution (CC BY) license.