


Abstract
Cardiovascular diseases frequently exhibit overlapping clinical symptoms, complicating the interpretation of disease–symptom relationships and coexisting diagnostic states. This study presents an interpretable logical framework for identifying and structurally analyzing self-consistent diagnostic configurations based on binary disease–symptom relationships. The framework represents diagnostic states as fixed points of a profile-based inference operator H, which determines disease combinations that remain logically consistent with their associated symptom profiles. The analysis considers eight cardiovascular diseases and 28 clinical symptoms derived from anonymized clinical records of 855 patients collected during 2024–2025. The Next Closure algorithm is employed to systematically enumerate the fixed points of the inference operator. Among 256 theoretically possible disease configurations, 148 self-consistent configurations were identified and independently verified through exhaustive enumeration. Structural analysis revealed four model-specific discriminative symptoms, a maximum overlap of nine symptoms between heart failure and pulmonary hypertension, and three two-disease combinations that generated additional logical inferences. The main contribution lies in the explicit characterization of the logical dependencies, symptom-profile overlaps, and structural relationships among self-consistent disease configurations. The proposed framework provides an interpretable representation of disease–symptom relationships rather than a patient-level diagnostic classifier, and its clinical predictive performance remains to be evaluated.
1. Introduction
Cardiovascular diseases remain one of the leading causes of morbidity and mortality worldwide [1]. One of the major challenges in diagnosing these diseases is the occurrence of similar clinical symptoms in different pathological conditions. Signs such as shortness of breath, chest pain, palpitations, dizziness, general weakness, fatigue, edema, and changes in heart rhythm may be characteristic of several cardiovascular diseases. In addition, the coexistence of multiple cardiovascular conditions in the same patient further complicates the interpretation of relationships between symptoms and diagnoses.
Under such conditions, clinical decision-making is not limited to assessing the presence or absence of an individual symptom. It is also necessary to consider combinations of simultaneously observed symptoms, the disease profiles associated with these symptoms, and the diagnostic states that are logically compatible with them. Therefore, in computer-assisted analysis of cardiovascular diseases, it is important not only to obtain a diagnostic output but also to explicitly represent the underlying logical relationships between diseases and symptoms.
In recent years, machine learning, deep learning, and other artificial intelligence methods have been widely used in clinical decision support [2,3]. These approaches make it possible to identify complex patterns in clinical and instrumental data. However, in medical applications, predictive performance alone is insufficient; the reasoning underlying a model’s output should also be understandable and verifiable [4]. In this regard, the development of explainable and interpretable computational models is one of the active research directions in clinical decision support systems [5,6,7].
When the relationships between diseases and symptoms are discrete in nature, representing them using Boolean variables is a natural approach. In this case, the presence of a symptom is represented by the value 1, while its absence is represented by the value 0. Similarly, the active or inactive state of a disease can also be represented using a binary variable. As a result, the relationships between diseases and symptoms can be formally represented through implications, equivalences, and other logical relations. Such a representation makes it possible to directly observe how a diagnostic inference is formed and to verify the logical consistency of the obtained results.
However, for cardiovascular diseases, the problem is not limited to finding a single solution to a given system of logical equations. When different diseases share identical or overlapping symptom profiles, multiple diagnostically plausible disease combinations may arise within the logical model. Therefore, it is particularly important to determine which of the possible disease combinations simultaneously satisfy the specified disease–symptom relationships. Such analysis can help distinguish diseases with similar symptom profiles, identify relationships among diagnostic combinations, and explain why certain combinations lead to the activation of additional diagnoses.
In this study, cardiovascular diseases and their associated clinical symptoms are represented as sets, with each disease characterized by its corresponding symptom profile. The H inference operator is used to examine the logical relationships between disease combinations and their associated symptoms. For a given combination of diseases, the operator identifies additional diseases whose symptom profiles are fully satisfied by the combined set of symptoms. A diagnostic configuration is considered self-consistent when applying the operator does not identify any additional diseases. This approach provides a basis for systematically identifying self-consistent diagnostic configurations and analyzing the logical dependencies among them.
The present study analyzes disease–symptom relationships based on data from 855 patients observed during 2024–2025 at the Samarkand Regional Branch of the Republican Specialized Scientific and Practical Medical Center of Cardiology. The study considered eight cardiovascular diseases and 28 clinical symptoms. The presence of symptoms was recorded based on patient complaints, objective examination, laboratory tests, and instrumental investigations, including electrocardiography and echocardiography.
In the disease–symptom table, the presence and absence of a symptom are denoted by “+” and “−”, respectively. For computational processing, these symbols are encoded as 1 and 0. The binary data formed on this basis are used to formally represent the logical relationships between diseases and symptoms. In the proposed logical model, two types of relationships are considered jointly: the requirement that each observed symptom be explained by at least one active disease and the equivalence between each disease state and its associated symptom profile.
The aim of this study is to develop an interpretable logical computing method for identifying all self-consistent diagnostic configurations based on binary relationships between cardiovascular diseases and their clinical symptoms and for analyzing the structural characteristics of the resulting solution space.
To achieve this aim, diagnostic configurations are formalized as fixed points of the H inference operator. To compute them, a bit-level implementation in C++ using std::bitset is employed, and the Next Closure algorithm is applied to systematically generate self-consistent diagnostic states. In this process, the main focus is not only on finding the solutions, but also on analyzing their composition, the overlap of symptom profiles, the structures of disease co-occurrence, and the ability of certain diagnostic combinations to logically activate other diseases.
The main scientific contributions of this study are summarized as follows:
- Logical formalization of disease–symptom relationships. A unified logical framework is formulated to represent binary relationships between cardiovascular diseases and clinical symptoms. Within this framework, diagnostic configurations are characterized as fixed points of the profile-based inference operator H, providing an explicit representation of self-consistent disease combinations.
- Systematic identification of self-consistent diagnostic configurations. The fixed-point formulation is used to identify the complete set of self-consistent configurations generated by the specified disease–symptom matrix. The completeness of the resulting solution space is independently verified through exhaustive evaluation of all theoretically possible disease combinations.
- Structural characterization of diagnostic relationships. The obtained solution space is analyzed to identify model-specific discriminative symptoms, quantify overlap between disease–symptom profiles, and determine disease combinations that induce additional logical inferences. This analysis provides an interpretable characterization of dependencies among diagnostic configurations within the specified logical model.
The Next Closure algorithm and the C++ implementation based on std::bitset are employed as computational tools for enumerating and verifying the self-consistent configurations. These implementation choices are not presented as independent methodological innovations.
Thus, the contribution of this study lies in the integrated logical formulation and structural analysis of disease–symptom relationships rather than in the development of a new enumeration algorithm or programming technique.
2. Related Work
Research on cardiovascular clinical decision support encompasses several methodological directions, including machine learning, explainable artificial intelligence, rule-based reasoning, and formal logical modeling. These approaches differ in their objectives, representation of clinical knowledge, and interpretation of diagnostic relationships. While predictive methods primarily focus on disease classification and risk estimation, rule-based and formal logical approaches emphasize explicit relationships between clinical observations and diagnostic states. This section reviews these research directions and examines their relevance to the systematic analysis of disease–symptom relationships.
2.1. Machine Learning and Explainable AI in Cardiovascular Diagnosis
Various approaches based on statistical methods, machine learning, deep learning, and logical modeling have been developed for the detection of cardiovascular diseases and clinical decision support. Recent studies have extensively investigated artificial intelligence methods for cardiovascular disease detection, risk assessment, outcome prediction, and patient monitoring [2,3]. Such methods make it possible to identify complex relationships among numerous clinical, laboratory, and instrumental indicators. At the same time, in most of these approaches, the primary task is to predict a disease class or estimate the probability of a clinical event.
Beyond cardiovascular applications, ensemble learning has also been investigated for clinical prediction and disease severity assessment. An ensemble approach for sarcopenia prediction combined multiple classifiers with adaptive synthetic sampling and recursive feature elimination to address class imbalance and select informative features [8]. Extending this direction to severity assessment, a stacked ensemble integrating Random Forest, Gradient Boosting, and Multilayer Perceptron models was developed for multiclass sarcopenia classification, with SHAP analysis used to interpret feature contributions [9]. Together, these studies illustrate how clinical feature processing, model fusion, and prediction interpretation can support medical decision-making. This predictive perspective provides a complementary context for the present study’s analysis of explicit disease–symptom relationships and self-consistent diagnostic configurations.
In automated clinical decision support, model performance must be accompanied by sufficient interpretability to explain how an output is obtained. For this reason, considerable attention is being paid to the development of explainable artificial intelligence methods in medicine [4,5,6]. Existing XAI approaches quantify the contribution of individual clinical features, provide local or global explanations, and improve the transparency of model predictions. For cardiovascular diseases, approaches aimed at the clinical interpretation of predictive model outputs have also been developed [7].
2.2. Rule-Based and Uncertainty-Aware Clinical Decision Support
Within this broader effort to make cardiovascular decision support interpretable, rule-based approaches also represent diagnostic knowledge through explicit decision paths. Taçyıldız et al. developed cardiovascular diagnostic rules using decision tree algorithms after selecting clinical features [10]. Anooj combined automatically generated weighted fuzzy rules and decision tree rules in a clinical decision support system for heart disease risk prediction [11]. These studies illustrate how clinical data can be converted into inspectable rules, while retaining patient classification or risk assessment as the main computational objective. They provide a relevant methodological context for examining how explicit rules can also support the analysis of relationships among diagnostic states.
However, in a large proportion of artificial intelligence methods, explanation is performed after the primary prediction process. In such cases, a statistical or machine learning model first generates a decision, and the reasons for that decision are subsequently explained using a separate mechanism. When the relationships between diseases and symptoms are predefined in an explicit binary form, logical modeling makes it possible to represent the decision-generation process itself in an explicit form. In such an approach, symptoms and diseases are represented by Boolean variables, and the relationships between them can be defined using implications, equivalences, and other logical relationships.
Beyond binary rule representations, fuzzy and belief rule-based systems have been investigated to represent uncertainty in cardiovascular assessment. Sanz et al. combined interval-valued fuzzy sets with a fuzzy rule-based classification system, allowing linguistic labels and inference parameters to be adjusted within the diagnostic model [12]. Kong et al. developed a belief rule-based decision support system for cardiac chest pain that addressed uncertainty in both clinical knowledge and clinical data [13]. More recently, Ali et al. constructed a fuzzy expert system using symptoms, physiological measurements, and biochemical indicators together with an expert-informed IF–THEN rule base [14]. Across these approaches, the form of knowledge representation determines how clinical observations activate rules and how the resulting output can be interpreted.
2.3. Formal Concept Analysis and Logical Modeling
The mathematical foundations for analyzing binary object–attribute relationships, implications, and the closed sets generated on their basis have been developed in [15,16]. In such systems, it is possible to identify states that simultaneously satisfy certain rules and to study their structural properties. In particular, the Next Closure algorithm provides a systematic procedure for enumerating closed sets associated with a closure operator.
Building on these mathematical foundations, subsequent work has examined both the construction of concept structures and their use in medical knowledge discovery. Pei et al. investigated attribute topologies for generating formal concept intensions and constructing concept lattices [17]. In a medical data application, Wang and Wu discretized clinical data, constructed a concept lattice and its hierarchy, and extracted association rules [18]. These contributions connect binary relational representations with the systematic organization of concepts and dependencies. Their relevance to the present study lies in the analysis of closed structures and explicit relationships; the specific closure operation must nevertheless be defined by the disease–symptom semantics of the model under consideration.
Previous studies have explored computational implementations of logical modeling, with particular attention to parallel processing. These efforts include the parallel analysis of binary systems [19], the formulation of disease–symptom relationships as systems of logical equations for identifying diagnostic dependencies [20], and the use of parallel computing to solve such systems in medical diagnosis [21]. Together, these studies establish a methodological foundation for the binary representation of disease–symptom relationships and the computational analysis of the resulting logical models.
Related developments extend concept-based reasoning to uncertain and heterogeneous medical information. Hu et al. proposed an interval three-way concept lattice model for medical diagnosis, combining hierarchical concept representation with decision rules and a strategy optimization model [22]. Chu et al. integrated dominance rough sets and Formal Concept Analysis in a multi-granularity model for clinical decision-making and attribute reduction [23]. These studies show that concept structures can support both knowledge representation and the examination of diagnostically relevant attributes. They also motivate examining which relationships remain visible when disease and symptom profiles are represented in a deliberately discrete form.
2.4. Research Gap and Positioning of the Present Study
Nevertheless, existing studies primarily focus on individual disease prediction, post hoc explanation of predictive outputs, or the identification of solutions to logical equation systems. In cases where the symptoms of multiple diseases substantially overlap, however, it becomes useful to analyze the possible diagnostic combinations jointly within a single logical framework. In particular, it is important to determine which combinations of diseases simultaneously satisfy the given disease–symptom relationships, which combinations form self-consistent solutions, and which initial combinations lead to the activation of other diagnostic states.
Furthermore, determining only the number of diagnostic solutions is not sufficient. Analyzing the degree of overlap among disease profiles, the discriminative properties of certain symptoms for distinguishing diseases, and the structural relationships among diagnostic combinations within the resulting solution space makes it possible to gain a deeper understanding of the structure of clinical data. These aspects are less commonly analyzed together within a unified logical diagnostic framework.
Alongside these formal approaches, recent cardiovascular decision support systems connect structured knowledge with heterogeneous clinical records. Miao et al. integrated multimodal hospital information, extracted medical entities and relationships using natural language processing, and incorporated a clinical knowledge model and rule inference engine into a physician workstation [24]. This work illustrates a setting in which explicit reasoning operates together with data integration and clinical workflow support. Taken together, these research directions motivate a focused examination of the logical relationships within a specified disease–symptom representation, including the configurations preserved by its inference operator and the profile combinations responsible for additional inferences.
Therefore, this study addresses the problem of identifying all self-consistent diagnostic solutions generated on the basis of disease–symptom relationships and analyzing their structural properties. Diagnostic solutions are considered as fixed points of the H inference operator. The Next Closure algorithm is used to systematically generate these solutions, while bit-level representation based on C++ and std::bitset is employed for efficient processing of the binary profiles of diseases and symptoms.
The proposed approach extends beyond the enumeration of solutions to a logical equation system by analyzing the structure of the resulting diagnostic solution space. Specifically, the analysis considers disease combinations, overlap between symptom profiles, model-specific discriminative symptoms, and additional logical inferences induced by initial disease combinations. This makes it possible to represent the internal logical structure of disease–symptom relationships in an interpretable form.
3. Materials and Methods
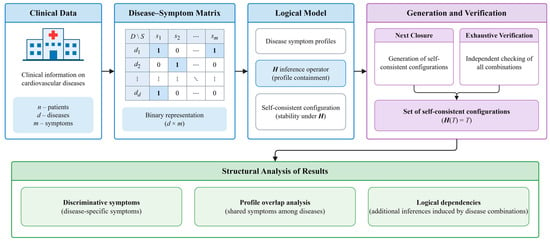
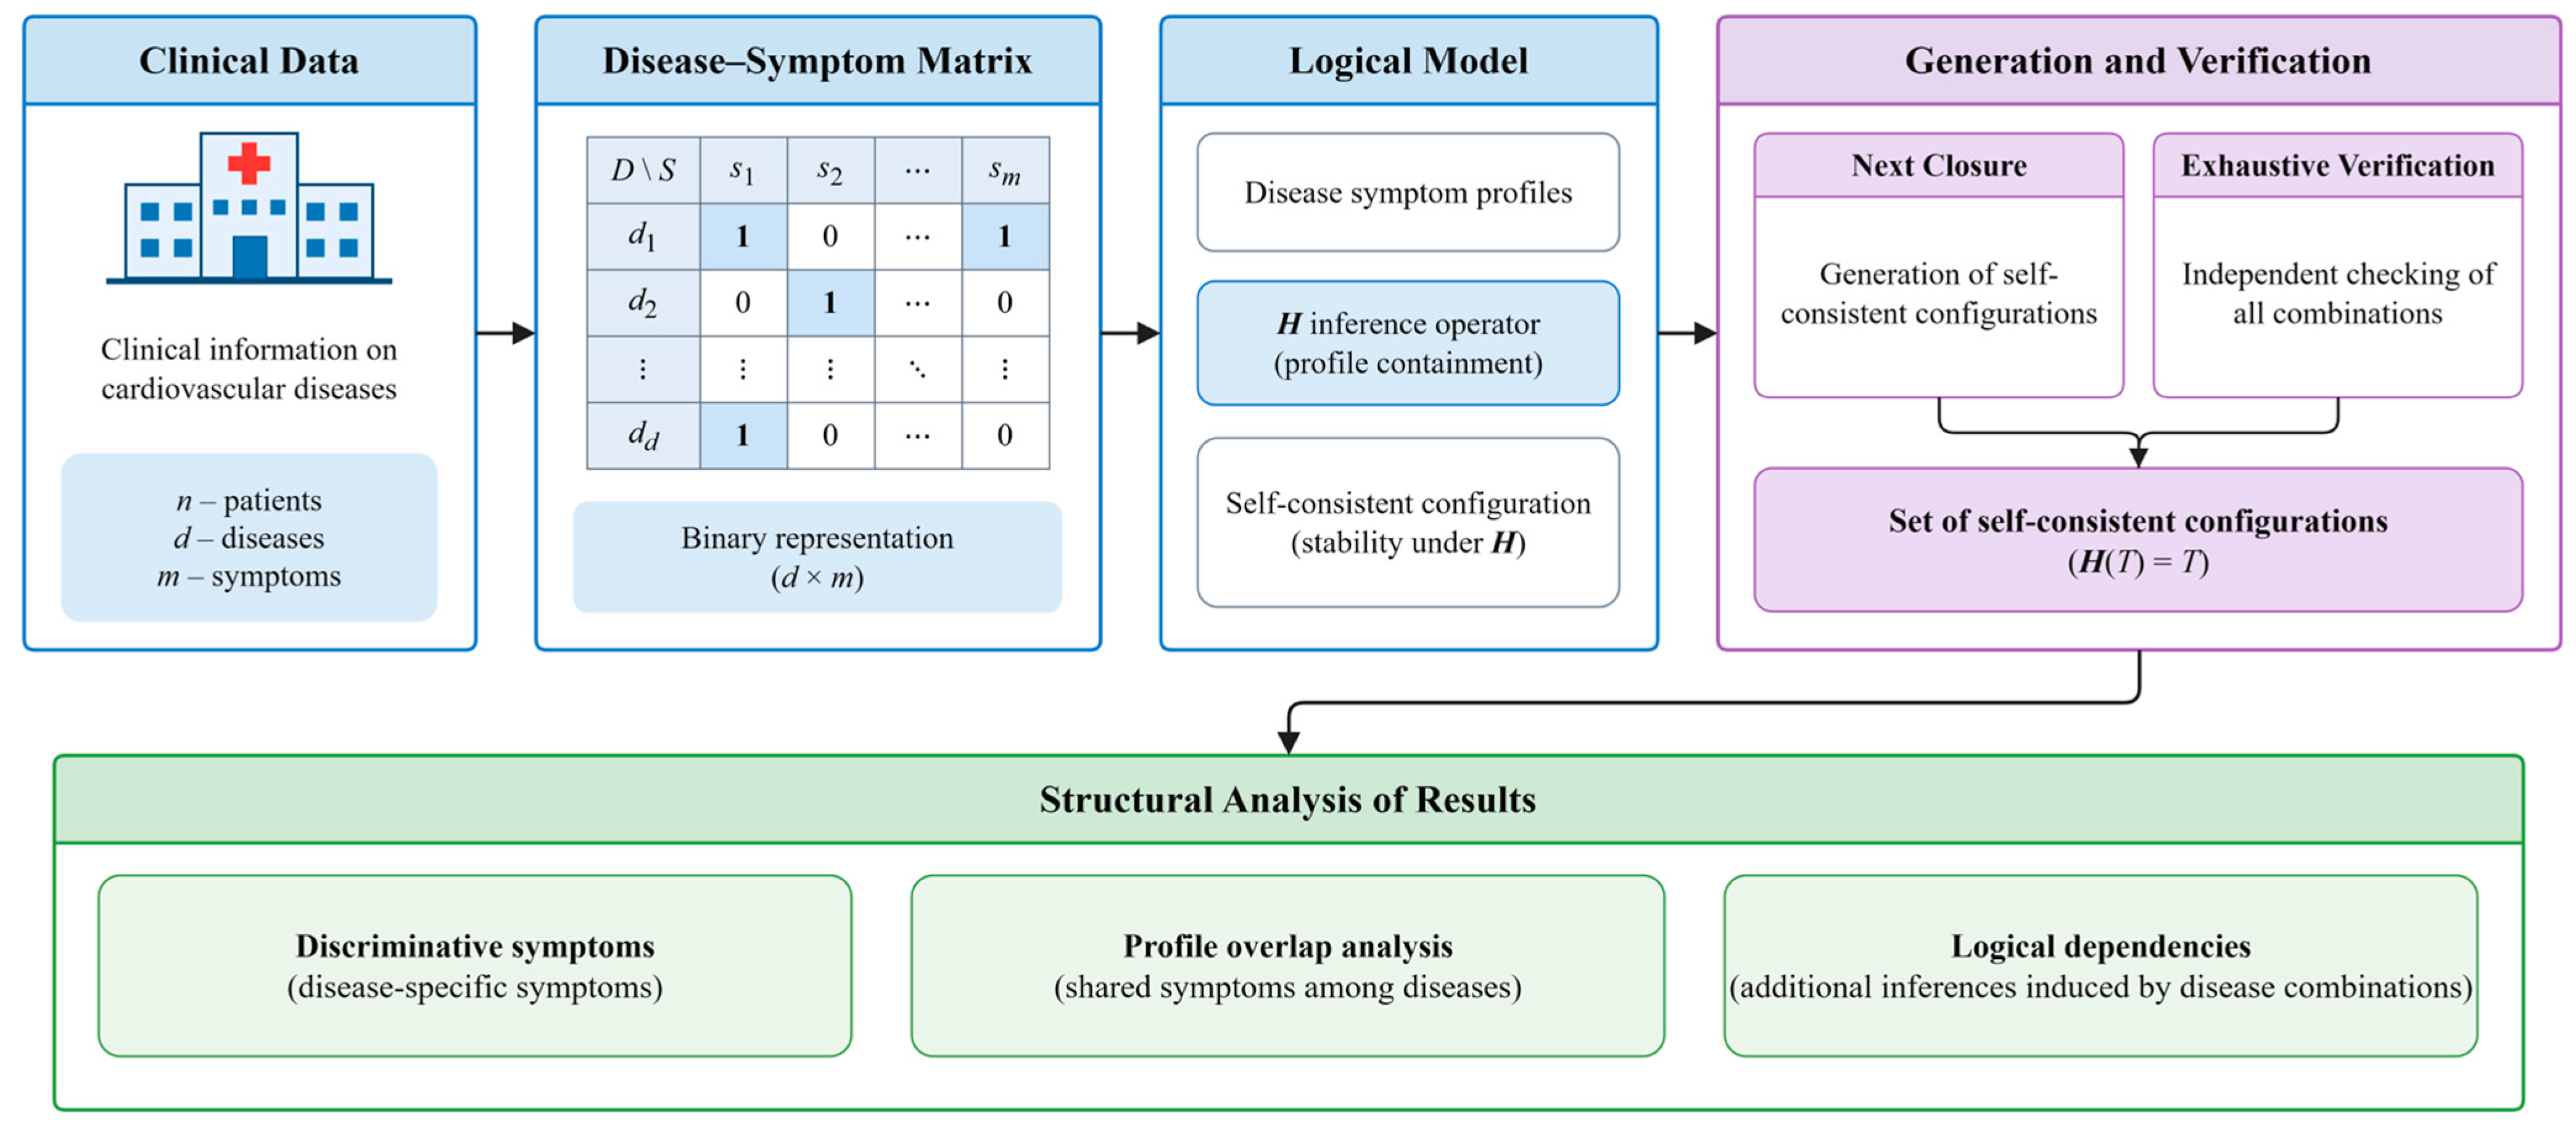
Figure 1 illustrates the overall workflow of the proposed logical framework. Clinical information is first represented as a binary disease–symptom matrix, where each disease is associated with a predefined symptom profile. Based on these profiles, the H inference operator is used to identify self-consistent diagnostic configurations. The Next Closure algorithm systematically generates these configurations, while exhaustive enumeration independently verifies the completeness of the resulting solution set. Finally, the identified configurations are subjected to structural analysis to determine model-specific discriminative symptoms, symptom-profile overlaps, and logical dependencies among disease combinations.
Figure 1.
Overview of the proposed logical framework for analyzing cardiovascular disease–symptom relationships.
For ease of reference, the mathematical notation introduced in the preceding sections and used throughout the remainder of the study is summarized in Table 1.
Table 1.
Mathematical symbols and definitions used in the proposed logical framework.
3.1. Problem Description
The problem considered in this study is the identification and structural analysis of self-consistent diagnostic configurations defined by binary relationships between cardiovascular diseases and their associated clinical symptoms. Given a disease–symptom incidence matrix, each disease is characterized by a predefined symptom profile, and a diagnostic configuration is represented by a subset of active diseases.
The objective is to identify all disease combinations that remain unchanged under the profile-based H inference operator. In addition to determining the complete set of self-consistent configurations, the study aims to examine symptom-profile overlaps, model-specific discriminative symptoms, and logical dependencies among disease combinations. The analysis focuses on the internal consistency and structural properties of the specified logical model rather than patient-level diagnostic prediction.
3.2. Data Description
Anonymized clinical data from 855 patients observed during 2024–2025 at the Samarkand Regional Branch of the Republican Specialized Scientific and Practical Medical Center of Cardiology were used for the study. Patients aged 40–75 years were included in the sample, with a mean age of 58.2 ± 9.4 years, and males accounted for 62% of the sample. The study considered eight diseases of the cardiovascular system and 28 associated clinical symptoms. All clinical data were anonymized before analysis.
The set of diseases was defined in the following form:
where
The set of symptoms was formed as follows:
It included shortness of breath, sharp chest pain, dizziness, palpitations, irregular heartbeat, cough, fainting, feeling ill, nausea, arm pain, peripheral edema, bradycardia, tachycardia, difficulty breathing, fatigue, hemoptysis, lymphedema, apnea, fluid retention in the body, and other clinical signs. The final disease–symptom representation therefore comprised eight cardiovascular diseases and 28 clinical symptoms.
The presence of symptoms was recorded based on the patient’s complaints, objective examination performed by a physician, clinical and laboratory examinations, and the results of instrumental diagnostics, including electrocardiography (ECG) and echocardiography (EchoCG).
The clinical records included information on documented cardiovascular diagnoses and associated symptoms. For the subsequent logical analysis, disease–symptom relationships were organized into a binary incidence matrix, where each entry indicates the presence or absence of an association between a particular disease and symptom. The resulting matrix served as the input for constructing disease-specific symptom profiles and identifying self-consistent diagnostic configurations.
In the subsequent mathematical stage of the study, the patients’ personal identification data were not used; the binary relationships established between diseases and symptoms were analyzed.
3.3. Proposed Logical Computing Method
The proposed logical computing method consists of three main stages: formal representation of disease–symptom relationships, systematic generation of self-consistent diagnostic configurations, and verification and structural analysis of the resulting solution space. First, binary symptom profiles are used to construct the logical diagnostic model and define the H inference operator. Next, the Next Closure algorithm is applied to enumerate the self-consistent configurations, with bit-level operations supporting their computational processing. Finally, the completeness and logical consistency of the generated solutions are verified, and their structural properties are analyzed.
3.3.1. Binary Representation of Disease–Symptom Relationships
The relationship between diseases and clinical symptoms was represented by a binary incidence matrix:
Each element of the matrix was defined as follows:
Thus,
This coding made it possible to process diagnostic data using Boolean algebra operations. In the clinical table, symptom presence and absence were denoted by “+” and “−”, respectively.
For each disease yj the corresponding symptom profile was defined as
Accordingly, each disease was represented by a 28-component binary vector:
For example, if aij = 1, the corresponding symptom xi is included in the symptom profile of disease yj. Thus, if the matrix entry corresponding to arm pain and myocardial infarction equals 1, arm pain is included in the myocardial infarction profile defined by the model. Conversely, aij = 0 indicates that symptom xj is not included in the corresponding disease profile.
Here, the values 1 and 0 do not represent the severity or quantitative degree of the symptom, but only its presence or absence in the current disease–symptom model.
3.3.2. Formation of the Logical Diagnostic Model
In the formal representation of the relationships between diseases and symptoms, two types of logical relationships were taken into account: implication and equivalence.
The first condition links the observed symptom to the active diseases. If a symptom xi is observed, this symptom must be explained by at least one active disease. The set of disease indices associated with symptom xi is defined as
Then, the implication condition for the symptom is expressed as
For example, if a particular symptom is present in several diseases, the presence of the symptom is logically associated with the presence of at least one of those diseases.
The second condition links each disease to its corresponding symptom profile. Since the set of symptoms corresponding to each disease yj is defined as Sj the logical state of the disease is expressed through the following relationship with these symptoms:
Equivalence (10) can be decomposed into two implications:
and
Thus, the equivalence requires both directions to hold within the model: an active disease implies the activation of all symptoms in its predefined profile, while satisfaction of the complete symptom profile implies activation of the corresponding disease.
The complete logical model therefore requires the symptom-to-disease implication and the disease–profile equivalence conditions to hold simultaneously.
As a result, the computational task is formulated as the identification of diagnostic states that simultaneously satisfy all specified logical relationships.
which constitutes the basis for further analysis of self-consistent solutions of the logical equation system.
3.3.3. Set of Active Diseases and the H Inference Operator
For computational convenience, a diagnostic state is represented by the subset of indices corresponding to active diseases.
The compact diagnostic state is defined as
The union of all symptoms associated with the diseases in T is defined as
F(T) represents the set of symptoms that become active in the logical model as a result of the selected combination of diseases.
At the next stage, the diseases whose profiles are completely satisfied by this set of symptoms are determined. For this purpose, the H inference operator is defined as
For a given active disease set T, the symptom profiles of all diseases in T are first combined. The operator H(T) then contains all diseases whose complete symptom profiles are contained in the resulting symptom set.
The profile-containment rule is determined by three main components: the current set of active diseases, the predefined symptom profile of each disease, and the combined symptom set generated by the active diseases. For each disease, the rule checks whether all symptoms in its predefined profile are contained in the combined symptom set. If this condition is satisfied, the disease is included in the output of the H inference operator. Thus, the rule identifies additional disease profiles that are logically implied by the selected configuration. In practical terms, this procedure makes the relationships among disease combinations explicitly traceable, although the inferred states should not be interpreted as confirmed clinical diagnoses.
If
the disease set T is defined as a self-consistent diagnostic configuration.
Thus, the problem of finding system solutions is reduced to identifying all fixed points of the H inference operator:
The proposed mathematical model therefore provides a formal basis for considering self-consistency as a fundamental property of the H inference operator.
It is important to note that H(T) by itself cannot be interpreted as an automatic clinical diagnosis. The operator only formalizes the logical relationships defined within the given disease–symptom model.
3.3.4. Mathematical Properties of the H Operator
The applicability of the Next Closure algorithm is established by verifying that the operator H satisfies the fundamental properties of a closure operator.
Extensivity. For every disease set
the following holds:
Indeed, for every yj ∈ T all of its symptoms are included in F(T). Therefore,
and hence,
Monotonicity
If
then,
Therefore,
Idempotence
The set H(T) contains only those diseases that satisfy the condition
Therefore, when a new disease is added to H(T) its symptoms are already contained in F(T). Consequently,
Hence,
Thus, the H operator satisfies the following properties:
Thus, H is extensive, monotone, and idempotent and therefore defines a closure operator on the disease set. This property enables systematic enumeration of its fixed points using the Next Closure algorithm [15,16].
3.3.5. Generation of Solutions Based on the Next Closure Algorithm
For n = 8 diseases, the total number of possible disease subsets is
In this study, the objective is to identify all subsets T ⊆ Y satisfying the fixed-point condition H(T) = T.
For this purpose, the Next Closure algorithm, based on the systematic generation of the fixed points of the H operator, was used [15,16].
To apply the Next Closure algorithm, the diseases are arranged in a fixed order, which determines the sequence of candidate generation, as follows: y1 < y2<…<ym.
Given a current closed set T and an index i, the corresponding candidate is formed according to the standard Next Closure construction:
A candidate is accepted as the next self-consistent configuration only if it satisfies the following Next Closure ordering condition:
The enumeration procedure begins with the following initial closed state:
Subsequently, the remaining self-consistent configurations are generated in lexicographic order.
As a result, the algorithm generates the complete set of self-consistent diagnostic configurations, expressed as follows:
where
The purpose of using Next Closure is to enumerate the fixed points of H directly and without duplication rather than testing every disease subset as part of the primary generation procedure.
3.3.6. Computational Implementation Based on C++ and std::bitset
The algorithm was implemented in C++. Binary disease states and symptom profiles were represented using the standard-library std::bitset container to enable compact storage and efficient bitwise operations.
C++ was selected because the proposed framework operates on fixed-size binary disease and symptom profiles, which can be efficiently represented and processed using the standard-library std::bitset container. This implementation supports compact data representation and direct bitwise operations without requiring additional software libraries or specialized computational frameworks. The choice of C++ is therefore motivated by the simplicity and suitability of its implementation for the considered logical operations rather than by an assumed performance advantage over other programming environments.
The active disease set T is represented by an 8-bit vector, whereas each disease–symptom profile is represented by a 28-bit vector, sj ∈ {0, 1}28.
Thus, in the implementation:
T ↔ std::bitset < 8>, Sj ↔ std::bitset < 28>.
The set of symptoms generated by the active diseases is calculated using a bitwise OR operation:
Here, ∨ denotes the bitwise OR operation.
To check whether the symptom profile of a particular disease is fully contained in the generated symptom set, the condition Sj ⊆ F(T) is implemented in the form
Accordingly, evaluation of H is reduced to bitwise OR, bitwise AND, and equality comparisons rather than element-wise processing of symptom vectors.
This implementation makes it possible to process the 28 symptoms as a compact bit-level structure and to compare entire symptom profiles at the bit level rather than checking individual symptoms separately.
3.3.7. Organization of Parallel Computation
To improve computational efficiency, independent verification operations were parallelized while preserving the sequential ordering required by the Next Closure procedure. The sequential step that determines the next closed set was kept unchanged, whereas independent profile checks and verification operations were distributed across computational threads.
Since the identification of the next closed state by Next Closure depends on the previous state, the lexicographic order of the algorithm’s solution generation is preserved. However, independent operations associated with candidate evaluation, symptom-profile checks, and verification of generated configurations can be executed in parallel.
When P multiple computational threads are available, independent verification tasks are partitioned among the threads:
where
Each computational thread independently checks F(T), H(T) and the condition
for the configurations assigned to it.
This parallelization affects only the implementation of independent checks and does not alter the set or ordering of closed configurations generated by the sequential Next Closure step.
3.3.8. Verification of Solution Completeness
Because the study considers only eight diseases, completeness of the generated solution set can be independently verified by evaluating all (35) disease subsets.
For each subset T ⊆ Y, the condition H(T) = T was evaluated independently.
Agreement between exhaustive verification and Next Closure enumeration confirms the completeness of the generated fixed-point set.
Exhaustive enumeration is used as a reference baseline for evaluating the completeness of the proposed enumeration procedure. Unlike Next Closure, which generates closed configurations in a systematic order, exhaustive enumeration examines every possible disease subset and evaluates the fixed-point condition using the same H inference operator. This provides an independent reference solution set against which the configurations generated by Next Closure can be compared. The comparison focuses on solution completeness and consistency rather than computational speed or memory efficiency.
3.3.9. Computational Complexity
Let m denote the number of diseases, n the number of symptoms, and w the machine-word size in bits.
A symptom profile of length n requires approximately ⌈n/w⌉ machine words for bit-level processing.
In the worst case, evaluation of H(T) requires checking all m disease profiles.
Therefore, the cost of a single evaluation of H is proportional to the number of disease profiles multiplied by the number of machine words required per symptom profile.
If L is the number of generated self-consistent solutions, the asymptotic complexity of Next Closure generation is expressed as
For the verification stage, where all 2m configurations need to be checked independently, the resulting complexity is
Under ideal load balancing across P threads, the cost of the independently parallelizable verification stage is reduced approximately by a factor of P.
In practice, the execution time also depends on thread allocation, synchronization, and memory-access overhead.
3.3.10. Structural Analysis of the Obtained Diagnostic Solutions
In addition to counting the self-consistent diagnostic configurations, their structural properties were analyzed.
For each self-consistent configuration T, two basic quantities were computed:
– the number of active diseases:
– the number of symptoms in the combined profile:
To assess the symptomatic similarity between disease profiles, the total number of common symptoms between two diseases was calculated:
When necessary, the normalized Jaccard similarity coefficient can also be applied:
For each symptom xi, its disease-profile frequency was calculated as the number of disease profiles containing that symptom.
If
then the symptom xi occurs in only one disease profile in the current disease–symptom matrix and is therefore considered a potentially discriminative symptom within the model.
If
then the symptom belongs to all disease profiles and therefore does not provide information for distinguishing diseases within the current model.
The term “pathognomonic” is intentionally avoided because uniqueness within the present eight-disease matrix does not imply universal clinical specificity.
Two-disease configurations T = {yj, yk} were analyzed separately to determine whether they remained fixed points or generated additional diseases under H.
If
the pair forms an independent self-consistent configuration.
If
the pair induces additional logical inferences within the model.
In the second case, the initial disease combination generated a symptom set that satisfied the profiles of additional diseases and was therefore interpreted as a diagnostic configuration leading to additional logical inferences.
3.3.11. Logical Verification
For each generated self-consistent diagnostic configuration, the defining logical conditions were independently verified.
First, the symptom-profile condition was checked for every active disease.
Second, the equivalence condition was evaluated for all eight diseases.
Together, these checks are equivalent to verifying the fixed-point condition
This verification made it possible to confirm the internal logical consistency of the diagnostic configurations generated by the algorithm. These logical checks assess internal model consistency only and should not be interpreted as measures of patient-level diagnostic performance, such as sensitivity, specificity, accuracy, or F1-score.
4. Results
The proposed logical computing method was applied to a disease–symptom matrix consisting of eight cardiovascular diseases and 28 clinical symptoms. The results were evaluated in terms of the fixed-point solution space, structural properties of disease and symptom profiles, non-self-consistent disease pairs, and logical verification.
4.1. Self-Consistent Diagnostic Solution Space
For eight diseases, the total number of theoretically possible diagnostic configurations is 28 = 256.
Of the 256 possible configurations, 148 satisfied the fixed-point condition H(T) = T, whereas the remaining 108 did not.
Thus, the self-consistent solutions constituted
of the total configuration space and represented the self-consistent solutions of the logical model. The obtained 148 solutions were distributed according to the number of active diseases |T| as follows, as shown in Table 2:
Table 2.
Distribution of self-consistent diagnostic configurations by the number of active diseases.
The largest number of self-consistent configurations was observed for three active diseases (39 configurations, 26.4%), followed by four active diseases (36 configurations, 24.3%). Together, these two groups accounted for 75 of the 148 configurations (50.7%). This distribution was used for further analysis.
These values do not represent the clinical prevalence of three- or four-disease combinations among the 855 patients. Rather, they reflect the structural distribution of the obtained self-consistent solutions within the logical model.
For the empty set
therefore,
is a trivial fixed point. In addition, each of the eight diseases individually also formed a self-consistent solution:
The corresponding disease profiles contained between 7 and 15 symptoms. The individual disease results as shown in Table 3:
Table 3.
Number of symptoms in each individual disease profile.
Within the current matrix, myocardial infarction had the largest symptom profile with 15 symptoms, whereas cardiomyopathy had the smallest with 7 symptoms.
4.2. Distribution of Symptoms in the Solution Space
Among the 148 obtained diagnostic solutions, the frequency of occurrence of symptoms was analyzed. The most frequently occurring symptom in the solution space was general malaise (x10), which appeared in 147 of the 148 self-consistent configurations, i.e., in every non-empty configuration. This occurs because x10 is included in all eight disease profiles.
Some of the most frequently occurring symptoms were as follows (Table 4):
Table 4.
Most frequently occurring symptoms in the 148 self-consistent configurations.
The least frequently occurring symptom was arm pain (x12), which appeared in 44 of the 148 self-consistent configurations (29.7%).
These frequencies describe occurrence within the logical solution space and should not be interpreted as symptom prevalence among the 855 patients. For example, the occurrence of general malaise in 147 of 148 configurations does not imply that the symptom was present in 99.3% of patients.
4.3. Model-Specific Discriminative Symptoms
Analysis of the disease–symptom matrix showed that four symptoms occurred in exactly one disease profile.
If the profile frequency of symptom
then xi is associated with only one disease profile within the current model.
As a result, the following four symptoms were identified (refer Table 5):
Table 5.
Model-specific discriminative symptoms and their associated disease profiles.
These symptoms are termed model-specific discriminative symptoms because their uniqueness is defined only relative to the present eight-disease, 28-symptom matrix. This should not be interpreted as universal clinical specificity.
Conversely, a symptom occurring in all eight disease profiles has no discriminative value for distinguishing diseases within the current model.
4.4. Structural Frequency of Diseases in Self-Consistent Solutions
For each disease yj its frequency of occurrence across the 148 self-consistent configurations was calculated.
These values represent structural frequencies within the logical solution space, not clinical prevalence among the 855 patients. For example, the 54.1% value for mitral valve disease indicates that it appears in 80 of the 148 self-consistent configurations; it does not indicate that mitral valve disease was diagnosed in 54.1% of the patient cohort as presented in Table 6.
Table 6.
Structural frequency of diseases across the 148 self-consistent configurations.
Therefore, this indicator should be interpreted as the structural frequency of a disease within the solution space.
4.5. Mutual Overlap of Disease–Symptom Profiles
To quantify the overlap between two disease–symptom profiles Si and Sj, the number of shared symptoms was calculated as:
The analysis identified the following disease pairs with the greatest overlap:
The greatest absolute overlap was observed between the heart failure and pulmonary hypertension profiles, which shared nine symptoms, as summarized in Table 7.
Table 7.
Disease pairs with the greatest overlap in symptom profiles.
According to the source matrix, the next highest value was observed for the pair of profiles
The next largest overlap was observed between angina pectoris and myocardial infarction:
The aortic valve disease and mitral valve disease profiles shared six symptoms.
These overlaps indicate that some disease profiles are structurally similar within the current symptom matrix; they should not be interpreted as evidence of clinical causality.
An important point is that
Importantly, although the angina pectoris and myocardial infarction profiles share eight symptoms, the angina pectoris profile is not a subset of the myocardial infarction profile. Each profile contains at least one symptom not present in the other.
4.6. Self-Consistent and Non-Self-Consistent Two-Disease Configurations
Among eight diseases, the number of distinct two-disease combinations is .
Of the 28 two-disease combinations, 25 satisfied the fixed-point condition H(T) = T, whereas three pairs generated larger configurations under H.
These three configurations are as follows:
For
For
For
In the first case, the combined symptom set of the profiles y1 and y2 p also satisfies the profile of y7. Therefore, the configuration {y1, y2} is not an independent fixed point.
Similarly, the symptom combination of the configuration {y4, y5} also satisfies the profile of y1, while {y4, y8} additionally activates the profiles of y1 and y5.
These findings do not imply that the corresponding diseases cannot co-occur clinically. They only indicate that, within the present binary disease–symptom model, the initial pair is not an independent fixed-point configuration.
4.7. Partial-Order Stability of Solutions
Because one of the 148 fixed points is the empty set, partial-order analysis was performed on the remaining 147 non-empty self-consistent configurations.
For each non-empty self-consistent configuration T, all non-empty proper subsets T′ ⊂ T, were tested for the fixed-point condition T′ ≠ ⌀.
Of the 147 non-empty configurations, 105/147 = 71.4% had all non-empty proper subsets self-consistent, whereas 42/147 = 28.6% contained at least one proper subset that was not self-consistent.
In this study, this structural property is referred to as partial-order stability.
The term “monotonicity” is deliberately avoided here because monotonicity already denotes the closure-operator property:
Partial-order stability is a structural property of the logical solution space and should not be interpreted as a statement about clinically valid subsets of diagnoses in individual patients.
4.8. Results of Logical Verification
The logical consistency of the 148 obtained configurations was verified separately. For each of the 148 configurations, the implication condition was checked for all 28 symptoms, resulting in 28 × 148 = 4144 implication checks.
The disease-profile equivalence condition was also evaluated for all eight diseases in each configuration, giving 8 × 148 = 1184 equivalence checks.
No violations were detected in any of the 4144 implication checks or 1184 equivalence checks, confirming internal consistency of all 148 fixed-point configurations with respect to the specified logical model.
This logical verification should not be interpreted as 100% clinical accuracy or patient-level diagnostic effectiveness. Internal logical consistency and clinical validation are distinct forms of evaluation.
The completeness of the generated solution space was additionally assessed by comparing Next Closure enumeration with exhaustive enumeration. Both procedures identified the same 148 self-consistent configurations among the 256 possible disease subsets. This agreement provides an independent confirmation that the Next Closure procedure generated the complete set of fixed points for the considered disease–symptom matrix. However, the comparison establishes equivalence in the identified solution sets and does not demonstrate computational superiority over the exhaustive approach.
4.9. Summary of Structural Findings
Among the 256 theoretically possible disease configurations, 148 were identified as self-consistent fixed points of the H inference operator. The largest proportion of the solution space consisted of configurations involving three and four diseases. General malaise occurred in all eight disease profiles and therefore had no discriminative value within the model. In contrast, cough, syncope, arm pain, and lymphedema each occurred in only one disease profile and were identified as model-specific discriminative symptoms.
The greatest profile overlap was observed between heart failure and pulmonary hypertension, which shared nine symptoms: |S5 ∩ S8| = 9.
In addition, among the 28 two-disease combinations, three did not form independent fixed points and instead generated larger configurations under H.
Overall, the framework enables both enumeration of self-consistent configurations and structural analysis of symptom distributions, disease-profile overlap, and logical dependencies among disease combinations.
5. Discussion
The main finding of this study is that 148 of the 256 theoretically possible disease configurations satisfy the fixed-point condition of the H inference operator. This result demonstrates that the specified binary disease–symptom relationships define a restricted set of self-consistent configurations rather than allowing every possible disease combination to remain logically independent. Beyond identifying these configurations, the proposed framework enables the examination of their structural properties, including symptom-profile overlap, model-specific discriminative symptoms, and logical dependencies among disease combinations. These findings should be interpreted as properties of the specified logical model rather than as indicators of clinical prevalence or diagnostic accuracy.
From this structural perspective, the present results can be situated alongside concept-based methods for organizing binary relations and extracting medical rules [17,18]. The 148 fixed points provide an explicit inventory of the disease subsets preserved by the specified inference operator. The connection with closure-based analysis concerns the organization and enumeration of closed states: here, the operator evaluates complete disease profiles against a union of symptom profiles. Consequently, the interpretation of each closed state follows directly from that profile-containment rule, making the origin of additional disease activations available for inspection.
The structural analysis demonstrates that the discriminative relevance of individual symptoms depends on their distribution across disease profiles. Symptoms shared by all considered diseases provide limited discriminatory information, whereas symptoms associated with a single disease profile may help distinguish that profile within the specified matrix. At the same time, substantial overlap between certain disease profiles indicates that symptom-based logical relationships alone may not be sufficient to differentiate clinically related conditions. These findings highlight both the interpretability of the proposed framework and the limitations of relying exclusively on binary symptom information.
The analysis of two-disease configurations further reveals logical dependencies among disease profiles. Specifically, three of the 28 possible disease pairs do not form independent fixed points because their combined symptom profiles satisfy the predefined profiles of additional diseases. This finding illustrates how the H inference operator identifies dependencies that are not immediately apparent when disease profiles are examined individually. However, these additional logical inferences reflect the structure of the binary model and should not be interpreted as evidence of clinical causality or the actual coexistence of diseases in individual patients.
In this context, the joint analysis of symptom discrimination and profile overlap adds a structural view to the rule-based cardiovascular approaches described in [10,11,12,13,14]. Those studies organize clinical evidence into decision paths, fuzzy rules, or belief-based risk assessments. In the present model, the corresponding question is which disease profiles become satisfied when their symptom sets are combined. For each of the three non-self-consistent pairs, this question can be answered by identifying the additional profile contained in the combined symptom set. Thus, the analysis provides a traceable explanation of the model’s diagnostic dependencies alongside the enumeration of its self-consistent configurations.
An important advantage of the proposed approach is its interpretability. The relationships between diseases and symptoms are explicitly represented, while diagnostic configurations are defined as fixed points of the H inference operator. The implementation based on C++ and std::bitset enables efficient computation, while the Next Closure algorithm makes it possible to systematically generate self-consistent configurations.
This emphasis on explicit derivation is also relevant to knowledge-based clinical systems that integrate data processing with rule execution. For example, Miao et al. linked medical entity extraction, structured knowledge, and a rule inference engine within a cardiovascular decision support workflow [24]. In relation to that architecture, the present framework offers a focused structural analysis of a predefined disease–symptom representation. Its outputs identify which configurations remain unchanged under the inference rule and which profile combinations produce additional activations. These outputs provide a concrete basis for reviewing the relationships encoded in the matrix and discussing their interpretation with domain experts.
The agreement between Next Closure and exhaustive enumeration confirms the completeness of the identified self-consistent configurations. Unlike exhaustive enumeration, which evaluates all possible disease subsets, Next Closure systematically generates closed configurations. However, this comparison does not establish computational superiority, as execution time and memory usage were not evaluated. The primary contribution of the present study lies in the interpretable structural analysis of disease–symptom relationships rather than computational performance optimization.
A major limitation is the binary representation of symptoms. The current model does not account for symptom severity, duration, temporal evolution, or quantitative clinical measurements such as ECG parameters, echocardiographic indices, or biomarkers. The resulting fixed points and structural relationships are entirely determined by the initial disease–symptom matrix; therefore, inaccuracies or incompleteness in that matrix directly affect the inferred solution space.
Overall, the proposed method is not intended to replace clinical diagnosis, but rather to analyze the logical structure of disease–symptom relationships and support clinical decisions in an interpretable form.
The present study evaluates logical consistency and structural properties rather than patient-level diagnostic performance. Sensitivity, specificity, predictive accuracy, and related clinical performance measures require a separate validation protocol using individual patient-level ground-truth diagnoses.
Looking ahead, the interval-valued and belief rule-based representations investigated in [12,13], together with the interval and multi-granularity concept models in [22,23], provide relevant methodological directions for incorporating graded or uncertain observations. Such an extension would require an explicit definition of how those observations contribute to profile satisfaction and a corresponding examination of the inference operator’s properties. Patient-level assessment would then complement the structural analysis by testing the resulting outputs against independently established clinical diagnoses. This sequence would retain the current emphasis on inspectable relationships while extending the evidence available for evaluating clinical use.
Future work should evaluate the stability of the disease–symptom matrix across independent cohorts and extend the framework to incorporate graded or quantitative clinical features.
6. Conclusions
This study presented an interpretable logical framework for analyzing binary relationships between eight cardiovascular diseases and 28 clinical symptoms. Diagnostic configurations were formalized as fixed points of the H inference operator and systematically enumerated using the Next Closure algorithm with a C++ implementation based on std::bitset. Among 256 theoretically possible configurations, 148 were self-consistent. Structural analysis identified model-specific discriminative symptoms, substantial overlap between selected disease profiles, and disease pairs that generated additional logical inferences.
The proposed framework provides an explicit representation of the internal structure of disease–symptom relationships but is not intended to replace clinical diagnosis. Its current limitations include binary symptom representation and the absence of patient-level clinical performance validation. Future work should incorporate quantitative clinical variables and evaluate the framework on independent patient cohorts.
Author Contributions
Conceptualization, D.T., N.A. and E.U.; methodology, N.A., E.U. and D.T.; software, N.A., J.U. and D.T.; validation, J.U., N.S. and A.M.; formal analysis, N.A., E.U. and J.U.; investigation, N.A., S.A. and N.S.; data curation, N.A. and S.A.; writing—original draft preparation, D.T. and N.A.; writing—review and editing, E.U., J.U., S.A., N.S. and A.M.; visualization, D.T. and J.U.; supervision, E.U. and A.M.; project administration, A.M. All authors have read and agreed to the published version of the manuscript.
Funding
This research received no external funding.
Informed Consent Statement
Informed consent was obtained from all subjects involved in the study. All clinical data were fully anonymized before analysis in accordance with the requirements of the Ethics Committee of the Samarkand Regional Branch of the Republican Specialized Scientific and Practical Medical Center of Cardiology.
Data Availability Statement
The clinical data analyzed in this study are not publicly available due to patient privacy, confidentiality, and institutional ethical restrictions. The data were anonymized prior to analysis.
Conflicts of Interest
The authors declare no conflicts of interest.
References
- World Health Organization. Cardiovascular Diseases (CVDs). 2025. Available online: https://www.who.int/news-room/fact-sheets/detail/cardiovascular-diseases-(cvds) (accessed on 24 August 2026).
- Bozyel, S.; Şimşek, E.; Koçyiğit Burunkaya, D.; Güler, A.; Korkmaz, Y.; Şeker, M.; Ertürk, M.; Keser, N. Artificial Intelligence-Based Clinical Decision Support Systems in Cardiovascular Diseases. Anatol. J. Cardiol. 2024, 28, 74–86. [Google Scholar] [CrossRef] [Scilit] [PubMed]
- Teshale, A.B.; Htun, H.L.; Vered, M.; Owen, A.J.; Freak-Poli, R. A Systematic Review of Artificial Intelligence Models for Time-to-Event Outcome Applied in Cardiovascular Disease Risk Prediction. J. Med. Syst. 2024, 48, 68. [Google Scholar] [CrossRef] [Scilit] [PubMed]
- Mooghali, M.; Stroud, A.M.; Yoo, D.W.; Barry, B.A.; Grimshaw, A.A.; Ross, J.S.; Zhu, X.; Miller, J.E. Trustworthy and Ethical AI-Enabled Cardiovascular Care: A Rapid Review. BMC Med. Inform. Decis. Mak. 2024, 24, 247. [Google Scholar] [CrossRef] [Scilit] [PubMed]
- Chaddad, A.; Peng, J.; Xu, J.; Bouridane, A. Survey of Explainable AI Techniques in Healthcare. Sensors 2023, 23, 634. [Google Scholar] [CrossRef] [Scilit] [PubMed]
- Sheu, R.K.; Pardeshi, M.S. A Survey on Medical Explainable AI (XAI): Recent Progress, Explainability Approach, Human Interaction and Scoring System. Sensors 2022, 22, 8068. [Google Scholar] [CrossRef] [Scilit] [PubMed]
- Skouteli, C.; Prenzas, N.; Kakas, A.; Pattichis, C.S. Explainable AI Modeling in the Prediction of Cardiovascular Disease Risk. Stud. Health Technol. Inform. 2024, 316, 978–982. [Google Scholar] [CrossRef] [Scilit] [PubMed]
- Ruziboev, A.; Turimov, D.; Kim, J.; Kim, W. Multiclass Classification of Sarcopenia Severity in Korean Adults Using Machine Learning and Model Fusion Approaches. Mathematics 2025, 13, 2907. [Google Scholar] [CrossRef] [Scilit]
- Turimov, D.; Kim, W. Enhancing Sarcopenia Prediction Through an Ensemble Learning Approach: Addressing Class Imbalance for Improved Clinical Diagnosis. Mathematics 2024, 13, 26. [Google Scholar] [CrossRef] [Scilit]
- Taçyıldız, N.N.; Karaman, B.N.; Bağdatlı, Z.; Çiğnitaş, S.; Uçar, M.K. Kardiyovasküler Hastalıkların Belirlenmesi için Yapay Zekâ Yöntemleriyle Kural Tabanlı Teşhis Algoritmalarının Geliştirilmesi [Development of Rule-Based Diagnostic Algorithms with Artificial Intelligence Methods for the Determination of Cardiovascular Diseases]. El-Cezeri 2022, 9, 1265–1273. [Google Scholar] [CrossRef] [Scilit]
- Anooj, P.K. Clinical decision support system: Risk level prediction of heart disease using weighted fuzzy rules and decision tree rules. Cent. Eur. J. Comput. Sci. 2011, 1, 482–498. [Google Scholar] [CrossRef] [Scilit]
- Sanz, J.A.; Galar, M.; Jurio, A.; Brugos, A.; Pagola, M.; Bustince, H. Medical diagnosis of cardiovascular diseases using an interval-valued fuzzy rule-based classification system. Appl. Soft Comput. 2014, 20, 103–111. [Google Scholar] [CrossRef] [Scilit]
- Kong, G.; Xu, D.L.; Body, R.; Yang, J.B.; Mackway-Jones, K.; Carley, S. A belief rule-based decision support system for clinical risk assessment of cardiac chest pain. Eur. J. Oper. Res. 2012, 219, 564–573. [Google Scholar] [CrossRef] [Scilit]
- Ali, S.I.; Bilal, H.S.M.; Hussain, M.; Hussain, J.; Satti, F.A.; Hussain, M.; Park, G.H.; Chung, T.; Lee, S. Ensemble feature ranking for cost-based non-overlapping groups: A case study of chronic kidney disease diagnosis in developing countries. IEEE Access 2020, 8, 215623–215648. [Google Scholar] [CrossRef] [Scilit]
- Ganter, B. Two Basic Algorithms in Concept Analysis. In Formal Concept Analysis; Kwuida, L., Sertkaya, B., Eds.; Lecture Notes in Computer Science; Springer: Berlin/Heidelberg, Germany, 2010; Volume 5986, pp. 312–340. [Google Scholar] [CrossRef] [Scilit]
- Ganter, B.; Wille, R. Formal Concept Analysis: Mathematical Foundations; Springer: Berlin/Heidelberg, Germany, 1999. [Google Scholar] [CrossRef] [Scilit]
- Pei, Z.; Ruan, D.; Meng, D.; Liu, Z. Formal concept analysis based on the topology for attributes of a formal context. Inf. Sci. 2013, 236, 66–82. [Google Scholar] [CrossRef] [Scilit]
- Wang, W.; Wu, Y. Mining association rules in medical data based on concept lattice. In Proceedings of the 2010 8th World Congress on Intelligent Control and Automation, Jinan, China, 7–9 July 2010; pp. 5171–5174. [Google Scholar] [CrossRef] [Scilit]
- Bogdanova, V.G.; Gorsky, S.A. Parallel Implementation of the Logical Method for Solving the Problems of Binary Dynamic Systems Qualitative Analysis. Inf. Math. Technol. Sci. Manag. 2018, 4, 145–154. [Google Scholar] [CrossRef] [Scilit]
- Abdirofiev, N.; Adilova, D. Logical Method for Determining the Connection between Symptoms and Diseases. AIP Conf. Proc. 2024, 3244, 030051. [Google Scholar] [CrossRef] [Scilit]
- Urunbaev, E.; Abdirofiev, N.; Turimov, D. Methods for Solving Systems of Logical Equations Using Parallelization Technology in Medical Diagnostics. Int. J. Theor. Appl. Issues Digit. Technol. 2025, 8, 142–148. [Google Scholar] [CrossRef] [Scilit]
- Hu, J.; Chen, D.; Liang, P. A Novel Interval Three-Way Concept Lattice Model with Its Application in Medical Diagnosis. Mathematics 2019, 7, 103. [Google Scholar] [CrossRef] [Scilit]
- Chu, X.L.; Sun, B.; Chu, X.J.; Wu, J.; Han, K.; Zhang, Y.; Huang, Q. Multi-granularity dominance rough concept attribute reduction over hybrid information systems and its application in clinical decision-making. Inf. Sci. 2022, 597, 274–299. [Google Scholar] [CrossRef] [Scilit]
- Miao, S.; Ji, P.; Zhu, Y.; Meng, H.; Jing, M.; Sheng, R.; Zhang, X.; Ding, H.; Guo, J.; Gao, W.; et al. The Construction and Application of a Clinical Decision Support System for Cardiovascular Diseases: Multimodal Data-Driven Development and Validation Study. JMIR Med. Inform. 2025, 13, e63186. [Google Scholar] [CrossRef] [Scilit] [PubMed]

Disclaimer/Publisher’s Note: The statements, opinions and data contained in all publications are solely those of the individual author(s) and contributor(s) and not of MDPI and/or the editor(s). MDPI and/or the editor(s) disclaim responsibility for any injury to people or property resulting from any ideas, methods, instructions or products referred to in the content. |
© 2026 by the authors. Licensee MDPI, Basel, Switzerland. This article is an open access article distributed under the terms and conditions of the Creative Commons Attribution (CC BY) license.