


Abstract
Electroencephalography (EEG)-based depression detection studies commonly reduce clinical severity scores, such as the Patient Health Questionnaire-9 (PHQ-9), to binary diagnostic labels, thereby discarding ordinal information that may be useful for representation learning. This study proposes PHQ-9-guided ordinal contrastive learning (CE+OC), a training objective that uses PHQ-9 scores as privileged ordinal supervision during training while requiring only EEG at inference. PHQ-9 severity distances guide contrastive pair selection and scale the embedding separation margin, using clinical distances to guide the latent EEG space without an explicit patient-ranking objective. The method was evaluated on the Multi-modal Open Dataset for Mental-Disorder Analysis (MODMA) using strict leave-one-subject-out cross-validation across 53 subjects with 128-channel resting-state EEG. The primary representation finding was improved full-cohort PHQ-9 recoverability: a cross-validated held-out PHQ-9 probe showed that CE+OC increased recoverable PHQ-9 rank correlation from 7.8% to 33.6% (paired two-sided permutation ), an absolute gain of 25.7 percentage points, and reduced mean absolute PHQ-9 error from 27.8% to 22.8% of the 27-point PHQ-9 range (18.1% relative reduction; paired two-sided Wilcoxon ; bootstrap 95% CI for : 3.0% to 49.6%). CE+OC also showed descriptive diagnostic differences on MODMA: AUC increased from 59.8% to 69.3%, balanced accuracy from 59.5% to 66.0%, specificity from 69.0% to 86.2%, precision for major depressive disorder (MDD) from 57.1% to 73.3%, and MDD-F1 from 53.3% to 56.4%. False positives decreased from 31.0% to 13.8% of healthy subjects, although sensitivity decreased from 50.0% to 45.8%. A separate LOSO diagnosis evaluation on the independently acquired Mumtaz cohort achieved an AUC of 85.1%; it provides secondary evidence that the pipeline is feasible in a second cohort, but it is not a cross-dataset transfer experiment. A true-diagnosis-only control achieved and MAE 2.142 points, and within-MDD probe correlation remained negative (). The findings support increased full-cohort PHQ-9 recoverability relative to CE-only, not established information beyond diagnosis; diagnostic difference intervals include zero, and the model is not validated for stand-alone screening.
1. Introduction
Major depressive disorder (MDD) is among the leading causes of global disability, affecting an estimated 280 million individuals worldwide [1]. Clinical assessment commonly relies on structured self-report instruments, most notably the Patient Health Questionnaire-9 (PHQ-9) [2], which assigns severity scores from 0 to 27 across minimal, mild, moderate, moderately severe, and severe categories. Although such instruments are well validated, they remain influenced by self-report variability, interviewer differences, and contextual factors. These limitations have motivated sustained research into objective neurophysiological biomarkers that may complement clinical assessment.
Electroencephalography (EEG) has attracted particular interest as a depression biomarker because it is non-invasive, temporally precise, and relatively accessible. Prior studies have linked MDD to several EEG abnormalities, including frontal alpha asymmetry [3], altered frontal theta activity [4], and disrupted interhemispheric synchrony in the alpha and theta bands [5]. Building on these neurophysiological correlates, machine learning studies have explored automated EEG-based depression classification using handcrafted spectral and connectivity features [6,7,8,9,10], as well as deep convolutional, recurrent, and Transformer-based models trained directly on EEG segments [11,12,13].
Despite this progress, two methodological limitations remain important. Clinical severity information is often collapsed into a binary diagnostic label: when PHQ-9 scores are available, they are typically used only to separate depressed and control participants, discarding the instrument’s ordinal severity structure. This removes clinically meaningful information. Two subjects may share a diagnostic label despite different PHQ-9 scores and symptom burdens. Incorporating this severity gradient during representation learning may instead encourage EEG embeddings to encode clinically relevant structure beyond a binary decision boundary.
Subject-independent evaluation is just as essential in EEG-based depression modeling. EEG signals contain strong individual-specific signatures, including stable spectral characteristics, scalp conductance patterns, and electrode-contact effects; if EEG segments from the same participant appear in both training and test partitions, a model can learn subject identity rather than depression-related neurophysiology, inflating performance estimates [14]. Strict subject-level partitioning, such as leave-one-subject-out (LOSO) cross-validation, together with fold-local normalization, is therefore required to evaluate generalization to unseen individuals.
In this study, we propose PHQ-9-guided ordinal contrastive learning (CE+OC) for severity-aware EEG depression representation learning. The method treats PHQ-9 scores as privileged ordinal supervision during training. Specifically, PHQ-9 distances between subjects guide contrastive pair assignment and scale the required embedding separation margin, encouraging subjects with similar clinical severity to occupy nearby regions of the latent space while separating subjects with larger severity differences. At inference, the model receives only EEG signals and does not require PHQ-9 scores or other clinical metadata. Here, ordinal guidance refers to score-based pair selection and separation margins; patient ranking is not an explicit training target, and the frozen-embedding probe is a post hoc evaluation. As used in this paper, “severity-aware” refers to the use of PHQ-9 distances during training and to full-cohort PHQ-9 recoverability from the embeddings.
The primary scientific question this work addresses is whether PHQ-9-guided ordinal supervision produces EEG representations that retain more recoverable clinical severity information than standard cross-entropy training. To answer this question, we evaluate learned embeddings using a cross-validated, held-out PHQ-9 severity probe independent of the classification head. We report diagnostic classification performance as supporting evidence under the same strict, subject-independent protocol.
The main contributions of this paper are summarized in three points:
- We propose a PHQ-9-guided ordinal contrastive learning objective for EEG depression representation learning. Unlike standard binary diagnosis training, the proposed CE+OC objective uses clinical severity distances as privileged ordinal supervision during training to define contrastive pair relationships and severity-scaled embedding margins, while requiring only EEG signals at inference.
- We introduce and apply a subject-independent severity-representation evaluation protocol. Under strict LOSO validation with fold-local normalization, we use a cross-validated, held-out PHQ-9 probe to test whether frozen EEG embeddings contain recoverable clinical severity information independent of the classification head.
- We provide an empirical analysis of the proposed objective, including MODMA diagnostic ablations, precision–specificity tradeoff analysis, a separate LOSO diagnosis evaluation on the independently acquired Mumtaz cohort, and explicit boundary analysis showing that the supported claim is cohort-level PHQ-9 recoverability rather than fine-grained within-MDD severity ranking.
The remainder of this paper is organized as follows. Section 2 reviews EEG-based depression detection, subject-independent evaluation, contrastive representation learning, and ordinal clinical supervision. It identifies the gap created when PHQ-9 scores are reduced to binary labels. Section 3 describes the preprocessing pipeline, the CNN–Transformer encoder, the PHQ-9-guided ordinal contrastive loss, the ablation settings, the LOSO evaluation protocol, the severity probe, and the statistical analysis. Section 4 opens with a description of the Multi-modal Open Dataset for Mental-Disorder Analysis (MODMA) and Mumtaz datasets before reporting the main MODMA severity-representation findings, diagnostic ablations, precision–specificity tradeoff, and the separate Mumtaz cohort evaluation. Section 5 interprets the results clinically and methodologically, including why the simpler CE+OC objective is preferred over the adversarial/regression extension and why within-MDD severity ranking is not claimed. Finally, Section 6 summarizes the implications of PHQ-9-guided ordinal supervision for severity-aware EEG representation learning and outlines directions for future independent severity validation.
2. Related Work
The related work reviewed here spans four areas that the proposed method draws on: EEG-based depression detection, subject-independent evaluation, contrastive representation learning, and ordinal clinical supervision.
2.1. EEG-Based Depression Detection
Machine learning approaches to EEG-based depression detection have evolved from classical feature engineering to end-to-end deep representation learning. Early studies commonly extracted spectral power, frontal asymmetry, coherence, entropy, and nonlinear complexity features, followed by classifiers such as support vector machines, random forests, or shallow neural networks [6,7]. More recent work has applied convolutional neural networks (CNNs) to single-channel and multi-channel EEG segments [11], recurrent models such as long short-term memory (LSTM) networks to temporal EEG sequences [12], and hybrid CNN–LSTM architectures for joint spatial–temporal modeling [8]. Transformer-based and generative architectures have also recently been explored for EEG depression detection, including generative depression discriminators evaluated on MODMA and external datasets [15]. A recent systematic review reports rapid growth in EEG-based machine intelligence methods for depression diagnosis and monitoring, along with persistent challenges in dataset size, evaluation protocol, and generalization [16].
Several dedicated deep learning architectures have targeted EEG-based depression screening directly. DeprNet is a compact convolutional network trained end-to-end on raw EEG [17], and DepCap combines time–frequency representations with a deep neural classifier [18]. LSDD-EEGNet is an efficient end-to-end convolutional framework evaluated on MODMA [19], while earlier CNN–LSTM sequence-learning models were proposed by Ay et al. [20] and Thoduparambil et al. [21]. More recently, graph-based and Transformer-based architectures such as GCTNet have combined graph convolution with self-attention to model spatial and temporal EEG structure jointly [22]. Across this body of work, PHQ-9 or equivalent severity instruments, when collected at all, are used exclusively to assign the binary diagnostic label, and none of these studies incorporates severity distance directly into the representation-learning objective.
Despite architectural progress, reported performance varies substantially across studies. One major reason is differing evaluation protocols. In particular, epoch-level splitting can lead to optimistic results when correlated EEG segments from the same subject appear in both training and test sets. This issue is especially important in depression datasets, where the number of subjects is often small but each subject contributes many EEG windows.
Mao et al. [15] proposed a generative depression discriminator and reported diagnostic results on MODMA and the Hospital Universiti Sains Malaysia dataset (HUSM). Kwok et al. [23] evaluated fairness and robustness issues across EEG depression datasets, including MODMA and Mumtaz. These studies complement the present work: they primarily address diagnostic performance, generative discrimination, or fairness, whereas the present study focuses on PHQ-9-guided, severity-aware representation learning under strict subject-independent evaluation.
2.2. Subject-Independent Evaluation and Data Leakage
Subject-independent evaluation is essential for clinically meaningful EEG modeling. EEG contains stable individual-specific signatures related to anatomy, spectral profile, electrode contact, scalp conductance, and recording conditions. If training and test sets contain segments from the same subject, a model may exploit these signatures rather than depression-related neurophysiology. Prior work on EEG machine learning has shown that such leakage can substantially inflate reported performance [14]. Recent studies have also examined broader reliability concerns in EEG depression modeling, including fairness and cross-dataset robustness across datasets such as MODMA and Mumtaz [23].
Beyond fairness auditing, some studies have targeted subject independence directly through domain adaptation. Jiang et al. [24] proposed DCAAN, which combines dynamic convolution with adversarial and association domain adaptation to reduce inter-subject distribution shift on MODMA, reporting 86.85% subject-independent accuracy. This line of work is methodologically related to the adversarial subject-disentanglement ablation examined in the present study (Section 5); however, it remains diagnosis-only and does not incorporate PHQ-9 severity distances as supervision.
Accordingly, strict subject-level partitioning, such as leave-one-subject-out (LOSO) cross-validation, provides a more realistic estimate of generalization to unseen individuals. In this work, we perform all evaluations on MODMA under strict LOSO and compute normalization statistics only from the training subjects within each fold.
2.3. Contrastive and Metric Learning in Biomedical EEG
Contrastive learning trains encoders to produce embeddings in which semantically related samples are close and unrelated samples are separated. In computer vision, methods such as SimCLR [25] and MoCo [26] established the effectiveness of self-supervised contrastive learning using augmentation-defined positive pairs. In EEG, contrastive and self-supervised objectives have been used to learn representations from temporal context, masked prediction, and cross-subject pretraining. For example, Banville et al. [27] explored self-supervised temporal representation learning for EEG, while BENDR [28] adapted wav2vec-style pretraining to EEG signals across subjects and tasks. Recent contrastive Transformer-based EEG studies have also aimed at learning transferable EEG representations across datasets [29].
However, most EEG contrastive learning approaches define positive and negative pairs using signal augmentations, temporal proximity, recording context, or subject identity. They do not directly use clinical severity scores to shape the embedding-space geometry. Metric learning methods, including triplet loss [30], further extend contrastive objectives by enforcing anchor-positive–negative relationships with fixed margins. In contrast, the proposed approach uses PHQ-9 severity distances to define contrastive relationships and severity-scaled margins, grounding the embedding geometry in clinical information rather than augmentation heuristics alone.
2.4. Ordinal and Severity-Aware Learning in Clinical Applications
Ordinal supervision has been used in clinical machine learning settings where labels represent ordered disease stages, symptom intensities, or risk scores. Examples include medical image grading [31], pain intensity estimation [32], and biological age prediction [33]. These approaches exploit the fact that ordered labels contain more information than nominal class labels. In mental health research, PHQ-9 scores are widely used for screening and severity stratification [34]; however, EEG depression models typically collapse these scores into binary diagnostic labels.
The Learning Using Privileged Information (LUPI) framework [35] provides a useful conceptual foundation for using auxiliary information during training that is unavailable at inference. In the present study, PHQ-9 scores play this role: they guide representation learning during training but are not required when the trained model is applied to new EEG recordings.
Table 1 summarizes representative studies from each of the four themes reviewed above, together with their dataset context, principal method, and relation to the ordinal severity-aware objective proposed in this work.
Table 1.
Summary of representative EEG-based depression detection and representation-learning studies discussed in this section.
Taken together, the studies in Table 1 point to three recurring problems in the EEG-based depression detection literature. Even when PHQ-9 or an equivalent severity instrument is collected, it almost always ends up being used only to assign a binary diagnostic label, so the ordinal severity gradient the instrument was designed to capture gets thrown away. Subject-independent evaluation is applied inconsistently across this work: many widely cited results come from epoch-level or otherwise looser data splits, which can inflate apparent performance well beyond what generalizes to unseen individuals. And the contrastive and self-supervised EEG representation-learning methods that do exist define their positive and negative pairs through signal augmentation, temporal proximity, or subject identity, never through validated clinical severity distances, so the geometry of the learned embedding space ends up clinically uninformed.
This work sits at the intersection of EEG depression detection, contrastive representation learning, subject-independent evaluation, and clinical severity-aware supervision, and it directly addresses each of the three limitations identified above. To the best of our knowledge, this is the first framework to use PHQ-9 severity distances as privileged ordinal supervision to shape EEG depression representations under strict subject-independent evaluation. Rather than discarding PHQ-9 severity information, the proposed CE+OC objective uses PHQ-9 distances as privileged ordinal supervision that shapes contrastive pair selection and the required embedding separation margin, while still requiring only EEG at inference. All MODMA experiments use strict LOSO cross-validation with fold-local normalization, avoiding the epoch-level leakage risk discussed above. Because the contrastive pair geometry is grounded in PHQ-9 severity distance rather than augmentation or subject identity alone, the proposed loss integrates contrastive representation learning with ordinal, severity-aware clinical supervision. To the best of our knowledge, this combination has not previously been applied to EEG-based depression detection.
3. Materials and Methods
3.1. Overall Framework
Figure 1 summarizes the proposed PHQ-9-guided ordinal contrastive learning framework. A CNN–Transformer backbone encodes preprocessed EEG segments to obtain latent EEG embeddings. The classification head is optimized using two-class cross-entropy, while PHQ-9 scores are used only during training as privileged ordinal supervision. Specifically, PHQ-9 severity distances define contrastive pair relationships and scale the required separation margin in the embedding space. The classifier produces two logits, for healthy control (HC) and major depressive disorder (MDD); their softmax output yields a segment-level . At inference, segment probabilities are averaged to obtain one subject-level MDD probability, which is thresholded to report an MDD or HC prediction. PHQ-9 scores and other clinical metadata are not required at inference.
Figure 1.
Overview of the proposed PHQ-9-guided ordinal contrastive learning framework. MODMA supports PHQ-9-guided training, whereas Mumtaz supports a separate diagnosis-only LOSO evaluation. At inference, EEG yields a subject-level MDD or HC classification without PHQ-9. Arrows indicate the flow of data or processing. Green and orange identify the MODMA and Mumtaz dataset paths, respectively; purple identifies PHQ-9-guided training supervision.
3.2. EEG Preprocessing
We implemented the preprocessing pipeline separately for each recording before the subject-level LOSO split. For MODMA, each raw resting-state EEG recording was arranged as channels by time. Recordings containing 129 channels had the final acquisition-reference channel removed, retaining the 128 EEG channels described by the dataset. To limit extreme amplitude excursions while preserving the waveform, each channel was clipped to its recording-wise mean standard deviations. A zero-phase fourth-order Butterworth band-pass filter (0.5–50 Hz) was then applied independently to every channel at a sampling rate of 250 Hz. Each filtered recording was standardized channel-wise using its own mean and standard deviation; this recording-wise operation used neither diagnosis labels nor information from other subjects.
We divided each standardized MODMA recording into 2-s windows (500 samples) with 50% overlap, corresponding to a stride of 1 s (250 samples). This produced 15,983 windows across the 53 MODMA participants (299–334 windows per subject; mean 301.6). The resulting tensors were transposed to the model input layout , where N is the number of segments, time samples, and channels. Thus, segmentation increased the number of training examples without allowing any segment from a held-out participant to enter training or validation. For Mumtaz, we resampled the eyes-closed recordings to 250 Hz, retained the native 19-channel 10–20 montage, and formed non-overlapping 2-s, 500-sample windows with a 2-s stride. This produced 6400 windows across 45 participants (87–151 windows per subject; mean 142.2).
In addition to the recording-wise signal conditioning described above, each LOSO fold used a second model-input normalization step. For the stored tensors, we computed one mean and standard deviation per time position across inner-training segments and channels. This implemented fold-local operation is distinct from the recording-wise per-channel standardization. We then applied these fixed statistics to the inner-validation and held-out subject segments without refitting. This fold-local operation prevents cross-subject information leakage during model-input normalization.
Table 2 summarizes the preprocessing and segmentation settings.
Table 2.
The EEG preprocessing and segmentation settings.
The encoder receives broadband 0.5–50 Hz waveforms rather than predefined alpha-band power features. Temporal convolutions learn features directly from these inputs, without imposing fixed alpha-band boundaries on feature extraction. Individual alpha peak frequency was not estimated or adjusted. Clipping and filtering do not constitute dedicated EMG removal; residual myogenic activity may remain within the retained frequency range [36].
The additional analyses below estimate individual alpha peaks from the recordings. They do not change the original classifier, and they do not add individualized alpha-band training.
3.3. Additional Physiological Characterization
We added analyses of the spectral content of the recordings and of prediction sensitivity. They leave the original training procedure and classifier unchanged. All 53 MODMA participants stayed in the analysis roster. We assessed subject-level power spectral density (PSD) and individual alpha peak frequency (IAF) separately in the continuous raw recordings and in reconstructed processed recordings. Welch spectra used 4-s Hann windows, 50% overlap and 0.25-Hz spacing at 250 Hz, and channel spectra were averaged over E1 to E128 in the acquisition Cz reference. The descriptive bands were 1 to 4, 4 to 8, 8 to 13, 13 to 30 and 30 to 45 Hz, normalized to power in the 1 to 45 Hz range. These measures describe the recordings; they are not new classifier features. Appendix A specifies the peak reliability criteria, the statistical families and the sensitivity protocols.
The spectral associations used saved probabilities averaged over the original three seeds. The separate sensitivity checks used seed 42 with frozen weights or with previously reproduced, unmodified segment probabilities. We defined approximate frontal and temporal or frontotemporal sensor groups from the dataset and manufacturer documentation. High-frequency power in these groups is a non-specific proxy. The exclusion analysis tests whether predictions stay stable under a fixed ranking rule; it does not identify muscle activity or confirm that it was removed. We did not perform individualized-alpha training or validated cohort-wide EMG removal.
3.4. Model Architecture
The CNN–Transformer architecture receives one EEG segment of shape , where for MODMA and for Mumtaz. It first transposes the segment to a channel-first representation for temporal convolution. The convolutional front-end comprises three temporal blocks. Each block contains two one-dimensional convolutions with batch normalization, GELU activation, dropout, and max-pooling by a factor of two. The three blocks use output-channel widths and kernel sizes , respectively. They compress the 500-sample input into 62 temporal tokens while learning local multi-channel temporal patterns.
Each 128-dimensional convolutional token is linearly projected to a 128-dimensional Transformer space and augmented with learnable positional embeddings. Two pre-normalized Transformer encoder layers, each with four attention heads and a 256-dimensional feed-forward network, model long-range dependencies between the 62 tokens. A final layer normalization is followed by learned attention pooling, which produces a single 128-dimensional segment embedding. The depression classifier maps this embedding through layer normalization, a 128-to-64 fully connected layer, GELU activation, 30% dropout, and a final two-logit output layer. Softmax converts these logits into and . The CE+OC model uses only this encoder and classifier; the full ablation additionally activates a PHQ-9 regression head and a gradient-reversal subject-classification head. The shared encoder and diagnostic head are unchanged across configurations.
Table 3 summarizes the encoder architecture and fixed hyperparameters.
Table 3.
The CNN–Transformer architecture and fixed hyperparameters.
3.5. PHQ-9-Guided Ordinal Contrastive Loss
Let denote the 128-dimensional latent embedding of EEG segment i, and let denote the corresponding subject-level PHQ-9 score. For every mini-batch of size B, embeddings are first -normalized, and all pairwise Euclidean distances are computed. PHQ-9 distances then define positive and negative pair sets. The implementation uses a positive-pair threshold and a negative-pair threshold . Positive pairs satisfy
whereas negative pairs satisfy
For each negative pair, the required separation margin is scaled according to the clinical severity distance:
where 27 is the maximum PHQ-9 score and is the global margin scale used in the primary CE+OC experiment.
For each anchor i, the hardest positive is selected as the most distant positive embedding. The ordinal contrastive loss is then defined as
where denotes the negative set for anchor i, is the set of anchors with at least one positive and one negative, and is Euclidean distance between -normalized embeddings. Anchors without eligible pairs are excluded; if is empty, the loss is zero.
The total training objective for CE+OC is
Here, is the class-weighted two-class cross-entropy classification loss and controls the contribution of the ordinal contrastive term. PHQ-9 scores enter only through during training. During inference, the model receives only EEG segments and outputs a depression probability from the trained classification head. This design follows the LUPI paradigm [35], in which auxiliary information shapes the hypothesis space during training but is not required at test time.
Algorithm 1 summarizes the objective calculation for one mini-batch.
| Algorithm 1 The PHQ-9-guided ordinal contrastive learning for one mini-batch. |
|
3.6. Training Configurations
Three training configurations were evaluated in the original three-seed experiments, as summarized in Table 4. The CE-only baseline uses standard two-class cross-entropy without ordinal supervision. The CE+OC+Adv+Reg condition combines cross-entropy, ordinal contrastive loss, a gradient-reversal subject adversary intended to encourage subject-invariant embeddings, and an auxiliary PHQ-9 regression term. The proposed CE+OC configuration combines cross-entropy with the PHQ-9-guided ordinal contrastive loss only, omitting the adversarial and regression components. All configurations use the same encoder backbone and identical evaluation splits. We report the ablation outcomes in Section 4.3.2.
Table 4.
The training configurations. The empirical ablation results are reported in Section 4.3.2.
Table 5 lists the optimization settings.
Table 5.
The optimization settings for the primary MODMA LOSO experiments.
3.7. Subject-Independent Evaluation Protocol
All MODMA experiments follow strict leave-one-subject-out (LOSO) cross-validation. In each of 53 folds, we hold out one complete participant as the test subject. The remaining 52 participants are split at the subject level into 47 inner-training subjects and 5 inner-validation subjects (10% of available training subjects, selected with seed 42). Across folds, this corresponds to approximately 14,183 inner-training windows (range: 14,151–14,186), 1498 inner-validation windows (range: 1498–1500), and 302 held-out test windows (range: 299–334) per fold. No EEG segment from the held-out subject is used for model fitting, early stopping, class-weight estimation, weighted sampling, fold-local normalization fitting, or threshold selection. We train three independently seeded models (42, 52, and 62) per fold for the original comparisons; the additional R1–R6 controls use seed 42 and matched saved seed-42 references. For each held-out participant, segment probabilities are averaged first across segments and then across seeds, yielding one subject-level MDD probability. For the primary comparison on both cohorts, a subject probability of at least 0.5 is reported as an MDD prediction; otherwise, it is reported as HC. We compute diagnostic metrics from these 53 subject-level predictions.
For the independently acquired Mumtaz cohort, we perform a separate LOSO diagnosis evaluation across the 45 available subjects. Each fold contains 40 inner-training and 4 inner-validation subjects, with one held-out test subject. This corresponds to approximately 5683 inner-training windows (range: 5673–5737), 575 inner-validation windows (range: 571–593), and 142 held-out test windows (range: 87–151) per fold. We train and evaluate models within Mumtaz; we do not transfer MODMA-trained model weights to this cohort. The original Mumtaz analysis selected thresholds using fold-internal validation subjects. For the revised primary comparison, we apply the same fixed 0.5 rule as MODMA to the saved held-out probabilities, without refitting models or selecting thresholds from test labels; the original validation-calibrated operating points remain distinct.
Table 6 summarizes the subject splits and segment counts for both datasets.
Table 6.
Exact segment accounting under the strict subject-level LOSO protocols. Segment counts are reported after preprocessing and windowing.
3.8. Severity Representation Probe Protocol
To evaluate whether the learned EEG embeddings encode recoverable clinical severity information without using the classification head, we implemented a cross-validated held-out severity probe. Within each LOSO fold, we used frozen embeddings from all non-held-out subjects to train a ridge regression model to predict the PHQ-9 score. We then applied the fitted probe to the held-out subject’s frozen embedding to generate a PHQ-9 prediction. This process yields one held-out PHQ-9 estimate per subject across all 53 folds. This analysis does not involve the classification head or updating the encoder. It does not establish independence from diagnosis information learned during encoder training. As label-only controls, we assign each held-out subject the non-held-out group mean PHQ-9 score using either the true diagnosis (an explanatory oracle) or the CE+OC hard predicted diagnosis; the held-out PHQ-9 value is excluded from both group means. We report Spearman rank correlation and mean absolute error (MAE) between predicted and true PHQ-9 scores across held-out subjects.
3.9. Statistical Analysis
All inferential units are subjects. For CE+OC versus CE-only, we report two-sided paired Wilcoxon testing of absolute PHQ-9 errors and a two-sided subject-wise swap permutation test (20,000 draws) for the difference in full-cohort Spearman correlation. Holm adjustment is applied to these two exploratory severity comparisons. A separate correction family covers the eight additional R1–R4 full-cohort severity tests (four controls, each assessed for correlation difference and absolute error); it is not pooled with the original two tests. R5–R6 and subgroup outcomes are exploratory. These family-specific adjustments do not provide simultaneous error control across every analysis in the paper. Paired, diagnosis-stratified subject bootstrapping (5000 resamples) provides 95% intervals for diagnostic metric differences; an exact McNemar test compares paired subject correctness at the common 0.5 threshold. The original paired severity-probe bootstrap used 10,000 subject resamples. We report three individual-seed subject-level metrics and the ensemble separately. Other subgroup and diagnostic comparisons are exploratory; no claim of diagnostic superiority is based on an unadjusted p-value. Single-subject test folds do not supply valid per-fold AUC or balanced accuracy for a Wilcoxon comparison. Accordingly, diagnosis inference uses paired subject decisions and cohort-level metric differences, rather than treating segment predictions as independent observations. LOSO training sets overlap; subject-resampling intervals summarize uncertainty in the saved prediction comparisons and do not replace replication in an independent cohort.
4. Experimental Results
4.1. Dataset Description
Table 7 summarizes the datasets, their diagnostic composition, and their roles in this study.
Table 7.
The datasets used in this study, including subject counts and study role.
An exploratory sex-stratified audit of the same held-out probabilities is shown in Table 8. These are small descriptive subgroups, not independent validation cohorts or a test of hormonal effects.
Table 8.
Exploratory MODMA diagnosis performance by recorded sex at the 0.5 threshold. Counts are held-out subjects, not EEG windows; no subgroup significance is claimed.
The MODMA metadata report 11 women and 13 men among the 24 participants with MDD, and 9 women and 20 men among the 29 healthy controls (Table 9). The two-sided Fisher exact test for a sex-by-diagnosis association gives . This small sample does not establish equivalence between groups. Menstrual-cycle or hormonal-phase information was not available in the supplied metadata and could not be included in the model or adjusted analysis.
Table 9.
MODMA participant characteristics from the supplied subject metadata.
4.1.1. MODMA Primary Dataset
We used the Multi-modal Open Dataset for Mental-Disorder Analysis (MODMA) [37] as the primary dataset. It contains 128-channel resting-state, eyes-closed EEG recordings from 53 subjects, including 24 individuals diagnosed with major depressive disorder (MDD) by professional psychiatrists according to Diagnostic and Statistical Manual of Mental Disorders, Fourth Edition (DSM-IV) criteria, and 29 healthy controls. PHQ-9 scores are available for all participants, making MODMA suitable for PHQ-9-guided ordinal contrastive learning and for evaluating whether learned EEG representations preserve clinical severity information. We used MODMA for all primary training experiments, ablation analyses, and severity representation probes.
4.1.2. Mumtaz Independent-Cohort Dataset
We used the EEG-based Diagnosis and Treatment Outcome Prediction dataset [38], publicly available through Figshare (DOI: 10.6084/m9.figshare.3385168), as an independently acquired second cohort for diagnosis evaluation. The dataset was collected at Hospital Universiti Sains Malaysia using a 19-channel 10–20 EEG montage. After preprocessing and retaining the eyes-closed condition, 45 subjects were available, including 30 MDD patients and 15 healthy controls. A dedicated LOSO protocol trained and evaluated models within this cohort; it did not directly transfer MODMA-trained weights. The public release does not include subject-level PHQ-9, Beck Depression Inventory (BDI), or Hamilton Depression Rating Scale (HAM-D) scores. Therefore, we did not use this dataset to evaluate PHQ-9 severity representation.
4.1.3. Wireless PHQ-9 Dataset
We explored a third wireless EEG dataset containing 31 subjects during development. It includes 18 depressed participants and 13 healthy controls recorded using a 14-channel wireless EEG headset. In the public files, PHQ-9 information is available only through group assignment, with healthy controls defined as PHQ-9 and depressed subjects defined as PHQ-9 . Exact subject-level PHQ-9 scores were not available. Because the proposed ordinal contrastive objective requires exact severity distances, we excluded this dataset from the main analysis and discuss it only as a limitation for external severity validation. Table 7 summarizes the subject counts, diagnostic composition, and role of each dataset used in this study.
4.2. Evaluation Metrics and Computational Environment
We calculate all reported diagnostic quantities from one aggregated prediction per held-out subject, rather than from individual EEG windows. For the positive MDD class, sensitivity denotes recall, specificity denotes healthy-control recall, precision denotes the proportion of predicted MDD cases that were correct, and MDD-F1 is the positive-class F1-score. Balanced accuracy is the mean of sensitivity and specificity, and AUC is the area under the receiver-operating-characteristic curve calculated from the subject-level probabilities (53 for MODMA and 45 for Mumtaz). We evaluate the PHQ-9 severity probe using Spearman rank correlation, mean absolute error (MAE), paired Wilcoxon signed-rank testing of held-out absolute errors, and 10,000-iteration stratified paired bootstrap confidence intervals for differences between CE-only and CE+OC. Bold values in result tables identify favorable point estimates (higher performance or fewer false positives), not statistical significance.
We implemented experiments in Python 3.10.20 with PyTorch 2.5.1 (CUDA 12.1), NumPy 2.2.6, SciPy 1.15.3, and scikit-learn 1.7.2. We ran training on an NVIDIA GeForce RTX 4050 laptop GPU with 6 GB of graphics memory. We used deterministic seeds for the three-run ensemble in each fold. Table 10 summarizes the computational setting and the outcome definitions used throughout this section.
Table 10.
The evaluation metrics and computational environment.
4.3. Quantitative Results
4.3.1. MODMA LOSO Diagnostic Performance
Table 11 presents the primary subject-level diagnostic comparison between standard CE-only training and the proposed CE+OC configuration under strict LOSO cross-validation on MODMA. To avoid ambiguity, the F1-score is reported as positive-class F1 for the MDD class, sensitivity is MDD recall, specificity is healthy-control recall, and precision is MDD precision. The table is organized around the clinically relevant operating-point tradeoff: CE+OC improves AUC, balanced accuracy, specificity, MDD precision, and MDD-F1 while slightly reducing sensitivity. Table 11 summarizes these subject-level diagnostic metrics for CE-only and CE+OC under strict LOSO evaluation.
Table 11.
The primary MODMA LOSO diagnostic comparison (N = 53). All metrics are percentages except FP/HC and FN/MDD counts.
Figure 2 compares subject-level diagnostic performance across the three training configurations.
Figure 2.
The MODMA subject-independent LOSO diagnostic performance across the three training configurations.
Figure 3 shows their subject-level confusion matrices at the common 0.5 threshold.
Figure 3.
Subject-level confusion matrices for the three MODMA training configurations at the common 0.5 threshold.
The proposed CE+OC objective shows a different observed false-positive profile. Compared with CE-only, CE+OC increases AUC from 59.8% to 69.3%, balanced accuracy from 59.5% to 66.0%, specificity from 69.0% to 86.2%, MDD precision from 57.1% to 73.3%, and MDD-F1 from 53.3% to 56.4%. False positive classifications decrease from 9 to 4 out of 29 healthy subjects, reducing from 31.0% to 13.8% of the healthy cohort. These point estimates are reported alongside paired uncertainty intervals below.
The improvement is not uniform across all diagnostic metrics. Sensitivity decreases from 50.0% to 45.8%, corresponding to one additional missed MDD subject. Therefore, we interpret the diagnostic effect of CE+OC as a precision–specificity improvement with a modest sensitivity tradeoff, not a universal classification improvement. CE+OC detects 11 of 24 MDD participants and misses 13; this operating point is not validated for stand-alone screening. Applications prioritizing MDD detection would require independent threshold calibration and clinical validation.
Table 12 reports individual-seed mean ± sample SD for the original three seeds, separately from the ensemble metrics.
Table 12.
MODMA seed variation calculated from one held-out probability per subject for each seed. Values are mean ± sample SD across seeds 42, 52, and 62; ensemble outcomes are reported separately.
4.3.2. Ablation Analysis
Table 13 shows that adding subject-adversarial training and auxiliary severity regression to CE+OC does not improve performance. The CE+OC+Adv+Reg configuration obtains 61.1% AUC and 56.0% balanced accuracy, below the proposed CE+OC configuration. This ablation supports the simpler CE+OC formulation as the primary model at the tested settings; the joint ablation alone cannot identify the individual component effects. Table 13 summarizes the AUC and balanced accuracy obtained by each of the three training-objective configurations.
Table 13.
The MODMA training objective ablation compares CE-only, CE+OC+Adv+Reg, and the proposed CE+OC configuration.
Paired diagnosis-stratified bootstrap 95% confidence intervals for CE+OC minus CE-only are percentage points for AUC and points for balanced accuracy; both include zero. Exact McNemar testing gives (seven subjects correct only under CE+OC; three only under CE-only). Diagnostic differences are therefore descriptive rather than established classification superiority.
4.3.3. Severity Representation Probe
Table 14 reports the cross-validated held-out PHQ-9 severity probe, which directly evaluates whether the learned EEG embeddings contain recoverable clinical severity information independently of the classification head. Figure 4 visualizes held-out PHQ-9 predictions for CE-only and CE+OC embeddings. Table 14 summarizes the Spearman correlation, p-value, and mean absolute error obtained by the held-out severity probe for each representation.
Table 14.
Held-out PHQ-9 probe and diagnosis-only controls (). The predicted-label control uses CE+OC’s hard MDD prediction; the oracle uses the held-out true diagnosis. Both map the selected label to the non-held-out group’s PHQ-9 mean. MAE is in PHQ-9 points.
Figure 4.
The cross-validated held-out PHQ-9 severity probe: predicted versus true PHQ-9 scores for CE-only and CE+OC embeddings.
The severity probe evaluates recoverable full-cohort PHQ-9 information after encoder training. CE+OC embeddings yield a held-out PHQ-9 Spearman correlation of (), compared with () for CE-only embeddings. Expressed as percentages for interpretability, recoverable PHQ-9 rank association increases from 7.8% to 33.6%, an absolute gain of 25.7 percentage points. The bootstrap 95% confidence interval for this gain is 3.0% to 49.6%, excluding zero.
Mean absolute PHQ-9 error decreases from 7.509 to 6.154 points. Relative to the 27-point PHQ-9 scale, this corresponds to a reduction from 27.8% to 22.8% of the full severity range, or an 18.1% relative reduction in prediction error. The bootstrap 95% confidence interval for ΔMAE is PHQ-9 points, and a paired two-sided Wilcoxon test gives . The paired two-sided permutation test for the correlation difference gives ; Holm-adjusted values for these two outcomes are 0.022 and 0.031, respectively. The individual-correlation p-values above test correlation against zero, not the difference between objectives.
This analysis is independent of the classification head: the Ridge probe is trained only on frozen embeddings from non-held-out subjects within each LOSO fold and then applied to the held-out subject. The probe therefore assesses PHQ-9 recoverability separately from the classification head, without establishing information beyond diagnosis. The true-diagnosis oracle gives and MAE 2.142 points; the predicted-label control gives and MAE 6.815 points (Table 14). The oracle uses the held-out true diagnosis and is an explanatory control, not an EEG-only predictor.
Within the MDD subgroup alone, both representations yield negative severity correlations (CE+OC: , ; CE-only: , ). The full-cohort association should therefore not be interpreted as demonstrated fine-grained severity ordering within MDD. Healthy PHQ-9 scores range from 0–5 and MDD scores from 11–24; 651 of 664 eligible distinct-subject negative pairs (98.0%) span the two diagnosis groups.
4.3.4. Additional Single-Seed Reviewer Controls
These supplementary controls extend, rather than replace, the original three-seed experiments and figures. Each condition R1–R6 completed all 53 MODMA LOSO folds with model seed 42 and the same subject splits, encoder, implemented fold-local scaler, and held-out probe procedure as the saved seed-42 references. These are additional single-seed comparisons; their values must not be substituted for the original three-seed ensemble results.
Table 15 specifies the objectives and settings of the additional single-seed controls.
Table 15.
Additional seed-42 objectives. CE has coefficient 1 throughout; auxiliary terms not listed are disabled.
R1 assigns pseudo-scores 0 and 27 from the diagnosis label, without clinical PHQ-9 distances. For R1, R4, R5, and R6, positive pairs have a score gap of at most 5 and negatives have a gap of at least 10; the contrastive reduction compares the hardest positive with all eligible negatives on normalized embeddings. R1 therefore has a negative-pair margin of 1. R4 fixes the margin at 0.5. R5 and R6 retain the clinical OC margin with . R2 uses same-diagnosis positives and temperature 0.1. R3 and R6 use the existing PHQ-9 SmoothL1 head. The subject adversary in R5 uses gradient reversal. These comparisons hold the backbone and evaluation protocol fixed but do not constitute independently tuned baselines. A within-MDD ranking term is disabled in all six controls. No hyperparameter search is inferred from these controls.
Table 16 reports their diagnostic and severity-probe outcomes alongside the matched seed-42 references.
Table 16.
Additional single-seed controls and matched saved seed-42 references. Diagnosis uses threshold 0.5; MAE is in PHQ-9 points. All rows contain 53 held-out subjects.
Among these matched seed-42 comparisons, CE+OC has the highest observed diagnostic AUC and full-cohort probe correlation. This is a descriptive ordering, not evidence of diagnostic superiority. Across the eight prespecified R1–R4 severity comparisons (four controls, each tested for full-cohort correlation and absolute error), only the CE+OC versus R1 correlation difference survives Holm correction: unadjusted paired permutation , adjusted . The R1 MAE comparison has unadjusted paired two-sided Wilcoxon and adjusted . No R2–R4 severity comparison survives this correction. The correlation tests used 20,000 paired subject-wise permutation draws. R5–R6 component comparisons are exploratory and are outside this eight-test family; they are not presented as multiplicity-adjusted discoveries.
R6, the isolated regression addition to OC, gives AUC 0.447 and overall probe , compared with 0.711 and 0.459 for matched CE+OC; its probe MAE is 8.902 versus 5.989. R5 also performs worse descriptively. These observations show that adding either auxiliary term at the tested settings did not improve the matched reference; they do not establish the cause or rule out better tuning. Within-MDD correlations remain negative. Moreover, the true-diagnosis group-mean oracle achieves and MAE 2.142, so the R1 result does not establish useful within-diagnosis severity ranking or information beyond the true diagnosis. Hyperparameter sensitivity and EMG robustness experiments remain unfinished.
4.3.5. Independent-Cohort LOSO Diagnosis Evaluation on Mumtaz
For MODMA, the supplementary analyses add limited regional window-exclusion and frozen-model frequency-sensitivity checks, reported separately in Appendix A. Hyperparameter sensitivity and validated cohort-wide EMG source removal remain uncompleted, and the new checks do not confirm that EMG was eliminated.
Table 17 reports the separate LOSO diagnosis evaluation on the independently acquired Mumtaz cohort. Figure 5 shows the corresponding ROC curves. This experiment retrains and evaluates the pipeline within Mumtaz and is therefore not a direct MODMA-to-Mumtaz transfer experiment.
Table 17.
Separately trained within-Mumtaz LOSO diagnosis evaluation (). Threshold-dependent metrics use the same 0.5 decision rule as MODMA. All metrics are percentages except FP/HC and FN/MDD counts.
Figure 5.
Subject-level ROC curves from separately trained within-Mumtaz LOSO diagnosis models.
The independent-cohort diagnosis evaluation applies the CNN–Transformer pipeline to a second cohort with a different acquisition setting and a 19-channel montage. CE-only achieves 85.1% AUC versus 84.4% for the diagnosis-label contrastive control. At the common 0.5 threshold, both give 60.0% balanced accuracy, 100.0% sensitivity, and 20.0% specificity (12/15 healthy controls classified as MDD). These threshold-dependent values are recomputed from saved probabilities and kept distinct from the original validation-calibrated operating points.
The diagnosis-label contrastive condition uses binary diagnosis labels in place of PHQ-9 scores as contrastive pseudo-severity because Mumtaz does not provide subject-level clinical severity metadata. It should therefore be interpreted only as a diagnosis-level contrastive control, not as independent validation of PHQ-9-guided severity representation learning. All PHQ-9 severity representation claims are based on the MODMA severity probe in Section 4.3.3.
4.4. Additional Frequency and Artifact-Sensitivity Results
A reliable raw IAF was detected in 47/53 participants by simple-peak estimation, in 38/53 by approximate background adjustment and in 47/53 by specparam. Simple IAF correlated with the saved three-seed CE+OC probability (, pointwise 95% CI , Holm ). The specparam estimate showed a similar association (, CI , Holm in a separate family). The approximate background adjustment gave no association that remained significant after correction (Holm ). No diagnosis-group or PHQ-9 association survived correction in the primary raw or specparam families. The supported finding is therefore a covariation between an individual spectral descriptor and the existing diagnostic probabilities. It is not a demonstrated depression-specific alpha shift (Table A1).
Excluding each participant’s highest-scoring 20% of frontal and temporal high-frequency-proxy windows left all 53 diagnostic decisions unchanged. AUC changed from 0.71121 to 0.70833 (paired difference , pointwise 95% CI ), and the mean absolute probability change was 0.01128 (CI ). The 10% rule also left all decisions unchanged, and the 30% rule changed one decision adversely. The separate frozen-model low-pass filters reduced balanced accuracy to 0.44828. They also changed the input scale and a prominent 50-Hz component. Table A2, Table A3 and Table A4 report every exclusion and filtering condition. The two kinds of intervention test different sensitivities, so they are not interchangeable evidence of artifact rejection.
4.5. Interpretation of Experimental Findings
The experimental findings have two distinct levels of evidence. The primary statistically supported result is the severity-probe improvement: CE+OC increases the recoverable PHQ-9 rank association from 0.078 to 0.336 and reduces MAE from 7.509 to 6.154 points under fully held-out subject evaluation. In contrast, the diagnostic improvements on MODMA are directionally favorable but descriptive, because the bootstrap confidence intervals for the CE+OC–CE-only AUC and balanced-accuracy differences include zero. The contribution is therefore evidence about full-cohort PHQ-9 recoverability under clinical-score-guided training, with the diagnosis-only controls defining its interpretive limits.
At the diagnostic operating point, CE+OC trades a small sensitivity reduction (50.0% to 45.8%) for substantially improved specificity (69.0% to 86.2%) and MDD precision (57.1% to 73.3%), reducing false positive classifications from nine to four healthy participants. The ablation further shows that adding subject-adversarial training and PHQ-9 regression does not improve the simpler CE+OC configuration in this 53-subject LOSO setting. The separate Mumtaz cohort evaluation, for its part, demonstrates that the diagnosis pipeline is feasible under a different acquisition setting and 19-channel montage, but it neither transfers MODMA-trained weights nor validates the PHQ-9 representation claim, since the public release contains no subject-level severity scores.
5. Discussion
5.1. PHQ-9-Guided Supervision and PHQ-9 Recoverability
The severity probe result in Section 4.3.3 is the central scientific finding of this work. PHQ-9-guided ordinal contrastive training produced EEG embeddings with more recoverable full-cohort PHQ-9 information than standard CE-only training under strict subject-independent evaluation. We demonstrated this using a held-out PHQ-9 probe independent of the classification head and trained only on non-held-out subjects within each LOSO fold. CE+OC improved Spearman correlation by and reduced mean absolute PHQ-9 prediction error by approximately 18%, with bootstrap confidence intervals excluding zero.
These findings support the motivating hypothesis that PHQ-9 scores should not be used only to derive binary diagnostic labels. The PHQ-9 is a validated instrument for depression severity measurement and screening [2,34]; when used as privileged ordinal supervision during training, its score distances guide pair selection and separation margins in the EEG embedding space. The probe evaluates the resulting representation rather than only the classification output. The true-diagnosis oracle and negative within-MDD correlation limit interpretation of this full-cohort effect (Section 4.3.3).
5.2. Interpretation of Diagnostic Effects
CE+OC produced descriptive diagnostic improvements over CE-only, including a 9.5-percentage-point increase in AUC and a reduction in false positive classifications from 9 to 4 among 29 healthy subjects. The specificity gain from 69.0% to 86.2%, together with the MDD precision gain from 57.1% to 73.3%, describes the observed operating point but does not by itself establish clinical benefit. Screening instruments and algorithmic screening outputs are not diagnostic assessments; a positive MDD output requires clinical evaluation, diagnostic confirmation, and appropriate follow-up [2,34,39]. The loss encourages separation of score-dissimilar pairs; this training rationale does not establish the physiological mechanism of the observed diagnostic differences.
At the same time, CE+OC decreased sensitivity from 50.0% to 45.8%, corresponding to one additional missed MDD subject relative to CE-only. This indicates a specificity–sensitivity tradeoff; the model still misses 13 of 24 MDD participants at this threshold and is not validated for stand-alone screening. Whether this tradeoff is acceptable depends on the intended clinical use and must be established prospectively with an application-specific operating threshold; depression screening recommendations state that screening should be coupled to systems for diagnostic assessment and follow-up [39]. In settings where missing depressed patients is more costly, sensitivity-weighted training, threshold recalibration, or cost-sensitive decision rules would be required.
Because the bootstrap confidence intervals for the diagnostic improvements include zero, we interpret these classification results as descriptive supporting evidence rather than statistically definitive evidence of classification superiority. The paired severity analyses support a relative improvement in full-cohort PHQ-9 recoverability, without establishing information beyond true diagnosis.
5.3. Comparison with Representative State-of-the-Art Studies
The diagnostic values in this study should be compared with the representative studies in Table 1 only with careful attention to the evaluation target. For example, Jiang et al. reported 86.85% subject-independent accuracy on MODMA using dynamic convolution and feature adaptation [24], whereas the proposed CE+OC configuration obtains 66.0% balanced accuracy and 69.3% AUC under 53-fold LOSO evaluation. These are not interchangeable quantities: accuracy is prevalence-dependent, while balanced accuracy weights MDD and HC recall equally, and the studies differ in preprocessing, model selection, window aggregation, and experimental implementation. LSDD-EEGNet, GCTNet, and the generative discriminator of Mao et al. likewise pursue binary diagnostic discrimination on MODMA or related EEG cohorts [15,19,22] but do not report the held-out PHQ-9 representation-probe endpoint introduced here.
Accordingly, we do not claim diagnostic state-of-the-art performance. Rather, the comparison clarifies what CE+OC contributes: a PHQ-9-guided representation objective evaluated under strict subject-independent LOSO, a severity-recoverability endpoint, and subject-level diagnostic performance reported together with its uncertainty. The current evidence concerns the tested representation objective rather than superior diagnostic accuracy; a matched architecture benchmark would be needed to rank diagnostic methods. This distinction is particularly important because reported EEG depression results can vary substantially when the split unit, preprocessing, or aggregation unit changes [14,23].
5.4. Boundary of the Severity Claim
The full-cohort severity probe shows that CE+OC improves recoverable PHQ-9 information across all subjects. However, within the MDD subgroup alone, PHQ-9 correlations remain negative for both CE-only and CE+OC. This limits interpretation of the full-cohort improvement as fine-grained ordering among MDD patients, particularly because diagnosis and PHQ-9 ranges are closely associated in this cohort.
The present results support increased full-cohort PHQ-9 recoverability relative to the tested CE-only reference. PHQ-9 guides training; explicit patient ranking is not the model objective. They do not support the stronger claim that the model accurately ranks mild, moderate, and severe MDD patients. Fine-grained within-MDD severity prediction may require larger MDD cohorts, repeated clinical assessments, multimodal clinical features, or objectives specifically designed for within-class ordinal ranking.
5.5. Effects of the Auxiliary Adversarial and Regression Components
The CE+OC+Adv+Reg ablation, which adds a gradient-reversal-based subject adversary and auxiliary severity regression to CE+OC, underperformed the simpler CE+OC configuration across the reported metrics. This joint ablation does not isolate the subject-adversarial effect. Additional R5 and R6 controls separately test adversarial and regression additions at seed 42; both are descriptively weaker than matched CE+OC (Section 4.3.4).
One possible explanation is that individual EEG characteristics and clinical presentation are partially entangled with 47 inner-training subjects and 5 inner-validation subjects in each fold. In principle, auxiliary objectives may compete with the diagnostic or contrastive terms; this explanation was not directly tested here. Adversarial domain-invariance methods are known to be sensitive to the relationship between nuisance variables and task-relevant variables [40]. Subject-adversarial disentanglement may be more appropriate in larger multi-site datasets where subject identity, recording site, and clinical signal can be more reliably separated. In the present study, the ablation supports CE+OC as the preferred configuration.
5.6. Independent-Cohort Diagnosis Evaluation
The separate LOSO evaluation on the Mumtaz dataset provides secondary evidence that the CNN–Transformer diagnosis pipeline can be trained and evaluated on an independently acquired cohort with a different acquisition setting and a 19-channel montage. The CE condition achieved AUC = 0.851 on Mumtaz. This result demonstrates within-cohort application under a different acquisition setting, but it is not a direct MODMA-to-Mumtaz transfer experiment because the model was trained within the Mumtaz LOSO folds.
However, Mumtaz does not provide subject-level PHQ-9, BDI, or HAM-D severity scores in the public release. Therefore, this evaluation cannot support claims about PHQ-9-guided severity representation learning. We interpret the Mumtaz result as an independent-cohort diagnosis evaluation only, while the PHQ-guided representation analysis rests on MODMA. At the common 0.5 threshold, Mumtaz specificity is 20.0% for both conditions despite their higher AUC values.
5.7. Clinical Implications
The methodological implication is that PHQ-9 scores can guide EEG representation learning without requiring those scores at inference. PHQ-9 is a well-established severity measure and screening instrument [2,34]. During training, its scores act as privileged ordinal supervision that shapes the embedding space. During inference, the trained model requires only EEG input. This design is applicable when clinical scores are available during dataset construction but unavailable at inference. The resulting MDD probability is a research decision-support output, not a replacement for clinical diagnosis; any real-world screening workflow would require diagnostic assessment and follow-up systems [39].
Severity-aware EEG representations may be useful beyond binary diagnosis. If a representation preserves more clinical severity information, it may provide a stronger foundation for research on treatment response prediction, longitudinal monitoring, risk stratification, and patient subgroup discovery. These possibilities require prospective validation and should not be inferred as demonstrated clinical uses from the present dataset. This study shows increased full-cohort PHQ-9 recoverability relative to CE-only under strict subject-independent evaluation; the oracle and subgroup results constrain its clinical interpretation.
5.8. Physiological Interpretation of the Additional Analyses
The IAF results relate an independently measured feature of frequency structure to the existing model outputs, and they complement the original representation-learning comparison. Periodic and aperiodic parameterization separates oscillatory peaks from background power, which conventional band summaries can conflate [41]. However, no MDD-HC difference in IAF survived correction, so we cannot claim alpha slowing, and band-stop filtering of the alpha band left the diagnostic decisions unchanged. The associations therefore do not establish an alpha-specific computational mechanism. The within-MDD correlations between IAF and the diagnostic probability are separate from the PHQ-9 severity probe, and they do not show that the model ranks severity within MDD. Missing peaks and the lack of hormonal-phase measurements limit the interpretation further.
The regional exclusion result indicates that seed-42 subject-level predictions are stable under the specified high-frequency ranking rule. It does not show that the EEG is free of EMG. Muscle activity overlaps lower EEG frequencies [36], and ranking windows within a recording can keep sustained contamination or discard neural activity. The loss of performance under low-pass filtering is a separate limitation. Those filters also attenuate a large 50-Hz component and change the input scale, so the experiment cannot separate muscle from neural contributions or identify the cause of the loss. Together, the analyses give a physiological characterization and a bounded set of sensitivity checks. Stronger source-specific claims would need validated myogenic source removal and independent physiological replication.
5.9. Limitations
The MODMA dataset contains 53 subjects, which is modest for deep representation learning. The strict LOSO protocol makes the most of the available cohort while preventing subject-level leakage, but statistical power to detect moderate classification effects remains limited, as shown by bootstrap confidence intervals for diagnostic metric differences that include zero for both AUC and balanced accuracy. Relatedly, the diagnostic improvements observed for CE+OC over CE-only should be read as descriptive rather than statistically definitive. CE+OC has higher observed AUC, balanced accuracy, and specificity, and fewer false positives, but the sample size here is not large enough to support a claim of statistically established classification superiority. The paired full-cohort PHQ-9 comparison carries statistical support, while the true-diagnosis control cautions against interpreting it as information beyond diagnosis.
CE+OC also comes with a sensitivity–specificity tradeoff: it improves specificity and reduces false positives, but sensitivity decreases to 45.8% (11/24 MDD subjects detected). Any clinical deployment would need independently validated threshold calibration or cost-sensitive optimization matched to the intended use case and the relative cost of false positives versus false negatives.
Although patient ranking is not an explicit training objective, the within-MDD probe results do not demonstrate fine-grained severity ordering. CE+OC improves full-cohort PHQ-9 recoverability, but within-MDD severity correlations stay negative, so these results should not be read as evidence that the model can distinguish mild, moderate, and severe depression among MDD patients specifically. Closing that gap will likely need larger MDD-specific cohorts with more within-class severity variability than is available here.
Independent-cohort severity validation is also unavailable at this stage. The Mumtaz dataset supports a separate diagnosis evaluation, but its public release does not include subject-level PHQ-9, BDI, or HAM-D scores, so the PHQ-9 severity representation claim remains unverified outside MODMA. We explored a third wireless EEG dataset with PHQ-9-defined group membership during development, but it provided only group labels rather than exact subject-level PHQ-9 scores, ruling out true ordinal contrastive validation there. Testing on an independent EEG cohort with exact clinical severity scores is an important next step.
A further caveat concerns the historical Mumtaz operating-point metrics, which depended on thresholds selected from a small fold-internal validation set. The revised primary comparison uses a common fixed 0.5 rule; both Mumtaz conditions then have 20.0% specificity. The threshold-selection procedure itself stays independent of each held-out test participant, but a small validation cohort can still make threshold-dependent measures such as sensitivity and specificity less stable than the threshold-independent AUC, so these particular results are best read as secondary diagnosis evidence rather than a precise operating point.
The objective comparisons retain the same broadband preprocessing, which controls input differences but does not establish EMG robustness or adjustment for individual alpha peaks. Dedicated EMG removal and individual alpha-peak adjustment were not performed; hormonal-phase metadata were unavailable, and the sex-stratified audit is exploratory. These physiological factors limit source attribution. The additional R1–R6 controls use only seed 42; across eight R1–R4 severity tests, only the R1 overall-correlation comparison survives Holm correction. Sensitivity to the pair thresholds, , and has not been evaluated, so the settings are not claimed to be optimal or robust.
All experiments here used a single CNN–Transformer encoder backbone. The proposed ordinal contrastive objective is architecture-agnostic in principle, but we have not yet tested how it interacts with other EEG encoders. The primary MODMA experiments are also limited to resting-state eyes-closed EEG, so whether the same severity-aware representation benefit carries over to eyes-open recordings, task-evoked EEG, or longitudinal EEG sessions remains an open question.
6. Conclusions
This study introduced CE+OC, a PHQ-9-guided ordinal contrastive learning objective for severity-aware EEG depression representation learning that uses PHQ-9 as privileged supervision during training and requires only EEG at inference. Under strict subject-independent LOSO evaluation on MODMA, CE+OC embeddings contained more recoverable full-cohort PHQ-9 information than CE-only embeddings: the held-out severity probe increased Spearman rank correlation from 7.8% to 33.6% (paired two-sided permutation ) and reduced PHQ-9 prediction error by 18.1% relative to CE-only (paired two-sided Wilcoxon ; bootstrap confidence intervals excluded zero). CE+OC also showed descriptive diagnostic improvements, raising AUC from 59.8% to 69.3%, balanced accuracy from 59.5% to 66.0%, specificity from 69.0% to 86.2%, and MDD precision from 57.1% to 73.3%, while reducing false positives from 9 to 4 among 29 healthy participants; these classification differences were not statistically definitive at the present sample size. A separate LOSO diagnosis evaluation on the independently acquired Mumtaz cohort achieved 85.1% AUC, providing secondary diagnosis-pipeline evidence under a different acquisition setting, not severity replication or direct cross-dataset transfer. The true-diagnosis oracle outperformed the embedding probe, and within-MDD correlations remained negative. PHQ-9 is training guidance rather than an explicit ranking target; the additional controls support a distinction from diagnosis-label guidance only for overall correlation after the specified Holm correction. Future work should validate the severity-representation result in independent cohorts with exact PHQ-9 or equivalent scores, use larger multi-site samples to assess diagnostic effects with higher statistical power, and test the proposed loss across alternative EEG encoders and recording conditions.
Supplementary Materials
The following supporting information can be downloaded at: https://www.mdpi.com/article/10.3390/bioengineering13111322/s1, Table S1: Phase 1 raw and processed families, including the separate within-diagnosis proxy family; Table S2: CE-only addendum families, including the separate within-diagnosis proxy family; Table S3: Exploratory diagnosis-conditioned simple IAF; Table S4: Specparam family; Table S5: All-subject raw reliable-peak roster; Table S6: Regional proxy associations: 18-test family.
Author Contributions
Conceptualization, K.E. and M.E.; methodology, K.E.; software, K.E.; validation, K.E., M.M.E.-G. and M.E.; formal analysis, K.E.; investigation, K.E.; resources, K.E.; data curation, K.E.; writing—original draft preparation, K.E.; writing—review and editing, K.E., M.M.E.-G. and M.E.; visualization, K.E.; supervision, M.M.E.-G. and M.E.; project administration, M.E. All authors have read and agreed to the published version of the manuscript.
Funding
This research received no external funding.
Institutional Review Board Statement
Not applicable. This study used publicly available, previously collected and de-identified EEG datasets (MODMA, Mumtaz); no new data involving human or animal subjects were collected by the authors.
Informed Consent Statement
Not applicable, as this study relies exclusively on publicly available, de-identified third-party EEG datasets (MODMA, Mumtaz).
Data Availability Statement
The MODMA dataset is available from the Lanzhou University research group upon request (http://modma.lzu.edu.cn/data/index/ (accessed on 24 March 2026)). The Mumtaz dataset is publicly available via Figshare, DOI: 10.6084/m9.figshare.3385168.
Acknowledgments
The authors acknowledge the research groups that made the MODMA and Mumtaz EEG datasets available to the scientific community. The authors acknowledge the Gansu Provincial Key Laboratory of Wearable Computing, Lanzhou University, China, for providing the MODMA dataset.
Conflicts of Interest
The authors declare no conflicts of interest.
Abbreviations
The following abbreviations are used in this manuscript:
| MDD | Major depressive disorder |
| EEG | Electroencephalography |
| PHQ-9 | Patient Health Questionnaire-9 |
| CE | Cross-entropy |
| OC | Ordinal contrastive (loss) |
| CE+OC | Cross-entropy plus ordinal contrastive (proposed method) |
| LUPI | Learning Using Privileged Information |
| LOSO | Leave-one-subject-out (cross-validation) |
| BDI | Beck Depression Inventory |
| HAM-D | Hamilton Depression Rating Scale |
| MODMA | Multi-modal Open Dataset for Mental-disorder Analysis |
| HUSM | Hospital Universiti Sains Malaysia (dataset) |
| DSM-IV | Diagnostic and Statistical Manual of Mental Disorders, Fourth Edition |
| CNN | Convolutional neural network |
| LSTM | Long short-term memory |
| AUC | Area under the receiver operating characteristic curve |
| BAcc | Balanced accuracy |
| MAE | Mean absolute error |
| TN | True negative |
| FP | False positive |
| FN | False negative |
| TP | True positive |
Appendix A. Additional Physiological Characterization and Sensitivity Checks
Appendix A.1. Scope, Acquisition and Statistical Families
These exploratory analyses supplement the original three-seed experiments. The R1 to R6 control reports completed earlier remain separate. The global spectral associations use saved probabilities averaged over seeds 42, 52 and 62, and the regional exclusion and frozen-model filtering use seed 42 only. The MODMA documentation specifies the HydroCel net, the E1 to E128 ordering and the Cz reference [37,42]. Raw PSD is expressed in squared native stored units per Hz, because we did not verify the amplitude calibration independently. Processed PSD uses standardized units. We fitted no sex-adjusted model and applied no hormonal-phase adjustment.
We wrote the plan for each supplementary stage before running its new comparisons, and we reused the same previously studied cohort. Nine spectral endpoints were assessed against diagnosis, PHQ-9 and CE+OC probability in separate 27-test Holm families for the raw and processed signals. The CE-only analyses use corresponding families. Separate corrections cover the four-test within-diagnosis proxy families, six diagnosis-conditioned IAF tests, eight specparam tests and 18 regional tests. This family-specific handling does not control the error rate across the whole manuscript. Two-sided permutation tests used 10,000 draws with an add-one correction. Pointwise 95% CIs used 5000 participant bootstraps, and group effects include mean differences and Hedges’ g. Supplementary Tables S1–S6 and the accompanying CSV files contain the complete families and the peak-availability records, including null and unfavorable findings.
Appendix A.2. Individual Alpha Peaks
Simple IAF was the largest eligible peak strictly within 7 to 13 Hz after Gaussian smoothing of log10 PSD (SD 0.25 Hz), with prominence log10 units and a half-prominence width of 0.5 to 4 Hz. Ties were resolved in favor of the lower frequency. A peak counted as reliable only if eligible peaks appeared in both recording halves within 1 Hz of the whole-recording estimate. Boundary maxima and monotonic spectra were not assigned peaks. The approximate background surrogate was a robust fit of intercept plus slope times log10 frequency over 2 to 40 Hz, excluding 7 to 14 Hz, and it is not specparam. We kept the positive excess-power centroid and the ordinary power-weighted 7 to 13 Hz centroid as descriptors; they are not proof of oscillatory peaks.
The specparam 2.0.0rc7 addendum ran in a separate environment. It fitted a fixed aperiodic background plus Gaussian peaks over 2 to 40 Hz, with widths of 0.5 to 4 Hz, at most six peaks, a minimum height of 0.10 log10 units and a relative threshold of 2 [41]. This release candidate is not the exact software release used in that methodological publication. Eligible alpha components had centers strictly within 7 to 13 Hz and agreed within 1 Hz between the whole recording and each half. We added no fit-quality cutoff chosen from the outcomes. The reliable raw counts were 47 for the simple method (22 MDD/25 HC), 38 for the approximate background (18/20) and 47 for specparam (23/24), which leaves 6, 15 and 6 non-detections. The corresponding processed counts were 45, 29 and 47. All subjects remain in the roster. Peak-based inference uses the available cases and may be affected by selection.
Table A1.
Alpha peak associations with saved CE+OC probabilities.
No diagnosis or PHQ-9 comparison survived the correction in the raw primary family or in the specparam family. Raw specparam IAF differed by Hz between MDD and HC (95% CI ; ) and correlated with PHQ-9 at (CI ); both adjusted . The exploratory simple-IAF associations with CE+OC probability were within MDD (, CI , Holm ), within HC (, CI , ), and partial after controlling for diagnosis (, CI , ). The partial Spearman correlation residualized the global ranks against diagnosis and an intercept, and the bootstraps recomputed the ranks and residuals. The CE-only counterparts did not survive correction. A significant CE+OC association next to a nonsignificant CE-only association does not show a difference between the models, and we did not run a paired test of the correlation difference. All outcomes are in Supplementary Tables S1–S5.
Appendix A.3. High-Frequency Proxies and Regional Window Exclusion
Global relative 30 to 45 Hz power and log absolute power are non-specific high-frequency proxies. The raw relative proxy differed by 0.00895 between MDD and HC (MDD minus HC; CI ; ). Its correlations were 0.227 with PHQ-9 and with CE+OC probability, all with Holm . Within MDD, the proxy correlated with PHQ-9 at 0.435 before correction, with Holm . No CE-only proxy association survived its correction. These findings do not establish equivalence, and they do not exclude lower-frequency or sustained myogenic contamination.
The approximate sensor groups were frontal E22/E9/E24/E124/E33/E122/E11 (Fp1/Fp2/F3/F4/F7/F8/Fz); temporal or frontotemporal E34/E116/E45/E108/E46/E102 (FT7/FT8/T7/T8/TP7/TP8); and a central comparison group E36/E104/E30/E105 (C3/C4/C1/C2). The manufacturer correspondences are approximate, especially for the temporal sites, and they are not participant-specific localization [43]. The native raw 2-s windows used Welch Hann subwindows of 250 samples with 125-sample overlap. Regional median 30 to 45 Hz power was ranked within each participant. The exclusion score was the maximum frontal or temporal percentile rank. The primary rule removed exactly of the highest-scoring windows, with fixed 10% and 30% secondary rules and earlier-window tie breaking. We fixed the scores and masks before joining them to outcomes. The separate 49 to 51 Hz descriptors do not rule out spectral leakage. This is a relative stress test, not a validated EMG detector.
All 15,983 reproduced, unmodified seed-42 segment probabilities were mapped one-to-one to the cached windows. Their float32 means, taken in the original order, reproduced the saved subject probabilities exactly for all 53 participants. The original segment targets were unavailable, so we cannot certify exact agreement at the segment level. The retained-window means needed no new inference, filtering, normalization or weight changes. Every participant exceeded the fixed minimum of 30 windows, and retained durations use the unions of overlapping native intervals. Baseline sensitivity and specificity were 0.50000 and 0.86207. No regional association survived the 18-test Holm correction, and a nonsignificant result does not exclude contamination.
Table A2.
All regional high-proxy exclusion conditions.
At 20% removal, the paired AUC difference was (95% CI ), the balanced-accuracy difference was 0 (CI ), and the mean absolute probability change was 0.01128 (CI ). At 10%, the AUC and accuracy differences were zero and the mean absolute change was 0.00537 (CI ). At 30%, the AUC difference was (CI ), the balanced-accuracy difference was (CI ) and the mean absolute change was 0.01762 (CI ); one HC decision changed adversely. Sensitivity stayed at 0.50000, and specificity fell to 0.82759. The retained counts were 269 to 300, 239 to 267 and 209 to 233 windows per participant. Intervals used 5000 diagnosis-stratified paired subject resamples with common indices (seed 20261034). Zero-width intervals reflect identical resampled decisions, not population equivalence.
Appendix A.4. Frozen-Model Frequency Perturbations and the 50-Hz Diagnostic
We evaluated the frozen seed-42 models after fourth-order zero-phase Butterworth SOS filtering: low-pass 30 Hz, band-stop 8 to 13 Hz, a same-width control band-stop of 15 to 20 Hz, and low-pass 20 Hz. The filters acted on the continuous reconstructed processed recordings before segmentation and the unchanged fold-local scaling. No restandardization or scaler refitting followed. Subject predictions from the cached inputs were reproduced exactly. The reconstructed windows and the baseline probabilities differed by at most and , respectively, which is tolerance agreement and not bitwise identity. Inference used float32 evaluation mode on an RTX 4050. We report all 53 subjects and all four conditions against the saved seed-42 baseline AUC of 0.71121 and balanced accuracy of 0.68103 (Table A4).
Table A3.
All four frozen-model filtering conditions.
Table A4.
Paired filtering differences and pointwise intervals.
Intervals used 5000 diagnosis-stratified paired subject resamples with common indices (seed 20261033). They are pointwise and not adjusted for multiple comparisons. The alpha and control band-stops left all decisions unchanged, and both low-pass conditions changed 19 decisions. The CIs for the mean absolute probability change were , , and in table order. Unchanged decisions under the alpha-band filter do not show individualized-alpha processing, and the same-width control band was not matched for power.
We inspected the full spectrum post hoc, prompted by the gap between the band-limited power retained and the whole-signal RMS. It showed a 50-Hz PSD maximum in all 53 processed recordings. The median power fractions relative to total Welch power over 0 to 125 Hz were 90.90% in 49 to 51 Hz and 6.58% in 1 to 45 Hz. This is consistent with residual power-line (mains) interference, but we have no independent confirmation of the source. The 30 Hz low-pass filter retained a median of 95.78% of the 1 to 45 Hz power, but it reduced the continuous RMS to 30.42% of baseline and the fold-scaled RMS to 29.99%. Filtering therefore changes a large narrowband component and the input scale along with other spectral content. The performance loss shows sensitivity to the intervention. These diagnostics do not establish its cause, and they cannot separate muscle from neural dependence.
Appendix A.5. ICA Feasibility Boundary
A separate feasibility pilot used the lexicographically first raw recording, chosen independently of diagnosis and predictions. It ran MNE 1.11.0 FastICA with 32 components, seed 42, tolerance 0.001 and a maximum of 500 iterations, on a 1 to 100 Hz diagnostic copy without a notch filter or re-reference. It converged in 84 iterations and retained 99.99644% of the PCA variance, which does not mean that all neural information was preserved. The default spectral and spatial scoring in the 7 to 45 Hz range nominated no muscle components. No components were removed. We did not compare cleaned and original model results. This numerical feasibility check is not evidence of EMG removal, and validated cohort-wide source removal remains outstanding.
References
- World Health Organization. Depressive Disorder (Depression). 2023. Available online: https://www.who.int/news-room/fact-sheets/detail/depression (accessed on 1 June 2026).
- Kroenke, K.; Spitzer, R.L.; Williams, J.B.W. The PHQ-9: Validity of a brief depression severity measure. J. Gen. Intern. Med. 2001, 16, 606–613. [Google Scholar] [CrossRef] [Scilit] [PubMed]
- Henriques, J.B.; Davidson, R.J. Left frontal hypoactivation in depression. J. Abnorm. Psychol. 1991, 100, 535–545. [Google Scholar] [CrossRef] [PubMed]
- Pizzagalli, D.A.; Oakes, T.R.; Davidson, R.J. Coupling of theta activity and glucose metabolism in the human rostral anterior cingulate cortex: An EEG/PET study of normal and depressed subjects. Psychophysiology 2003, 40, 939–949. [Google Scholar] [CrossRef] [Scilit] [PubMed]
- Fingelkurts, A.A.; Fingelkurts, A.A.; Rytsälä, H.; Suominen, K.; Isometsä, E.; Kähkönen, S. Impaired functional connectivity at EEG alpha and theta frequency bands in major depression. Hum. Brain Mapp. 2007, 28, 247–261. [Google Scholar] [CrossRef] [Scilit] [PubMed]
- Hosseinifard, M.; Moradi, M.H.; Rostami, R. Classifying depression patients and normal subjects using machine learning techniques and nonlinear features from EEG signal. Comput. Methods Programs Biomed. 2013, 109, 339–345. [Google Scholar] [CrossRef] [Scilit] [PubMed]
- Ahmadlou, M.; Adeli, H.; Adeli, A. Fractality and a wavelet-chaos-neural network methodology for EEG-based diagnosis of depression. J. Clin. Neurophysiol. 2012, 29, 257–266. [Google Scholar]
- Mumtaz, W.; Xia, L.; Yasin, M.A.M.; Ali, S.S.A.; Malik, A.S. A wavelet-based technique to predict treatment outcome for major depressive disorder. PLoS ONE 2017, 12, e0171409. [Google Scholar] [CrossRef] [Scilit] [PubMed]
- Bachmann, M.; Lass, J.; Suhhova, A.; Hinrikus, H. Spectral asymmetry and Higuchi’s fractal dimension measures of depression electroencephalogram. Comput. Math. Methods Med. 2013, 2013, 251638. [Google Scholar] [CrossRef] [Scilit] [PubMed]
- de Aguiar Neto, F.S.; Rosa, J.L.G. Depression biomarkers using non-invasive EEG: A review. Neurosci. Biobehav. Rev. 2019, 105, 83–93. [Google Scholar] [CrossRef] [Scilit] [PubMed]
- Acharya, U.R.; Oh, S.L.; Hagiwara, Y.; Tan, J.H.; Adeli, H.; Subha, D.P. Automated EEG-based screening of depression using deep convolutional neural network. Comput. Methods Programs Biomed. 2018, 161, 103–113. [Google Scholar] [CrossRef] [Scilit] [PubMed]
- Sarkar, A.; Singh, A.; Chakraborty, R. A deep learning-based comparative study to track mental depression from EEG data. Neurosci. Inform. 2022, 2, 100039. [Google Scholar] [CrossRef] [Scilit]
- Vaswani, A.; Shazeer, N.; Parmar, N.; Uszkoreit, J.; Jones, L.; Gomez, A.N.; Kaiser, L.; Polosukhin, I. Attention is all you need. In Proceedings of the Advances in Neural Information Processing Systems, Long Beach, CA, USA, 4–9 December 2017; pp. 5998–6008. [Google Scholar]
- Lotte, F.; Bougrain, L.; Cichocki, A.; Clerc, M.; Congedo, M.; Rakotomamonjy, A.; Yger, F. A review of classification algorithms for EEG-based brain-computer interfaces: A 10 year update. J. Neural Eng. 2018, 15, 031005. [Google Scholar] [CrossRef] [Scilit] [PubMed]
- Mao, Z.; Wu, H.; Tan, Y.; Jin, Y. EEG based generative depression discriminator. arXiv 2024, arXiv:2402.09421. [Google Scholar]
- Nassibi, A.; Papavassiliou, C.; Rakhmatulin, I.; Mandic, D.; Atashzar, S.F. A systematic review of EEG-based machine intelligence algorithms for depression diagnosis and monitoring. arXiv 2025, arXiv:2503.19820. [Google Scholar]
- Seal, A.; Bajpai, R.; Agnihotri, J.; Yazidi, A.; Herrera-Viedma, E.; Krejcar, O. DeprNet: A deep convolution neural network framework for detecting depression using EEG. IEEE Trans. Instrum. Meas. 2021, 70, 2505413. [Google Scholar] [CrossRef] [Scilit]
- Sharma, G.; Joshi, A.M.; Gupta, R.; Cenkeramaddi, L.R. DepCap: A smart healthcare framework for EEG based depression detection using time-frequency response and deep neural network. IEEE Access 2023, 11, 52327–52338. [Google Scholar] [CrossRef] [Scilit]
- Song, X.W.; Yan, D.D.; Zhao, L.L.; Yang, L. LSDD-EEGNet: An efficient end-to-end framework for EEG-based depression detection. Biomed. Signal Process. Control 2022, 75, 103612. [Google Scholar] [CrossRef] [Scilit]
- Ay, B.; Yildirim, O.; Talo, M.; Baloglu, U.B.; Aydin, G.; Puthankattil, S.D.; Acharya, U.R. Automated depression detection using deep representation and sequence learning with EEG signals. J. Med. Syst. 2019, 43, 205. [Google Scholar] [CrossRef] [Scilit] [PubMed]
- Thoduparambil, P.P.; Dominic, A.; Varghese, S.M. EEG-based deep learning model for the automatic detection of clinical depression. Phys. Eng. Sci. Med. 2020, 43, 1349–1360. [Google Scholar] [CrossRef] [Scilit] [PubMed]
- Wang, Y.; Peng, Y.; Han, M.; Liu, X.; Niu, H.; Cheng, J.; Chang, S.; Liu, T. GCTNet: A graph convolutional transformer network for major depressive disorder detection based on EEG signals. J. Neural Eng. 2024, 21, 036042. [Google Scholar] [CrossRef] [Scilit] [PubMed]
- Kwok, A.M.H.; Cheong, J.; Kalkan, S.; Gunes, H. Machine learning fairness for depression detection using EEG data. In Proceedings of the 2025 IEEE 22nd International Symposium on Biomedical Imaging (ISBI), Houston, TX, USA, 14–17 April 2025; pp. 1–5. [Google Scholar] [CrossRef] [Scilit]
- Jiang, W.; Su, N.; Pan, T.; Miao, Y.; Lv, X.; Jiang, T.; Zuo, N. EEG-based subject-independent depression detection using dynamic convolution and feature adaptation. In Proceedings of the Advances in Swarm Intelligence (ICSI 2023); Lecture Notes in Computer Science; Springer: Cham, Switzerland, 2023; Volume 13969, pp. 272–283. [Google Scholar] [CrossRef] [Scilit]
- Chen, T.; Kornblith, S.; Norouzi, M.; Hinton, G. A simple framework for contrastive learning of visual representations. In Proceedings of the International Conference on Machine Learning, Virtual, 13–18 July 2020; pp. 1597–1607. [Google Scholar]
- He, K.; Fan, H.; Wu, Y.; Xie, S.; Girshick, R. Momentum contrast for unsupervised visual representation learning. In Proceedings of the IEEE/CVF Conference on Computer Vision and Pattern Recognition, Seattle, WA, USA, 13–19 June 2020; pp. 9729–9738. [Google Scholar]
- Banville, H.; Chehab, O.; Hyvärinen, A.; Engemann, D.-A.; Gramfort, A. Uncovering the structure of clinical EEG signals with self-supervised learning. J. Neural Eng. 2021, 18, 046020. [Google Scholar] [CrossRef] [Scilit] [PubMed]
- Kostas, D.; Aroca-Ouellette, S.; Rudzicz, F. BENDR: Using transformers and a contrastive self-supervised learning task to learn from massive amounts of EEG data. Front. Hum. Neurosci. 2021, 15, 653659. [Google Scholar] [CrossRef] [Scilit] [PubMed]
- Liao, Y.; Zhang, Y.; Wang, S.; Zhang, X.; Zhang, Y.; Chen, W.; Gu, Y.; Huang, L. CLDTA: Contrastive learning based on diagonal transformer autoencoder for cross-dataset EEG emotion recognition. arXiv 2024, arXiv:2406.08081. [Google Scholar]
- Schroff, F.; Kalenichenko, D.; Philbin, J. FaceNet: A unified embedding for face recognition and clustering. In Proceedings of the IEEE Conference on Computer Vision and Pattern Recognition, Boston, MA, USA, 7–12 June 2015; pp. 815–823. [Google Scholar]
- Niu, Z.; Zhou, M.; Wang, L.; Gao, X.; Hua, G. Ordinal regression with multiple output CNN for age estimation. In Proceedings of the IEEE Conference on Computer Vision and Pattern Recognition, Las Vegas, NV, USA, 27–30 June 2016; pp. 4920–4928. [Google Scholar]
- Werner, P.; Lopez-Martinez, D.; Walter, S.; Al-Hamadi, A.; Gruss, S.; Picard, R.W. Automatic recognition methods supporting pain assessment: A survey. IEEE Trans. Affect. Comput. 2022, 13, 530–552. [Google Scholar] [CrossRef] [Scilit]
- Rothe, R.; Timofte, R.; Van Gool, L. DEX: Deep EXpectation of apparent age from a single image. In Proceedings of the IEEE International Conference on Computer Vision Workshops, Santiago, Chile, 7–13 December 2015; pp. 252–257. [Google Scholar]
- Negeri, Z.F.; Levis, B.; Sun, Y.; He, C.; Krishnan, A.; Wu, Y.; Bhandari, P.M.; Neupane, D.; Brehaut, E.; Benedetti, A.; et al. Accuracy of the Patient Health Questionnaire-9 for screening to detect major depression: Updated systematic review and individual participant data meta-analysis. BMJ 2021, 375, n2183. [Google Scholar] [CrossRef] [Scilit] [PubMed]
- Vapnik, V.; Vashist, A. A new learning paradigm: Learning using privileged information. Neural Netw. 2009, 22, 544–557. [Google Scholar] [CrossRef] [Scilit] [PubMed]
- Goncharova, I.I.; McFarland, D.J.; Vaughan, T.M.; Wolpaw, J.R. EMG contamination of EEG: Spectral and topographical characteristics. Clin. Neurophysiol. 2003, 114, 1580–1593. [Google Scholar] [CrossRef] [Scilit] [PubMed]
- Cai, H.; Yuan, Z.; Gao, Y.; Sun, S.; Li, N.; Tian, F.; Han, X.; Li, J.; Yang, Z.; Li, X.; et al. A multi-modal open dataset for mental-disorder analysis. Sci. Data 2022, 9, 178. [Google Scholar] [CrossRef] [Scilit] [PubMed]
- Mumtaz, W.; Malik, A.S.; Yasin, M.A.M.; Ali, S.S.A.; Xia, L. EEG-Based Diagnosis and Treatment Outcome Prediction for Major Depressive Disorder; Figshare: London, UK, 2016. [Google Scholar] [CrossRef] [Scilit]
- US Preventive Services Task Force; Barry, M.J.; Nicholson, W.K.; Silverstein, M.; Chelmow, D.; Coker, T.R.; Davidson, K.W.; Davis, E.S.; Donahue, K.E.; Jaén, C.R.; et al. Screening for depression and suicide risk in adults: US Preventive Services Task Force recommendation statement. JAMA 2023, 329, 2057–2067. [Google Scholar] [CrossRef] [Scilit] [PubMed]
- Ganin, Y.; Ustinova, E.; Ajakan, H.; Germain, P.; Larochelle, H.; Laviolette, F.; Marchand, M.; Lempitsky, V. Domain-adversarial training of neural networks. J. Mach. Learn. Res. 2016, 17, 1–35. [Google Scholar]
- Donoghue, T.; Haller, M.; Peterson, E.J.; Varma, P.; Sebastian, P.; Gao, R.; Noto, T.; Lara, A.H.; Wallis, J.D.; Knight, R.T.; et al. Parameterizing neural power spectra into periodic and aperiodic components. Nat. Neurosci. 2020, 23, 1655–1665. [Google Scholar] [CrossRef] [Scilit] [PubMed]
- MODMA. Resting-State 128-Channel HydroCel Geodesic Sensor Net Documentation. Available online: https://modma.lzu.edu.cn/static/references/128%20channel%20HydroCel%20Geodesic%20Sensor%20Net-resting%20state%20EEG.pdf (accessed on 30 October 2026).
- Luu, P.; Ferree, T. Determination of the HydroCel Geodesic Sensor Nets’ Average Electrode Positions and Their 10–10 International Equivalents. EGI Technical Note, Revised 24 October 2005. Available online: https://www.egi.com/images/HydroCelGSN_10-10.pdf (accessed on 30 October 2026).
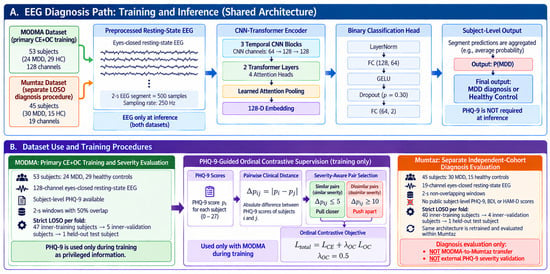
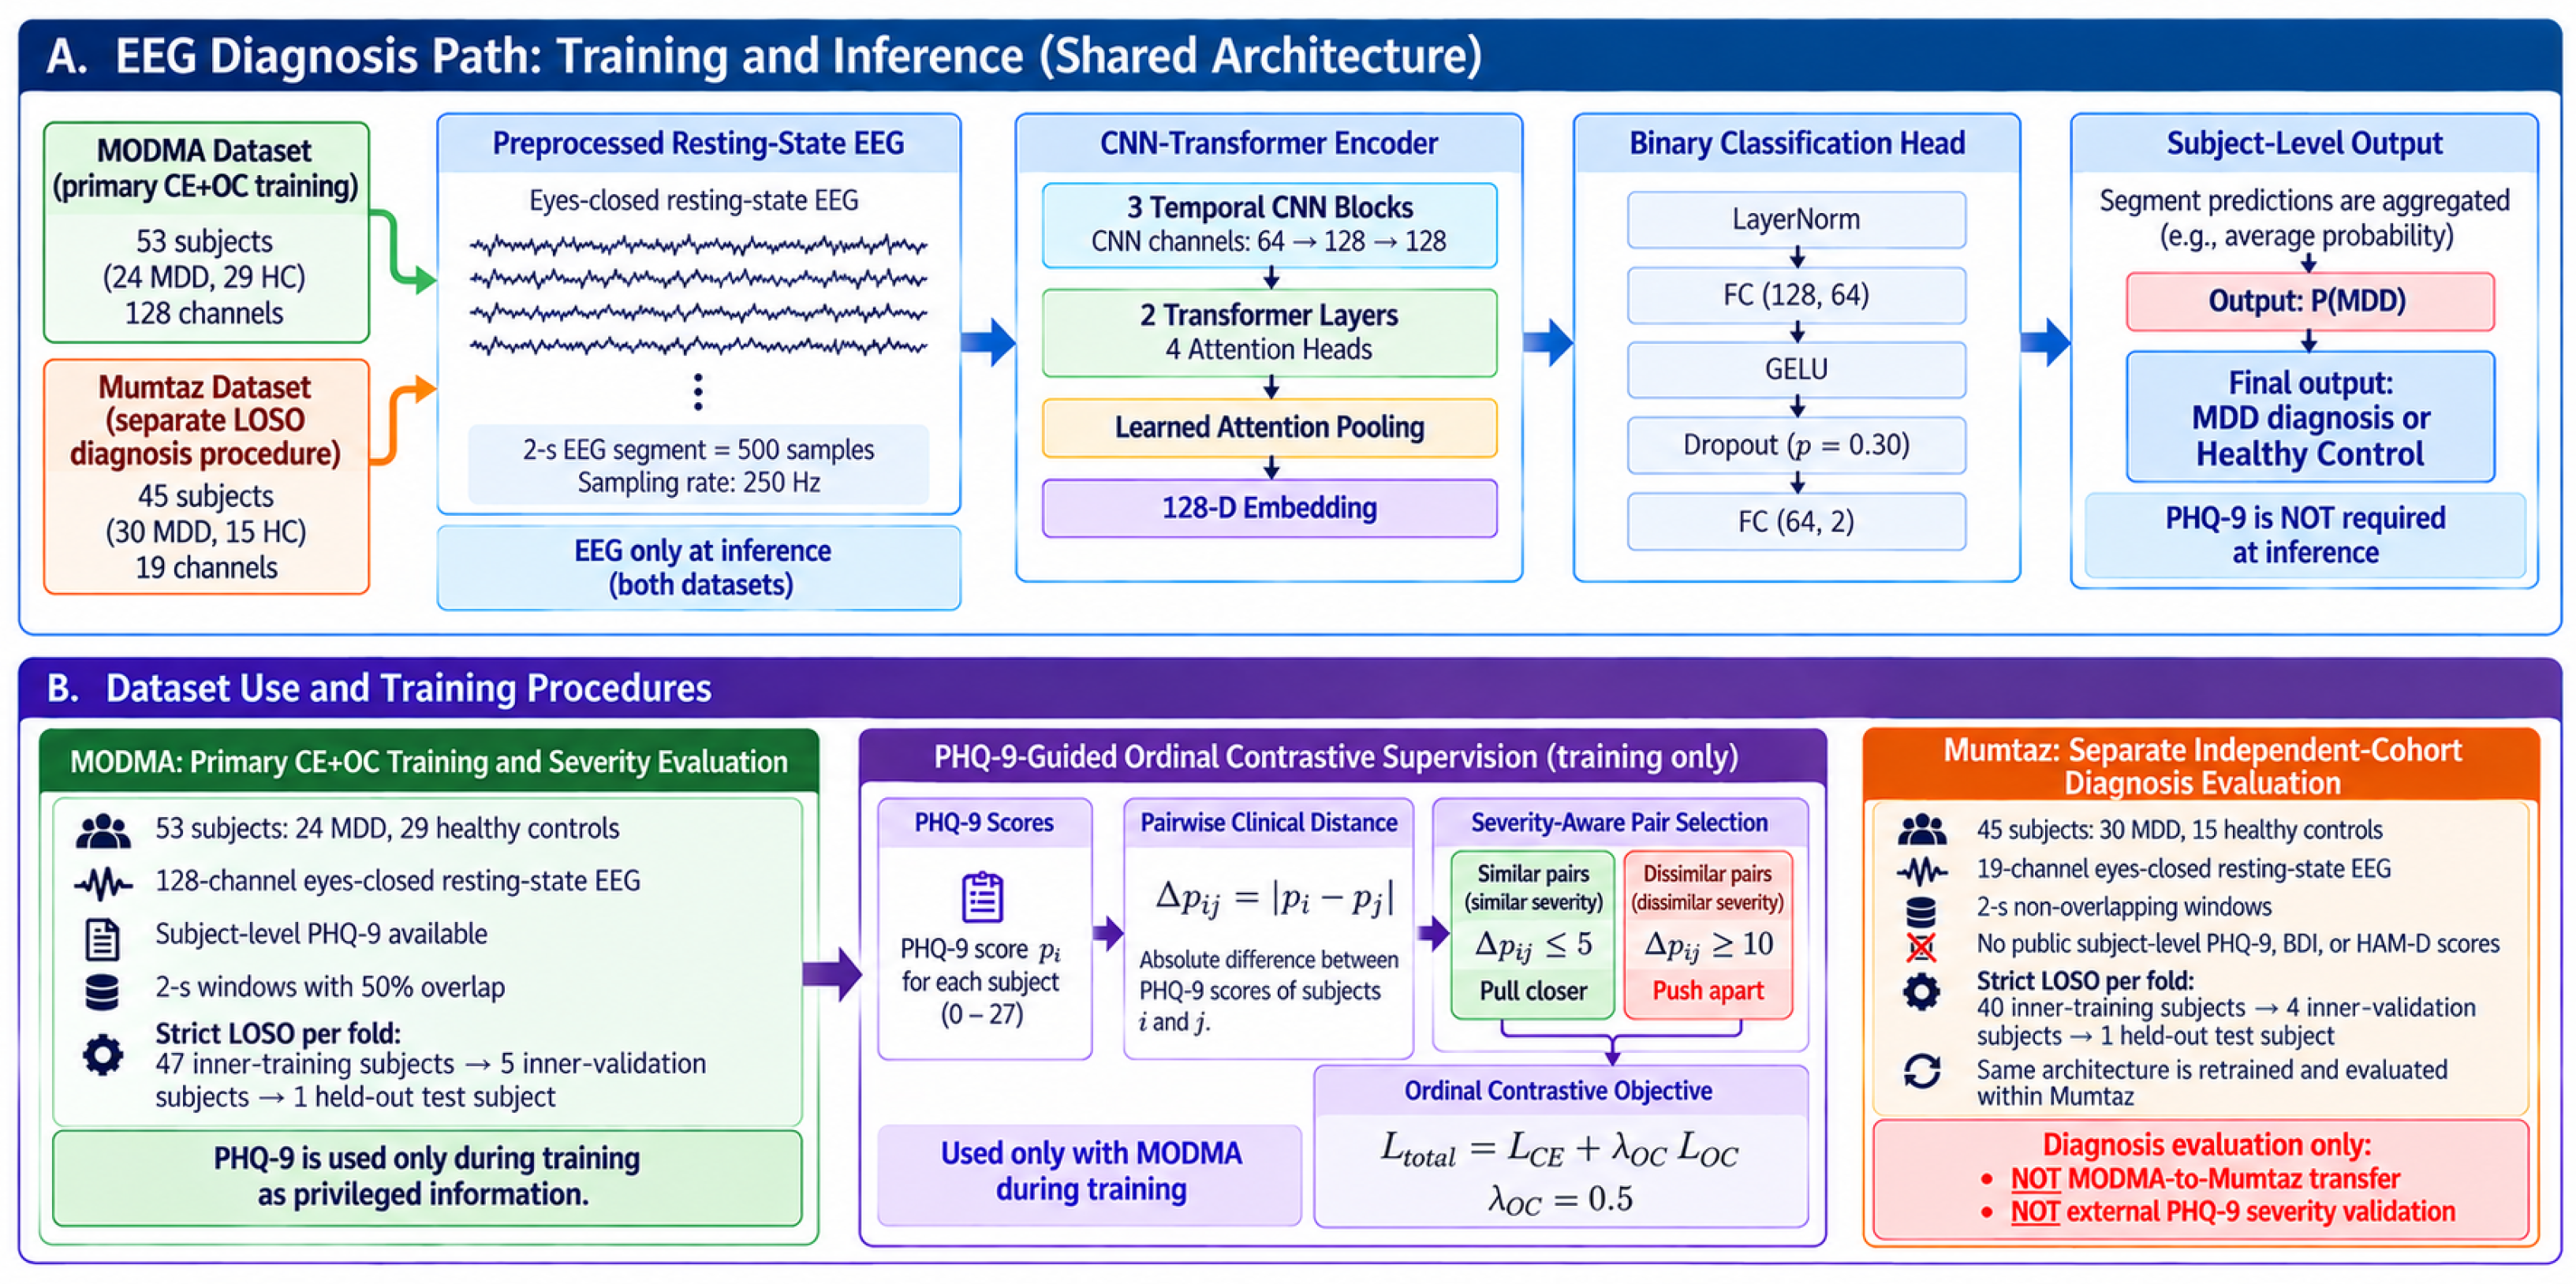
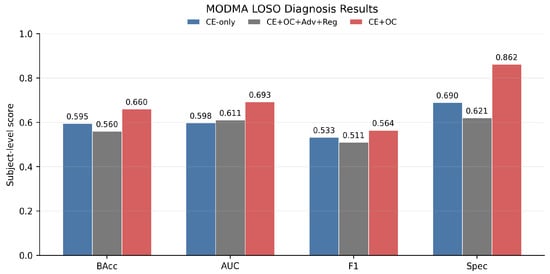
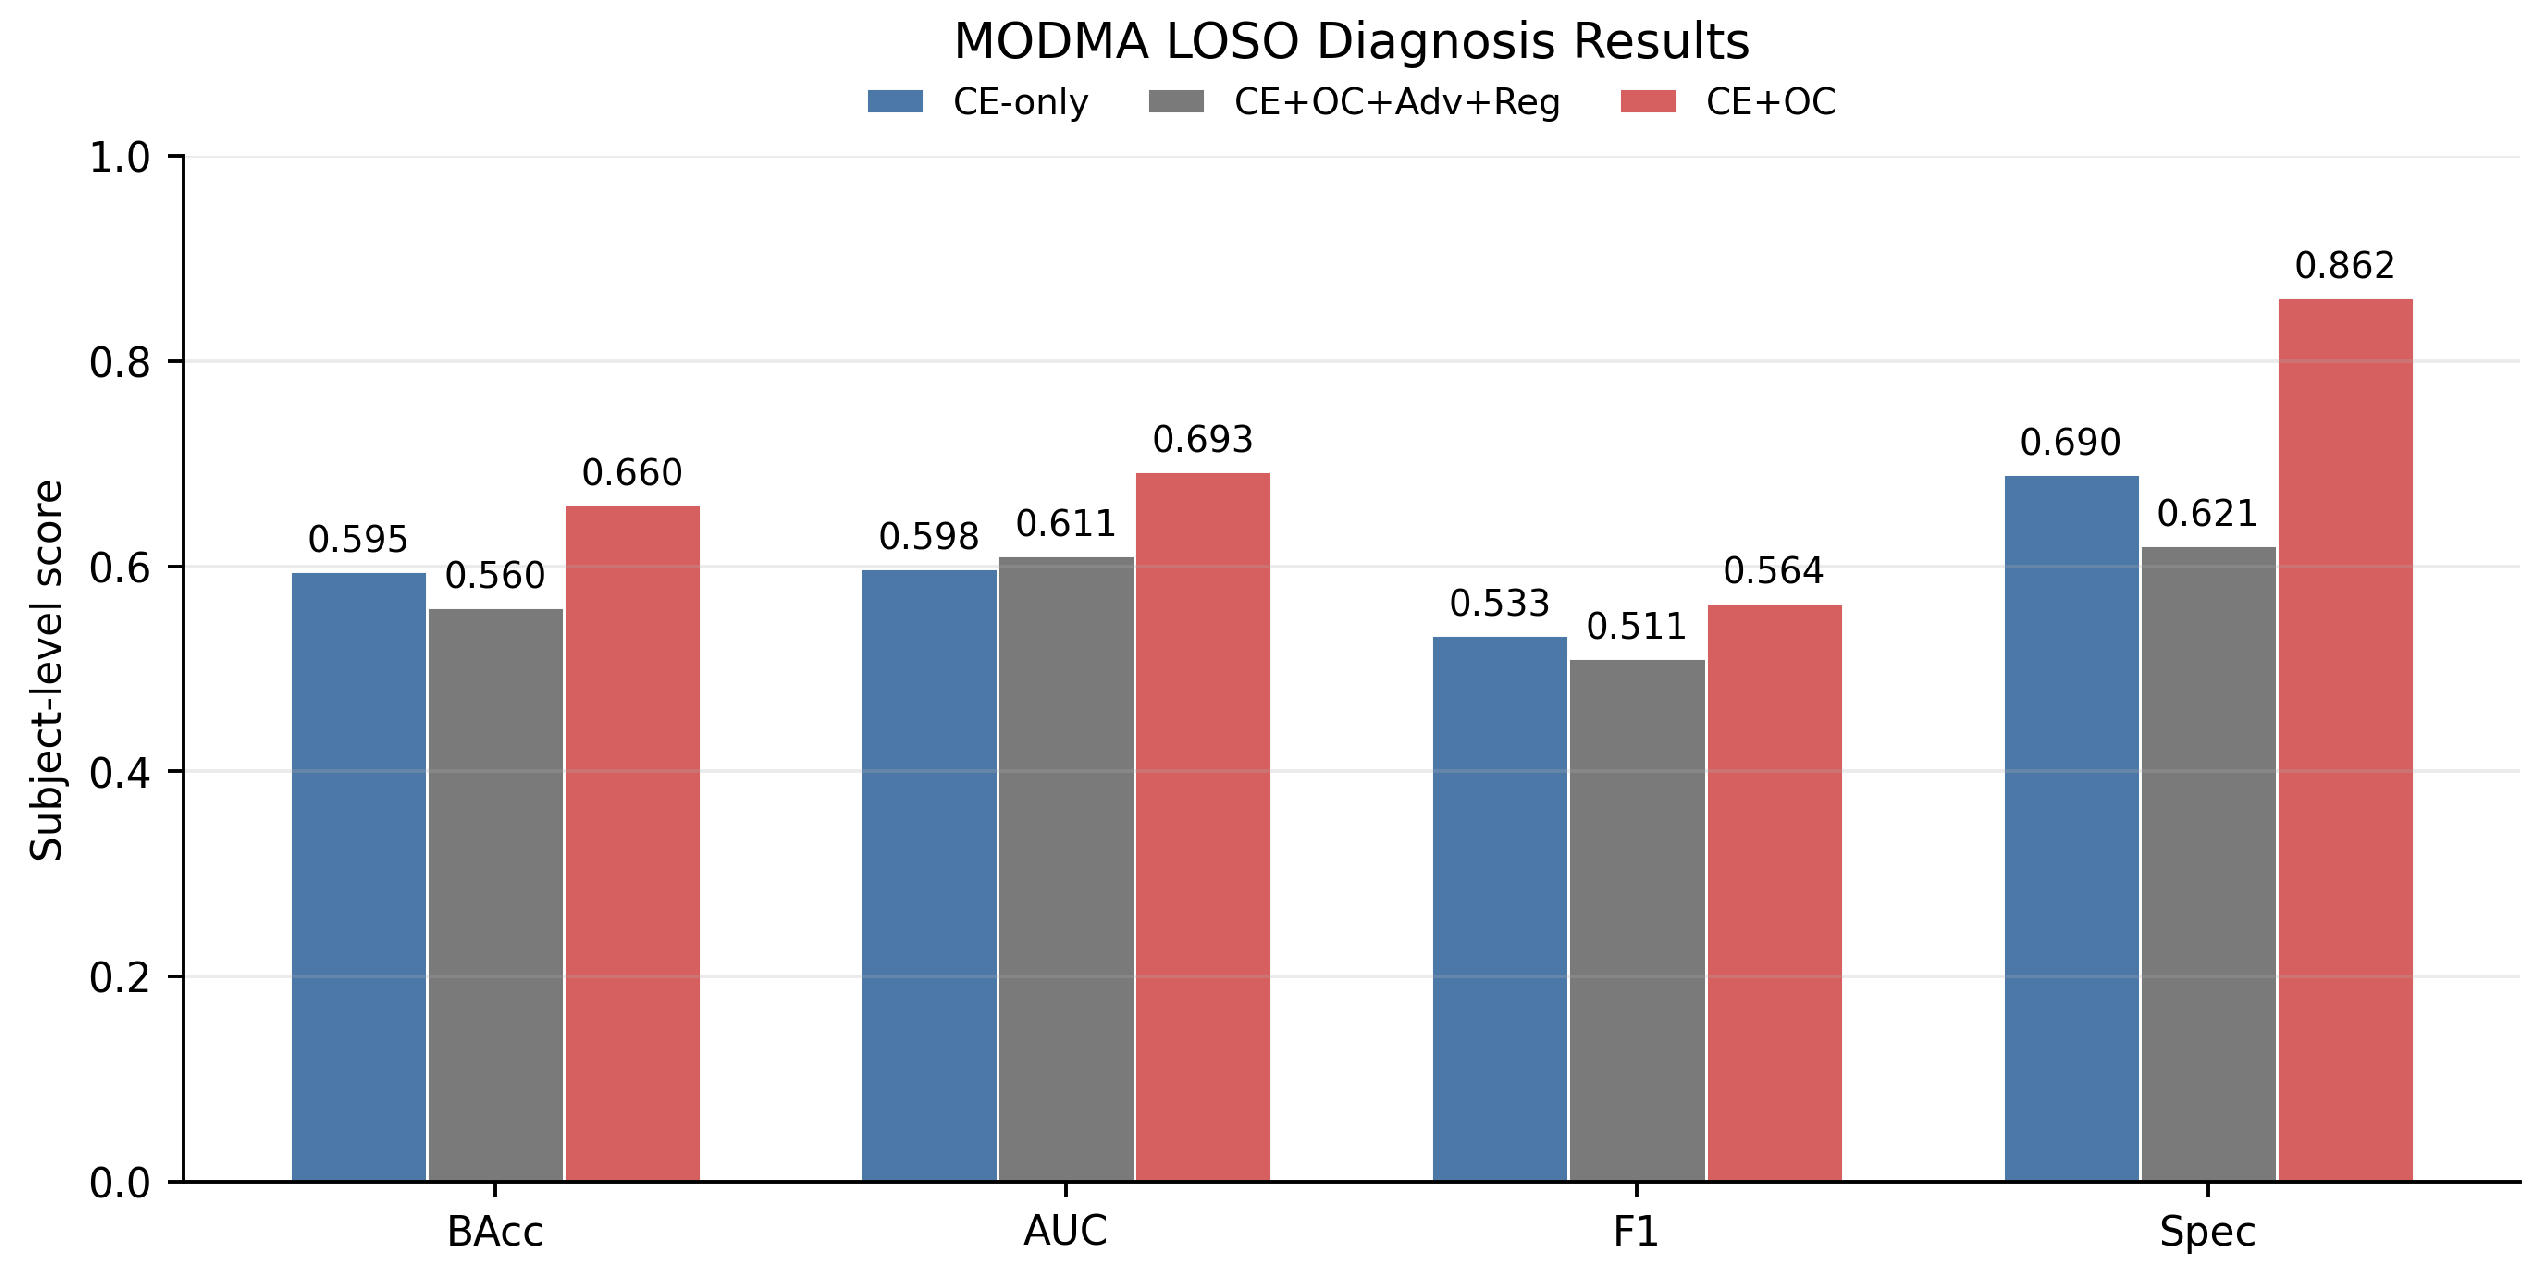
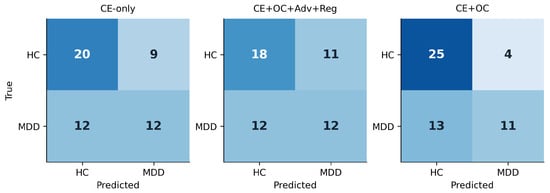
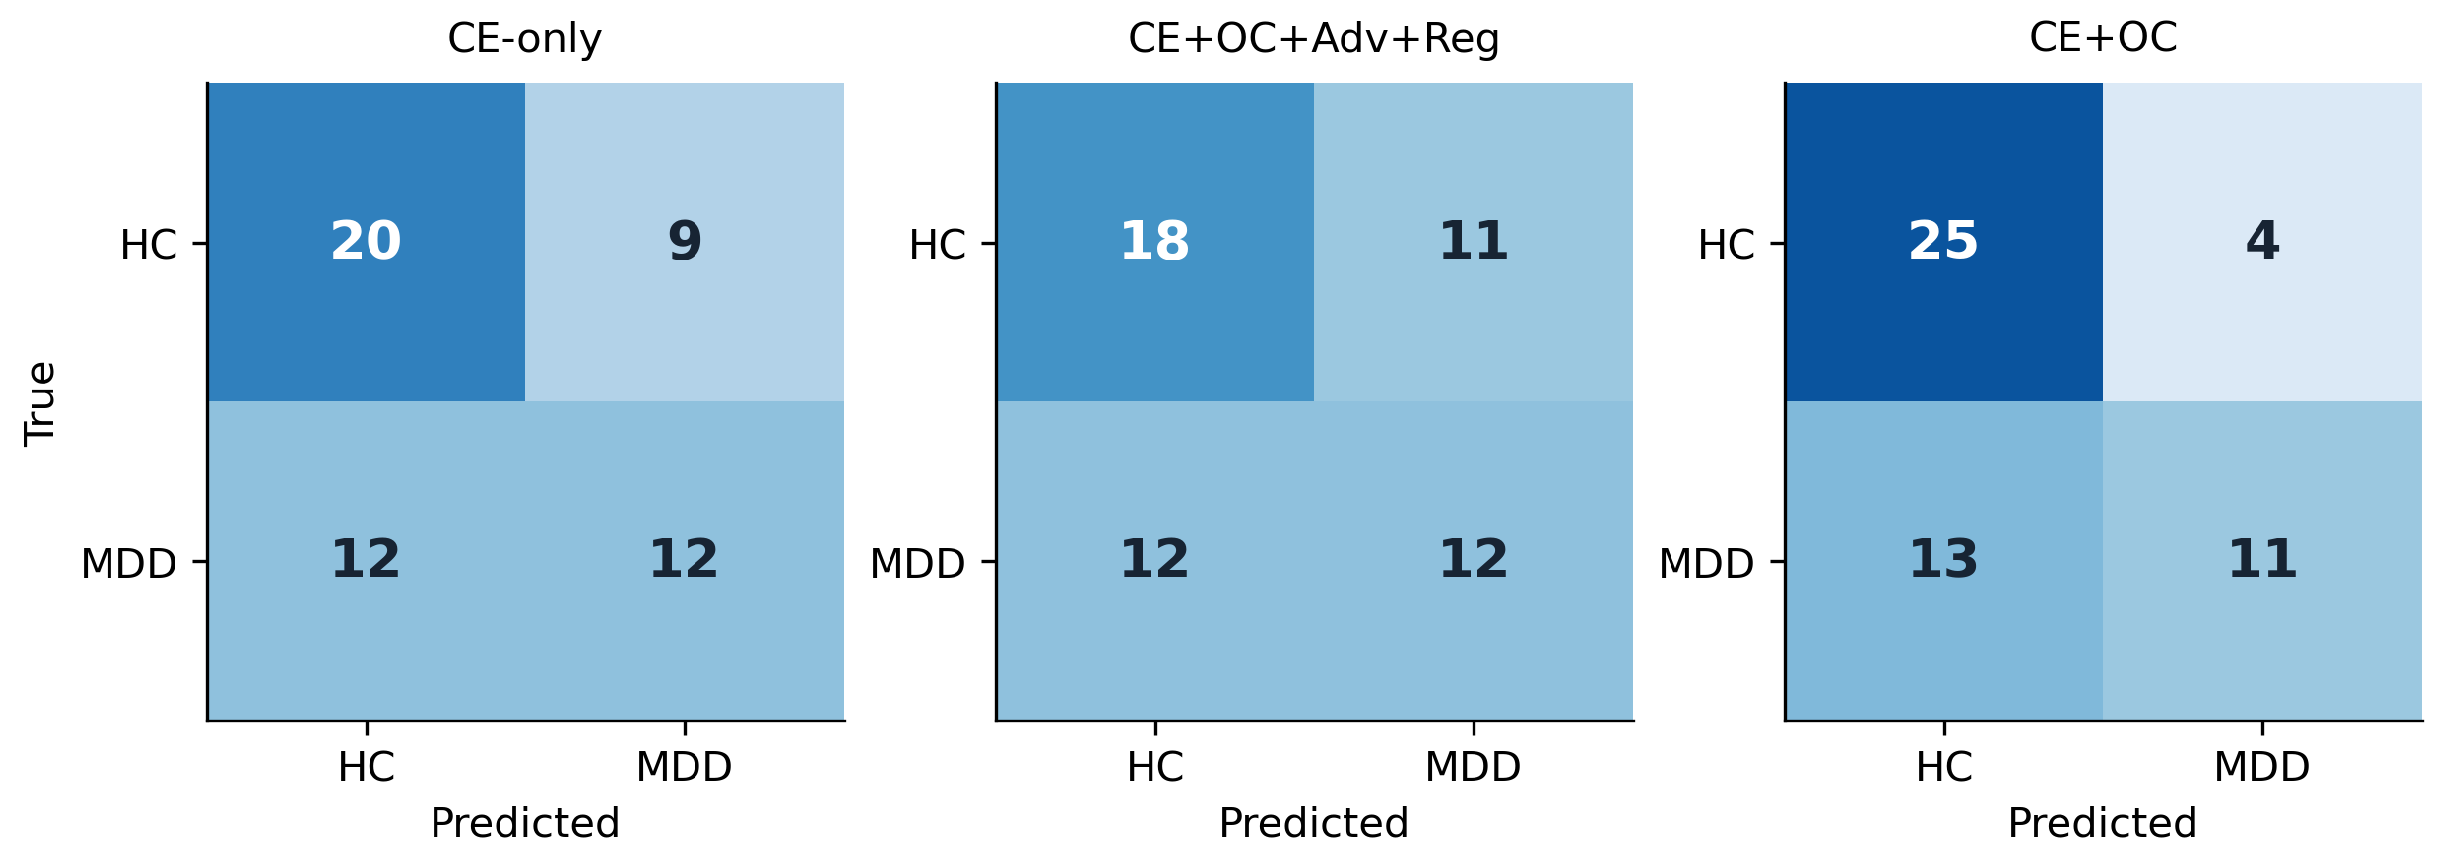
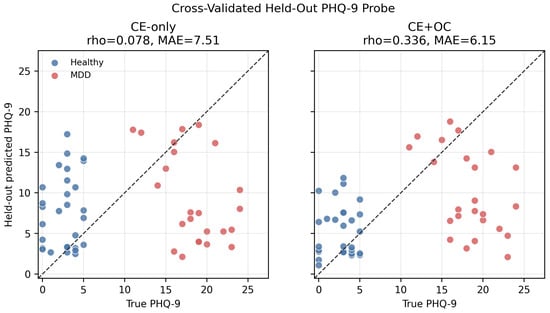
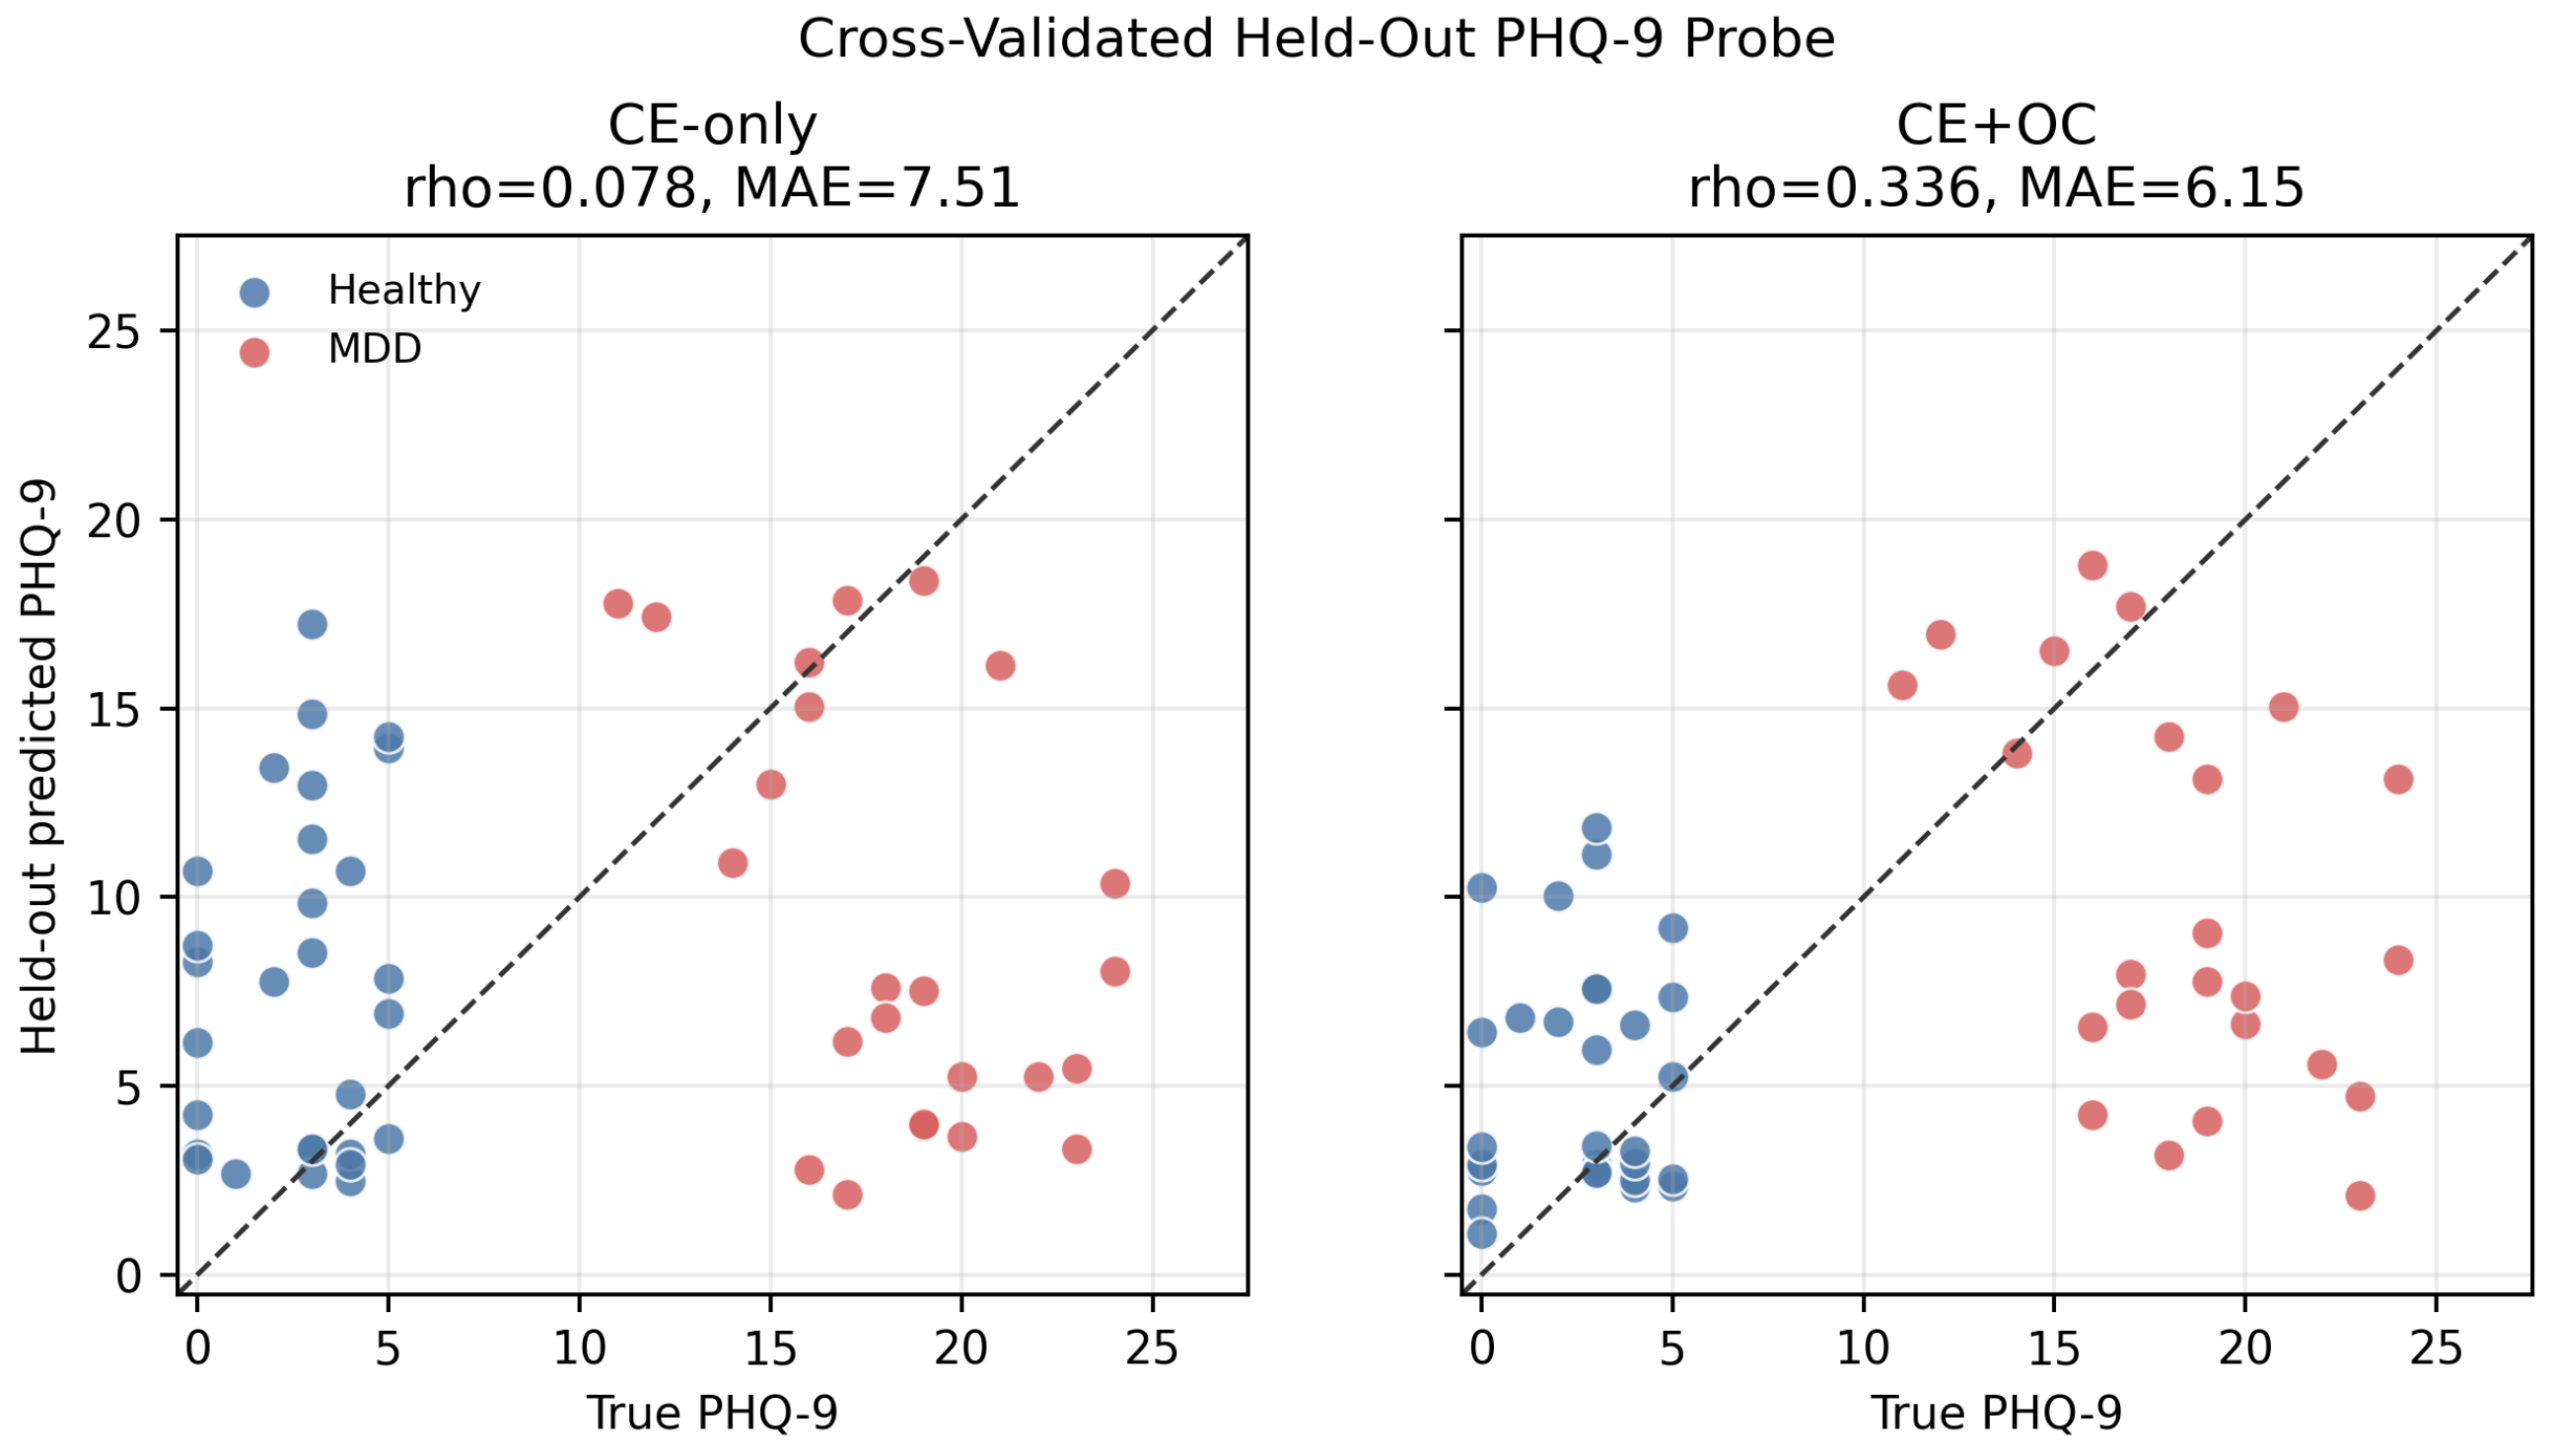
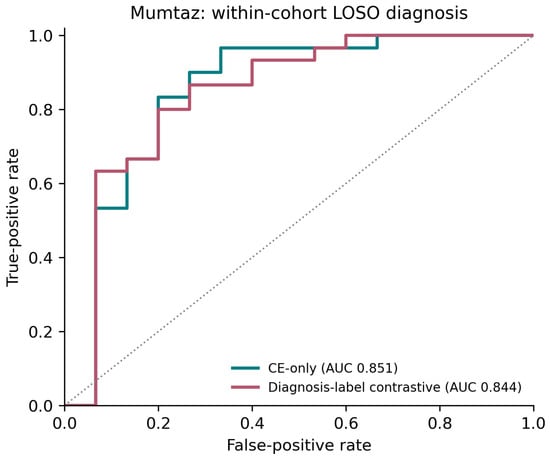
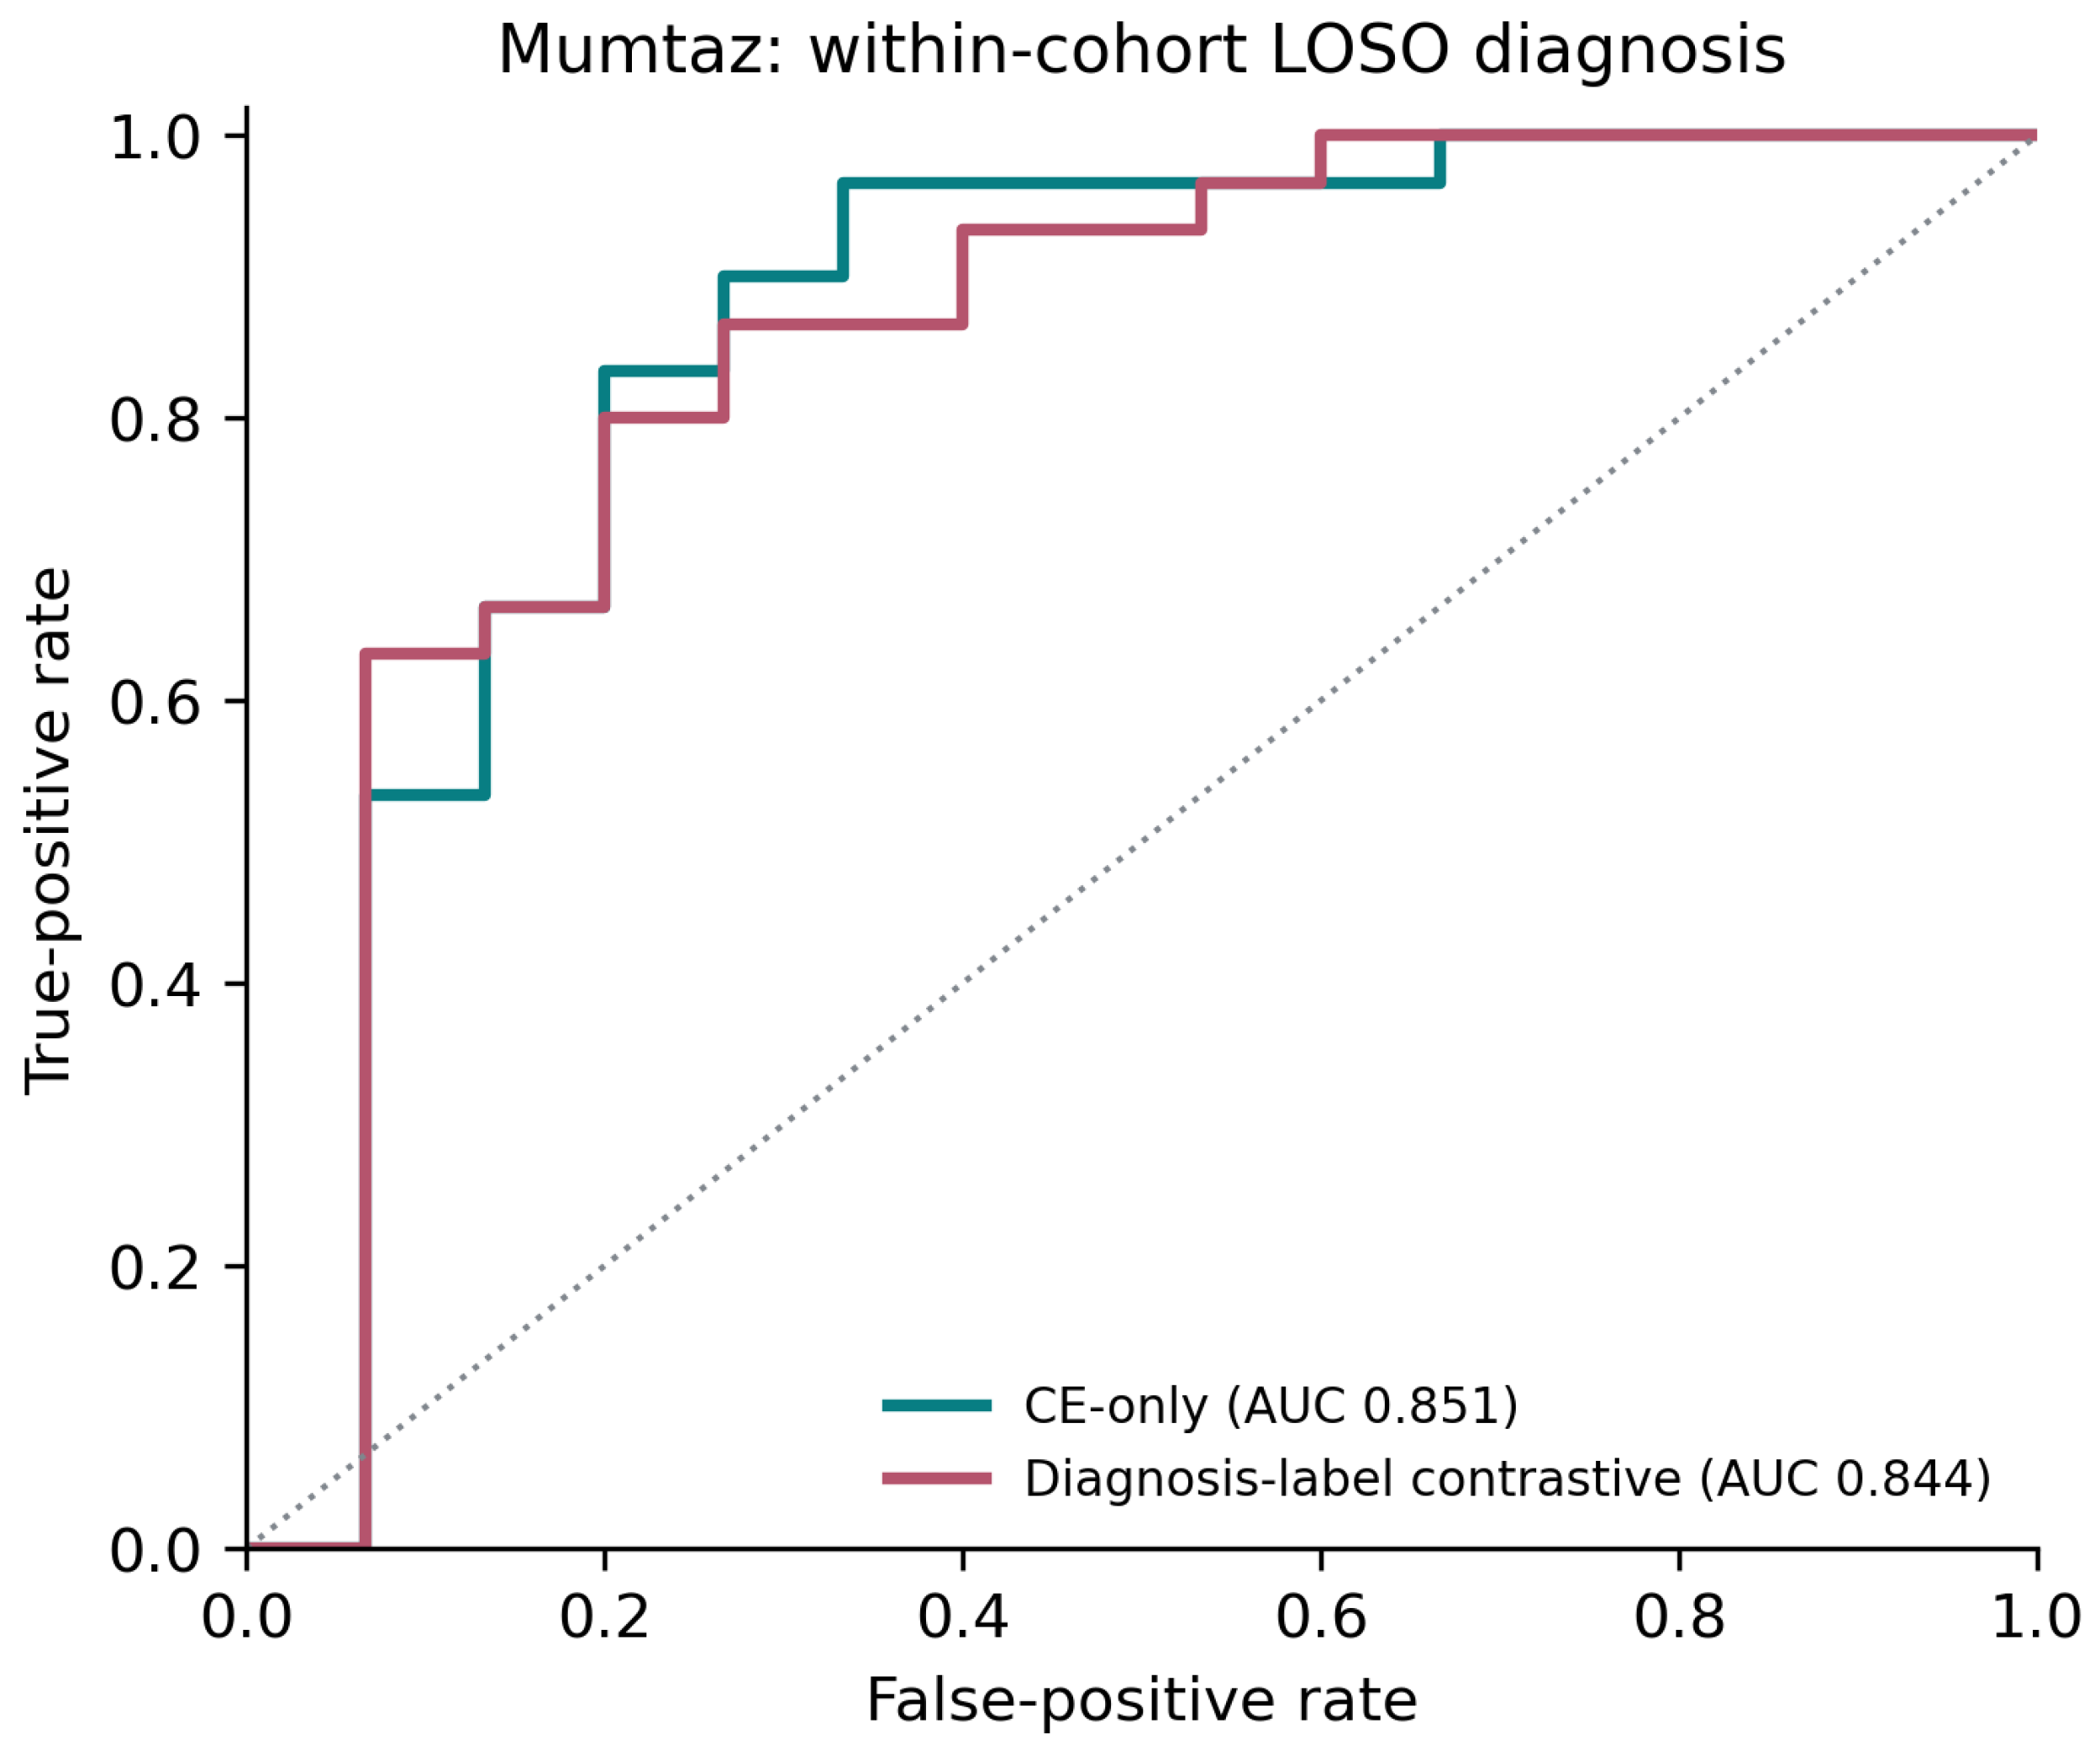

Disclaimer/Publisher’s Note: The statements, opinions and data contained in all publications are solely those of the individual author(s) and contributor(s) and not of MDPI and/or the editor(s). MDPI and/or the editor(s) disclaim responsibility for any injury to people or property resulting from any ideas, methods, instructions or products referred to in the content. |
© 2026 by the authors. Licensee MDPI, Basel, Switzerland. This article is an open access article distributed under the terms and conditions of the Creative Commons Attribution (CC BY) license.