


Abstract
Background: The choriocapillaris (CC), which supplies the outer retina, may be involved in myopic macular degeneration (MMD); however, quantitative in vivo assessment remains challenging. This study aimed to quantify CC thickness (CCT) with swept-source optical coherence tomography (SS-OCT) C-scan imaging and to characterize its changes in MMD. Methods: This study grouped participants into control (CN), simple high myopia (SHM), and pathological myopia (PM) groups. Each group included 30 eyes. Swept-source optical coherence tomography was used to obtain 3 × 3 mm volumetric scans. The choriocapillaris was segmented from the en-face (C-scan) images to determine its thickness and its coefficient of variation. The choroidal thickness (CT), luminal volume, stromal volume, and choroidal vascularity index were quantified from the volumetric data. Results: Reproducibility was excellent (intra- and inter-grader ICCs 0.987 and 0.970). CCT was lower in PM than in CN and SHM (mean differences 9.94 µm and 7.95 µm; both p < 0.001) and slightly lower in SHM than in CN (1.99 µm; p = 0.005), together with increased coefficient of variation in PM. CT and axial length were independently associated with CCT (p = 0.002 and 0.020, respectively). Mediation analysis indicated that choroidal thickness accounted for approximately 52.5% of the association between axial length and choriocapillaris thickness (p < 0.05). CCT distinguished PM from SHM with excellent performance (AUC = 0.996; cutoff 8.9 µm). Conclusions: Choriocapillaris thickness was significantly reduced, with increased relative spatially heterogeneous in MMD. It was associated with axial length and choroidal thickness and showed excellent discriminatory performance.
1. Introduction
The global prevalence of high myopia is increasing, especially in Asian countries [1]. The number of patients with high myopia is projected to reach approximately 938 million by 2050, representing 9.8% of the global population [2]. The progression of high myopia may be accompanied by complications such as myopic macular degeneration (MMD), retinal detachment, cataracts, and open-angle glaucoma. MMD is the most important complication of myopia and a major cause of visual impairment [3]. The risk of MMD associated with high myopia is 845.08 times higher than that associated with emmetropia [4]. The number of patients with visual impairment due to MMD is expected to increase to 55.7 million by 2050 if the current interventions are not improved, and one-third of these people may become blind [5].
Several studies have reported an association between choroidal thickness (CT) and the progression of MMD, and progressive choroidal thinning has been observed with increasing disease severity. A previous study reported that choroidal thickness thresholds of 56.5 (nasal) and 62 µm (subfoveal) have been reported for predicting peripapillary and macular diffuse choroidal atrophy, respectively [6]. Beyond choroidal thinning, our previous studies demonstrated that reductions in the choroidal vascularity index (CVI) were associated with visual impairment in pathological myopia [7]. Furthermore, we were the first to report disease-specific alterations of CVI in pathological myopia, characterized by a pronounced nasal–temporal asymmetry [8]. Among the distinct vascular layers of the choroid, the choriocapillaris (CC), which is located immediately adjacent to the retinal pigment epithelium (RPE) and Bruch’s membrane (BM) complex, constitutes the innermost vascular layer of the choroid. The CC is the critical site for metabolic exchange due to its high density and blood flow and provides vital oxygen and nutritional support to photoreceptors [9]. Therefore, it is essential to investigate changes in the choriocapillaris in MMD.
Segmentation of the CC is associated with several challenges. Previous studies have reported that the demarcation between the human choriocapillaris and Sattler’s/Haller’s layer is indistinct, making direct segmentation difficult on B-scans of optical coherence tomography (OCT) [10]. Zhou et al. used optical coherence tomography angiography (OCTA) signals to differentiate them, but their method required access to raw OCT signals [11]. The CC has been reported to present a homogeneous reticular pattern in en-face (C-scan) OCT images, which enables its segmentation [12]. Consequently, this study was designed to capitalize on this characteristic by performing CC segmentation based on C-scan images. It aimed to investigate the changes in CC thickness in pathological myopia and provide new references for identifying and understanding MMD.
2. Materials and Methods
2.1. Participants and Design
This cross-sectional study was approved by the Ethics Committee of Wenzhou Medical University and adhered to the tenets of the Declaration of Helsinki. Between May 2023 and September 2025, 196 participants were consecutively recruited from the high-myopia clinic of our hospital; all underwent the same screening examinations. For the present analysis, 30 participant triplets (90 eyes; one control, one simple-high-myopia, and one pathological-myopia participant per triplet) were selected from this pool by frequency matching: participants were chosen such that the age and sex distributions of the three groups were comparable at the group level (both p > 0.05; Table 1), and selection was performed before any image segmentation. One eye per participant was included; when both eyes were eligible, the eye with the longer axial length was selected. The remaining participants (n = 106) are currently undergoing image processing and were not included in the present analysis.
Table 1.
Basic characteristics of the three groups.
Only one eye per participant was included to avoid inter-eye correlation. The study eyes were categorized into three groups: (a) control group (CN), which included emmetropic and low myopic eyes with spherical equivalent (SE) values ranging from −3.0 to +1.0 diopters (D); (b) simple high myopia (SHM) group, which included eyes with SE values of ≤−6.0 D or axial lengths of ≥26.5 mm and without myopic pathological changes on fundus photography; and (c) pathological myopia (PM) group, which included eyes with SE values of ≤−6.0 D or axial lengths of ≥26.5 mm and pathological changes in the fundus. In this study, only eyes with MMD (diffuse chorioretinal atrophy, category 2 [C2], according to the International Pathological Myopia Meta-Analysis [META-PM] classification system [13]), predominantly involving the peripapillary or macular regions, were included.
The exclusion criteria included myopic plus lesions such as choroidal neovascularization, as well as ocular conditions that could affect OCT image quality or retinal and choroidal structure, including intraocular pressure (IOP) > 21 mmHg, age-related macular degeneration, significant cataract, diabetic retinopathy, history of intraocular surgery, and retinal detachment.
2.2. Clinical Examinations
All participants underwent comprehensive clinical examinations, including refraction, assessment of best-corrected visual acuity (BCVA), and measurement of IOP. The SE was calculated as the sum of the spherical dioptric power and half of the cylindrical dioptric power. The BCVA was expressed as the logarithm of the minimum angle of resolution (LogMAR). The IOP was measured using the Canon TX-F fully automatic tonometer (Canon Inc., Tokyo, Japan). The axial length (AL) was measured using the Lenstar 900 (Haag-Streit USA, Mason, OH, USA). Digital 45 × 45° color fundus photographs were captured using a retinal camera (VISUCAM 224; Carl Zeiss Meditec, Jena, Germany).
2.3. Image Acquisition Protocol and Analysis
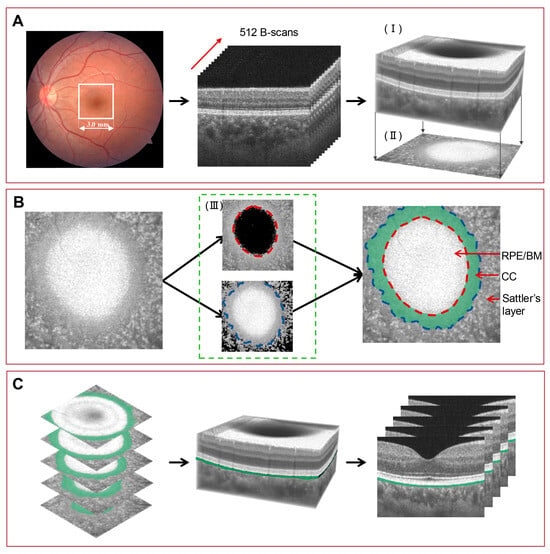
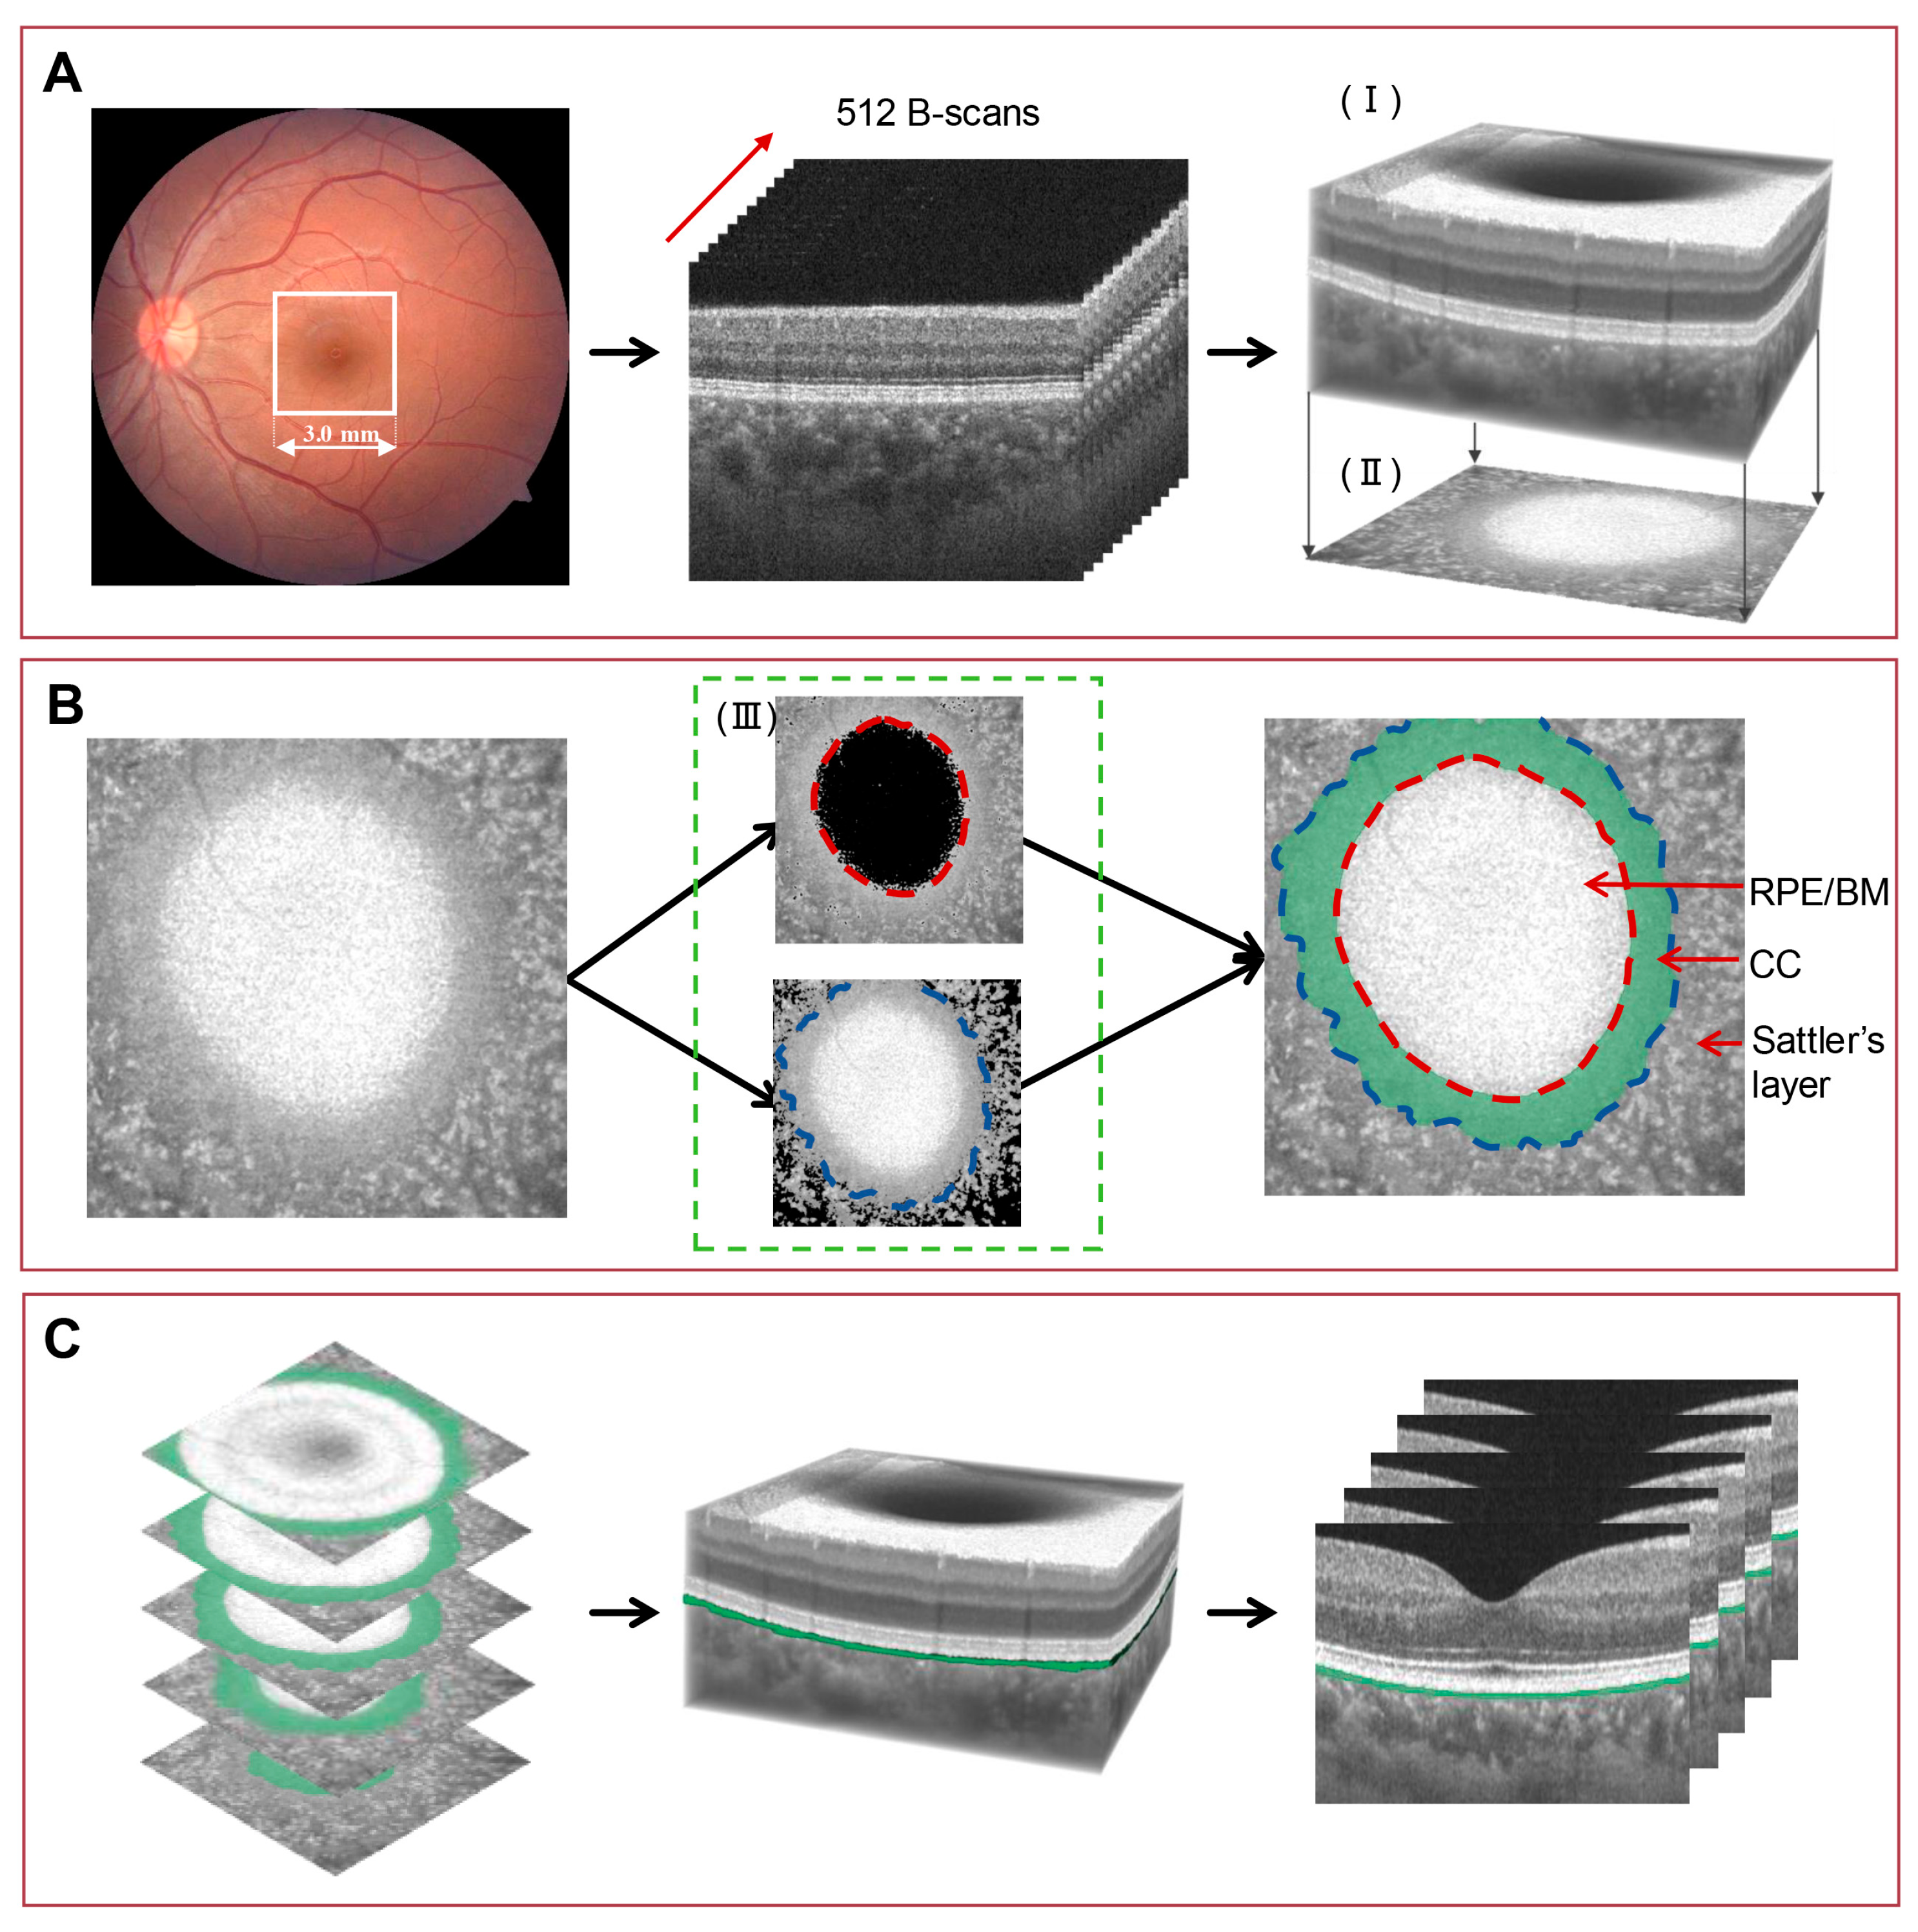
All participants underwent swept-source OCT (SS-OCT; VG200S, SVision Imaging, Luoyang, China) with a central wavelength of 1050 nm. The scanning speed was 200,000 A-scans/s, and the axial resolution was 6.3 µm. Volume scanning mode with a scanning range of 3 × 3 mm around the fovea was used (Figure 1A). Each OCT volume consisted of 512 × 512 × 1024 voxels, corresponding to a lateral sampling interval of approximately 5.86 × 5.86 × 3 µm. Scans with a quality score of >4/10 (as defined by the machine) were selected for further analysis. All OCT images were corrected for magnification using the Bennett formula (t = p × q × s), where t is the actual scan length, p is the magnification factor inherent to the OCT imaging system camera, q is the magnification factor related to the eye, and s is the original measurement from the OCT imaging system. These factors have been described in detail in previous studies [7,14]. The actual scan range (t) was equivalent to the original measurements for eyes with an AL of 24.46 mm. The actual scan length (t) for eyes with other AL values was adjusted using the following formula:
Figure 1.
Image acquisition and segmentation process for the choriocapillaris. (A) Optical coherence tomography (OCT) images were acquired using the 3 × 3 mm scanning mode, and the OCT volume was reconstructed to obtain the C-scan images. (I) Volumetric rendering of the OCT. (II) C-scan image projection derived from the volume. (B) Definition of the CC boundaries on the C-scan image. (III) Niblack’s local thresholding was applied to suppress hyper-reflective BM signals for delineation of the inner CC boundary (red dashed line, upper panel) and attenuate low-intensity signals from medium choroidal vessels to define the outer boundary (blue dashed line, lower panel). The green region represents the CC. (C) Extraction of CC thickness. Following manual annotation, the C-scan segmentation was mapped back onto the reconstructed OCT volume to visualize the segmented CC layers on B-scan images. CC thickness was calculated on B-scan images as the distance between the inner and outer CC boundaries. CC, choriocapillaris; RPE/BM, retinal pigment epithelium–Bruch’s membrane complex.
All measurements were standardized to a central 2.5 × 2.5 mm area centered on the fovea to ensure consistency across samples.
The segmentation of the CC on B-scan images is constrained by the limited axial resolution (approximately 8 pixels per A-line). Quantification of layers thinner than the axial resolution by signal averaging is an established approach in OCT imaging [11,15]. The CC appears as a relatively homogeneous reticular pattern with indistinct vessel lumens on the C-scan image. In contrast, the Sattler’s/Haller’s layers demonstrate a heterogeneous pattern with vascular segments overlapping in different planes. The choroidal Sattler’s layer has small-caliber vessels, whereas the Haller’s layer has medium and large choroidal vessels [12]. These characteristics enable more reliable segmentation of fine structures in en-face views. The CC was defined as the homogeneous area between the BM (visualized as a uniform hyper-reflective band) as the inner boundary on the C-scan image (corresponding to the upper boundary on the B-scan) and the CC–Sattler interface as the outer boundary on the C-scan image (corresponding to the lower boundary on the B-scan) (Figure 1B).
The CC gradually transitions into the medium- and small-vessel layers, and its boundary with Sattler’s layer is indistinct. We applied Niblack local thresholding solely to enhance boundary visualization and assist manual delineation (window size, 15 × 15 pixels; threshold coefficient, k = 0.01); it was not used for automated boundary detection. This method determines an adaptive threshold based on the mean and standard deviation within a defined neighborhood, which enabled effective suppression of low-intensity signals from the medium-vessel while reducing interference from hyper-reflective signals originating from Bruch’s membrane, thereby enhancing local contrast and facilitating clearer delineation of CC structures [16]. The en-face projections were reconstructed from the OCT volume after preprocessing, and the CC was manually annotated independently by two trained graders, each masked to the other’s annotations, to their own earlier annotations, and to the diagnostic group, using 3D Slicer (version 5.6.2). No interpolation or automated surface fitting was applied; the manually delineated boundaries from consecutive C-scans were directly assembled according to their original spatial positions to reconstruct the three-dimensional boundary surfaces, and CCT was obtained as the axial separation between the two surfaces at each sampling point.
CC thickness maps were generated from the volumetric segmentation after manual annotation (CC boundaries were projected from C-scan images to B-scan images) (Figure 1C). The mean CC thickness (CCT) was calculated as the distance between the segmented boundaries by averaging all measurements within 2.5 × 2.5 mm around the fovea. The spatial standard deviation (SD) of CCT and its coefficient of variation (CV, SD divided by the mean) were used to characterize the within-eye dispersion of CC thickness in this region. In addition, the skewness of the within-eye CCT distribution was calculated for each eye as an exploratory measure of the shape of the spatial thickness distribution.
Each of the 15 volumes was segmented twice on the same day, once in the morning and once in the afternoon; the two readings were performed independently, with no access to the earlier results, and masked to the diagnostic group. Reliabilities were determined using the two-way random-effects, absolute-agreement, single-measurement ICC (ICC(2,1)), with 95% confidence intervals obtained by the exact F method.
We used deep learning to automatically quantify the other choroidal parameters within the 2.5 × 2.5 mm region of the macula. The distance between the BM boundary and the choroid-sclera junction was defined as the CT. The luminal volume (LV) and stromal volume (SV) were demarcated based on Niblack’s auto-local threshold algorithm after binarization of the OCT images. The CVI was defined as the ratio of the LV to total choroidal volume (LV + SV), as reported in our previous study [7].
2.4. Statistical Analysis
The eye characteristics are reported as means ± standard deviations. The data were analyzed using SPSS Statistics 26.0 (IBM Corporation, Chicago, IL, USA). The differences in gender ratios among the three groups were analyzed using the χ2 test. The differences among the three groups were determined using one-way analysis of variance, followed by Tukey’s post-hoc test. The skewness of CCT was compared among groups using the Kruskal–Wallis test followed by Dunn’s post-hoc test with Bonferroni correction, and its associations with axial length and choroidal thickness were assessed using Pearson correlation. The intra- and inter-grader reliabilities of the method were validated using intraclass correlation coefficient and Bland–Altman plots. Univariable and multivariable linear regression analyses were performed to assess factors associated with CCT. To avoid multicollinearity, highly correlated choroidal parameters were not included simultaneously in the multivariable model. Standardized regression coefficients (β) were reported, and the equality of the absolute magnitudes of the two standardized coefficients (H0: β_axial length + β_choroidal thickness = 0) was determined using a Wald test. To further address confounding, group differences in CCT were examined in a series of linear models: unadjusted, adjusted for age and sex, further adjusted for axial length, and in a full model including age, sex, axial length, and choroidal thickness. Mediation analysis was conducted to evaluate whether CT mediated the association between AL and CCT. The associations between choroidal parameters and BCVA were assessed using correlation analysis. Receiver operating characteristic (ROC) curve analysis was used to evaluate the ability of parameters to discriminate SHM from PM. The area under the curve (AUC) and corresponding 95% confidence intervals (CIs) were calculated. Internal validation was performed using stratified bootstrap resampling (1000 iterations; 30 simple-high-myopia and 30 pathological-myopia eyes drawn with replacement in each iteration). Within each iteration, the cutoff was re-selected by maximizing the Youden index and the AUC was recomputed. Exact binomial 95% confidence intervals were calculated for sensitivity and specificity at the original cutoff. To obtain a held-out estimate of the full modeling procedure, the cutoff selected within each resample was additionally applied only to the eyes not drawn into that resample (out-of-bag eyes, approximately 37% per iteration). Out-of-bag predictions were pooled across iterations, and each eye was classified by majority vote over the iterations in which it was out-of-bag.
3. Results
3.1. Basic Patient Characteristics
The study included 90 eyes, and 30 were allocated to each of the CN, SHM, and PM groups. Within the PM group, diffuse chorioretinal atrophy predominantly involved the macular region (26/30 eyes), with fewer eyes showing peripapillary involvement (4/30). The groups did not differ significantly in age, sex, or IOP (p = 0.304, p = 0.223, and p = 0.636, respectively). However, significant differences in AL, SE, and BCVA were observed (all p < 0.001; Table 1). The AL was longer, and the myopia and BCVA were worse in the PM group than in the CN and SHM groups. The SHM group had longer AL, higher myopia, and worse BCVA than the CN group (Table 1).
3.2. Reliability Analysis of Choriocapillaris Measurements
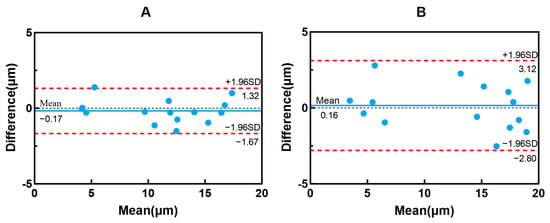
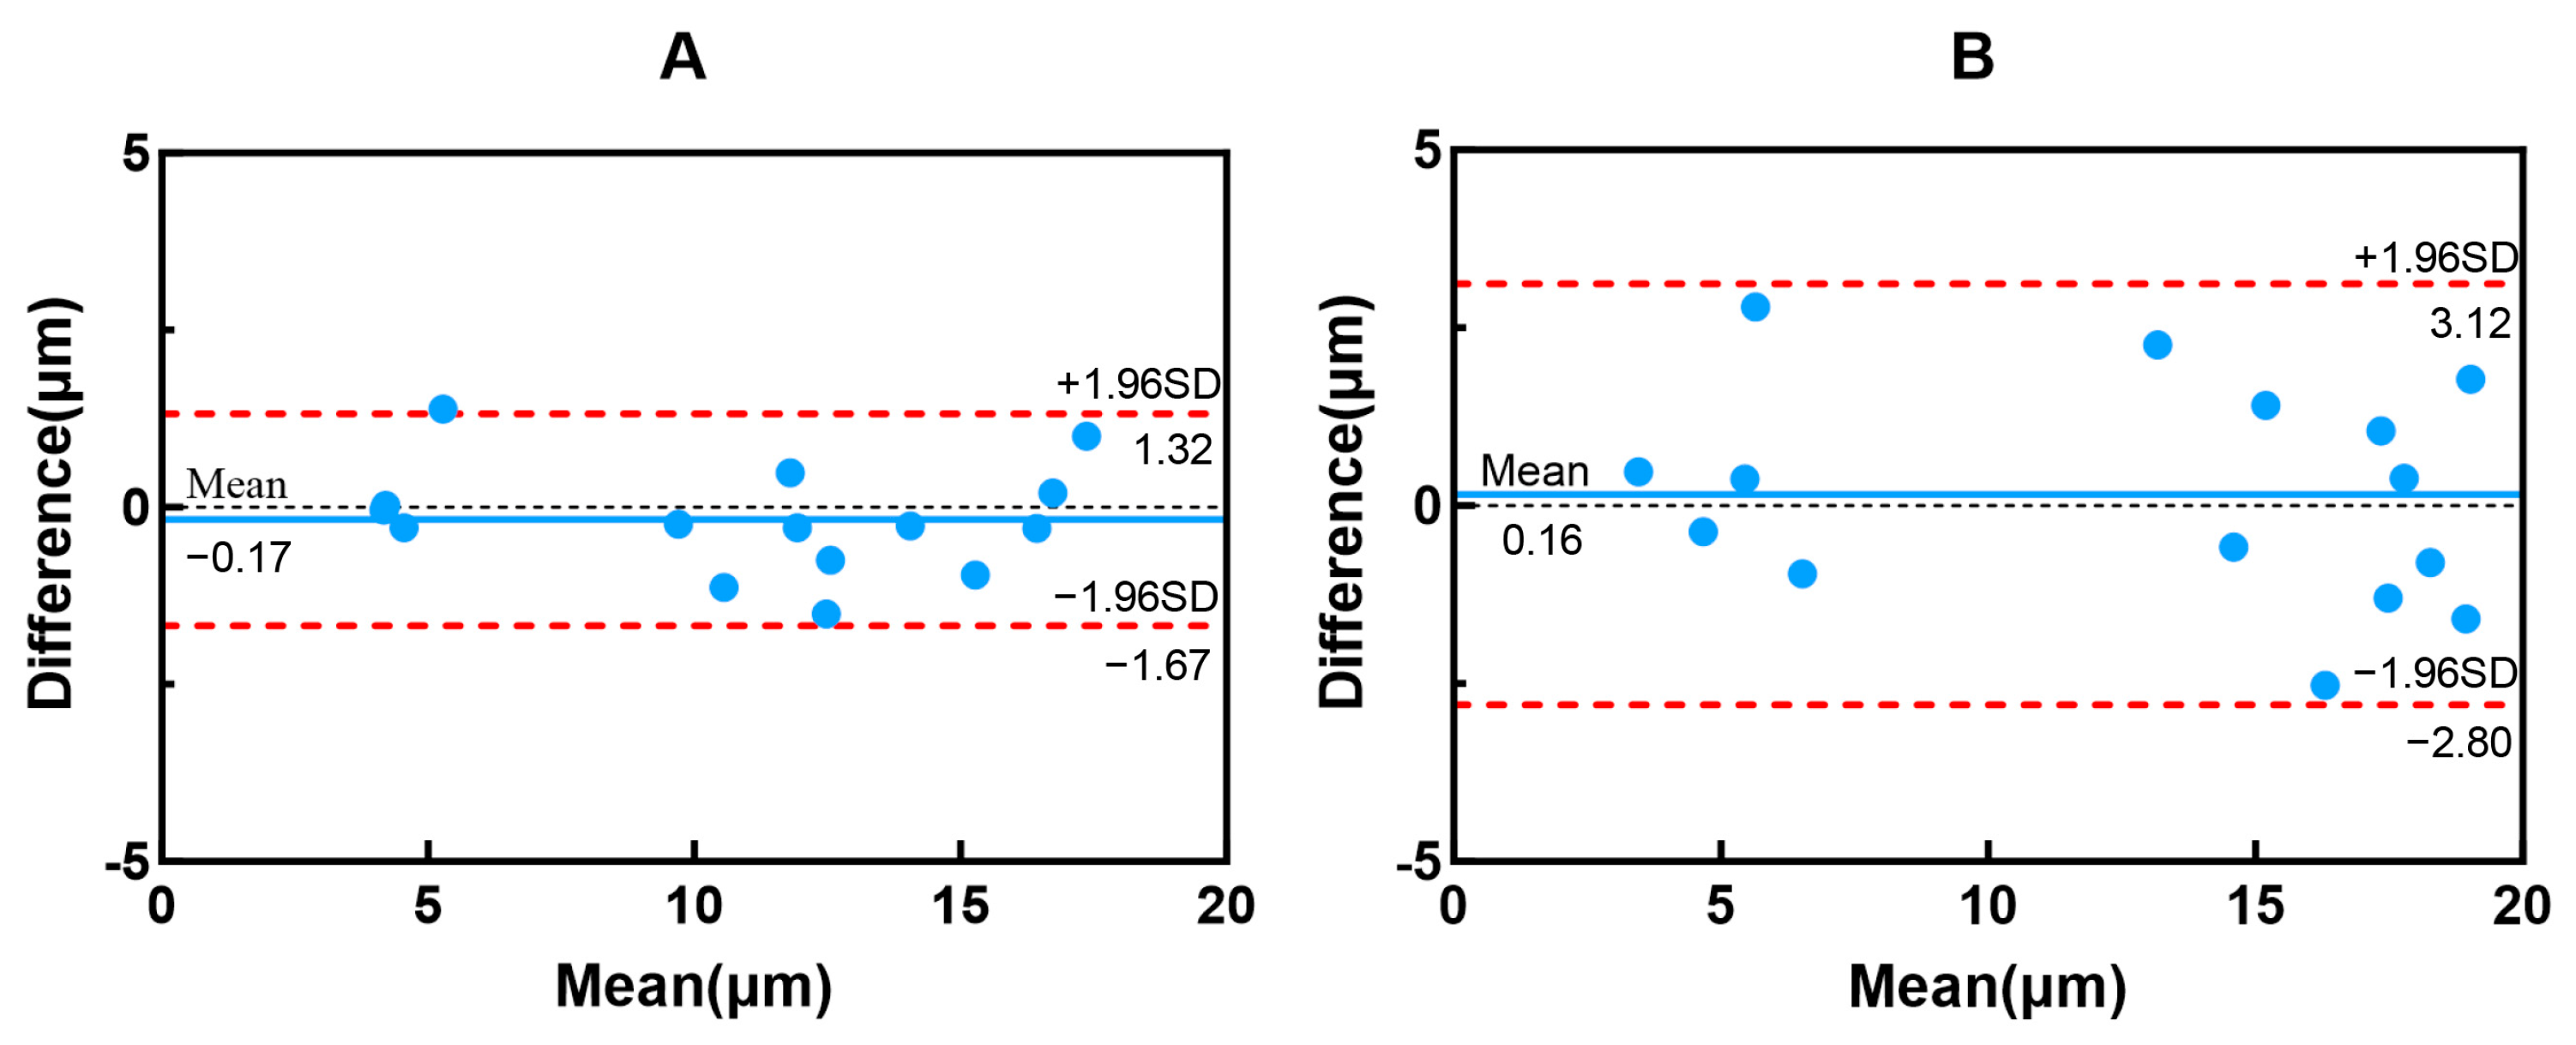
We randomly selected five eyes from each of the three groups (15 eyes in total) for repeat annotation of the same 15 OCT volumes. The intra- and inter-grader reliabilities were excellent, with ICCs of 0.987 (95% CI, 0.925–0.996) and 0.970 (95% CI, 0.833–0.990), respectively. Bland–Altman analysis revealed that the differences in the CC thickness determined from the two repeated measurements were within the limits of agreement for most cases (Figure 2). The limits of agreement describe the expected disagreement for a single eye graded once, whereas the between-group differences are based on group means of 30 eyes; the standard error of the mean difference between the CN and SHM groups was 0.66 µm, with a 95% confidence interval of 0.66–3.31 µm. Random grading error increases the uncertainty of single-eye measurements without systematically shifting the group means, and the confidence intervals we report already reflect this uncertainty. A systematic boundary offset common to the three groups would displace all CCT values in the same direction and would largely cancel in between-group contrasts.
Figure 2.
Bland–Altman plots for intra-observer and inter-observer reliability. (A) Bland–Altman plot for intra-observer reliability. (B) Bland–Altman plot for inter-observer reliability. The plots show the mean of the two measurements against their difference. The central blue solid lines represent the mean bias, and the red dashed lines represent the 95% limits of agreement.
3.3. Differences in CCT and Other Choroidal Parameters
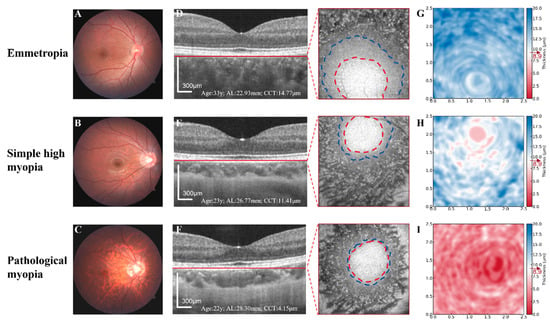
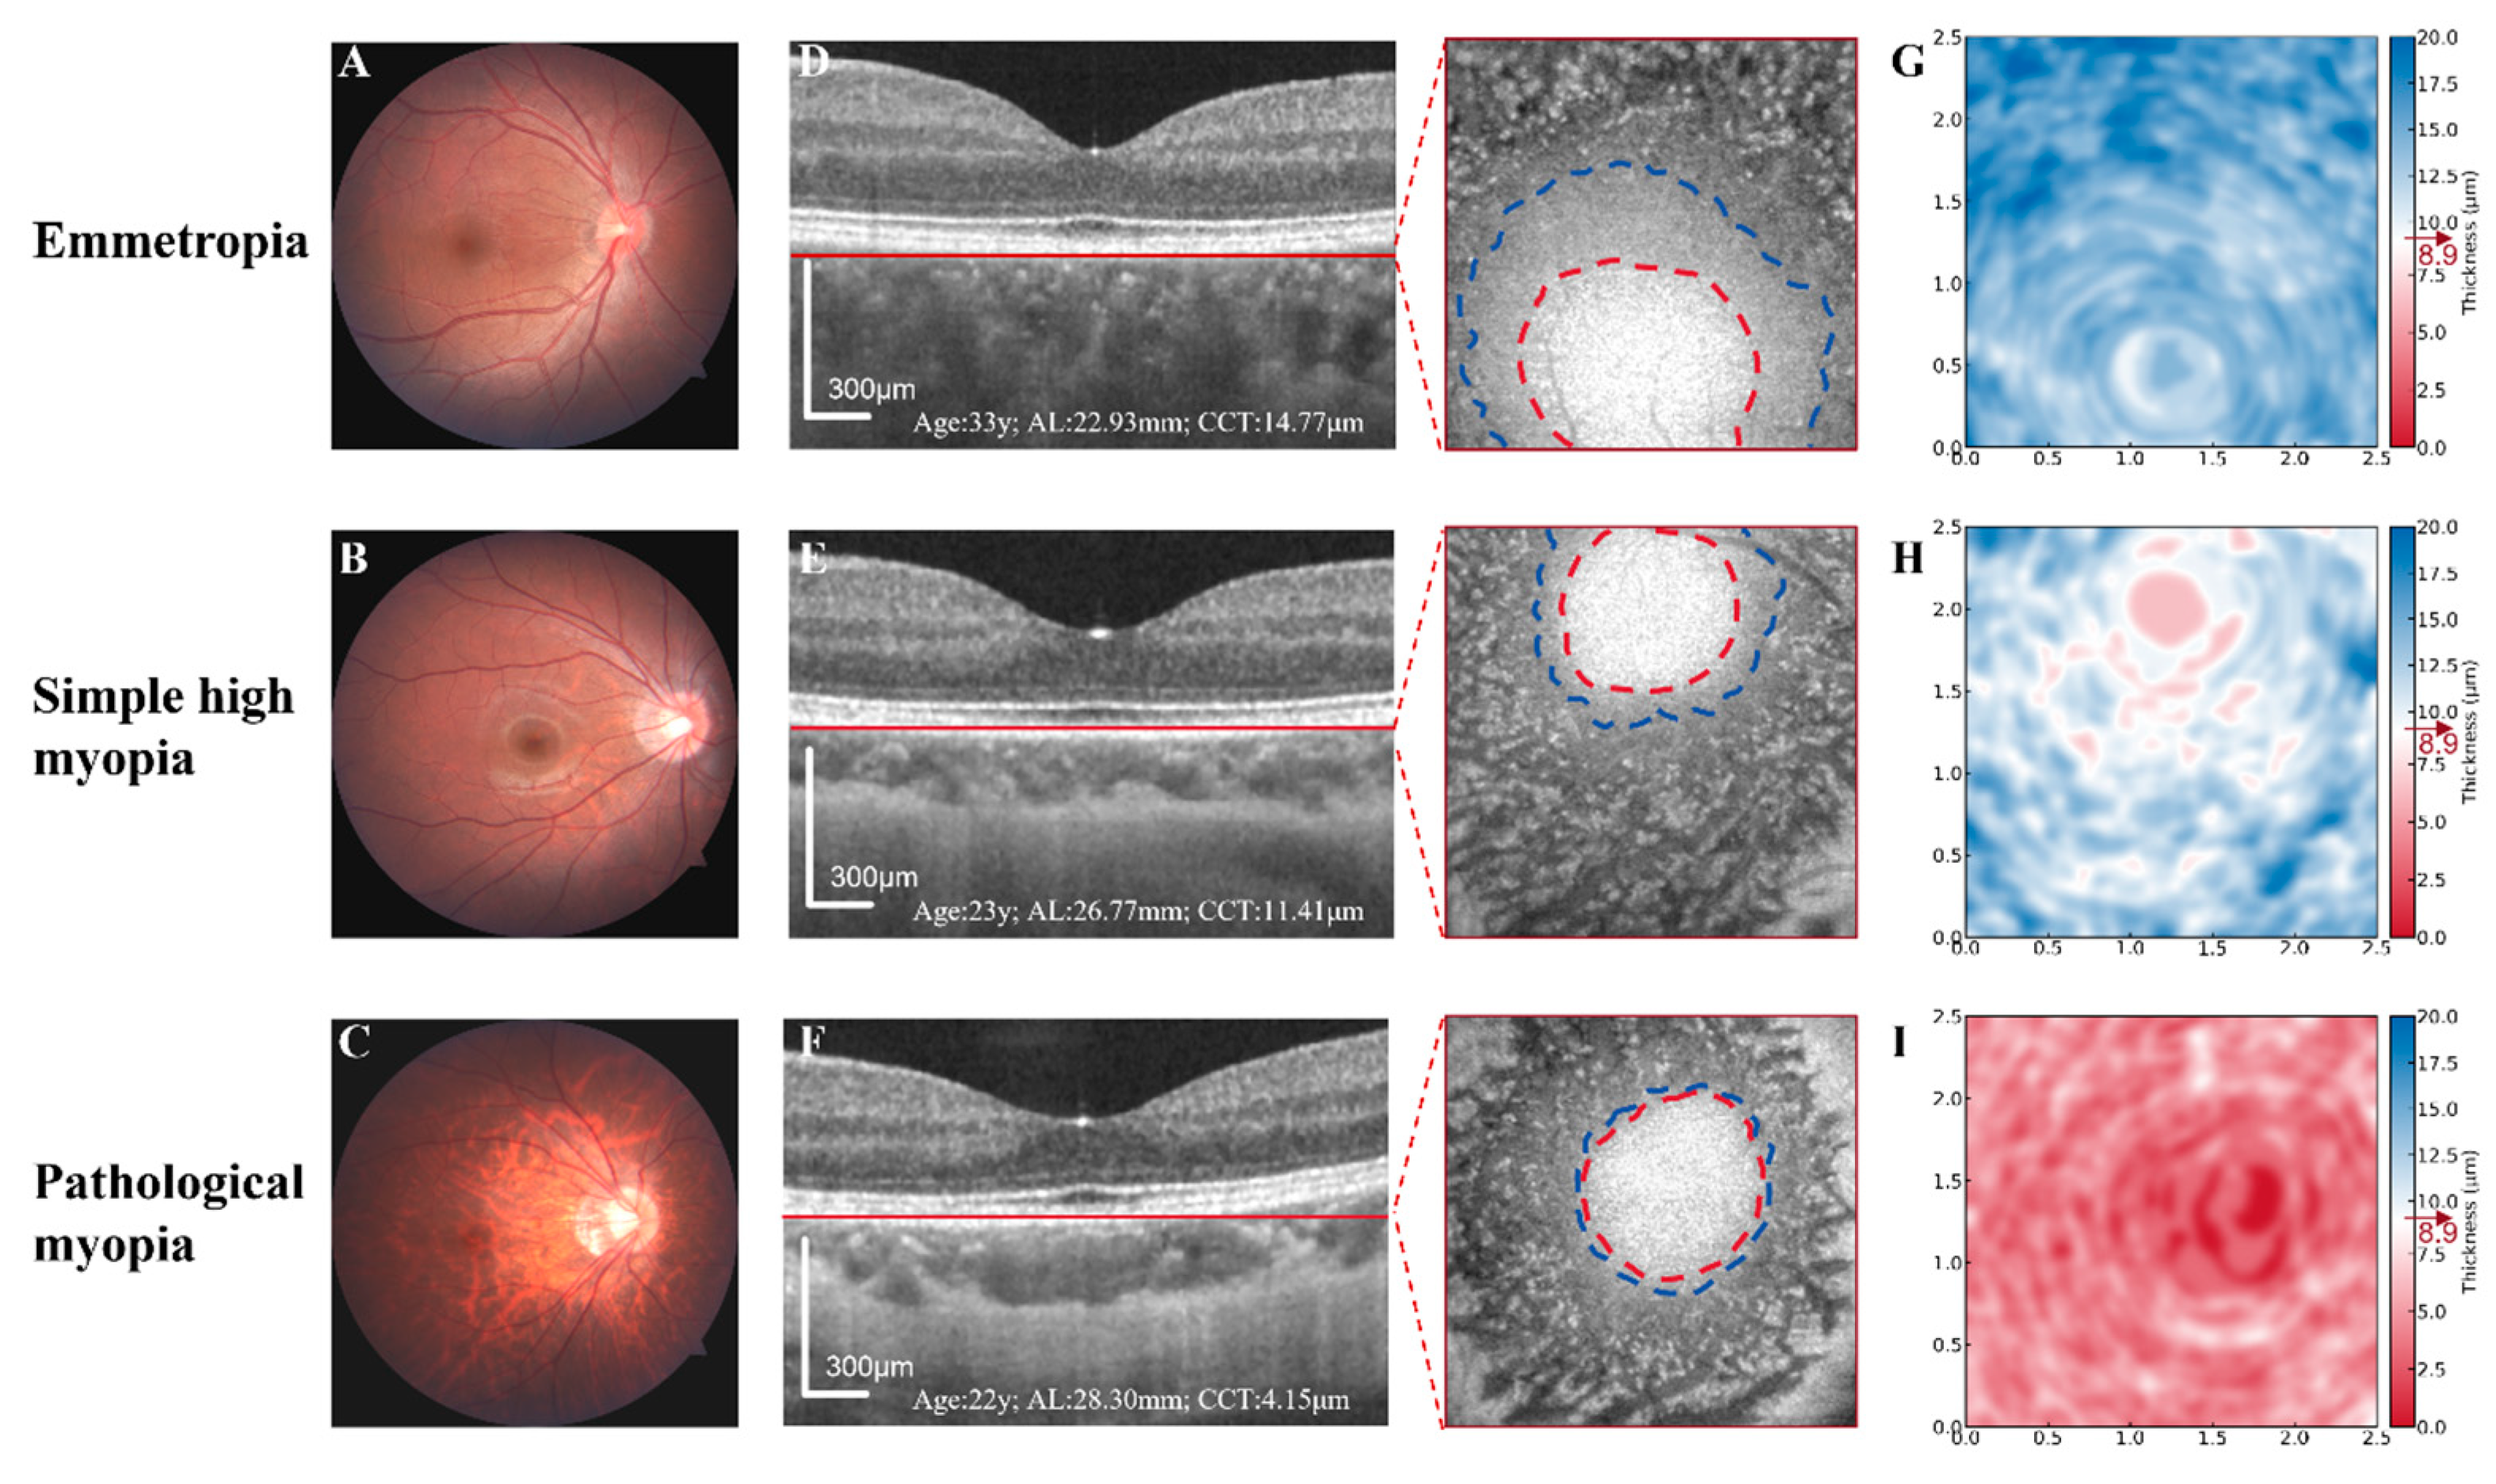
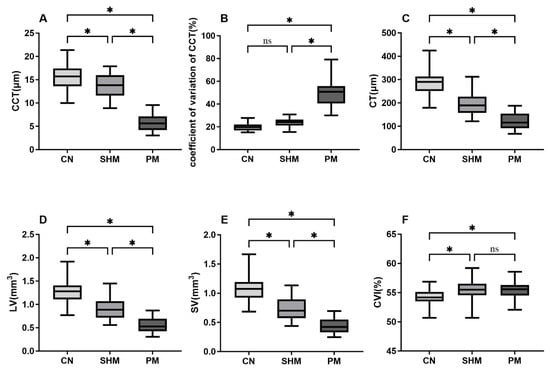
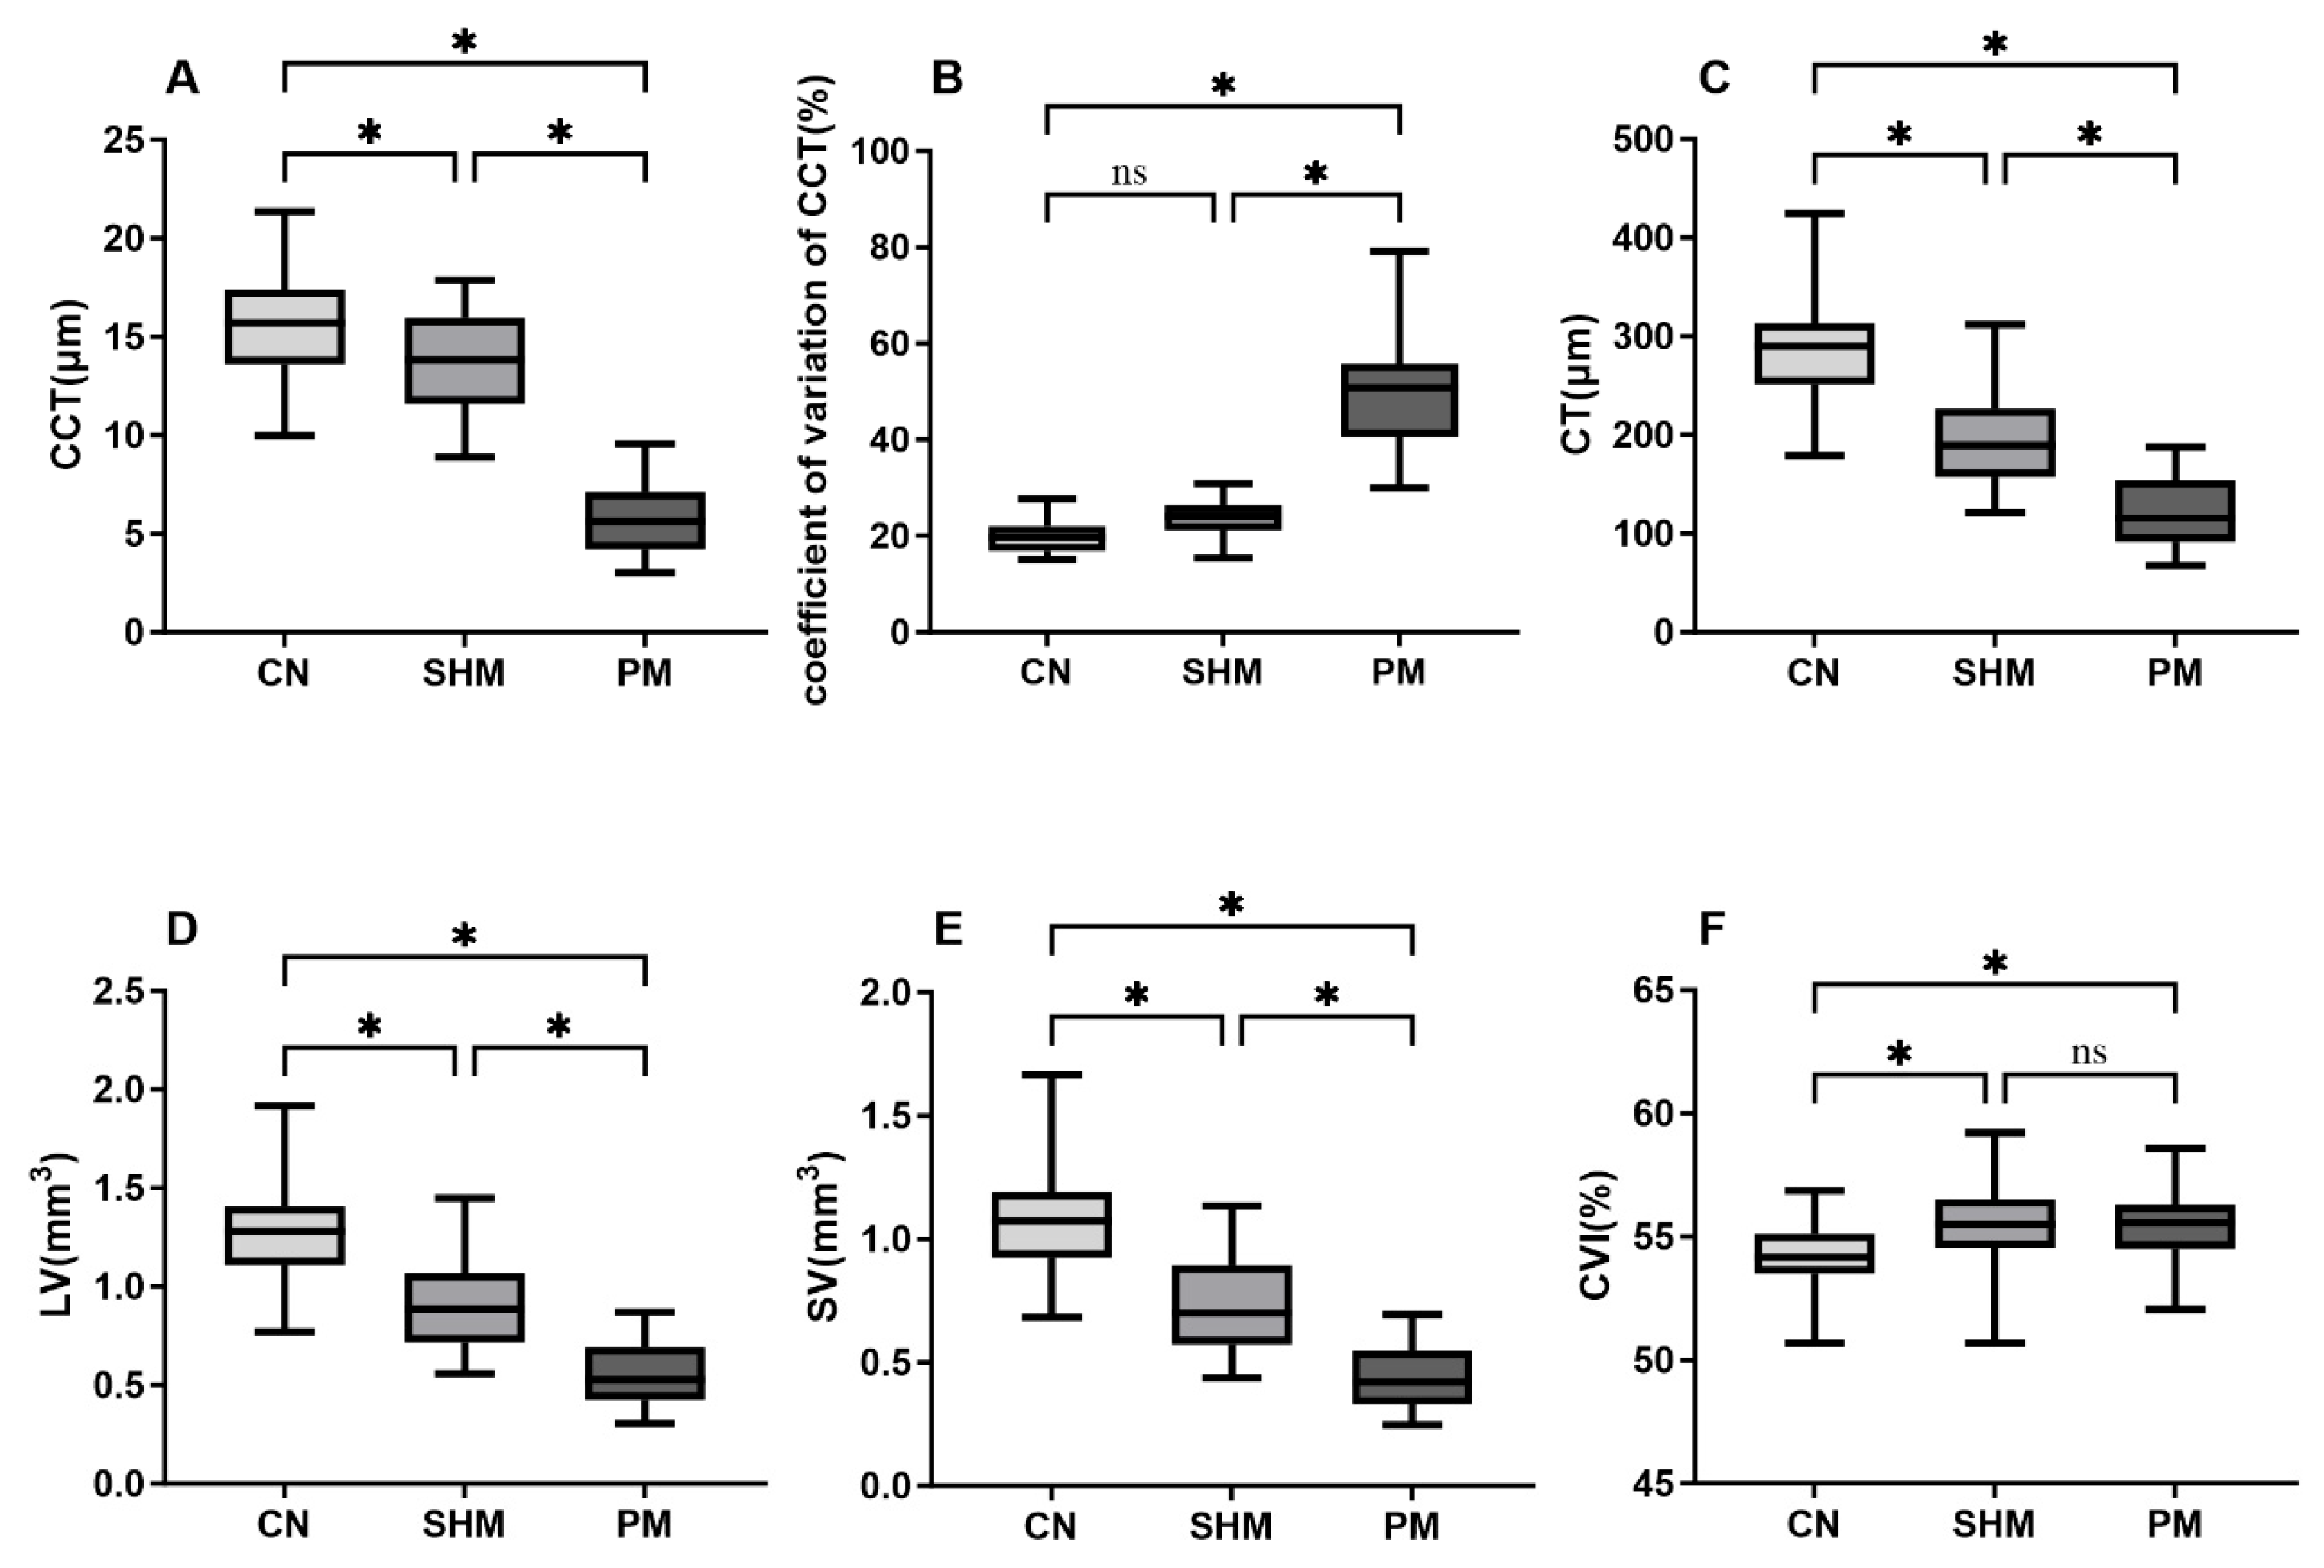
We acquired fundus and OCT images for each group, processed the CC layer for segmentation, and generated thickness maps (Figure 3). The average CC thickness was significantly lower for the PM group than for the CN and SHM groups (mean differences: 9.94 µm and 7.95 µm, respectively; both p < 0.001). It was also slightly but significantly lower for the SHM group than for the CN group (difference: 1.99 µm; p = 0.005). The coefficient of variation of CCT was significantly higher for the PM group than for the CN and SHM groups (p < 0.001, respectively). However, it did not differ significantly between the CN and SHM groups (p = 0.099). The absolute spatial SD of CCT was 3.09 ± 0.63 µm, 3.24 ± 0.60 µm, and 2.55 ± 0.61 µm in the CN, SHM, and PM groups, respectively (ANOVA p < 0.001; Tukey: PM vs. SHM, p < 0.001; PM vs. CN, p = 0.002; SHM vs. CN, p = 0.583), indicating that the absolute spatial dispersion did not increase in PM; the higher CV in PM (46.5 ± 10.9%) therefore reflects the reduction in mean CCT. In exploratory analyses, the skewness of the within-eye CCT distribution was +0.25 ± 0.21, +0.26 ± 0.25, and +0.50 ± 0.23 in the CN, SHM, and PM groups, respectively, with all 30 PM eyes showing positive skewness (Kruskal–Wallis p < 0.001; Dunn–Bonferroni: PM vs. SHM, p = 0.003; PM vs. CN, p = 0.001), and correlated with CT (r = −0.363, p < 0.001) and AL (r = +0.354, p < 0.001).
Figure 3.
Fundus photographs, optical coherence tomography images, and choriocapillaris thickness heatmaps of eyes with emmetropia, simple high myopia, and pathological myopia. Fundus photographs (A–C) and B-scan images (D–F) and C-scan images correspond to the plane marked by the red solid line on the B-scan. The red and blue dashed lines indicate the upper and lower boundaries of the choriocapillaris, respectively. The heatmaps (G–I) represent the choriocapillaris thickness distribution within a 2.5 × 2.5 mm area centered on the macula. The red-white-blue color map represents the choriocapillaris thickness, with white denoting a thickness of 8.9 µm. AL, axial length; CCT, choriocapillaris thickness. Scale bars: 300 µm.
The CT, LV, and SV differed significantly among the three groups (p < 0.001 for all; Figure 4). The CVIs of the SHM and PM groups were higher than that of the CN group (p < 0.05). However, the difference between the SHM and PM groups was not significant (p = 0.991).
Figure 4.
Box-and-whisker plots comparing the choroidal parameters of the three groups. (A) CCT; (B) coefficient of variation of CCT; (C) CT; (D) LV; (E) SV; and (F) CVI. CCT, choriocapillaris thickness; CT, choroidal thickness; CVI, choroidal vascularity index; LV, luminal volume; SV, stromal volume. The median is represented by the middle line within each box, and the second and third quartiles are represented by the lower and upper segments of the box, respectively. The whiskers represent the minimum (bottom) and maximum (top) values. * p < 0.05.
3.4. Associations Between CCT and Other Parameters
Univariable regression analysis showed that CCT was positively associated with CT, LV and SV, and negatively associated with AL and CVI (all p < 0.05; Table 2). Given the substantial collinearity among CT, LV, SV, and CVI, CT was selected as a representative parameter of choroidal structure for further analysis. In the multivariable model, CT and AL remained independently associated with CCT (standardized β_CT = 0.423, β_AL = −0.303; p = 0.002 and 0.020, respectively; Table 2). A Wald test of the equality of the absolute magnitudes of the two coefficients (H0: β_axial length + β_choroidal thickness = 0) showed no significant difference (difference, 0.120; F(1,85) = 0.24; p = 0.62). These group differences were robust to adjustment for age, sex, axial length, and choroidal thickness (Supplementary Table S1).
Table 2.
Linear regression models based on choriocapillaris thickness.
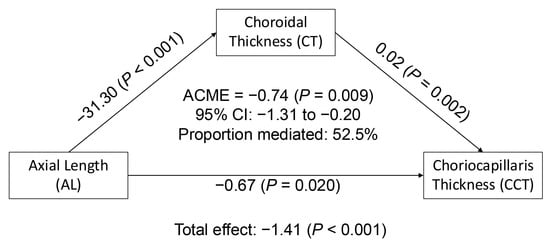
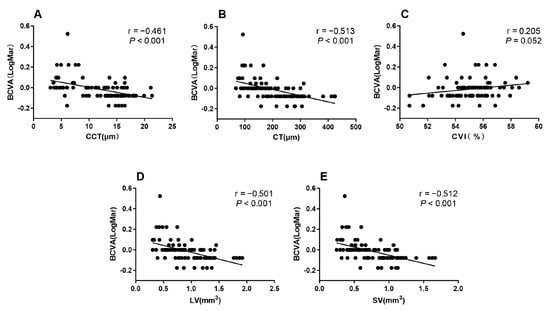
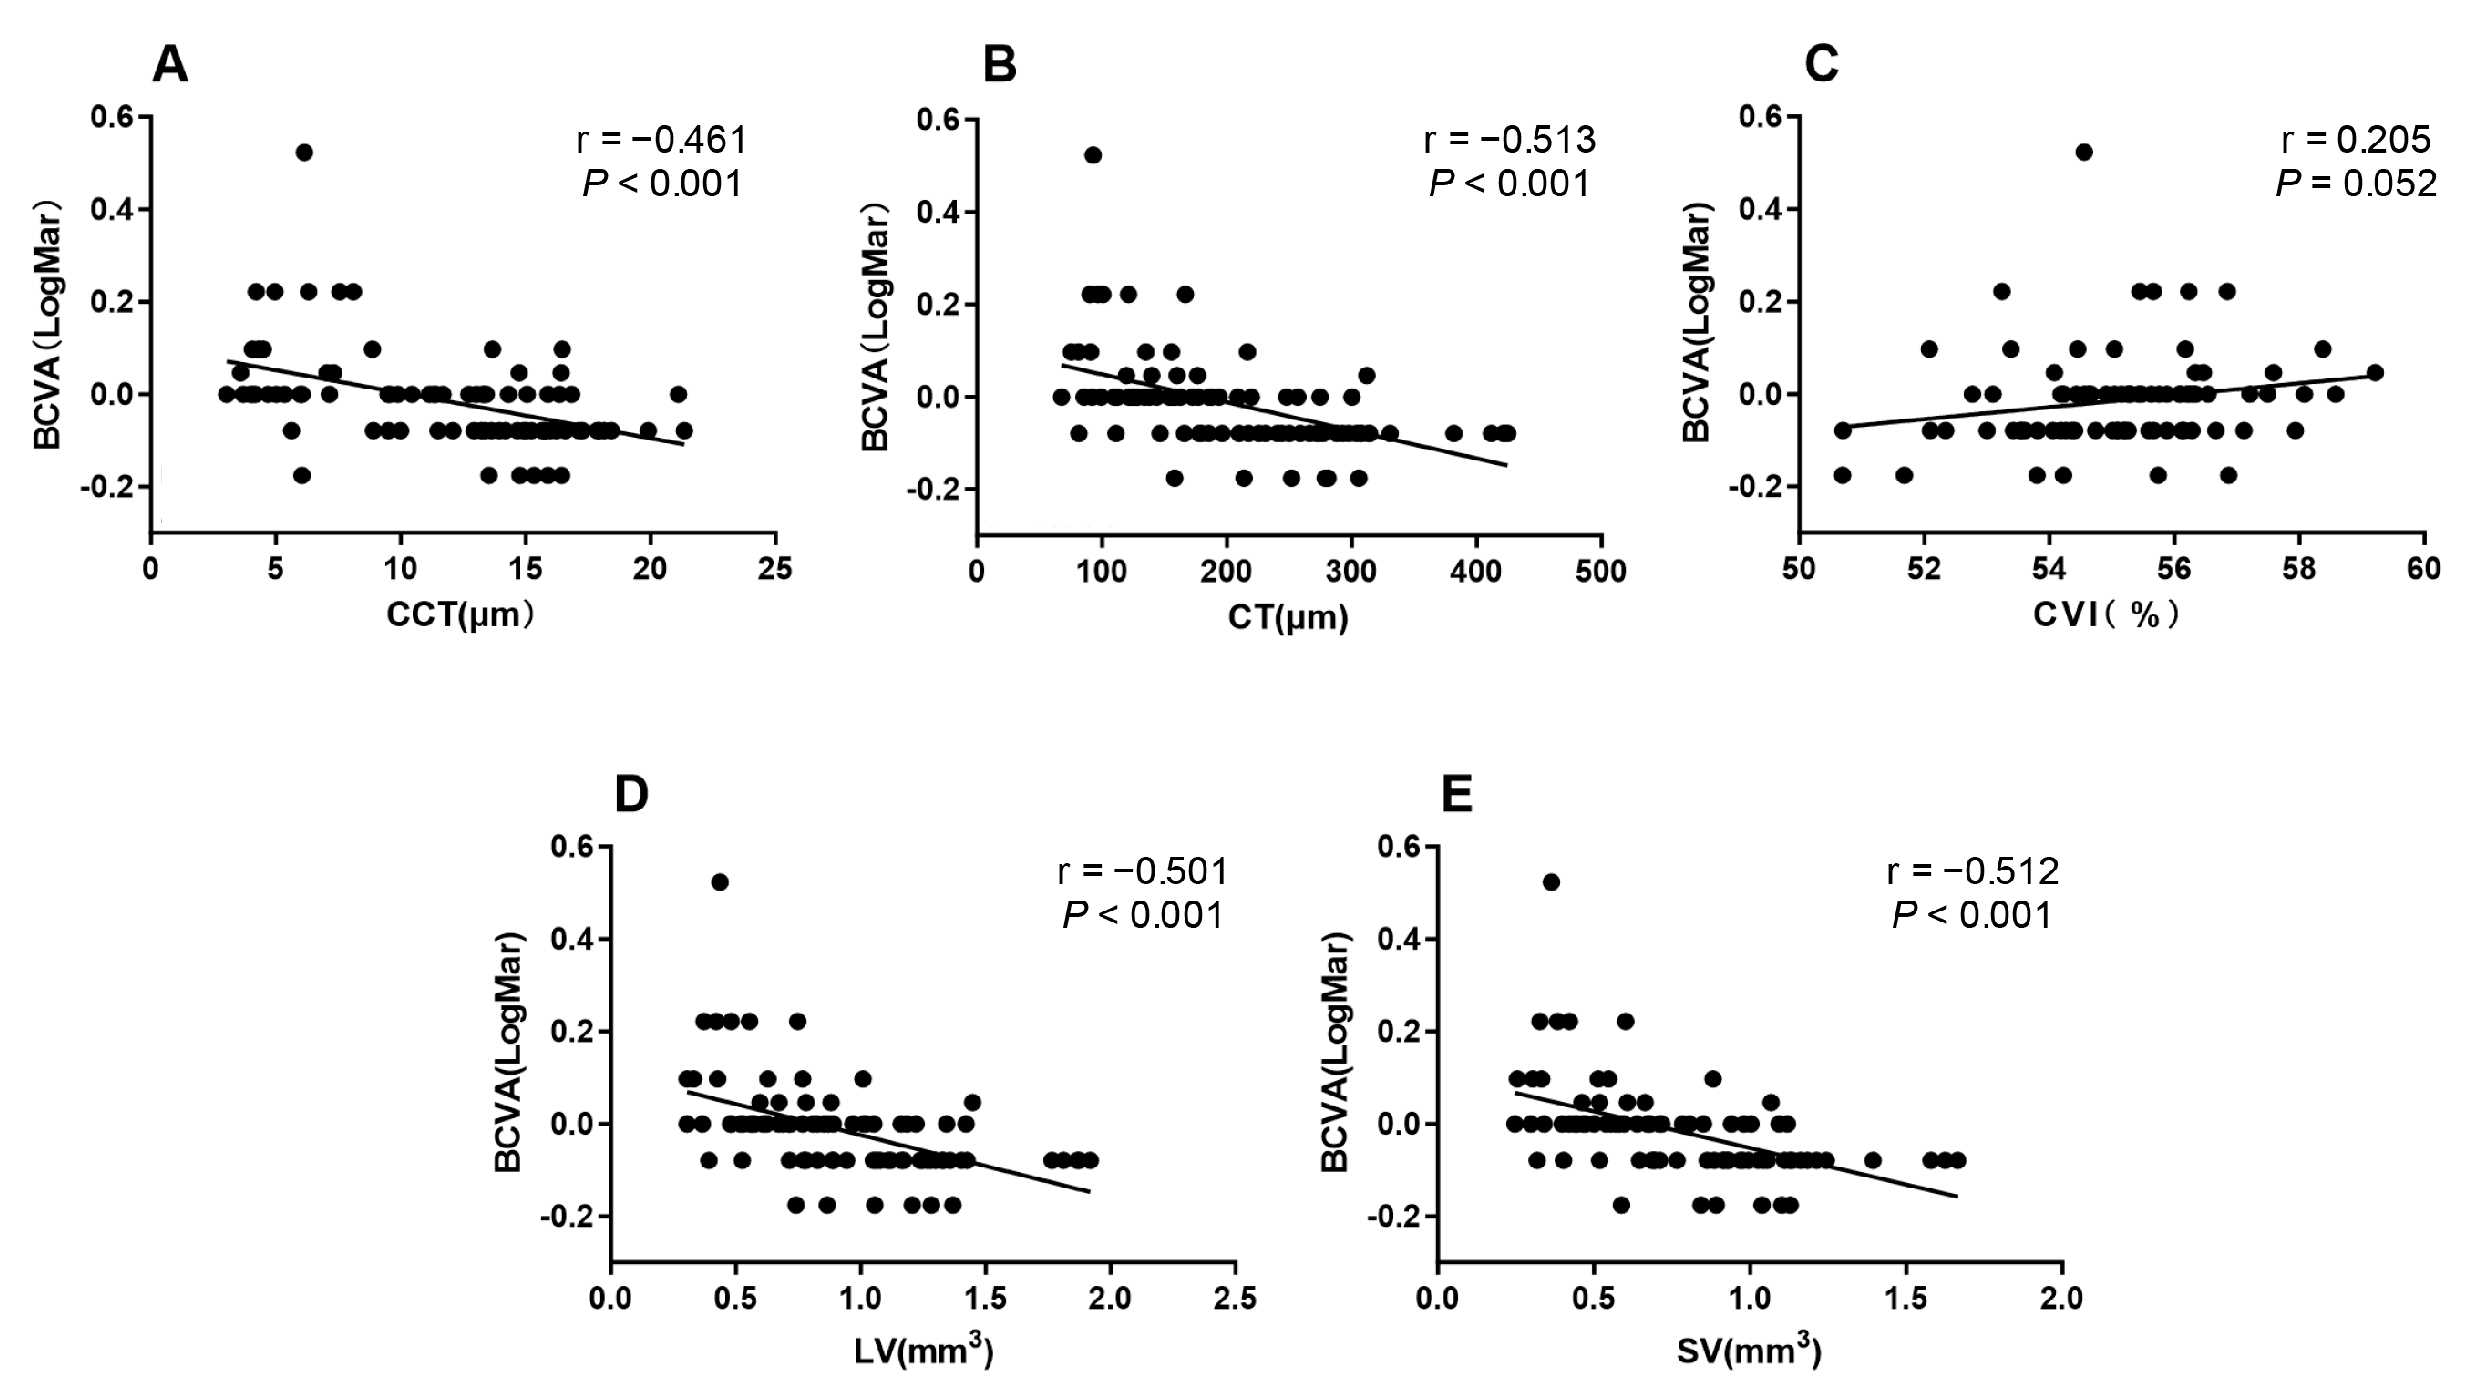
Mediation analysis showed that CT significantly mediated the association between AL and CCT. The total effect of AL on CCT was significant (p < 0.001), and the direct effect was attenuated after adjustment for CT. The indirect effect through CT was significant (p < 0.05), accounting for approximately 52.5% of the total effect (Figure 5). BCVA was significantly associated with CCT, CT, LV, and SV (all p < 0.001), but not with CVI (p = 0.052) (Figure 6).
Figure 5.
Mediation analysis of the association between axial length and choriocapillaris thickness mediated by choroidal thickness. ACME, average causal mediation effect (indirect effect); CI, confidence interval.
Figure 6.
Scatterplots showing the correlations between BCVA and choroidal parameters. (A) CCT versus BCVA; (B) CT versus BCVA; (C) CVI versus BCVA; (D) LV versus BCVA; and (E) SV versus BCVA. BCVA, best-corrected visual acuity. CCT, choriocapillaris thickness; CT, choroidal thickness; CVI, choroidal vascularity index; LV, luminal volume; SV, stromal volume. Each dot represents an eye. Black line represents linear regression fit.
3.5. Diagnostic Performance of Choroidal Parameters and Models
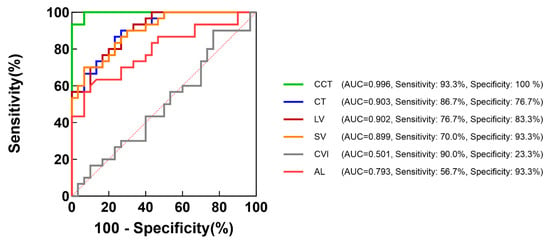
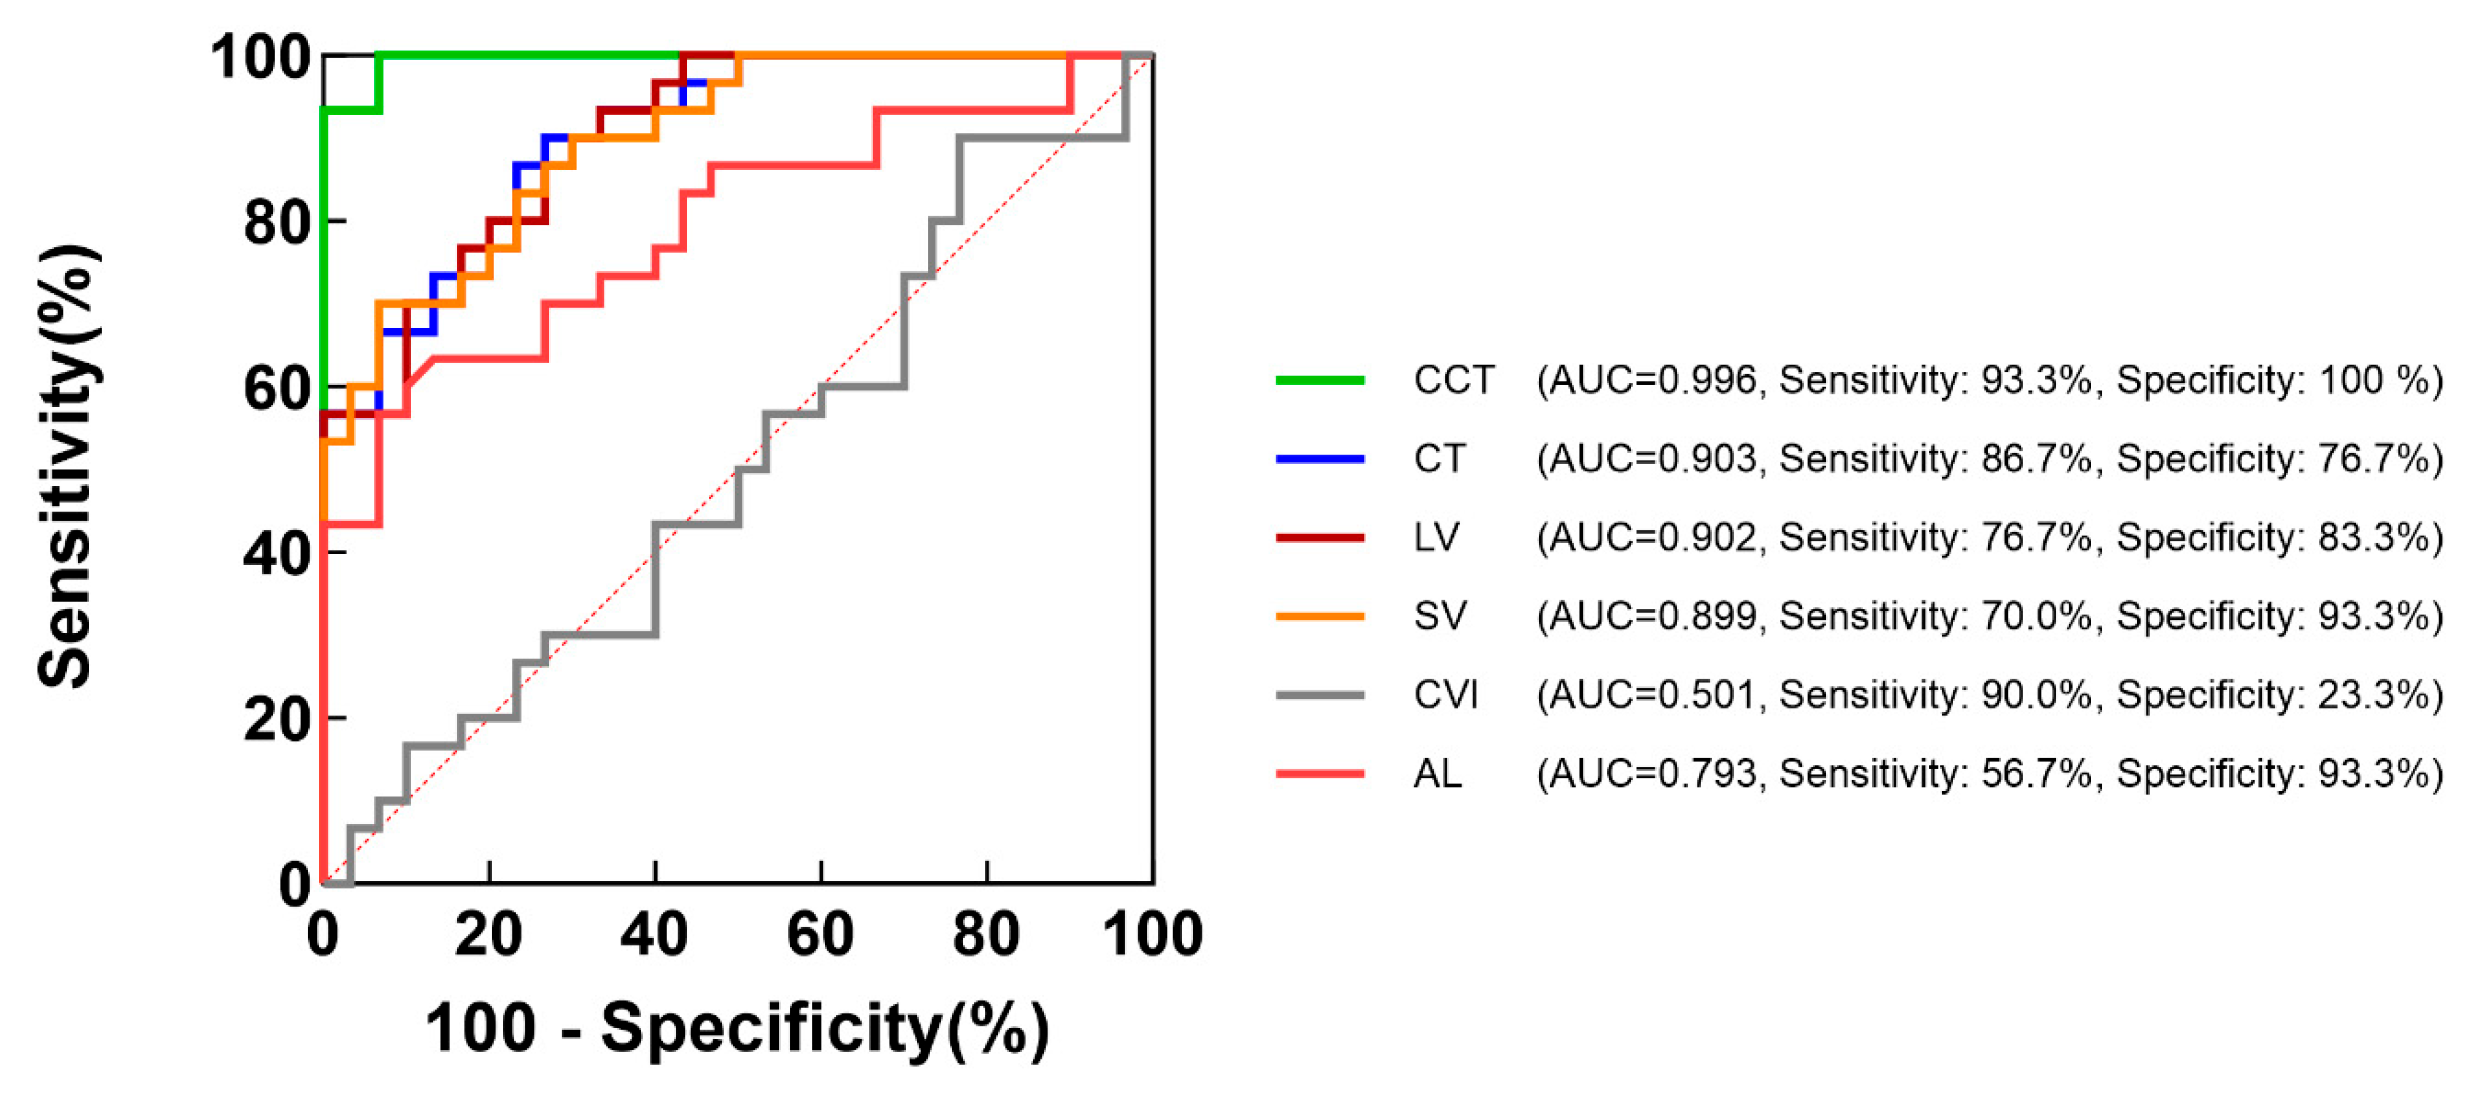
ROC curve analysis was performed to evaluate the ability of choroidal parameters and AL to distinguish SHM from PM (Figure 7). CCT showed excellent diagnostic performance, with an optimal cutoff value of 8.9 µm (AUC = 0.996, 95% CI: 0.978–1.000; sensitivity = 93.3%; specificity = 100%). The optimal cutoff values for CT and AL were 158.3 µm (AUC = 0.903, 95% CI: 0.823–0.984; sensitivity = 86.7%; specificity = 76.7%) and 28.2 mm (AUC = 0.793, 95% CI: 0.678–0.908; sensitivity = 56.7%; specificity = 93.3%), respectively. The AUCs for LV and SV were 0.902 (95% CI: 0.821–0.983) and 0.899 (95% CI: 0.817–0.981), respectively, whereas CVI demonstrated no significant discriminatory ability (AUC = 0.501, 95% CI: 0.354–0.648; p = 0.988) (Figure 7). Internal validation using stratified bootstrap resampling (1000 iterations, with the cutoff re-selected within each resample) yielded a bootstrap AUC 95% CI of 0.983–1.000, indicating stable discrimination; the optimal cutoff ranged from 8.2 to 10.4 µm across resamples (median 9.7, IQR 8.9–9.7), indicating that the specific cutoff value was sample-dependent. At the fixed cutoff of 8.9 µm, the apparent (in-sample) sensitivity was 93.3% (95% CI, 77.9–99.2) and specificity was 100% (95% CI, 88.4–100). In the held-out (out-of-bag) evaluation, sensitivity was 90.0% (27/30; 95% CI, 73.5–97.9) and specificity was 93.3% (28/30; 95% CI, 77.9–100.0), indicating that the apparent specificity was optimistic by approximately 7 percentage points.
Figure 7.
Receiver operating characteristic curves for distinguishing pathological myopia from simple high myopia. AL, axial length; AUC, area under the curve; CCT, choriocapillaris thickness; CT, choroidal thickness; CVI, choroidal vascularity index; LV, luminal volume; SV, stromal volume. The dashed line represents random classification (AUC = 0.5).
4. Discussion
CC thickness was evaluated using SS-OCT C-scan imaging across the CN, SHM, and PM groups. Previous OCTA studies have reported inconsistent findings regarding CC alterations in high myopia. Al-Sheikh et al. reported an increased area of CC flow impairment in high myopia [17], whereas Mo et al. reported a reduction in CC density in pathological myopia but not in simple high myopia [18]. These discrepancies may be partially attributable to the use of fixed-thickness CC slab definitions for measurement. Given that the choriocapillaris may be markedly thinned in high myopia, fixed-thickness slabs may inadvertently incorporate signals from deeper medium- and large-sized choroidal vessels, thereby confounding CC flow assessment. Therefore, accurate segmentation of the CC is particularly critical in high myopia and myopic macular degeneration. We individualized the CC boundaries for each eye and demonstrated a significant reduction in CCT in the PM group, which was consistent with previous reports [19]. We also examined the associations between CCT and other parameters and identified the optimal cutoff values of CCT and related parameters for distinguishing PM from SHM.
We have developed a method to quantify CC thickness based on OCT C-scan images. Previous studies have reported that the CC layer is clearly visible in rhesus monkeys [10], but it often shows variable reflectivity and poor visualization in humans. This results in low reproducibility for manual B-scan segmentation (ICC = 0.590). Zhou et al. combined OCT and OCTA A-scan intensity profiles with peak detection to estimate CC thickness [11,19]. However, this technique depends on the raw signal and may fail in regions with undetectable blood flow. En-face OCT imaging is superior to cross-sectional scanning for visualizing the CC [20], but earlier studies inferred CC thickness indirectly by counting the number of image layers, which limited accuracy [12]. In contrast, we annotated the CC boundaries directly across all C-scan layers and reconstructed the CC in 3D to obtain thickness measurements from the B-scans. This C-scan-guided and Niblack algorithm-based segmentation workflow minimized segmentation errors and improved objectivity and precision. The intra- and inter-observer repeatability were within 1–3 µm, which was markedly smaller than the extent of CC thinning observed in pathological myopia. Because this boundary-localization uncertainty is approximately fixed while CCT becomes very small in pathological myopia, its relative contribution is larger in the thinnest eyes, and single-eye values in these eyes should be interpreted with corresponding caution, and in the absence of an independent reference standard, the boundary placement in such eyes cannot be verified beyond the agreement statistics and the signal-feature correspondence shown in Supplementary Figure S1. As each reported CCT is an area-averaged measurement and the uncertainty is non-differential between groups, the between-group comparisons are not inflated by this uncertainty.
In the present study, CCT was significantly reduced in pathological myopia and showed a mild but significant decrease in simple high myopia compared with emmetropic and low myopic eyes. The differences in AL and CCT between the CN and SHM groups were 2.90 mm and 1.99 µm (CCT average decrease of 12.7%), respectively, whereas those between the SHM and PM groups were 1.56 mm and 7.95 µm (CCT average decrease of 57.9%), respectively. This indicated that the magnitude of CCT reduction increased disproportionately relative to AL, particularly during the transition from SHM to PM, suggesting that CC thinning is not fully explained by mechanical stretching alone. Notably, the PM group in this study predominantly consisted of eyes with mild MMD. Even at this early stage, a marked reduction in CCT was already observed. In these cross-sectional data, the decline in CCT observed across groups appeared to accelerate during the transition from simple high myopia to pathological myopia; this group-level pattern should not be interpreted as intra-individual disease progression. These findings suggest that CC thinning may represent a characteristic structural alteration associated with mild MMD. Notably, the absolute spatial SD of CCT did not increase in pathological myopia; the higher CV reflects increased relative rather than absolute spatial variability, as the mean CCT was markedly reduced. The within-eye CCT distribution was more positively skewed in pathological myopia, whereas a minority of control and simple-high-myopia eyes showed negative skewness, a pattern consistent with focal thinning on an otherwise thick choriocapillaris. Taken together, and strictly as a hypothesis-generating observation derived from cross-sectional data, these findings suggest that spatial CCT variability may initially increase during a phase of focal thinning and become reorganized as thinning becomes diffuse; they do not, by themselves, establish any temporal sequence.
To further explore the factors underlying this observation, regression analyses demonstrated that both AL and CT were significantly associated with CCT. Wald testing of the equality of the absolute magnitudes of the two standardized coefficients showed no significant difference (F(1,85) = 0.24, p = 0.62), indicating that axial length and choroidal thickness were independently and comparably associated with CCT. Mediation analysis provided further insight into the relationship among AL, CT, and CCT. Approximately 52% of the total association between AL and CCT was attributable to the indirect pathway through CT. These phenomena indicate that the overall choroidal thinning represents a major structural pathway linking axial elongation to choriocapillaris alterations. The choriocapillaris is a highly anastomotic vascular network supplied by arterioles from Sattler’s layer [21]. Choroidal thinning may involve reductions in both vascular and stromal components, potentially compromising microvascular support and perfusion and contributing to local hypoxia, endothelial dysfunction, and capillary impairment [22,23]. Therefore, the passive stretching of axial elongation may not fully account for CC thinning, and additional processes such as vascular remodeling or dysregulation of choroidal blood flow may be involved [24]. Nevertheless, the cross-sectional design of this study does not allow for causal inference; the indirect effect observed should be interpreted as a statistical mediation rather than a demonstrated causal pathway. Future longitudinal studies and mechanistic investigations are needed to validate these findings.
The lobular architecture of the choriocapillaris enables localized and relatively independent blood flow, facilitating rapid metabolic exchange [25]. Its unique vascular geometry, abundant RPE-facing fenestrations, and high permeability support the high metabolic demands of the photoreceptors and retinal pigment epithelium [26,27]. Reduced choroidal blood flow has been proposed to contribute to scleral hypoxia and the progression of myopia [28,29]. However, visual function is often relatively preserved in simple high myopia despite significant choroidal thinning, indicating that preserved choriocapillaris perfusion may contribute to maintaining outer retinal metabolism. Extremely thin choroidal thickness, such as values below 40 µm, has been reported to be associated with an increased risk of visual decline in highly myopic eyes [30]. Severe choriocapillaris atrophy may disrupt outer retinal metabolic homeostasis and contribute to substantial visual loss, particularly in pathological myopia. The PM group enrolled in the current study had eyes with diffuse chorioretinal atrophy, corresponding to a relatively early stage of myopic maculopathy. Visual impairment in the current cohort remained relatively limited. Further studies including eyes with more advanced stages of myopic maculopathy are needed to clarify the relationship between choriocapillaris alterations and severe visual impairment.
The CCT, AL, and other choroidal parameters were used to differentiate pathological myopia from simple high myopia. CCT demonstrated the best diagnostic performance, with an AUC of 0.996, sensitivity of 93.3%, specificity of 100%, and an optimal cutoff value of 8.9 µm. The held-out (out-of-bag) evaluation yielded a sensitivity of 90.0% and a specificity of 93.3%, indicating that the apparent specificity of 100% was optimistic by approximately 7 percentage points; the cutoff should be regarded as provisional, and external validation in an independent cohort is required before clinical use. CC thinning was observed in eyes with diffuse chorioretinal atrophy on color fundus photography, suggesting an association between choriocapillaris microvascular alterations and the characteristic fundus appearance. These findings indicate that CCT may provide a quantitative imaging correlate of early fundus changes in MMD, bridging microvascular alterations and clinically visible atrophic features. Compared with global structural parameters such as AL or CT [31,32], CCT may more directly reflect microvascular impairment at the level of the choriocapillaris, which may explain its superior diagnostic performance. Diffuse chorioretinal atrophy, representing mild MMD, is the most common form of MMD and reflects the onset of progressive and often irreversible degenerative changes [33]. Therefore, for eyes with high myopia that have not yet developed diffuse chorioretinal atrophy, preventing progression to MMD is critical for preserving visual function. In this context, CCT may serve as a practical and sensitive cross-sectional imaging marker associated with the presence of mild MMD; its prognostic value and its potential role in risk stratification or monitoring would need to be established in longitudinal studies.
This study has several limitations. First, the cross-sectional design precluded the determination of temporal or causal relationships. Longitudinal studies are needed to elucidate the relationship between changes in CCT and the development and progression of MMD. Second, the pathological myopia cohort mainly included only eyes with diffuse chorioretinal atrophy. The findings therefore cannot be extrapolated to more advanced lesions, such as category 3 or category 4 eyes with myopic choroidal neovascularization, in which choriocapillaris alterations may be implicated in angiogenic processes. Future studies should include eyes with more advanced grades of myopic maculopathy. Moreover, extreme thinning and structural alterations of the choriocapillaris in advanced stages may pose additional challenges for accurate segmentation and quantitative assessment. Third, the analyzed sample represents an age- and sex-matched subset of a larger consecutively recruited cohort (196 participants); the remaining participants are currently being processed, and the findings should be confirmed as the full cohort is analyzed. Furthermore, this was a single-center study with a modest sample size, and the estimates reported here, particularly the diagnostic cutoff, should be verified in larger and more diverse cohorts. In addition, posterior staphyloma was not specifically excluded, and its potential association with CC thinning cannot be ruled out. No independent gold standard (such as histologic measurement or flow-based OCTA) was available for the archived image volumes, so the accuracy of the boundary placement in the thinnest eyes could not be verified directly. Finally, CC delineation relied on manual segmentation, which is labor-intensive and may limit scalability. The development of automated approaches, particularly deep learning-based methods, may improve efficiency and reproducibility, thereby facilitating large-scale studies and future clinical translation.
5. Conclusions
This study introduces a quantitative imaging approach that reveals a significant reduction in CCT with increased relative spatially variability in mild myopic macular degeneration. CC thinning was primarily associated with overall choroidal thinning and axial elongation. Furthermore, CCT demonstrated excellent diagnostic performance in distinguishing pathological myopia from simple high myopia, outperforming other choroidal parameters and axial length. These findings suggest that CCT may serve as a novel quantitative imaging marker associated with the presence of mild myopic macular degeneration; its potential value for early detection, risk stratification, and monitoring would need to be established in longitudinal studies.
Supplementary Materials
The following supporting information can be downloaded at: https://www.mdpi.com/article/10.3390/bioengineering13111309/s1, Figure S1: Unprocessed images and choriocapillaris boundary annotations in an eye with pathological myopia (mean CCT, 4.15 µm); Table S1: Group differences in CCT across sequentially adjusted linear models.
Author Contributions
T.W.: writing—original draft, investigation, formal analysis, visualization. G.L.: writing—original draft, methodology, conceptualization, software. N.X., X.W. and R.Y. (Ran Yang): writing—review & editing, data curation, investigation, validation. S.Y., R.Y. (Ruyu Yan) and Y.G.: formal analysis, investigation. N.D. and X.D.: investigation, data curation. N.W. and Y.W. (Yiyi Wang): data curation. M.S. and S.Z.: resources. C.W. and Y.W. (Yuanyuan Wang): funding acquisition. F.L. and Y.S. (corresponding authors): writing—review & editing, funding acquisition, supervision, conceptualization. All authors have read and agreed to the published version of the manuscript.
Funding
This research was funded by grants from the National Natural Science Foundation of China (grant number 82471119 and U22A20312), and Natural Science Foundation of Zhejiang Province (grant number LGF22H120016).
Institutional Review Board Statement
The study was conducted in accordance with the Declaration of Helsinki, and approved by the Ethics Committee of Wenzhou Medical University (protocol code: 2023-153-K-126,Approved on 15 September 2023).
Informed Consent Statement
Informed consent was obtained from all subjects involved in the study.
Data Availability Statement
Data are available on reasonable request. The data sets generated during and/or analyzed during the current study are not publicly available due to the issue of copyright but are available from the corresponding author on reasonable request.
Conflicts of Interest
The authors declare no conflicts of interest.
Abbreviations
The following abbreviations are used in this manuscript:
| ACME | Average causal mediation effect |
| AL | Axial length |
| AUC | Area under the curve |
| BCVA | Best-corrected visual acuity |
| BM | Bruch’s membrane |
| CC | Choriocapillaris |
| CCT | Choriocapillaris thickness |
| CI | Confidence interval |
| CN | Control (group) |
| CT | Choroidal thickness |
| CVI | Choroidal vascularity index |
| D | Diopter(s) |
| ICC | Intraclass correlation coefficient |
| IOP | Intraocular pressure |
| LogMAR | Logarithm of the minimum angle of resolution |
| LV | Luminal volume |
| MMD | Myopic macular degeneration |
| OCT | Optical coherence tomography |
| OCTA | Optical coherence tomography angiography |
| PM | Pathological myopia |
| ROC | Receiver operating characteristic |
| RPE | Retinal pigment epithelium |
| SD | Standard deviation |
| SE | Spherical equivalent |
| SHM | Simple high myopia |
| SS-OCT | Swept-source optical coherence tomography |
| SV | Stromal volume |
References
- Sankaridurg, P.; Tahhan, N.; Kandel, H.; Naduvilath, T.; Zou, H.; Frick, K.D.; Marmamula, S.; Friedman, D.S.; Lamoureux, E.; Keeffe, J.; et al. IMI Impact of Myopia. Investig. Ophthalmol. Vis. Sci. 2021, 62, 2. [Google Scholar] [CrossRef] [Scilit] [PubMed]
- Holden, B.A.; Fricke, T.R.; Wilson, D.A.; Jong, M.; Naidoo, K.S.; Sankaridurg, P.; Wong, T.Y.; Naduvilath, T.J.; Resnikoff, S. Global Prevalence of Myopia and High Myopia and Temporal Trends from 2000 through 2050. Ophthalmology 2016, 123, 1036–1042. [Google Scholar] [CrossRef] [Scilit] [PubMed]
- Jonas, J.B.; Jonas, R.A.; Xu, J.; Wang, Y.X. Prevalence and Cause of Loss of Visual Acuity and Visual Field in Highly Myopic Eyes: The Beijing Eye Study. Ophthalmology 2024, 131, 58–65. [Google Scholar] [CrossRef] [Scilit] [PubMed]
- Haarman, A.E.G.; Enthoven, C.A.; Tideman, J.W.L.; Tedja, M.S.; Verhoeven, V.J.M.; Klaver, C.C.W. The Complications of Myopia: A Review and Meta-Analysis. Investig. Ophthalmol. Vis. Sci. 2020, 61, 49. [Google Scholar] [CrossRef] [Scilit] [PubMed]
- Fricke, T.R.; Jong, M.; Naidoo, K.S.; Sankaridurg, P.; Naduvilath, T.J.; Ho, S.M.; Wong, T.Y.; Resnikoff, S. Global prevalence of visual impairment associated with myopic macular degeneration and temporal trends from 2000 through 2050: Systematic review, meta-analysis and modelling. Br. J. Ophthalmol. 2018, 102, 855–862. [Google Scholar] [CrossRef] [Scilit] [PubMed]
- Fang, Y.; Du, R.; Nagaoka, N.; Yokoi, T.; Shinohara, K.; Xu, X.; Takahashi, H.; Onishi, Y.; Yoshida, T.; Ohno-Matsui, K. OCT-Based Diagnostic Criteria for Different Stages of Myopic Maculopathy. Ophthalmology 2019, 126, 1018–1032. [Google Scholar] [CrossRef] [Scilit] [PubMed]
- Wang, Y.; Chen, S.; Lin, J.; Chen, W.; Huang, H.; Fan, X.; Cao, X.; Shen, M.; Ye, J.; Zhu, S.; et al. Vascular Changes of the Choroid and Their Correlations With Visual Acuity in Pathological Myopia. Investig. Ophthalmol. Vis. Sci. 2022, 63, 20. [Google Scholar] [CrossRef] [Scilit] [PubMed]
- Ding, X.; Wang, Y.; Wan, N.; Wu, X.; Shen, J.; Wang, H.; Lin, K.; Chen, H.; Wang, T.; Xu, N.; et al. Elevated Nasal-Temporal Asymmetry of the Choroidal Vascular Index in Pathologically Myopic Eyes. Investig. Ophthalmol. Vis. Sci. 2025, 66, 66. [Google Scholar] [CrossRef] [Scilit] [PubMed]
- Lejoyeux, R.; Benillouche, J.; Ong, J.; Errera, M.-H.; Rossi, E.A.; Singh, S.R.; Dansingani, K.K.; da Silva, S.; Sinha, D.; Sahel, J.-A.; et al. Choriocapillaris: Fundamentals and advancements. Prog. Retin. Eye Res. 2022, 87, 100997. [Google Scholar] [CrossRef] [Scilit] [PubMed]
- Yiu, G.; Vuong, V.S.; Oltjen, S.; Cunefare, D.; Farsiu, S.; Garzel, L.; Roberts, J.; Thomasy, S.M. Effect of Uveal Melanocytes on Choroidal Morphology in Rhesus Macaques and Humans on Enhanced-Depth Imaging Optical Coherence Tomography. Investig. Ophthalmol. Vis. Sci. 2016, 57, 5764–5771. [Google Scholar] [CrossRef] [Scilit] [PubMed]
- Zhou, H.; Dai, Y.; Gregori, G.; Rosenfeld, P.R.; Duncan, J.L.; Schwartz, D.M.; Wang, R.K. Automated morphometric measurement of the retinal pigment epithelium complex and choriocapillaris using swept source OCT. Biomed. Opt. Express 2020, 11, 1834–1850. [Google Scholar] [CrossRef] [Scilit] [PubMed]
- Adhi, M.; Ferrara, D.; Mullins, R.F.; Baumal, C.R.; Mohler, K.J.; Kraus, M.F.; Liu, J.; Badaro, E.; Alasil, T.; Hornegger, J.; et al. Characterization of Choroidal Layers in Normal Aging Eyes Using Enface Swept-Source Optical Coherence Tomography. PLoS ONE 2015, 10, e0133080. [Google Scholar] [CrossRef] [Scilit] [PubMed]
- Ohno-Matsui, K.; Kawasaki, R.; Jonas, J.B.; Cheung, C.M.G.; Saw, S.-M.; Verhoeven, V.J.; Klaver, C.C.; Moriyama, M.; Shinohara, K.; Kawasaki, Y.; et al. International photographic classification and grading system for myopic maculopathy. Am. J. Ophthalmol. 2015, 159, 877–883.e7. [Google Scholar] [CrossRef] [Scilit] [PubMed]
- Nowroozizadeh, S.; Cirineo, N.; Amini, N.; Knipping, S.; Chang, T.; Chou, T.; Caprioli, J.; Nouri-Mahdavi, K. Influence of correction of ocular magnification on spectral-domain OCT retinal nerve fiber layer measurement variability and performance. Investig. Ophthalmol. Vis. Sci. 2014, 55, 3439–3446. [Google Scholar] [CrossRef] [Scilit] [PubMed]
- Tan, B.; Chua, J.; Barathi, V.A.; Baskaran, M.; Chan, A.; Lin, E.; Ang, M.; Klose, G.; Schmetterer, L. Quantitative analysis of choriocapillaris in non-human primates using swept-source optical coherence tomography angiography (SS-OCTA). Biomed. Opt. Express 2019, 10, 356–371. [Google Scholar] [CrossRef] [Scilit] [PubMed]
- Agrawal, R.; Gupta, P.; Tan, K.A.; Cheung, C.M.; Wong, T.Y.; Cheng, C.Y. Choroidal vascularity index as a measure of vascular status of the choroid: Measurements in healthy eyes from a population-based study. Sci. Rep. 2016, 6, 21090. [Google Scholar] [CrossRef] [Scilit] [PubMed]
- Al-Sheikh, M.; Phasukkijwatana, N.; Dolz-Marco, R.; Rahimi, M.; Iafe, N.A.; Freund, K.B.; Sadda, S.R.; Sarraf, D. Quantitative OCT Angiography of the Retinal Microvasculature and the Choriocapillaris in Myopic Eyes. Investig. Ophthalmol. Vis. Sci. 2017, 58, 2063–2069. [Google Scholar] [CrossRef] [Scilit] [PubMed]
- Mo, J.; Duan, A.; Chan, S.; Wang, X.; Wei, W. Vascular flow density in pathological myopia: An optical coherence tomography angiography study. BMJ Open 2017, 7, e013571. [Google Scholar] [CrossRef] [Scilit] [PubMed]
- Li, J.; Zhou, H.; Feinstein, M.; Wong, J.; Wang, R.K.; Chan, L.; Dai, Y.; Porco, T.; Duncan, J.L.; Schwartz, D.M. Choriocapillaris Changes in Myopic Macular Degeneration. Transl. Vis. Sci. Technol. 2022, 11, 37. [Google Scholar] [CrossRef] [Scilit] [PubMed]
- Ng, D.S.; Chan, L.K.; Ng, C.M.; Lai, T.Y.Y. Visualising the choriocapillaris: Histology, imaging modalities and clinical research—A review. Clin. Exp. Ophthalmol. 2022, 50, 91–103. [Google Scholar] [CrossRef] [Scilit] [PubMed]
- Zhang, W.; Kaser-Eichberger, A.; Fan, W.; Platzl, C.; Schrodl, F.; Heindl, L.M. The structure and function of the human choroid. Ann. Anat. 2024, 254, 152239. [Google Scholar] [CrossRef] [Scilit] [PubMed]
- Yeo, N.J.Y.; Chan, E.J.J.; Cheung, C. Choroidal Neovascularization: Mechanisms of Endothelial Dysfunction. Front. Pharmacol. 2019, 10, 1363. [Google Scholar] [CrossRef] [Scilit] [PubMed]
- Lipecz, A.; Miller, L.; Kovacs, I.; Czakó, C.; Csipo, T.; Baffi, J.; Csiszar, A.; Tarantini, S.; Ungvari, Z.; Yabluchanskiy, A.; et al. Microvascular contributions to age-related macular degeneration (AMD): From mechanisms of choriocapillaris aging to novel interventions. Geroscience 2019, 41, 813–845. [Google Scholar] [CrossRef] [Scilit] [PubMed]
- Liu, Y.; Wang, L.; Xu, Y.; Pang, Z.; Mu, G. The influence of the choroid on the onset and development of myopia: From perspectives of choroidal thickness and blood flow. Acta Ophthalmol. 2021, 99, 730–738. [Google Scholar] [CrossRef] [Scilit] [PubMed]
- Zouache, M.A.; Eames, I.; Klettner, C.A.; Luthert, P.J. Form, shape and function: Segmented blood flow in the choriocapillaris. Sci. Rep. 2016, 6, 35754. [Google Scholar] [CrossRef] [Scilit] [PubMed]
- Nickla, D.L.; Wallman, J. The multifunctional choroid. Prog. Retin. Eye Res. 2010, 29, 144–168. [Google Scholar] [CrossRef] [Scilit] [PubMed]
- Faust, C.D.; Klettner, C.A.; Toso, M.; Hageman, G.S.; Eames, I.; Luthert, P.J.; Zouache, M.A. The vascular geometry of the choriocapillaris is associated with spatially heterogeneous molecular exchange with the outer retina. J. Physiol. 2024, 602, 1273–1295. [Google Scholar] [CrossRef] [Scilit] [PubMed]
- Wu, H.; Chen, W.; Zhao, F.; Zhou, Q.; Reinach, P.S.; Deng, L.; Ma, L.; Luo, S.; Srinivasalu, N.; Pan, M.; et al. Scleral hypoxia is a target for myopia control. Proc. Natl. Acad. Sci. USA 2018, 115, E7091–E7100. [Google Scholar] [CrossRef] [Scilit] [PubMed]
- Xiao, Q.; Zhang, X.; Chen, Z.L.; Zou, Y.Y.; Tang, C.F. An Evidence-Based Narrative Review of Scleral Hypoxia Theory in Myopia: From Mechanisms to Treatments. Int. J. Mol. Sci. 2025, 26, 332. [Google Scholar] [CrossRef] [Scilit] [PubMed]
- Carlà, M.M.; Boselli, F.; Giannuzzi, F.; Crincoli, E.; Catania, F.; Perugini, A.M.; Gambini, G.; Rizzo, S.; Mateo, C. Longitudinal changes in choroidal thickness in high myopia: Correlation with maculopathy progression and visual outcomes. Acta Ophthalmol. 2025, 104, 448–458. [Google Scholar] [CrossRef] [Scilit] [PubMed]
- Ueda, E.; Yasuda, M.; Fujiwara, K.; Hashimoto, S.; Honda, T.; Nakamura, S.; Hata, J.; Ninomiya, T.; Sonoda, K.-H. Association Between Choroidal Thickness and Myopic Maculopathy in a Japanese Population: The Hisayama Study. Ophthalmol. Sci. 2023, 3, 100350. [Google Scholar] [CrossRef] [Scilit] [PubMed]
- Midorikawa, M.; Mori, K.; Torii, H.; Tomita, Y.; Zhang, Y.; Tsubota, K.; Kurihara, T.; Negishi, K. Choroidal thinning in myopia is associated with axial elongation and severity of myopic maculopathy. Sci. Rep. 2024, 14, 17600. [Google Scholar] [CrossRef] [Scilit] [PubMed]
- Xiao, O.; Guo, X.; Wang, D.; Jong, M.; Lee, P.Y.; Chen, L.; Morgan, I.G.; Sankaridurg, P.; He, M. Distribution and Severity of Myopic Maculopathy Among Highly Myopic Eyes. Investig. Ophthalmol. Vis. Sci. 2018, 59, 4880–4885. [Google Scholar] [CrossRef] [Scilit] [PubMed]

Disclaimer/Publisher’s Note: The statements, opinions and data contained in all publications are solely those of the individual author(s) and contributor(s) and not of MDPI and/or the editor(s). MDPI and/or the editor(s) disclaim responsibility for any injury to people or property resulting from any ideas, methods, instructions or products referred to in the content. |
© 2026 by the authors. Licensee MDPI, Basel, Switzerland. This article is an open access article distributed under the terms and conditions of the Creative Commons Attribution (CC BY) license.