


Abstract
Multimodal models can predict progression from mild cognitive impairment (MCI) to Alzheimer’s disease (AD), but most evaluations assume that every modality is immediately available. We developed a retrospective framework using only the Alzheimer’s Disease Neuroimaging Initiative (ADNI) that separates statistical risk estimation, sequential evidence acquisition, language-model explanation, and deterministic verification. Participants with baseline MCI were assigned state-specific landmarks using information visible within a +/−90-day window. The primary simulation cohort included 425 participants with clinical/cognitive, magnetic resonance imaging (MRI)-derived, and cerebrospinal fluid (CSF) evidence; 153 converted to AD within 36 months after the landmark. Calibrated elastic-net models were evaluated with 10 repeated nested five-fold cross-validation. In the common-landmark cohort, adding MRI-derived and CSF features improved the Brier score from 0.158 (95% confidence interval (CI) 0.141–0.175) to 0.138 (0.122–0.155) and the area under the receiver-operating characteristic curve (AUROC) from 0.837 (0.802–0.871) to 0.878 (0.847–0.908). A sequential policy used cross-fitted estimates of individual Brier-score gain to decide whether to request MRI or CSF. The fixed-threshold exploratory analysis requested 40.6% fewer simulated tests than an all-tests policy while meeting the prespecified Brier and AUROC noninferiority margins. Under fully nested threshold selection, the policy requested 46.9% fewer tests and met the AUROC criterion, while narrowly missing the Brier criterion (difference 0.00546, 95% CI 0.00090–0.01003; margin +0.01). In a 40-card-per-model engineering audit, local Qwen3-4B and Qwen3-8B models copied probabilities and cited supplied evidence correctly in 40/40 cards but matched the deterministic action in 16/40 and 15/40 cards, respectively. Execution authority therefore remained with the deterministic policy. Here, agentic refers to the orchestration of modular evidence states, policy checks, verification, and explanation; it does not imply autonomous language-model control. As a retrospective simulation, the framework does not establish prospective clinical utility, real-world cost savings, or external computational reproducibility.
1. Introduction
Mild cognitive impairment is a clinically heterogeneous state in which some individuals progress to Alzheimer’s disease (AD), whereas others remain stable or follow a different course. Predicting progression is important for counseling, enrichment of observational and interventional studies, and rational use of increasingly diverse clinical, imaging, and fluid-biomarker evidence. The Alzheimer’s Disease Neuroimaging Initiative (ADNI) was established to study the longitudinal contribution of clinical, cognitive, imaging, and biomarker measures across the AD continuum [1].
Recent multimodal studies have shown that cognitive measures, MRI-derived markers, fluid biomarkers, and genetic information can provide complementary information for predicting progression from MCI to dementia [2,3,4,5,6,7,8,9,10,11,12,13,14,15,16,17]. A 2022 systematic review found that MRI and cognitive measures were among the most common predictors, but external validation remained uncommon [6]. Most such studies nevertheless frame the task as static fusion: all modalities are assumed to be simultaneously available and the main endpoint is discrimination. That abstraction omits a practical decision problem. In a real evaluation pathway, MRI and CSF may be unavailable, delayed, burdensome, or simply unnecessary when currently visible evidence already supports a sufficiently certain risk estimate. It is therefore useful to evaluate not only how well a model predicts, but also which additional evidence it requests and under what safeguards.
This problem overlaps with active feature acquisition and cost-sensitive sequential classification, which balance predictive value against the burden of obtaining additional information [18,19,20]. Recent work has also shown that a new acquisition policy can induce a missingness-distribution shift that requires explicit evaluation [19], while clinical-imaging guidance emphasizes that technical performance alone does not establish clinical value [21]. Recent neurodegenerative-disease systems have extended this idea toward agentic orchestration and evidence-grounded reasoning [22,23,24]. Our framework focuses on one testable stage of that path: calibrated prognosis, cross-fitted evidence acquisition, deterministic action verification, and schema-bound language generation are implemented and audited as separate components (Supplementary Table S8). It does not address causal off-policy evaluation or autonomous clinical deployment.
Recent work on language models and agentic systems has broadened interest in systems that decompose clinical reasoning into specialized roles. Yet an autonomous language model can introduce a separate source of error: it can copy a correct probability but propose an unsupported or unsafe next action. For high-stakes clinical applications, the narrative or orchestration layer should not silently replace a calibrated statistical prediction model, and it should be evaluated separately from clinical prediction performance. Calibration is especially important when a predicted probability controls a downstream action [25,26].
Here, we have developed an ADNI-only retrospective framework with four separated layers: (i) calibrated statistical models for 36-month MCI-to-AD progression risk; (ii) a cross-fitted Value Gate that estimates the expected individual improvement in Brier loss from acquiring MRI or CSF evidence; (iii) a deterministic sequential policy that selects STOP, REQUEST_MRI, REQUEST_CSF, or ABSTAIN; and (iv) a local language-model layer restricted to schema-bound candidate explanations that are verified against supplied Evidence Cards. We use agentic in the systems sense: the framework orchestrates evidence states, acquisition checks, deterministic policy execution, verification, and explanation, while the language model has no authority over risk or action. We asked whether MRI-derived and CSF features improve prediction in a common cohort, whether a constrained sequential policy can reduce simulated test requests while retaining prespecified performance, and whether a local language model is sufficiently action-aligned to execute the policy. The architecture makes each answer separately traceable and testable within the implemented pipeline and prevents fluent language output from overriding calibrated risk or deterministic action selection; it does not by itself provide external computational reproducibility. Current guidance distinguishes transparent model reporting from staged clinical evaluation and deployment assessment [27,28,29,30,31,32]. This distinction also guides our interpretation of the retrospective results.
2. Materials and Methods
2.1. Study Design and Data Source
This was a retrospective methodological study using participant-level data obtained from ADNI. ADNI is a longitudinal multicenter observational program designed to develop and validate clinical, neuropsychological, imaging, genetic, and biochemical measures for the detection and tracking of AD [1]. The current analysis used only downloaded ADNI data and ran locally. No external cohort, external model API, raw MRI training, PET quantitative data, or APOE data was used in the primary analysis.
ADNI was approved by institutional review boards at participating sites, and written informed consent was obtained from participants by ADNI. This secondary analysis used de-identified data in accordance with the ADNI data-use requirements. Local institutional review-board approval was not applicable to this secondary analysis of de-identified ADNI data.
2.2. Landmark Cohort Construction and Outcome
Participants were eligible for initial screening if their baseline diagnostic visit classified them as MCI. For each visible-evidence state, the candidate record for clinical/cognitive, MRI-derived, CSF, or plasma data had to occur within +/−90 days of the baseline MCI diagnosis. The state-specific landmark was the latest date among the baseline diagnosis and the modalities visible in that state. A participant with an AD diagnosis on or before that landmark was excluded from that state. The primary outcome was the first post-landmark AD diagnosis within 36 months. Participants who did not convert had to have at least 36 months of follow-up. The outcome clock began at each participant’s state-specific landmark, not at a common calendar date. No post-landmark measurements, later diagnoses, or follow-up information were used in feature selection, preprocessing, risk-model tuning, calibration, Value Gate fitting, threshold selection, or policy fitting; all such operations were nested within the corresponding training folds.
The primary sequential-policy cohort required clinical/cognitive, MRI-derived, and CSF evidence in the landmark window. This complete-evidence restriction was necessary for an offline simulation: when a policy requested a modality, the participant’s observed ADNI value could be revealed without imputing an unobserved test. The main policy cohort therefore should not be interpreted as a representative clinical screening cohort.
The selection analysis compared participants in the complete policy cohort with core-eligible participants excluded from that cohort. Descriptive measures included demographics, four baseline cognitive composites, ADNI phase, 36-month conversion, and observed diagnostic follow-up. Follow-up was defined for both groups as months from the core-state landmark to the last valid diagnosis visit and was not used as a predictor.
2.3. Evidence States and Features
The core state included age, sex, years of education, and four ADNI phenotype-harmonized cognitive composite scores: memory, executive function, language, and visuospatial function. The MRI state added left and right MUSE regional-volume-to-intracranial-volume ratios for the hippocampus, entorhinal cortex, parahippocampal gyrus, precuneus, middle temporal gyrus, amygdala, and lateral ventricle. The CSF state added standardized ADNI phenotype-harmonized Abeta42, total tau, and p-tau181 variables. Because these harmonized continuous variables can be negative, no ratio was calculated from them. The full state contained core, MRI-derived, and CSF features. The downloaded ADNI CSF values were used as standardized ADNI phenotype variables; no additional scanner- or assay-site harmonization was applied. MRI regional measurements were normalized to intracranial volume, but no external batch-correction model was fitted. These choices are reported explicitly because ADNI1, ADNIGO, ADNI2, and ADNI3 differ in acquisition and assay composition. ADNI3 participants contributed to the core-eligible selection analysis, but none met the complete MRI + CSF policy-cohort definition within the landmark window; the primary multimodal risk and policy analyses therefore comprised ADNI1, ADNIGO, and ADNI2 participants.
Within a training fold, numeric features were median-imputed with missingness indicators and standardized. Sex was most-frequent-imputed and one-hot-encoded. All preprocessing was fitted only in the corresponding training data. Maximum missingness among prespecified continuous primary-cohort predictors was 0.5%.
2.4. Statistical Risk Models
The prespecified primary risk engine was an elastic-net logistic-regression model. Within each outer-training fold, the inverse regularization parameter (0.05, 0.2, or 1.0) and l1 ratio (0, 0.5, or 1.0) were selected by three-fold stratified cross-validation using negative Brier score. The selected model was then Platt-calibrated with a separate three-fold stratified calibration procedure. A constrained XGBoost classifier was retained as a nonlinear robustness comparator, not as a data-driven replacement for the primary model.
We used 10 repetitions of stratified five-fold outer cross-validation, preserving participant-level separation. Each participant’s out-of-fold probabilities were averaged across repetitions. Performance was quantified by Brier score, AUROC, average precision, eight-bin calibration curves, and 2000 patient-level bootstrap 95% confidence intervals. Bootstrap resampling was performed at the participant level after aggregation of repeated out-of-fold predictions; it therefore quantifies uncertainty in the observed prediction summaries but does not treat repeated folds as independent participants. Threshold and policy-fitting uncertainty was assessed separately through the fully nested operating-point analysis. The primary multimodal comparison used the same MRI + CSF-complete 36-month cohort for every evidence state, thereby avoiding apparent gains caused by changing cohort composition.
2.5. Sequential Evidence-Acquisition Policy
The sequential simulation began with the core state. The policy could stop, request MRI, request CSF, request both sequentially, or abstain. It used only the calibrated risk estimates generated without access to the outer-test participant’s outcome. For each outer fold, risk predictions for outer-training participants were generated by inner cross-fitting. Individual targets for the Value Gate were the corresponding Brier-loss improvements from core to MRI, core to CSF, MRI to full evidence, and CSF to full evidence. Four ridge-regression gates were trained using visible evidence and demographics to predict these gains. The gate was thus an estimate of predictive value, not a causal estimate of test benefit.
The constrained S7 policy selected the next modality with the larger predicted gain when the current risk estimate was insufficiently certain. A conflict rule was triggered when the relevant modality-specific risk estimates differed by more than 0.25. The deterministic verifier checked that a requested action was permitted and that the requested test belonged to the available modality set. The primary gate used a point estimate of predicted gain; it did not propagate epistemic uncertainty in the gate estimate into the action. Comparators included core only (S0), all tests (S1), fixed MRI-then-CSF (S2), fixed CSF-then-MRI (S3), random first test (S4), population-preferred first test (S5), and a personalized policy without the additional conflict constraint (S6).
The fixed-threshold analysis used a certainty threshold of 0.10 selected during one development repeat and is explicitly labeled exploratory. The stricter sensitivity analysis selected the certainty threshold in each outer-training set from the prespecified grid {0.05, 0.075, 0.10, 0.125, 0.15, 0.175, 0.20, 0.25, 0.30}. It chose the most parsimonious threshold satisfying an inner cross-fitted Brier tolerance of +0.005 versus all tests; when no candidate met that rule, it used the lowest-Brier fallback. The prespecified outer-test noninferiority boundaries for S7 versus S1 were +0.01 for the Brier score and −0.03 for the AUROC. These values were analysis operating criteria, not clinical equivalence margins, because no utility study was available to derive a clinically anchored boundary.
Sensitivity analyses reused the frozen out-of-fold risk and Value Gate predictions without refitting on outer-test outcomes. We varied the conflict threshold from 0.10 to 0.40, the inner Brier tolerance from 0 to +0.01, and the reported Brier noninferiority boundary from +0.005 to +0.015. To examine imperfect modality availability, we blocked acquisition under four deterministic masks (both available, MRI only, CSF only, or neither) and under 200 random assignments, preserving the observed marginal availability-pattern frequencies among core-eligible participants. The latter is an availability stress test rather than an estimator under informative missingness. We also calculated decision-curve net benefit for S7, all tests, treat-all, and treat-none strategies over risk thresholds from 0.05 to 0.50.
Exploratory subgroup performance was calculated from participant-level averaged repeated out-of-fold S7 predictions by age, sex, education, and baseline memory-composite tertile. Two thousand patient-level bootstrap replicates were calculated within each subgroup. These analyses were descriptive and were not used to select the model or policy.
2.6. Local Language-Model Coordinator Audit
The language-model layer consumed only a de-identified, schema-limited Evidence Card containing supplied evidence identifiers, modality availability, a statistical risk probability, and a permitted action list. It could propose an action and explanation but could not calculate, change, or execute the risk probability or action. An independent verifier checked exact probability copying, action-list compliance, evidence grounding, deterministic-policy agreement, and response-schema validity. Failure of any language-layer check resulted in ABSTAIN for that layer; the deterministic policy retained execution authority.
We ran a systematic engineering audit on 40 synthetic, de-identified Evidence Cards per model. Five prospectively defined scenario strata contained eight cards each: standard evidence, missing evidence, conflicting evidence, ambiguous evidence, and forced policy abstention. The standard and missing-evidence strata were balanced across REQUEST_MRI, REQUEST_CSF, STOP, and ABSTAIN; the conflicting-evidence stratum required ABSTAIN; the ambiguous stratum included MRI, CSF, and abstention decisions; and the forced-abstention stratum permitted only ABSTAIN. Qwen3-4B and Qwen3-8B GGUF Q4_K_M models were run locally through llama.cpp b10767 on a CPU with four threads, seed 20260903, temperature 0, top-k 1, top-p 1, reasoning disabled, and a maximum of 128 new tokens. The cards were designed to probe the language-policy interface and do not estimate clinical accuracy or population-level language-model reliability.
2.7. Reporting Boundaries
The unit “requested tests” is an offline count of MRI and CSF acquisitions revealed from ADNI-complete records. It does not represent monetary cost, patient burden, a clinical order, or realized health-service use. Prospective utility, routine-care diagnostic accuracy, clinical effectiveness, equity, and external generalizability require separate evaluation. These reporting boundaries follow prediction-model reporting principles [27,28].
3. Results
3.1. Landmark Cohort and Primary Policy Cohort
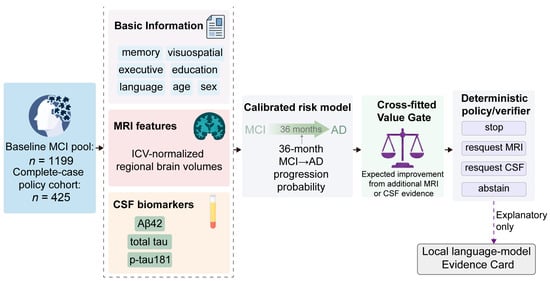
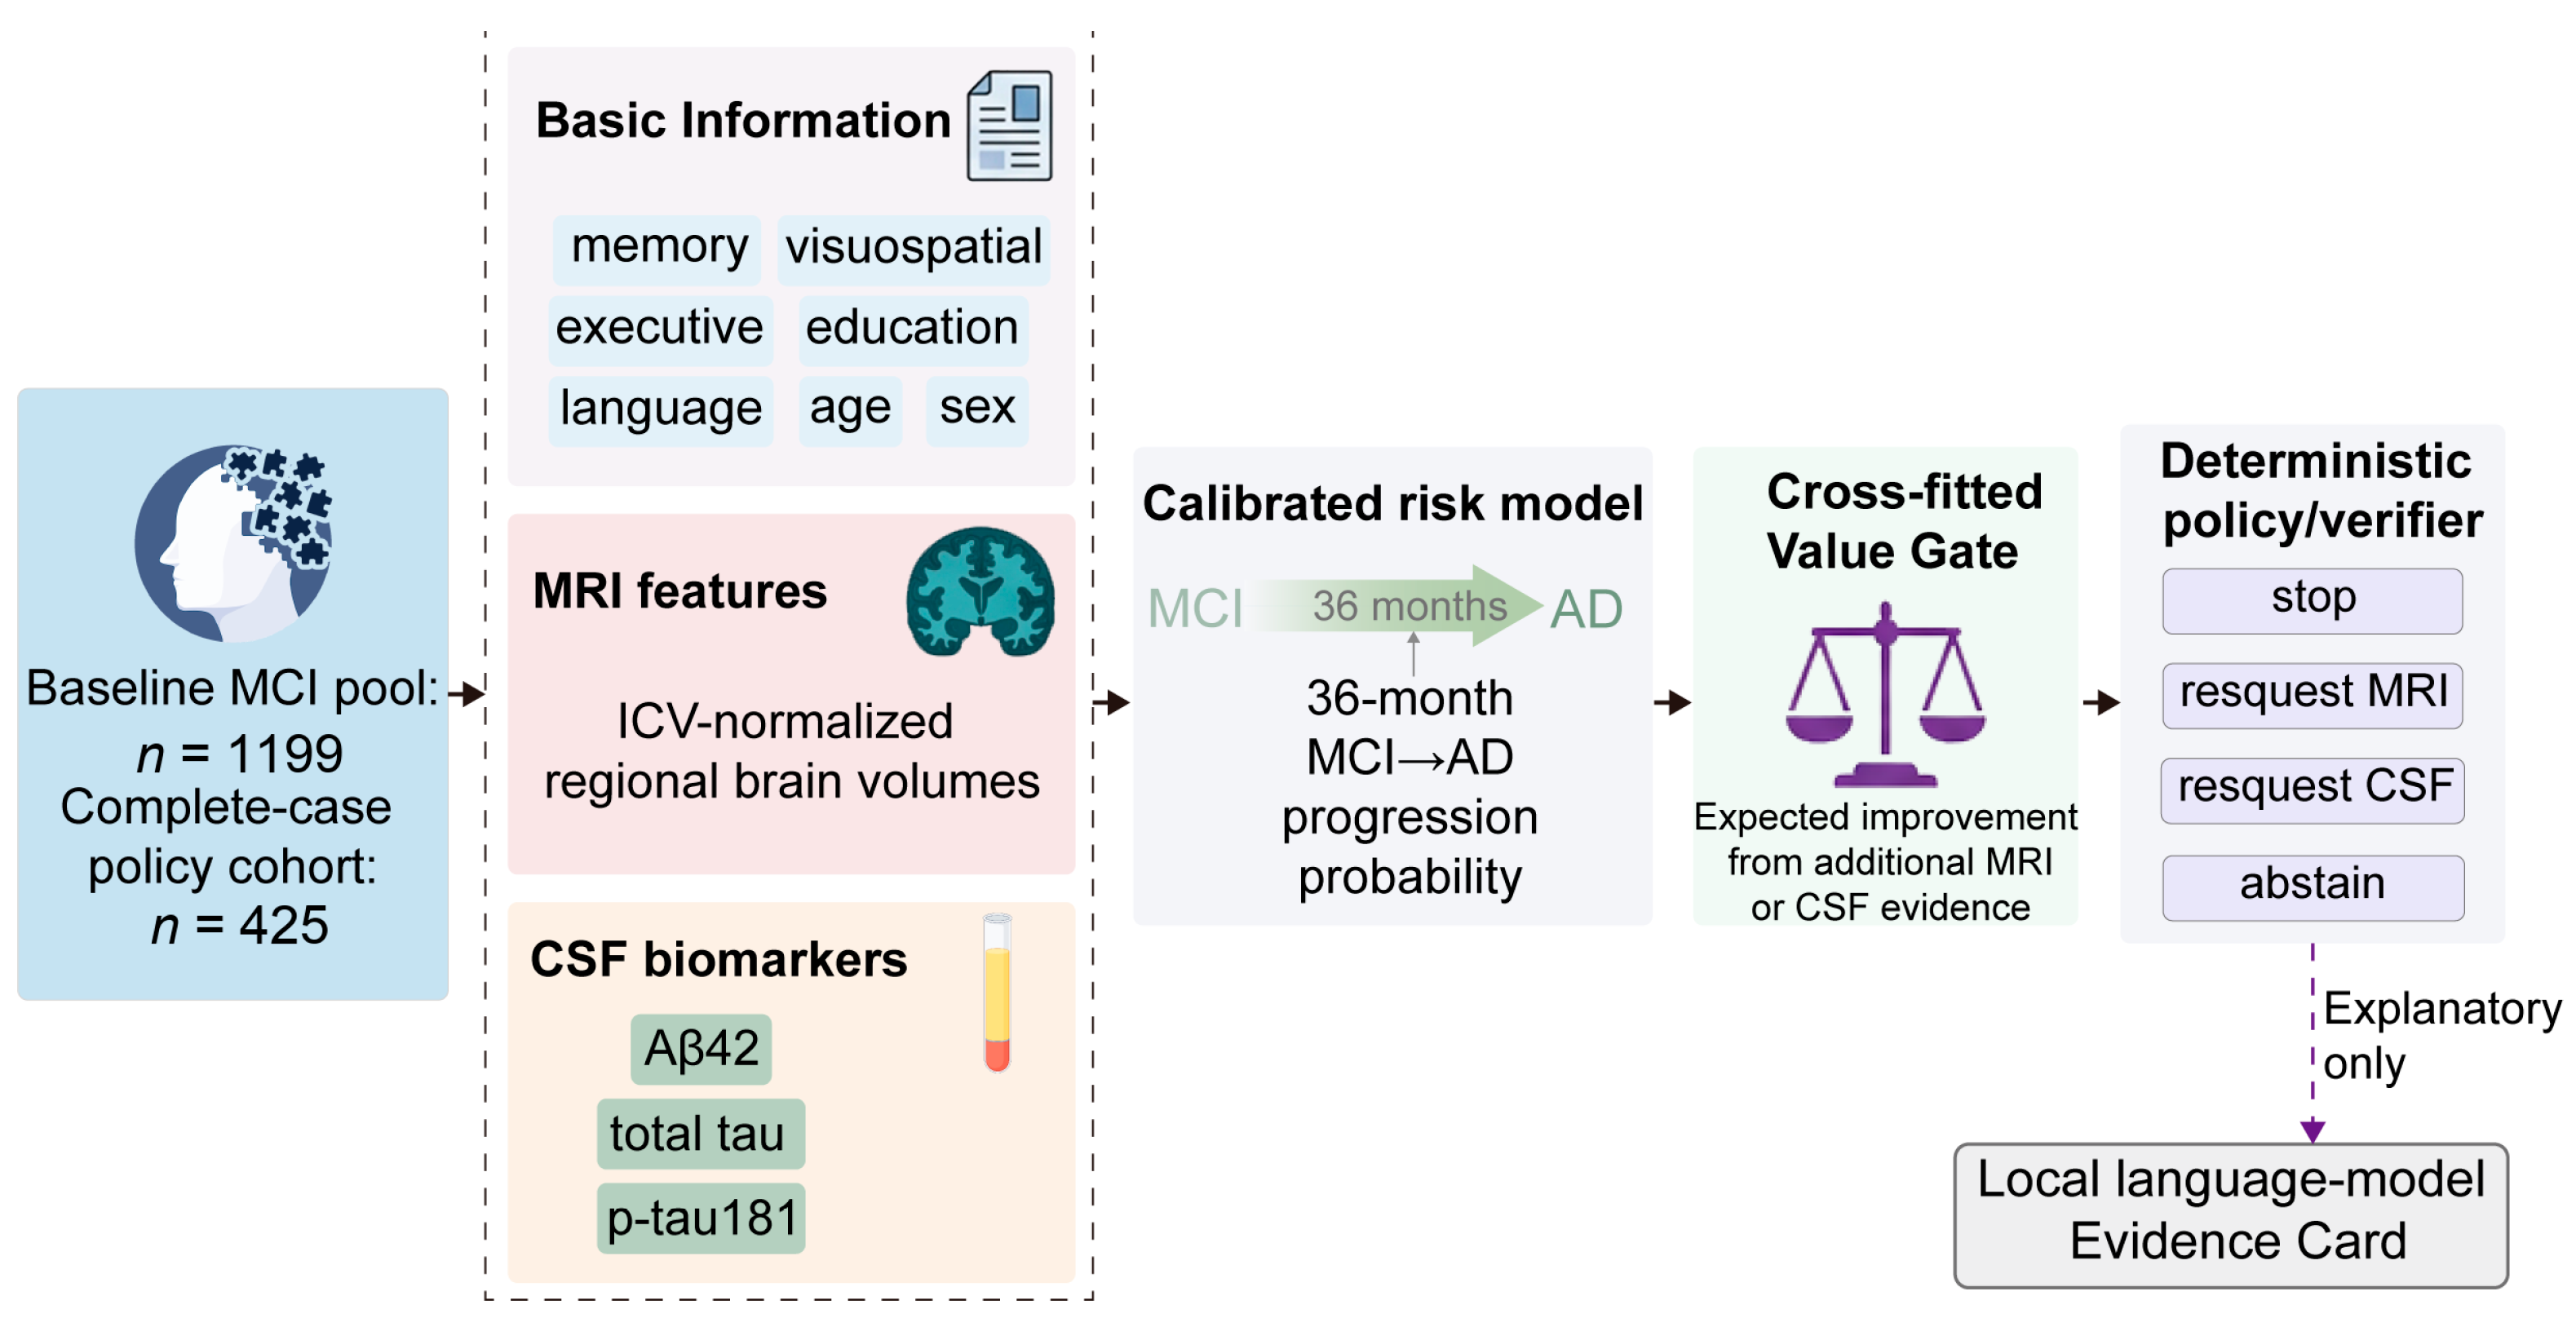
Among 1199 participants with MCI at the baseline diagnosis visit, 425 had the prespecified MRI and CSF features available within the landmark window and were eligible for the 36-month endpoint. Of these, 153 participants converted to AD after the state-specific landmark (36.0%). The median landmark offset was 6 days from baseline and the 95th percentile was 47 days. No participant with an AD diagnosis on or before the landmark was retained. The core-only, MRI, CSF, and MRI + CSF states contained 765/254, 697/240, 452/158, and 425/153 eligible participants/conversions, respectively. All modality offsets were within the prespecified +/−90-day window (Table 1; Supplementary Figure S1). Figure 1 summarizes the framework used for this cohort.
Table 1.
Primary MRI + CSF policy cohort at the state-specific landmark.
Figure 1.
Verifiable sequential multimodal reasoning framework. ADNI participants with baseline MCI were assigned a state-specific landmark based on information visible within the modality window. The primary policy cohort comprised participants with core clinical/cognitive, MRI-derived, and CSF biomarker evidence available at the MRI + CSF state. A calibrated elastic-net risk engine generated progression probabilities, and a cross-fitted Value Gate estimated the expected individual value of acquiring MRI or CSF evidence. A deterministic policy and independent verifier selected or validated one of four actions: STOP, REQUEST_MRI, REQUEST_CSF, or ABSTAIN. The local Qwen Evidence Card layer generated only schema-bound candidate explanations; it could neither calculate or alter risk nor execute an acquisition action. All outcomes represent offline ADNI simulations rather than prospective clinical care.
Within the 765 participants eligible for the core-state 36-month endpoint, the 425-participant MRI + CSF policy cohort was younger on average than the 340 participants who were core-eligible but not in the complete policy cohort (72.3 versus 73.7 years), had similar mean education (16.1 versus 16.0 years), and had a similar proportion of male participants (59.3% versus 59.7%). Baseline memory, executive, language, and visuospatial composites were also similar descriptively. Median observed diagnostic follow-up from the common core landmark was 59.7 months (interquartile range, 37.1–89.7) in the complete cohort and 52.1 months (36.4–75.8) in the excluded group. Using the core-state landmark for both groups, the observed conversion proportions were 35.1% and 30.9%, respectively. ADNI phase composition differed: ADNI2 represented 48.5% of the complete policy cohort but 10.9% of the excluded group, whereas all 119 ADNI3 participants were in the excluded group. These descriptive differences indicate that complete-case selection is informative and may limit transportability (Supplementary Table S3).
Among core-eligible participants, observed modality-availability patterns were MRI + CSF (n = 442), MRI without CSF (n = 260), CSF without MRI (n = 24), and neither modality (n = 39). The corresponding conversion proportions were 33.7%, 35.0%, 16.7%, and 25.6%. These patterns motivate missing-modality sensitivity analyses and caution against interpreting the complete-case cohort as a routine-care population.
3.2. Incremental Multimodal Prediction Performance
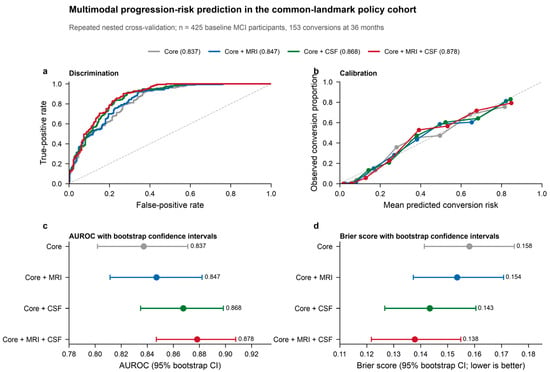
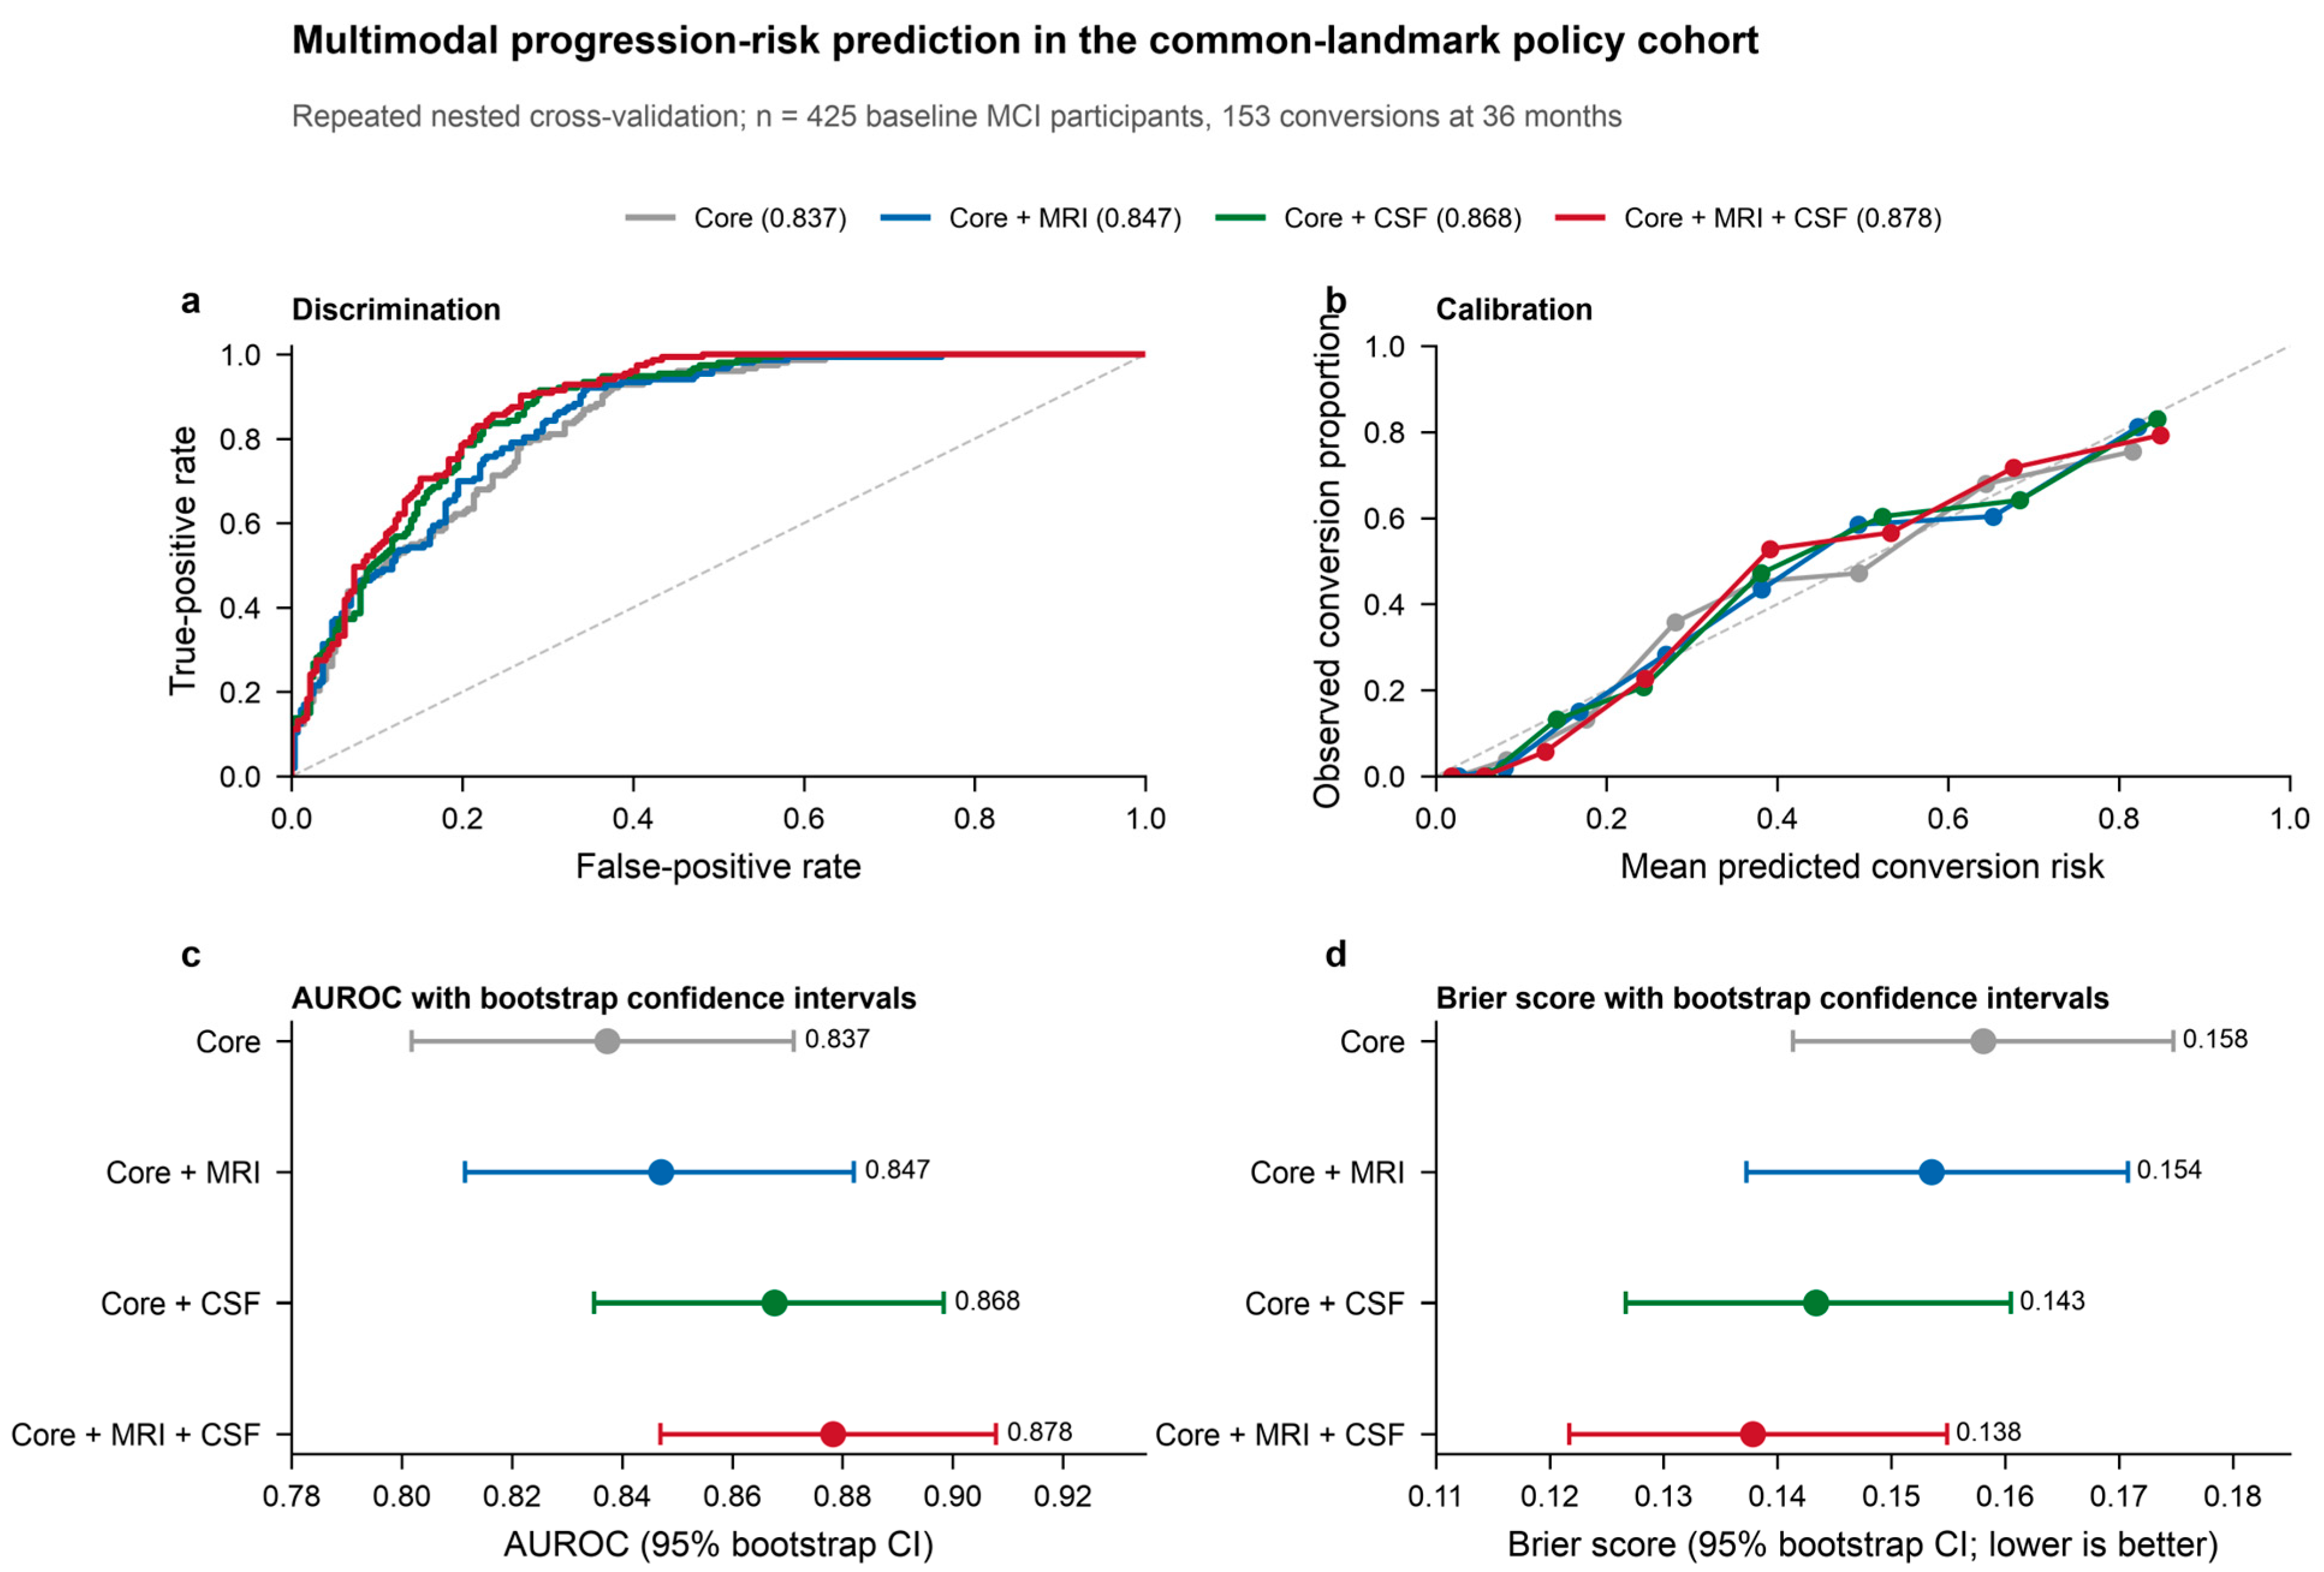
In repeated nested cross-validation on the common MRI + CSF policy cohort, the calibrated elastic-net model using core clinical and cognitive evidence achieved a Brier score of 0.158 (95% CI 0.141–0.175) and an AUROC of 0.837 (0.802–0.871). Adding MRI-derived features improved the Brier score to 0.154 (0.137–0.171) and the AUROC to 0.847 (0.811–0.882). The CSF state achieved a Brier score of 0.143 (0.127–0.160) and an AUROC of 0.868 (0.835–0.898), while MRI + CSF achieved the best overall performance (Brier 0.138, 95% CI 0.122–0.155; AUROC 0.878, 0.847–0.908; Figure 2 and Table 2). These risk states use the same outer splits and state-specific model seeds as the sequential-policy analysis; the full state is therefore identical to S1 in Table 3. The nonlinear XGBoost comparator had a worse Brier score and AUROC than elastic net in every visible-evidence state (Supplementary Table S1).
Figure 2.
Incremental multimodal risk-prediction performance in the common-landmark policy cohort. (a) Receiver-operating characteristic curves based on averaged repeated out-of-fold probabilities for calibrated elastic-net risk models. (b) Eight-bin calibration curves using the same averaged out-of-fold predictions. (c) AUROC with 2000 patient-level bootstrap confidence intervals. (d) Brier score with 2000 patient-level bootstrap confidence intervals. All panels use the same n = 425 MRI + CSF-complete policy cohort and n = 153 36-month conversions; thus, observed differences reflect visible evidence states rather than a changing study population. The gray dashed diagonal lines in panels (a) and (b) indicate chance-level discrimination and perfect calibration, respectively.
Table 2.
Incremental multimodal risk prediction in the common-landmark primary cohort.
Table 3.
Nested sequential-policy sensitivity analysis.
3.3. Sequential Policy Evaluation
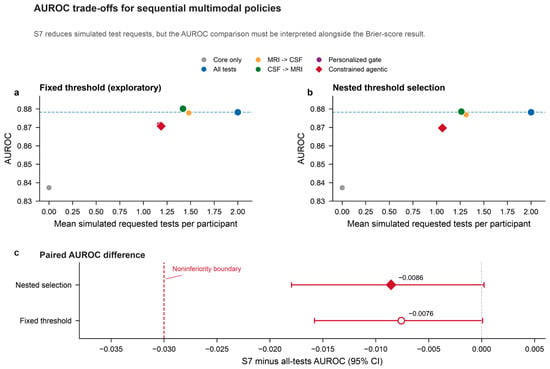
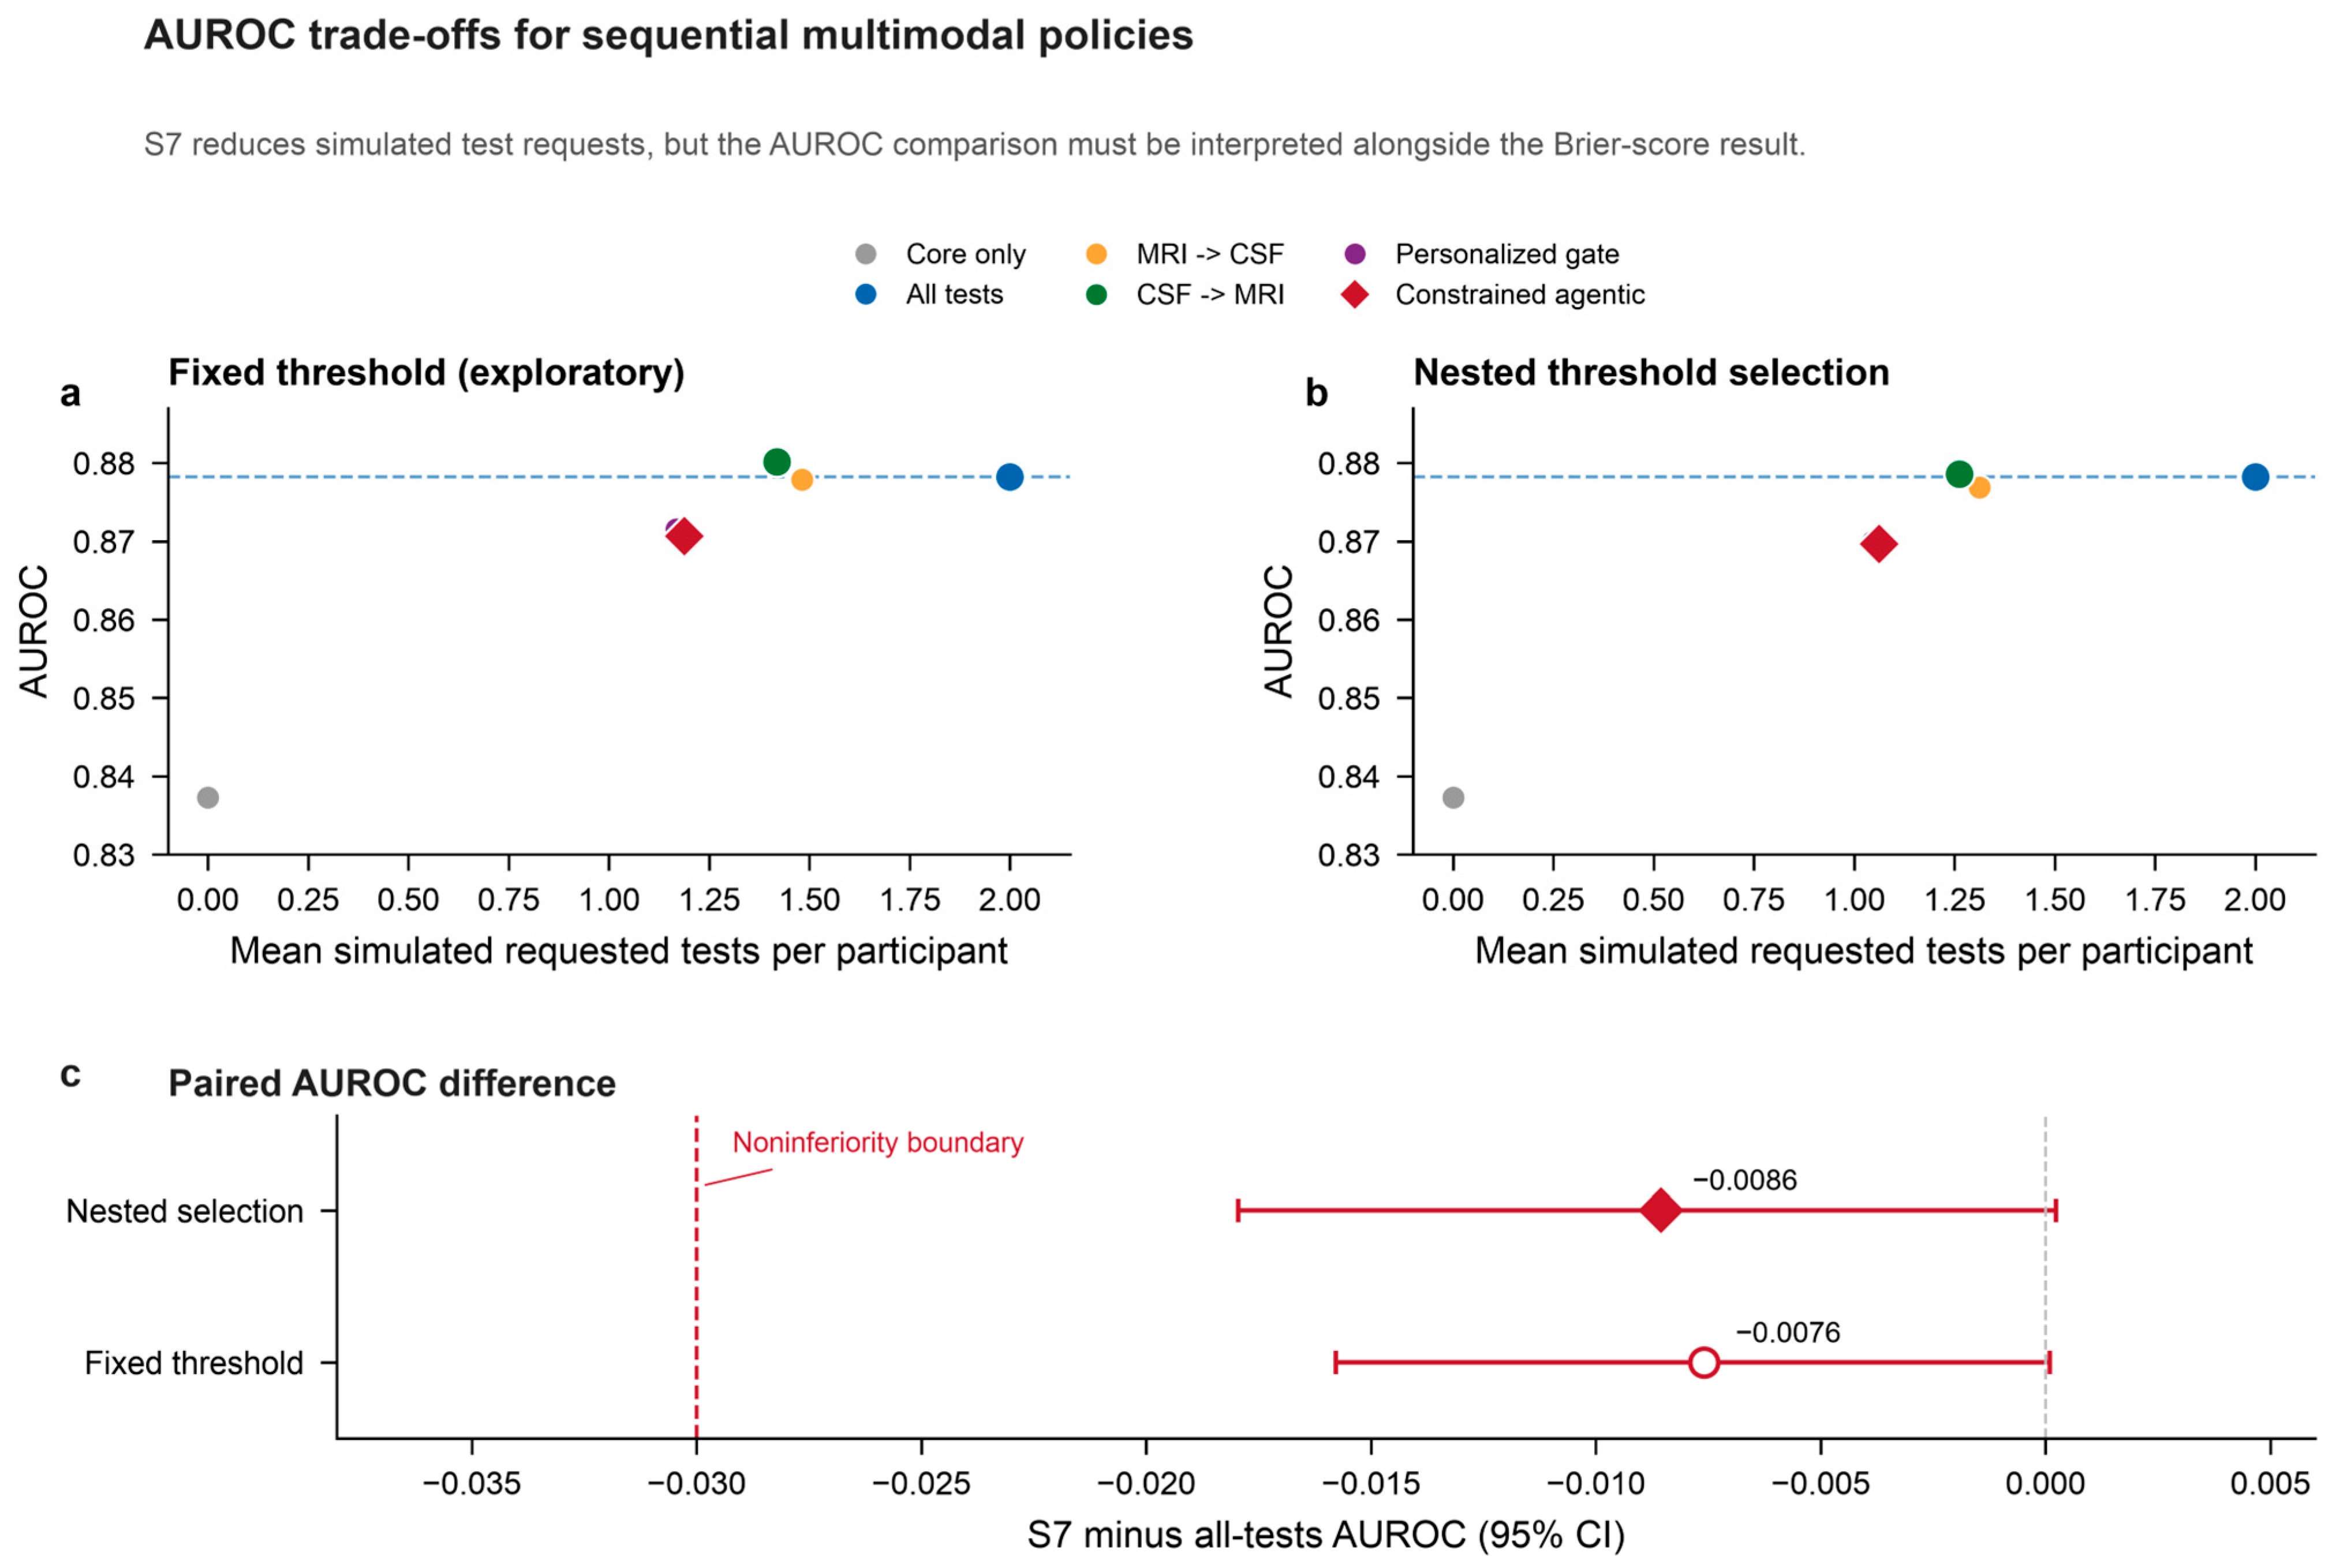
In the fixed-threshold exploratory analysis, S7 requested a mean of 1.187 simulated tests per participant, compared with 2.000 for S1 (40.6% reduction). Its Brier score was 0.142 (95% CI 0.126–0.159) and its AUROC was 0.871 (0.838–0.901). Relative to S1, the paired Brier difference was +0.0046 (95% CI +0.0005 to +0.0087) and the AUROC difference was −0.0076 (−0.0158 to +0.0001), both within the prespecified margins. The action verifier passed on all policy records and the conflict rule was triggered in 5.6% of patient-folds. This result is exploratory because its threshold was selected during development.
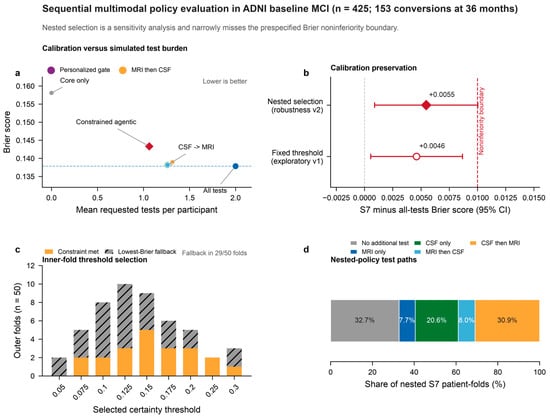
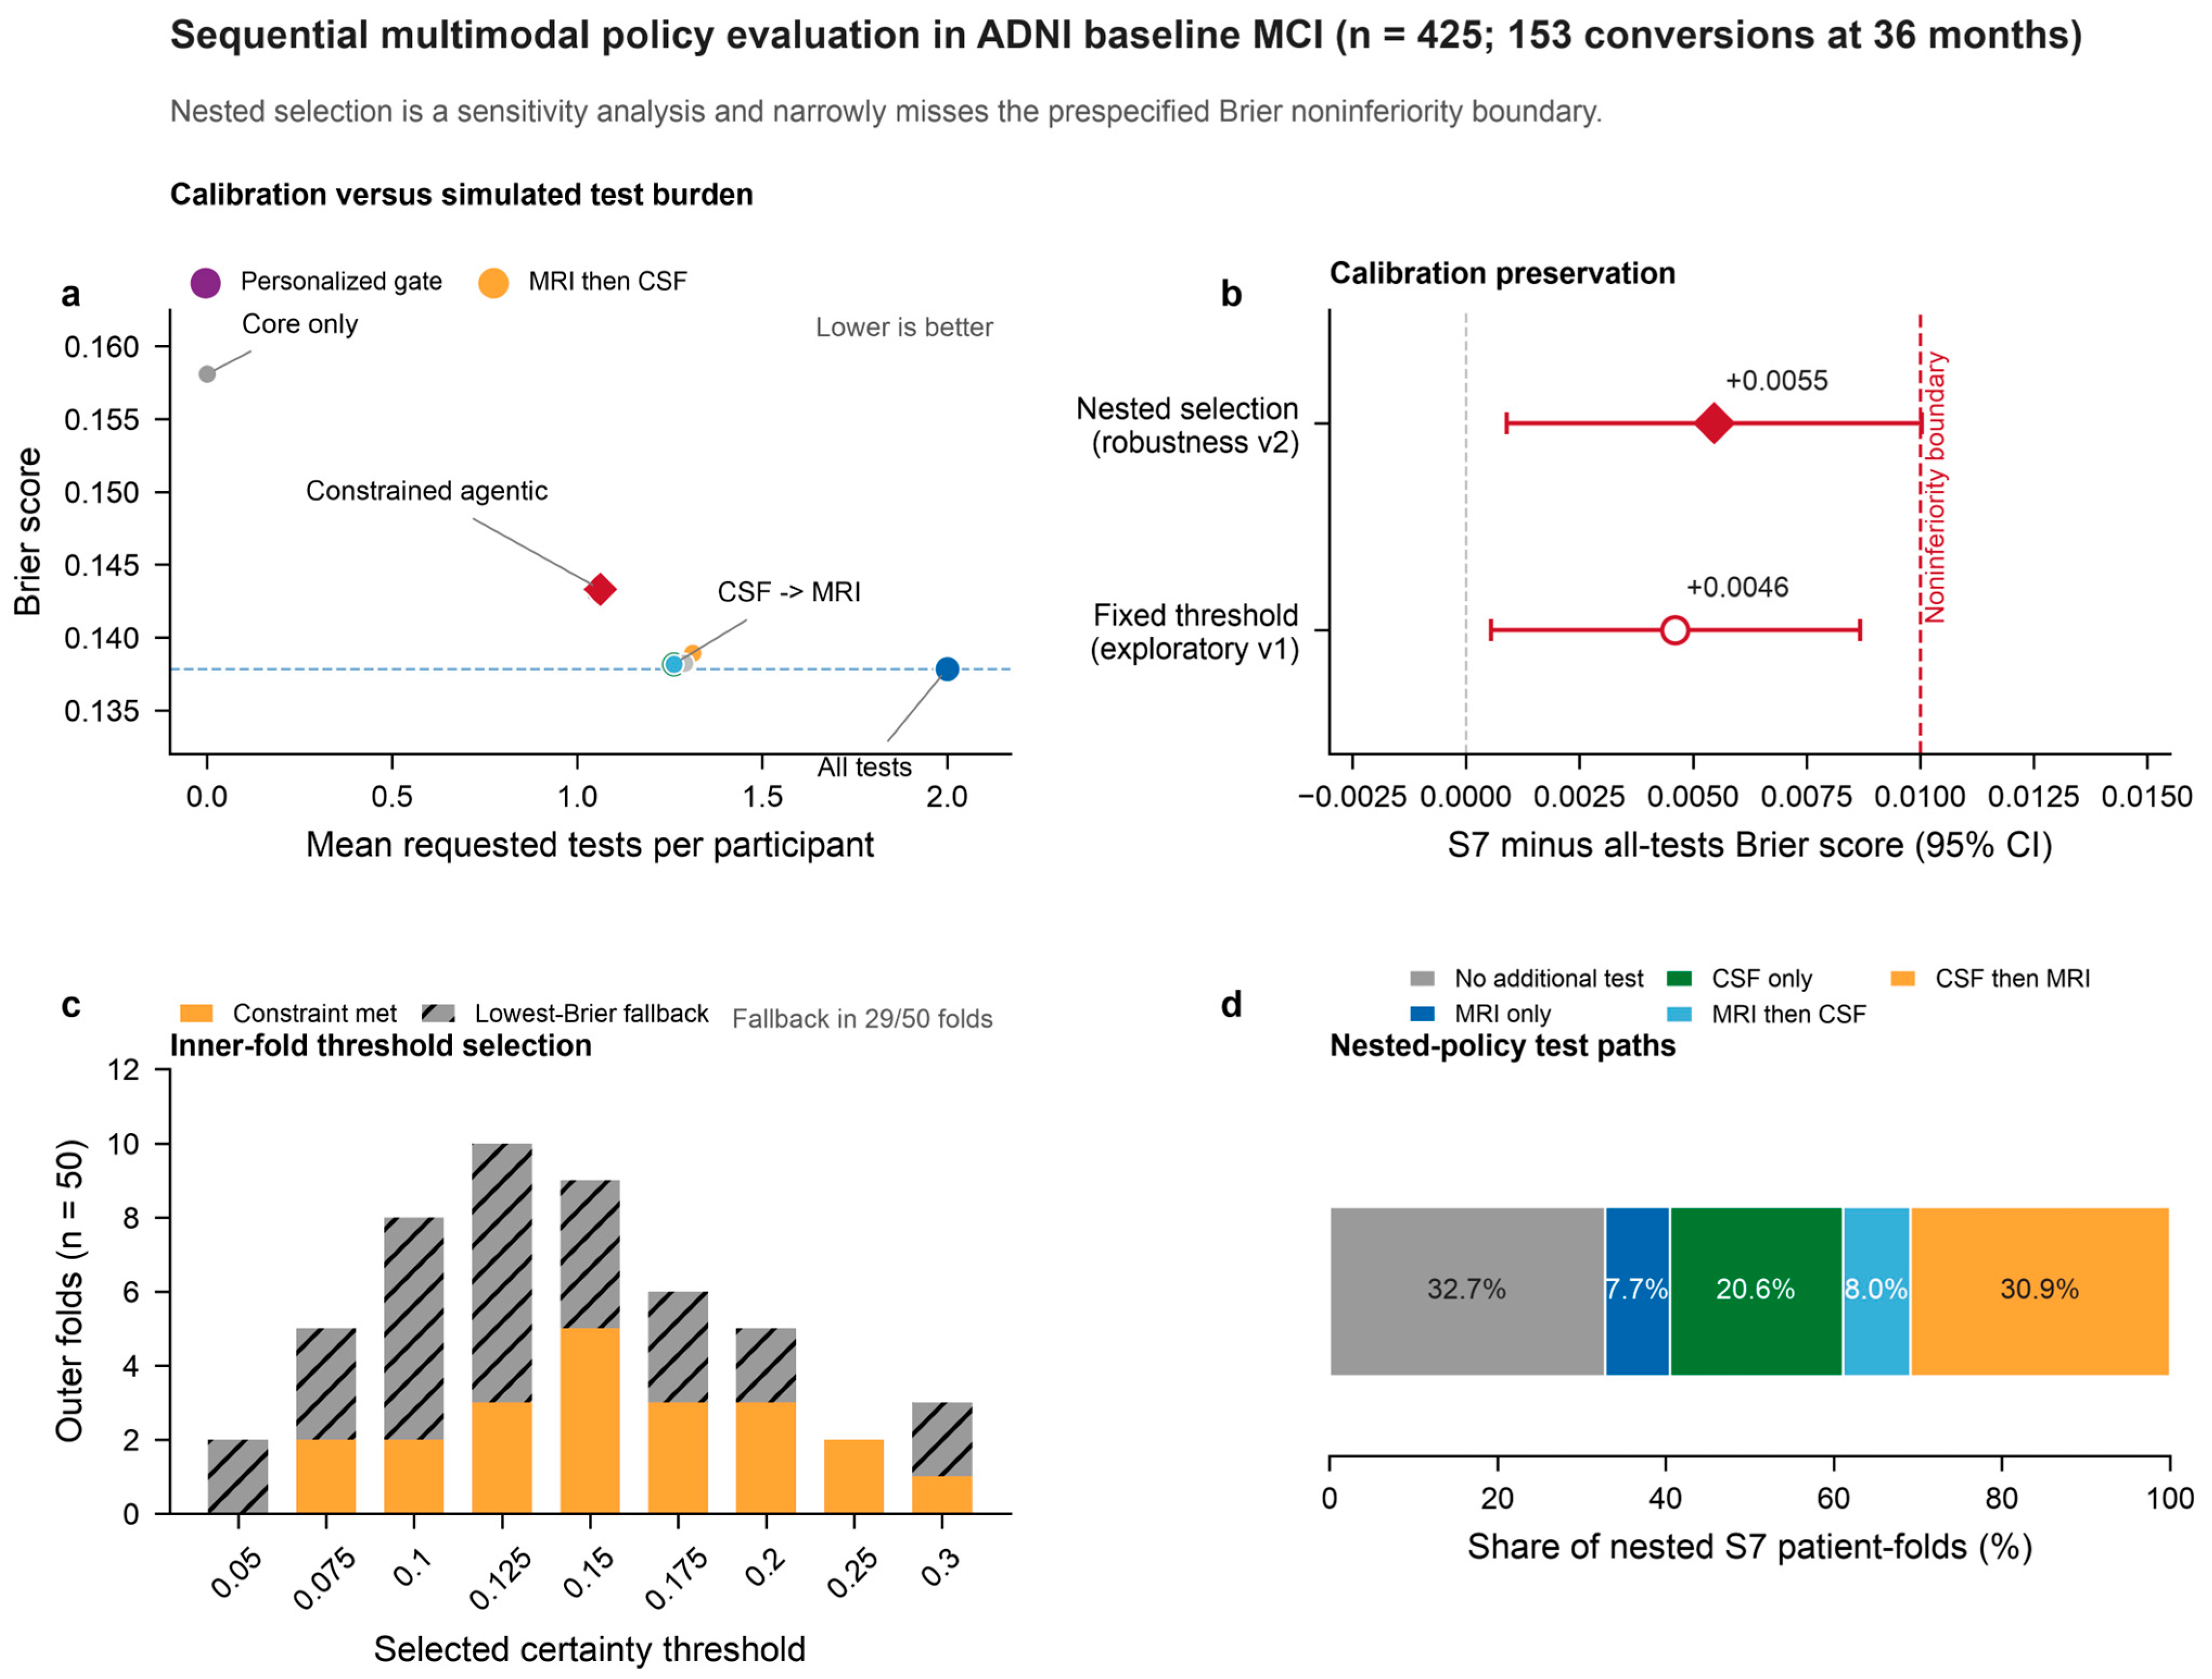
The fully nested sensitivity analysis selected the threshold within every outer-training set. Across 50 outer folds, the mean selected threshold was 0.147 (unrounded mean 0.1465; range 0.050–0.300), and 29 folds used the lowest-Brier fallback because no candidate met the internal +0.005 tolerance. Under this procedure, S7 requested 1.062 tests per participant, a 46.9% reduction versus S1, with a Brier score of 0.143 (0.127–0.161) and an AUROC of 0.870 (0.836–0.900). The S7-minus-S1 Brier difference was +0.00546 (95% CI +0.00090 to +0.01003). The upper confidence bound exceeded the prespecified +0.01 margin, so Brier noninferiority was not met. The AUROC difference was −0.00855 (−0.01796 to +0.00023), satisfying the AUROC criterion (Figure 3 and Figure 4; Table 3; Supplementary Figure S2).
Figure 3.
Efficiency–performance trade-offs and nested threshold-selection sensitivity. (a) Mean simulated requested tests versus Brier score for the nested-threshold analysis. A lower Brier score is better. The dashed line denotes the all-tests Brier score. (b) Paired differences in Brier score between the constrained S7 policy and all tests. The vertical red dashed line is the prespecified +0.01 noninferiority boundary. The fixed-threshold result is exploratory because its threshold was selected during development; the nested analysis narrowly exceeded the Brier boundary. (c) Thresholds selected in 50 outer folds. Hatched segments denote folds in which no candidate threshold met the internal Brier tolerance and the lowest-Brier fallback was used. (d) Distribution of nested S7 simulated test sequences across patient-folds. n = 425 baseline-MCI participants and 153 36-month conversions in the primary policy cohort.
Figure 4.
AUROC trade-offs for sequential multimodal policies. (a) Mean simulated requested tests versus the AUROC in the fixed-threshold exploratory analysis. (b) Corresponding relationship under fully nested threshold selection. (c) Paired AUROC differences between S7 and all tests, with 95% confidence intervals. The red dashed line denotes the prespecified −0.03 noninferiority boundary. Both analyses meet the AUROC boundary, but the AUROC does not replace the primary calibration-sensitive Brier-score assessment reported in Figure 3. The blue horizontal dashed lines in panels (a) and (b) denote the corresponding all-tests AUROC; the gray vertical dashed line in panel (c) denotes zero AUROC difference.
The calibrated elastic-net model had lower Brier scores and higher AUROCs than the XGBoost robustness comparator in every visible-evidence state. The sequential comparisons showed a trade-off between acquisition burden and calibration. In the fixed-threshold analysis, the CSF-then-MRI policy requested 1.418 tests with Brier score 0.137, while S7 requested 1.187 tests with Brier score 0.142. Under nested selection, the corresponding values were 1.261 tests and 0.138 for S3 versus 1.062 tests and 0.143 for S7. Both MRI-first and CSF-first paths occurred under S7. Thus, the personalized policy reduced simulated requests relative to the strongest fixed-order strategy, but it did not improve predictive performance over that comparator.
The component ablation separated the governance role of the conflict constraint from predictive performance. Relative to S6, S7 changed the Brier score by +0.00017 (95% CI −0.00059 to +0.00114), the AUROC by −0.00029 (−0.00221 to +0.00114), and the mean simulated tests by +0.015. The constraint therefore functions as an explicit governance rule in this implementation; no measurable predictive gain was observed (Supplementary Table S9).
The held-out Value Gate audit found weak patient-level ranking of incremental value. Repeated out-of-fold risk probabilities were first averaged for each participant and evidence state, after which the paired difference in squared error was calculated. This matches the aggregation order used for Table 2: the mean observed gains of 0.0046 for core-to-MRI, 0.0147 for core-to-CSF, 0.0157 for MRI-to-full, and 0.0055 for CSF-to-full equal the corresponding differences between the precise, unrounded Table 2 Brier scores. The AUROC for identifying a positive realized Brier gain was 0.520, 0.398, 0.461, and 0.467, respectively. Mean predicted and observed gains were similar in magnitude, but absolute errors were substantial and regression calibration slopes were unstable (Supplementary Table S7). We therefore treat the Value Gate as an exploratory acquisition heuristic in this dataset rather than a validated estimator of patient-specific test utility.
Operating-policy sensitivity analyses showed a continuous efficiency–calibration trade-off rather than a privileged threshold. Across conflict thresholds of 0.10–0.40, the mean simulated tests ranged from 1.130 to 1.048, the Brier score from 0.1421 to 0.1433, and the AUROC from 0.8697 to 0.8726. As the inner Brier tolerance increased from 0 to +0.01, the mean tests decreased from 1.116 to 0.833 while the Brier score increased from 0.1431 to 0.1458 and the AUROC decreased from 0.8699 to 0.8647. The observed upper confidence bound for the S7-minus-S1 Brier difference (0.01003) met boundaries of +0.0125 or +0.015 but not +0.005, +0.0075, or +0.01, illustrating why the margin must be clinically anchored before deployment (Supplementary Figure S3; Supplementary Table S10).
When test acquisition was masked, S7 achieved AUROC/Brier values of 0.870/0.143 with both modalities available, 0.851/0.152 with MRI only, 0.862/0.147 with CSF only, and 0.837/0.158 with neither. Under 200 random assignments matching the observed marginal availability-pattern frequencies, the mean AUROC was 0.862, the Brier score was 0.147, and 0.787 tests were requested. The stress test quantifies performance when acquisition actions are unavailable, but it does not correct selection bias or reproduce patient-specific refusal, contraindication, or informative missingness (Supplementary Figure S3; Supplementary Table S10).
3.4. Local Coordinator Audit
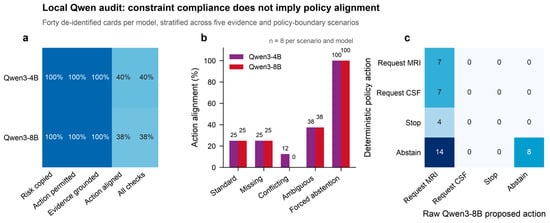
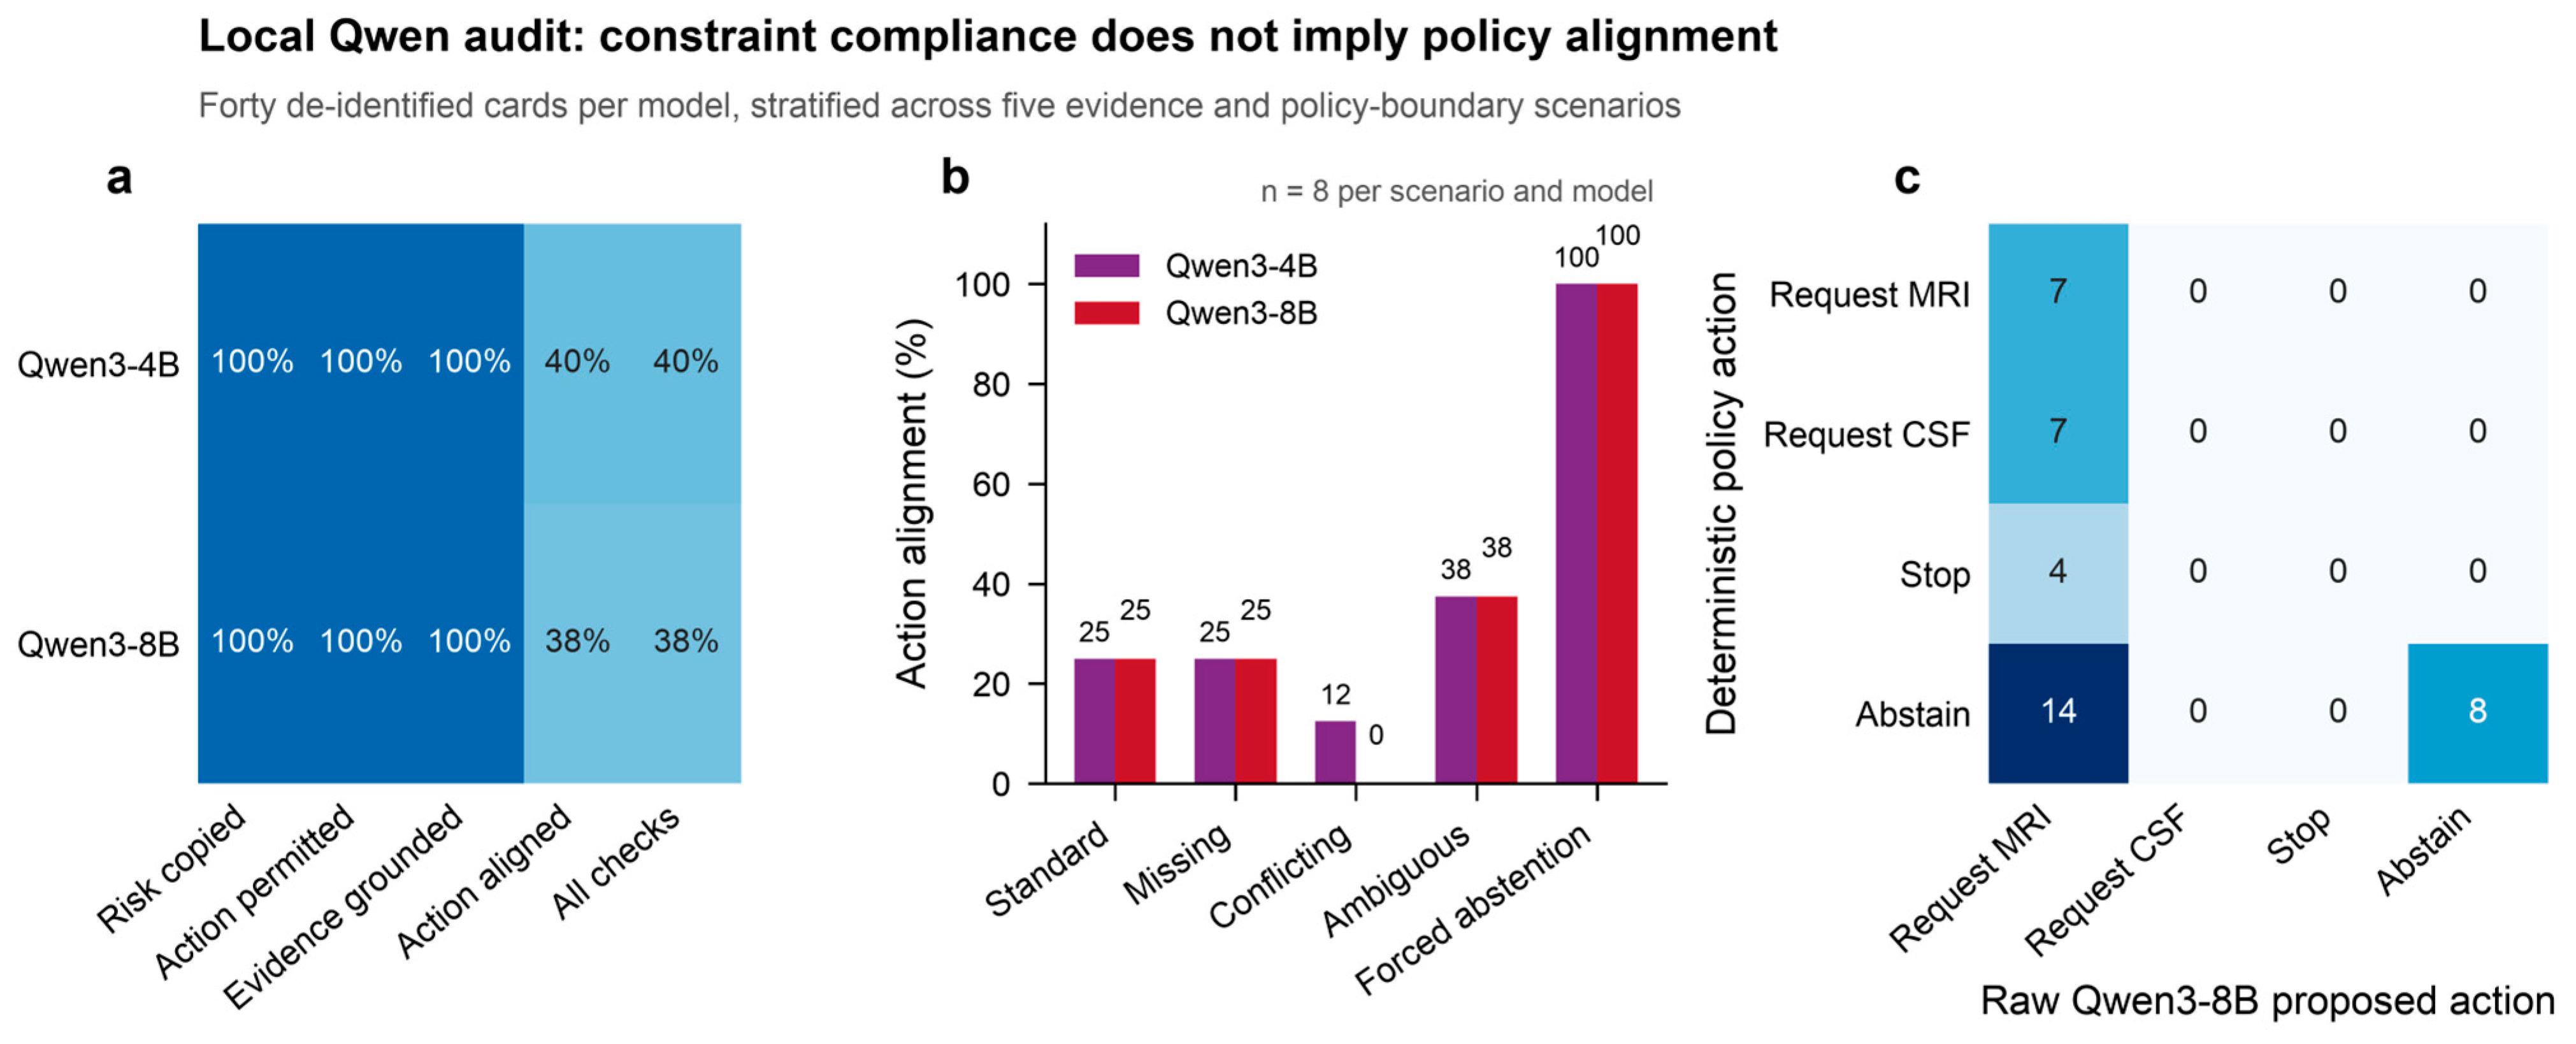
Both local Qwen models copied the risk probability exactly, selected an action from the permitted list, and cited supplied evidence identifiers on all 40 Evidence Cards. Qwen3-4B matched the deterministic action on 16/40 cards (40.0%), and Qwen3-8B matched it on 15/40 (37.5%; Figure 5; Supplementary Table S2). For Qwen3-8B, alignment was 2/8 in standard cards, 2/8 with missing evidence, 0/8 with conflicting evidence, 3/8 with ambiguous evidence, and 8/8 when ABSTAIN was the only permitted action. It proposed REQUEST_MRI on all 32 cards outside the forced-abstention stratum. Qwen3-4B also favored REQUEST_MRI but abstained more often. The models were dependable for the tested copying, schema, and grounding checks, but not for policy reasoning. The deterministic policy therefore retained execution authority, and the language layer remained explanatory.
Figure 5.
Local Qwen audit supports verification rather than autonomous execution. Forty synthetic, de-identified Evidence Cards per model were stratified across standard, missing-evidence, conflicting-evidence, ambiguous-evidence, and forced-abstention scenarios. (a) Pass rates for exact risk copying, action-list compliance, evidence grounding, deterministic-policy action alignment, and the conjunction of all checks. (b) Action-alignment rate by scenario for Qwen3-4B and Qwen3-8B. (c) Confusion matrix for the raw Qwen3-8B action proposal versus the deterministic policy action. The language model did not determine the executed action; deterministic policy output remained the execution authority. This engineering audit probes the language–policy interface and is not an estimate of clinical or population-level reliability.
3.5. Exploratory Subgroup and Clinical-Utility Analyses
Exploratory subgroup analyses used the averaged repeated out-of-fold probabilities from S7. Discrimination was lower and Brier scores were higher in participants aged 70–79 or at least 80 years than in those younger than 70 years, and in participants with fewer than 16 years of education than in those with at least 16 years. Two participants, including one event, had missing education and were excluded only from the education-stratified rows. Baseline memory-composite tertiles showed marked differences in event prevalence and model performance: the AUROC was 0.734, 0.755, and 0.953 in the lower, middle, and upper tertiles, respectively. Because these strata differ substantially in baseline risk and event count, especially the nine events in the upper-memory tertile, the apparent AUROC gradient should not be interpreted as comparative fairness or clinical transportability. Confidence intervals were also wide in the oldest subgroup (Supplementary Table S5); all subgroup findings are hypothesis-generating.
Decision-curve analysis, including treat-all and treat-none reference strategies, showed similar net benefit for S7 and the all-tests policy across the examined thresholds, with no consistent advantage for S7 (Supplementary Figure S3; Supplementary Table S6). Because the analysis does not encode the burden, cost, contraindications, or preferences associated with MRI and CSF acquisition, it is a descriptive utility analysis rather than a clinical recommendation.
4. Discussion
This study shows how an agentic clinical-AI workflow can be evaluated without giving a language model authority over prediction or action. In a common landmark cohort, MRI-derived and CSF evidence improved calibrated 36-month progression prediction. The sequential policy also reduced simulated test requests, although the operating point determined the calibration cost. The fixed-threshold analysis met both prespecified margins and remained exploratory; the fully nested analysis met the AUROC margin and narrowly missed the Brier margin. The central result is therefore an internally traceable efficiency–calibration trade-off rather than a claim of preserved real-world performance or external reproducibility.
The multimodal finding agrees with recent studies that found complementary prognostic information in cognitive assessments, structural MRI, fluid biomarkers, and genetic measures [2,3,4,5,6,7,8,9,10,11,12,13,14,15,16,17]. Conventional multimodal prediction estimates risk after static fusion, whereas active feature-acquisition methods learn when additional information is worth obtaining [18,19,20]. Broader agentic clinical architectures use language models to coordinate specialist reasoning or synthesize evidence [22,23,24]. This study connects those areas through a different contribution: calibrated risk, evidence acquisition, action verification, and language generation are separated so that each can be tested on its own terms. That separation exposed two findings that an end-to-end score would conceal: S7 reduced simulated acquisitions without outperforming the best fixed order, and the held-out gate audit showed weak ranking of individual gain.
The Value Gate estimates the improvement in Brier loss expected from revealing an additional ADNI modality. Its held-out AUROC for identifying a positive realized gain ranged from 0.398 to 0.520, so the present gate is best understood as an exploratory acquisition heuristic rather than a validated estimator of individual test utility. It does not estimate causal test benefit, diagnostic yield, cost, accessibility, or patient burden. The gate also acts on point estimates and does not abstain when the incremental-value estimate is uncertain. An uncertainty-aware rule, such as an ensemble or conformal bound with a prespecified abstention threshold, is a logical next step. The term agentic should therefore be read as a description of modular orchestration and explicit authority boundaries, not as evidence that the language model independently reasons about clinical utility. A prospective study would also need to specify clinical workflow, appropriate-use criteria, contraindications, patient preferences, timing, cost, harms, clinician oversight, and patient-relevant outcomes.
The language-model audit validates the framework’s separation of authority. Both models reliably copied the supplied probability, stayed within the permitted action vocabulary, and cited supplied evidence. Those checks did not translate into policy reasoning: action alignment was 40.0% for Qwen3-4B and 37.5% for Qwen3-8B. Qwen3-8B aligned perfectly when ABSTAIN was the only permitted action, but proposed REQUEST_MRI on all 32 cards outside that stratum. This pattern is consistent with prompt-sensitive modality preference and the absence of the Value Gate calculation from the model weights. The language model can therefore produce a readable Evidence Card whose fields can be checked within the implemented verifier, while calibrated risk estimation and action selection remain deterministic. Structured constraint decoding, tool-mediated policy calls, and targeted fine-tuning may improve policy adherence, but they should be tested after external validation of the statistical policy.
The findings should be interpreted within the study design. The endpoint was ADNI clinical conversion rather than biomarker-confirmed neuropathology, and the analysis was retrospective. Complete-case selection reduced the 1199 baseline-MCI participants to 425 policy participants; included and excluded participants differed in age, ADNI phase composition, diagnostic follow-up, and conversion rate. In routine care, lumbar-puncture refusal, MRI contraindications, scheduling delays, and reimbursement may alter both modality availability and the value of a requested test. Our requested-test count instead assumes that an observed ADNI measurement can be revealed without burden, cost, or delay. The masking analysis blocks unavailable actions but cannot recover informative missingness or the counterfactual result of an unmeasured test; that target requires semi-offline or prospective evaluation [19]. Recent missing-data-enabled ADNI analyses further illustrate that incomplete modality patterns contain information about cohort composition and disease heterogeneity rather than behaving as interchangeable random omissions [33]. The landmark design and nested validation reduce temporal leakage within ADNI but do not provide external validation. PET quantitative features and APOE were unavailable in the downloaded analytic tables, and plasma data were too sparse for the primary sequential analysis. Finally, the fixed-threshold analysis was exploratory, and the nested analysis did not meet the Brier criterion. These boundaries rule out claims of clinical cost saving, diagnostic improvement, patient benefit, or autonomous readiness from the present study.
Clinical deployment requires an operating threshold anchored to the relative harms of unnecessary MRI or CSF acquisition, missed progression, delayed action, and patient refusal. Those utilities were not estimated here. Current clinical-AI guidance supports a staged evaluation path before deployment [27,28,29,30,31,32]. The appropriate next setting is therefore offline or clinician-in-the-loop evaluation, with prespecified calibration, net-benefit, and missingness criteria. The 46.9% simulated reduction defines an efficiency hypothesis to test prospectively; it is not a recommendation to withhold testing.
The next evaluation should lock the policy before testing it in an external, temporally distinct cohort with prespecified missingness patterns, prospective test-availability assumptions, and clinical adjudication. A blinded language-layer audit using independently authored cards should examine action alignment, unsupported claims, prompt perturbations, and abstention separately from clinical prediction. This sequence preserves the framework’s main advantage: failures in prediction, acquisition, verification, and explanation remain attributable to the component that produced them.
5. Conclusions
This ADNI-only study shows the value of separating multimodal prediction, evidence acquisition, deterministic verification, and language generation. MRI-derived and CSF evidence improved calibrated MCI-to-AD progression prediction, and the sequential policy reduced simulated test requests. The fully nested analysis met the AUROC margin but narrowly missed the Brier margin; the Value Gate showed weak held-out ranking and did not outperform the best fixed-order policy on prediction. Local language models reliably copied supplied probabilities and evidence identifiers but had low action alignment. Together, these findings support an evidence-before-autonomy architecture in which “agentic” denotes auditable orchestration rather than autonomous clinical decision making, each component is audited independently, and execution remains deterministic.
Supplementary Materials
The following supporting information can be downloaded at: https://www.mdpi.com/article/10.3390/bioengineering13111296/s1, Figure S1: State availability, endpoint eligibility, and landmark timing; Figure S2: Fixed-order comparators and nested operating-point robustness; Figure S3: Clinical-utility and operating-policy sensitivity analyses; Table S1: Nonlinear robustness comparator in the common-landmark cohort; Table S2: Local coordinator constraint audit; Table S3: Descriptive comparison of the complete policy cohort and core-eligible participants excluded from it; Table S4: Observed modality-availability patterns among core-eligible participants; Table S5: Exploratory subgroup performance of the nested S7 policy; Table S6: Exploratory decision-curve analysis for S7 and all-tests policies; Table S7: Held-out Value Gate audit at the participant-transition level; Table S8: Methodological demarcation from adjacent framework classes; Table S9: Component ablation for the conflict constraint; Table S10: Policy-threshold and modality-availability sensitivity analyses.
Author Contributions
Conceptualization, T.J., J.C., and Q.H.; methodology, T.J., J.C., and Q.H.; software, T.J.; validation, T.J., J.L., and H.W.; formal analysis, T.J.; investigation, J.L. and H.W.; resources, J.C. and Q.H.; data curation, T.J.; writing—original draft preparation, T.J.; writing—review and editing, J.L., H.W., J.C., and Q.H.; visualization, T.J.; supervision, J.C. and Q.H.; project administration, J.C. and Q.H. All authors have read and agreed to the published version of the manuscript.
Funding
This research was funded by the National Natural Science Foundation of China, grant number 22338004, and the National Key Research and Development Program of China, grant number 2025YFC3507603.
Institutional Review Board Statement
Not applicable. This study was a secondary analysis of de-identified data obtained from ADNI. The ADNI study was conducted in accordance with the Declaration of Helsinki and approved by the institutional review boards of all participating institutions.
Informed Consent Statement
Informed consent was obtained from all participants by ADNI.
Data Availability Statement
Data used in this study were obtained from the Alzheimer’s Disease Neuroimaging Initiative database and are available to qualified investigators subject to ADNI’s data-access procedures and data-use agreement. The analysis code is not publicly available at this time, so this release does not enable independent computational reproduction of the reported analyses. Participant-level ADNI data will not be redistributed by the authors.
Acknowledgments
Data used in preparation of this article were obtained from the Alzheimer’s Disease Neuroimaging Initiative (ADNI) database (adni.loni.usc.edu). As such, the investigators within ADNI contributed to the design and implementation of ADNI and/or provided data but did not participate in analysis or writing of this report. A complete listing of ADNI investigators can be found at: https://adni.loni.usc.edu/wp-content/uploads/how_to_apply/ADNI_Acknowledgement_List.pdf (accessed on 28 October 2025).
Conflicts of Interest
The authors declare no conflicts of interest.
References
- Weiner, M.W.; Veitch, D.P.; Aisen, P.S.; Beckett, L.A.; Cairns, N.J.; Green, R.C.; Harvey, D.; Jack, C.R.; Jagust, W.; Morris, J.C.; et al. The Alzheimer’s Disease Neuroimaging Initiative 3: Continued innovation for clinical trial improvement. Alzheimers Dement. 2017, 13, 561–571. [Google Scholar] [CrossRef] [Scilit] [PubMed]
- Agostinho, D.; Simoes, M.; Castelo-Branco, M. Alzheimer’s Disease Neuroimaging Initiative. Predicting conversion from mild cognitive impairment to Alzheimer’s disease: A multimodal approach. Brain Commun. 2024, 6, fcae208. [Google Scholar] [CrossRef] [Scilit] [PubMed]
- Wang, C.; Li, Y.; Tsuboshita, Y.; Sakurai, T.; Goto, T.; Yamaguchi, H.; Yamashita, Y.; Sekiguchi, A.; Tachimori, H. A high-generalizability machine learning framework for predicting the progression of Alzheimer’s disease using limited data. npj Digit. Med. 2022, 5, 43. [Google Scholar] [CrossRef] [Scilit] [PubMed]
- Leonardsen, E.H.; Persson, K.; Grodem, E.; Dinsdale, N.; Schellhorn, T.; Roe, J.M.; Vidal-Piñeiro, D.; Sørensen, Ø.; Kaufmann, T.; Westman, E.; et al. Constructing personalized characterizations of structural brain aberrations in patients with dementia using explainable artificial intelligence. npj Digit. Med. 2024, 7, 110. [Google Scholar] [CrossRef] [Scilit] [PubMed]
- Chu, C.; Wang, Y.; Huynh, A.L.H.; Ng, K.W.; Liu, S.; Ji, G.; Doecke, J.; Fripp, J.; Masters, C.L.; Goudey, B.; et al. Development and validation of a model to predict the progression of Alzheimer’s disease. Age Ageing 2025, 54, afaf198. [Google Scholar] [CrossRef] [Scilit] [PubMed]
- Chen, Y.; Qian, X.; Zhang, Y.; Su, W.; Huang, Y.; Wang, X.; Chen, X.; Zhao, E.; Han, L.; Ma, Y. Prediction models for conversion from mild cognitive impairment to Alzheimer’s disease: A systematic review and meta-analysis. Front. Aging Neurosci. 2022, 14, 840386. [Google Scholar] [CrossRef] [Scilit] [PubMed]
- Reas, E.T.; Shadrin, A.; Frei, O.; Motazedi, E.; McEvoy, L.; Bahrami, S.; van der Meer, D.; Makowski, C.; Loughnan, R.; Wang, X.; et al. Improved multimodal prediction of progression from MCI to Alzheimer’s disease combining genetics with quantitative brain MRI and cognitive measures. Alzheimers Dement. 2023, 19, 5151–5158. [Google Scholar] [CrossRef] [Scilit] [PubMed]
- Mofrad, S.A.; Lundervold, A.J.; Vik, A.; Lundervold, A.S. Cognitive and MRI trajectories for prediction of Alzheimer’s disease. Sci. Rep. 2021, 11, 2122. [Google Scholar] [CrossRef] [Scilit] [PubMed]
- Rye, I.; Vik, A.; Kocinski, M.; Lundervold, A.S.; Lundervold, A.J. Predicting conversion to Alzheimer’s disease in individuals with mild cognitive impairment using clinically transferable features. Sci. Rep. 2022, 12, 15566. [Google Scholar] [CrossRef] [Scilit] [PubMed]
- Shu, Z.-Y.; Mao, D.-W.; Xu, Y.-Y.; Shao, Y.; Pang, P.-P.; Gong, X.-Y. Prediction of the progression from mild cognitive impairment to Alzheimer’s disease using a radiomics-integrated model. Ther. Adv. Neurol. Disord. 2021, 14, 17562864211029551. [Google Scholar] [CrossRef] [Scilit] [PubMed]
- Zhang, M.; Cui, Q.; Lu, Y.; Li, W. A feature-aware multimodal framework with auto-fusion for Alzheimer’s disease diagnosis. Comput. Biol. Med. 2024, 178, 108740. [Google Scholar] [CrossRef] [Scilit] [PubMed]
- Wang, Y.; Gao, R.; Wei, T.; Johnston, L.; Yuan, X.; Zhang, Y.; Yu, Z. Predicting long-term progression of Alzheimer’s disease using a multimodal deep learning model incorporating interaction effects. J. Transl. Med. 2024, 22, 265. [Google Scholar] [CrossRef] [Scilit] [PubMed]
- Lee, M.-W.; Kim, H.W.; Choe, Y.S.; Yang, H.S.; Lee, J.; Lee, H.; Yong, J.H.; Kim, D.; Lee, M.; Kang, D.W.; et al. A multimodal machine learning model for predicting dementia conversion in Alzheimer’s disease. Sci. Rep. 2024, 14, 12276. [Google Scholar] [CrossRef] [Scilit] [PubMed]
- Simkhada, B.; Liang, T.Y.; Cui, X.; Adeyosoye, M.; Simkhada, B.; Cabrerizo, M.; Curiel Cid, R.; Burke, S.L.; Barreto, A.; Rishe, N.; et al. Multimodal Prediction of MCI-to-dementia Conversion Over a Two-year Window. GeroScience 2026. advance online publication. [Google Scholar] [CrossRef] [Scilit] [PubMed]
- Jasodanand, V.H.; Kowshik, S.S.; Puducheri, S.; Romano, M.F.; Xu, L.; Au, R.; Kolachalama, V.B. AI-driven fusion of multimodal data for Alzheimer’s disease biomarker assessment. Nat. Commun. 2025, 16, 7407. [Google Scholar] [CrossRef] [Scilit] [PubMed]
- Kumar, S.; Yu, S.C.; Michelson, A.P.; Kannampallil, T.; Payne, P.R.O. HiMAL: Multimodal hierarchical multi-task auxiliary learning framework for predicting Alzheimer’s disease progression. JAMIA Open 2024, 7, ooae087. [Google Scholar] [CrossRef] [Scilit] [PubMed]
- Yu, Z.; Mulholland, A.; Huang, T.; Liu, Q. Multimodal AI for Alzheimer disease diagnosis: Systematic review of datasets, models, and modalities. J. Med. Internet Res. 2026, 28, e85414. [Google Scholar] [CrossRef] [Scilit] [PubMed]
- An, C.; Zhou, Q.; Yang, S. A reinforcement learning guided adaptive cost-sensitive feature acquisition method. Appl. Soft Comput. 2022, 117, 108437. [Google Scholar] [CrossRef] [Scilit]
- von Kleist, H.; Zamanian, A.; Shpitser, I.; Ahmidi, N. Evaluation of active feature acquisition methods for time-varying feature settings. J. Mach. Learn. Res. 2025, 26, 60:1–60:84. [Google Scholar]
- Das, S.; Ramanan, N.; Kunapuli, G.; Radivojac, P.; Natarajan, S. Active feature elicitation: An unified framework. Front. Artif. Intell. 2023, 6, 1029943. [Google Scholar] [CrossRef] [Scilit] [PubMed]
- McCague, C.; MacKay, K.; Welsh, C.; Constantinou, A.; Jena, R.; Crispin-Ortuzar, M. Imaging AI Evaluation Consensus Group. Position statement on clinical evaluation of imaging AI. Lancet Digit. Health 2023, 5, e400–e402. [Google Scholar] [CrossRef] [Scilit] [PubMed]
- Breithaupt, A.G.; Weiner, M.; Tang, A.; Possin, K.L.; Sirota, M.; Lah, J.; Levey, A.I.; Van Hentenryck, P.; Zandehshahvar, R.; Gorno-Tempini, M.L.; et al. Agentic AI for scaling diagnosis and care in neurodegenerative disease. Nat. Aging 2026, 6, 1565–1579. [Google Scholar] [CrossRef] [Scilit] [PubMed]
- Li, R.; Wang, X.; Berlowitz, D.; Mez, J.; Lin, H.; Yu, H. CARE-AD: A multi-agent large language model framework for Alzheimer’s disease prediction using longitudinal clinical notes. npj Digit. Med. 2025, 8, 541. [Google Scholar] [CrossRef] [Scilit] [PubMed]
- Hu, S.; Sheng, X.; Wang, F.-A.; Zhao, E.; Fei, T.; Zhou, L.; Zhang, X.; Qu, F.; Li, Y. A multimodal evidence-driven framework for clinical decision support in cognitive impairment. npj Digit. Med. 2026. advance online publication. [Google Scholar] [CrossRef] [Scilit] [PubMed]
- Van Calster, B.; McLernon, D.J.; van Smeden, M.; Wynants, L.; Steyerberg, E.W. Calibration: The Achilles heel of predictive analytics. BMC Med. 2019, 17, 230. [Google Scholar] [CrossRef] [Scilit] [PubMed]
- Steyerberg, E.W.; Vickers, A.J.; Cook, N.R.; Gerds, T.; Gonen, M.; Obuchowski, N.; Pencina, M.; Kattan, M. Assessing the performance of prediction models: A framework for traditional and novel measures. Epidemiology 2010, 21, 128–138. [Google Scholar] [CrossRef] [Scilit] [PubMed]
- Collins, G.S.; Reitsma, J.B.; Altman, D.G.; Moons, K.G.M. Transparent Reporting of a multivariable prediction model for Individual Prognosis Or Diagnosis (TRIPOD): The TRIPOD Statement. Ann. Intern. Med. 2015, 162, 55–63. [Google Scholar] [CrossRef] [Scilit] [PubMed]
- Sounderajah, V.; Guni, A.; Liu, X.; Collins, G.S.; Karthikesalingam, A.; Markar, S.R.; Golub, R.M.; Denniston, A.K.; Shetty, S.; Moher, D.; et al. The STARD-AI reporting guideline for diagnostic accuracy studies using artificial intelligence. Nat. Med. 2025, 31, 3283–3289. [Google Scholar] [CrossRef] [Scilit] [PubMed]
- Collins, G.S.; Moons, K.G.M.; Dhiman, P.; Riley, R.D.; Beam, A.L.; Van Calster, B.; Ghassemi, M.; Liu, X.; Reitsma, J.B.; van Smeden, M.; et al. TRIPOD+AI statement: Updated guidance for reporting clinical prediction models that use regression or machine learning methods. BMJ 2024, 385, e078378. [Google Scholar] [CrossRef] [Scilit] [PubMed]
- Binuya, M.A.E.; Engelhardt, E.G.; Schats, W.; Schmidt, M.K.; Steyerberg, E.W. Methodological guidance for the evaluation and updating of clinical prediction models: A systematic review. BMC Med. Res. Methodol. 2022, 22, 316. [Google Scholar] [CrossRef] [Scilit] [PubMed]
- Vasey, B.; Nagendran, M.; Campbell, B.; Clifton, D.A.; Collins, G.S.; Denaxas, S.; Denniston, A.K.; Faes, L.; Geerts, B.; Ibrahim, M.; et al. Reporting guideline for the early-stage clinical evaluation of decision support systems driven by artificial intelligence: DECIDE-AI. BMJ 2022, 377, e070904. [Google Scholar] [CrossRef] [Scilit] [PubMed]
- Lekadir, K.; Frangi, A.F.; Porras, A.R.; Glocker, B.; Cintas, C.; Langlotz, C.P.; Weicken, E.; Asselbergs, F.W.; Prior, F.; Collins, G.S.; et al. FUTURE-AI: International consensus guideline for trustworthy and deployable artificial intelligence in healthcare. BMJ 2025, 388, e081554. [Google Scholar] [CrossRef] [Scilit] [PubMed]
- Estarellas, M.; Oxtoby, N.P.; Schott, J.M.; Alexander, D.C.; Young, A.L. Multimodal subtypes identified in Alzheimer’s Disease Neuroimaging Initiative participants by missing-data-enabled subtype and stage inference. Brain Commun. 2024, 6, fcae219. [Google Scholar] [CrossRef] [Scilit] [PubMed]

Disclaimer/Publisher’s Note: The statements, opinions and data contained in all publications are solely those of the individual author(s) and contributor(s) and not of MDPI and/or the editor(s). MDPI and/or the editor(s) disclaim responsibility for any injury to people or property resulting from any ideas, methods, instructions or products referred to in the content. |
© 2026 by the authors. Licensee MDPI, Basel, Switzerland. This article is an open access article distributed under the terms and conditions of the Creative Commons Attribution (CC BY) license.