Abstract
Under concurrent global warming and multi-scale climate anomalies, regional precipitation has become more uneven and less stable, and extreme events occur more frequently, amplifying water scarcity and ecological risk. Focusing on mainland China, we analyze nearly 70 years of monthly station precipitation records together with eight climate drivers—the Pacific Decadal Oscillation (PDO), Atlantic Multidecadal Oscillation (AMO), Multivariate ENSO Index (MEI), Arctic Oscillation (AO), surface air pressure (AP), wind speed (WS), relative humidity (RH), and surface solar radiation (SR)—and precipitation outputs from eight CMIP6 models. Using wavelet analysis and partial redundancy analysis, we systematically evaluate the qualitative relationships between climate drivers and precipitation and quantify the contribution of each driver. The results show that seasonal precipitation decreases stepwise from the southeast toward the northwest, and that stability is markedly lower in the northern arid and semi-arid regions than in the humid south, with widespread declines near the boundary between the second and third topographic steps of China. During the cold season, and in the northern arid and semi-arid zones and along the margins of the Tibetan Plateau, precipitation varies mainly with interdecadal swings of North Atlantic sea surface temperature and with the strength of polar and midlatitude circulation, and it is further amplified by variability in near-surface winds; the combined contribution reaches about 32% across the Northeast Plain, the Junggar Basin, and areas north of the Loess Plateau. During the warm season, and in the eastern and southern monsoon regions, precipitation is modulated primarily by tropical Pacific sea surface temperature and convection anomalies and by related changes in the position and strength of the subtropical high, moisture transport pathways, and relative humidity; the combined contribution is about 22% south of the Yangtze River and in adjacent areas. Our findings reveal the spatiotemporal variability of precipitation in China and its responses to multiple climate drivers and their relative contributions, providing a quantitative basis for water allocation and disaster risk management under climate change.
1. Introduction
Under sustained warming and multi-scale climate anomalies, global precipitation shows stronger spatial unevenness and temporal instability [1]. The resulting hydrologic extremes and wet-dry imbalance have become key constraints on ecosystem security and the sustainable development of human society [2]. Since the twentieth century, detection and attribution of global and regional precipitation change have relied mainly on a combined approach using climate system models and statistical methods [3], which usually partition external forcing into natural and anthropogenic components for comparative attribution [4]. In China, where the monsoon is dominant, land–ocean contrasts are strong, and topography is highly variable, spatial heterogeneity at the seasonal scale is superimposed on interannual and interdecadal variability. These features directly shape the spatial and temporal distribution of flood and drought risk and the predictability of water allocation. It is therefore essential, in the coupled system of the monsoon and the westerlies over China, to identify how remote ocean–atmosphere modes and near-surface meteorological factors influence seasonal precipitation.
Research worldwide has advanced along two tracks, multi-method and multi-variable, and a consistent framework has emerged that links large-scale teleconnection modes to regional precipitation responses. For the globe [5], the Northern Hemisphere [6], Europe [7], North America [8], and Canada [9], studies have widely applied Fuzzy C-means clustering [10], empirical orthogonal function (EOF) analysis [11], NCEP/NCAR reanalysis data [12], and multiple regression [13] to assess how the Pacific Decadal Oscillation (PDO) [14], El Niño–Southern Oscillation (ENSO) [15], Atlantic Multidecadal Oscillation (AMO) [16], and Indian Ocean Dipole (IOD) [17] modulate precipitation. In terms of external forcing, under a scenario of a 1% per year increase in carbon dioxide, heavy precipitation becomes more frequent globally, moderate precipitation declines, and dry or rain-free periods lengthen [18]; over Northern Hemisphere land during 1951–2005, observations of extreme precipitation reveal a significant anthropogenic signal, and the influence of human activities on precipitation rises by an average of 3.3% [19]. In circulation-type associations, the first EOF mode of mean summer and winter precipitation over Europe is strongly correlated with the North Atlantic Oscillation (NAO), at about 42% in winter and about 25% in summer, while the second EOF mode relates to 500-hPa height and the East Atlantic pattern [20]. Over eastern North America, extreme precipitation is highly sensitive to the NAO phase, with fewer events in the north and more in the south during the positive phase [21]. A multi-scale and multi-variable analysis for Canadian basins further shows that positive and negative phases of ENSO and NAO correspond to significant precipitation decreases and increases, respectively, that neutral and negative phases exhibit similar trends, and that the PDO provides an interdecadal background constraint [22]. Together, these findings establish an international paradigm that uses multi-source reanalysis and statistical learning to reveal the influence of ocean–atmosphere teleconnections on regional.
China spans both land and ocean across a vast domain and is strongly affected by global climate change. Research has therefore focused on the three-way coupling among monsoon moisture transport, sea surface temperature anomalies, and topographic thermal forcing. Under a warming climate, interdecadal precipitation variability in eastern China is closely linked to anomalous summer monsoon moisture flux over East Asia [23]. The intensification of heavy precipitation is mainly attributed to anthropogenic forcing from rising greenhouse gases, and it is expected to strengthen in coming decades with continued greenhouse gas increases and declining aerosol emissions [24]. In the north, annual precipitation generally increases from the northwest toward the southeast and northeast, and summer rainfall is especially sensitive to sea surface temperature anomalies in the Pacific and Indian Oceans [25]. Seasonal precipitation in North China is jointly controlled by the evolution of ENSO and IOD events, with the IOD exerting a stronger influence during some stages [26]. When the Arctic Oscillation is positive (negative), precipitation increases (decreases) over Southwest China; during El Niño years precipitation is higher in Southwest China, and during La Niña years it is higher in central China but lower on the western and eastern flanks [27]. With respect to coupling between the Tibetan Plateau and the mid to high latitudes, the cold and warm phases of the AMO can shift the western edge of NAO anomalies, trigger anomalous moisture convergence over eastern Tibet, and produce either a north–south dipole or a regionally uniform pattern of summer rainfall there. At the basin scale, different time scales in the Pearl River basin are tied to different climate indices: the IOD, NAO, and ENSO dominate annual, wet-season, and dry-season variability, respectively [28]. Together these studies show, from the viewpoint of regional mechanisms and factor coupling, that precipitation in China is sensitive to teleconnection modes and to the reorganization of monsoon moisture, with amplification by orography.
Despite a solid foundation, important gaps remain. Many studies focus on small regions with relatively uniform climate or topography, and they lack season-by-season and region-by-region comparisons under a unified national framework. The variable space is narrow: most analyses test correlations with only one to three teleconnection indices, and few include near-surface factors such as surface solar radiation (SR), wind speed (WS), RH, and surface air pressure (AP) to support quantitative attribution. Methodologically, there is a shortage of systematic identification of multiple features of seasonal precipitation and of robust estimates of the relative contributions of multiple drivers. Comparative attribution that benchmarks the CMIP6 ability to simulate precipitation over China is also limited. It is therefore a current frontier and challenge to broaden the set of climate drivers, to reveal both the qualitative links and quantitative responses of precipitation at individual stations, and to investigate how precipitation evolves and what mechanisms are involved under multiple drivers.
This study provides a comprehensive, multi-perspective analysis of the relationships between multiple climate drivers and precipitation, and quantifies the influence of each driver. Focusing on China, we use monthly precipitation records from 619 meteorological stations together with eight climate drivers—the PDO, AMO, Multivariate ENSO Index (MEI), AO, AP, WS, RH, and SR. We apply Morlet wavelet analysis, ensemble empirical mode decomposition (EEMD), and partial redundancy analysis (pRDA). We reveal the evolution of key characteristics of seasonal precipitation, assess the spatiotemporal variability of the qualitative associations between climate drivers and seasonal precipitation, and quantify the drivers’ contributions. The findings provide strong support for climate change research, for addressing water resource challenges, and for improving ecological conditions worldwide.
2. Materials and Methods
2.1. Study Area
China spans a vast territory with terrain that is high in the west and low in the east and with diverse landforms. The land area is about 9.6 million km2, of which mountains, plateaus, and hills account for roughly 67%, and basins and plains account for about 33%. The region includes several climate types, including the monsoon climate, temperate continental climate, and plateau–mountain climate. It is divided into four humidity zones: humid, semi-humid, semi-arid, and arid. These humidity zones and climate types intersect and blend, giving rise to a wide range of ecological systems.
2.2. Data Sources
This study uses monthly precipitation records from 683 stations across China for 1951–2018, obtained from the China Meteorological Data Service Center (http://data.cma.cn/). To ensure data quality, we first screened each station series for completeness and removed stations with more than nine years of cumulative missing data. For the remaining stations, we infilled sporadic gaps by regression using nearby stations. We then performed consistency and logic checks, including trend consistency among stations within the same climate-type region and coherent variability among neighboring station groups. After quality control, 64 stations were excluded, leaving 619 stations (see Figure 1). The retained series show good temporal consistency and are representative of precipitation conditions in the study area. Monthly near-surface meteorological variables from the same source include AP, WS, and RH, all observed synchronously at the 619 stations. SR was obtained from the same portal.
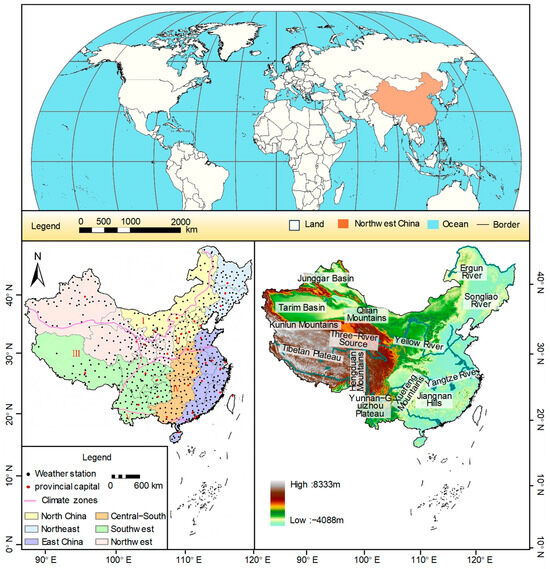
Figure 1.
Location of study area.
To characterize how large-scale ocean–atmosphere modes affect seasonal precipitation in China, we use monthly indices for the MEI, the PDO, the AMO, and the AO [29]. All indices are from the public archive of the NOAA Earth System Research Laboratory. These indices are temporally aligned with the station precipitation records and the near-surface variables and are used for qualitative correlation diagnostics and subsequent quantitative attribution.
To separate externally forced variability from internal variability and quantify the contribution of natural internal variability to precipitation over China, we used eight CMIP6 climate system models with documented good performance for Asian rainfall: BCC-CSM2-MR, CAMS-CSM1-0, EC-Earth3, FGOALS-f3-L, GFDL-ESM4, INM-CM4-8, INM-CM5-0, and MRI-ESM2-0. The models were selected according to the following criteria: (1) availability of continuous monthly time series of precipitation for both the historical period (1951–2014) and the four ScenarioMIP experiments SSP1-2.6, SSP2-4.5, SSP3-7.0 and SSP5-8.5 (2015–2099); (2) a horizontal spatial resolution of at least ~100 km, so that the influence of topography on the regional precipitation patterns can be better represented; and (3) use of the standard r1i1p1f1 ensemble member only, to ensure consistency of model outputs across the ensemble. To enhance regional applicability, we preferentially selected models developed by Asian institutions, assuming that they better represent local climate processes. For each model, we concatenated the historical and scenario simulations without gaps to match the study period and bilinearly interpolated the gridded data to the locations of the 619 rain-gauge stations. We then evaluated the skill of each model over China by comparing the simulated mean state, spatial distribution, seasonal cycle and interannual variability of precipitation with observations, and by referring to previous CMIP6 assessments for Asian rainfall [30]. Thus, building on previous studies of the general performance and applicability of CMIP6 models over Asia [31], we retained the above eight models for the subsequent attribution analyses.
2.3. Precipitation Abrupt Change Test Method
To identify change points in the monthly precipitation series for 1951–2018, we apply the nonparametric Mann–Kendall (MK) sequential test [32]. This method requires no distributional assumption and is insensitive to outliers. It first tests whether a significant monotonic change exists and then uses a sequential statistic to locate the time of the shift. The null hypothesis is that the series has no monotonic trend, and the alternative is that a monotonic increase or decrease is present. The significance level is α (commonly 0.05). For the series , we compare all pairs with and define the test statistic :
Compute in the standard form with a tie correction, and standardize to obtain . When , the series exhibits a significant monotonic change ( indicates an increase, a decrease).
Construct the forward sequential statistic (the backward statistic can be derived in the same way and is denoted ):
2.4. Morlet Wavelet Analysis
To characterize the periodic structure and anomalous variability of the precipitation series across time scales, we employ Morlet wavelet analysis [33], defined as:
The relationship between the Morlet wavelet scale and the period is given by:
The nondimensional central frequency is commonly set near 6.2 based on empirical practice. All computations were implemented in MATLAB (R2021a). We apply Morlet wavelet analysis to extract the dominant periodicities of precipitation. Using the wavelet time–frequency distribution and the variance of the wavelet coefficients, we identify the dominant period at each station. To further illustrate regional differences, we classify the dominant periods using 9-year and 15-year thresholds into three categories: high-frequency, mid-frequency, and low-frequency variability types.
2.5. Methodology for Classifying Precipitation Deficit Levels
For drought classification, we use the precipitation anomaly percentage (PAP) method [34], defined as:
In the formula, is the precipitation anomaly percentage, %; is the precipitation during the target period, mm; is the multi-year mean precipitation for the same month or season, mm. At the seasonal scale, drought classes based on are: no drought for −25 < ; light drought for −50 < ≤ −25; moderate drought for −70 < ≤ −50; severe drought for −80 < ≤ −70; and extreme drought for ≤ −80.
2.6. Contribution of Natural Variability to Precipitation
To estimate the contribution of natural internal variability to precipitation over China, we decompose the observed anomalies into an externally forced component and an internal component using a regression-based forced-signal removal approach. The basic idea is that the externally forced response is coherent across climate models, whereas internal variability is largely uncorrelated among models and is therefore suppressed when averaging across them. We first use a CMIP6 multi-model weighted ensemble to represent the externally forced response over China, and then remove this forced signal from the observations by linear regression; the regression residual is interpreted as the dominant internal variability [35].
- (1)
- Multi-model weighted ensemble as forced signal
We compute a weighted ensemble from the eight selected CMIP6 models. Let be the China area-mean monthly precipitation anomaly from model in month , obtained after concatenating the historical and scenario simulations and interpolating to the 619 stations. The China area-mean weighted ensemble anomaly series is defined as:
where is the China area-mean precipitation anomaly from model in month , and approximates the externally forced response at the China scale.
Regional mean decomposition and regression-based de-forcing. Let the observed China area-mean precipitation anomaly be . Decompose it into the sum of the externally forced component and internal variability:
- (2)
- Regression-based de-forcing at the China scale
Perform an ordinary least squares regression using the ensemble series as the independent variable:
Accordingly, we define the externally forced component and the internal variability component as:
Correlation over the historical period shows that , while , showing that the two components are nearly uncorrelated and that the decomposition is effective. Unlike a simple linear detrending of the observations, this method explicitly uses the model-derived forced signal and substantially reduces internal noise by aggregating across models.
- (3)
- Station-scale estimation of internal variability
For station , perform the same regression on the observed anomaly :
where is the regression coefficient of on ; is taken as the dominant internal variability at the station scale. Formally, we have:
Here, and represent the local residual responses of the forced and internal processes, respectively. Their contributions to long-term interdecadal variability are assumed to be small and are therefore neglected when estimating the dominant internal variability.
2.7. The Influence of Climatic Factors on Precipitation
To evaluate the independent effects of multiple climate drivers on precipitation, we use the detrended precipitation anomalies as the response variable and construct the predictor matrix from standardized climate drivers, including ocean–atmosphere indices and near-surface variables [36]. Because these drivers exhibit common collinearity and multi-scale coupling, entering them directly in a multiple regression can yield unstable estimates and biased contribution rates. We therefore adopt a two-step approach: PCA-based de-redundancy followed by RDA variance partitioning. First, we apply principal component analysis (PCA) in the predictor space to compress highly correlated variables into a set of orthogonal principal components, which preserves information while suppressing noise and collinearity. Next, within the constrained regression framework of redundancy analysis (RDA), we use the principal component scores as predictors to decompose the variance of , and we use partial RDA (pRDA) to compute the independent contribution of a target driver or driver group while controlling for the others. This workflow improves statistical robustness and preserves physical interpretability.
In implementation, all predictors are standardized, and PCA retains the first components whose cumulative explained variance reaches 85% to 90%. The projection is given by:
where is the matrix of principal component scores and is the corresponding eigenvector set. The matrix is then entered into RDA to maximize the variance of that is explained. To obtain the independent contribution rate of a single factor group, we apply partial RDA and compute the conditional explained variance after controlling for the remaining predictor sets:
Normalize to a percentage to obtain the contribution rate of group . Report the model’s total explained variance and the adjusted , and assess significance using permutation tests. This approach quantifies the influence and contribution of climate drivers to seasonal precipitation variability.
2.8. Kriging Interpolation Method
To map the basic characteristics of the climate drivers and precipitation, and the spatial patterns of the drivers’ effects and contributions to precipitation, we use the kriging interpolation method in ArcGIS (10.2) [37]. Because meteorological data for Taiwan and adjacent areas were not available, that region is not analyzed; maps in the main text are shown for mainland China only.
3. Results
3.1. Analysis of Spatiotemporal Variability in Seasonal Precipitation Across China
Seasonal precipitation in China exhibits a coherent spatial pattern (Figure 2). The multi-year mean decreases stepwise from the southeast coast toward the northwest interior (Figure 2a). Summer precipitation is greatest; along the southern coast, seasonal totals can exceed 900 mm, whereas in the northwest they are mostly below 50 mm. Spring and autumn rank next, and winter is lowest; in winter, precipitation is below 50 mm across most regions except East China and South-Central China.
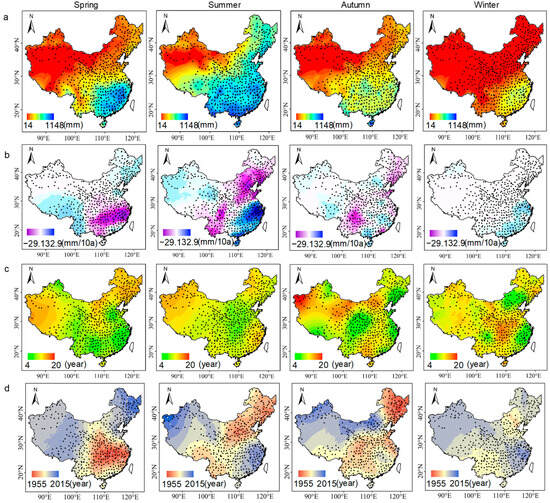
Figure 2.
Spatial distribution of seasonal mean precipitation (a), tendency rate (b), main period (c) and mutation year (d) in the study area.
In the study region, declining trends in seasonal precipitation are concentrated in the monsoon domain (Figure 2b). Rapid spring declines occur in South-Central China and East China; in summer they occur in central North China, northeastern North China, and along the Bohai Sea coast. In autumn the area with declines contracts, with slight decreases in the eastern Southwest and in the Northeast, and there is no declining trend in winter. Increasing trends are more heterogeneous: in spring there are slight increases in the Southwest and the Northeast; in summer there are rapid increases in South-Central China and East China and slight increases in the Northwest; in autumn increases are sporadic; and in winter only the southeast coast shows a slight increase, while other regions are near steady. Overall, seasonal precipitation cycles are dominated by mid-frequency variability (Figure 2c). In spring the north and west show slightly higher frequencies than other regions; in summer the central region is slightly lower; in autumn high-frequency variability appears west of the Tarim Basin, while the central and eastern coastal regions show low-frequency variability; and in winter the central region fluctuates slightly more than elsewhere. Abrupt shifts in seasonal precipitation occur at most stations nationwide (Figure 2d). In spring, the earliest shifts appear in East China and South-Central China (1960s to 1970s) and the latest in the Northeast (2000s), with timing in the west becoming progressively later from west to east. In summer, the earliest shifts occur west of the Tarim Basin and become later toward the southeast, then earlier again south of the boundary between the second and third topographic steps. Autumn resembles summer, with earlier shifts than in summer over the Northeast and East China and later shifts over central North China. In winter, shift timing is relatively concentrated during 1983 to 1995.
Overall, low-precipitation regions such as the Northwest are characterized by low means, mid to high frequency oscillations, later abrupt shifts, and trends that are slightly increasing or nearly steady. In contrast, high-precipitation regions such as East China and South-Central China show high means, low to mid-frequency oscillations, earlier abrupt shifts, increased summer rainfall, and pronounced spring drying. This pattern is broadly consistent with decadal adjustments in the intensity and position of the East Asian summer monsoon, with the westward extension and northward shift in the western Pacific subtropical high, and with the reorganization of the moisture flux convergence belt.
3.2. The Proportion of Severely Drought-Stricken Areas Affected by the Westerly Wind Belt Is Relatively Large
Against the southeast-humid to northwest-arid precipitation gradient, we further compute the seasonal percentages of occurrences for each drought class across China (Figure 3). Under the five-class scheme, the share of no-drought events increases from the Tarim Basin toward the Three-River Source region and the southeast coast; light drought rises slightly from west to east; moderate and severe drought generally increase from the southeast toward the northwest; extreme drought concentrates in western China. Overall, the order of occurrence is no drought > light drought > moderate drought > extreme drought > severe drought. In spring, the no-drought share is second only to summer, with the Tarim Basin at 47–51% and increasing toward the northeast, and rising faster toward the southeast to about 85% south of the Xuefeng Mountains and Jiangnan Hills. Light drought is spatially uniform, slightly lower in the Northwest, the Southeast, and South-Central China, and about 4% points higher in the Northeast, North China, and the Southwest. South of the Yangtze River, moderate drought and above are nearly absent. Moderate drought in North China and on the Tibetan Plateau is about 18%, higher than elsewhere; severe drought in the Tarim reaches about 11%; extreme drought in the Tarim and parts of the area to its east can reach 32%, second only to no drought. In summer, the climate is wettest, and the no-drought share is highest, reaching about 83% over the Qilian Mountains–Tibetan Plateau–Hengduan Mountains–Yunnan–Guizhou Plateau and farther south, but only 64–72% near the Kunlun Mountains. Summer light drought in the east is higher than in the west by about 8% points; moderate drought is about 9% in central North China and the Northwest, is nearly absent south of the Hengduan–Yunnan–Guizhou region, and is about 4% elsewhere; severe plus extreme drought is mostly confined to the Tarim region and totals below 12% and is essentially absent elsewhere. In autumn, drought classes shift upward. No-drought frequency is lowest in the Tarim and near the Kunlun Mountains at 38–55% and highest at about 79% from the eastern Tibetan Plateau through the Hengduan Mountains and the Yunnan–Guizhou Plateau to the south. Light drought is about 15% in the Tarim and 17–26% elsewhere. Moderate drought is markedly higher than in spring and summer, about 4% in the Sichuan Basin and nearby areas and mostly 9–17% elsewhere. Severe drought has a distribution similar to moderate drought, near zero in the Sichuan Basin and about 4–9% elsewhere. Autumn extreme drought peaks for the year, up to 64% in central Kunlun, while it is broadly zero across the Northeast, North China, South-Central China, East China, the central and eastern Southwest, and regions north of the Tianshan Mountains. In winter, the driest season, the no-drought share is the smallest among the four seasons, at only 43–47% south of the Kunlun and about 75% in the Yangtze River basin. Light drought resembles autumn, about 14% in the Tarim and 21–26% elsewhere. Moderate drought is fairly uniform at 9–21% and is lower over the middle and lower Yangtze. Severe drought is slightly higher, 9–13%, north of the Qilian Mountains, in the western Tibetan Plateau, and south of the Yunnan–Guizhou Plateau, and is mostly 0–9% elsewhere. Extreme drought ranks second only to autumn, with the smallest zero-occurrence area nationwide and higher shares in the central and western Northwest, the western Southwest, and central North China.
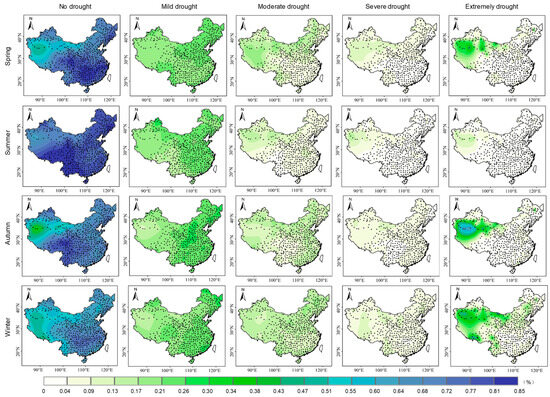
Figure 3.
The spatial distribution of the proportion of different drought levels in the study area over the period in the entire sequence.
Overall, precipitation is markedly less stable in the northern arid and semi-arid regions of China than in the humid south. This is reflected by a smaller no-drought share and much higher frequencies of moderate to severe and extreme drought. North of the Tibetan Plateau, drought occurs frequently under the control of the westerlies and the shielding effect of orography, whereas in the Three-River Source region the no-drought share is high, drought classes are low, and precipitation is most stable. These seasonal and regional contrasts are consistent with the spatiotemporal configuration of the East Asian summer monsoon, the organization of moisture transport pathways, and modulation by plateau topography. Therefore, climatic drought is more likely to arise from the joint and coupled effects of multiple atmospheric circulation factors. Further analysis centered on precipitation, including systematic identification of the dominant drivers and clarification of their mechanisms, is essential for revealing the occurrence and evolution of drought and for improving explanatory power and prediction.
3.3. The Relationship Between Seasonal Precipitation and Influencing Factors Exhibits Regional Characteristics
Building on the spatial patterns of seasonal means, variability, and shifts, we further assess qualitative links between major ocean–atmosphere indices and seasonal precipitation (Figure 4). Overall, the PDO signal is clear, with seasonal dependence strongest in autumn, then winter, summer, and weakest in spring. In spring, precipitation is significantly positively correlated with the PDO south of the Yunnan–Guizhou Plateau and along the Xuefeng Mountains, significantly negatively correlated in southeastern East China, and mostly insignificant in the Northeast and North China. In summer, correlations are significantly positive along the Bohai coast and significantly negative in the northern part of the Northwest. In autumn, about one third of the country shows significant correlations, with significant positive correlations from the Loess Plateau to the Yunnan–Guizhou Plateau and significant negative correlations in East China, central North China, and the Junggar Basin. In winter, correlations are significantly negative south of the middle to upper Yangtze River, and mostly negative but not significant on the North China Plain. The AMO is dominated by negative correlations, with scattered positives and strong seasonal dependence. In spring, correlations are strongest, significantly positive south of the Yunnan–Guizhou Plateau and significantly negative across the Northeast and much of the West. In summer, correlations are significantly negative south of the Tianshan Mountains, in the Southwest, and across the Jiangnan Hills, while elsewhere they are weaker. In autumn, correlations are positive over the Yunnan–Guizhou Plateau and the Sichuan Basin and negative in the Tarim Basin, and overall weaker than in other seasons. In winter, correlations are significantly negative in the Northeast and the northern Northwest, while the North China Plain shows a nonsignificant positive signal. The MEI shows mainly positive correlations in the warm season and mainly negative correlations in winter. In spring, correlations are significantly positive along the Hengduan Mountains and south of the Yunnan–Guizhou Plateau, with isolated significant negatives on the North China Plain and near the Pearl River estuary. In summer, correlations are significantly positive south of the Tibetan Plateau and east of the Taihang Mountains, and are mostly weakly positive but insignificant over the Xiaoxing’an Mountains and east of the Tianshan. In autumn, about half of the stations reach significance, with significant positives across the Yellow River basin and significant negatives south of the middle to lower Yangtze. In winter, significant negative correlations are widespread south of the Yangtze. The AO exhibits the sharpest seasonal contrast, strongest in winter, followed by summer and spring, and weakest in autumn. In spring, correlation strength decreases from the Northeast toward the Southwest, with significant positives over the Xiaoxing’an Mountains, north of the Junggar Basin, and the Jiangnan Hills, and a significant negative in Yunnan. In summer, about 70% of stations correlate positively with the AO, with significant positives in the Northeast and the Southwest and a significant negative confined to central parts of the Northwest. In autumn, correlation strength decreases from the eastern and western flanks toward the center; significant positives occur in the Northeast and the western Tibetan Plateau, and significant negatives appear east of the Xuefeng Mountains. In winter, about half the stations are significant, with correlation strength increasing from the center toward both east and west; significant positives appear in the Northeast and northern North China, and significant negatives over the Loess Plateau and the central Yangtze.
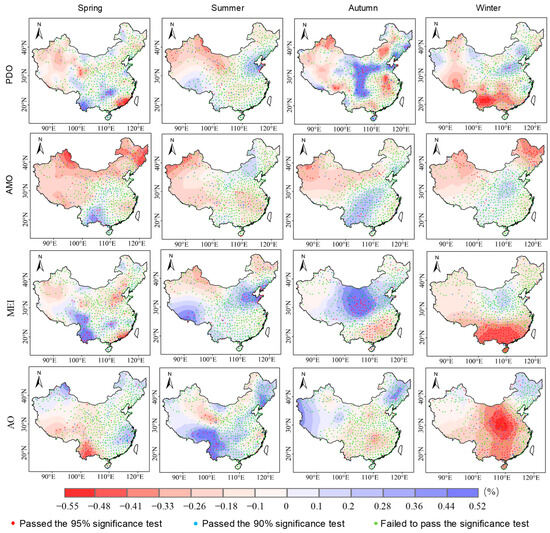
Figure 4.
Spatial distribution of the correlation between seasonal precipitation and PDO, AMO, MEI, and AO.
Among near-surface variables (Figure 5), correlations of seasonal precipitation with SR and WS are overall stronger than with RH and AP, with the strongest relationships in spring. For RH, spring correlations decrease from the Northeast and Southwest toward the central region, with significant positives in the West and the Northeast and significant negatives south of the middle to lower Yangtze; in summer, coefficients are mostly within −0.1 to 0.1, tending positive in the western Northwest and East China and negative elsewhere; in autumn and winter they are generally nonsignificant and negative. For SR, correlations are strongest in spring, with significant positives along the Taihang Mountains, the Tarim Basin, the Hengduan Mountains, and the Zhejiang–Fujian hills, and significant negatives in the western Greater Khingan Range and the southern Sichuan Basin; in summer, correlations are mostly nonsignificant and positive with a uniform spatial pattern; in autumn they are broadly nonsignificant and negative; in winter they are mainly positive and stronger in western and southeastern China. For WS, spring precipitation correlates significantly positively in the Southwest and significantly negatively at some stations on the middle to lower Yangtze Plain; in summer, most stations show nonsignificant positive correlations; in autumn, correlations are generally nonsignificant and negative with a uniform pattern; in winter, correlations are second only to spring, significantly positive in the West and mostly nonsignificant and positive elsewhere. For AP, correlations with seasonal precipitation are weakest and reach significance only locally in spring: significantly positive in the Northeast, nonsignificantly positive in the West, and nonsignificantly negative in South-Central and North China; in summer and autumn, about one third of stations are nonsignificantly negative and the rest are nonsignificantly positive; in winter, correlation coefficients nationwide fall mainly between 0 and 0.1.
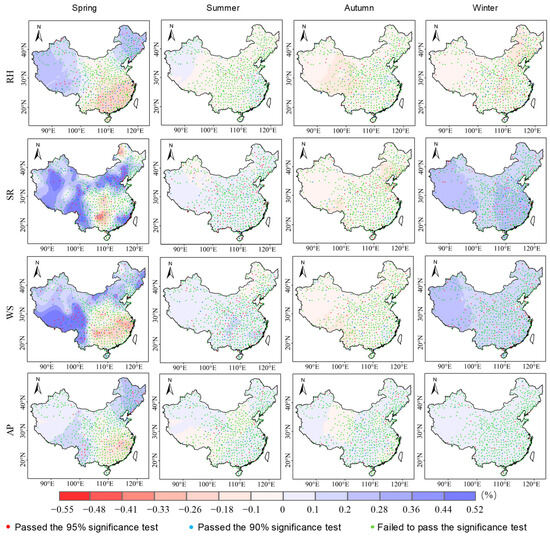
Figure 5.
Spatial distribution of the correlations between seasonal precipitation and RH, SR, WS, and AP.
Taken together, the spatial pattern of responses between seasonal precipitation and the drivers is regional. Delineating areas with significant correlations (Figure 6) shows the following. In spring, precipitation correlates well with RH nationwide; it also correlates well with AMO, SR, WS, and AP in the Northeast, North China, the Northwest, and the central–western Southwest, and MEI and AO also influence the central–western Southwest. In summer, precipitation–driver relationships are weak in northern North China, the southern part of South-Central China, East China, and the northern Tibetan Plateau, with correlation coefficients roughly between −0.18 and 0.1; in the northern Northwest, summer precipitation correlates significantly with AMO and PDO; AO affects the Northeast, south of the Tibetan Plateau, the Hengduan Mountains, and the Yunnan–Guizhou Plateau; MEI correlates significantly with precipitation on the North China Plain, in the northern Northwest, and south of the Tibetan Plateau. In autumn, precipitation in the Northeast and northern North China responds well to PDO and AO; correlations with AMO and AO are significant in western Xinjiang and western Tibet; and central and southern China respond well to MEI, PDO, and AMO. In winter, precipitation correlates well with AMO in the Northeast, northern North China, Xinjiang, and western Tibet; AO mainly affects winter precipitation in central and southern China; and PDO and MEI are also influential in the eastern Southwest, the southern part of South-Central China, and southeastern East China.
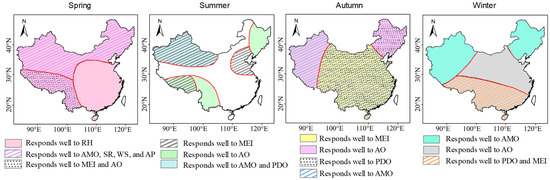
Figure 6.
Spatial distribution of quantitative response relationships between seasonal precipitation and influencing factors.
3.4. Regional Variations in the Contribution Rates of Climatic Factors to Spring and Winter Precipitation Are Considerable
To quantify the contribution rates of the selected climate drivers to seasonal precipitation, we apply ensemble empirical mode decomposition (EEMD) to the observed seasonal precipitation fields and to the climate-driver time series, extract intrinsic mode functions across time scales, and remove the influence of human activities. We then use these intrinsic mode functions in redundancy analysis (RDA) based on a linear model to quantify driver contributions under natural variability. The same calculation is applied at all meteorological stations. The drivers are grouped into two classes: large-scale circulation factors (PDO, AMO, MEI, AO) and regional factors (RH, SR, WS, AP). Using a representative station as an example (Figure 7), the contribution rates are as follows: in spring, 22.5% from large-scale circulation and 36.8% from regional factors; in summer, 44.5% and 28.0%; in autumn, 40.6% and 31.9%; and in winter, 41.6% and 27.0%, respectively.
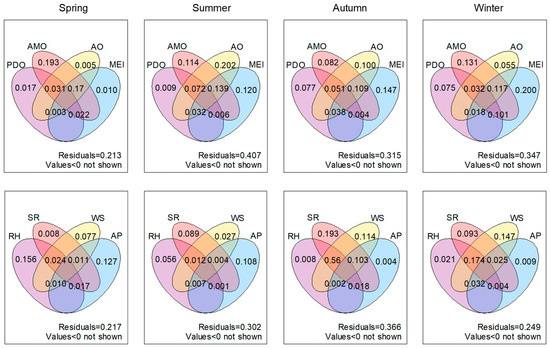
Figure 7.
Analysis of variance of the influencing factors of seasonal precipitation based on partial redundancy analysis.
Based on the above procedures, we derive the spatial distribution of contribution rates for each driver to precipitation over China (Figure 8 and Figure 9). The PDO contributes most to summer precipitation, followed by autumn and winter, and least in spring. In spring the PDO contribution is fairly uniform with no pronounced hotspot. In summer it increases from the southeast toward the northwest, reaching 9–13.6% in the northwest and about 2.8% along the east coast of East China. In autumn it weakens outward from central China, with an overall drop of about 2.8% points. In winter it decreases from south to north, exceeding 10.5% over and south of the Yunnan–Guizhou Plateau. The AMO shows a north–south contrast with higher contributions in the north. The seasonal ranking is winter, spring, summer, and autumn in the north, and summer, autumn, spring, and winter in the south. In spring the Northeast and the northern Northwest are higher at 7.5–13.5%; in summer the Tianshan Mountains and the middle to lower Yangtze Plain are higher while central North China is lower; in autumn the Tarim Basin, the Inner Mongolia Plateau, and the Yunnan–Guizhou Plateau are higher, and other areas are lower with a uniform distribution; in winter the northern Northwest and the Northeast reach 12–15%, and elsewhere the pattern is dispersed, with about half of stations at 0–3% and the other half at 3–7.5%. The MEI contributes most to autumn precipitation, followed by winter and summer, and least to spring. In spring contributions are higher along the Taihang Mountains, the Hengduan Mountains, and the Yunnan–Guizhou Plateau, and they are lower over the Changbai Mountains and the Sichuan Basin. In summer contributions are about 7.5% in the Tarim Basin, decay eastward to about 3% over the Loess Plateau, and rise again to above 9% north of the Bohai Sea. In autumn contributions increase markedly over central China, reaching about 13.2% south of the Loess Plateau and decreasing toward both the east and west flanks to about 5.1% in the Northeast and along the western margin. In winter contributions exceed 12% south of the Yangtze River and decrease northward to about 3.8% over the western Inner Mongolia Plateau. The AO contributes most in winter, followed by spring, summer, and autumn. In spring contributions decrease toward about 110° E from north of the Tianshan Mountains, the Xiaoxing’an Mountains, south of the Yunnan–Guizhou Plateau, and the Zhejiang–Fujian hills, from about 12.8% south of the Yunnan–Guizhou Plateau to about 1.2% near 110° E. In summer contributions are relatively high on the Northeast Plain and west of the Hengduan Mountains, exceeding those over the Loess Plateau and regions to its south. In autumn contributions exceed 8.1% in the southern Northeast Plain, the Xuefeng Mountains, the Loess Plateau, and the Qilian Mountains, and are below 4.5% elsewhere. In winter a high-contribution belt lies near 102–112° E at about 14.7% and weakens toward both the east and west.
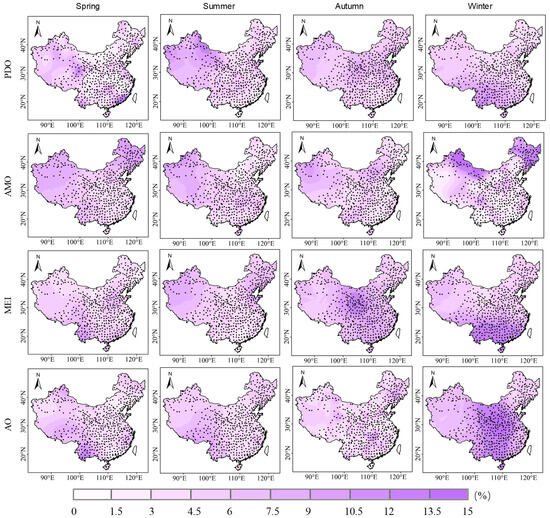
Figure 8.
The spatial distribution of the contribution rates of PDO, AMO, MEI and AO to seasonal precipitation.
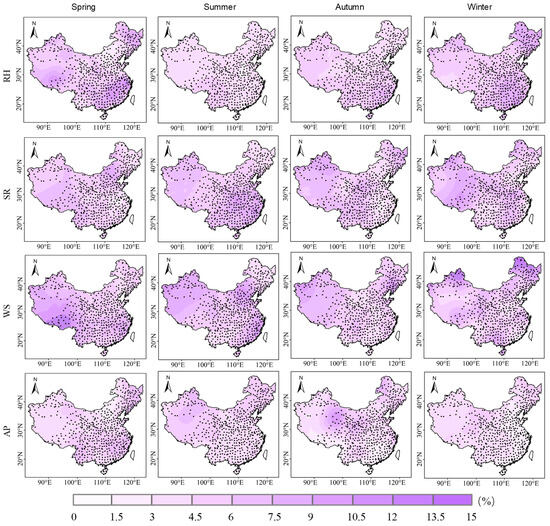
Figure 9.
The spatial distribution of the contribution rates of RH, SR, WS, and AP to seasonal precipitation.
For RH, the impact on spring precipitation is highest over the Northeast Plain, the southern Tibetan Plateau, and south of the middle to lower Yangtze River, reaching up to 10.5%, and is lowest in central North China at about 1.5–3%; in summer the spatial pattern is fairly uniform at mostly 1.5–6%, slightly higher over the Hengduan region and lowest on the North China Plain; in autumn it is stronger in the south and weaker in the north at about 9% in East China and less than 4.5% in North China and the Northeast; in winter the overall impact is larger, higher in the Northeast, South-Central China, and East China, and lower in central and western North China at 3–6%. For SR, contributions exceed 8% in spring over central North China and the Tibetan Plateau, and are below 3.5% in the Northeast, South-Central China, and East China; in summer they are relatively high in northern South-Central China and the northeastern part of East China; in autumn they are slightly higher in the Northeast, north of the Tianshan, and the northern Loess Plateau; in winter they are higher north of the Greater Khingan Range, over the Altun Mountains, and from the Tibetan Plateau to the Loess Plateau. For WS, contributions to spring precipitation are largest in the Southwest at 12–13.5%, next highest in northeastern East China, and lowest on the Inner Mongolia Plateau and south of the Xuefeng Mountains; in summer they are largest in central North China and East China and smallest in the Northeast, the eastern part of northern Xinjiang, and the Southwest at 3–5.8%; in autumn they decrease from the eastern and western flanks toward the center, with the southern Northeast Plain near 15%; in winter they are higher in the north than in the south, reaching about 13.5% in the Junggar region and north of the Greater Khingan Range. For AP, contributions are below 6% in all seasons; in spring they are slightly higher on the Northeast Plain, the Changbai Mountains, and south of the Yangtze River at 6–8.4% and are lowest in central North China at less than 3%; in summer they are slightly higher north of the Yellow River than to the south at 4.5–7.5% versus 3–4.5%; in autumn they exceed 9% over and north of the Qaidam Basin and are about 2.8% south of the middle to lower Yangtze; in winter they are about 5.7% in the Northeast and central Northwest and are lowest from the Taihang Mountains through the Beijing to Hangzhou Grand Canal corridor and the Zhejiang and Fujian hills at 1.5–3%. In summary, RH and WS are the leading controls in spring, RH is relatively prominent in winter, differences among factors narrow in summer, and regional contrasts are most pronounced in autumn.
Accordingly, the contribution rates of the selected climate drivers to seasonal precipitation show pronounced spatial heterogeneity across China, and some drivers make only small contributions in certain regions. Among large-scale circulation factors, the overall contribution ranks as MEI > AO > AMO > PDO; among regional factors, WS > SR > RH > AP. The selected drivers contribute more to spring and summer precipitation in western China and more to autumn precipitation in central China. Regions with high winter contribution are more localized: AMO and WS contribute more in the north, PDO, MEI, and RH contribute more in the south, and AO contributes more in central China. Overall, the total contribution of multiple drivers to spring and winter precipitation varies by region (Figure 10), whereas contributions to summer and autumn precipitation vary little in space. In spring, total contributions are high over the Lesser Khingan Range, the Tibetan Plateau, and areas south of the Yunnan–Guizhou Plateau at 34–38%, and are relatively low over the Inner Mongolia Plateau and the Loess Plateau at about 10%. In summer, the total contribution decreases slightly from the west and east toward the center, is slightly larger in the west than in the east, reaches a maximum of about 34% in a small area west of the Tarim River and east of the Tianshan Mountains, and is lowest along the Inner Mongolia reach of the Yellow River and in the Pearl River basin at about 18%. In autumn, differences across the study region are small, with a range under 10%; totals are relatively high over the Northeast Plain, the Junggar Basin, and areas north of the Loess Plateau at about 32%, and relatively low in central North China, South-Central China, East China, and the southern fringe of the Southwest at about 22%. In winter, the total contribution decreases from north and south toward the central band; totals north of 40° N and south of 25° N are high at 34–42%, whereas totals between 25° N and 40° N are lower at about 18–30%.
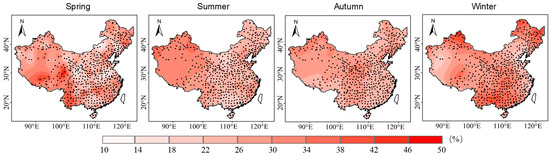
Figure 10.
The spatial distribution of the combined influence of climatic factors on seasonal precipitation.
4. Discussion
Under the influence of the monsoon system, topography [38], and land–sea configuration [39], the multi-year mean of seasonal precipitation shows a clear spatial tendency, with a marked gradient from dry in the northwest to modestly wetter toward the southeast [40]. In the north, drought tends to expand slightly, and interannual precipitation is less stable [41]; precipitation increases in northern Northeast China but continues to decline in the southern Northeast. In North China, under the persistent influence of the NAO and the PDO [42], precipitation has declined overall. Historical records indicate a roughly 40-year persistent drought, and warming-driven increases in evaporation may have intensified aridity [43]. North of the Tibetan Plateau, annual and seasonal precipitation vary strongly despite low amounts, likely because the region includes the Tarim Basin where severe water scarcity, aridity, and frequent extremes drive large fluctuations. The southeast coast lies along the pathway of the Pacific southeast monsoon and the Indian Ocean southwest monsoon during their northward advance and southward retreat, so the summer monsoon lingers, the rainy season is long, and precipitation is abundant; south of the Yangtze River and along the southeast coast, trends are clearly upward and seasonal variability is small, consistent with the spatial pattern of “stable south, fluctuating north, stable east, fluctuating west” [44]. Areas with declining annual and seasonal precipitation are located near the second–third step boundary, with many change points in the 1960s to 1970s, while other regions show increases with most change points in the 1990s. Dominant periods of annual and seasonal precipitation exhibit clear regional differences. Under the influence of plateau–mountain climate [45], annual precipitation shows mid to high frequency over the Tibetan Plateau and the southeast, low frequency in the west, and in the eastern monsoon region high frequency prevails except over the Nanling, Qinling, the eastern Inner Mongolia Plateau, the Xiaoxing’an Mountains, and the Changbai Mountains where mid to low frequency dominates [46]. Seasonal periods are shorter than annual periods, consistent with the results of this study.
In spring, the Northeast, North China, the Northwest, and the central–western Southwest are influenced by AMO together with near-surface factors (SR, WS, AP), while the central–western Southwest is also affected by MEI and AO. In summer, the northern Northwest is most sensitive to AMO and PDO; AO affects the Northeast and the Southwest; and MEI has a significant effect on the North China Plain, the northern Northwest, and the southern margin of the Tibetan Plateau. In autumn, the Northeast and northern North China are biased toward PDO and AO control; Xinjiang and western Tibet are biased toward AMO and AO; and central and southern China are jointly modulated by MEI, PDO, and AMO. In winter, AMO primarily controls the sequence from the Northeast through northern North China, Xinjiang, and northern Tibet; AO dominates South-Central China; and PDO and MEI exert increasing influence over southeastern East China and the eastern Southwest. To understand uncertainty from internal climate variability, many studies [47] analyze the ENSO, the PDO, the NAO, and other variability modes. Results show that ENSO imparts clear space–time features to seasonal precipitation trends in China, with strong correlations in the southeast and the northwest and marked increases in correlation over the Northwest in spring and winter [48]. South of the Nanling Mountains, winter precipitation typically increases when ENSO, sea surface temperature anomalies (SSTs), and the positive phase of the AO increase together [49], consistent with this study. Autumn precipitation changes in North China are caused by large-scale midlatitude atmospheric circulation anomalies over the Northern Hemisphere associated with the PDO [50]. The AMO influences summer rainfall in southern China by modulating El Niño-related air–sea interaction over the western North Pacific (WNP) [51], which differs slightly from our results, likely because the effects of different climate drivers on seasonal precipitation can offset or reinforce one another.
AMO plays an important role in precipitation over the mid to high latitudes of the Northern Hemisphere [52]. On interannual scales, pronounced precipitation periodicity is linked to PDO and AMO variability, with high correlations over much of the Northwest, the Songliao River basin, the Huang–Huai–Hai Plain, and the southern margin of the Yangtze basin, consistent with our results. Because water vapor flux changes differ spatially between the warm and cold AMO phases, precipitation is largely in phase with AMO in the northwestern corner of China, while in the middle Yellow River basin the cold AMO phase leads to surplus precipitation [53]. ENSO and PDO are two key indices for Asian precipitation [54] and contribute strongly over China. During La Niña, the Indian High strengthens and enhances the Somali cross-equatorial flow, increasing precipitation in Xinjiang; during El Niño, Xinjiang precipitation decreases [55]. A cyclone over the Indian Ocean and a strengthened South Asian High increase precipitation over the Tibetan Plateau [56]. Warmer sea surface temperatures in the tropical eastern Pacific weaken the Walker and Hadley circulations, and a strengthened western Pacific subtropical high expands southward, transporting more moisture to Northeast and North China [57]. This agrees with our finding that the MEI strongly affects Xinjiang, the Tibetan Plateau, the Northeast, and North China on interdecadal scales. The PDO represents thermal contrasts over the North Pacific and modulates Northern Hemisphere climate on interdecadal scales [58]. Its impact on regional precipitation is mainly through changes in the East Asian summer monsoon and the westerlies [59]. Since the 1970s, the PDO has been largely in a positive phase; the Mascarene and Australian highs have strengthened, and cross-equatorial flow has intensified, increasing precipitation in Xinjiang [60]. The westerly jet and the western Pacific subtropical high have shifted northward; under stronger westerlies, moisture from the Bay of Bengal, the South China Sea, and the western North Pacific can reach the Hetao belt and Inner Mongolia, enhancing local rainfall [61]. When a positive PDO coincides with El Niño, an anticyclone forms over the western North Pacific, and moisture transport to southern China increases [62]. Variations in the AO may reflect wave–mean flow interactions. Stratospheric AO changes are influenced by slow interactions between planetary waves and the zonal flow, and tropospheric AO changes are driven mainly by interactions between synoptic-scale eddies and the zonal-mean flow [63]. Different AO phases correspond to a redistribution of atmospheric mass over the Northern Hemisphere, which alters the meridional pressure gradient, induces zonal westerly anomalies in the midlatitudes, and affects climate [64]. With its activity center over the Arctic, the AO’s influence on precipitation weakens from north to south, in line with our results. Solar incoming radiation controls Earth’s energy balance and the climate system, while the atmosphere and surface properties regulate outgoing radiation and involve climate feedbacks. Scattering and absorption of solar radiation reduce surface solar flux, surface temperature, and surface moisture flux, and increase atmospheric stability, thereby reducing precipitation [65]. Other factors also matter. Radiative changes from volcanic and solar activity can combine with ENSO evolution within natural variability [66]; the Interdecadal Pacific Oscillation (IPO) [67], multidecadal NAO variability [68], WS, air pressure, and human activities can all contribute to precipitation change.
5. Conclusions
Seasonal precipitation in China exhibits a clear southeast–northwest decreasing gradient. Precipitation stability is lower in northern arid and semi-arid regions than in the humid south, with the smallest amounts but strongest variability occurring north of the Tibetan Plateau. Spatially, decreasing trends are mainly observed near the boundary between the second and third topographic steps, while most other regions show increasing trends, particularly along the East China coast where precipitation is highest and increases most rapidly. Most detected change points occur in the 1990s.
The dominant periodicities of precipitation are shorter in the temperate continental and temperate monsoon regions than elsewhere. Climate drivers show distinct seasonal and regional influences: AMO and AO dominate precipitation variability in the cold season and in high-latitude to northwestern regions, whereas MEI and PDO primarily modulate warm-season precipitation in eastern and southern monsoon regions. The Southwest transition zone reflects the combined influence of multiple drivers. Overall, the combined contribution of climate drivers to annual precipitation is higher in western China and lower in the east, with regional differences in spring and winter. Among the drivers, AMO, MEI, and AO contribute the most, while AP contributes the least, with additional influence from natural radiative forcings such as volcanic aerosols.
Author Contributions
Conceptualization, C.L. and L.M.; methodology, C.L. and L.M.; software, C.L.; validation, L.M., B.S. and T.L.; formal analysis, C.L., X.H. and T.L.; investigation, T.L.; resources, C.L. and L.M.; data curation, C.L.; writing—original draft preparation, C.L. and L.M.; writing—review and editing, L.M.; visualization, B.S.; supervision, X.H.; project administration, B.S. and X.H.; funding acquisition, L.M. All authors have read and agreed to the published version of the manuscript.
Funding
This research was funded by the National Key R&D Program of China (Grant No. 2023YFC3206502), National Natural Science Foundation of China (Grant No. 52379015), Inner Mongolia Autonomous Region Education Special Fund Project (2025), and Inner Mongolia Autonomous Region Science and Technology Leading Talent Team (Grant No. 2022LJRC0007).
Data Availability Statement
No new data were created or analyzed in this study.
Conflicts of Interest
The authors declare no conflicts of interest.
Abbreviations
The following abbreviations are used in this manuscript:
| AMO | Atlantic Multidecadal Oscillation |
| PDO | Pacific Decadal Oscillation |
| MEI | Multivariate ENSO Index |
| AO | Arctic Oscillation |
| AP | Air Pressure |
| WS | Wind Speed |
| RH | Relative Humidity |
| SR | solar radiation |
References
- Vousdoukas, M.I.; Mentaschi, L.; Voukouvalas, E.; Verlaan, M.; Feyen, L. Extreme sea levels on the rise along Europe’s coasts. Earth’s Future 2017, 5, 304–323. [Google Scholar] [CrossRef]
- Ravinandrasana, V.P.; Franzke, C.L.E. The first emergence of unprecedented global water scarcity in the Anthropocene. Nat. Commun. 2025, 16, 8281. [Google Scholar] [CrossRef] [PubMed]
- Huo, F.; Xu, L.; Li, Z.; Li, Y.; Famiglietti, J.S.; Chandanpurkar, H.A. Can climate change signals be detected from the terrestrial water storage at daily timescale? npj Clim. Atmos. Sci. 2024, 7, 158. [Google Scholar] [CrossRef]
- Zhou, S.; Yu, B. Neglecting land–atmosphere feedbacks overestimates climate-driven increases in evapotranspiration. Nat. Clim. Change 2025, 15, 1099–1106. [Google Scholar] [CrossRef]
- Dong, M.; Sun, C.; Lou, W.; Shi, L.; Song, Z.; He, Y.; Tong, Y. Global teleconnection of concurrent dry and wet events revealed by climate network. Clim. Dyn. 2025, 63, 256. [Google Scholar] [CrossRef]
- Springer, S.; Laio, A.; Galfi, V.M.; Lucarini, V. Unsupervised detection of large-scale weather patterns in the northern hemisphere via Markov State Modelling: From blockings to teleconnections. NPJ Clim. Atmos. Sci. 2024, 7, 105. [Google Scholar] [CrossRef]
- Liné, A.; Cassou, C.; Msadek, R.; Parey, S. Modulation of Northern Europe near-term anthropogenic warming and wettening assessed through internal variability storylines. NPJ Clim. Atmos. Sci. 2024, 7, 272. [Google Scholar] [CrossRef]
- Liu, M.; Ren, H.L.; Zhou, F.; Wang, R. Distinct North American teleconnection of the strong El Niños as modulated by the ENSO-annual cycle combination mode. Clim. Dyn. 2024, 62, 2147–2160. [Google Scholar] [CrossRef]
- Selkirk, T.F.; Western, A.W.; Webb, J.A. Interdecadal rainfall cycles in spatially coherent global regions and their relationship to the climate modes. Hydrol. Earth Syst. Sci. 2025, 29, 5737–5754. [Google Scholar] [CrossRef]
- Berhail, S.; Katipoğlu, O.M. Analysis of drought patterns and categories based on the Standard Precipitation-Temperature Index (SPTI): Application of fuzzy c-means clustering and principal component analysis. Nat. Hazards 2025, 121, 12025–12051. [Google Scholar] [CrossRef]
- Shen, T.; Lu, R. Relationship between the uncertainty of empirical orthogonal function (EOF) modes and sampling sizes in climate models. J. Clim. 2024, 37, 2297–2307. [Google Scholar] [CrossRef]
- Deepthi, B.; Sivakumar, B. Spatial downscaling of rainfall from general circulation models: A chaos theory-based framework. Atmos. Res. 2024, 308, 107531. [Google Scholar] [CrossRef]
- Meng, H.; Chu, L.; Wang, P.; Wei, X.; Liu, J.; Jiang, M. Precipitation drives latitudinal patterns of multifaceted biodiversity in montane forests, South-Central China. Ecol. Indic. 2025, 171, 113246. [Google Scholar] [CrossRef]
- Wei, W.; Yan, Z.; Li, Z. Influence of Pacific Decadal Oscillation on global precipitation extremes. Environ. Res. Lett. 2021, 16, 044031. [Google Scholar] [CrossRef]
- Cai, W.; Santoso, A.; Collins, M.; Dewitte, B.; Karamperidou, C.; Kug, J.S.; Lengaigne, M.; McPhaden, M.J.; Stuecker, M.F.; Taschetto, A.S.; et al. Changing El Niño–Southern oscillation in a warming climate. Nat. Rev. Earth Environ. 2021, 2, 628–644. [Google Scholar] [CrossRef]
- Liu, J.; Xue, J.; Gao, Y.; Zhu, H. The influence of Arctic oscillation on South China precipitation in winter is modulated by the Atlantic multidecadal oscillation. Geophys. Res. Lett. 2024, 51, e2024GL112090. [Google Scholar] [CrossRef]
- Zhang, Y.; Zhou, W.; Wang, X.; Chen, S.; Chen, J.; Li, S. Indian Ocean Dipole and ENSO’s mechanistic importance in modulating the ensuing-summer precipitation over Eastern China. NPJ Clim. Atmos. Sci. 2022, 5, 48. [Google Scholar] [CrossRef]
- Chen, H.; Sun, J. Significant increase of the global population exposure to increased precipitation extremes in the future. Earth’s Future 2021, 9, e2020EF001941. [Google Scholar] [CrossRef]
- Dong, S.; Sun, Y.; Zhang, X. Attributing observed increase in extreme precipitation in China to human influence. Environ. Res. Lett. 2022, 17, 095005. [Google Scholar] [CrossRef]
- Ding, R.; Nnamchi, H.C.; Yu, J.Y.; Li, T.; Sun, C.; Li, J.; Iseng, Y.H.; Li, X.; Xie, F.; Feng, J.; et al. North Atlantic oscillation controls multidecadal changes in the North Tropical Atlantic−Pacific connection. Nat. Commun. 2023, 14, 862. [Google Scholar] [CrossRef]
- Wang, B.; Lee, M.Y.; Xie, Z.; Lu, M.; Pan, M. A new Asian/North American teleconnection linking clustered extreme precipitation from Indian to Canada. Npj Clim. Atmos. Sci. 2022, 5, 90. [Google Scholar] [CrossRef]
- Wang, F.; Huang, G.H.; Cheng, G.H.; Li, Y.P. Impacts of climate variations on non-stationarity of streamflow over Canada. Environ. Res. 2021, 197, 111118. [Google Scholar] [CrossRef] [PubMed]
- Sang, Y.; Ren, H.L.; Deng, Y.; Xu, X.; Shi, X.; Zhao, S. Impacts of late-spring North Eurasian soil moisture variation on summer rainfall anomalies in northern East Asia. Clim. Dyn. 2022, 58, 1495–1508. [Google Scholar] [CrossRef]
- Touma, D.; Stevenson, S.; Lehner, F.; Coats, S. Human-driven greenhouse gas and aerosol emissions cause distinct regional impacts on extreme fire weather. Nat. Commun. 2021, 12, 212. [Google Scholar] [CrossRef]
- Chao, L.; Tian, H.; Tu, X.; Jiang, J.; Shen, K. Comparison of the Impacts of Sea Surface Temperature in the Western Pacific and Indian Ocean on the Asian Summer Monsoon Anticyclone and Water Vapor in the Upper Troposphere. Remote Sens. 2024, 16, 2922. [Google Scholar] [CrossRef]
- Gao, T.; Xu, Y.; Wang, H.J.; Sun, Q.; Xie, L.; Cao, F. Combined impacts of climate variability modes on seasonal precipitation extremes over China. Water Resour. Manag. 2022, 36, 2411–2431. [Google Scholar] [CrossRef]
- Duffey, A.; Irvine, P.; Tsamados, M.; Stroeve, J. Solar geoengineering in the polar regions: A review. Earth’s Future 2023, 11, e2023EF003679. [Google Scholar] [CrossRef]
- Li, X.; Xue, Y.; Wu, D.; Tan, S.; Cao, X.; Zhao, W. Precipitation Governs Terrestrial Water Storage Anomaly Decline in the Hengduan Mountains Region, China, Amid Climate Change. Remote Sens. 2025, 17, 2447. [Google Scholar] [CrossRef]
- Liao, T.J.; Chao, B.F. Global mean Sea level variation on interannual–decadal timescales: Climatic connections. Remote Sens. 2022, 14, 2159. [Google Scholar] [CrossRef]
- Zabihi, O.; Ahmadi, A. Multi-criteria evaluation of CMIP6 precipitation and temperature simulations over Iran. J. Hydrol. Reg. Stud. 2024, 52, 101707. [Google Scholar] [CrossRef]
- Huang, F.; Xu, Z.; Guo, W.; Feng, J.; Chen, L.; Zheng, H.; Fu, C. Relative contributions of internal variability and external forcing to the inter-decadal transition of climate patterns in East Asia. NPJ Clim. Atmos. Sci. 2023, 6, 21. [Google Scholar] [CrossRef]
- Freeman, B.G.; Miller, E.T.; Strimas-Mackey, M. Interspecific competition shapes bird species’ distributions along tropical precipitation gradients. Ecol. Lett. 2024, 27, e14487. [Google Scholar] [CrossRef] [PubMed]
- Wu, H.; Ye, X.; Du, X.; Wang, W.; Li, H.; Dong, W. Assessing groundwater level variability in response to climate change: A case study of large plain areas. J. Hydrol. Reg. Stud. 2025, 57, 102180. [Google Scholar] [CrossRef]
- Lv, F.; Sun, Y.; Wang, X.; Zhang, P. Precipitation changes and extreme drought events over the last millennium inferred from a pollen record from Moon Lake, Northeast China. Palaeogeogr. Palaeoclimatol. Palaeoecol. 2024, 640, 112089. [Google Scholar] [CrossRef]
- Xiang, Y.; Li, J.; Wang, B.; Zhu, Z. Decadal predictability of summer precipitation in Northwestern China originated from the North Atlantic Ocean. NPJ Clim. Atmos. Sci. 2025, 8, 309. [Google Scholar] [CrossRef]
- Zhou, W.; Yan, Z.; Zhang, L. A comparative study of 11 non-linear regression models highlighting autoencoder, DBN, and SVR, enhanced by SHAP importance analysis in soybean branching prediction. Sci. Rep. 2024, 14, 5905. [Google Scholar] [CrossRef]
- Salehi, S.; Barati, R.; Baghani, M.; Sakhdari, S.; Maghrebi, M. Interpolation methods for spatial distribution of groundwater mapping electrical conductivity. Sci. Rep. 2024, 14, 30337. [Google Scholar] [CrossRef]
- Han, Z.; Werner, N.; Wang, Z.; Li, X.; Yao, Z.; Zhang, Q. Miocene African topography induces decoupling of Somali Jet and South Asian summer monsoon rainfall. Nat. Commun. 2025, 16, 7172. [Google Scholar] [CrossRef]
- Xu, D.; Bisht, G.; Feng, D.; Tan, Z.; Li, L.; Qiu, H.; Leung, L.R. Impacts of sea-level rise on coastal groundwater table simulated by an Earth system model with a land-ocean coupling scheme. Earth’s Future 2024, 12, e2024EF004479. [Google Scholar] [CrossRef]
- Cao, C.; Zhu, X.; Liu, K.; Liang, Y.; Ma, X. Satellite-Observed Arid Vegetation Greening and Terrestrial Water Storage Decline in the Hexi Corridor, Northwest China. Remote Sens. 2025, 17, 1361. [Google Scholar] [CrossRef]
- Di Nunno, F.; Yıldız, M.B.; Granata, F. Decoding the architecture of drought: SHAP-enhanced insights into the climate forces reshaping the Sahel. Hydrol. Earth Syst. Sci. 2025, 29, 6043–6067. [Google Scholar] [CrossRef]
- Hao, S.; Li, J.; Mao, J.; Liu, Y.; Wu, G. Interannual variability of spring rainfall over South China in association with the North Pacific Oscillation and North Atlantic Oscillation as revealed by reanalysis data and CMIP6 simulations. Clim. Dyn. 2024, 62, 7535–7557. [Google Scholar] [CrossRef]
- Todd, V.L.; Shanahan, T.M.; DiNezio, P.N.; Klavans, J.M.; Fawcett, P.J.; Anderson, R.S.; Jimenez-Moreno, G.; LeGrande, A.N.; Pausata, F.S.R.; Thompson, A.J.; et al. North Pacific ocean–atmosphere responses to Holocene and future warming drive Southwest US drought. Nat. Geosci. 2025, 18, 646–652. [Google Scholar] [CrossRef]
- Alberti, M.; Veiga, S.F.; Chen, B.; Hu, L.; Fang, Z.; Zhou, B.; Pan, Y. The Yangtze River Delta experienced strong seasonality and regular summer upwelling during the warm mid-Holocene. Commun. Earth Environ. 2024, 5, 492. [Google Scholar] [CrossRef]
- Chen, L.; Zhu, G.; Wang, Q.Q.; Ye, L.; Lin, X.; Lu, S.; Jiao, Y.; Li, R.; Meng, G.; Wang, Y.; et al. Influence of mountain orientation on precipitation isotopes in the westerly belt of Eurasia. Glob. Planet. Change 2024, 240, 104543. [Google Scholar] [CrossRef]
- Ma, B.; Liu, X.; Tong, Z.; Zhang, J.; Wang, X. Coupled Effects of High Temperatures and Droughts on Forest Fires in Northeast China. Remote Sens. 2024, 16, 3784. [Google Scholar] [CrossRef]
- Adeyeri, O.E.; Zhou, W.; Ndehedehe, C.E.; Wang, X.; Ishola, K.A.; Laux, P. Minimizing uncertainties in climate projections and water budget reveals the vulnerability of freshwater to climate change. One Earth 2024, 7, 72–87. [Google Scholar] [CrossRef]
- Liu, C.; Wang, F.; Köhl, A.; Wang, X.; Wang, C.; Richards, K.J. Subsurface ocean turbulent mixing enhances central Pacific ENSO. Nat. Commun. 2025, 16, 2315. [Google Scholar] [CrossRef]
- Park, J.H.; Koo, J.H.; Kug, J.S.; Lee, S.J.; Sung, M.K.; Kim, J.; Chang, E.C.; Yang, Y.M.; Park, S.S.; Kwak, K.H.; et al. Arctic stratospheric ozone as a precursor of ENSO events since 2000s. NPJ Clim. Atmos. Sci. 2025, 8, 338. [Google Scholar] [CrossRef]
- Song, S.; Wang, Y.; Zhang, Y.; Zhai, Z.; Wu, Q.; Zhou, M.; Hou, S. Large-scale forcing of principal near-surface wind speed variability patterns in the Arctic since 1979. Environ. Res. Lett. 2025, 20, 064051. [Google Scholar] [CrossRef]
- Fu, Z.H.; Xi, D.; Xie, S.P.; Zhou, W.; Lin, N.; Zhao, J.; Wang, X.; Chan, J.C.L. Shifting hotspot of tropical cyclone clusters in a warming climate. Nat. Clim. Change 2025, 15, 850–858. [Google Scholar] [CrossRef]
- Liang, Y.; Gillett, N.P. Reducing uncertainty in climate projections for the mid and high latitudes of the Northern Hemisphere. Geophys. Res. Lett. 2025, 52, e2025GL117477. [Google Scholar] [CrossRef]
- Ye, P.; Zhang, Q.; Wang, J.; Liu, X.; Wei, D.; Liu, W.; Li, Y.; Huang, X.; Gan, Z. Interdecadal shifts and associated atmospheric circulation anomalies of heavy precipitation during the warm-season in the Upper Yellow River Basin over the past 40 years. Atmos. Res. 2025, 314, 107801. [Google Scholar] [CrossRef]
- Jin, T.; Zhou, Y.; Zhou, P.; Zheng, Z.; Zhou, R.; Wei, Y.; Zhang, Y.; Jin, J. Spatiotemporal Evolution of Precipitation Concentration in the Yangtze River Basin (1960–2019): Associations with Extreme Heavy Precipitation and Validation Using GPM IMERG. Remote Sens. 2025, 17, 2732. [Google Scholar] [CrossRef]
- Naibi, S.; Bao, A.; Yuan, Y.; Bao, J.; Hamdi, R.; Yu, T.; Huang, X.; Wang, T.; Li, T.; Jin, J.; et al. A Spatial Shift in Flood–Drought Severity in the Decades Surrounding 2000 in Xinjiang, China. Remote Sens. 2025, 17, 1746. [Google Scholar] [CrossRef]
- Zhou, A.; Yuan, C.; Luo, J.J.; Yamagata, T. Warming tropical Indian Ocean wets the Tibetan plateau. Geophys. Res. Lett. 2024, 51, e2024GL108989. [Google Scholar] [CrossRef]
- Song, J.; Klotzbach, P.J.; Qin, N.; Duan, Y. Recent intensification of the pacific meridional mode’s influence on the frequency of late-season western north pacific tropical cyclones. Geophys. Res. Lett. 2025, 52, e2024GL114270. [Google Scholar] [CrossRef]
- Duan, J.; Li, Y.; Lyu, Y.; Jing, Z.; Wang, F. Emergence of the North Pacific heat storage pattern delayed by decadal wind-driven redistribution. Nat. Commun. 2025, 16, 668. [Google Scholar] [CrossRef]
- Dong, X.; Zhang, X.; Zhang, H.; Zhang, Y.; Rasmussen, S.O.; Zhang, R.; Cai, Y.; Huang, S.; Kathayat, G.; Perez-Mejlas, C.; et al. Interstadial diversity of East Asian summer monsoon linked to changes of the Northern Westerlies. Nat. Commun. 2025, 16, 7765. [Google Scholar] [CrossRef]
- Zheng, J.; Wang, F. Atmospheric response to the South Pacific subtropical dipole. Clim. Dyn. 2021, 56, 1753–1765. [Google Scholar] [CrossRef]
- An, X.; Wang, F.; Sheng, L.; Li, C. Pattern of wintertime southern rainfall and northern pollution over eastern China: The role of the strong eastern Pacific El Niño. J. Clim. 2022, 35, 7259–7273. [Google Scholar] [CrossRef]
- Mu, Y.; Jones, C.; Carvalho, L.M.V.; Xue, L.; Liu, C.; Ding, Q. Pacific decadal oscillation and ENSO forcings of northerly low-level jets in South America. NPJ Clim. Atmos. Sci. 2024, 7, 297. [Google Scholar] [CrossRef]
- Li, G.; Yang, S.; Zhang, T.; Zhong, W.; Fan, K.; Ren, Q. Two distinct interannual modes of the north pacific oscillation: Role of ocean-atmosphere coupling and transient eddies. Clim. Dyn. 2025, 63, 10. [Google Scholar] [CrossRef]
- Zhang, J.; Chen, H.; Fang, X.; Yin, Z.; Hu, R. Warming-induced hydrothermal anomaly over the Earth’s three Poles amplifies concurrent extremes in 2022. NPJ Clim. Atmos. Sci. 2024, 7, 8. [Google Scholar] [CrossRef]
- te Wierik, S.A.; Cammeraat, E.L.H.; Gupta, J.; Artzy-Randrup, Y.A. Reviewing the impact of land use and land-use change on moisture recycling and precipitation patterns. Water Resour. Res. 2021, 57, e2020WR029234. [Google Scholar] [CrossRef]
- Dogar, M.M.; Watanabe, S.; Fujiwara, M.; Abid, M.A.; Habeebullah, T.M.; Khan, B. Tropical volcanic impacts on MENA climate via ENSO and NAO dynamics in a high-top model. NPJ Clim. Atmos. Sci. 2025, 8, 330. [Google Scholar] [CrossRef]
- D’olivo, J.P.; Zinke, J.; Goyal, R.; England, M.H.; Purich, A.; Corrège, T.; Zorita, E.; Scholz, D.; Weber, M.; Carriquiry, J.D. Coral Sr/Ca-SST reconstruction from Fiji extending to~ 1370 CE reveals insights into the Interdecadal Pacific Oscillation. Sci. Adv. 2024, 10, eado5107. [Google Scholar] [CrossRef]
- Wang, C.; Su, H.; Zhai, C.; Zheng, J.; Yu, S.; Mo, H.; Wang, Y.; Jiang, L. Recent slowing of Arctic sea ice melt tied to multidecadal NAO variability. Nat. Commun. 2025, 16, 8504. [Google Scholar] [CrossRef] [PubMed]


Disclaimer/Publisher’s Note: The statements, opinions and data contained in all publications are solely those of the individual author(s) and contributor(s) and not of MDPI and/or the editor(s). MDPI and/or the editor(s) disclaim responsibility for any injury to people or property resulting from any ideas, methods, instructions or products referred to in the content. |
© 2026 by the authors. Licensee MDPI, Basel, Switzerland. This article is an open access article distributed under the terms and conditions of the Creative Commons Attribution (CC BY) license.