


Abstract
Halide solid electrolytes (HSE) have shown remarkable stability against high-voltage cathodes. Some HSE, such as Li3InCl6 (LIC), can be readily synthesized via aqueous routes. Here, we expand the aqueous synthesis of LIC to include Y substitution, which has different hydration coordination strengths, to form Li3InxY1−xCl6 (LIYC, 0 ≤ x ≤1). This composition is intended to combine the high ionic conductivity of LIC with the superior stability of Li3YCl6 (LYC). We compared solution-synthesized products with those derived mechanochemically. We found that adding ammonium chloride in a 3:1 ratio to YCl3 + InCl3 produces a phase-pure product, with X-ray diffraction (XRD) revealing structure similarity for both routes. Through nuclear magnetic resonance (NMR) and impedance measurements, we evaluate how the synthesis method affects ionic transport, particularly regarding correlated motion. Despite lower initial grain boundary impedance in mechanochemical samples, full cells made from solution-synthesized samples show superior cycling performance. This work establishes a scalable aqueous synthesis route for LIYC that achieves properties comparable to traditional mechanochemical methods.
1. Introduction
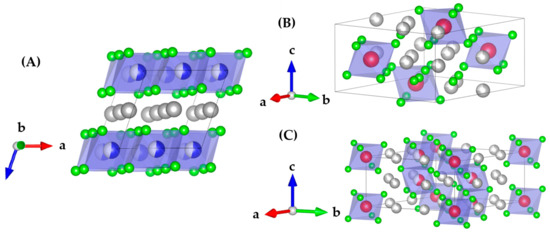
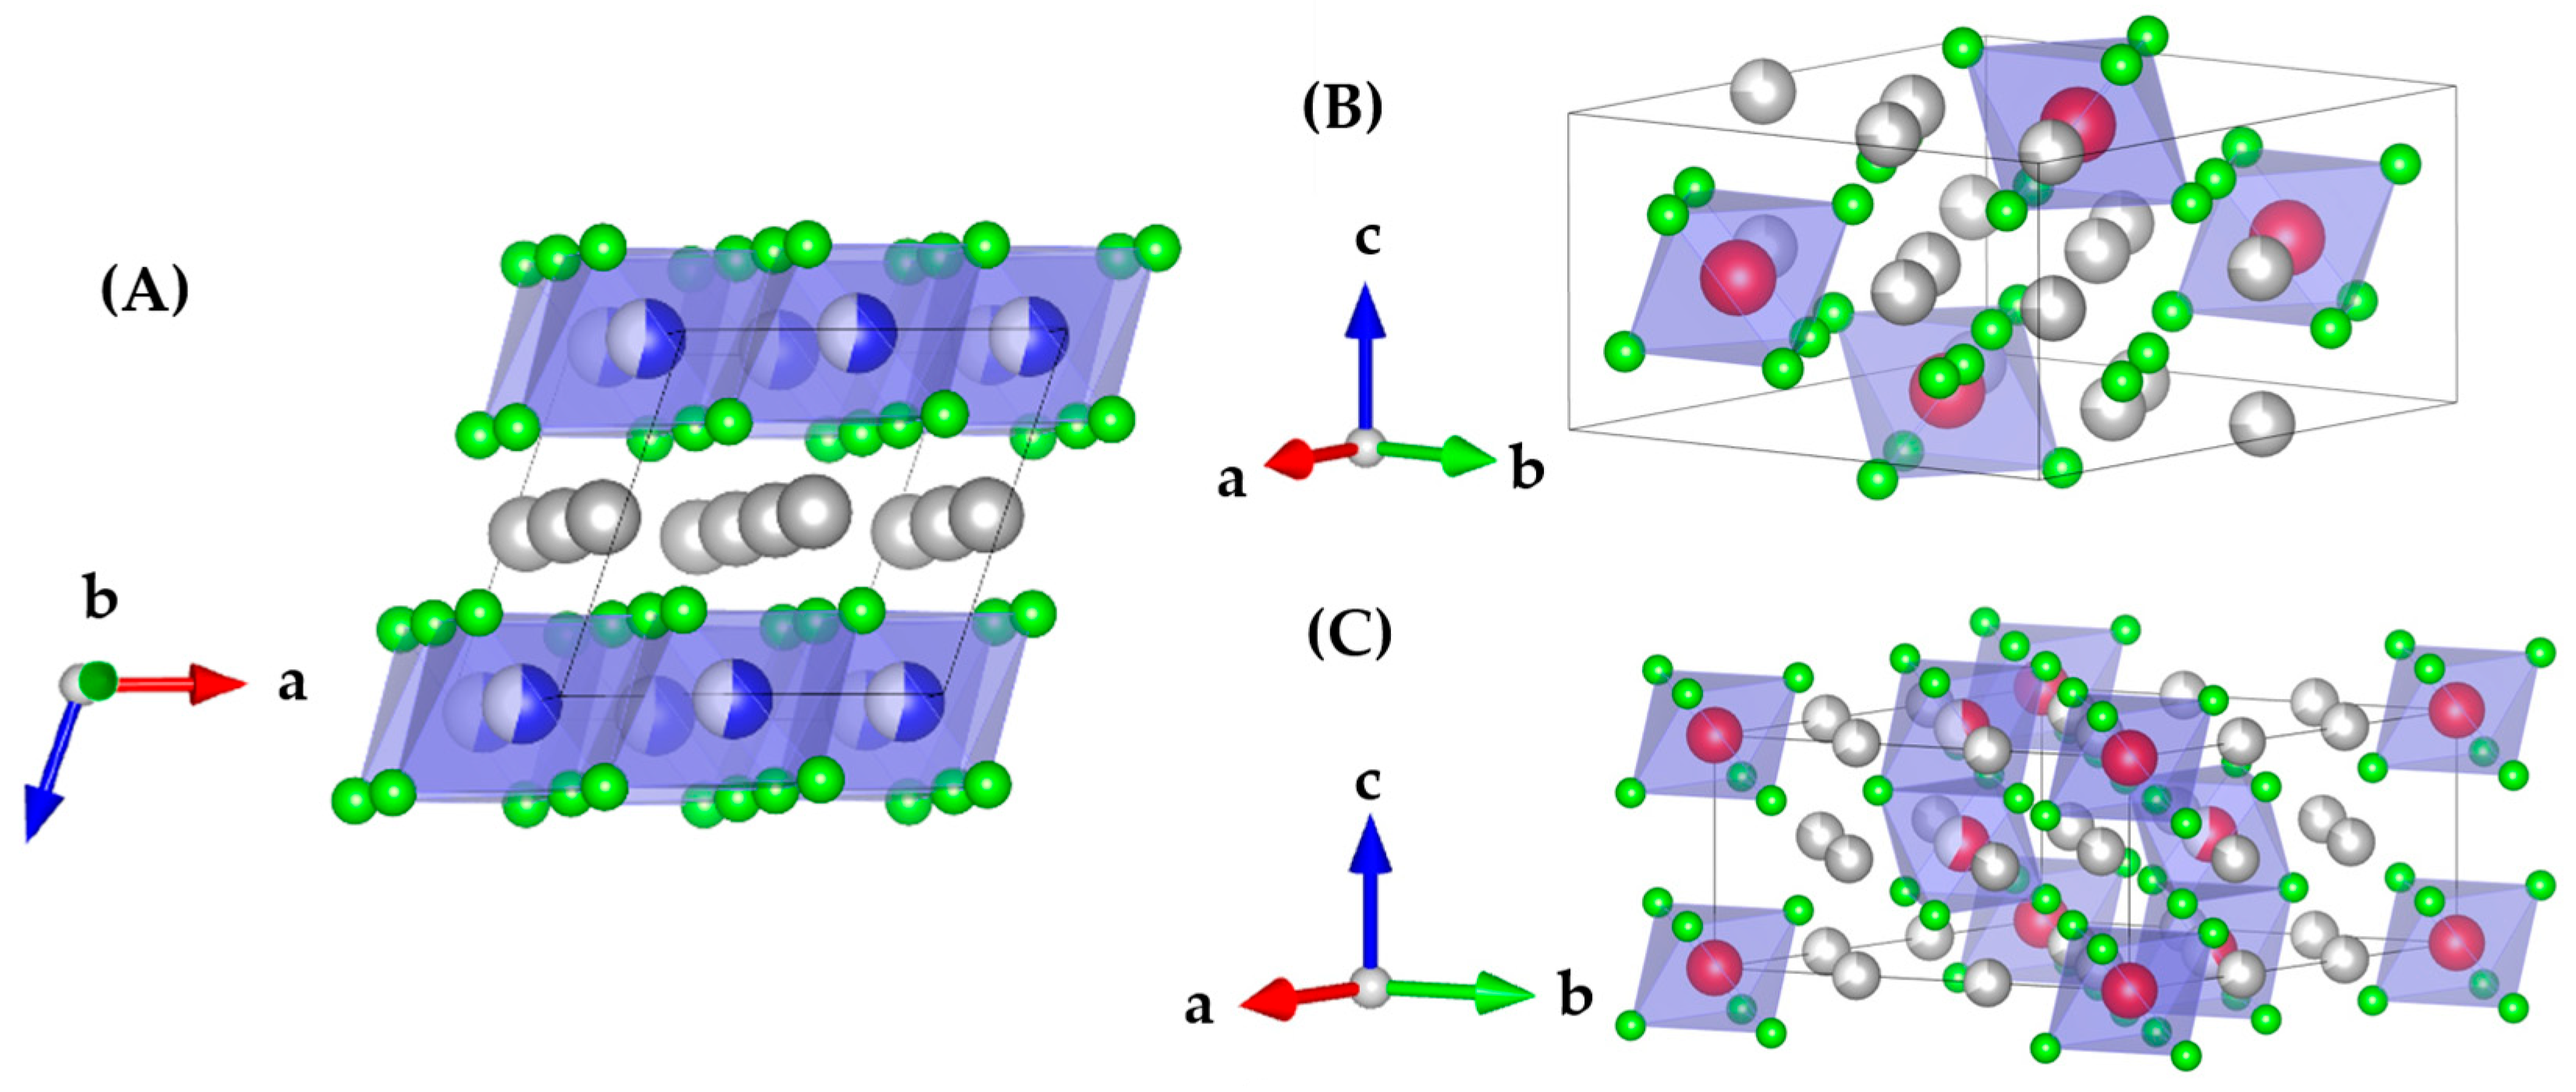
Solid electrolytes have the potential to enable safer solid-state batteries (SSBs) that are less flammable than conventional lithium-ion batteries (LIBs), which use organic liquid electrolytes. Some SSBs offer improved oxidative stability with high voltage cathodes, and limit Li metal dendrite formation thanks to their better mechanical properties and either a larger electrochemical voltage window or passivation reactions. Some halide solid electrolytes, such as LIC and LYC, can be synthesized in solution, enabling large-scale processing. Furthermore, halide solid electrolytes tend to be more stable with high voltage cathodes than sulfides, and more flexible than oxides. Electrolytes’ thermal and electrochemical stability are improved by close-packing structures. Whereas theoretical calculations indicate that close-packed sulfide and oxide electrolytes are not favorable for Li+ migration, most halide electrolytes are close-packed while benefiting from mobile Li+ ions (Figure 1). This low diffusion barrier is enabled by the monovalent halide anions bonding only weakly with Li+. Similarly, the low binding strength of halide anions with core metal ions and their high polarizability allow these materials to have superior deformability [1].
Figure 1.
Representative crystal structures of: (A) monoclinic LIC, (B) orthorhombic LYC, and (C) trigonal LYC phases. Blue octahedrals represent the MCl63− polyanions; white spheres are Li; green spheres are Cl; blue spheres are In; red spheres are Y.
Since Asano et al.’s 2018 breakthrough [2] in the first reported halide solid electrolyte with ionic conductivity greater than 1 mS cm−1, there has been significant research focused on understanding their conduction mechanisms and other relevant properties. Stainer et al. have recently investigated the ion dynamics in LIC synthesized via aqueous dissolution-precipitation and ball-milling [2]. While LIC can be easily synthesized in water and shows promise for large-scale processing, it suffers from poor stability with cathodes. LYC is more stable and has demonstrated good cycling performance using LiIn alloy anode [3,4,5]; however, LYC achieves an ionic conductivity of ~0.1 mS·cm−1 when synthesized using high-energy ball milling. Here we report on the similarities and differences between synthesizing Li3InxY1−xCl6 (LIYC) through milling and water routes, with different Y and In ratios, and how it impacts the structure–property correlations, i.e., ionic conductivity and cathode cycling stability. Aliovalent doping with elements such as Zr4+, Hf4+, and Nb5+ can maintain the parent structure while increasing both the charge carrier concentration and the disorder, which effectively boosts the ionic conductivity [6,7,8,9]. However, the aqueous synthesis of these phases, even in the presence of ammonium chloride, is prevented by overly stable metal–oxygen bonds. Similarly, other recent oxyhalide solid electrolytes (SEs) [10,11,12,13,14,15] show very promising performance but rely on high-energy ball-milling to reach a highly disordered phase, challenging their mass production.
We hypothesized that combining Y and In in LIYC could yield a solid electrolyte that balances stability with high-voltage cathodes and benefits from the high conductivity of the LIC monoclinic structure. This report examines the aqueous synthesis of mixed metal ion LIYC. In our previous report investigating LYC synthesis [16], we showed that in order to synthesize LYC, it is necessary to form an ammonium chloride complex intermediate species and that grain boundary differences arise from the synthesis routes.
In a water solution of YCl3 without ammonium chloride, Y3+ is coordinated by eight H2O at the vertices of a cube [17]. These local clusters arrange themselves in a cubic face-centered close-packed fashion, with non-coordinated Cl− anions accommodated in the free spaces of the lattice [18]. This coordination is drastically different from InCl3 solutions, which form octahedral InCl63− complexes. The addition of ammonium chloride increases the Cl− activity, shifting Y3+ speciation to the hexachloride, and stabilizes the (NH4)3[YCl6] monoclinic C2/c intermediate at low hydration level [16,19].
Synthesis from water would drastically reduce costs in terms of synthesis and processing, as well as recycling. These cost-saving factors are thought to aid in offsetting the raw material cost of In and Y. While the sourcing cost of metal salts varies according to the purity and hydration, we can estimate it from a bulk anhydrous source (upper limit) and the main, most unrefined ore source (lower limit). The average price of Y2O3 has fluctuated between $3 and $12/kg over the past 5 years [20]. Indium is only found as a byproduct of Zn ore processing. It is coextracted with Zn and S from sphalerite and the 2024 average cost of 99.99% In metal was $340/kg [21], about 10 times more expensive than Y ($33/kg in 2024). An estimate provides a cost of $596/kg and $320/kg for bulk InCl3 and YCl3, respectively, and of $1030/kg and $75/kg for their hydrated counterparts [22,23]. Thus, YCl3∙6H2O may be used to further reduce synthesis cost from solution, but based on the cost of reactants, anhydrous InCl3 is more indicated than InCl3·4H2O to synthesize the LIYC compounds. This is because the anhydrous compound is made by direct chlorination from In metal, while YCl3∙6H2O is synthesized from Y2O3 in a solution of hydrochloric acid, further refined to YCl3 if required through ammonium coordination and dehydration. Given that Lithium Nickel Manganese Cobalt Oxide (NMC) is insoluble in water, recycling of the spent trivalent metal center, halide-based solid electrolytes introduced here may be designed based on selective dissolution in water, followed by appropriate post-treatment such as mild annealing or freeze drying to recover the optimal grain size and ionic conductivity [24,25]. Such recycling would be less energy intensive than the current techniques designed for liquid electrolyte batteries using pyro- or hydro-metallurgical methods.
2. Materials and Methods
2.1. Synthesis
The LIYC solid electrolytes were synthesized from anhydrous LiCl (Sigma-Aldrich 99%, 793620, St. Louis, MO, USA), InCl3 (Thermo Scientific 99.99%, 041977.18, Watham, MA, USA), and YCl3 (Sigma Aldrich 99.99%, 451363) that were stored in an Ar atmosphere. Based on the stoichiometric amounts, 10 wt% excess InCl3 and YCl3 were added to offset the losses during grinding of the mixed precursors because the rare earth halide salts stick to the agate mortar [26]. To compensate for partial hydration based on thermogravimetry analysis (TGA) determination (Figure S1), an additional 4.4 wt% of YCl3 has been added, making the total YCl3 excess 14.4 wt%. For instance, in the case of an equimolar amount of Y and In and a 5 g target sample mass, 1.81 g (8.20 mmol) and 1.66 g (8.52 mmol) of InCl3 and YCl3, respectively, were added instead of 1.65 g and 1.45 g (7.45 mmol of both) without excess.
In the case of the mechanochemical-annealed (MCA) route, the precursors and Y-stabilized ZrO2 balls (5 mm diameter) were loaded into a 40 mL Retsch milling jar in a media-to-powder mass ratio of 20:1. We pre-mixed the precursors at 100 rpm for two times 5 min with direction reversal, then milled the mixture at 500 rpm for two times 24 h cycles and scraped the wall of the jar in between cycles with a planetary mill (Retsch PM 200, Retsch GmbH, Haan, Germany). The samples were then pelletized at 632 MPa, placed in alumina vessels covered with a lid, and annealed at 500 °C for 0 ≤ x ≤ 0.5 or 350 °C for 0.5 < x ≤ 1 for 5 h in a box furnace within an Ar-filled glovebox.
In the case of the water-based (W) route, the precursors were added to a flask and dissolved in 18 MΩ water (40 mL for 5 g of precursors) and sonicated at 60 °C for 30 min. The ammonium coordinated samples (AC) were prepared in the same stoichiometric amounts as MCA ones, but NH4Cl (Sigma Aldrich 99.5%, A4514) was added to the AC samples in a 1:3 ratio to YCl3. The unbound water was removed through Rotovap (BÜCHI Labortechnik AG, Flawil, Switzerland) at 60 °C before drying overnight at 150 °C under a dynamic vacuum. In an Ar atmosphere, the product was ground with a mortar and pestle, pelletized, placed in an alumina combustion boat, and annealed at 500 °C for 5 h under an active vacuum in a quartz tube furnace. The pure In sample was annealed at 350 °C.
2.2. Characterization
2.2.1. X-Ray Diffraction
The XRD samples were placed in an airtight knife-edge Rigaku (Akishima, Japan) sample holder under an argon atmosphere. Spectra were measured using a Smartlab (Rigaku Corporation, Akishima, Japan) (38 kV, 30 mA) and a Cu Kα source, collecting data at 1.5°/min. The Rietveld refinement was performed using Highscore Plus v3.0 (Malvern Panalytical, Almelo, The Netherlands).
2.2.2. Impedance Spectroscopy
The LIYC samples were pelletized at 8 T for at least 1 min in a 12.7 mm die set with 18 µm thick carbon-coated aluminum symmetric blocking electrodes. The conductivity of the material was determined by electrochemical impedance spectroscopy (EIS) measurements, which were carried out with a 10 mV excitation amplitude between 7 MHz and 1 Hz using a VSP potentiostat (Biologic, SP-240, Bio-logic Science Instruments, Seyssinet-Pariset, France). The EIS spectra of LIYC were fitted using a ZARC equivalent circuit using a loop made of a constant phase element (CPE) Qgb describing space charging and a resistor Rgb for the grain boundaries; in series with a resistor Rion englobing lattice ionic resistance and ohmic losses, and another QSS for the contact capacitance in the absence of diffusion (stainless steel blocking electrodes). The associated capacitance C to R/CPE loops can be calculated from:
where Q and α are the CPE parameters.
The ionic conductivity in a crystalline material can be modelled by the Arrhenius equation:
where , , and T are respectively the temperature-independent Arrhenius pre-factor, the Boltzmann constant, and the absolute temperature. represents the frequency of lithium hopping events at a standard carrier concentration within the solid ionic conductor. We used Equation (4) to fit the temperature-dependent impedance measurements.
2.2.3. Thermogravimetry Analysis
A TA instruments TGA Q500 (New Castle, DE, USA) was used to measure the TGA of YCl3. The sample was loaded into aluminium pans and heated to 350 °C at a heating rate of 5 °C/min under a nitrogen flow of 50 mL/min.
2.2.4. Nuclear Magnetic Resonance
7Li static NMR spectra and pulsed field gradient-NMR were recorded using a Bruker Avance Neo 400 MHz narrow bore spectrometer (Bruker Corporation, Billerica, MA, USA) equipped with a Diff50 high gradient 1H/X diffusion probe (Bruker Corporation, Billerica, MA, USA). All NMR measurements were conducted with temperature control using the built-in variable temperature module and samples were equilibrated for at least 5 min at specified temperatures prior to the collection of data.
Self-diffusion coefficients for the Li+ cation were obtained using the pulse-gradient stimulated echo (PGSTE) experiment on the 7Li nucleus. The Stejskal-Tanner equation (Equation (3)) was used to fit the integrated peak area as a function of the gradient strength (g) [27].
In Equation (3), A0 is the peak area at zero gradient (g = 0), A(g) is the peak area at gradient g, γ is the gyromagnetic ratio of the nucleus, δ is the gradient pulse duration, Δ is the diffusion time between gradient pulses, and D is the self-diffusion coefficient. The values of the adjustable parameters (g, δ, and Δ) were selected to achieve ≥85% signal attenuation in at least 16 gradient steps. The fits of the signal data were performed by exporting the data from Bruker’s Topspin v. 3.6.4 software and fitting a monoexponential decay in Origin 2024.
The Nernst-Einstein Equation (6) relates the microscopic property of diffusion to the macroscopic ionic conductivity . We use it to estimate an equivalent ionic conductivity from NMR. The inverse Haven ratio in (7) is a useful metric to compare to .
where n is the concentration of Li+ in the unit cell and the diffusion measured through NMR. Given that the NMR diffusion measurements were conducted at a higher temperature, we extrapolated the values at lower temperatures using the Arrhenius relationship.
2.2.5. Scanning Electron Microscopy (SEM)
SEM pictures of the powder samples were collected using a Hitachi TM3030 Plus tabletop microscope (Hitashi High-Tech Corporation, Tokyo, Japan) with a 15 kV beam and mixed backscattered electrons (BSE)/secondary electrons (SE) mode. In a glovebox, the samples were deposited on carbon-coated tape prepared on a holder made of aluminum, then brought to the SEM in a Mason jar and quickly loaded into the microscope for observation.
2.3. Cycling
2.3.1. LIYC Downsizing Treatment
300 mg of W LIYC (x = 0.1, 0.3, 0.5) powders were loaded and ball-milled into ZrO2 pots containing ZrO2 balls (12 mm and 3 mm dia.) with a planetary ball mill (Retsch GmbH, Haan, Germany) at 100 rpm for 60 min. The LIYC synthesized by ball-milling was used in the cells without further downsizing treatment.
2.3.2. Cell Preparation
First, 50 mg of Li6PS5Cl (LPSCl) was used as a separate layer to construct a stable anode–electrolyte interface, by adding the powder into a PEEK cell (0.5-inch dia.) and pressing at 79 MPa for 1 min. Then, 100 mg of LIYC was added and pressed the same way. The composite cathode powder was prepared by mixing sc-NMC811, LIYC, and vapor-grown carbon nano-fibers (VGCF) at a mass ratio of 50:47:3. Approximately 12.7 mg of the composite cathode powder was evenly dispersed on the LIYC side of the pellet and then pressed at 395 MPa for 15 min. A piece of Cu foil coated with 40 μm Li was then added at the surface of the Li6PS5Cl and pressed at 79 MPa for 30s. Galvanostatic cycling of the cells was carried out at the same pressure, in the voltage range of 2.6–4.2 V (vs. Li/Li+), starting with two formation cycles at C/10, followed by cycling at C/3 (1C = 200 mAh·g−1) using a Neware battery cycler (Shenzhen, China) at 30 °C.
3. Results and Discussion
3.1. Synthesis and Phase Evolution
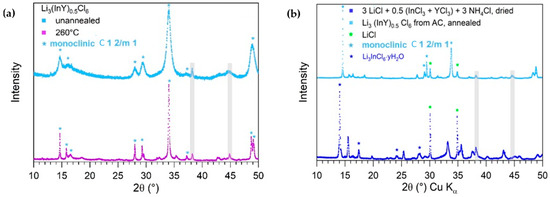
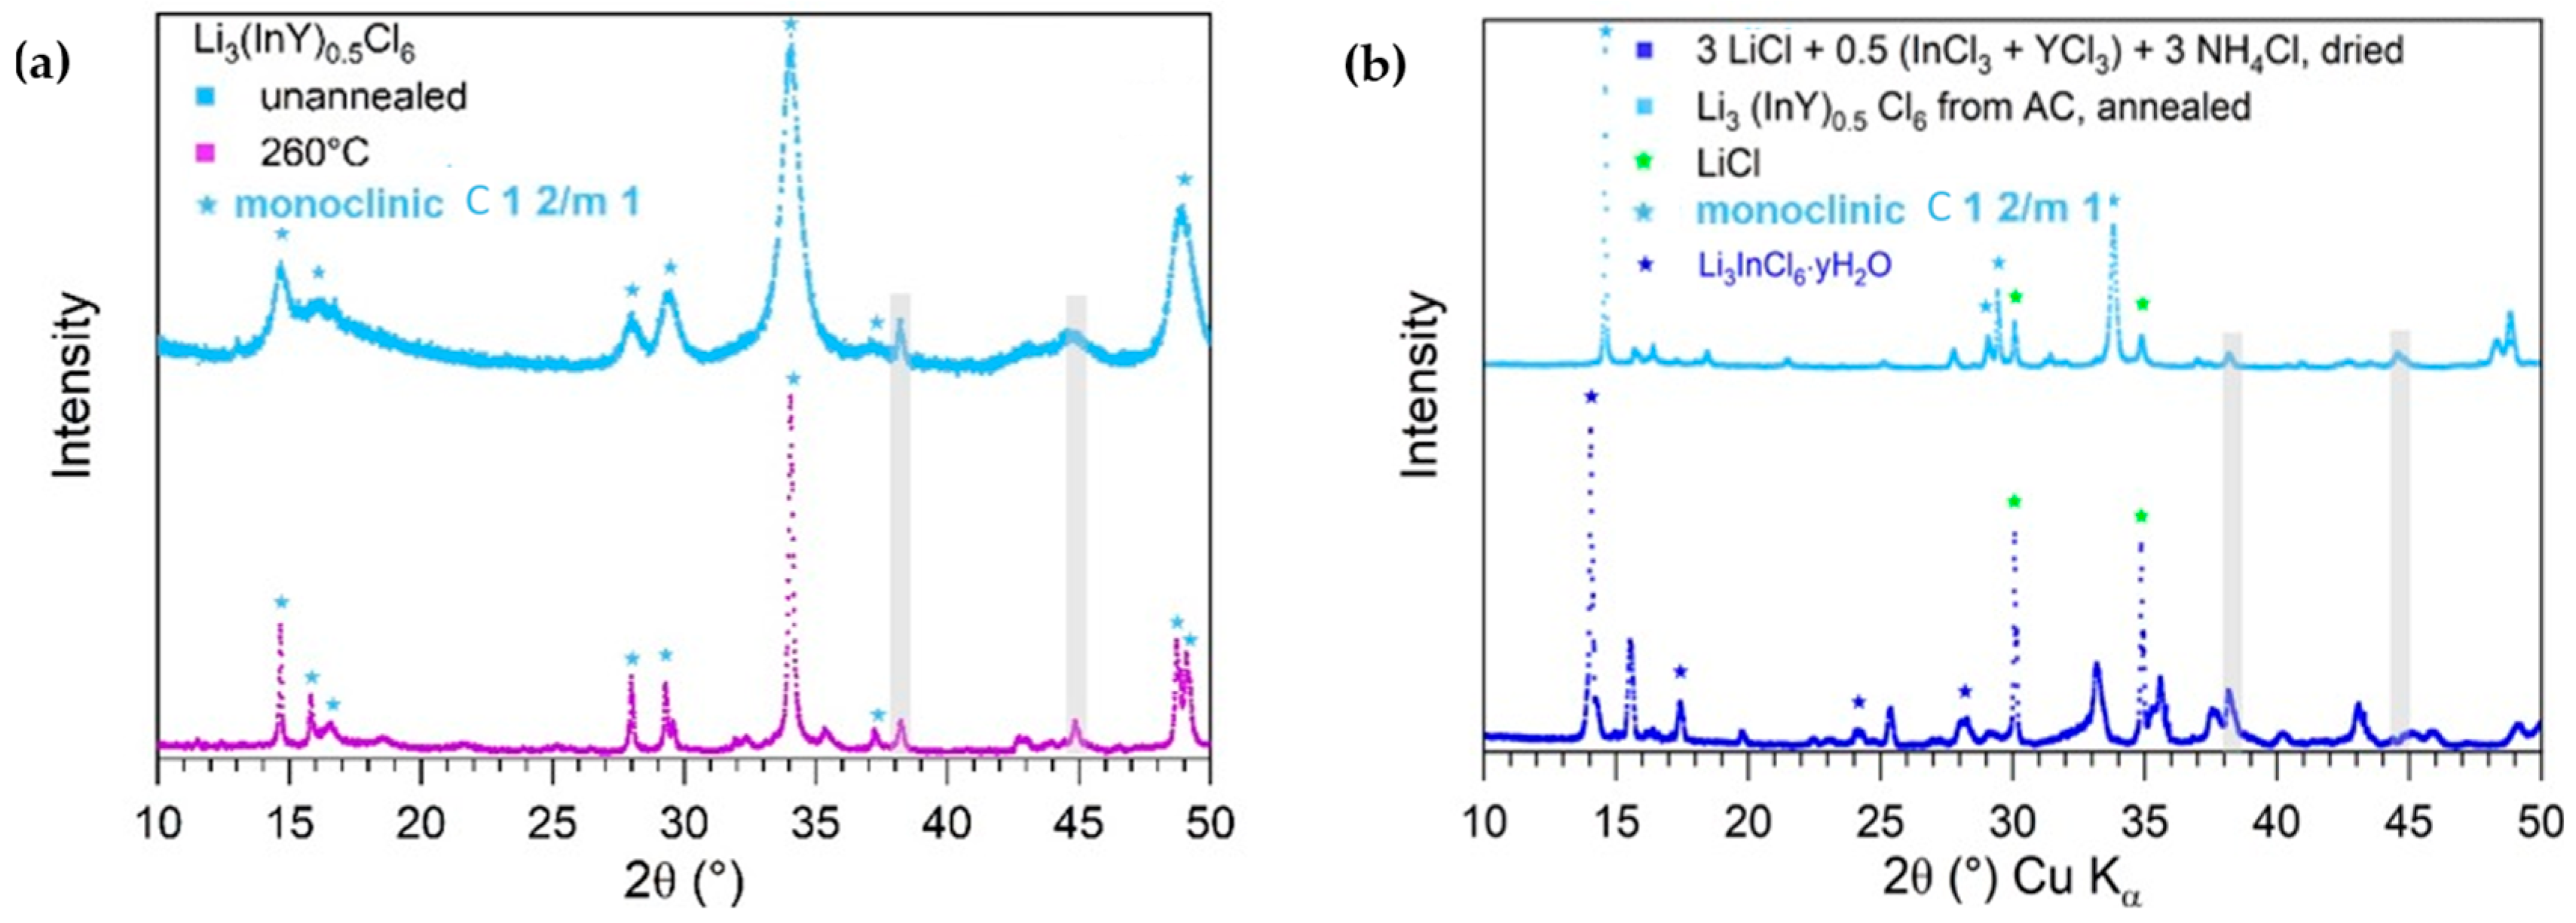
The structure of LIC is monoclinic; however, LYC can exist as two different structures, trigonal or orthorhombic, as shown in Figure 1. The XRD patterns of the sample with x = 0.5 in Figure 2 mostly reveal a product with single monoclinic C 1 2/m 1 close to the base LIC structure, with trace amounts of LiCl. The broad peaks of the as-prepared sample show a more disordered material, whereas the annealed sample at 260 °C has sharper features due to it becoming more ordered.
Figure 2.
X-ray diffraction spectra of Li3(InY)0.5Cl6 at intermediate and final stages of the (a) MCA and (b) W syntheses. Reflections from the metal sample holder are highlighted in grey.
To synthesize LIYC from water (W LIYC), the stoichiometric amount of NH4Cl needed to be added in a 3:1 ratio to YCl3 + InCl3, suggesting that an InCl3(NH3)3 complex is formed [28]. It is likely that the higher ionization potential of In compared to Y causes the negatively charged Cl− to form more stable bonds with In, causing a lack of NH4Cl around Y and hydrolysis of YCl3 if the ratio of NH4Cl to metal center is lower than 3. Having excess NH4Cl on a per YCl3 + InCl3 basis does not seem to change the product structure; rather, it lowers its final total ionic conductivity, and Sheng et al. also found lower phase purity [28]; see Figures S2 and S3 for more details on the effect of the NH4Cl amount on W LIYC. The W LIYC was also synthesized in two steps, with the first being the removal of the bulk solvents, and the second being the annealing step that locks in the product structure and removes the ammonium chloride. Figure 2b shows that the removal of the bulk solvent from Li3(InY)0.5Cl6 results in an intermediate hydrated monoclinic structure we previously investigated [29] and revisited by Wissel et al., with characteristic reflections at 14, 16, 17, 24, and 28° 2θ [30]. We are not observing the ammonium yttrium chloride hydrated intermediate from our previous report. The material prepared via the ammonium coordinated (AC) route has more pronounced LiCl features around 30 and 35°. The trend of the relative intensities of the peaks around 14 and 34° for the annealed is inverted compared to the milled samples; the monoclinic peak around 14 is much taller in the AC sample. The final product has no reflections of the intermediate phase and is similar to the MCA sample.
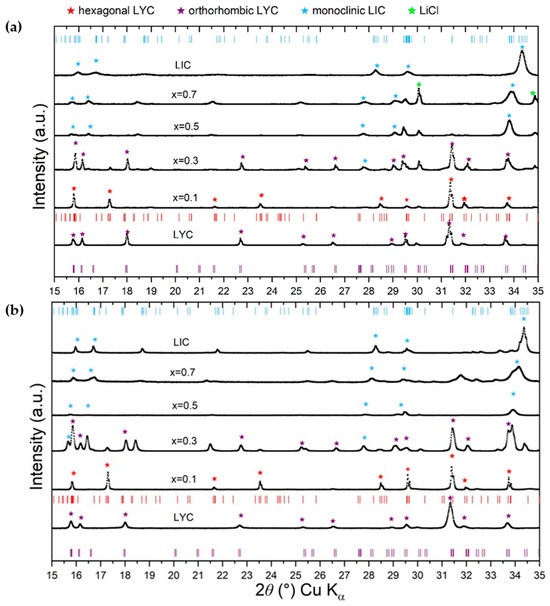
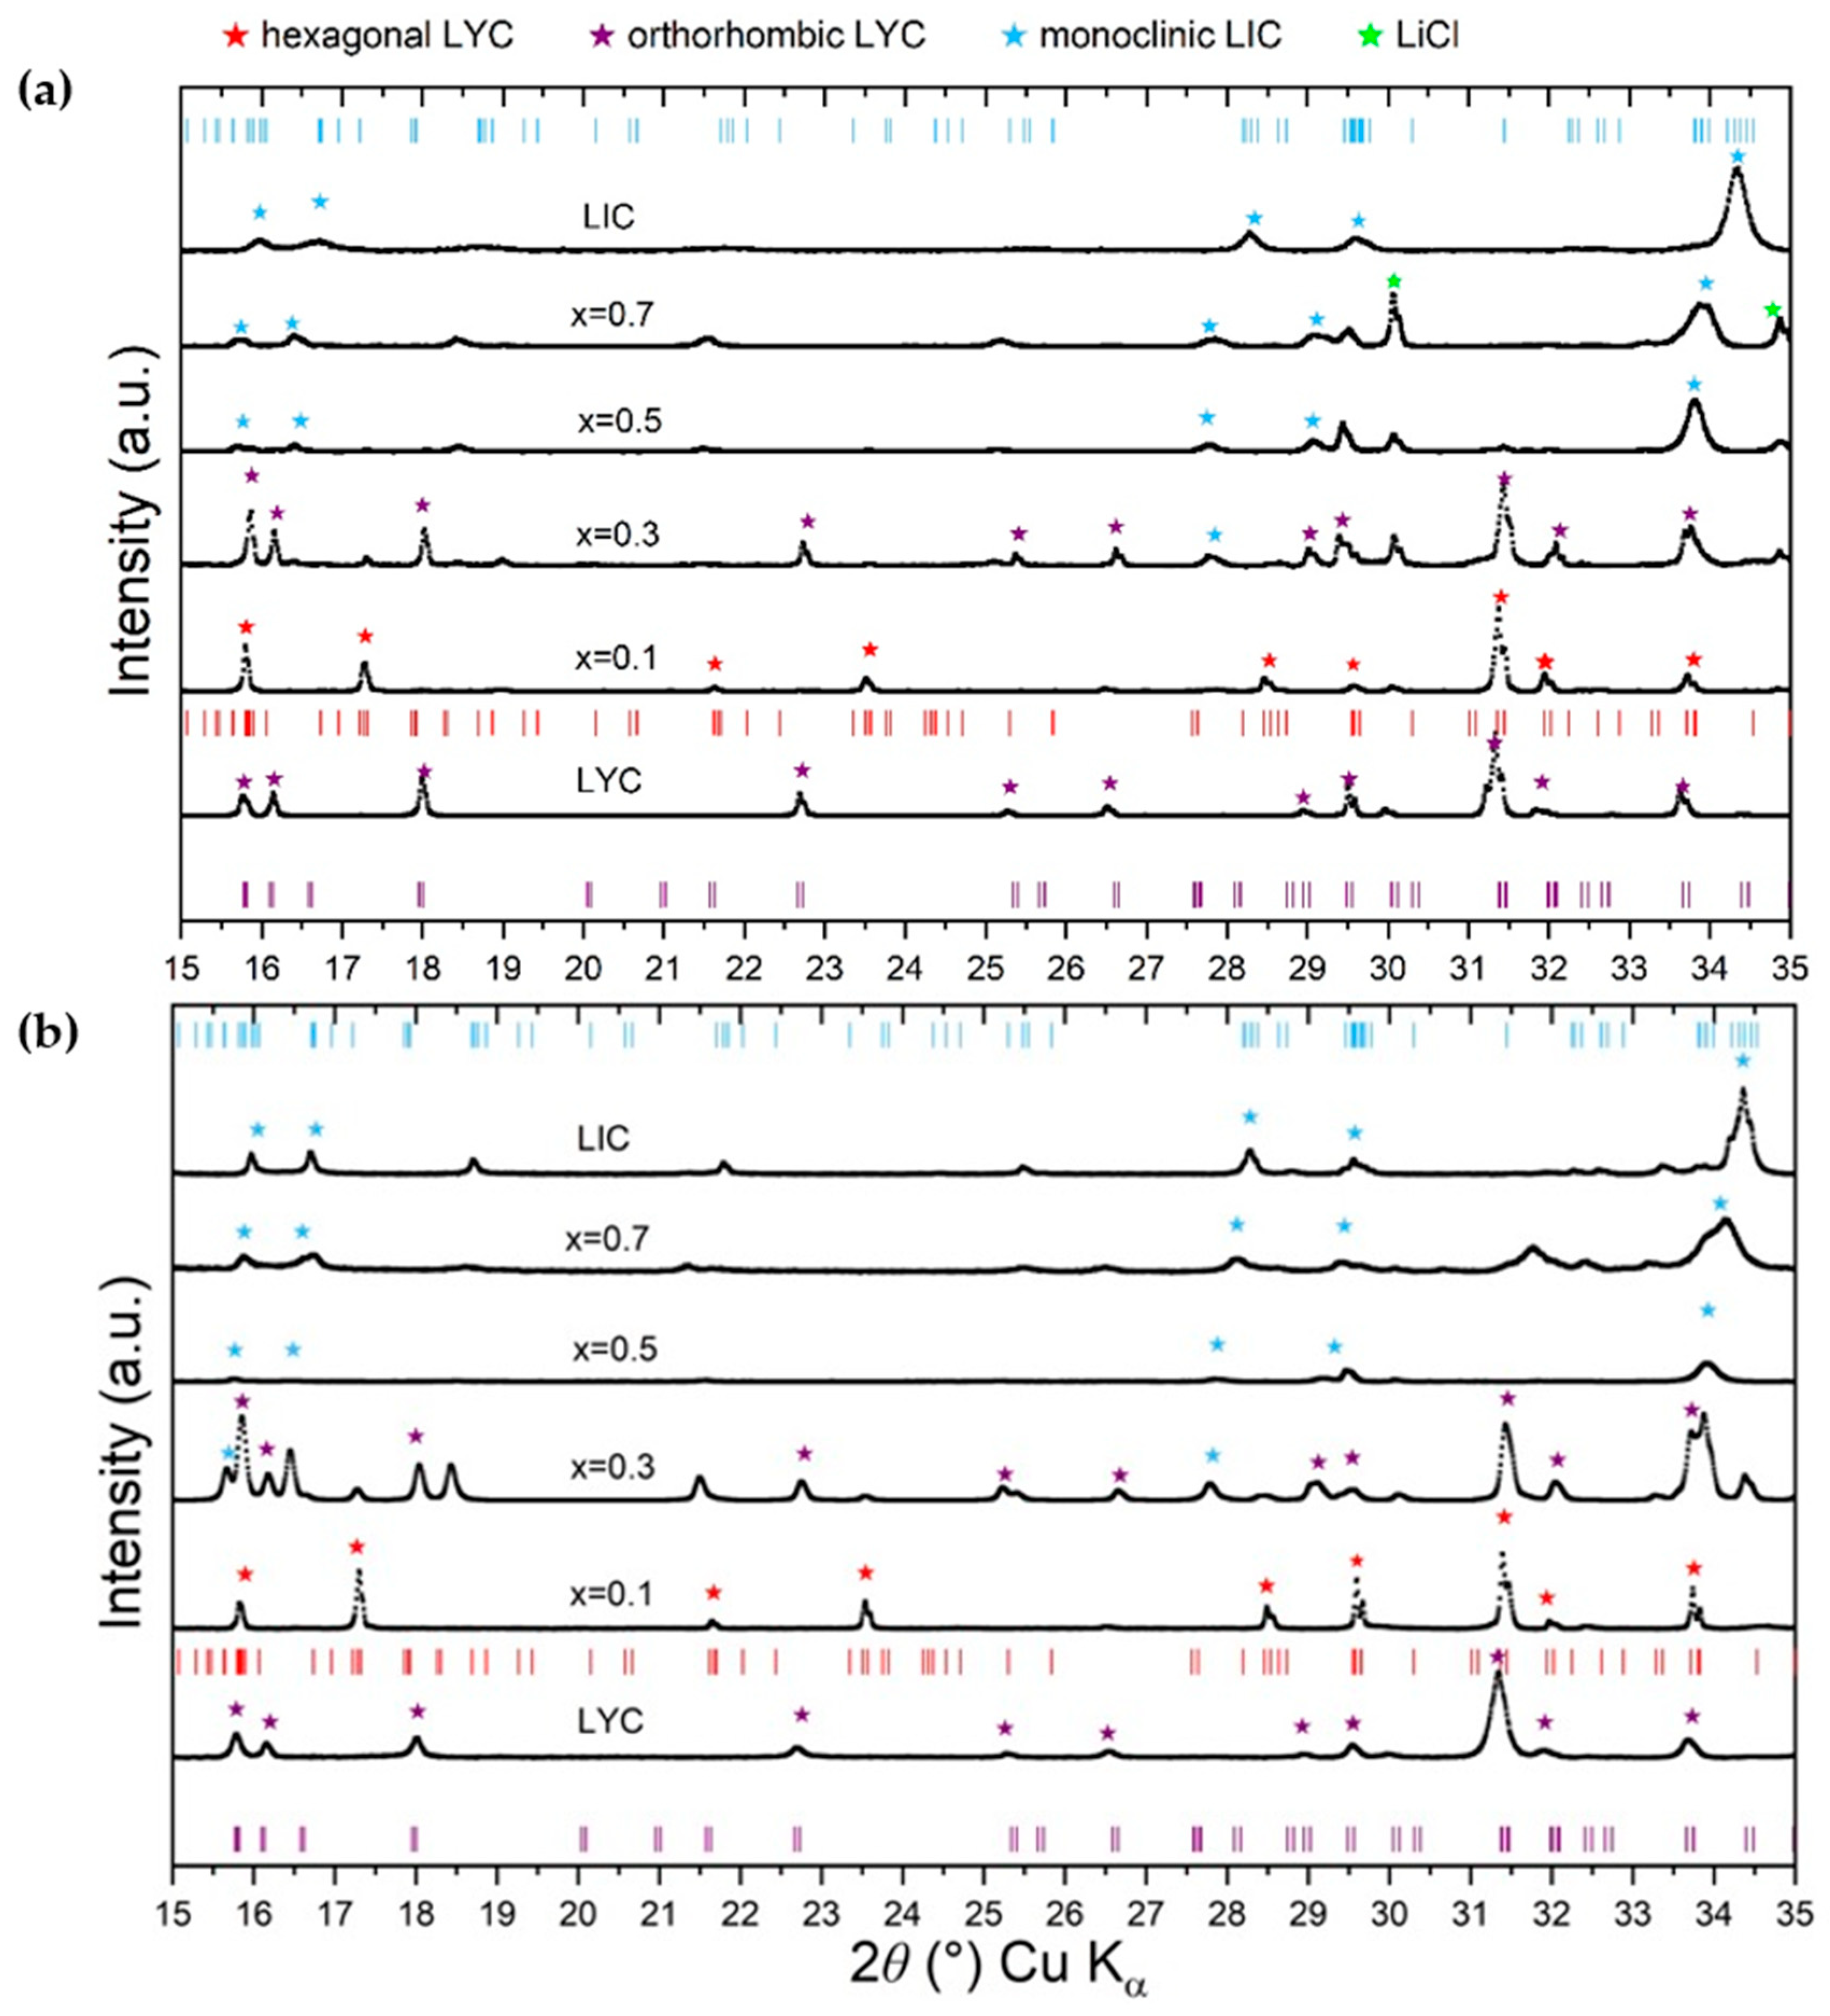
The XRD reflections show a similar structural trend for MCA and W samples in Figure 3. Overall, the size of the unit cell of the monoclinic cell increases with increasing x from 427 Å3 for MCA LIC to 448 Å3 for Li3In0.3Y0.7Cl6, and from 425 for W LIC to 444 Å3 for Li3In0.5Y0.5Cl6, reflecting the larger ionic radius size of Y replaced into the structure. W Li3In0.3Y0.7Cl6 has four different phases; therefore, the volume of the monoclinic phase being close to x = 1 may hint at nearly pure LIC phase with Y being entirely absorbed by the hcp phases. The orthorhombic phase also sees a slight volume increase from 875(.5) Å3 for MCA Li3In0.3Y0.7Cl6 to 876 Å3 for LYC, and from 869 to 878 Å3 for W LIYC, due to the decrease of In content in the structure. In the MCA sample, the Y substitution in the monoclinic phase in Li3In0.3Y0.7Cl6 is more important, and the In substitution in the orthorhombic phase is less pronounced. For more details, the reader is referred to Figures S4 and S5 and Tables S1–S12. The impurity amount and unit cell volume are detailed in Figure S6. The samples from x = 1 to x = 0.5 exhibit mostly monoclinic phase with characteristic LIC peaks around 16, 16.5, 28, 29.5, and 34.5° 2θ. These peaks shift to the left with increasing Y content, pointing to an increasing size of the unit cell, consistent with a substitution of In by Y, which has a greater atomic radius. The W Li3In0.7Y0.3Cl6 sample has LiCl peaks around 30 and 35°, maybe due to the trade-off between the lower melting point of LIYC with increasing In content and the necessity to anneal at 500 °C to remove the ammonium chloride. As x decreases, there are smaller and fewer secondary features indicating increasing disorder. For x = 0.3 and x = 0.1, the reflections correspond mostly to an orthorhombic LYC phase, whereas Li3In0.1Y0.9Cl6 has a trigonal LYC phase. Both phases have some similar reflections but can be unambiguously distinguished and matched to the appropriate samples because the low-angle region shows some key differences: two peaks around 16 and 17.4° for the trigonal phase, whereas the orthorhombic phase has two twin peaks around 16° and one peak around 18°, along with a multitude of different smaller features between 20 and 32°.
Figure 3.
Comparison of X-ray diffraction patterns of LIYC. (a) W samples (b) MCA samples. Tick marks denote the reference patterns for each material by color.
Modelling the ions constitutive of LIYC with charged spheres, their stacking can assume only three categories with the following sites occupation: trigonal and orthorhombic hexagonal close-packed (respectively hcp-T and hcp-O), and monoclinic cubic close-packed (ccp-M). Sun et al. infer a correlation between the transition metal radii, charges, and the final structure of the halide compounds of the form LiaMXb, with M being one or more metal centers and X a halide [31]. The interaction between the cation and anion frameworks determines the final symmetry of the material.
The ionic potential I indicates how strong the electrostatic attraction is between ions carrying opposite charges. I is described as the quotient of a cation charge (z+) divided by its radius (r+). In a molecule, φ equals the ionic potential of a species times its stoichiometric number. Sun et al. explain how, for LiaMXb, the cationic polarization factor τ would predict the crystal structure [31].
where is the stoichiometric ionic potential of Li+, is the sum of the stoichiometric ionic potential of the metal centers, and that of the halide anions.
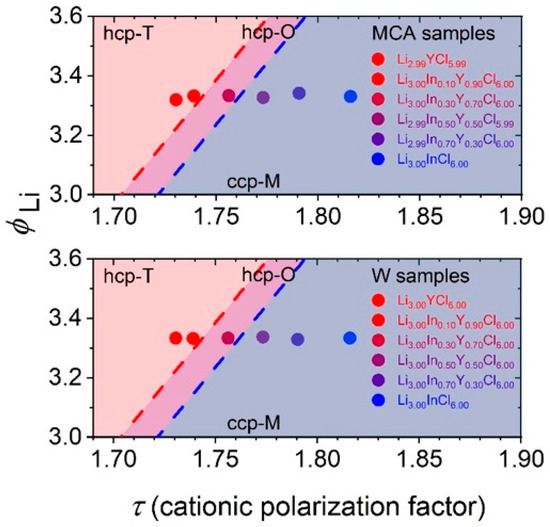
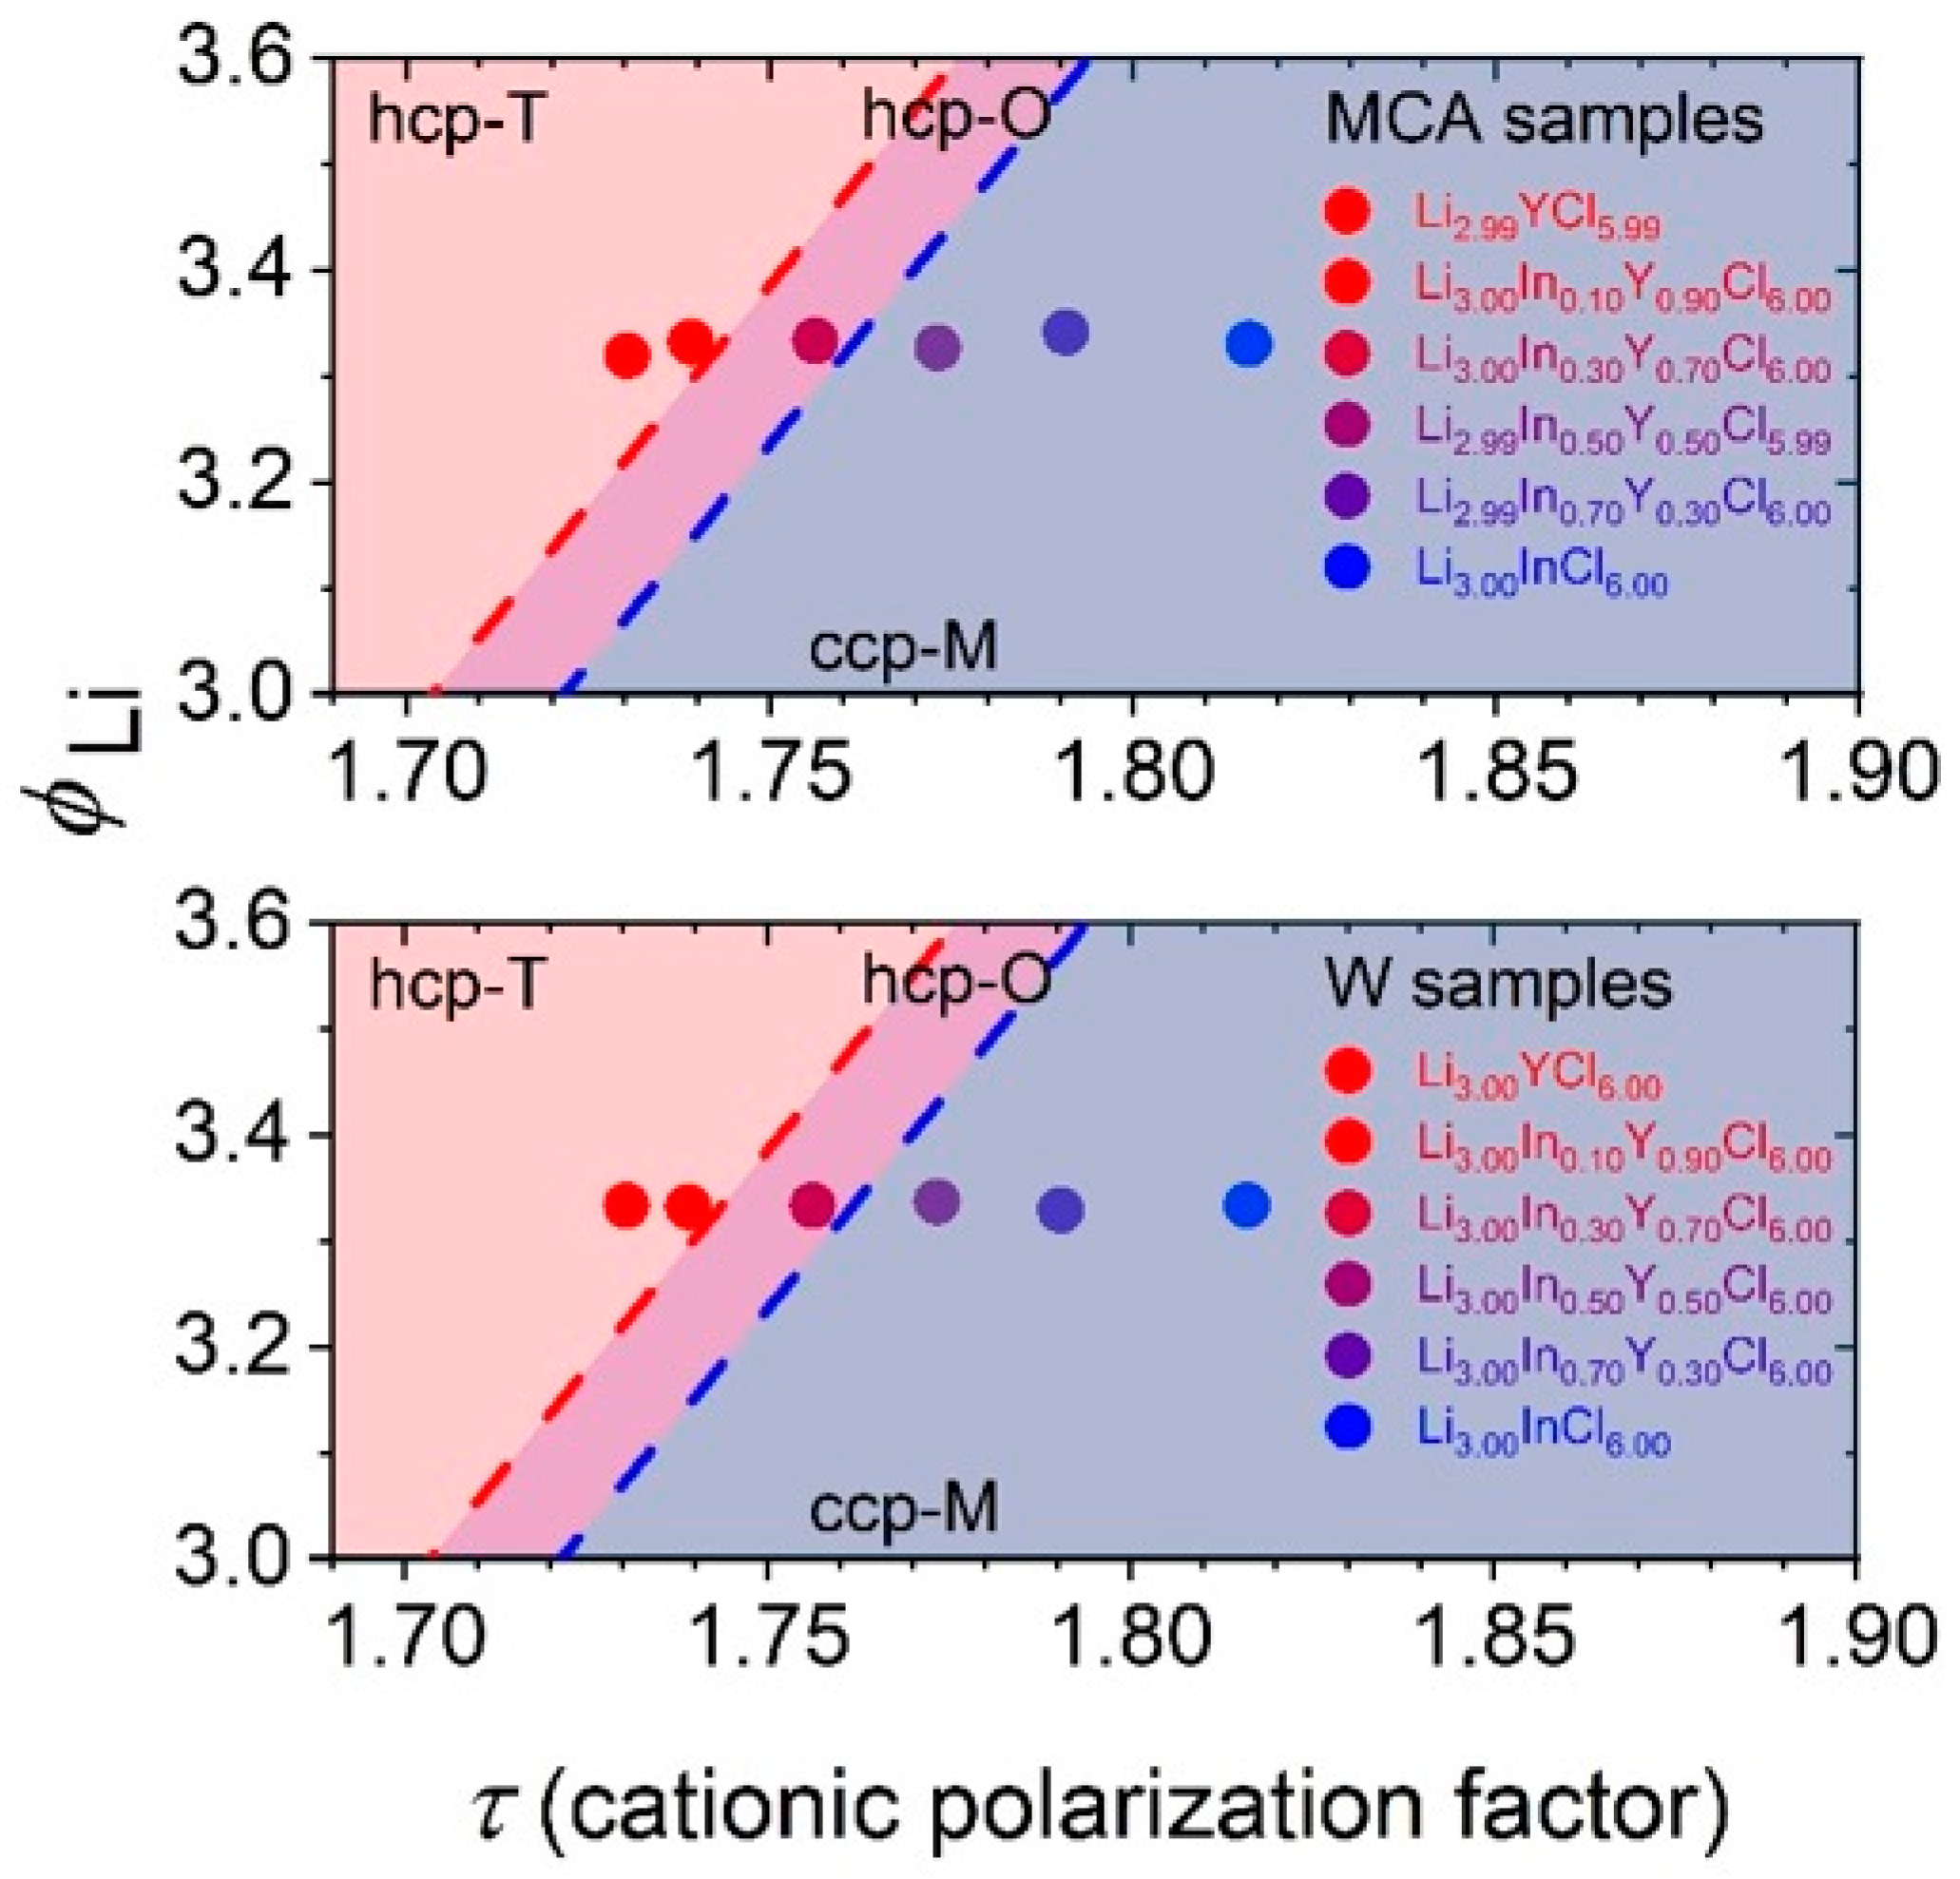
When τ is large, the cations have a weaker impact on the halide anions, and the high symmetry arrangement is favored (ccp-M). As τ decreases, the relative polarizing power of cations increases and distorts the symmetry, forcing the anions to shift from a ccp arrangement into a less symmetric hcp arrangement. In the case of Li3InxY1−xCl6, τ ≲ 1.74 would correspond to trigonal compounds, 1.74 ≲ τ ≲ 1.76 to orthorhombic, and 1.76 ≲ τ to monoclinic. However, our findings nuance this ionic potential model, as can be seen in Figure 4. In this model, the ionic potential for LYC is ≈1.73, making it belong to the trigonal region, whereas we observe the orthorhombic structure, as in their initial report on LYC [32]. Figure S6 shows that errors due to moisture determination cannot account for the discrepancy between the predicted hcp-T LYC phase and the observed hcp-O. Moreover, the ionic radius considered for Y in the model seems appropriate since x = 0.1 has a trigonal structure [32]. Thus, there are other parameters regulating the structure of Li3MCl6. That said, we obtained the same product trend via different synthesis routes, suggesting that the synthesis temperature, dwell time, and cooling rate are the main drivers. For example, Ref. [32] reports an orthorhombic structure for MCA LYC with 260 °C annealing temperature for 5 h, as does Meyer et al. [33] when melting at 650 °C and slowly cooling at 1 °C/min, and Lutz et al. when melting between 500 and 600 °C and using the Tamman-Stöber cooling technique to produce large crystals. Banik et al. report the trigonal phase for LYC when synthesizing at 550 °C, maintaining the temperature for a week, which likely leaves time to reach the thermodynamically favored structure, and cooling down without controlling the rate [34].
Figure 4.
Sun et al. cationic polarization factor structural prediction for our LIYC samples [31]. The stoichiometries have been recalculated after weighting the precursors masses. The light pink area to the left corresponds to hcp-T, the narrow mauve area is for hcp-O, and the blue area is for ccp-M.
NH4Cl needs to be added in a 3:1 ratio to the metal center, either Y or In in the case of the AC route. Annealing is necessary to remove the flux, and in the case of MCA, it promotes a more ordered phase with sharper XRD reflections. The resulting phases are very similar, except in the case of x = −0.7 with more LiCl impurities for the AC sample, which is likely caused by the increased amount of In, lowering the melting temperature and interfering with the elevated temperature required to remove NH4Cl. The monoclinic phase is maintained from x = 0.3 to 1 in this study, transitioning to hcp for x ≤ 0.1. Interestingly, the thermodynamically favored hcp-T phase for τ ≲ 1.74 and x ≲ 0.1 is only observed for x = 0.1; LYC has the hcp-O phase. The In substitution may cause the Li+ to be less tightly bound, allowing it to reach the thermodynamically favored hcp-T phase faster than for LYC. It may be possible to avoid the thermodynamically favored hcp-T phase for LYC by frustrating the structure with a relatively short dwelling time at high temperature or relatively fast quenching, thus locking a slightly more ionically conductive hcp-O phase as discussed in the next section.
3.2. Li+ Transport
We chose to focus mostly on the samples with x = 0.1, 0.3, and 0.5 in Li3InxY1−xCl6 because they are on each side of the observed phase transition from trigonal to monoclinic at x = 0.2, and because x = 0.5 seems to exhibit high ionic conductivity and potentially improved cathode stability [32]. There is an optimal annealing temperature for the LIYC samples. For x = 1 (pure LIC), the ionic conductivity increases with the annealing temperature from unannealed up to 350 °C, which is the best ionic conductivity measured; the impedance relationship with annealing temperature is available in Figure S8. Decreasing x (increasing Y content) increases the optimal annealing temperature. In coherence with previous studies, the annealing temperature for x ≤ 0.5 has been chosen at 500 °C, which is close to the optimal annealing temperature in terms of ionic conductivity [34].
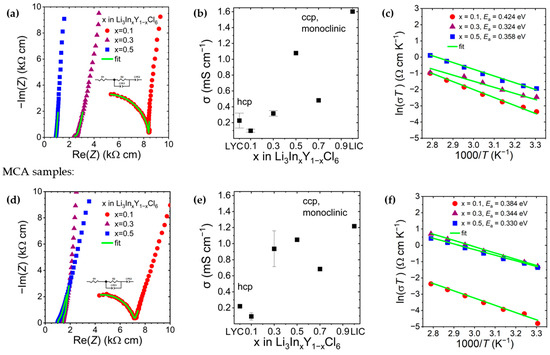
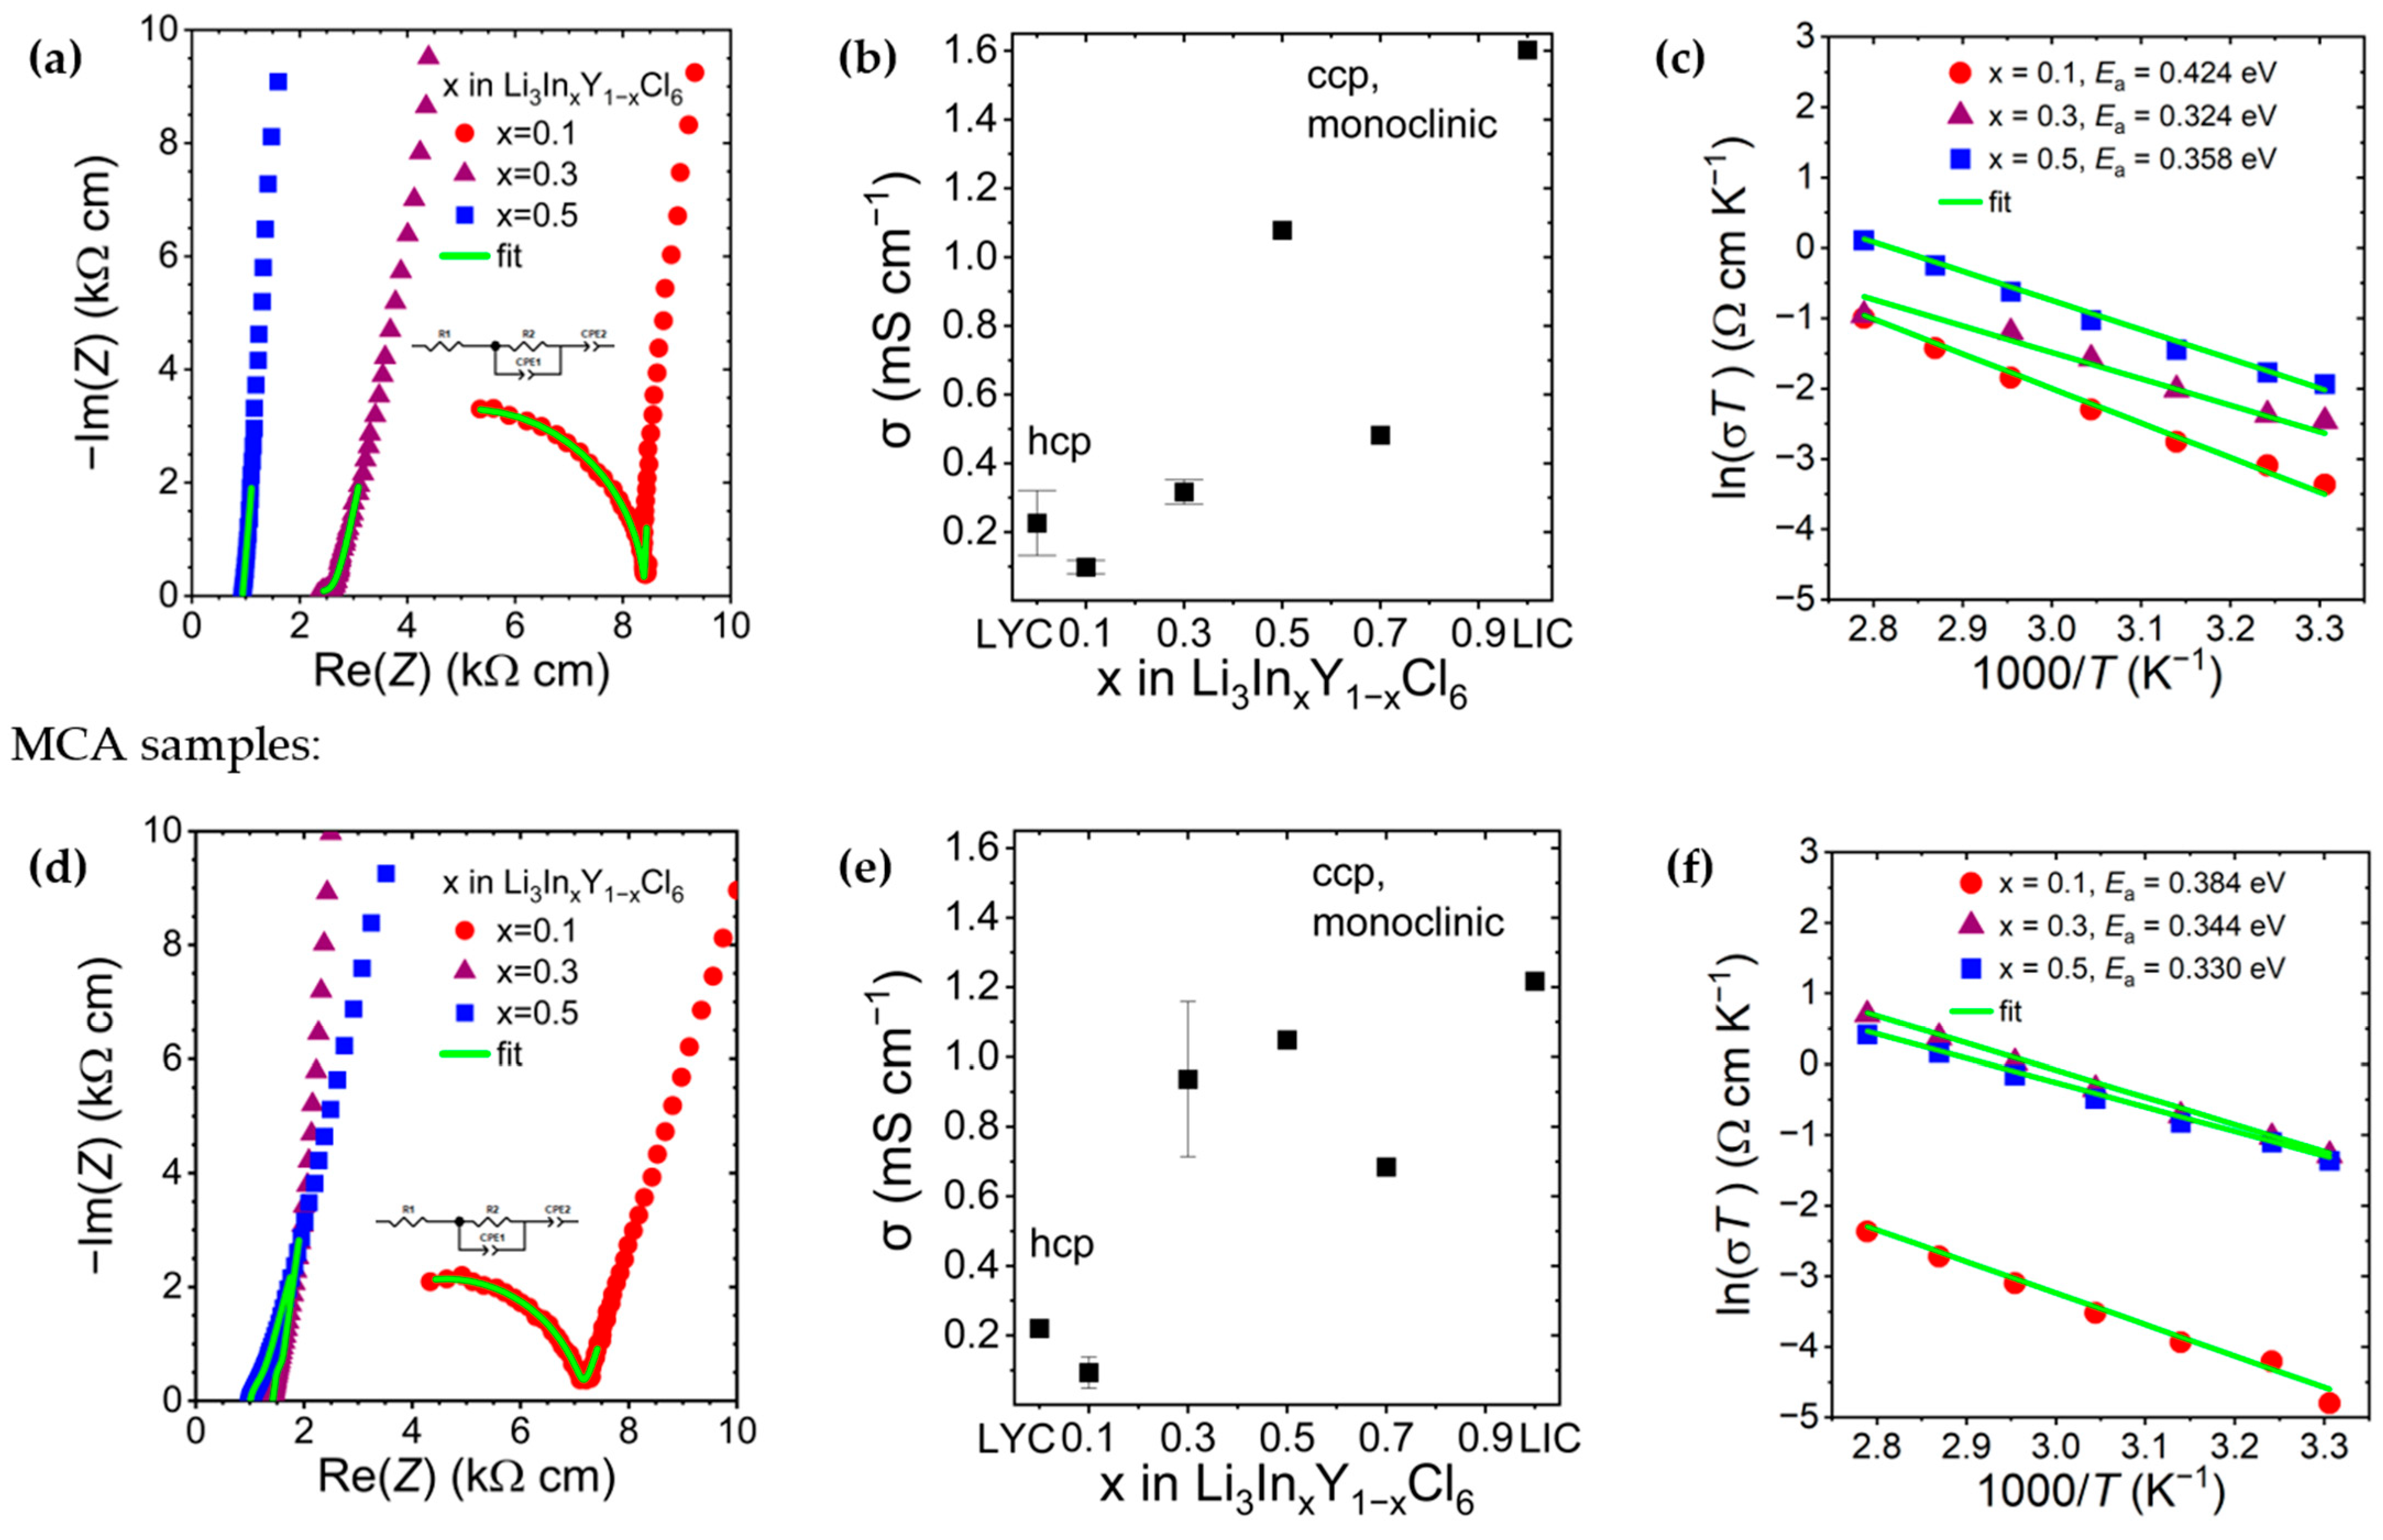
The Li3In0.1Y0.9Cl6 samples in Figure 5a,d have a hexagonal close-packed structure and lower total ionic conductivity. MCA and W–Li3In0.1Y0.9Cl6 have an equivalent capacitance for Qgb of, respectively, 6.20 · 10−10 and 1.05 · 10−9 F m−1, mostly attributable to grain boundaries [35]. As can be seen in Figure 5b,e, the samples have increasing conductivity, increasing x between 0 and 1, both for MCA and W samples. Transitioning from the trigonal structure (x = 0.1) with a conductivity of 0.1 mS cm−1 to the mix of orthorhombic and monoclinic phases (x = 0.3) leads to an increase in the effective conductivity. For the MCA samples, this phase transition leads to an order of magnitude increase in total conductivity as the grain boundary impedance drastically shrinks. For the W sample, the overall conductivity increase is more limited, by a factor of 3. Nevertheless, this confirms the conclusion of better conductivity of the hexagonal closed pack orthorhombic (hcp-O) over the trigonal (hcp-T) for Li3MCl6 solid electrolytes [31]. The MCA and W samples with x = 0.5 have, respectively, a conductivity of 1.07 mS cm−1 and 1.06 mS cm−1, and negligible grain boundaries. MCA and W samples at x = 0.7 have just above 0.6 and 0.4 mS cm−1 conductivities, respectively, also lower than the x = 0.5 and pure LIC samples above 1 mS cm−1. The W Li3In0.7Y0.3Cl6 exhibits a larger LiCl reflection on the XRD scans, due to a potential phase separation resulting from the lower melting point of InCl3, which would occur when annealing to remove the NH4Cl. The above observations corroborate literature results and confirm the better ionic conductivity of monoclinic cubic close packed (ccp) Li3MCl6 over both types of hcp phases [32,34]. However, the LYC sample having the orthorhombic phase has expectedly better conductivity than the x = 0.1 sample.
Figure 5.
(a,d) Complex impedance data collected at room-temperature. (b,e) total ionic conductivity as a function of In content. (c,f) Arrhenius plots. The error bars for (b,e) are for 2 samples, except pure LYC which is for 6 samples for W LYC. The lower room temperature value difference from the PEEK mold conductivity measurement is due to slightly worse contact in the AA battery holder without active high stack pressure, as shown in Figure S9.
Figure 5c,f shows Arrhenius behaviour of the total conductivity based on the temperature. The y-axis intersect is −ln() which are similar for both monoclinic phases x = 0.5 and x = 0.3 but significantly lower for x = 0.1, confirming that the ccp-M phase ionic conductivity is inherently superior to hcp for LIYC. Activation energies (Ea) are similar among the samples, ~0.35 eV, and comparable to Banik et al., reporting activation energies ranging from 0.49 eV for LYC, to 0.38 eV for x = 0.7, and ~0.32 eV for LIC [34]. The Ea is inferior to 0.40 eV for all monoclinic (x ≥ 0.3) samples and just above it at 0.42 eV for the x = 0.1 W sample. The x = 0.1 MCA sample has a similar Ea at 0.38 eV.
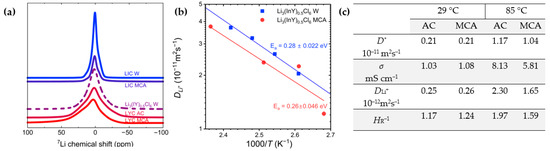
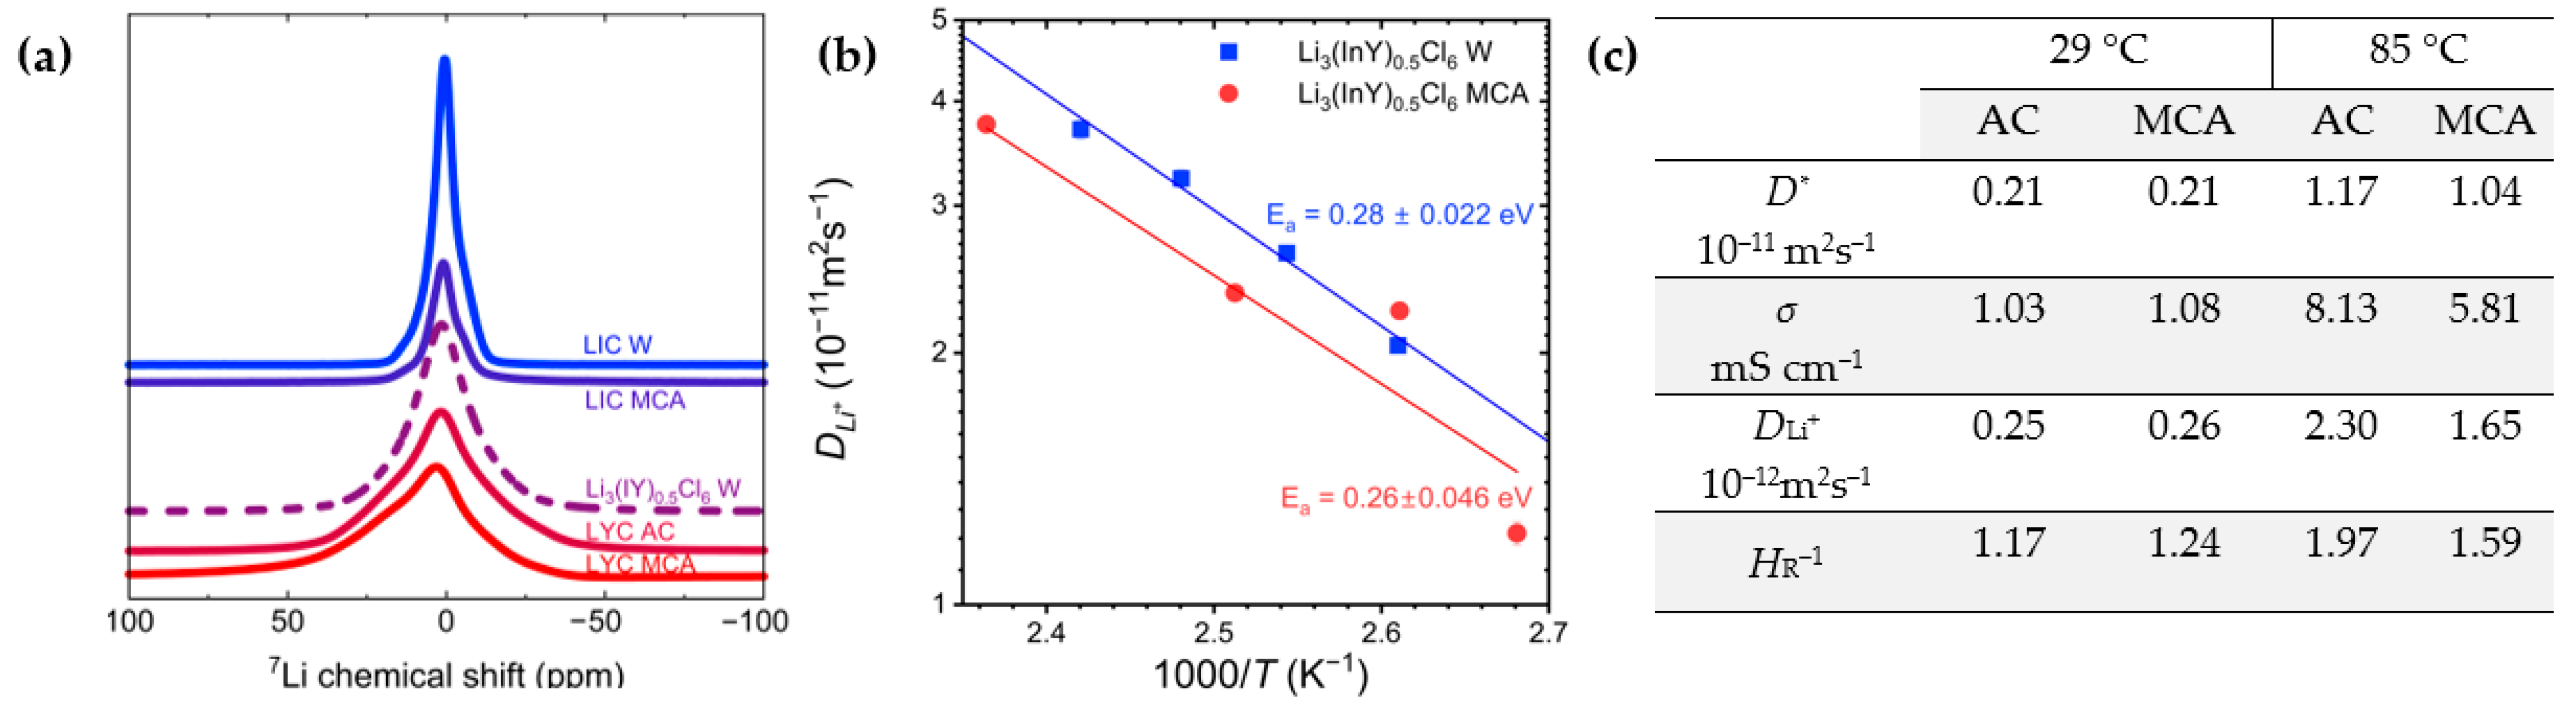
Solid-state 7Li NMR spectra were collected on powders of LIC and LYC of both W and MCA, and Li3(InY)0.5Cl6 W. Across these samples, as can be seen in Figure 6, those containing Y exhibit broad non-Gaussian peaks which are suggestive of quadrupolar interactions with an asymmetric electric field imposed by the crystal lattice. Upon heating, the central transition in the NMR spectra of Li3(InY)0.5Cl6 W sharpens significantly, and the quadrupolar satellite peaks become easier to resolve (Figure S10). In fact, at 140 °C, two sets of quadrupolar satellite peaks become partially resolved from each other, which would be consistent with a temperature induced ordering in the sample resulting in two non-exchanging inequivalent lithium sites. We extracted a diffusion coefficient (Figure 6b) from these spectra through the Stejskal-Tanner Equation (3).
Figure 6.
(a) 7Li static NMR spectra of MCA and AC selected samples. (b) Diffusion coefficients of Li+ measured as a function of temperature from 100 to 140 °C in Li3(InY)0.5Cl6. The error bars relate to the fit quality, better at higher temperatures. (c) Inverse Haven ratio (HR−1) of Li3(InY)0.5Cl6.
NMR shows slightly faster diffusivity in the AC than in the MCA sample, and a lower activation energy compared to the impedance measurement. LIC diffusion values are reported at 60 °C 9 × 10—12 m2s—1 in [2], between 6 and 7 × 10⁻¹² m2s−1 in [36] and for LYC at 80 °C between 5 and 6 × 10⁻¹² m2s−1 in [16]. Li3(InY)0.5Cl6 is of the same order of magnitude between 1 and 3 × 10⁻¹¹ m2s−1 at 85 °C. > 1 shows correlated ionic hopping. Increasing values of with temperature indicates that the ionic conduction relies more on this correlated mechanism as the temperature increases. Stainer and Wilkening [37] provided definitive proof through temperature-dependent NMR and appropriate modelling that the Li+ diffusion relies mostly on 2D motion in the ab plane of Figure 1A. The Li3(InY)0.5Cl6 NMR activation energies of 0.27 ± 0.02 (W) and 0.26 ± 0.05 eV (MCA) are close to Stainer and Wilkening’s LIC (0.25 eV). The activation energies in Figure 5c,f measured through impedance spectroscopy are higher due to probing not only the local diffusion, but also the slower transitions at grain boundaries.
Because Li3(InY)0.5Cl6 and LIC have similar diffusion, activation energies, and monoclinic structure with Li atoms organized in parallel planes in the lattice, the barrier for Li+ diffusion for Li3(InY)0.5Cl6 should also be lowest within the 2D planes [2,34,37]. Doping is commonly used to improve the ionic conductivity in SE by introducing disorder and vacancies. In LIYC, the partial occupation of In and the stacking defects induced by Y substitution may facilitate Li+ transport along the c-axis. However, for the 2D layered structure of monoclinic LIYC, such disorder seems to hinder long-range 2D transport. The long-range Li+ transport disruption results in the lower ionic conductivities relative to LIC observed in Figure 5b,e [2,6].
When observed, the grain boundary impedance is larger for the W samples owing to more LiCl impurities. The activation energy and grain boundary impedance decrease as the ionic conductivity increases and with In addition, except for the x = 0.1 sample with hcp-T phase, which has the lowest ionic conductivity. The activation energy found through NMR compared to EIS is lower because the environment probed is more local. The grain boundaries have less impact on the measurement, which reveals that the AC samples have slightly higher bulk diffusion than the MCA. NMR shows correlated ionic motions, with the ionic transport being favored through the 2D planes as the temperature increases.
3.3. Cycling
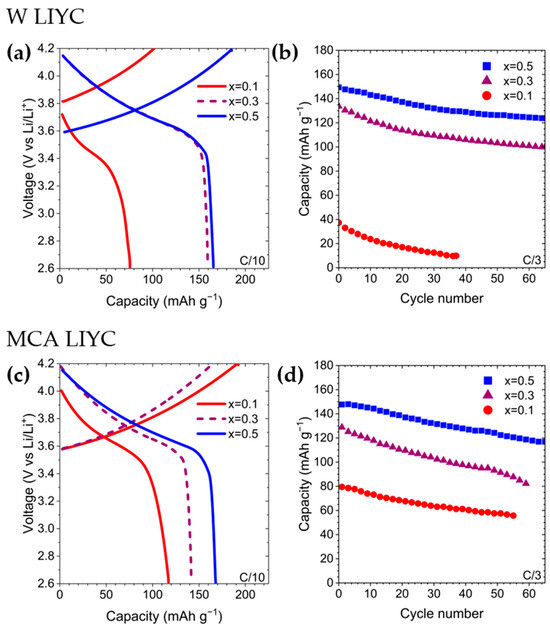
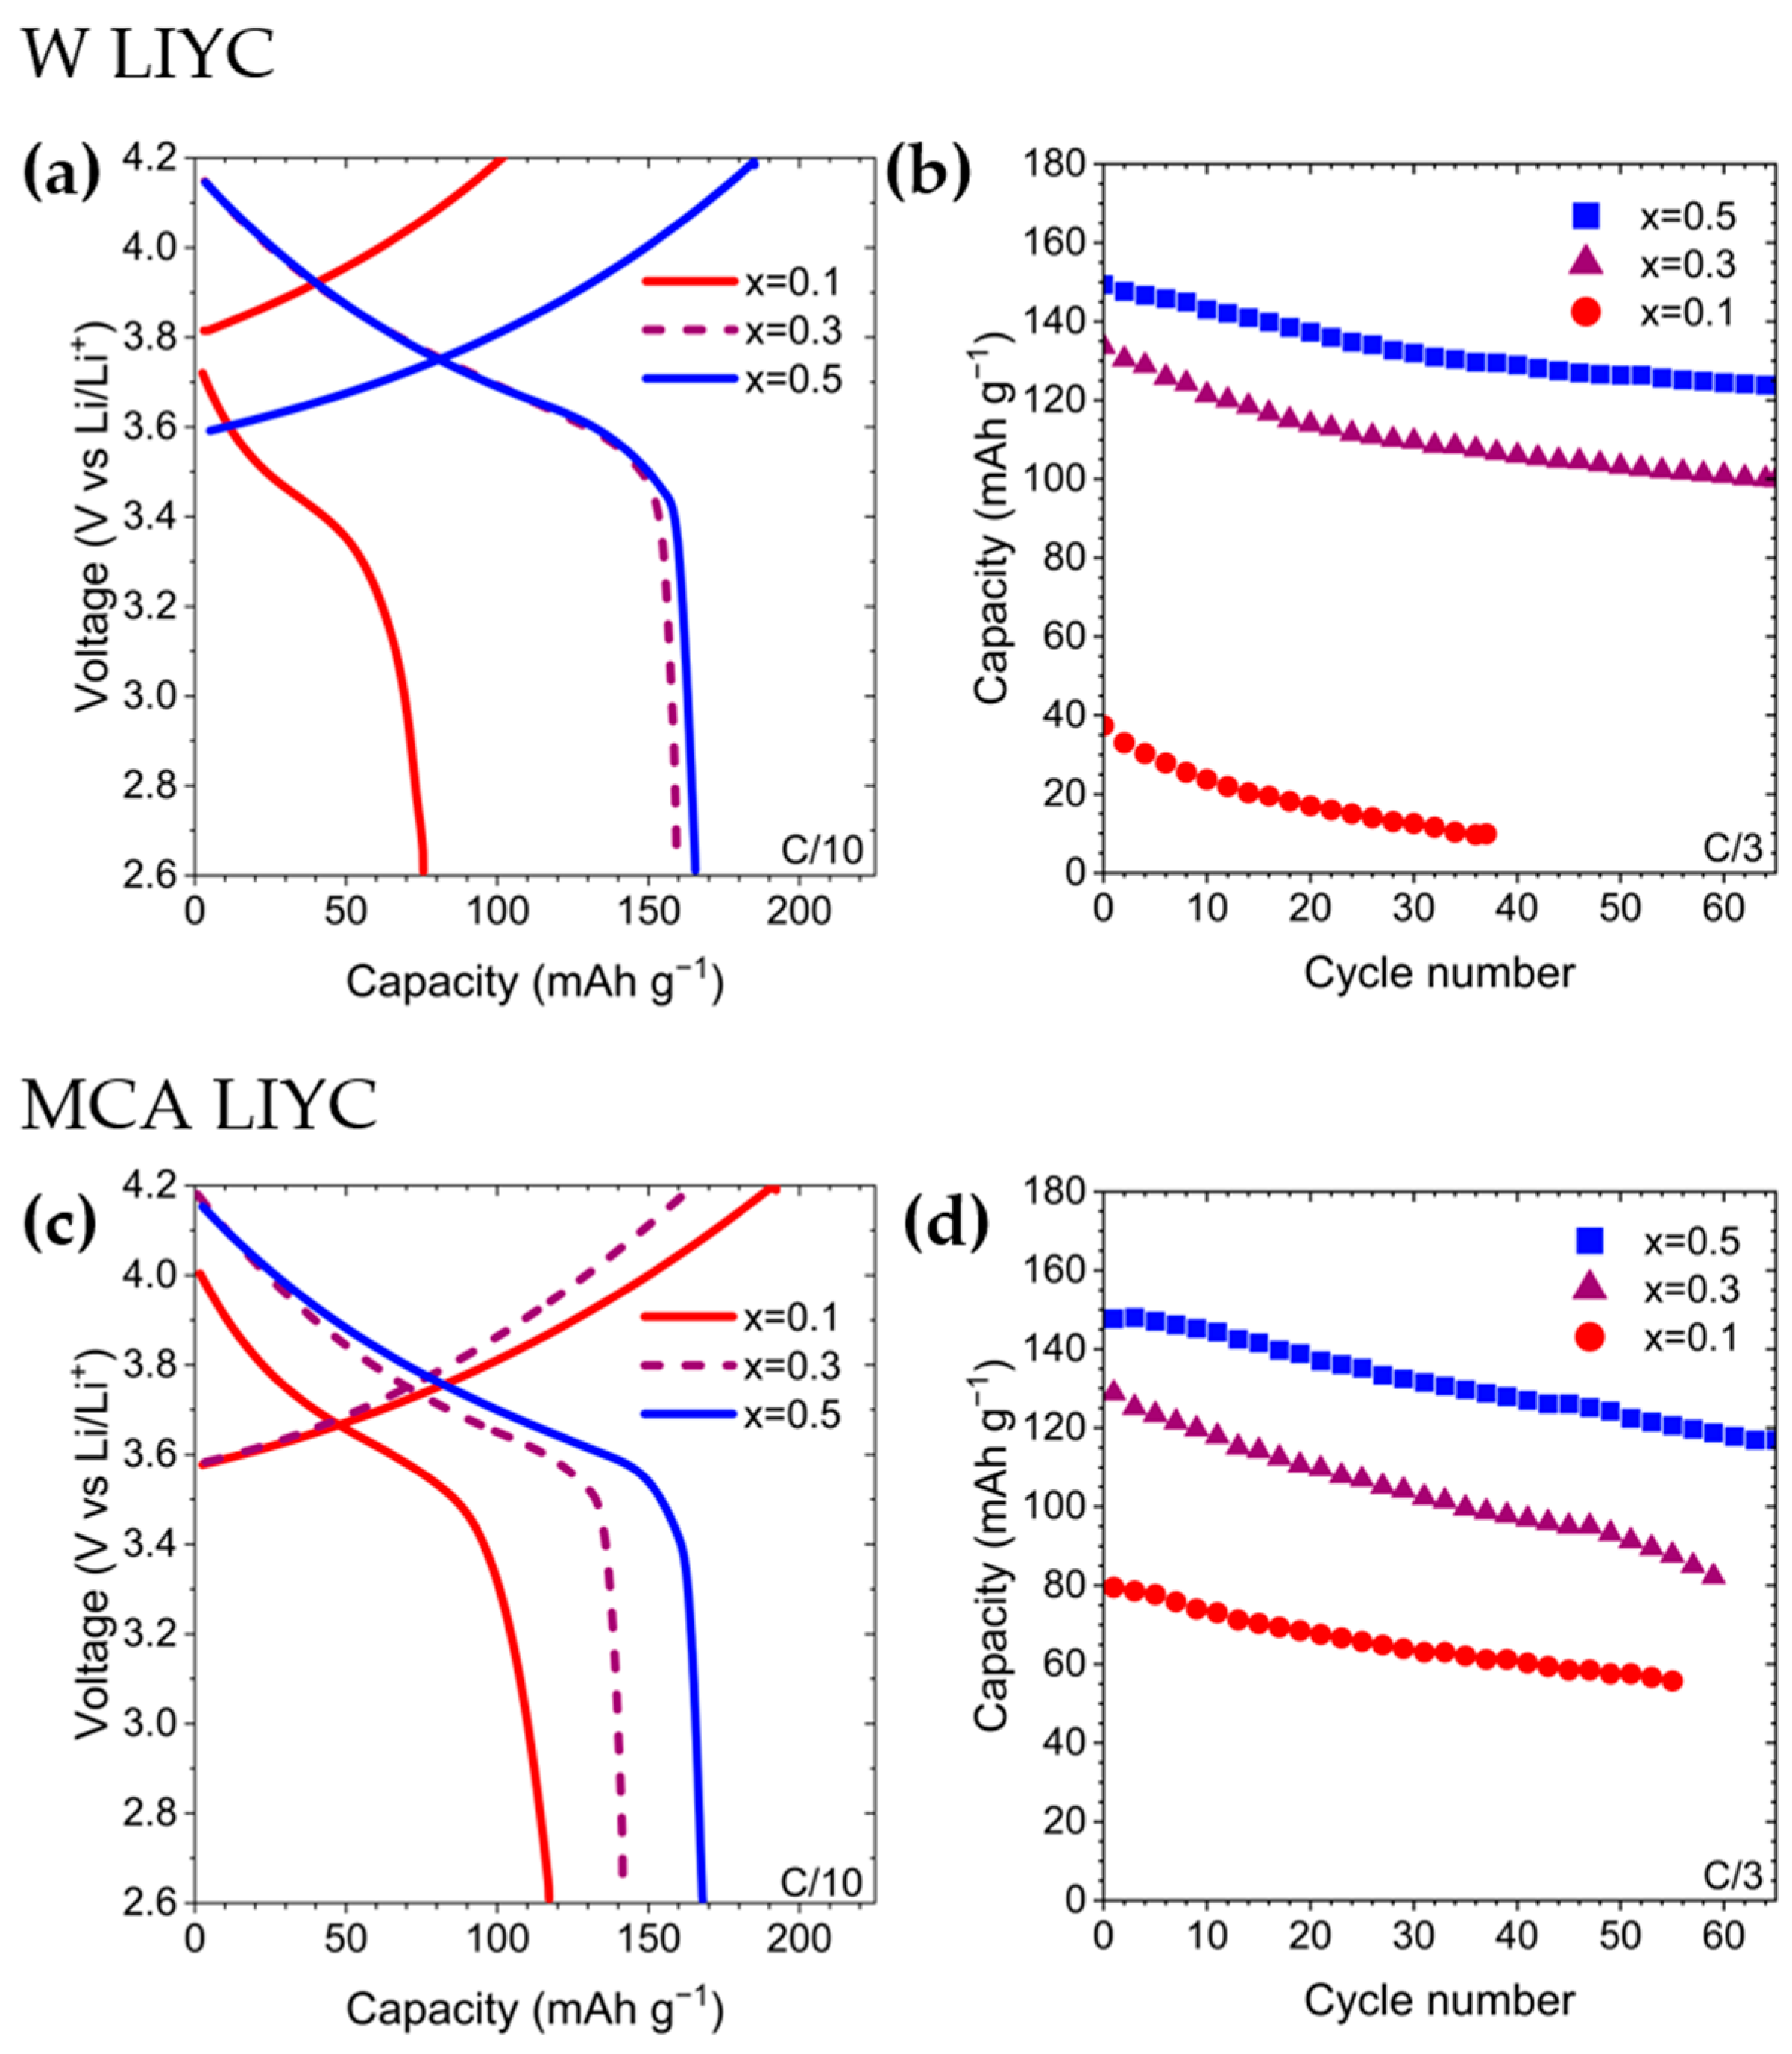
We cycled the MCA and W samples with x = 0.1, 0.3, and 0.5 in full cells with an LPSCl interlayer and a Li metal anode. The anodic sweep of the linear sweep voltammetry (LSV) in Figure S11 shows an onset of 4 V for the oxidative peak, in line with previous reports for LIC [28,38] and LYC [39]. During the conditioning cycle at C/10, Figure 7 shows that samples W Li3In0.5Y0.5Cl6 and Li3In0.3Y0.7Cl6 have an initial capacity of about 180 mAh g−1 and initial coulombic efficiencies (ICE) of, respectively, 91% and 88%, whereas Li3In0.1Y0.9Cl6 showed only 105 mAh g−1 capacity and 70% ICE initially. W Li3In0.5Y0.5Cl6 has the highest capacity retention at 100 cycles, around 120 mAh, which is also 80% of its initial capacity at C/3. W Li3In0.3Y0.7Cl6 reaches 80% of its initial capacity at C/3 at about 27 cycles and 110 mAh. W Li3In01Y0.9Cl6 reaches the 80% mark before 10 cycles. We observe initial C/10 capacity and coulombic efficiency for the MCA Li3In0.5Y0.5Cl6, Li3In0.3Y0.7Cl6 and Li3In0.1Y0.9Cl6 of respectively 190 mAh and 89%, 170 mAh and 72%, and 149 mAh and 87%. The capacity fade at 80% of initial performance for these same samples is attained, respectively, at 60, 45, and 30 cycles.
Figure 7.
Cell performance. (a,c) Initial charge–discharge voltage-capacity profiles. (b,d) Cycling capacity at C/3. The symbols on (b,d) are the same as Figure 5.
Overall, higher In content leads to improved ICE and cycling stability despite showing greater oxidative currents above 4.2 V (Figure S11). W-LIYC cells only showed similar cycling upon the addition of a quick milling post-processing step. The W-LIYC particles agglomerated during drying and therefore needed to be ground to smaller sizes. When particle size was appropriately reduced, the W LIYC exhibits slightly better stability than the MCA LIYC at all stoichiometries but Li3In0.1Y0.9Cl6., which is not due to the amount of LiCl impurity, as the MCA and W samples have equivalent LiCl amounts (Figure S6). As such, the amount of LiCl in our samples is not the main predictor of the battery performance, as it is in the same range for x = 0.1, 0.3, and 0.5, and is slightly higher for the W samples.
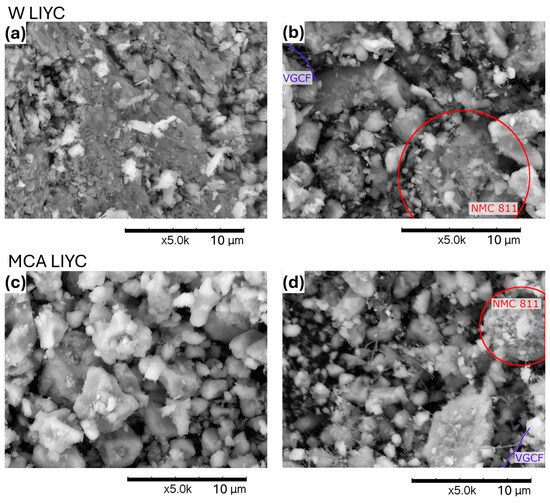
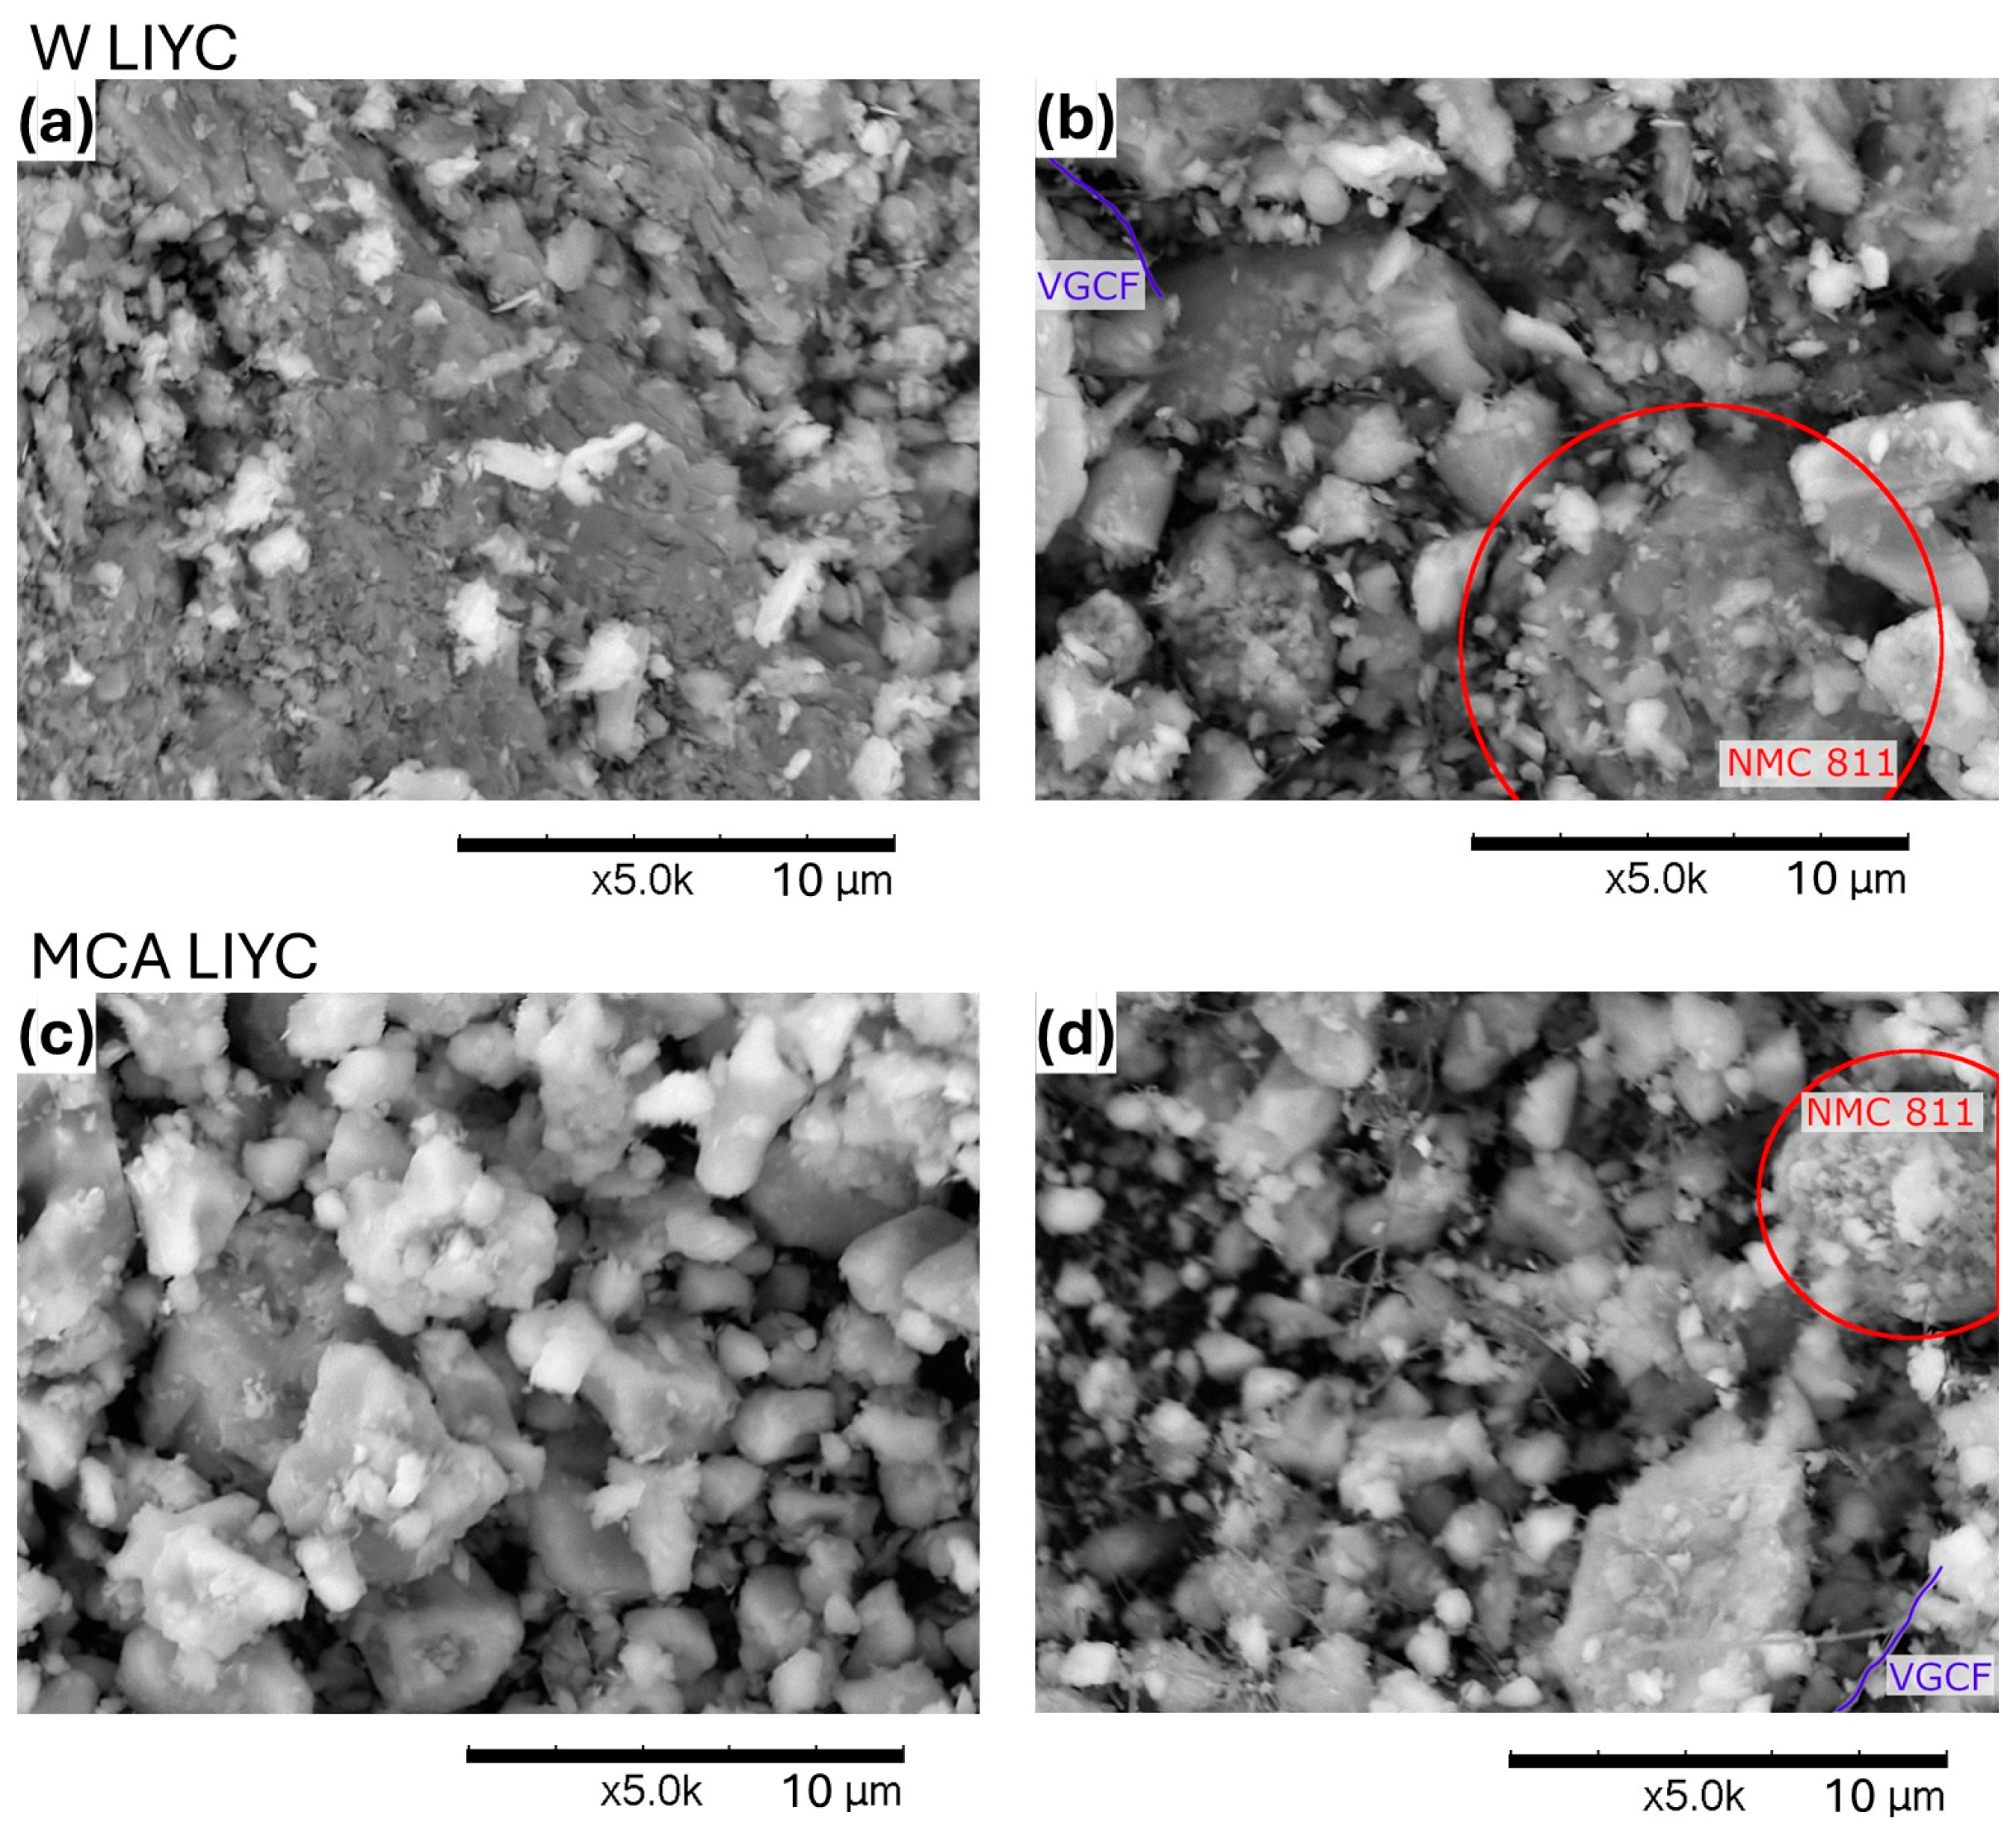
The scanning electron microscope (SEM) images of the electrolyte in Figure 8 reveal agglomerated particles for W LIYC. The larger, more defined NMC 811 particles are visible for both W and MCA LIYC. The annealing treatment on dense MCA pellets sinters the particles, causing the SE particles in the cathode not to blend as well with the active material, and explaining their faster capacity fade.
Figure 8.
Mixed backscattered electrons (BSE) and secondary electrons (SE) SEM images at 15 kV of (a,c) pure Li3In0.5Y0.5Cl6 and (b,d) Li3In0.5Y0.5Cl6 + NMC catholyte blend at 5k magnification.
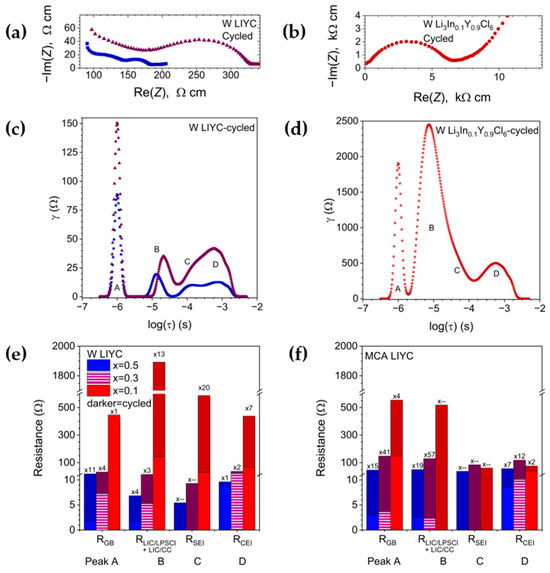
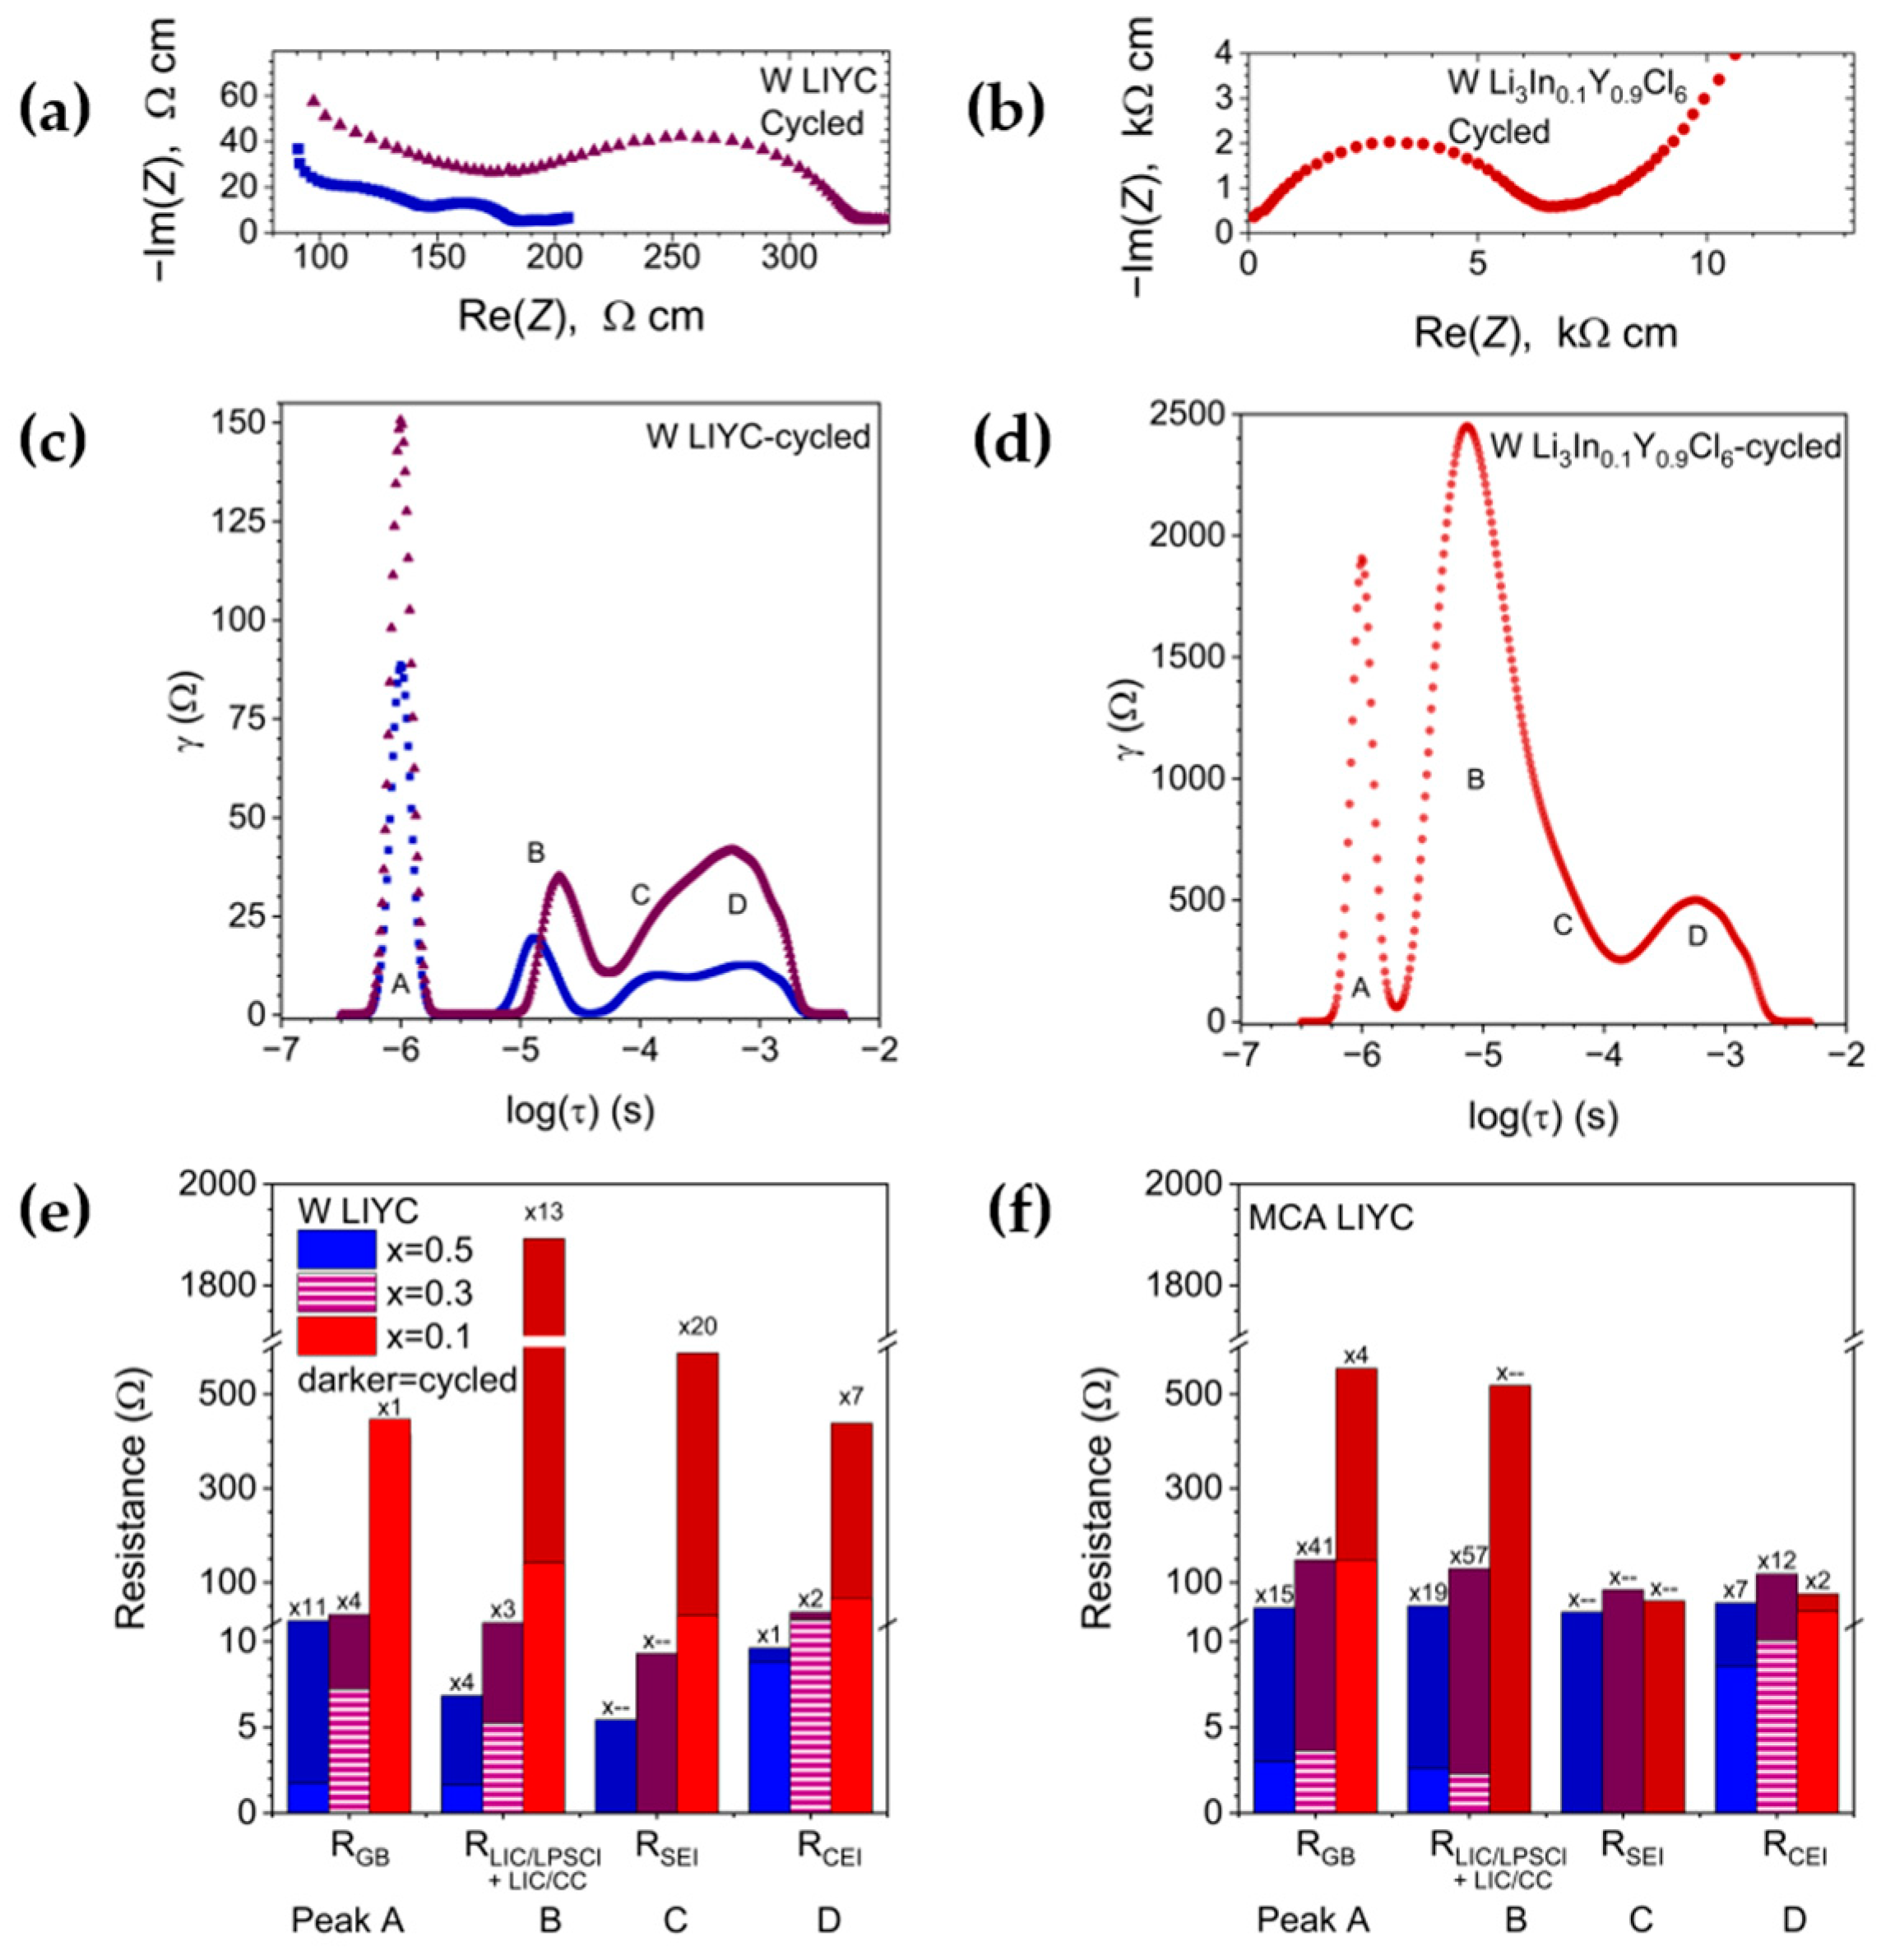
The impedance data informs us about the degradation mechanisms in the cell. All the semi-circles on the Nyquist plots in Figure 9a,b have increasing diameter after cycling, showing degradation in the cells. The impedances after cycling are largely convoluted; only one or two features are clearly visible, whereas the distribution of relaxation times (DRT) shows four peaks in Figure 9c,d, and therefore helps pinpoint the sources of the degradations. Only representative Nyquist and DRT plots for cycled cells with W LIYC are shown in Figure 9; the other plots can be found in Figure S12. Long-range, mass-transport-limited diffusion is excluded as it causes divergence in the standard DRT integral [40], and the intrinsic SE ionic conductivity is not represented as it is a purely resistive phenomenon. An increase in the peak area indicates an increase in the impedance of that process, such as material degradation. Faster processes can be assigned to higher frequencies/smaller time constants in the DRT spectra: 10−6 s characterizes grain boundary ionic transport of both LIYC and LPSCl (peak A, RGB), 10−5 s the SE/current collector (CC) and LIC/LPSCl interfaces (peak B, RLIC/LPSCl+LIC/CC), 10−4 s and 10−3 s the SEI and CEI, respectively (peak C, RSEI and peak D, RCEI) [41,42,43,44,45]. The evolution of all the resistances associated with the DRT peaks is summarized in Figure 9e,f.
Figure 9.
(a,b) Representative Nyquist plots at room temperature of the charged cells after their last cycle; the data for the pristine cells are available in Figure S7. (c,d) Corresponding distribution of relaxation times (DRT) spectra of the data in (a,b). The letters help distinguish between time constants in the text. (e,f) Histograms of the resistance identified in the DRT before and after cycling. The darker hues are for cycled cells, and symbols from (a–d) are the same as Figure 7. The multipliers above the darker bars relate to how much the resistance has increased compared to the pristine cells.
For Li3In0.5Y0.5Cl6, RGB is smaller in the W than in the MCA cells, with respectively 1.7 and 3.0 Ω in the pristine cells; increasing 11 and 15 times in the cycled cells. For W Li3In0.3Y0.7Cl6, RGB is 7.2 Ω in the pristine W cells and 3.6 Ω in the pristine MCA cells, but it increases 4 times for the cycled W cells and 41 times for the cycled MCA cells. In Li3In0.1Y0.9Cl6, A is almost identical in the pristine and cycled W cells at 450 Ω. The MCA Li3In0.1Y0.9Cl6 cell has a feature at 150 Ω in the pristine state, increasing 4 times after cycling. This indicates greater bulk degradation of the MCA samples in this region, especially with a lower In:Y ratio—apart from W Li3In0.1Y0.9Cl6 [41].
RLIC/LPSCl+LIC/CC in the W Li3In0.5Y0.5Cl6 cells increases 4 times after cycling from 1.6 Ω in the pristine state. In the MCA Li3In0.5Y0.5Cl6 cells, it increases 19 times from 2.6 Ω. In the W Li3In0.3Y0.7Cl6 cells, it increases 3 times after cycling from 5.2 Ω in the pristine state. In the MCA Li3In0.3Y0.7Cl6 cells, it surges 57 times from 2.3 Ω. In both W and MCA Li3In0.1Y0.9Cl6, it increases greatly after cycling, 13 times from 140 Ω in the W sample and up to 520 Ω from a non-visible level in the pristine MCA sample. The increase in RLIC/LPSCl+LIC/CC after cycling suggests either particle degradation in the cathode mix or delamination between LIC and LPSCl is one of the main causes of the capacity loss, and this failure cause is more severe with increasing amount of Y and overall in the MCA samples [42].
Consistent with being associated with the SEI formation, RSEI is not perceivable in the pristine cells, except for W Li3In0.1Y0.9Cl6 at 29 Ω. It generally does not contribute significantly to the impedance of cycled cells, remaining at 5.4 Ω for W Li3In0.5Y0.5Cl6 and 9.3 for Li3In0.3Y0.7Cl6, and at 37, 85, and 61 Ω for the MCA samples with x = 0.5, 0.3, and 0.1, respectively, and demonstrating the formation of a stable SEI. W Li3In0.1Y0.9Cl6 stands out with a 20 times increase to 590 Ω after cycling, possibly linked to the great RLIC/LPSCl+LIC/CC increase and showing growing dendrites or isolated Li causing a larger LIC/LPSCl interface as well as SEI [42].
RCEI does not contribute as much to the performance decrease. It remains stable from 8.8 to 9.6 Ω in the W Li3In0.5Y0.5Cl6 before and after cycling, increases 2 times from 20 Ω for W Li3In0.3Y0.7Cl6, and 7 times from 67 Ω in Li3In0.1Y0.9Cl6. In the MCA samples, RCEI grows 7 times from 8.6 Ω in Li3In0.5Y0.5Cl6, 12 times from 10 Ω in Li3In0.3Y0.7Cl6, and 2 times from 48 Ω in Li3In0.1Y0.9Cl6.
RGB and RLIC/LPSCl+LIC/CC are the resistances contributing most to the impedance increase after cycling, suggesting the degradations occur mostly through mechanical degradation of LIYC in the bulk and causing delamination of the LIC/LPSCl interface. These two mechanisms are also the ones most worsened by decreasing In:Y ratio, which is particularly noticeable for the W Li3In0.1Y0.9Cl6 cell with RLIC/LPSCl+LIC/CC growing from 140 Ω to 1900 Ω, and associated with growing isolated Li or dendrites since there is also a large RSEI growth.
The total resistance triples after cycling for W samples of x = 0.5 and 0.3, whereas it is an order of magnitude higher for the corresponding MCA samples. Comparatively, higher In content results in lower impedance before and after cycling and achieves better stability. Importantly, the slightly greater ionic conductivity of the MCA samples does not help prevent subsequent degradation during cycling, with a larger increase in the grain boundaries of MCA versus W samples.
4. Conclusions
Our work compares the structure, electrochemical properties, and cycling performance of LIYC synthesized in aqueous solution and mechanochemically. Ammonium chloride is used as a sacrificial additive for Y to be incorporated into the LIC structure. Its proportion needs to be 3:1 relative to In + Y, leading to LiCl impurities if this proportion is not respected, and oxychloride as well if below. The substitution of Y for In shifts the low conductive hcp phase to the highly conductive ccp-M phase. The transition from hcp to ccp-M with increasing In:Y ratio follows a similar trend for both synthesis routes. The LYC samples have hcp-O phase, whereas sphere packing modelling of the ions in the unit cell predicts hcp-T [31]. Both the thermodynamically favored hcp-T LYC phase [34] and hcp-O [32,33,46] are encountered in the literature; longer annealing time may favor the hcp-T phase. Expectedly, the volume of the unit cell decreases with increasing In:Y. Due to lower intrinsic ionic conductivity in hcp samples, the grain boundaries bottlenecks are more easily resolved in Li3In0.1Y0.9Cl6 and LYC. The grain boundary impedance is also magnified by the aqueous synthesis for all LIYC stoichiometries because it tends to leave more LiCl impurities. As the In:Y ratio and the ionic conductivity increase, both the activation energy and grain boundary impedance decrease, apart from the x = 0.1 sample with hcp-T phase exhibiting the lowest ionic conductivity. The activation energy determined by NMR is lower than that obtained from EIS because NMR probes more localized environments, making grain boundaries less influential in the measurement. This indicates that AC samples possess slightly higher bulk diffusion compared to MCA samples. Additionally, NMR results demonstrate correlated ionic motions, with ionic transport becoming increasingly favored within the 2D planes as temperature rises. In-rich samples with ccp-M phase experience less capacity fade thanks to their order of magnitude higher ionic conductivity. Although the grain boundary impedance is more important for samples synthesized through the aqueous route, the corresponding cells show better stability, owing to smaller grains that tend to fragment less and keep better contact during cycling.
Supplementary Materials
The following supporting information can be downloaded at: https://www.mdpi.com/article/10.3390/chemengineering10060079/s1, Figure S1: Thermogravimetric analysis (TGA) of the YCl3 used as a precursor salt; Figure S2: X-ray diffraction patterns of W Li3In0.5Y0.5Cl6 synthesized with various ammonium chloride ratios; Figure S3: Total ionic conductivity of W Li3In0.5Y0.5Cl6 from EIS measurement; Figure S4: X-ray diffraction patterns of W Li3InxY1−xCl6 0 ≤ x ≤ 1, and standard references; Figure S5: X-ray diffraction patterns of MCA Li3InxY1−xCl6 0 ≤ x ≤ 1, and standard references; Figure S6: Unit cell volume and impurities as a function of x in W Li3InxY1−xCl6 0 ≤ x ≤ 1; Figure S7: Sun et al. cationic polarization factor structural prediction for our LIYC samples, assuming the moisture determination for the precursors and loss during grinding is wrong. The light pink area to the left corresponds to hcp-T, the narrow mauve area is for hcp-O, and the blue area to the right is for ccp-M.; Figure S8: Nyquist plot of MCA LIC annealed at different temperatures; Figure S9: Nyquist plot of W LIC gradually pressed to 354 MPa, released to 0 MPa, and pressed again to 354 MPa; Figure S10: Static NMR of W Li3In0.5Y0.5Cl6; Figure S11: Linear sweep voltammetry at 0.1 mV/s of cells made of LPSCl/LIYC representative samples in mass ratio 10:40 mg, with Li foil on the argyrodite side and C coated Al foil on the LIYC side; Figure S12: (a,b) Nyquist plots at room temperature for all cells; and (c–h) corresponding distribution of relaxation times (DRT) spectra of the data in (a) and (b), (c), (d) Pristine cells. (e), (f) Post cycling charged cells. (g), (h) DRT for Li3In0.1Y0.9Cl6. Darker hues for cycled cells, the symbols and colors are the same as in the main text; Table S1: Rietveld analysis results for the XRD pattern of W LYC; Table S2: Rietveld analysis results for the XRD pattern of W Li3In0.1Y0.9Cl6; Table S3: Rietveld analysis results for the XRD pattern of W Li3In0.3Y0.7Cl6. Secondary LIC phase omitted; Table S4: Rietveld analysis results for the XRD pattern of W Li3In0.5Y0.5Cl6; Table S5: Rietveld analysis results for the XRD pattern of W Li3In0.7Y0.3Cl6; Table S6: Rietveld analysis results for the XRD pattern of W LIC; Table S7: Rietveld analysis results for the XRD pattern of MCA LYC; Table S8: Rietveld analysis results for the XRD pattern of MCA Li3In0.1Y0.9Cl6; Table S9: Rietveld analysis results for the XRD pattern of MCA Li3In0.3Y0.7Cl6. Secondary LIC phase omitted; Table S10: Rietveld analysis results for the XRD pattern of MCA Li3In0.5Y0.5Cl6; Table S11: Rietveld analysis results for the XRD pattern of MCA Li3In0.7Y0.3Cl6; Table S12: Rietveld analysis results for the XRD pattern of MCA LIC.
Author Contributions
Conceptualization, K.L. and R.L.S.; Methodology, J.Z., L.G., A.M.U. and R.L.S.; Formal analysis, K.L., J.Z., A.M.U., J.N. and R.L.S.; Investigation, K.L., J.Z., L.G. and A.M.U.; Resources, Y.Y., J.N. and R.L.S.; Data curation, K.L.; Writing—original draft, K.L., J.Z., A.M.U. and R.L.S.; Writing—review & editing, L.G., Y.Y., A.M.U., J.N. and R.L.S.; Visualization, K.L., J.Z., A.M.U. and R.L.S.; Supervision, Y.Y., J.N. and R.L.S.; Project administration, R.L.S.; Funding acquisition, R.L.S. All authors have read and agreed to the published version of the manuscript.
Funding
This project was supported by the Transportation Technologies Office (TTO) under the Office of Critical Materials and Energy Innovation (CMEI) as part of the Battery Materials Research (BMR) program. This manuscript has been authored by UT-Battelle, LLC under Contract No. DE-AC05-00OR22725 with the U.S. Department of Energy. The United States Government retains and the publisher, by accepting the article for publication, acknowledges that the United States Government retains a non-exclusive, paid-up, irrevocable, worldwide license to publish or reproduce the published form of this manuscript, or allow others to do so, for United States Government purposes. The Department of Energy will provide public access to these results of federally sponsored research in accordance with the DOE Public Access Plan (http://energy.gov/downloads/doe-public-access-plan, accessed on 31 May 2026).
Data Availability Statement
The original contributions presented in this study are included in the article/Supplementary Material. Further inquiries can be directed to the corresponding authors.
Conflicts of Interest
Y.Y. has equity interests in LiBeyond, LLC and Solid Design Instruments, LLC. The University of Houston reviewed and approved his relationship in compliance with its conflict-of-interest policy. The remaining authors declare no competing interests.
Abbreviations
The following abbreviations are used in this manuscript:
| AC | ammonium coordinated samples |
| CC | current collector |
| ccp-M | monoclinic cubic close-packed |
| CEI | cathode electrolyte interphase |
| CPE | constant phase element |
| DRT | distribution of relaxation times |
| DSC | differential scanning calorimetry |
| Ea | activation energy |
| EIS | electrochemical impedance spectroscopy |
| hcp-O | orthorhombic close-packed |
| hcp-T | trigonal close-packed |
| HSE | halide solid electrolyte |
| ICE | initial coulombic efficiency |
| LIBs | lithium-ion battery |
| LIC | Li3InCl6 |
| LIYC, 0 ≤ x ≤ 1 | Li3InxY1−xCl6 |
| LPSCl | Li6PS5Cl (LPSCl) |
| LYC | Li3YCl6 |
| MCA | mechanochemically synthesized, and annealed |
| NMR | nuclear magnetic resonance |
| PEEK | polyether ketone |
| PGSTE | pulse-gradient stimulated echo |
| sc-NMC811 | single crystal LiNixMnyCo1−x−yO2 |
| SE | solid electrolyte |
| SEI | solid electrolyte interphase |
| SEM | scanning electron microscope |
| SSB | solid-state battery |
| TGA | thermogravimetric analysis |
| VGCF | vapor-grown carbon nanofiber |
| W | water samples |
| XRD | x-ray diffraction |
| ZARC | constant phase element in parallel with an ohmic resistor |
References
- Wu, J.; Li, J.; Yao, X. Exploring the Potential of Halide Electrolytes for Next-Generation All-Solid-State Lithium Batteries. Adv. Funct. Mater. 2025, 35, 2416671. [Google Scholar] [CrossRef] [Scilit]
- Asano, T.; Sakai, A.; Ouchi, S.; Sakaida, M.; Miyazaki, A.; Hasegawa, S. Solid Halide Electrolytes with High Lithium-Ion Conductivity for Application in 4 V Class Bulk-Type All-Solid-State Batteries. Adv. Mater. 2018, 30, 1803075. [Google Scholar] [CrossRef] [Scilit] [PubMed]
- Stainer, F.; Gadermaier, B.; Wilkening, H.M.R. Local and Long-Range Li+ Diffusion in Li3InCl6: Impact of Preparation Method on Ion Dynamics. Chem. Mater. 2025, 37, 2650–2663. [Google Scholar] [CrossRef] [Scilit]
- Liu, Z.; Chien, P.-H.; Wang, S.; Song, S.; Lu, M.; Chen, S.; Xia, S.; Liu, J.; Mo, Y.; Chen, H. Tuning Collective Anion Motion Enables Superionic Conductivity in Solid-State Halide Electrolytes. Nat. Chem. 2024, 16, 1584–1591. [Google Scholar] [CrossRef] [Scilit] [PubMed]
- Shen, F.; McGahan, M.; Pietras, J.D.; Doeff, M.M.; Battaglia, V.S.; Tucker, M.C. Optimization of Catholyte for Halide-Based All-Solid-State Batteries. J. Power Sources 2025, 640, 236709. [Google Scholar] [CrossRef] [Scilit]
- Rosa, C.; Ravalli, M.; Pianta, N.; Mustarelli, P.; Ferrara, C.; Quartarone, E.; Malavasi, L.; Sheptyakov, D.; Tealdi, C. Aliovalent Substitution in Li3InCl6: A Combined Experimental and Computational Investigation of Structure and Ion Diffusion in Lithium-Halide Solid State Electrolytes. ACS Appl. Energy Mater. 2024, 7, 4314–4323. [Google Scholar] [CrossRef] [Scilit]
- Helm, B.; Schlem, R.; Wankmiller, B.; Banik, A.; Gautam, A.; Ruhl, J.; Li, C.; Hansen, M.R.; Zeier, W.G. Exploring Aliovalent Substitutions in the Lithium Halide Superionic Conductor Li3–xIn1–xZrxCl6 (0 ≤ x ≤ 0.5). Chem. Mater. 2021, 33, 4773–4782. [Google Scholar] [CrossRef] [Scilit]
- van der Maas, E.; Famprikis, T.; Pieters, S.; Dijkstra, J.P.; Li, Z.; Parnell, S.R.; Smith, R.I.; van Eck, E.R.H.; Ganapathy, S.; Wagemaker, M. Re-Investigating the Structure–Property Relationship of the Solid Electrolytes Li 3−xIn1−xZrxCl6 and the Impact of In–Zr(IV) Substitution. J. Mater. Chem. A 2023, 11, 4559–4571. [Google Scholar] [CrossRef] [Scilit] [PubMed]
- Tuo, K.; Sun, C.; López, C.A.; Fernández-Díaz, M.T.; Alonso, J.A. New Superionic Halide Solid Electrolytes Enabled by Aliovalent Substitution in Li3−xY1−xHfxCl6 for All-Solid-State Lithium Metal Based Batteries. J. Mater. Chem. A 2023, 11, 15651–15662. [Google Scholar] [CrossRef] [Scilit]
- Hu, L.; Wang, J.; Wang, K.; Gu, Z.; Xi, Z.; Li, H.; Chen, F.; Wang, Y.; Li, Z.; Ma, C. A Cost-Effective, Ionically Conductive and Compressible Oxychloride Solid-State Electrolyte for Stable All-Solid-State Lithium-Based Batteries. Nat. Commun. 2023, 14, 3807. [Google Scholar] [CrossRef] [Scilit] [PubMed]
- Tanaka, Y.; Ueno, K.; Mizuno, K.; Takeuchi, K.; Asano, T.; Sakai, A. New Oxyhalide Solid Electrolytes with High Lithium Ionic Conductivity >10 mS cm−1 for All-Solid-State Batteries. Angew. Chem. 2023, 135, e202217581. [Google Scholar] [CrossRef] [Scilit]
- Cheng, J.; Zhang, H.; Wang, Z.; Zhou, Y.; Yu, K.; Cheng, Y.; Yu, Z.; Huang, X.; Tian, B. O2− Substituted Li-Richened Li2ZrCl6 Lattice towards Superionic Conductivity. J. Energy Storage 2024, 89, 111700. [Google Scholar] [CrossRef] [Scilit]
- Zhang, S.; Zhao, F.; Chang, L.-Y.; Chuang, Y.-C.; Zhang, Z.; Zhu, Y.; Hao, X.; Fu, J.; Chen, J.; Luo, J.; et al. Amorphous Oxyhalide Matters for Achieving Lithium Superionic Conduction. J. Am. Chem. Soc. 2024, 146, 2977–2985. [Google Scholar] [CrossRef] [Scilit] [PubMed]
- Singh, B.; Wang, Y.; Liu, J.; Bazak, J.D.; Shyamsunder, A.; Nazar, L.F. Critical Role of Framework Flexibility and Disorder in Driving High Ionic Conductivity in LiNbOCl4. J. Am. Chem. Soc. 2024, 146, 17158–17169. [Google Scholar] [CrossRef] [Scilit] [PubMed]
- Ou, J.; Senevirathna, I.; Tatagari, V.; Saleem, A.; Segre, C.; Shaw, L. Boosting the Ionic Conductivity of Amorphous Oxychloride Solid Electrolytes via Different Degrees of Amorphization. Energy Mater. 2025, 5, 500088. [Google Scholar] [CrossRef] [Scilit]
- Brahmbhatt, T.; Li, C.; Garaga, M.N.; Tsai, W.-Y.; Greenbaum, S.G.; Nanda, J.; Sacci, R.L. Tuning Lithium–Yttrium Chloride Local Structure through Coordination Control and Mixing during Synthesis. Inorg. Chem. Front. 2024, 11, 3001–3010. [Google Scholar] [CrossRef] [Scilit]
- Rudolph, W.W.; Irmer, G. Hydration and Ion Pair Formation in Aqueous Y3+–Salt Solutions. Dalton Trans. 2015, 44, 18492–18505. [Google Scholar] [CrossRef] [Scilit] [PubMed]
- Cabaco, M.I.; Marques, M.A.; de Barros Marques, M.I.; Bushnell-Wye, G.; Costa, M.M.; de Almeida, M.J.; Andrade, L.C. Local Order in Concentrated Aqueous Solutions of Yttrium Chloride and Bromide. J. Phys. Condens. Matter 1995, 7, 7409. [Google Scholar] [CrossRef] [Scilit]
- Meyer, G.; Ax, P. An Analysis of the Ammonium Chloride Route to Anhydrous Rare-Earth Metal Chlorides. Mater. Res. Bull. 1982, 17, 1447–1455. [Google Scholar] [CrossRef] [Scilit]
- U.S. Geological Survey. Mineral Commodity Summaries, Yttrium, January 2025. Available online: https://pubs.usgs.gov/periodicals/mcs2025/mcs2025-yttrium.pdf (accessed on 13 March 2025).
- U.S. Geological Survey, 2025, Mineral Commodity Summaries 2025 (ver. 1.2, March 2025). Available online: https://pubs.usgs.gov/periodicals/mcs2025/mcs2025.pdf (accessed on 13 March 2025).
- Wang, K.; Ren, Q.; Gu, Z.; Duan, C.; Wang, J.; Zhu, F.; Fu, Y.; Hao, J.; Zhu, J.; He, L.; et al. A Cost-Effective and Humidity-Tolerant Chloride Solid Electrolyte for Lithium Batteries. Nat. Commun. 2021, 12, 4410. [Google Scholar] [CrossRef] [Scilit] [PubMed]
- Hart, P.W.; Sommerfeld, J.T. Cost estimation of specialty chemicals from laboratory-scale prices. Cost Eng. 1997, 39, 31–35. [Google Scholar]
- Tan, D.H.S.; Banerjee, A.; Chen, Z.; Meng, Y.S. From Nanoscale Interface Characterization to Sustainable Energy Storage Using All-Solid-State Batteries. Nat. Nanotechnol. 2020, 15, 170–180. [Google Scholar] [CrossRef] [Scilit] [PubMed]
- Zhang, X.; Xue, Q.; Li, L.; Fan, E.; Wu, F.; Chen, R. Sustainable Recycling and Regeneration of Cathode Scraps from Industrial Production of Lithium-Ion Batteries. ACS Sustain. Chem. Eng. 2016, 4, 7041–7049. [Google Scholar] [CrossRef] [Scilit]
- Schlem, R.; Muy, S.; Prinz, N.; Banik, A.; Shao-Horn, Y.; Zobel, M.; Zeier, W.G. Mechanochemical Synthesis: A Tool to Tune Cation Site Disorder and Ionic Transport Properties of Li3MCl6 (M = Y, Er) Superionic Conductors. Adv. Energy Mater. 2020, 10, 1903719. [Google Scholar] [CrossRef] [Scilit]
- Han, K.S.; Bazak, J.D.; Chen, Y.; Graham, T.R.; Washton, N.M.; Hu, J.Z.; Murugesan, V.; Mueller, K.T. Pulsed Field Gradient Nuclear Magnetic Resonance and Diffusion Analysis in Battery Research. Chem. Mater. 2021, 33, 8562–8590. [Google Scholar] [CrossRef] [Scilit]
- Sheng, H.; Wen, S.; Ma, Y.; Zheng, S.; Wang, Z. The Effect of NH4Cl on the Preparation of Li3InCl6 by Aqueous Phase Synthesis. Mater. Today Chem. 2025, 47, 102882. [Google Scholar] [CrossRef] [Scilit]
- Sacci, R.L.; Bennett, T.H.; Drews, A.R.; Anandan, V.; Kirkham, M.J.; Daemen, L.L.; Nanda, J. Phase Evolution during Lithium–Indium Halide Superionic Conductor Dehydration. J. Mater. Chem. A 2021, 9, 990–996. [Google Scholar] [CrossRef] [Scilit]
- Jacob, M.; Bette, S.; da Silva, I.; Yilmaz, H.; Wissel, K. Revisiting the Hydration and Dehydration Behavior of Li3InCl6 and Li3InCl6·xH2O: Crystal Structure Determination of an Intermediate Hydrated Phase. Inorg. Chem. 2025, 64, 18155–18165. [Google Scholar] [CrossRef] [Scilit] [PubMed]
- Li, X.; Kim, J.T.; Luo, J.; Zhao, C.; Xu, Y.; Mei, T.; Li, R.; Liang, J.; Sun, X. Structural Regulation of Halide Superionic Conductors for All-Solid-State Lithium Batteries. Nat. Commun. 2024, 15, 53. [Google Scholar] [CrossRef] [Scilit] [PubMed]
- Li, X.; Liang, J.; Adair, K.R.; Li, J.; Li, W.; Zhao, F.; Hu, Y.; Sham, T.-K.; Zhang, L.; Zhao, S.; et al. Origin of Superionic Li3Y1–xInxCl6 Halide Solid Electrolytes with High Humidity Tolerance. Nano Lett. 2020, 20, 4384–4392. [Google Scholar] [CrossRef] [Scilit] [PubMed]
- Bohnsack, A.; Stenzel, F.; Zajonc, A.; Balzer, G.; Wickleder, M.S.; Meyer, G. Ternäre Halogenide vom Typ A3MX6. VI [1]. Ternäre Chloride der Selten-Erd-Elemente mit Lithium, Li3MCl6 (M = Tb—Lu, Y, Sc): Synthese, Kristallstrukturen und Ionenbewegung. Z. Anorg. Allg. Chem. 1997, 623, 1067–1073. [Google Scholar] [CrossRef] [Scilit]
- Banik, A.; Samanta, B.; Helm, B.; Kraft, M.A.; Rudel, Y.; Li, C.; Hansen, M.R.; Lotsch, B.V.; Bette, S.; Zeier, W.G. Exploring Layered Disorder in Lithium-Ion-Conducting Li3Y1–xInxCl6. Inorg. Chem. 2024, 63, 8698–8709. [Google Scholar] [CrossRef] [Scilit] [PubMed]
- Wu, J.-F.; Guo, X. Size Effect in Nanocrystalline Lithium-Ion Conducting Perovskite: Li0.30La0.57TiO3. Solid State Ion. 2017, 310, 38–43. [Google Scholar] [CrossRef] [Scilit]
- Molaiyan, P.; Mailhiot, S.E.; Voges, K.; Kantola, A.M.; Hu, T.; Michalowski, P.; Kwade, A.; Telkki, V.-V.; Lassi, U. Investigation of the Structure and Ionic Conductivity of a Li3InCl6 Modified by Dry Room Annealing for Solid-State Li-Ion Battery Applications. Mater. Des. 2023, 227, 111690. [Google Scholar] [CrossRef] [Scilit]
- Stainer, F.; Wilkening, H.M.R. Two-Dimensional Li Ionic Hopping in Li3InCl6 as Revealed by Diffusion-Induced Nuclear Spin Relaxation. Phys. Rev. B 2024, 109, 174304. [Google Scholar] [CrossRef] [Scilit]
- Yang, G.; Qi, J.; Tian, J.; Liu, H.; Xu, K.; Yi, Y.; Zhong, G.; Guo, P. Structural Tuning and Electrochemical Behavior of Indium Halide Solid-State Electrolytes. Mater. Sci. Eng. B 2025, 318, 118297. [Google Scholar] [CrossRef] [Scilit]
- Yang, S.; Kim, S.Y.; Chen, G. Halide Superionic Conductors for All-Solid-State Batteries: Effects of Synthesis and Composition on Lithium-Ion Conductivity. ACS Energy Lett. 2024, 9, 2212–2221. [Google Scholar] [CrossRef] [Scilit] [PubMed]
- Huld, F.T.; Yu, Z.; Lou, F. Unravelling the Electrochemical Impedance Spectroscopy of Silicon Half Cells with Commercial Loading. Energy Adv. 2023, 2, 1176–1181. [Google Scholar] [CrossRef] [Scilit]
- Wei, C.; Yu, C.; Chen, S.; Chen, S.; Peng, L.; Wu, Y.; Li, S.; Cheng, S.; Xie, J. Unraveling the LiNbO3 Coating Layer on Battery Performances of Lithium Argyrodite-Based All-Solid-State Batteries under Different Cut-off Voltages. Electrochim. Acta 2023, 438, 141545. [Google Scholar] [CrossRef] [Scilit]
- Ma, T.; Wang, Z.; Wu, D.; Lu, P.; Zhu, X.; Yang, M.; Peng, J.; Chen, L.; Li, H.; Wu, F. High-Areal-Capacity and Long-Cycle-Life All-Solid-State Battery Enabled by Freeze Drying Technology. Energy Environ. Sci. 2023, 16, 2142–2152. [Google Scholar] [CrossRef] [Scilit]
- Koerver, R.; Aygün, I.; Leichtweiß, T.; Dietrich, C.; Zhang, W.; Binder, J.O.; Hartmann, P.; Zeier, W.G.; Janek, J. Capacity Fade in Solid-State Batteries: Interphase Formation and Chemomechanical Processes in Nickel-Rich Layered Oxide Cathodes and Lithium Thiophosphate Solid Electrolytes. Chem. Mater. 2017, 29, 5574–5582. [Google Scholar] [CrossRef] [Scilit]
- Hahn, M.; Rosenbach, D.; Krimalowski, A.; Nazarenus, T.; Moos, R.; Thelakkat, M.; Danzer, M.A. Investigating Solid Polymer and Ceramic Electrolytes for Lithium-Ion Batteries by Means of an Extended Distribution of Relaxation Times Analysis. Electrochim. Acta 2020, 344, 136060. [Google Scholar] [CrossRef] [Scilit]
- Yu, C.-Y.; Choi, J.; Dunham, J.; Ghahremani, R.; Liu, K.; Lindemann, P.; Garver, Z.; Barchiesi, D.; Farahati, R.; Kim, J.-H. Time-Resolved Impedance Spectroscopy Analysis of Aging in Sulfide-Based All-Solid-State Battery Full-Cells Using Distribution of Relaxation Times Technique. J. Power Sources 2024, 597, 234116. [Google Scholar] [CrossRef] [Scilit]
- Steiner, H.-J.; Lutz, H.D. Neue Schnelle Ionenleiter Vom Typ MMIII Cl6 (MI = Li, Na, Ag; MIII = In, Y). Z. Anorg. Allg. Chem. 1992, 613, 26–30. [Google Scholar] [CrossRef] [Scilit]
Disclaimer/Publisher’s Note: The statements, opinions and data contained in all publications are solely those of the individual author(s) and contributor(s) and not of MDPI and/or the editor(s). MDPI and/or the editor(s) disclaim responsibility for any injury to people or property resulting from any ideas, methods, instructions or products referred to in the content. |
© 2026 by the authors. Licensee MDPI, Basel, Switzerland. This article is an open access article distributed under the terms and conditions of the Creative Commons Attribution (CC BY) license.