


Abstract
: In the grain logistics context, pre-processing operations such as reception, pre-cleaning, drying, storage, and shipping are performed at farm, collecting, intermediate, sub-terminal, and terminal storage units to preserve quality, reduce losses, and add value in the products. However, high transportation costs and limited static storage capacity reduce the selling prices. The objective of this article is to maximize profit associated with pre-processing, storage, and transportation along the grain flow in Brazil. : A generic post-harvest logistics network is represented as a graph connecting producers, multi-level storage units, agribusiness facilities, and ports. A multi-period, multi-level mathematical model is applied in a case study framework explored in three scenarios, covering pre-cleaning, drying, storage, and transportation costs from production areas to commercialization nodes. : In all three scenarios, road transport resulted in transportation costs ranging from approximately US$ 49 million to US$ 492 million, mainly over long distances. : The location and static capacity of collecting and intermediate storage units strongly influenced transport, storage use, CO2 emissions, and post-harvest efficiency. Also, the flow concentration increased heavy-vehicle traffic, reducing overall logistics performance.
1. Introduction
Grains are a major source of food worldwide, with Brazil and the United States being the largest global producers [1]. Specifically in the 2024/25 Brazilian harvest, 340 million tons of grains were produced, contributing approximately 24% to the Gross Domestic Product (GDP) [2]. For commercialization, the post-harvest process is adopted to preserve quality, reduce losses, and add value to the product [3]. To preserve quality in the post-harvest process, pre-processing operations (reception, pre-cleaning, and drying), storage, and shipping are developed in storage units at different levels, such as farm, collecting, intermediate, sub-terminal and terminal [4], where storage in collecting units is renowned for providing services such as cleaning, drying, and storage [5].
The location of storage units for pre-processing, storage, and shipping influences the grain transportation system, specifically handling costs, which depend on the intermodal system [6,7]. According to SteadieSeifi et al. [8], intermodal transport is the combination of two or more modals used to transport cargoes of the same unit along the entire route, contributing to the mitigation of environmental impacts by prioritizing modals with reduced gas emissions [9]. According to Crainic et al. [10], in tactical planning, fleet sizing and route optimization through the use of different modals are developed, in addition to delivery itineraries, frequency, and vehicle capacity [11,12,13,14].
Thus, intermodal transport planning in the post-harvest process mitigates logistical costs, enhancing the competitiveness of the final product price, generating attractiveness, and, consequently, profitability for the entire production chain [15]. However, route selection and the unavailability of rail transport for moving large quantities of grain are constraints on intermodal planning, potentially increasing post-harvest logistical costs, especially in Brazil. Additionally, the lack of on-farm storage units and low static storage capacity forces producers to sell immediately after harvest, subjecting them to low commercialization prices and influencing transport demand. Intense transport during the harvest period causes congestion of heavy vehicles on highways and queues for unloading at collecting-level storage units, thereby increasing pre-processing costs [3].
For pre-processing operations, the main challenge is to define the quantity of grains to be pre-cleaned and dried, considering the equipment operational limitations and the location of storage units [16]. Dirty and wet grains transported to storage units at the collecting and intermediate levels increase pre-processing costs through outsourcing operations. Furthermore, producers’ heavy reliance on grain management at collecting and intermediate storage units limits their control over marketing [5]. In storage and shipping, the difficulty lies in identifying storage units with available static capacity [3]. In transportation, the difficulty lies in defining the optimal intermodal fleet size, given the multiplicity of destinations, which hinders grain flow efficiency [15,17].
Based on the context and difficulties described, the objective of this article is to maximize profit in the pre-processing, storage, and transportation associated with grains flow in Brazil. Proposing a mathematically modeled logistics network, the economic results are quantified based on distances between producers, storage units, and destination points. The mathematical model also supported the decision-making process of producers and storage facility managers in identifying the most advantageous periods for grain commercialization, also incorporating static capacity, transportation, pre-processing, and storage costs, as well as CO2 emissions.
Regarding the research limitations, the application of the mathematical model to specific regional scenarios in Brazil was highlighted, especially in a context in which few articles addressed grain transportation planning. The static storage capacities were considered without incorporating infrastructure expansion, operational changes, or investments over the planning horizon, since these aspects were associated with the strategic level of transportation planning rather than the tactical level. In addition, variability in selling prices under market fluctuations was not considered. Grain selling prices were based on reports from Brazilian government agencies on grain transportation and storage. Another limitation was the calculation of CO2 emissions only from transportation, without including energy consumption and emissions associated with drying and storage operations. The analysis of loading and unloading times, as well as congestion effects, was also not addressed, as it falls within the operational level of transportation planning. Fleet limitations were not incorporated either, because the research focused mainly on the analysis of transported grain volumes.
The article’s structure is presented as follows. Section 2 presents a literature review on pre-processing, storage, and transportation concepts. Section 3 describes the logistics network structure and the mathematical model formulation associated with the grain flow. Section 4 details the case study and the data used to evaluate the proposed mathematical model, followed by the sensitivity analysis. Finally, Section 5 presents the conclusions drawn from the analysis of the results.
2. Literature Review
To measure the profits and costs associated with the post-harvest process, a logistics network structure is developed for storage units and routes to enable grain reception, pre-cleaning, drying, storage, and transportation. The storage units’ static capacities are useful for determining the quantity of grain transported between origin and destination points, where the logistics network has multiple stocking periods [18]. Storage units undergo pre-processing operations, such as pre-cleaning to remove impurities and drying to reduce moisture, to comply with the required technical standards for storage and sale [5]. Specifically, farm-level storage units are located in producing regions, where grains are received immediately after harvest. Collecting-level storage units include outsourced activities by cooperatives for pre-cleaning, drying, and long-term storage, followed by routing to agribusinesses or ports. Intermediate-level storage units have robust operational capacity and are strategically located between producing regions and final destinations, such as agribusinesses or ports. Finally, terminal-level storage units are located at the destinations in the logistics chain [19].
In the scientific literature, grain pre-processing operations in logistics network structures are observed in Seyedzadeh et al. [20], where the quantity of agricultural products transported is determined by the deterioration rate during commercialization after pre-processing. Li et al. [21] structured a multi-period network for the pre-cleaning, drying, and containerization over three months. Furthermore, road and rail transport modals were adopted to transport up to 54 grain containers between producers and ports. In Motevalli-Taher et al. [22], a logistics network from production to export was developed, including storage levels and pre-processing capacity for harvest seasons, with storage analyzed at bi-weekly intervals to assess water consumption in agricultural production compared to the variation observed in grain exports. Daneshvar et al. [23] solve the problem of storage units and retailers for the transportation of highly perishable agricultural products. Retailer demand uncertainty prevents meeting customers’ complete needs, and the limited number of storage units for pre-processing results in vehicle queues in the yards. The logistics network was designed to optimize product flow, reduce yard waiting time, and improve vehicle selection to ensure efficient demand fulfillment. Similarly, Hosseini-Motlagh et al. [24] integrate producers, silos, flour mills, and demand zones into a logistics network for the deployment analysis of new storage units with pre-processing operations.
For storage and shipping, Rahbari et al. [25] assess the resilience of a grain transport network in Ukraine during the war, considering disruptions in supply, pollution reduction, and stock levels to meet expected demand. The logistics network structure includes producers, storage units at different levels, and market demand analyzed over a three-month horizon, with the focus on determining the quantity of grain shipped through the logistics network. Next, intermediate-level storage units intended for shipping to the final destination or redistribution are analyzed in Sharma et al. [26], in the context of COVID-19, to achieve a faster financial return for producers, subject to flow-blockade constraints. Maiyar and Thakkar [27] structured a logistics network to meet market demand through public and private storage units. However, when public storage units fail to meet market demand, private storage units assume the shipping to cover the unreached market demand. The shipments between storage units occur via road and rail transport, with the simultaneous use of both modals for the same destination not being permitted. Maiyar and Thakkar [28,29] subsequently adopted intermediate-level storage units to distribute grains via road and rail in India. Grain shipments between surplus and deficit storage units are always mediated by intermediate-level storage units, strategically located on major transport routes. Furthermore, the logistics network accounts for the impact of operational interruptions at storage units on grain transport.
The logistics network structure in Mogale et al. [30,31] analyzes the impact of installing storage units near production regions to expand the storage units’ static capacity across all levels, with a focus on reducing the environmental impacts of heavy vehicles transporting grains over long distances. Similarly, Mogale et al. [7] analyze market location and openness for grain purchases by the Indian government. In addition, Mogale et al. [32] developed a logistics network to address the lack of static storage capacity, with a focus on grain losses during transport and storage. Furthermore, the logistics network in Mogale et al. [33,34] describes the problem of grain transport and storage in India’s public distribution system. The first logistics network stage concerns road shipments between acquisition centers (origin nodes) and storage units in producing states. The second logistics network stage depicts the shipment between producing states’ storage units and destination nodes (silos in consuming states) via rail or road. The logistics network also focuses on planning intermodal transport for grains flow.
Maiyar and Thakkar [35] concentrate the storage units in specific regions to facilitate logistics network structuring and flow management. The storage units are classified into different storage and transshipment levels, interconnected by road and rail modals, with the logistics network structured to minimize grain losses during transshipment operations for an intermodal system. K.P. et al. [36] analyze the total or partial rail transport usage when transporting grains between storage units of different levels, focused on reaching a monthly stored quota prioritizing the transport for storage units with the lowest penalty associated with the full or partial use of static capacity, in addition to defining penalty applications on storage units with shipments lower than the average volume of past three months. Similarly, K.P. et al. [37] present a logistics network spanning four weeks to analyze total or partial rail transport usage. The discounts offered by the rail transport company depend on the storage units’ static capacity, market demand, and vehicle availability.
Faria et al. [38] discuss a simulation-optimization-based planning approach to minimize carbon emissions in intermodal grain transport by road and rail in Brazil. The logistics network is subject to uncertainties associated with seasonal production and market demand. The integration of collecting-level storage units and terminals, along with seasonal uncertainties, determines the quantity of grain transported and reduces heavy-vehicle pollutant emissions. Finally, López and Qassim [39] evaluate a logistics network with two levels. The upper level, composed of producers, and the lower level, composed of storage units connected by different transport modals. The logistics network interconnects the upper and lower levels, reducing road transport and expanding the use of waterways and rail, highlighting the economic and environmental advantages.
Based on the configuration of the logistics network for grain transportation, storage, and pre-processing, Mixed-Integer Linear Programming (MILP) and Mixed-Integer Nonlinear Programming (MINLP) are used to represent and optimize the post-harvest system, according to the network objectives, the adoption of multi-period, and the CO2 emissions analysis, as shown in Table 1.
Table 1.
Summary of the explored literature articles.
The MINLP is the most recurrent mathematical model type adopted for reducing grain transportation costs, incorporating constraints related to the storage facilities’ static capacity, grain flow conservation, and modal use, balancing logistics costs, environmental impacts, and demand service levels in the post-harvest stage. Articles on mathematical models applied to grain logistics also explored the use of different commercial solvers. López and Qassim [39], for example, solve a two-level mathematical model using LINGO optimization modeling software. Li et al. [21] adopted the SCIP solver to minimize grain pre-processing costs. Sharma et al. [26] and Rahbari et al. [25] used CPLEX in GAMS with the augmented epsilon-constraint method to reduce production costs and CO2 emissions. In contrast, Motevalli-Taher et al. [22] apply the branch-and-bound method to solve an exact mathematical formulation to reduce transportation costs and water use in grain production through Meta-Goal programming. Seyedzadeh et al. [20] combine the Data Envelopment Analysis (DEA) and the neural networks to minimize transportation costs and CO2 emissions, while also maximizing the generation of fixed and variable jobs associated with grain pre-processing. Faria et al. [38] and Mogale et al. [32] combine scatter search and tabu search with neural networks in a simulation-optimization environment to obtain reliable approximate solutions for minimizing transportation costs.
Daneshvar et al. [23] and Mogale et al. [30,33,34] employ genetic algorithms combined with the arithmetic optimization algorithm to minimize grain pre-processing, storage, dispatch, and transportation costs, as well as vehicle waiting time. Maiyar and Thakkar [27,28,29,35], and Mogale et al. [30,31] also address multi-objective mathematical models by using a modified version of Multi-objective Particle Swarm Optimization (MOPSODE) to minimize transportation costs, storage costs, and CO2 emissions. K. P. et al. [36] solve the grain wagon allocation problem through the Optimum Rake Allocation Algorithm (ORAA) to reduce transportation costs associated with delay penalties. Similarly, K.P. et al. [37] address the same problem by using an ad hoc heuristic called MGAA/ORAA, specifically developed to optimize railway wagon distribution and to incorporate technical and logistical factors, such as inventory and the static capacity of storage facilities. Finally, Hosseini-Motlagh et al. [24] used Hybrid Robust Possibilistic Programming (HRPP) combined with nonlinear programming to minimize transportation costs and economic losses due to demand non-fulfillment.
Logistics networks constitute a key element in managing grain flows among producers, storage units, and market demands, since they provide the structure for systematically evaluating pre-processing, storage, and transportation operations under different modal conditions in the post-harvest stage. As highlighted in the literature, static storage capacity constraints and the technical requirements of pre-processing directly shape flow configuration, transported volumes, and the network’s ability to respond to market demand, without accounting for grain losses resulting from the removal of different impurity and moisture levels. Despite this relevance, traditional grain logistics models largely focus on isolated transportation and storage decisions, without integrating pre-cleaning and drying operations into large-scale logistics planning. To address this gap, the present research proposes a multi-period and multi-level mathematical model that integrates, within a single decision-making framework, the costs and constraints of pre-processing, storage, and transportation, while also considering grain losses associated with impurity removal and moisture reduction, as well as profit maximization for producers and cooperative managers.
3. Materials and Methods
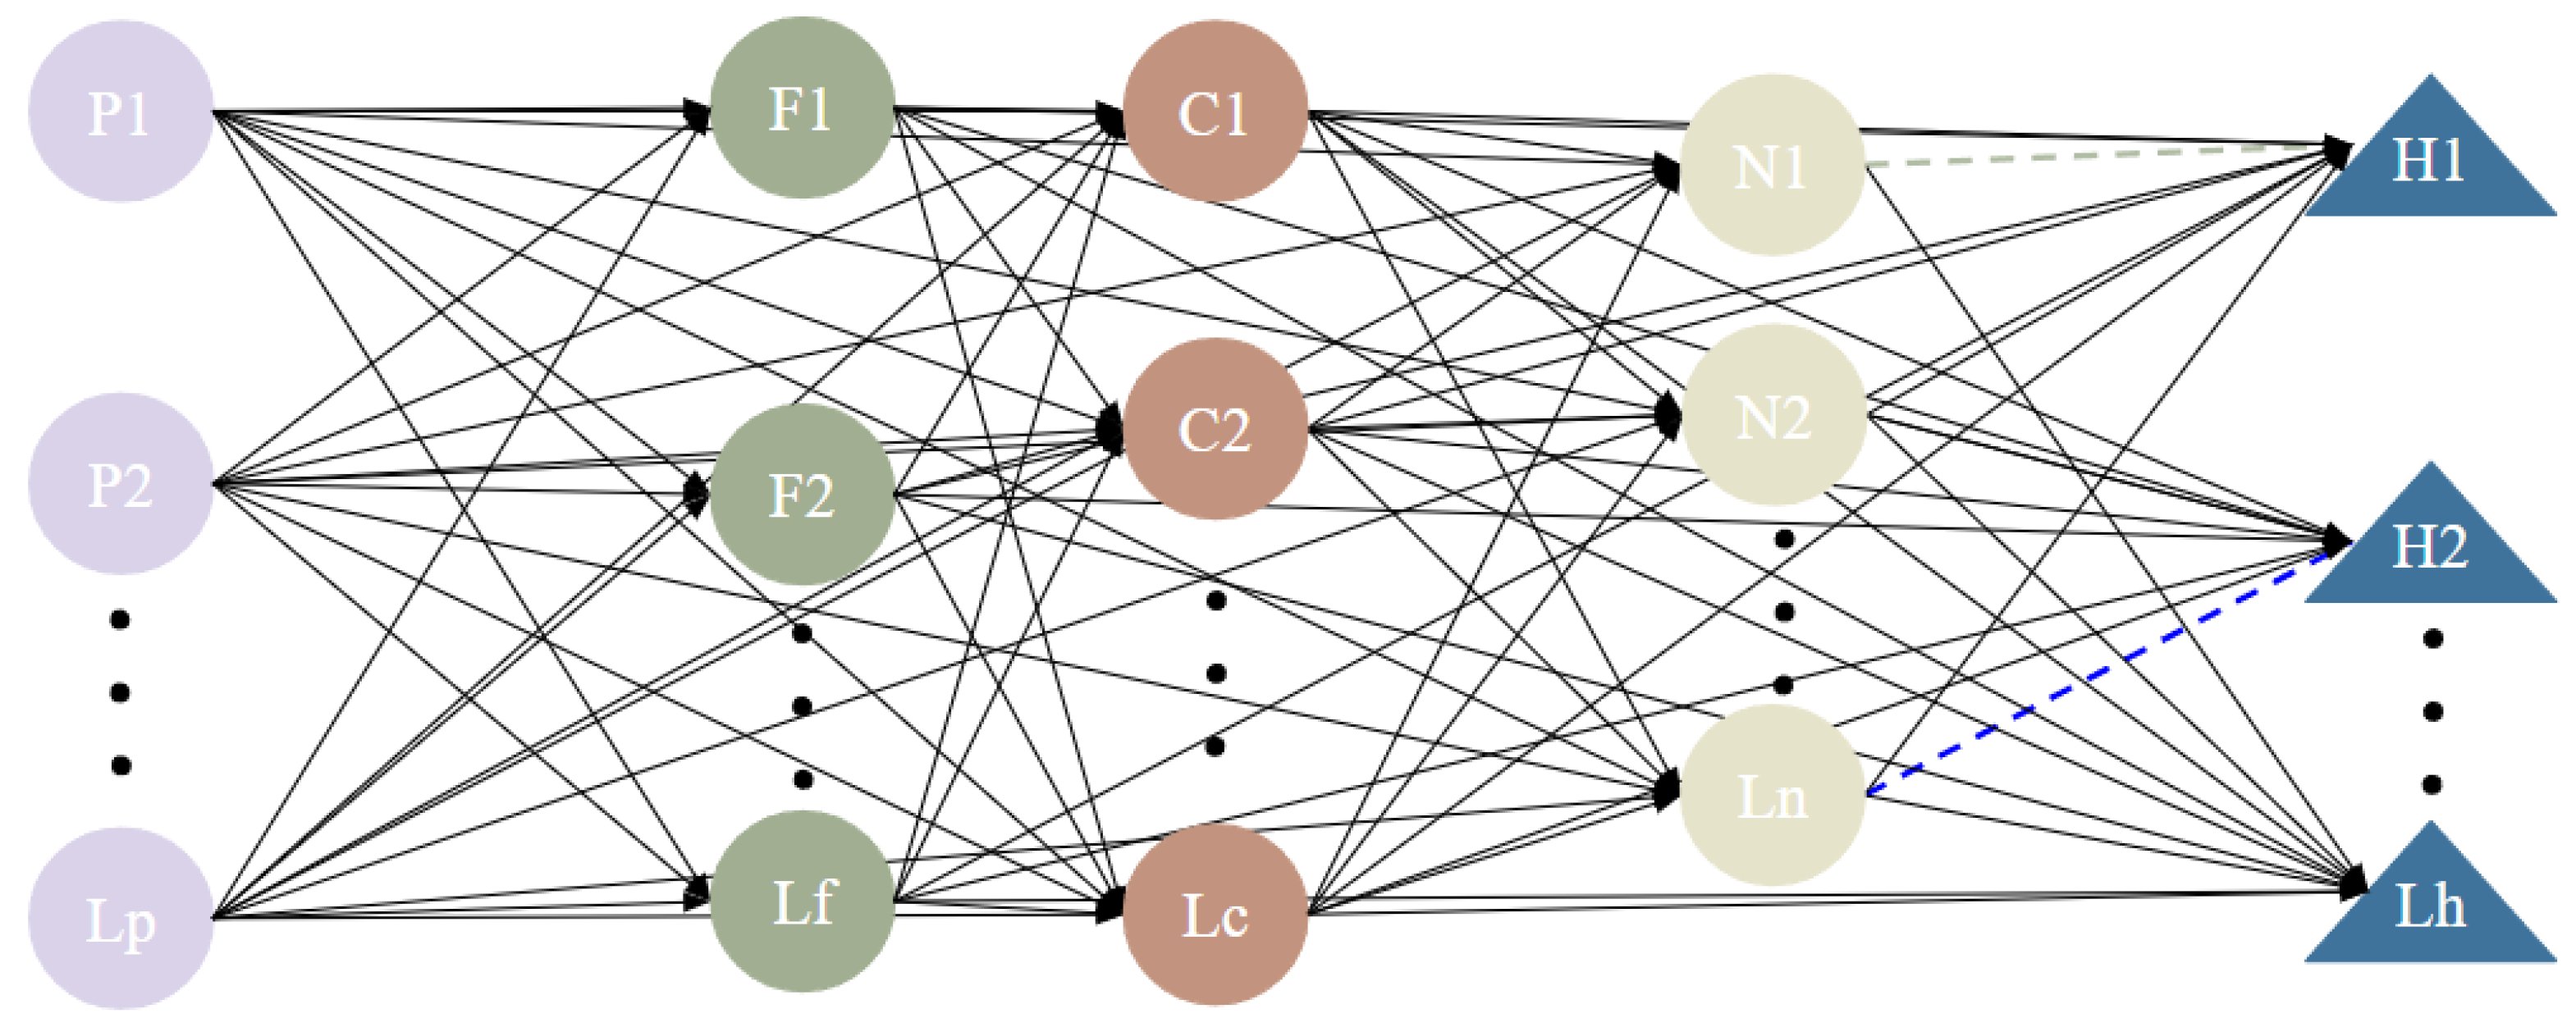
A generic logistics network for the post-harvest process was modeled as a graph , based on Vieira et al. [40], where V represents the set of nodes and A the set of edges, as illustrated in Figure 1. The set of nodes is defined as , where denotes the set of producers, the set of farm storage facilities, the set of collection centers, the set of intermediate storage facilities, and the set of agribusiness port terminals. For each producer, a production is assigned. In each storage unit, a static storage capacity per period and a pre-cleaning and drying cost for each grain moisture content are considered. In agribusinesses and ports, all demand of each period must be reached. The edges connect the nodes, indicating the use of road transport (black lines) or rail transport (dashed green and blue lines).
Figure 1.
Generic representation of the logistics network graph.
The logistics network outlines are established as follows: (i) single direction transports from producers to other nodes; (ii) all production must be harvested and undergo pre-cleaning and drying at storage units within the first two periods; (iii) the storage units receiving, pre-cleaning, drying, storage, and shipping capacity is limited, and the initial quantity of grain stored is equal to zero; and (iv) approximately 40% of clean and dry grains are used to cover production costs and are not used for sales, while the remaining 60% are transported to reach the demand from agribusinesses (local and national markets) and ports (international market) in a commercial format. The technical logistics factors for transportation include transportation costs, the quantity of grains transported, and the distance traveled. Regarding storage units, the technical logistics factors include pre-cleaning and drying costs, static capacity, quantity of clean and dry grains stored and transported over time, and grain losses.
Therefore, the optimization model defined on aimed to maximize the profit of the logistics network on the basis of grain production and market demand through the joint deduction of pre-cleaning and drying costs , storage costs , and transportation costs associated with grain flows from producers to agribusiness facilities and ports. The mathematical model consists of a multi-period, multi-level linear programming formulation for analyzing grain transportation across periods and among different levels of storage units. The formulation also simultaneously considers grain losses from pre-processing, selling prices across different periods, and transportation costs calculated based on actual distances between network nodes, supporting the decision-making process of producers and storage-facility managers in identifying the most advantageous periods for grain commercialization. The combined integration of transportation, storage, pre-processing, grain losses, selling prices, and real distances does not appear in the scientific articles examined in the literature review.
The decision variables represent the quantity of dirty and wet grains transported per period from producers to storage units by the road transportation mode, denoted by , the quantity of clean and dry grains transported per period from storage units to agribusinesses and ports by road modal m, denoted by , and the quantity of clean and dry grains stored per period at storage units, denoted by . The parameters and denote the selling price in period q and the distance between nodes i and j, respectively. All decision variables and parameters incorporated into the mathematical model were based on the systematic literature review developed by Vieira et al. [41].
Parameters:
- P: Sets of nodes representing the producers p;
- F: Sets of nodes representing farm-level storage units f;
- C: Sets of nodes representing the collecting-level storage units c;
- N: Sets of nodes representing the intermediate-level storage units n;
- H: Sets of nodes representing agribusinesses and ports h;
- Q: Set of periods, indexed by q;
- M: Sets of modals, indexed by m;
- : Sale price in the period q;
- : Cost of modal m;
- : Storage cost at node i;
- : Cost of pre-processing at node i;
- : Proportion of grains lost during pre-processing at node i;
- : Produced grains of producer p in the period q.
- : Distance from node i to node j;
- : Static capacity to node i in period q;
- : Market demands of agribusinesses and ports h in the period q.
Decision variables:
- : Quantity of dirty and wet grains transported from i to j using the road transport modal in period q;
- : Quantity of clean and dry grains transported from i to j using a modal m in period q;
- : Quantity of grains stored at node i in period q.
Mathematical model:
s.t.
The objective function (1) maximizes sales profit, accounting for transportation, pre-cleaning and drying, and storage costs. In the first part of the objective function, the quantity of clean and dry grains is multiplied by the selling price to define the revenue value. The second part calculates the transportation cost by multiplying the quantity of dirty and wet grains, the distance traveled, and the cost of modal used, in addition to the cost of pre-cleaning and drying in relation to the quantity of dirty and wet grains transported. In the third part, the storage cost is multiplied by the quantity of clean and dry grains per period. Finally, in the last part, the cost of transporting is calculated by multiplying the quantity of clean and dry grains, the distance traveled, and the cost of the modal used.
Constraint (2) ensures that all production of dirty and wet grains harvested by producers is transported in period q using the road transportation mode . Constraint (3) limits the quantity of clean and dry grains stored at node i during period q, based on the stock from the previous period. The inventory is updated by adding the quantity of clean and dry grains received and then subtracting the quantity of clean and dry grains sent to the next logistics structure levels. Also, only 60% of the dirty and wet grains are incorporated into the pre-processing, storage, and selling operations, because 40% are used to pay the producers’ production costs. In addition, the quantity of clean and dry grains is calculated on the basis of the loss rate resulting from impurity removal and moisture reduction. For each node i, a static storage capacity was assigned to the storage facilities during period q. For each node i, a static capacity in the storage units in period q for storage is assigned. Constraint (4) defines the complete fulfillment of all demand for clean and dry grains from agribusinesses and ports in each period q. Finally, constraints (5)–(7) describe the ongoing decision variables regarding the quantity of dirty and wet grains , clean and dry grains , and the quantity of stored grains , where is a box-constrained variable bounded between 0 and the upper limit .
Based on the origin-destination distances obtained after obtaining the optimal solution, the amount of CO2 emitted by grain transportation was calculated by multiplying the transported quantity by the traveled distance and by the emission factor of each transport mode, as described by MAPA [42]. CO2 emissions are not included in the objective function, given that the corresponding result represents a physical quantity of emissions, whereas the objective function is based on monetary values. Also, CO2 emissions are not included in the mathematical model constraints as the main objective focused on the grain flow analysis and the monetary values associated with transportation, storage, and pre-processing. Finally, the environmental analysis is developed to quantify the impact of grain transportation on CO2 emissions rather than to constrain logistics decisions. The multi-objective function was not considered because the mathematical model prioritizes profit maximization based on monetary variables, whereas CO2 emissions are treated as a complementary physical indicator, calculated afterward to assess the environmental impact of the logistics solutions obtained.
4. Results and Discussion
This section presents the application of the proposed mathematical model. Section 4.1 describes the case study, composed of three scenarios. Section 4.2 details the profit analysis of the scenarios, as well as the CO2 emissions associated with transportation in Section 4.3, the number of storage units used in Section 4.4, and the quantity of grains received per period in Section 4.5. Finally, Section 4.6 presents a sensitivity analysis to assess the variation in profit across storage units, grains moisture content, and total CO2 emissions. The computational experiments were processed using a Ryzen 5-3550H processor (Acer, São Paulo, Brazil) (3.6 GHz) with 16 GB of RAM, and Windows 11. The mathematical model was solved using the commercial solver CPLEX Studio IDE 20.1.0 with computational time ranging from 0.03 s (0.90 ticks) to 0.30 s (4.70 ticks).
4.1. Case Study
Information was collected from databases of Brazilian government agencies, and with a diagnosis from Vieira et al. [40] applied to eight producers and three cooperative managers. The diagnosis gathered relevant information for the logistics network construction and for the characterization of grain transportation and storage planning, including the production origin municipalities, harvested volume, transportation modals and service types used, criteria adopted for transport choice, transportation costs, transshipment terminal usage, grain flow recurrent delays, grain losses during transportation, storage locations, storage costs, destination changes motivated by capacity constraints or operational costs, as well as the highest volume of transported grains periods. Data obtained from government agencies provided the input parameters required for the mathematical model, such as transportation, storage, and pre-processing costs, transportation losses, storage units static capacities, selling prices, demand, production, and grain losses associated with impurity and moisture rates.
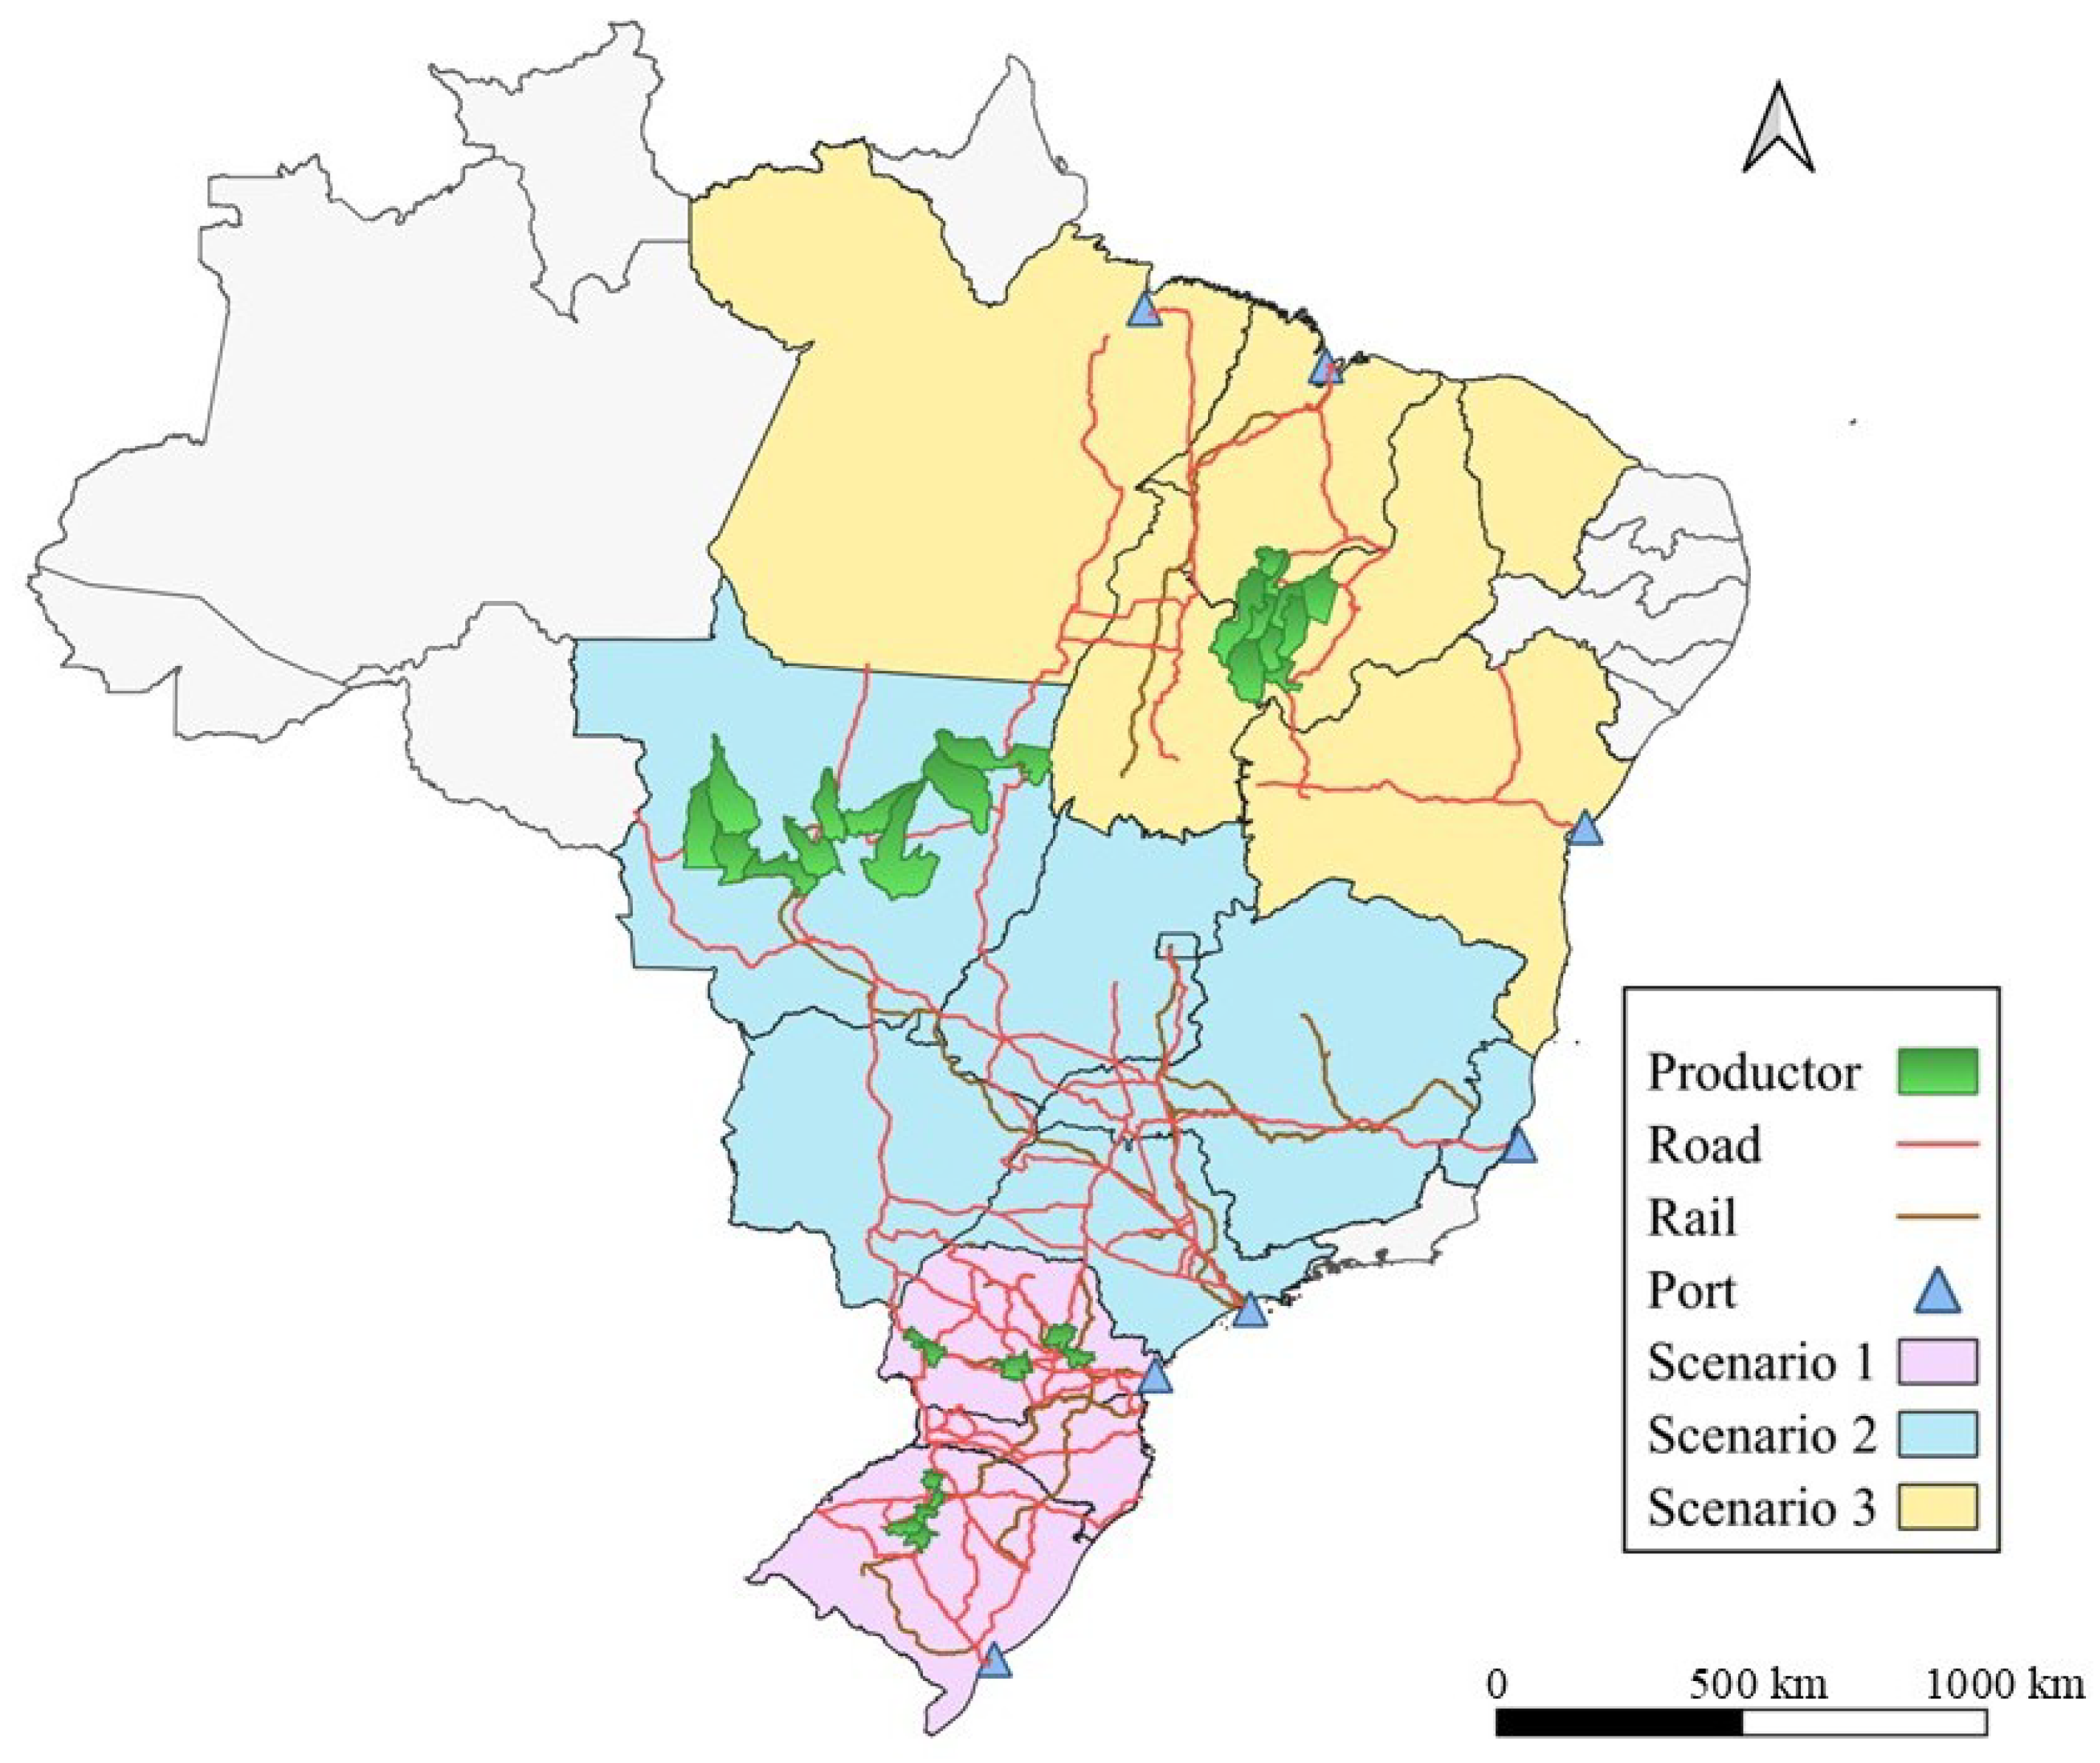
Thus, three scenarios were defined to represent different realities of the Brazilian soybean logistics network. Scenario 1 represents the southern region, characterized by consolidated storage units and road infrastructure for the grains flow. The logistics network includes 71 storage units at the collecting level, 31 storage units at the intermediate level, two ports, and nine agribusinesses. Scenario 2 corresponds to the central-west region, which has underdeveloped storage units for transportation. The logistics network considers 50 storage units at the collecting level, 18 storage units at the intermediate level, two ports, and 12 agribusinesses. Scenario 3 represents the northeast region, where infrastructure is in its early stages of development. The logistics network includes 26 storage units at the collecting level, five storage units at the intermediate level, three ports, and one agribusiness [4]. Figure 2 shows the map with the location of the producers and ports, as well as the road and rail routes of the three scenarios. The 12-month period considered for analysis is between March 2024 and February 2025 [43].
Figure 2.
Locations in the Brazilian logistics network context.
The producers in the three scenarios are the ten largest producers by production volume, ranging from 100,000 to 2 million tons of grain per year [44]. In addition, in each scenario, only 20% of producers operate on-farm storage facilities, and harvested grains contain between 13% and 18% moisture and impurities [43]. Storage units have static capacities ranging from 70,000 to 300,000 tons [4], and the geographic location and distances between producers and storage units were defined using QGIS v3.44 and Google Maps (v 19.0.0.). Furthermore, the moisture content of incoming dirty and wet grains at each storage unit is assumed to be random during the drying operation. Market demands from agribusinesses and ports were defined based on data from the Ministry of Agriculture and Supply [42]. Of the total clean and dry grains, 40% are reserved for paying producers’ production costs to storage units at the collecting level, 24% are reserved for agribusinesses’ market demand, and 36% are reserved for ports, with a focus on international market demand.
For storage in storage units, impurity removal during pre-cleaning and a moisture content of 12% during drying are required to ensure clean, dry grains. Impurity removal results in a 5% loss of the initial quantity, while the drying process causes losses of 2% to 8% [5]. The combined cost of pre-cleaning and drying in farm-level storage units ranges from US$ 2/t to US$ 3/t, and in intermediate-level and collecting-level storage units from US$ 3/t to US$ 5/t [45]. Chemical and biochemical processes were not considered in this research, and grains are stored at a fixed cost of US$ 2/t.
The selling prices are based on the average of the last 10 years, ranging from US$ 330/t to US$ 360/t [46]. The unitary operational cost for road transport is US$ 50/t, and for rail transport, it is US$ 30/t [43]. CO2 emissions associated with road transport are 0.164 kg of CO2 per ton per 1000 km traveled, and with rail transport, 0.0481 kg of CO2 per ton per 1000 km [47].
4.2. Profit
The profit maximization in the scenarios was achieved by considering the market demands of agribusinesses and ports, influenced by sales prices per period and subject to constraints related to factors such as transportation costs, storage unit location, and quantity of clean and dry grains, similarly explored in Mogale et al. [34] and Dwivedi et al. [48]. Table 2 presents the quantity of grains received by storage units, agribusinesses, and ports. The dirty and wet grains received by storage units come from producers, while the grains sold are clean and dry, received by agribusinesses and ports from storage units. Finally, the total profits obtained in each scenario after the sale are shown, discounted for transportation, pre-cleaning and drying, and storage costs. A description of the three scenarios’ parameters and results found is provided in Appendix A, in Table A1.
Table 2.
Quantity of grains (in tons) received and the profit (in million US$) obtained in each scenario.
In all three scenarios, more than 60% of dirty and wet grains are directed to collecting-level storage units for impurity removal and moisture reduction. The location of the collecting-level storage units is the main factor in directing dirty and wet grains, given their proximity to producers, agribusinesses, and ports. The second factor that determines the direction of dirty and wet grains is the availability of static capacity. For example, in Scenario 1, the collecting-level storage units are selected based on location and available static capacity, receiving 67% of all dirty and wet grains. In Scenario 2, 8,663,868 tons of dirty and wet grains (69% of the total) are received at the collecting-level storage units. In addition, the storage units’ static capacity is directly related to the potential volume of dirty and wet grains received for pre-cleaning and to the waiting time to unload heavy vehicles, which influences the formation of waiting lines in parking yards.
The results verified in the three scenarios agree with those of Mogale et al. [34], with profit being directly influenced by the volume of dirty and wet grains and clean and dry grains received by storage units at the farm, collecting, intermediate, agribusiness, and port levels, a volume conditioned by static capacity and the unloading rate of heavy vehicles. Furthermore, Faria et al. [38] estimate a profit of US$ 43.82 million for grain transportation using the rail modal exclusively. However, the economic result is based on rail transportation cost reduction rather than grain selling price. Similarly, Sun [9] reports an economic value of approximately US$ 323 thousand for the transport of about 1863 tons of grains, corresponding to approximately US$ 173/t. The value is close to that observed in Scenario 1, where the profit reached about US$ 127/t.
Consequently, the unloading capacity and the distance between storage units and producers impact the logistics network’s profit, since the transportation cost, calculated by multiplying the quantity of grain transported between storage units, the distance traveled, and the transport modal cost, subtracts the revenue value obtained by agribusinesses and ports. A profit of US$ 391,261,504.00 was obtained from the sale of 6,684,492 tons of clean and dry grains in Scenario 2. In Scenario 1, the profit of US$ 213,356,482.00 is associated with the sale of 1,668,474 tons of clean and dry grains. In Scenario 3, the profit is US$ 52,025,523.00, 76% lower than in Scenario 1, despite selling 27% more grains. The profit difference observed between scenarios 1 and 3 is influenced not only by the volume sold, but also by the distance between the storage units and the destinations. In Scenario 3, the average distance traveled between a storage unit of any level and an agribusiness or port is 624 km, 65% greater when compared to the average distance traveled between a storage unit of any level and an agribusiness or port in Scenario 1.
Table 3 shows the transportation costs throughout the storage units for the grains received.
Table 3.
Cost of transportation (in million US$) for received grains (in tons) in each scenario.
As transportation is impacted by the quantity of grain transported and the cost of the modal used, in Scenario 3, the cost of transporting dirty and wet grains is a consequence of the distances exceeding 1000 km between producers and storage units using heavy vehicles. Similarly, the transport of clean and dry grains between storage units at the farm, collecting, and intermediate levels to ports is covered over distances of less than 500 km by heavy vehicles. In Scenario 2, the total cost of transporting clean and dry grains is approximately 90% higher than that observed in Scenario 1 and 80% higher than that observed in Scenario 3, mainly due to the long distances exceeding 1500 km between storage units and ports using heavy vehicles. Conversely, in Scenario 1, transportation costs for both dirty and wet grains, and for clean and dry grains, are approximately 86% lower than in Scenario 2 and 89% lower than in Scenario 3, due to the geographical proximity among producers, storage units, ports, and agribusinesses, which favors logistical efficiency.
Modal choice and operational speed influence the transportation costs by up to US$ 25 million, equivalent to 50% of the transportation cost verified in Scenario 1. Jahani et al. [15] show that transportation costs depend on interactions among transportation modal choice, cargo quantities, and distances traveled. Specifically, for Maiyar and Thakkar [28], road transport adoption for dirty and wet grains between producers and storage units is driven by the accessibility and operational flexibility of road vehicles.
The transportation cost in Mizanbekov and Kalym [16] is approximately US$ 7.85/t, a value close to that observed in Scenario 1 (US$ 10.20/t). The similarity is associated with a more developed infrastructure of storage units and roadways in Scenario 1 compared with the other scenarios. In contrast, Mogale et al. [30] report substantially higher transportation costs, around US$ 102.40/t, a difference explained by the distinct analytical approach adopted. While Mogale et al. [30] minimize the overall logistics network cost, Mizanbekov and Kalym [16] focus on increasing operational efficiency per trip, considering grain losses as part of the logistics cost. In the present research, the transportation cost calculation considers traveled distance, transportation cost by mode, the quantity of grains transported, and grain losses resulting from grain pre-processing. Thus, logistics costs depend not only on the available infrastructure and the distances traveled, but also on the losses incorporated into the system and on the configuration of the logistics network.
In scenarios 1 and 2, rail transport is used to transport 33,000 and 1,755,542 tons of clean and dry grains, respectively, representing only 2% sold in Scenario 1 and 26% in Scenario 2. The difference in rail transport use between scenarios 1 and 2 is due to the average distance between intermediate-level storage units and ports: approximately 600 km in Scenario 1 and 1200 km in Scenario 2, which favors rail transport for moving large quantities of grains in Scenario 2. In Scenario 3, rail transport was not used because the transshipment storage unit is farther from producers and farm-level storage units than from agribusinesses and ports. Similarly, Mogale et al. [30] consider the transportation of 5.2 million tons of grains over approximately 800 km by rail, which reinforces the efficiency of rail transport for moving large volumes over long distances, as observed in Scenario 2. Uchuya López and Qassim [39] report a reduction in annual operating costs from US$ 4057.97 million to US$ 1034.54 million through the adoption of an intermodal system, corresponding to approximately 25% of the annual operating costs originally associated with the exclusive use of road transportation. In Scenario 3, transportation costs remain high, and rail transport is not adopted.
4.3. CO2 Emissions
By minimizing transportation costs, the distances traveled by different modals between producers, storage units, agribusinesses, and ports are obtained to quantify CO2 emissions in the three scenarios. Thus, Table 4 presents the CO2 emissions associated with transportation, by multiplying the distances covered by each modal, the quantities of grain transported, and the CO2 emission factors of each modal.
Table 4.
CO2 emissions (in kg) of transport to storage units and for sale.
The CO2 emissions from transporting dirty and wet grains in Scenario 3 are 99% higher compared to Scenario 1 and 24% higher compared to Scenario 2, due to the long distances traveled by road between producers and storage units at the collecting level. In contrast, the emissions associated with transporting clean and dry grains are reduced primarily by the storage units’ proximity to agribusinesses and ports at the collecting level in Scenario 1. In scenarios 2 and 3, CO2 emissions for transporting clean and dry grains destined for storage units, agribusinesses, and ports are 78% and 54% higher, respectively, compared to Scenario 1 due to the distances traveled by road.
In addition to the distances traveled, the choice of transport modal directly influenced CO2 emissions, as observed in Faria et al. [38], with a 2.8% reduction in CO2 emissions when considering the emission rate per liter of diesel consumed in the rail transportation of 51 million tons of grains. A similar pattern is observed especially in Scenario 2, in which the rail transportation of 1.755 million tons of clean and dry grains generated 219,330 kg of CO2, whereas road transportation for the same quantity resulted in 442,576 kg of CO2. In Scenario 1, the rail transportation of 33,000 tons of clean and dry grains generates 971 kg of CO2, while road transportation generates 2229 kg of CO2. In Scenario 3, all transportation is developed exclusively by road, reinforcing the emissions. Maiyar and Thakkar [29] estimate CO2 emissions ranging from 12 thousand kg to 617 thousand kg for different logistics network sizes, showing that both network configuration and modal choice significantly influenced the environmental system performance.
4.4. Quantity of Storage Units Used
Table 5 presents the origin-destination relations for receiving grains across the three logistics network scenarios, in terms of quantity and the proportion of storage units at the farm, collecting, and intermediate levels to meet the agribusinesses’ and port market demands.
Table 5.
Origin–destination relation for grain reception.
All farm-level storage units available to producers are completely full, since only 20% of producers have storage units on their properties, forcing producers to transport their products to storage units at other levels of the logistics network. Thus, more than 60% of the collecting-level storage units, distributed throughout the logistics network and with higher static capacity than farm-level storage units, are used by producers, thereby increasing transportation costs and CO2 emissions.
Due to the distances involved, intermediate-level storage units are not used as destinations for agribusinesses, with almost all receiving, pre-cleaning, and drying operations concentrated in the collecting-level storage units, as verified in Mardaneh et al. [49] and Daneshvar et al. [23]. The use of storage units to receive clean and dry grains for ports varies across the three scenarios. In Scenario 3, approximately 80% of intermediate-level storage units are used to transport grains to ports, a behavior linked to their favorable geographic location relative to both producers and ports. In Scenario 2, 76% of collecting-level storage units concentrate transport to ports, again due to their proximity to producing areas, thereby favoring grains flow consolidation given transportation costs. Finally, Scenario 1 shows a non-concentrated use of collecting-level and intermediate-level storage units for ports, characterizing a dispersed spatial distribution in the logistics network among producers, storage units, and final destinations, with lower operational intensity than the other two scenarios.
In Mogale et al. [30], variation in the number of storage units used for grain procurement directly influences the performance of the logistics network. When the number of centers increases or decreases by 60%, the total cost varies by 41% and 27%, respectively, while the lead time varies by 122% and 45%, respectively. Comparison with the present research indicates that the spatial configuration of the network and the degree of concentration of storage units directly influence logistics cost, operational intensity, and the environmental performance of the system.
4.5. Quantity of Grains Received per Period
To illustrate the grains flow dynamics in the logistics network by period, Table 6 shows the quantity of grains received by storage units in Scenario 2. Dirty and wet grains in periods 1 and 2 are sent by producers and received by storage units at the farm, collecting, and intermediate levels. From period 3 onward, only clean and dry grains are transported to intermediate units, agribusinesses, and ports. Throughout periods 3 to 12, the agribusinesses and ports maintain a constant reception rate, while the intermediate storage units vary, resulting in differences in total received in each period.
Table 6.
Quantity of grains (in tons) received per period in Scenario 2.
The first two periods involve harvesting, followed by pre-cleaning and drying of the dirty and wet grains destined for storage. In scenarios 1 and 3 (Appendix A—Table A2 and Table A3), the static capacity of the farm-level storage units is fully utilized in the first two periods due to the proximity of the producing regions, significantly reducing transportation costs in the logistics network. Furthermore, the costs associated with pre-cleaning and drying are 30% lower compared to storage units at other levels, due to outsourced services. Given the limitations of static capacity and the distances between storage units, the flow of dirty and wet grains is distributed differently across the logistics network in the three scenarios. In Scenario 1, approximately 17% of the dirty and wet grains are received by farm-level storage units, 65% by collecting-level storage units, and 14% by intermediate-level storage units. In Scenario 2, 20% of the dirty and wet grains are received by farm-level storage units, 60% are directed to collecting-level storage units, and the remaining 20% are mandatorily transported to the next level of the logistics network. In Scenario 3, farm-level storage units receive 28% of the dirty and wet grains, collecting-level storage units 53%, and intermediate-level storage units 9%.
Variations in the distribution of dirty and wet grains across storage units increase the complexity of logistics planning and transportation routes, requiring coordination among pre-cleaning, drying, storage, and transportation operations throughout the periods analyzed, as verified in Mogale et al. [30]. In addition, managing grain flow through collecting-level and intermediate-level storage units increases pre-cleaning, drying, storage, and transportation costs due to the outsourcing of operational services. In Maiyar and Thakkar [35], demand continues to be attended, but the average total cost increases by 14%. Furthermore, the concentration of 40% of grain transportation in a single period, coupled with multiple disruptions, determines a stronger dependence on intermediate and transshipment units, and increases logistics network costs and operational vulnerability.
Next, periods 1 to 5 and 7 to 12 are used for receiving 46% of clean and dry grains in Scenario 2 by storage units at the collecting and intermediate levels, highlighting the volume received in periods 3 and 8, which contributes to the final cost of storing clean and dry grains of approximately US$ 60 million, 75% higher compared to Scenario 1 and 66% higher compared to Scenario 3. In addition, in 11 periods in Scenario 2, clean and dry grains are stored rather than sold, resulting in additional costs, whereas in scenarios 1 and 3, costs are reduced due to higher turnover. Thus, the use of static capacity to store clean and dry grains varies across scenarios, depending on the structure and location of available storage units within the logistics network. In this way, the quantity of clean and dry grains during the highest-volume reception periods helps identify logistical bottlenecks.
The high volume of grains received by storage units in a single period causes unloading delays and intensifies operational bottlenecks. In K. P. et al. [36], within a four-week planning horizon, only one weekly allocation per warehouse is allowed. Therefore, the risk of delay penalties associated with unloading a full train is 2.52 times higher than that observed for a partially loaded train, due to the higher penalty cost and the difference in free unloading time. Thus, periods with higher grain unloading volumes between storage units place greater pressure on receiving capacity and require stricter planning of unloading and storage operations.
Understanding the dynamics of grain quantities received, the distribution over periods, and the storage units with the highest intake contributes to the unloading operations planning and to the reduction of operational bottlenecks, as verified for example in Li et al. [21], where a reduction of US 10.15 million in transportation and storage costs through the advance planning at intermediate-level storage units over the three analyzed periods is observed.
4.6. Sensibility Analysis
A sensitivity analysis was performed to evaluate the controlled variations in static capacity, moisture content, and production effect on the profit maximization associated with grain flow, based on the scenarios explored.
According to Coradi et al. [5], farm-level storage units allow pre-cleaning and drying of dirty and wet grains, with operational costs up to 30% lower than storage units at other levels. Therefore, to understand the impact of pre-cleaning and drying costs, the static capacities of the farm-level storage units were increased to accommodate the complete pre-cleaning, drying, and storage of all dirty and wet grains required by the market. Table 7 presents the quantity of grains received, the transportation costs, and the profits obtained considering the proposed static capacity change.
Table 7.
Quantity of grains (in tons) received and the profit obtained in each scenario, changing the farm-level storage units’ static capacities.
Compared to the results obtained with profit maximization for the case study explored (Table 1), the quantity of dirty and wet grains received by farm-level storage units in Scenario 1 increases by 81%, reducing transportation costs by 46% by eliminating transport to collecting and intermediate-level storage units, resulting in an increased profit by 15%. Also, the farm-level storage units are close to the collecting and intermediate-level storage units. In Scenario 2, profit increased by 13% due to a 6% reduction in transportation costs, a consequence of 77% more grains received by farm-level storage units. In Scenario 3, profit increased by 26%, reducing transportation costs by 67% and shifting the dirty and wet grain destination to farm-level storage units by 70%. Thus, the new farm-level storage capacity available reduces the cost of pre-cleaning all dirty and wet grains, improving producers’ competitiveness and achieving higher profit margins. Furthermore, storing in on-farm storage units allows producers to control marketing, focusing on sales primarily during the off-season, when prices are higher.
In Mardaneh et al. [49], storage at farm-level storage units is economically advantageous for grain producers, providing a profit increase of 4.3% in all scenarios compared with the baseline case. The argument received additional support in Motevalli-Taher et al. [22], which highlights the storage as an essential stage for preserving grain quality after harvest, where wheat is stored in silos before transport to factories, showing the storage time relevance to supply chain performance and the demand for storage capacity expansion close to the origin to increase logistics flexibility.
Next, the moisture removed after harvesting affects the quantity of grains transported between storage units and, consequently, sold to industries and ports, mainly due to losses during drying [43]. Table 8 presents the quantity of grains sold and the profit obtained, changing the moisture of all dirty and wet grains provided by the producers to a moisture rate of 12%, using as a reference the random moisture tax adopted in the case study explored. Considering all scenarios, the moisture rate, which increased from 13% to 18%, progressively reduced the quantity of grain sold and, consequently, altered profits, with a moderate average sensitivity of 13%.
Table 8.
Profit (in milion US$) and quantity of grains (in tons) available for sale defined according to the dirty and wet grains’ moisture rate.
The 13% level generates the highest profit in all three scenarios, whereas the gradual increase up to 18% simultaneously reduces profit and the quantity of clean and dry grains sold. Between the 13% and 18% levels, profit decreases from 11.5% to 53.6%, with the highest sensitivity observed in Scenario 3. The reduction in profit is due to higher grain-drying costs and increased transport costs when transporting grains with higher moisture content. The increase in transport cost due to higher moisture content is also observed in Motevalli-Taher et al. [22], with a 38% increase in transportation cost in relation to an 88% increase in grain moisture content.
According to MAPA [42], the Brazilian grain production increased by approximately 30% over 10 years, affecting mainly the road transport demand and, consequently, increasing CO2 emissions. Table 9 presents the relation between the profit obtained with a greater quantity of grains produced and CO2 emissions for all three scenarios over two years, considering the production used in the case study as a reference.
Table 9.
Profit (in milion US$) and quantity of CO2 (in kg) emitted according to the production increase.
Increasing production by 30% in Scenario 1 resulted in an approximate increase of 51,875 kg of CO2, associated with an average distance traveled of 261 km using road transport. In Scenario 2, an additional 504,804 kg of CO2 are emitted over an average distance traveled of 507 km using road transport. In Scenario 3, an additional 276,164 kg of CO2 are associated with a distance traveled of 624 km. The 76% difference in profit and the 80% difference in CO2 emissions between scenarios 1 and 3 occurred due to the distance traveled between producers, storage units, agribusinesses, and ports by road transport. The lack of storage facilities and adequate road infrastructure to accommodate the increased production in Scenario 3 forced heavy vehicles to travel longer distances, increasing CO2 emissions by 80%, even though sales volume is approximately 23% higher than in Scenario 1.
The increase in CO2 emissions after the 30% production expansion is a combined effect of longer road-haul distances, the road transport predominance, and the lack of storage capacity close to production areas, as is verified in Rahbari et al. [25], in Sharma et al. [26], and in Mogale et al. [30]. Therefore, the lower profit and higher CO2 emissions observed in Scenario 3 can be explained not only by the larger production volume, but mainly by the longer road distances imposed by the lack of nearby storage facilities and adequate infrastructure.
The sensitivity analysis reveals the influence of distance and static capacity on the mathematical model results, especially profit and post-harvest transportation, storage, and pre-processing costs. Distance directly affects transportation cost, profit, and CO2 emissions, according to Rahbari et al. [25]. Static capacity conditions the quantity of grains transported between storage units and the grain flow across periods, with direct effects on storage costs. K. P. et al. [36] emphasize the role of storage unit capacity in grain reception, unloading operations, and total post-harvest cost. Within the evaluated ranges, the parameters associated with pre-processing costs, storage costs, and grain losses during pre-cleaning and drying have a lower relative influence on profit and post-harvest costs than distance and static capacity. A similar interpretation appears in Li et al. [21], since transportation represents the largest share of total supply chain cost, at 69.7%, whereas inventory accounts for 21.1% and operating costs for 9.2%, highlighting the predominance of logistics movement components over the remaining cost elements.
5. Conclusions
The production and marketing of grains highlight Brazil in the international market, which demands strict physical control qualities. In the post-harvest process, excessive outsourcing of reception, pre-cleaning, and drying operations, focused on quality control, in collecting-level storage units, increases operational costs by 30%. In addition, for 80% of Brazilian producers, farm-level storage units with reception, pre-cleaning, and drying operations are unavailable, creating a lack of static capacity near producers and complicating transport planning and control due to the multiplicity of routes to collecting-level storage units.
The transport of dirty and wet grains to storage units shows the predominance of road transport, which concentrates logistical flows, increases congestion, and raises transportation costs due to the distances traveled. The presence of impurities and moisture in harvested grains increases the weight transported, allowing material displacement that could be removed during pre-cleaning and drying operations within farm-level storage units rather than in collecting-level storage units.
To aid post-harvest logistical planning, a mathematical model based on a graph of a generic logistics network was proposed, enabling analysis of three distinct scenarios in the Brazilian grain flow context, specifically for soybeans. The mathematical model was solved through a deterministic approach to maximize profit based on revenue from grain commercialization discounted by transportation, storage, and pre-processing costs, defining the origin–destination pairs, as well as the quantities of dirty and wet grains and clean and dry grains transported in each period to reach the market demand. As a limitation, the mathematical model did not consider heavy vehicles’ loading and unloading times, nor the uncertainty associated with grain selling prices.
In Scenario 1, sales yield a relatively high profit due to shorter distances between origins and destinations (producers, storage units, agro-industries, and ports), with grain flow concentrated in only three periods. Consequently, CO2 emissions are low. The use of storage units for reception, pre-cleaning, and drying operations is decentralized due to the available quantity and spatial distribution of the storage units. Scenario 2 produces the largest quantity of grains, resulting in higher proportional profits and CO2 emissions. The distance between origins and destinations affects transportation costs, even as rail transport use increases. The distances between producers and storage units concentrate the reception, pre-cleaning, and drying operations, reinforcing the outsourcing effect on transportation costs. Grain transport between storage units at the collecting and intermediate levels is verified in almost all periods, intensifying CO2 emissions and dependence on road transport. Scenario 3 presents the lowest profit, as well as proportionally high transportation costs and CO2 emissions relative to the quantities of grain transported. The long distances traveled and the lack of storage units near producers led to the transport of mainly dirty and wet grains over long distances. Another aggravating factor is the lack of intermediate-level storage units for rail transport transshipment, given the distances between producers and ports that require road transport.
In summary, the location and static capacity of storage units at the collecting and intermediate levels directly influence grain transportation and the use of storage units in the post-harvest process. This concentration increases the use of heavy vehicles to transport dirty and wet grains, raising transportation costs and CO2 emissions and compromising the efficiency of the post-harvest process. The location and static capacity of collecting-level and intermediate-level storage units directly influenced grain transportation and the use of storage units in the post-harvest process. The flow concentration in storage units increased the use of heavy vehicles for transporting dirty and wet grains, raised transportation costs and CO2 emissions, and reduced post-harvest processing efficiency. In addition, traffic congestion and deficiencies in Brazil’s road infrastructure further aggravated grain outflow. The intense movement of heavy vehicles on highways increases congestion, while poor pavement conditions and structural limitations of the roads hinder the grains flow. Moreover, the lack of integration with rail and waterway systems contributed to higher demand for heavy vehicle transportation, increasing CO2 emissions.
To improve grain transportation, the Brazilian government published the National Logistics Plan (PNL), with emphasis on expanding and modernizing the transport corridors used for the outflow of agricultural production. However, the PNL did not include a specific analysis of storage unit locations. In this context, the present research contributed to identifying the routes that require attention and urgent rehabilitation between storage units. For producers, the results supported decision-making regarding grain destination, storage unit selection, and the most advantageous period for commercialization. For cooperative managers, the research contributed to intermodal routing planning and to the efficient use of storage units’ static capacity.
For future research, a detailed analysis of the influence of loading and unloading times at storage units was recommended in order to reduce queues and vehicle waiting times in storage yards. The development of an operational schedule for the heavy vehicles’ arrival and the trains’ departure is also recommended, as well as the synchronization between transport modals through stochastic methods, allowing a representation of the uncertainties associated with vehicle arrival times, variations in loading and unloading times, operational equipment availability, and grain flow fluctuations across periods.
Author Contributions
Conceptualization, J.V.; methodology, J.V., P.C.C. and O.A.; validation, A.N.J., P.C.C. and V.A.; formal analysis, J.V. and A.N.J.; investigation, J.V.; resources, J.V. and A.N.J.; data curation, J.V.; writing—original draft preparation, J.V.; writing—review and editing, A.N.J., P.C.C., O.A. and V.A.; visualization, A.N.J.; supervision, A.N.J., P.C.C., O.A. and V.A.; project administration, A.N.J.; funding acquisition, J.V. and A.N.J. All authors have read and agreed to the published version of the manuscript.
Funding
This work was supported by the Brazilian National Council for Scientific and Technological Development (CNPq) under Grant number 406917/2023-0, 312474/2023-7 [Alvaro Neuenfeldt Júnior] and 141576/2024-3 [Jonathan Vieira], and by the Rio Grande do Sul/Brazil Research Foundation (FAPERGS) under Grant number 24/2551-0000761-0 [Alvaro Neuenfeldt Júnior]. The funder had no role in study design, data collection and analysis, decision to publish, or preparation of the manuscript.
Institutional Review Board Statement
Ethical review and approval were waived for this study by Institution Committee due to Legal Regulations (https://www.gov.br/conselho-nacional-de-saude/pt-br/atos-normativos/resolucoes/2016/resolucao-no-510.pdf/view, accessed on 9 April 2026).
Informed Consent Statement
Verbal consent was obtained rather than written because the research presented no more than minimal risk of harm to subjects and involved no procedures for which written consent is normally required outside of the research context.
Data Availability Statement
The raw data supporting the conclusions of this article will be made available by the authors on request.
Conflicts of Interest
The authors declare no conflicts of interest.
Appendix A
Table A1.
Case study parameters and results found for the three scenarios.
Table A2.
Quantity of grains (in tons) received per period in Scenario 1.
Table A3.
Quantity of grains (in tons) received per period in Scenario 3.
References
- United States Department of Agriculture. Graphical Query: Top Countries by Commodity. Available online: https://apps.fas.usda.gov/psdonline/app/index.html#/app/topCountriesByCommodity/chart125 (accessed on 13 August 2025).
- Brazilian Agriculture Bulletin in Numbers. Available online: https://www.gov.br/agricultura/pt-br/assuntos/politica-agricola/todas-publicacoes-de-politica-agricola/agropecuaria-brasileira-em-numeros/abn-2024-12.pdf (accessed on 13 August 2025).
- Taşkiner, T.; Bilgen, B. Optimization models for harvest and production planning in agri-food supply chain: A systematic review. Logistics 2021, 5, 52. [Google Scholar] [CrossRef] [Scilit]
- National Supply Company (CONAB). Brazil Warehouses Portal. Available online: https://app.powerbi.com/view?r=eyJrIjoiNDdkNDM4ZjctYzk0OS00NWVjLWFlYjktZWQ4Njg3MDEyMTg0IiwidCI6ImU2ZDkwZGYzLWYxOGItNGJkZC04MDhjLWFhNmQwZjY4YjgwOSJ9 (accessed on 13 August 2025).
- Coradi, P.C.; Camilo, L.J.; da Cunha, F.F.; Pereira, T.L.L.; Alves, C.Z. Alternatives of storage of corn grains for the conditions of the Brazilian cerrado. Bioscience 2016, 32, 29–40. [Google Scholar] [CrossRef] [Scilit]
- Reis, S.A.; Leal, J.E.; Thomé, A.M.T. A Two-Stage Stochastic Linear Programming Model for Tactical Planning in the Soybean Supply Chain. Logistics 2023, 7, 49. [Google Scholar] [CrossRef] [Scilit]
- Mogale, D.G.; Kumar, S.K.; Tiwari, M.K. Green food supply chain design considering risk and post-harvest losses: A case study. Ann. Oper. Res. 2020, 295, 257–284. [Google Scholar] [CrossRef] [Scilit]
- SteadieSeifi, M.; Dellaert, N.P.; Nuijten, W.; Van Woensel, T.; Raoufi, R. Multimodal freight transportation planning: A literature review. Eur. J. Oper. Res. 2014, 233, 1–15. [Google Scholar] [CrossRef] [Scilit]
- Sun, Y. Green and reliable freight routing problem in the road-rail intermodal transportation network with uncertain parameters: A fuzzy goal programming approach. J. Adv. Transp. 2020, 2020, 7570686. [Google Scholar] [CrossRef] [Scilit]
- Crainic, T.G.; Laporte, G. Planning models for freight transportation. Eur. J. Oper. Res. 1997, 97, 409–438. [Google Scholar] [CrossRef] [Scilit]
- Bierwirth, C.; Kirschstein, T.; Meisel, F. On transport service selection in intermodal rail/road distribution networks. Bus. Res. 2012, 5, 198–219. [Google Scholar] [CrossRef] [Scilit]
- Elbert, R.; Müller, J.P.; Rentschler, J. Tactical network planning and design in multimodal transportation—A systematic literature review. Res. Transp. Bus. Manag. 2020, 35, 100462. [Google Scholar] [CrossRef] [Scilit]
- Aloui, A.; Hamani, N.; Delahoche, L.; Daghfous, A. Systematic literature review on collaborative sustainable transportation: Overview, analysis and perspectives. Transp. Res. Interdiscip. Perspect. 2021, 9, 100291. [Google Scholar] [CrossRef] [Scilit]
- Harks, T.; Kleinert, T.; Klimm, M. An integrated approach to tactical transportation planning in logistics networks. Transp. Sci. 2016, 50, 439–460. [Google Scholar] [CrossRef] [Scilit]
- Jahani, H.; Rabbani, M.; Keyvanshokooh, E.; Tavakkoli-Moghaddam, R. Supply chain network design with financial considerations: A comprehensive review. Eur. J. Oper. Res. 2024, 312, 799–839. [Google Scholar] [CrossRef] [Scilit]
- Mizanbekov, I.; Kalym, K. Identification of transport and technological problems in the grain product subcomplex. East.-Eur. J. Enterp. Technol. 2024, 2, 15–25. [Google Scholar] [CrossRef] [Scilit]
- Beresford, A.K.C.; Banomyong, R.; Pettit, S. A Critical Review of a Holistic Model Used for Assessing Multimodal Transport Systems. Logistics 2021, 5, 11. [Google Scholar] [CrossRef] [Scilit]
- Yadav, V.S.; Singh, A.R.; Raut, R.D.; Narkhede, B.E. A systematic literature review of the agro-food supply chain: Challenges, network design, and performance measurement perspectives. Sustain. Prod. Consum. 2022, 29, 685–704. [Google Scholar] [CrossRef] [Scilit]
- Valente, D.S.M. Development of a Decision Support System with Internet Access for Cost Determination in Storage Units. Ph.D. Thesis, Universidade Federal de Viçosa, Viçosa, MG, Brazil, 2007. [Google Scholar]
- Seyedzadeh, Z.; JabalAmeli, M.S.; Dehghani, E. Towards a sustainable viticultural supply chain under uncertainty: Integration of data envelopment analysis, artificial neural networks, and a multi-objective optimization model. Sci. Total Environ. 2025, 970, 178980. [Google Scholar] [CrossRef] [Scilit]
- Li, J.; Zhang, Y.; Ivanov, D.; Dolgui, A. Optimization of green containerized grain supply chain transportation problem in Ukraine considering disruption scenarios. Sustainability 2023, 15, 7620. [Google Scholar] [CrossRef] [Scilit]
- Motevalli-Taher, F.; Paydar, M.M.; Emami, S. Wheat sustainable supply chain network design with forecasted demand by simulation. Comput. Electron. Agric. 2020, 178, 105763. [Google Scholar] [CrossRef] [Scilit]
- Daneshvar, A.; Gholamian, M.R.; Karimi, B.; Naderi, B. Design of an optimal robust possibilistic model in the distribution chain network of agricultural products with high perishability under uncertainty. Sustainability 2023, 15, 11669. [Google Scholar] [CrossRef] [Scilit]
- Hosseini-Motlagh, S.-M.; Samani, M.R.G.; Saadi, F.A. A novel hybrid approach for synchronized development of sustainability and resiliency in the wheat network. Comput. Electron. Agric. 2020, 168, 105095. [Google Scholar] [CrossRef] [Scilit]
- Rahbari, M.; Nasiri, M.M.; Werner, F.; Iranmanesh, S. Wheat supply chain network design: Lesson for resilience and sustainability in a situation of war and crisis. J. Knowl. Econ. 2026, 17, 5972–6016. [Google Scholar] [CrossRef] [Scilit]
- Sharma, D.; Kumar, A.; Tiwari, M.K.; Jaggi, C.K. Reconfiguration of food grain supply network amidst COVID-19 outbreak: An emerging economy perspective. Ann. Oper. Res. 2024, 335, 1177–1207. [Google Scholar] [CrossRef] [Scilit] [PubMed]
- Maiyar, L.M.; Thakkar, J.J. A combined tactical and operational deterministic food grain transportation model: Particle swarm based optimization approach. Comput. Ind. Eng. 2017, 110, 30–42. [Google Scholar] [CrossRef] [Scilit]
- Maiyar, L.M.; Thakkar, J.J. Environmentally conscious logistics planning for food grain industry considering wastages employing multi objective hybrid particle swarm optimization. Transp. Res. Part E Logist. Transp. Rev. 2019, 127, 220–248. [Google Scholar] [CrossRef] [Scilit]
- Maiyar, L.M.; Thakkar, J.J. Robust optimisation of sustainable food grain transportation with uncertain supply and intentional disruptions. Int. J. Prod. Res. 2019, 58, 5651–5675. [Google Scholar] [CrossRef] [Scilit]
- Mogale, D.G.; Kumar, M.; Kumar, S.K.; Tiwari, M.K. Grain silo location-allocation problem with dwell time for optimization of food grain supply chain network. Transp. Res. Part E Logist. Transp. Rev. 2018, 111, 40–69. [Google Scholar] [CrossRef] [Scilit]
- Mogale, D.G.; Ghadge, A.; Kumar, S.K.; Tiwari, M.K. Modelling supply chain network for procurement of food grains in India. Int. J. Prod. Res. 2019, 58, 6493–6512. [Google Scholar] [CrossRef] [Scilit]
- Mogale, D.G.; Cheikhrouhou, N.; Tiwari, M.K. Modelling of sustainable food grain supply chain distribution system: A bi-objective approach. Int. J. Prod. Res. 2019, 58, 5521–5544. [Google Scholar] [CrossRef] [Scilit]
- Mogale, D.G.; Dolgui, A.; Kandhway, R.; Kumar, S.K.; Tiwari, M.K. A multi-period inventory transportation model for tactical planning of food grain supply chain. Comput. Ind. Eng. 2017, 110, 379–394. [Google Scholar] [CrossRef] [Scilit]
- Mogale, D.G.; Kumar, S.K.; Marquez, F.P.G.; Tiwari, M.K. Bulk wheat transportation and storage problem of public distribution system. Comput. Ind. Eng. 2017, 104, 80–97. [Google Scholar] [CrossRef] [Scilit]
- Maiyar, L.M.; Thakkar, J.J. Modelling and analysis of intermodal food grain transportation under hub disruption towards sustainability. Int. J. Prod. Econ. 2019, 217, 281–297. [Google Scholar] [CrossRef] [Scilit]
- K.P., A.; Panicker, V.V.; Ravi, V. Multi-objective optimization algorithms for freight allocation in a food grain supply chain. Appl. Soft Comput. 2025, 171, 112729. [Google Scholar] [CrossRef] [Scilit]
- K.P., A.; Panicker, V.V. Multimodal transportation planning with freight consolidation and volume discount on rail freight rate. Transp. Lett. 2022, 14, 227–244. [Google Scholar] [CrossRef] [Scilit]
- Faria, C.H.F.; Almeida, J.F.F.; Pinto, L.R. Simulation–optimisation approach for sustainable planning of intermodal logistics in the Brazilian grain export industry. Decis. Anal. J. 2024, 10, 100388. [Google Scholar] [CrossRef] [Scilit]
- López, J.J.U.; Qassim, R.Y. A novel modelling approach for the redesign of supply chains: An application to soybean grain supply chains. Res. Transp. Bus. Manag. 2023, 51, 101037. [Google Scholar] [CrossRef] [Scilit]
- Vieira, J.; Neuenfeldt Júnior, A.; Alves, V.; Araújo, O. A mathematical model to maximize the grain transport planning profit. Transp. Res. Interdiscip. Perspect. 2026, 35, 101773. [Google Scholar] [CrossRef] [Scilit]
- Vieira, J.; Neuenfeldt Júnior, A.; Alves, V.; Bouzon, M.; Francescatto, M. The intermodal transport tactical planning: A literature review on the use of transportation modes for cargo delivery. An. Acad. Bras. Cienc. 2024, 96, e20240081. [Google Scholar] [CrossRef] [Scilit]
- Agriculture and Livestock Ministry (MAPA). Brazilian Agribusiness Projections 2022/23 to 2032/33; MAPA: Brasília, Brazil, 2023; p. 102.
- National Supply Company (CONAB). Losses in Grain Transportation and Storage: Current Overview and Perspectives; CONAB: Brasília, Brazil, 2021. Available online: https://www.gov.br/conab/pt-br/acesso-a-informacao/institucional/publicacoes/outras-publicacoes/Perdas%20em%20transporte%20e%20armanenagem%20de%20graos/view (accessed on 13 August 2025).
- Brazilian Geography and Statistics Institute (IBGE). Municipal Agricultural Production—2024. Available online: https://www.ibge.gov.br/estatisticas/economicas/agricultura-e-pecuaria/9117-producao-agricola-municipal-culturas-temporarias-e-permanentes.html (accessed on 13 August 2025).
- National Supply Company (CONAB). Storage Tariff Table for Natural Environment Storage Units. Available online: https://www.gov.br/conab/pt-br/atuacao/armazenagem/rede-armazenadora-da-conab/tarifas-de-armazenagem-da-conab (accessed on 13 August 2025).
- Copagril Agroindustrial Cooperative (COPAGRIL). Historical Prices. Available online: https://www.copagril.com.br/historico-de-precos (accessed on 13 August 2025).
- Agriculture and Livestock Confederation (CNA). Logistics Infrastructure: Challenges for the Flow of Agricultural Products; CNA: Brasília, Brazil, 2015; Available online: https://www.cnabrasil.org.br/storage/arquivos/livrocompleto_infraestrutura_logistica-_desafios_para_o_escoamento_dos_produtos_agropecuarios_0.07677600201515000372.pdf (accessed on 13 August 2025).
- Dwivedi, A.; Jha, A.; Kumar, S.; Tiwari, M.K. Meta-heuristic algorithms for solving the sustainable agro-food grain supply chain network design problem. Mod. Supply Chain Res. Appl. 2020, 2, 161–177. [Google Scholar] [CrossRef] [Scilit]
- Mardaneh, E.; Ghahremani-Nahr, J.; Kianfar, F.; Pishvaee, M.S. A decision support system for grain harvesting, storage, and distribution logistics. Knowl.-Based Syst. 2021, 223, 107037. [Google Scholar] [CrossRef] [Scilit]

Disclaimer/Publisher’s Note: The statements, opinions and data contained in all publications are solely those of the individual author(s) and contributor(s) and not of MDPI and/or the editor(s). MDPI and/or the editor(s) disclaim responsibility for any injury to people or property resulting from any ideas, methods, instructions or products referred to in the content. |
© 2026 by the authors. Licensee MDPI, Basel, Switzerland. This article is an open access article distributed under the terms and conditions of the Creative Commons Attribution (CC BY) license.