Abstract
Thin-layer convective drying of plantain banana was performed at four different temperatures from 50 to 80 °C, with slice thicknesses from 2 to 8 mm. The drying curves, fitted to seven different semi-empirical mathematical models, were successfully used to fit experimental data ( 0.72–0.99). The diffusion approach had better applicability in envisaging the moisture ratio at any time during the drying process, with the maximum correlation value ( 0.99) and minimum value of (2 and RMSE (5.0 . The , , and values were calculated on the basis of the experimental data, and overall ranged from to m2 s−1, to 2.20 m s−1 and 13.70 to 18.23 kJ mol−1, respectively. The process energy consumption varied from 23.3 to 121.4 kWh kg−1. The correlation study showed that the drying temperature had a close correlation with value and sample hardness. A significant (p < 0.05) increase in hardness of dried plantain banana was observed at 80 °C compared to the other temperatures. Additionally, the sample hardness and process energy consumption were more positively correlated with the thickness of the samples.
1. Introduction
Banana is an important fruit crop in many tropical and subtropical areas of India. India is the world’s leading producer of bananas, with a share of around 25% of absolute yield. Andhra Pradesh, Gujarat, Tamil Nadu, Maharashtra, Kerala, Uttar Pradesh, Bihar, and Madhya Pradesh states provide more than 70% of the banana production in India [1]. It constitutes the fourth main staple fruit crop in many economies in developing countries. Among the world’s total fresh fruit produce, 15% of total production is contributed by ~11 × 104 T of banana varieties each year [2]. Plantain banana is a crossbreed and polyploid of two wild, seeded banana species: Musa acuminata and Musa balbisiana. The composition of banana makes it a good source of carbohydrates (including resistant starch and dietary fiber), phenolic compounds, minerals (potassium, phosphorus, magnesium, and zinc), and vitamins (C, B6, and A), but with low content of protein and fat [3]. The green banana has a low glycemic index, and its consumption could diminish the risk of type II diabetes in the early stage of adulthood [4]. It rapidly deteriorates after harvest due to abiotic factors. In total world production, 33% of bananas are lost because of their climacteric nature [4]. In 2019, the Food and Agriculture Organization estimated that ~2 billion people across the globe did not have the assets required for safer, nutritious, and sufficient food. The United Nations general assembly declared 2021 the international year of fruit and vegetables (IYFV) in order to raise awareness about fruit and vegetables’ vital role in nutrition, health, and food security. In this context, the drying of bananas would be able to solve this issue and reduce wastage, leading to value addition.
Thin-layer hot air convective drying is a commonly used cost-effective preservation method that involves simultaneous heat and mass transfer and which can be properly described using Fick’s diffusion models [5,6]. During drying, the heat energy moves from the surface of the fruit and vegetables, simultaneously enhancing the movement of the moisture inside towards the external surface, resulting in a decline in its moisture content and water activity at a certain level [7,8]. At the same time, it will subsequently minimize the biochemical reaction and microbiological deterioration. Additionally, it helps to minimize the cost of storage, transportation and packaging. Dried plantain bananas are an unexplored ingredient with great potential for application in numerous food products; for example, in flour form, it makes an ideal component of soup mixes, gluten-free cookies, gluten-free biscuits, muffins, baby food mix, and waffles, and makes it possible to modify the taste, flavor, and texture in accordance with consumer preference [3,9].
The information on drying kinetic and critical moisture is fundamental for advancing and controlling the drying process and the quality of the final product. Mathematical modeling is a significant tool that is commonly used to simulate and optimize drying processes. Empirical and semi-empirical mathematical models are widely used to envisage the drying time and drying parameters, and to provide an overview of the drying behaviors of agricultural produce [10]. Several general features influence the drying kinetics of the product, like drying temperature, relative humidity, drying air velocity, and product composition. In addition to the above features, size, shape and surface (morphology) also influence the product’s drying characteristics [10]. This is one of the most energy-intensive operations, due to the high amount of energy consumed in processing compared to the case of fresh produce. Subsequently, there is the need to optimize the drying process, which reduces energy consumption by achieving maximum moisture removal within a short time [11]. Several researchers have studied mathematical modeling in order to better understand the drying behavior of various fruits and vegetables subjected to thin-layer hot-air drying including onion [12], apple [11], lemon [13], banana blossoms [14], mango [15], pumpkin [16], stone apple [17], apple [18], red pepper [19], and green pepper [20].
Moreover, to the best of our knowledge, there is no reported literature which mass transfer properties, process energy consumption, and their compound co-relation are estimated for convectively dried plantain banana slices on the basis of different thicknesses. Additionally, very few authors have studied the mathematical modeling of thin-layer hot air convective drying of bananas at different temperatures and slice thicknesses.
In light of the above limitation, the objective of the present study was to use different semi-empirical mathematical models to predict the moisture ratio (MR) as a function of time period. Moreover, effective moisture diffusivity , activation energy , mass transfer properties process energy consumption, and their compound relation, were determined during the drying process. Additionally, the effect of drying on the textural properties (hardness) of plantain banana slices was studied.
2. Materials and Methods
2.1. Collection of Raw Material
Fully mature green plantain banana bunches with angularity were hand harvested around 110–120 days after flowering, and were obtained from the Dinesh farm near the district of Sonepat (Haryana, India) in January 2020. The banana fruit bunches were cleaned under running tap water, and then the fruit clusters were separated from the banana bunches and sanitized with sodium hypochlorite (NaOCl) (0.1 g L−1) solution to expel the microbial burden from the fruit [21].
2.2. Drying Experiment
The green plantain banana fruits, which possessed an initial moisture content of 598.12 ± 13.97% (dry basis), were peeled using a hand peeler. An automated slicer was used to slice the peeled banana into slices of four different thicknesses (2, 4, 6, and 8 mm). Convective tray drying was performed using a laboratory tray dryer (Macro Scientific works Pvt Ltd., Delhi, India) at four different temperatures (50, 60, 70, and 80 °C) with a constant air velocity of 1.5 m s−1. All of the distinct banana slices with a weight of 0.88 kg was placed in a single layer on a perforated tray and kept in a dryer for drying. The loss in weight was recorded for each sample, taking out every sample from the dryer at intervals of 10 min during the first 1 h, every 20 min during the second 1 h, every 30 min for the next 1 h, and then after every 1 h until the weight of the banana slices became constant. The weight loss was used to calculate the moisture content of the slices after drying for a certain period of time. The weights of the slices were measured in triplicate using a digital weighing balance (BSA224S-CW, Sartorius Company, Göttingen, Germany; Accuracy = 0.1 mg).
2.3. Determination of Moisture Content, Moisture Ratio, and Drying Rate
The moisture content of the banana slices was determined by desiccating sample moisture in a hot air oven at 105 °C to achieve a constant sample weight, and was repeated three subsequent times, as per the AOAC [22] procedure. The moisture ratio (MR) and drying rate (DR) of the plantain banana slices were calculated using Equations (2) and (3) [23].
where is the moisture content at any time t, is the equilibrium moisture content, and is the initial moisture content of the sample. The initial moisture content and moisture content of the plantain banana slice at any time point is relatively higher than the equilibrium moisture content value of the plantain banana slice. Thus, the equation can be simplified as shown in Equation (2) [24].
The DR of the plantain banana slice was determined under different drying conditions using Equation (3).
where and are the moisture content at any given instant t and t + Δt (kg of water and kg of dry matter−1), respectively. Δt is the time difference between two consecutive measurements.
2.4. Fitting of Semi-Empirical Mathematical Models
Semi-empirical models typically involve a combination of theory and measurement in order to generalize the design and simplify the results according to observations. The drying data were fitted to seven semi-empirical models obtained on the basis of Fick’s second law of diffusion or Newton’s law of cooling (Table 1). Non-linear regression analysis was used to analyze the drying data and to determine the process-dependent parameters of the model. The drying temperature, drying time, relative humidity, initial moisture content, sample thickness, and morphology are various factors that may influence model parameters. The best model choice for the drying of plantain banana can be distinguished based on three evaluation criteria: the highest coefficient of determination (, reduced root mean square error (RMSE), and chi-square () analysis. The degree of variance between the experimental and predicted values is represented by and RMSE. The value of RMSE and are inversely proportional to the level of accuracy of the model fit. Estimation of , RMSE and reduced are mathematically expressed in Equations (4)–(6).
where N is the number of observations, and and are the ith experimental value and ith model-predicted value.

Table 1.
Selected semi-empirical models used for the plantain banana drying kinetics [10].
2.5. Determination of Effective Moisture Diffusivity
Effective moisture diffusivity is a key phenomenon in the drying process that can be used to determine the rate of movement of water by means of the diffusion of liquid/vapor. The diffusion phenomenon is able to represent the movement of moisture within hygroscopic solid during the falling rate period in accordance with Fick’s second law (Equation (7)) [6]. The diffusion coefficients are considered constant with infinite slab geometry and uniform initial moisture distribution of plantain banana slices.
where is the effective moisture diffusivity coefficient (m2 s−1), L is half the thickness of a plantain banana slice (m), t is time (s), and n is a positive integer (n = 0). Thus, for a long drying period, it can be simplified to Equation (8) from Equation (7) [25]. The constant thickness of slices was assumed to have a larger surface area on the cut slices than the peripheral area, resulting in uniform moisture distribution, constant diffusivity, and negligible external resistance and shrinkage [25].
2.6. Determination of Activation Energy
The activation energy ) describes the association between effective moisture diffusivity and the air temperature of the dryer. It is typically depicted under Arrhenius-type conditions with the aim of investigating the impact of temperature on effective moisture diffusivity, and can be calculated using Equation (9).
where is a pre-exponential factor of the Arrhenius equation (m2 s−1), is the activation energy (kJ mol−1), R is the universal gas constant (kJ mol−1 K−1), and T is the temperature (°C).
2.7. Mass Transfer Properties
The biot number ( and convective mass transfer coefficient () are the mass transfer properties. The number is a dimensionless quantity representing the thermal resistance to moisture diffusion inside and the product’s surface. It is calculated by establishing a relation between the number and the dimensionless Dincer number (), and can be conveyed by Equation (10) [26].
was calculated using Equation (11), and represents the effect of the flow velocity of the drying fluid and the drying coefficient of the produce [27].
where ν is the drying air velocity (m s−1), L is the thickness (m), and k is the drying constant.
and are associated with the dimensionless number for mass transfer, and were calculated using Equation (12) [28]. This equation is legitimate for values of greater than 0.1.
2.8. Process Energy Consumption
The energy consumed by an electrical heater during the drying process was calculated using Equation (13) [29].
where A is the tray area (m2), is the airflow rate (m s−1), t is drying time in (h), and ΔT is the temperature difference (K). and are the air density (kg m−3) and specific heat of the air (kJ kg−1 K−1), respectively. Drying was carried out at atmospheric pressure, and air density () at a specific temperature was calculated as expressed in Equation (14) [11]. Specific heat () was calculated using Equation (15).
where is the absolute temperature (K).
The specific energy () required for the drying of one kilogram of the sample was determined by using Equation (16) and is expressed as kWh kg−1 [29].
where is the total energy required for drying (kWh), and is the initial weight of the sample (kg).
2.9. Texture Analysis
The texture properties of the plantain banana chips were measured using a texture analyzer (TA-XT plus Texture analyzer, Stable Micro Systems, Godalming, UK) in terms of hardness. The texture analyzer was equipped with a P/2 cylindrical probe loaded with a 30 kg load cell. The force was applied to the banana chips in order to fracture the sample at a pre-test speed of 1.0 mm s−1, a test speed of 1.0 mm s−1, and a post-test speed of 10.0 mm s−1. The hardness of each sample was measured as the peak force in the force deformation curve. Each sample was independently analyzed six times at room temperature [30].
2.10. Statistical Analysis
The analysis of variance (ANOVA) was performed for data analysis, and the least significant difference (p < 0.05) was calculated using Duncan’s test. The Origin Pro statistical software (pro-2021, Origin Lab Corporation, Northampton, MA, USA) was used to fit the semi-empirical mathematical models. The model coefficients and constants were obtained using the F-test, significant at p < 0.05. Furthermore, principal component analysis (PCA) and dendrogram analysis were performed to determine the compound correlation among the different tray-dried samples.
3. Results and Discussion
3.1. Drying Characteristics
The dehydrated plantain banana slices with thicknesses of 2, 4, 6 and 8 mm, dried at four different temperatures (50–80 °C), are shown in Figure 1a–d. The variations in moisture content and drying rate (DR) with drying time for plantain bananas were investigated at four different drying temperatures (50, 60, 70, and 80 °C) and thicknesses (2, 4, 6 and 8 mm) (Figure 2a–h). It was observed that the dehydration of banana slices could be achieved at a constant temperature with varied thickness by hot air-drying. With increasing drying temperature, the movement of the water molecules increases and evaporates rapidly from the minimum thickness of the food surface. The final moisture content obtained at four different temperatures and thicknesses was found to be in the range of 11.89–12.33% (dry basis). A significant (p < 0.05) reduction in drying time was observed when drying the 2, 4, 6 and 8 mm banana slices at four different drying temperatures (50–80 °C). For the slice with a thickness of 2 mm, the drying time was decreased by 66.7% at 80 °C compared to the time required at 50 °C, as was expected. On the other hand, for the slices with thicknesses of 4, 6 and 8 mm, the drying time decreased by 62.5, 66.7, and 71.9%, respectively, when dried at 80 °C compared to when dried at 50 °C. A similar finding was reported by Kabiru et al. [15] and Sharabiani et al. [31] for the drying of apple slices and mango.
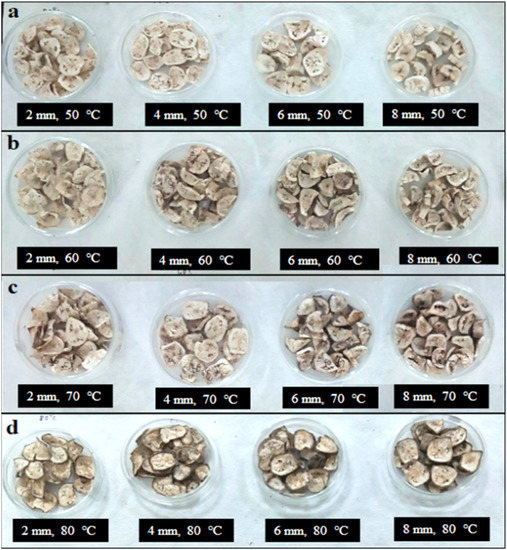
Figure 1.
Convective hot-air-dried plantain banana slices with thicknesses of 2, 4, 6, and 8 mm dried at 50 °C (a), 60 °C (b), 70 °C (c) and 80 °C (d).
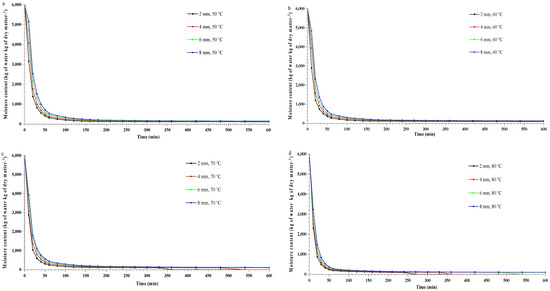
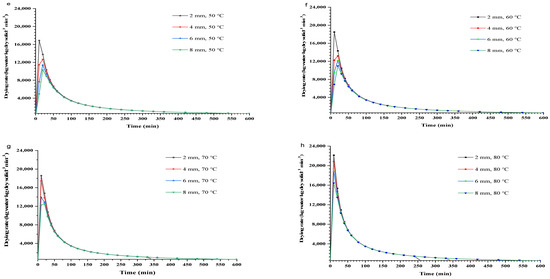
Figure 2.
Variation in moisture content vs. drying time (a–d) and drying rate vs. drying time (e–h) for plantain banana slices.
On the basis of the drying curves, it was observed that the falling rate period for the 2 mm slice was 1 h, with 0.24 kg of water loss per kg of dry matter at 50 °C (Figure 2a). Meanwhile, the falling rate period at 50 °C for the slices with thicknesses of 4, 6 and 8 mm was sustained for 1.33, 1.66 and 2 h, respectively, and decreased the initial moisture content by 0.23, 0.23, and 0.22 kg of water per kg of dry matter, respectively. The constant DR was trailed by the falling rate of drying, which consequently decreased with increasing drying time, as shown in Figure 2e–h. A similar pattern of constant DR followed by falling rate was obtained for 2, 4, 6, and 8 mm thick banana slices dried at 60, 70, and 80 °C, as shown in the drying curves presented in Figure 2f–h. The thickness of the plantain banana slices had a significant (p < 0.05) effect on moisture content and drying time. Srikanth et al. [32] and Jabeen et al. [33] stated that the decreased kinetic energy of water molecules resulted in a slower DR with increasing sample slice thickness. The same trend was noticed on plantain banana slices dried at 60, 70, and 80 °C with varied slice thicknesses (2 to 8 mm) (Figure 2). The faster reduction in moisture content during the initial drying phase could be attributed to the ambient availability of surface moisture and its subsequent diffusion to keep up with the constant DR during drying at various temperatures and product thicknesses [34]. Ojediran et al. [35] noted that as the drying process progressed, the diffusion of moisture from the core to the surface of each particle became the limiting factor, greatly lowering the DR value due to the bound water of the samples. For the overall drying process, the falling rate period was observed as an eventual outcome of the mass transfer-controlled process.
3.2. Model Fitting on Drying Curve
The MR data were obtained at four different drying temperatures (50, 60, 70 and 80 °C) with constant thicknesses of 2, 4, 6 and 8 mm. On the basis of the experiments, the obtained drying data were fitted to seven semi-empirical mathematical models to envisage the drying behavior (Table 1). The drying curve model constant and coefficients were evaluated. The results were analyzed in terms of the highest value, lowest reduced , and RMSE for all the drying conditions to assess the applicability of the better fit model for different drying curves, represented in Table 2. The F-values of all models were seen as significant (p < 0.05). From all the experiments, all models , , and RMSE values varied in between the range of 0.72 to 0.99, to and to , respectively. The exception of the Verma model showed non-fit to the experimental data of the 2 mm banana slice dried at 60 and 80 °C, respectively. Whereas modified page, page, diffusion approach, and logarithmic models quite fit well to the experimental data dried at varied temperatures and thicknesses, and it showed the 0.91. Likewise, Henderson and Pabis, and Newton/Lewis models were observed to be the best fit with the > 0.92 for experimental data of 2 mm plantain banana slices dried at 70 and 80 °C, respectively. The Verma model was found to be the best fit for the experimental data of banana slices dried at 70 °C having 2 mm thickness and 80 °C, having 6 mm thickness, respectively, showing the > 0.92. Among all the mathematical drying models, the diffusion approach model was observed to be better fitted to all experimental drying curve data obtained from different drying conditions, which was selected based on the maximum 0.99 and minimum and RMSE value ).
Table 2.
Diffusion approach model constant and coefficients at different drying temperatures and thickness with statistical performance indicators (better fit model).
The most appropriate fitted drying curve models (diffusion approach model) were validated by plotting the experimental MR and predicted MR of bananas dried at different temperatures with constant thickness against time, represented in Figure 3a–d.
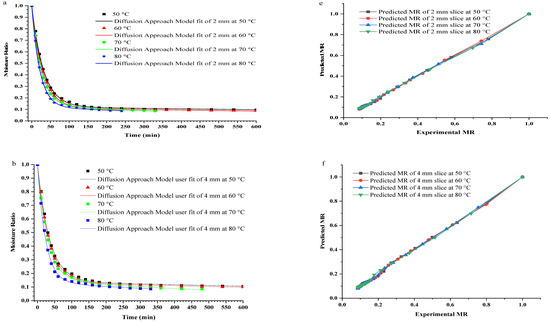
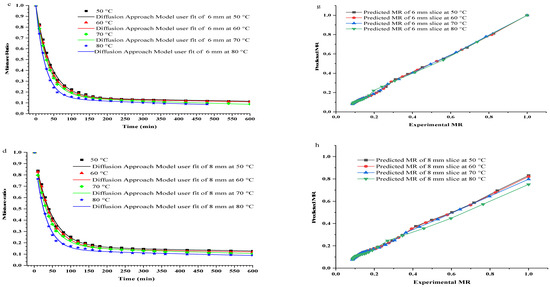
Figure 3.
The moisture ratio (MR) vs. drying time (a–d) and experimental moisture ratio (MR) vs. predicted moisture ratio (MR) (e–h) for plantain banana slices at different drying temperatures and thickness by diffusion approach.
The fit agreement was generated between the predicted and experimental MR at different drying temperatures with constant thickness using the diffusion approach model (Figure 3e–h). Henceforth, it could be contemplated that the diffusion approach model was seen to be satisfactory in addressing the drying behavior of banana slices at different temperatures and constant thicknesses. This assessment is in concurrence with a study conducted by Yaldýz & Ertekýn [20]. They studied the hot air drying of green pepper at 50–80 °C and showed that the diffusion approach model best fit the experimental MR data. Additionally, red pepper was hot air-dried at a temperature of 55–70 °C showed the diffusion approach model is ideal to foresee the drying of red pepper [19]. Interestingly, the diffusion approach and logarithmic model were found to be the best fit for hot air-dried banana slices (4 mm in thickness) at 60 and 70 °C, respectively, with the highest 0.99 and 0.99, respectively [36].
3.3. Effective Moisture Diffusivity
The effective moisture diffusivity during drying is a complex process involving various diffusion parameters, such as liquid, molecular, vapor, and hydrodynamic diffusion, to describe the characteristic movement of the inherent moisture of food [37]. The effective moisture diffusivity usually relies on drying temperature, air velocity, relative humidity, and sample thickness [38]. The values for the drying of plantain banana slices under various drying temperatures and thicknesses were obtained within a range of to m2 s−1, with values ranging from 0.79 to 0.90, as shown in Table 3. These results are in agreement with the values of food material ( m2 s−1) reported by Zogzas et al. [38]. The values of the 2, 4, 6, and 8 mm banana slices dried at a constant temperature of 50 °C were found to be , and m2 s−1, respectively, with the highest being 0.79–0.85, and the lowest values of to and RMSE to ). The increase in the effective moisture diffusivity of banana slices was observed upon increasing the thickness of the sample (2–8 mm) at 50 °C. In the same way, the same effective moisture diffusivity trend was noticed for banana slices with thicknesses of 2, 4, 6, and 8 mm dried at 60, 70, and 80 °C, which was found to be in the range of to m2 s−1, to m2 s−1 and to m2 s−1, respectively, as shown in Table 3. In the same way, an increase in the effective moisture diffusivity pattern was seen for banana slices dried at 50, 60, 70, and 80 °C with a constant slice thickness of 2, 4, 6, and 8 mm (Table 3). The hot air increases the heat energy and the activity of water molecules resulting from the increase in vapor pressure inside the food samples, prompting an enhancement of effective moisture diffusivity toward the outer surface [11]. Therefore, the value of the banana slice was seen to increase with increasing drying temperature and banana slice thickness (Table 3). Additionally, Ojediran et al. [35] noted that the of yam slices increases with increasing air velocity (0.5, 1, and 1.5 m s−1), temperature, (50, 60 and 70 °C), and thickness (3, 6 and 9 mm), which was acquired in ranges from to m2 s−1. Moreover, Kumar et al. [23] evaluated the value of thin-layer-dried banana slices (4 mm) at 45–65 °C, and increases from to m2 s−1 were observed with increasing drying temperature. The value of hot air-dried apple slices at 50, 60, and 70 °C was seen to be in the range of to m2 s−1 [11].
Table 3.
Heat transfer parameter, mass transfer parameter, activation energy, and hardness of convectively hot air-dried plantain banana slices.
These differences in the effective moisture diffusivity of agricultural produce might be because of the diversity in the nature of biomaterials, composition, dimensions, drying velocity, drying temperature, and moisture content, as well as physical or chemical pretreatment conditions [39].
3.4. Activation Energy
The commencement of the reaction (moisture diffusion) from the inside to the outside of plantain banana slices requires energy, which is expressed as activation energy . This is the energy needed to achieve effective moisture diffusivity. Higher values of are dependent on temperature and thickness, and enhance the and promote moisture movement. was calculated using the Arrhenius equation, and was found to be in the range of 13.70 to 18.23 kJ mol−1 for banana slices dried at four different temperatures (50, 60, 70, and 80 °C) and thicknesses (2, 4, 6 and 8 mm), with highest value ranging from 0.89 to 0.98, and the lowest to and RMSE to as shown in Table 3. Values of for banana slices dried at different temperatures were obtained as 13.70, 15.82, 16.93, and 18.23 kJ mol−1, respectively, for slice thicknesses of 2, 4, 6, and 8 mm. The obtained results are within the range of those published by various researchers with respect to several food materials (12.7–110 kJ mol−1) [40]. Therefore, it can be concluded that the value is also dependent on sample thickness. Several researchers have reported the values for the drying of various types of agriculture produce; for example, the value of Dioscorea rotundata and Dioscorea alata increased insignificantly (p > 0.05) from 41.75 to 72.47 kJ mol−1 and 25.25 to 46.46 kJ mol−1, respectively, during drying at different temperatures (50–80 °C) and thicknesses (10–30 mm) [39]. In the same way, the value of yam sliced was found to be 10.59–54.93 kJ mol−1, which increased with increasing air velocity (0.5–1.5 m s−1) but fluctuated with air temperature and thickness [35]. John et al. [14] evaluated the value of hot air-dried banana blossoms at temperatures of 40–60 °C, and found that it was 500 kJ mol−1. Likewise, the value of apple slices dried at three different temperatures—50, 60, and 70 °C —and air velocities—1, 1.5, and 2 m s−1—were 17.77, 19.75, and 25.41 kJ mol−1 [11]. Moreover, the value of melon slices dried at four different temperatures—40, 50, 60, and 70 °C—with constant thicknesses of 2, 4, and 6 mm, respectively, were found to be 45.24 to 51.30 kJ mol−1 [41]. Thus, various drying parameters, such as drying temperature, air velocity, sample thickness, and moisture diffusivity, significantly affect value.
3.5. Mass Transfer Properties
The mass transfer coefficient () increased with decreasing moisture content and increasing drying temperature and thickness. The value of increased from to m s−1 with increasing drying air temperature (50–80 °C) and slice thickness (2–8 mm), as shown in Table 3. Similarly, Darvishi et al. [41] found that the value of hm increased from to m s−1 in melon slices dried at temperatures of 40, 50, 60, and 70 °C and slice thicknesses of 2, 4, and 6 mm, respectively. In the same way, Guiné et al. [28] assessed the of pumpkin slices (5–12.5 mm) dried at 30–70 °C, finding an increase in the value from to m s−1, while pear slices dried at 60 and 70 °C were found to exhibit an increase from to m s−1. Furthermore, the increase in the value of of hot air-dried whole lemon at 50, 60, and 70 °C was found to be , and m h−1, respectively [13]. The increase in the value of with increasing drying temperature and slice thickness due to surface hardening results in an increase in the diffusion of moisture toward the outer surface [41].
3.6. Process Energy Consumption
The process energy consumption required for the drying of plantain banana at different temperatures and thicknesses was found to be between 23.26 and 121.44 kWh kg−1, as shown in Figure 4. The maximum reductions in the process energy consumption of 2 mm thick dried plantain banana were 1.81, 19.63, and 27.61%, respectively, at temperatures of 50 to 60, 70 and 80 °C. A similar trend was found for plantain bananas with thicknesses of 4, 6, and 8 mm dried at four different temperatures, as shown in Figure 4. However, the maximum increases in the energy consumption of dried plantain banana at the four different thicknesses of 2, 4, 6, and 8 mm were found to be from 32.13 to 121.44, 31.55 to 97.51, 25.82 to 89.92, and 23.26 to 70.08 kWh kg−1, at temperatures of 50, 60, 70 and 80 °C, respectively. The increase in drying temperature resulted in a decline in drying time, and had a more significant effect on the process energy requirement of the dried sample [29]. The process energy consumption of dried samples was more influenced by air velocity, drying time, and drying temperature [11,30,40].
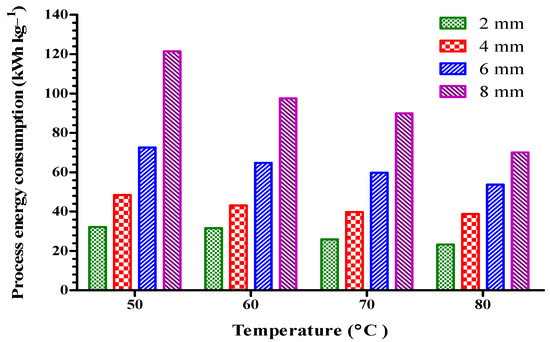
Figure 4.
Process energy consumption of plantain banana slices during convective hot air drying at different temperatures and thicknesses.
3.7. Texture
The textural properties, characterized in terms of hardness, are the force necessary to determine the capacity of a material to resist deformation. The variation in the hardness of plantain banana slices of different thicknesses dried at different temperatures is shown in Table 3. Insignificant (p > 0.05) increases in the hardness of dried plantain banana at 50, 60, and 70 °C were observed, from 15.25 to 23.75, 26.56 to 37.02, 38.23 to 45.76, and 39.8 to 5.36 N for the constant thicknesses of 2, 4, 6, 8 mm, respectively. The significant (p < 0.05) increase in the hardness of plantain banana slices was found to be at 80 °C, with varied thicknesses of 2, 4, 6, and 8 mm, respectively (Table 3). The significant (p < 0.05) differences in the hardness of dried plantain banana with four different thicknesses of 2, 4, 6, and 8 mm were found to be 15.25 to 39.8, 17.54 to 41.65, 23.75 to 50.36, and 31.84 to 71.41 N at constant drying temperatures of 40, 50, 60 and 70 °C, respectively. The water vapor expands the cellular wall when the hot air comes into contact with the fruit surface. This creates large pores within the center of the material, showing the highest hardness with dense structure compared to when dried at the lowest drying temperature [42]. Conversely, at the minimum drying air temperature, hot air moved from the surface to the core at a slow and constant speed, causing insignificant microstructural changes and leading to this sample having the lowest hardness [43]. Similarly, Kumar et al. [23] observed an increase in the hardness of a thin layer of dried ripe banana from 6 to 10 N at temperatures of 110–140 °C. Additionally, Macedo et al. [44] reported that the rapid loss of moisture content with increasing air drying temperature results in greater physical damage to food material, leading to an increase in sample hardness.
3.8. Compound Correlation Study
A compound correlation among the different samples can be observed from the dendrogram considering various independent and dependent parameters presented in Figure 5. The samples with lower thicknesses (2 and 4 mm) and at lower temperatures (50 and 60 °C) are closely correlated, and have similar drying characteristics. The samples with greater thicknesses (6 and 8 mm) also possess similar characteristics at the higher temperature of 80 °C. Overall, the samples can be clustered into four groups, i.e., (i) 1, 2, 5, 6; (ii) 3, 4, 7, 8; (iii) 9, 10, 11, 12, 16; and (iv) 13, 14, 15. The correlation among the various samples is evident, due to the smaller changes in characteristics under similar drying conditions. The lowest energy consumption was observed for the samples dried at 80 °C with a thickness of 2 mm, which also had similar drying characteristics to the sample dried at 70 °C with a thickness of 2 mm. Therefore, a sample thickness of 2 mm should be appropriate for drying plantain banana slices. The correlations among the various properties are presented in Figure 5b, which indicates that drying temperature is closely correlated with the value. Process energy consumption is more positively correlated with the thickness of the samples. The hardness of the samples is also positively correlated with drying temperature and thickness, indicating that increasing thickness and drying temperature result in increased hardness of the samples.
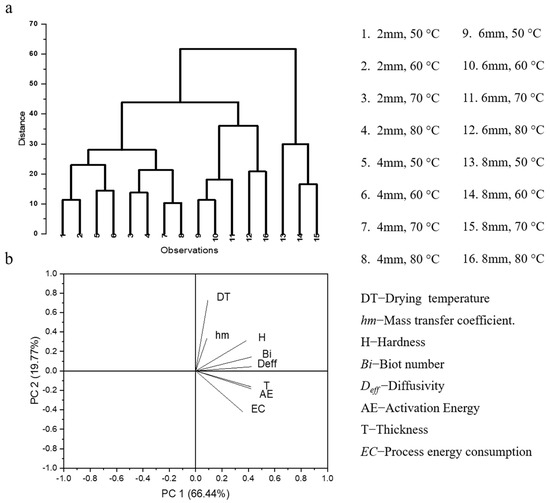
Figure 5.
(a) Dendrogram representing compound correlation among different samples, (b) PCA loading plot representing correlation among various drying characteristics.
4. Conclusions
Experimental investigation showed that an increase in temperature and reduced thickness significantly influenced the rate of drying, the moisture content, and the drying time. The entire drying experiment was observed to take place within the falling rate period, suggesting the transfer of water molecules from interior to the outer surface of the material was caused by the phenomenon of internal diffusion. The seven semi-empirical mathematical models used to fit the drying curves, the diffusion approach model was found to most adequately fit the experimental data, meeting statistical criteria such as maximum , and minimum RMSE and on the basis of our analysis. The diffusion approach model was found to be the most suitable for predicting the drying behaviors of banana slices of different thicknesses at different temperatures. The and of the banana slices increased with increasing drying temperature (50–80 °C) and thickness (2–8 mm). The needed for the diffusion of moisture from the inside to the outside of the plantain banana slice was obtained in the range of 13.70 to 18.23 kJ mol−1. The process energy consumption was directly affected by sample thickness and drying temperature. However, it is necessary to understand the changes in chemical composition as a result of drying temperature and thickness before their use. This will be performed in future study.
5. Practical Applications
The drying of fruits and vegetables is the primary unit activity on most food processing lines, making the installation of proper drying conditions essential. Traditional drying methods lose nutritional quality due to a sluggish drying rate and inappropriate heating. The results obtained in the current study demonstrate banana drying behavior and drying characteristics, which find their application in the determination of the economic aspects of drying banana slices at an industrial scale. Data from this paper could be useful for designing drying operations for this kind of product on the basis of an estimation of drying time, energy consumption, and qualitive parameters by avoiding expensive and time-consuming experimental tests.
Author Contributions
Conceptualization, M.G.K. and A.S.; Writing—original draft, M.G.K. and A.V.C.; Software, M.G.K. and A.V.C.; Editing, A.S., N.K., R.V.D. and M.R.; Methodology, M.G.K.; Validation M.G.K., A.S. and N.K.; Project administration, A.S.; Supervision, A.S.; Reviewing, A.S. and R.V.D.; Writing—review and editing and data visualization, A.S., N.K., R.V.D. and M.R. All authors have read and agreed to the published version of the manuscript.
Funding
This research work was supported by National Institute of Food Technology Entrepreneurship and Management (NIFTEM), Sonipat under Ph.D. research grant no. Ph.D./17-18/7/175.
Data Availability Statement
The data that support the findings in this study are available from the corresponding authors upon reasonable request.
Acknowledgments
All the authors individually consented wish to thank NIFTEM for providing all the necessary facilities to conduct this research work.
Conflicts of Interest
On behalf of all authors, the corresponding author states that there is no conflict of interest.
References
- India Exports Bananas Worth Rs 619 cr during 2020–2021—The Economic Times. Available online: https://economictimes.indiatimes.com/news/economy/foreign-trade/india-exports-bananas-worth-rs-619-cr-during-2020-21/articleshow/83566756.cms (accessed on 22 February 2022).
- Food and Agriculture Organization of the United Nations, Rome. Available online: http://www.fao.org/faostat/en/#data/QC/visualize (accessed on 22 February 2022).
- Odenigbo, M.A.; Asumugha, V.U.; Ubbor, S.; Nwauzor, C.; Otuonye, A.C.; Offia-Olua, B.I.; Princewill-Ogbonna, I.L.; Nzeagwu, O.C.; Henry-Uneze, H.N.; Anyika, J.U.; et al. Proximate composition and consumption pattern of plantain and cooking-banana. Br. J. Appl. Sci. 2013, 3, 1035–1043. [Google Scholar] [CrossRef]
- Falcomer, A.L.; Riquette, R.F.; de Lima, B.R.; Ginani, V.C.; Zandonadi, R.P. Health benefits of green banana consumption: A systematic review. Nutrients 2019, 11, 1222. [Google Scholar] [CrossRef] [PubMed]
- Ojediran, J.O. Thin layer drying of millet and effect of temperature on drying characteristics. Int. Food Res. J. 2010, 17, 1095–1106. [Google Scholar]
- Doymaz, İ. Thin-layer drying characteristics of sweet potato slices and mathematical modelling. Heat Mass Transf. 2011, 47, 277–285. [Google Scholar] [CrossRef]
- Omari, A.; Behroozi-Khazaei, N.; Sharifian, F. Drying kinetic and artificial neural network modeling of mushroom drying process in microwave-hot air dryer. J. Food Process Eng. 2018, 41, 12849–12859. [Google Scholar] [CrossRef]
- Nguyen, M.H.; Price, W.E. Air-drying of banana: Influence of experimental parameters, slab thickness, banana maturity and harvesting season. J. Food Eng. 2007, 79, 200–207. [Google Scholar] [CrossRef]
- Pico, J.; Xu, K.; Guo, M.; Mohamedshah, Z.; Ferruzzi, M.G.; Martinez, M.M. Manufacturing the ultimate green banana flour: Impact of drying and extrusion on phenolic profile and starch bioaccessibility. Food Chem. 2019, 297, 124990–125000. [Google Scholar] [CrossRef]
- Onwude, D.I.; Hashim, N.; Janius, R.B.; Nawi, N.M.; Abdan, K. Modeling the thin-layer drying of fruits and vegetables: A review. Compr. Rev. Food Sci. Food Saf. 2016, 15, 599–618. [Google Scholar] [CrossRef]
- Beigi, M. Energy efficiency and moisture diffusivity of apple slices during convective drying. Food Sci. Technol. 2016, 36, 145–150. [Google Scholar] [CrossRef]
- Takougnadi, E.; Boroze, T.E.; Azouma, O.Y. Development of an intermittent drying process of onion. Cogent Food Agric. 2018, 4, 1422225. [Google Scholar] [CrossRef]
- Torki-Harchegani, M.; Ghanbarian, D.; Sadeghi, M. Estimation of whole lemon mass transfer parameters during hot air drying using different modelling methods. Heat Mass Transf. 2015, 51, 1121–1129. [Google Scholar] [CrossRef]
- John, S.G.; Sangamithra, A.; Veerapandian, C.; Sasikala, S.; Sanju, V. Mathematical modelling of the thin layer drying of banana blossoms. J. Nutr. Health Food Eng. 2014, 1, 42–49. [Google Scholar] [CrossRef]
- Kabiru, A.A.; Joshua, A.A.; Raji, A.O. Effect of slice thickness and temperature on the drying kinetics of mango (Mangifera indica). Int. J. Res. Rev. Appl. Sci. 2013, 15, 41–50. [Google Scholar]
- Olurin, T.O.; Adelekan, A.O.; Olosunde, W.A. Mathematical modelling of drying characteristics of blanched field pumpkin (Cucurbita pepo L.) slices. Agric. Eng. Int. CIGR J. 2012, 14, 246–254. [Google Scholar]
- Rayaguru, K.; Routray, W. Mathematical modeling of thin layer drying kinetics of stone apple slices. Int. Food Res. J. 2012, 19, 1503–1510. [Google Scholar]
- Kaleta, A.; Górnicki, K. Evaluation of drying models of apple (var. McIntosh) dried in a convective dryer. Int. J. Food Sci. Technol. 2010, 45, 891–898. [Google Scholar] [CrossRef]
- Akpinar, E.K.; Bicer, Y.; Yildiz, C. Thin layer drying of red pepper. J. Food Eng. 2003, 59, 99–104. [Google Scholar] [CrossRef]
- Yaldýz, O.; Ertekýn, C. Thin layer solar drying of some vegetables. Dry. Technol. 2001, 19, 583–597. [Google Scholar] [CrossRef]
- Sun, S.H.; Kim, S.J.; Kwak, S.J.; Yoon, K.S. Efficacy of sodium hypochlorite and acidified sodium chlorite in preventing browning and microbial growth on fresh-cut produce. Prev. Nutr. Food Sci. 2012, 17, 210–216. [Google Scholar] [CrossRef]
- AOAC. Official Methods of Analysis; AOAC: Washington, DC, USA, 2003. [Google Scholar]
- Kumar, P.S.; Nambi, E.; Shiva, K.N.; Vaganan, M.M.; Ravi, I.; Jeyabaskaran, K.J.; Uma, S. Thin layer drying kinetics of Banana var. Monthan (ABB): Influence of convective drying on nutritional quality, microstructure, thermal properties, color, and sensory characteristics. J. Food Process Eng. 2019, 42, e13020. [Google Scholar] [CrossRef]
- Song, X.D.; Mujumdar, A.S.; Law, C.L.; Fang, X.M.; Peng, W.J.; Deng, L.Z.; Wang, J.; Xiao, H.W. Effect of drying air temperature on drying kinetics, color, carotenoid content, antioxidant capacity and oxidation of fat for lotus pollen. Dry. Technol. 2020, 38, 1151–1164. [Google Scholar] [CrossRef]
- Singh, A.; Sarkar, J.; Sahoo, R.R. Experimental energy-exergy performance and kinetics analyses of compact dual-mode heat pump drying of food chips. J. Food Process Eng. 2020, 43, e13404. [Google Scholar] [CrossRef]
- Guiné, R.P.; Barroca, M.J.; Silva, V. Mass transfer properties of pears for different drying methods. Int. J. Food Prop. 2013, 16, 251–262. [Google Scholar] [CrossRef]
- Akpinar, E.K.; Dincer, I. Application of moisture transfer models to solids drying. Proc. Inst. Mech. Eng. Part A J. Power Energy 2005, 219, 235–244. [Google Scholar] [CrossRef]
- Guiné, R.P.; Henrriques, F.; Barroca, M.J. Mass transfer coefficients for the drying of pumpkin (Cucurbita moschata) and dried product quality. Food Bioprocess Technol. 2012, 5, 176–183. [Google Scholar] [CrossRef]
- Motevali, A.; Minaei, S.; Khoshtagaza, M.H. Evaluation of energy consumption in different drying methods. Energy Convers. Manag. 2011, 52, 1192–1199. [Google Scholar] [CrossRef]
- Mao, Y.; Flores, R.A.; Loughin, T.M. Objective texture measurements of commercial wheat flour tortillas. Cereal Chem. 2002, 79, 648–653. [Google Scholar] [CrossRef]
- Sharabiani, V.R.; Kaveh, M.; Abdi, R.; Szymanek, M.; Tanaś, W. Estimation of moisture ratio for apple drying by convective and microwave methods using artificial neural network modeling. Sci. Rep. 2021, 11, 9155. [Google Scholar] [CrossRef]
- Srikanth, K.S.; Sharanagat, V.S.; Kumar, Y.; Bhadra, R.; Singh, L.; Nema, P.K.; Kumar, V. Convective drying and quality attributes of elephant foot yam (Amorphophallus paeoniifolius). LWT-Food Sci. Technol. 2019, 99, 8–16. [Google Scholar] [CrossRef]
- Jabeen, R.; Aijaz, T.; Gul, K. Drying kinetics of potato using a self-designed cabinet dryer. Cogent Food Agric. 2015, 1, 1036485. [Google Scholar] [CrossRef]
- Workneh, T.S.; Oke, M.O. The influence of the combined microwave power and hot air ventilation on the drying kinetics and colour quality of tomato slices. Afr. J. Biotechnol. 2012, 11, 15353–15364. [Google Scholar]
- Ojediran, J.O.; Okonkwo, C.E.; Adeyi, A.J.; Adeyi, O.; Olaniran, A.F.; George, N.E.; Olayanju, A.T. Drying characteristics of yam slices (Dioscorea rotundata) in a convective hot air dryer: Application of ANFIS in the prediction of drying kinetics. Heliyon 2020, 6, e03555. [Google Scholar] [CrossRef]
- Taskin, O.; Polat, A.; Etemoglu, A.B.; Izli, N. Energy and exergy analysis, drying kinetics, modeling, microstructure and thermal properties of convective-dried banana slices. J. Therm. Anal. Calorim. 2021, 147, 2343–2351. [Google Scholar] [CrossRef]
- Nachaisin, M.; Jamradloedluk, J.; Niamnuy, C. Application of combined far-infrared radiation and air convection for drying of instant germinated brown rice. J. Food Process Eng. 2016, 39, 306–318. [Google Scholar] [CrossRef]
- Zogzas, N.P.; Maroulis, Z.B.; Marinos-Kouris, D. Moisture diffusivity data compilation in foodstuffs. Dry. Technol. 1996, 14, 2225–2253. [Google Scholar] [CrossRef]
- Falade, K.O.; Olurin, T.O.; Ike, E.A.; Aworh, O.C. Effect of pretreatment and temperature on air-drying of Dioscorea alata and Dioscorea rotundata slices. J. Food Eng. 2007, 80, 1002–1010. [Google Scholar] [CrossRef]
- Ye, L.; EL-Mesery, H.S.; Ashfaq, M.M.; Shi, Y.; Zicheng, H.; Alshaer, W.G. Analysis of energy and specific energy requirements in various drying process of mint leaves. Case Stud. Therm. Eng. 2021, 26, 101113. [Google Scholar] [CrossRef]
- Darvishi, H.; Khodaie, J.; Azadbakht, M. The parameters of mass transfer of convective drying in sliced melon. Philipp. Agric. Sci. 2015, 98, 60–72. [Google Scholar]
- Barragán-Iglesias, J.; Rodríguez-Ramírez, J.; Sablani, S.S.; Méndez-Lagunas, L.L. Texture analysis of dried papaya (Carica papaya L., Cv. Maradol) pretreated with calcium and osmotic dehydration. Dry. Technol. 2019, 37, 906–919. [Google Scholar] [CrossRef]
- Jamradloedluk, J.; Nathakaranakule, A.; Soponronnarit, S.; Prachayawarakorn, S. Influences of drying medium and temperature on drying kinetics and quality attributes of durian chip. J. Food Eng. 2007, 78, 198–205. [Google Scholar] [CrossRef]
- Macedo, L.L.; da Silva Araújo, C.; Vimercati, W.C.; Saraiva, S.H.; Teixeira, L.J. Influence of yacon syrup concentration and drying air temperature on properties of osmotically pre-dehydrated dried banana. Heat Mass Transf. 2021, 57, 441–451. [Google Scholar] [CrossRef]
Publisher’s Note: MDPI stays neutral with regard to jurisdictional claims in published maps and institutional affiliations. |
© 2022 by the authors. Licensee MDPI, Basel, Switzerland. This article is an open access article distributed under the terms and conditions of the Creative Commons Attribution (CC BY) license (https://creativecommons.org/licenses/by/4.0/).