Abstract
To achieve high-sensitivity and intrinsically safe monitoring of hydrogen energy systems, a multi-wavelength fiber Bragg grating sensor based on the hydrogen-induced exothermic effect of Pt/WO3 nanomaterials was designed. This structure takes advantage of the catalytic effect of Pt on hydrogen molecules to trigger a thermal effect in a hydrogen environment, resulting in a redshift in the grating’s reflected wavelength. Experiments show that the sensor has a good linear response (R2 > 0.98) within a hydrogen concentration range of 0.5% to 3.5%, with stable and repeatable response and recovery processes. The multi-channel fiber structure enables synchronous detection of different central wavelengths, significantly enhancing the system’s scalability and distributed measurement capabilities. The research results indicate that this method has potential application value in hydrogen energy safety monitoring and intelligent sensor networks.
1. Introduction
Hydrogen energy, as a clean and efficient secondary energy carrier, offers significant advantages such as a high calorific value and the production of water as its sole combustion byproduct, making it a key component of future low-carbon energy systems [1,2]. The advancement of hydrogen energy technologies plays a crucial role in achieving global carbon neutrality goals. However, hydrogen’s inherent flammability and explosiveness pose substantial safety challenges: an explosive atmosphere can form when the volumetric concentration of hydrogen in air reaches approximately 4%, with an extremely low minimum ignition energy and a broad flammability range of 4–75% [3]. Moreover, hydrogen is prone to leakage during production, storage, and transportation, and its colorless, odorless nature makes detection difficult [4]. If undetected leaks encounter an ignition source, they may lead to catastrophic explosions. Therefore, real-time monitoring of hydrogen concentration is essential for ensuring the safe deployment of hydrogen-based technologies. Research into high-performance hydrogen sensors is thus not only of academic significance but also addresses a critical practical requirement for the secure development of the hydrogen energy industry. Over the past few decades, a wide range of hydrogen sensors have been developed, encompassing semiconductor resistive, electrochemical, catalytic combustion, optical, acoustic, and mechanical types, among others [5,6,7,8,9,10,11]. Among these, electrical sensors are the most prevalent in commercial applications. Nevertheless, emerging optical sensing technologies, such as fiber optic sensors, have garnered increasing attention due to their intrinsic safety and immunity to electromagnetic interference [12,13]. Optical transducers can effectively convert environmental changes into variations in optical signals, loading environmental change information onto optical signals, and further achieving the integration of optical fiber sensing and communication [14,15,16]. Despite the availability of multiple technological approaches, the field of hydrogen sensing continues to face significant challenges. A key research focus lies in enhancing sensitivity, selectivity, and response speed, while ensuring long-term reliability and early detection of hydrogen leakage. Furthermore, achieving miniaturization and integration of sensing systems remains a critical objective for future development [17].
Many conventional hydrogen sensors exhibit limited effectiveness in detecting low hydrogen concentrations, thereby failing to satisfy the requirements for early leak detection [17]. Pure metal oxides such as WO3 generally possess low reactivity toward hydrogen and insufficient sensing performance [3,4]. Furthermore, due to the small molecular size and high diffusivity of hydrogen, leaked gas can rapidly disperse, necessitating sensing systems capable of reliable detection at extremely low concentrations. This inadequate sensitivity increases the risk of undetected leaks, highlighting the urgent need to enhance the response capability of hydrogen-sensitive materials to hydrogen molecules. Conventional hydrogen sensors face significant limitations in size, power consumption, and operational requirements, which hinder their suitability for emerging applications demanding miniaturization, low energy usage, and seamless integration [18]. For example, catalytic combustion sensors typically require sustained high operating temperatures—often several hundred degrees Celsius—to facilitate chemical reactions [19]. This not only results in substantial energy consumption but also necessitates explosion-proof enclosures, thereby limiting portability and ease of deployment. While semiconductor oxide sensors feature a relatively simple structure, they generally rely on integrated heating elements to achieve adequate sensitivity, leading to increased power demands and larger physical footprints [20]. These factors constrain their applicability in wearable and mobile monitoring systems, where energy efficiency and safety are critical considerations [21]. As such, the development of miniaturized, networked, and ultimately chip-scale hydrogen sensors represents a key trajectory for future advancement. In summary, current hydrogen sensing technologies still exhibit room for improvement in sensitivity, response speed, selectivity, and integration capability. The incorporation of novel materials and innovative methodologies is essential to overcoming these technical barriers.
In response to the above issues, researchers have turned their attention to nanomaterials to enhance the performance of hydrogen sensors. The nanosizing of materials can significantly increase the specific surface area and the number of active sites, which is conducive to improving the capture and reaction efficiency of hydrogen molecules [17,22]. In particular, the nanostructures of transition metal oxides (such as nanofilms, nanowires, nanoparticles, etc.) exhibit outstanding performance in the gas sensing field due to their size effect and surface effect. Among numerous nanomaterials, metal oxides doped or loaded with noble metals have been proven to be an effective approach to enhance hydrogen sensing performance. The incorporation of a small number of noble metals (such as Pd, Pt, Au) can significantly reduce the activation of energy for the reaction of hydrogen molecules on the oxide surface, which is known as the “catalytic combustion” or “spillover effect”. Among them, platinum (Pt) is considered one of the most effective hydrogen catalysts due to its extremely strong ability to activate the dissociation of hydrogen molecules. Studies have shown that pure WO3 is almost insensitive to hydrogen, but when loaded with Pt, a significant reaction occurs at room temperature and heat is released. The mechanism of Pt’s action lies in that its surface first catalyzes the dissociation of H2 molecules into H atoms, and then the H atoms diffuse into the WO3 lattice to create oxygen defects or form HxWO3, thereby significantly altering the electrical and optical properties of WO3. Through this mechanism, the hydrogen sensitivity of Pt-doped WO3 is enhanced compared to undoped WO3 [23]. In addition, the introduction of Pt can also improve selectivity because Pt has a preferential catalytic effect on hydrogen and a relatively limited effect on other gases, thereby enhancing the specificity of the sensing material for hydrogen.
Apart from Pt/WO3, other nanomaterial systems are also being explored for high-performance hydrogen sensing. For instance, Pd-based alloy/oxide composite nanomaterials exhibit excellent hydrogen sensitivity and anti-poisoning performance at medium and low temperatures; the surface modification of two-dimensional materials (such as graphene and MoS2) with noble metal nanoparticles can take advantage of their large specific surface area and high carrier mobility to achieve rapid and sensitive hydrogen detection [12,24,25]. However, in comparison, Pt-loaded metal oxides, which combine a stable oxide framework with efficient Pt catalytic centers, have been proven to have more outstanding comprehensive performance in hydrogen sensing. Therefore, Pt/WO3 nanocomposites were selected as the core material for the sensing element in this study. Based on the above research progress, it can be expected that through the design of nanoscale structures and the regulation of interfaces and surfaces, the performance of hydrogen sensors in terms of sensitivity, selectivity, and response speed can be comprehensively enhanced, providing an effective solution to the existing problems of current sensors.
In response to the challenges in the field of hydrogen sensing, this study proposes and designs a hydrogen sensor based on fiber Bragg grating (FBG) and platinum-loaded tungsten trioxide (Pt/WO3) nanomaterials. This design utilizes Pt/WO3 nanomaterials as the hydrogen-sensitive medium, which is uniformly coated on the surface of the FBG to form a novel fiber hydrogen sensing probe. When hydrogen is present in the environment, the Pt/WO3 coating undergoes an exothermic reaction with hydrogen, causing a local increase in temperature or a change in refractive index, which in turn leads to a shift in the Bragg wavelength of the FBG. By real-time monitoring of the grating’s reflected wavelength, high-precision measurement of hydrogen concentration can be achieved. This sensor solution has the following prominent advantages: High sensitivity and fast response: With the catalytic exothermic effect of the Pt/WO3 nano-sensitive film, a small amount of hydrogen can cause a significant grating wavelength drift. The FBG probe has a small structure size and low thermal capacity, which helps to further shorten the thermal conduction response time and achieve quasi-real-time hydrogen concentration monitoring. In addition, the FBG detection is based on wavelength signals, avoiding the noise amplification problem that may occur in electrical sensors due to resistance/current detection at high sensitivity, thus ensuring high signal-to-noise ratio detection performance. Good selectivity and stability: By optimizing the composition and structure of the Pt loading, the catalytic sensitivity of Pt/WO3 to hydrogen is much stronger than its response to other gases, which helps to improve selectivity. At the same time, this design adopts a multi-wavelength/multi-channel detection architecture, allowing multiple FBGs with different central wavelengths to be multiplexed on a single optical fiber. Intrinsic safety and easy integration and distribution: FBG optical fiber sensors have inherent intrinsic safety characteristics. The detection process does not require a power supply or electrical signals, and will not produce electric sparks in explosive environments, making them particularly suitable for the safe monitoring of flammable gases such as hydrogen. The FBG sensing network can simultaneously read multiple grating signals through a single spectral demodulator, greatly facilitating the integration and expansion of hydrogen leakage monitoring systems.
2. Materials and Methods
In the experiment, we used Pt-loaded WO3 as the hydrogen-induced exothermic nanomaterial. The raw materials for the experiment were sodium tungstate dihydrate, citric acid monohydrate, oxalic acid dihydrate, dilute hydrochloric acid, and platinum acetylacetonate. The specific experimental steps are as follows: (1) Measure 40 mL of deionized water into a beaker, weigh 0.66 g of sodium tungstate dihydrate and 0.4 g of citric acid monohydrate with a balance, and dissolve them completely. (2) Add 0.4 g of oxalic acid dihydrate and then place it on a magnetic stirrer to stir. (3) Add the prepared 3 mol/L hydrochloric acid drop by drop to the solution while continuously stirring and measure the pH value of the solution with a pH meter until the pH value reaches 1, then stop. (4) Transfer the prepared solution to a polytetrafluoroethylene inner liner, tighten the reactor and place it in an oven, set the temperature to 160 °C, and set the holding time to 12 h. After the heating stops, wait for the reactor to cool naturally. (5) Wash the obtained precipitate with deionized water, centrifuge it three times, and freeze dry to obtain WO3 powder. (6) Mix the prepared WO3 with platinum acetylacetonate and grind the powder in a mortar multiple times to ensure thorough and uniform mixing. (7) Transfer the ground mixed powder to a crucible and place it in a muffle furnace for sintering. Set the sintering temperature to 315 °C and the time to 2 h. After heating, cool the furnace to room temperature to obtain Pt-deposited WO3.
Figure 1 presents the morphology and elemental distribution characteristics of platinum-loaded tungsten trioxide (Pt/WO3) nanomaterials. Figure 1a is a scanning electron microscopy (SEM) image, which shows that the sample is composed of regular plate-like or block-like nanocrystals stacked together, with high crystallinity and clear layered boundaries, and a scale of approximately several hundred nanometers. On the surface of these nanosheets, some smaller attached particles can be observed, which are presumed to be loaded platinum nanoclusters. Figure 1b is an energy dispersive spectroscopy (EDS) elemental mapping image of the same area, showing the superimposed distribution of W (green), Pt (purple), and O (cyan) elements, with their spatial distributions being basically consistent. Figure 1c–e are the individual channel images of W, Pt, and O, respectively. The W and O signals are strong and uniform, confirming that the main structure is tungsten oxide; the Pt signal is uniformly dispersed without obvious agglomeration, indicating that the platinum particles are highly dispersed on the surface of WO3 nanosheets. Overall, the uniform distribution of Pt elements on the WO3 substrate helps to enhance the surface activity and utilization rate of catalytic sites of the material, providing a continuous interface for electron and heat transfer during the hydrogen adsorption–reaction–desorption process, thereby laying a structural foundation for the improvement of hydrogen-induced exothermic sensing performance.
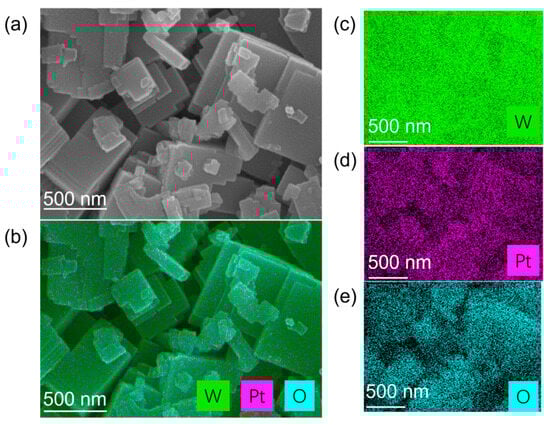
Figure 1.
Structural and elemental characterization of Pt-loaded tungsten trioxide (Pt/WO3) nanomaterials. (a) SEM image showing the morphology of WO3 nanosheets decorated with fine Pt nanoparticles. (b) Corresponding EDS elemental mapping overlay of W, Pt, and O. (c–e) Individual elemental mapping images of W (green), Pt (magenta), and O (cyan), respectively.
The synthesized Pt/WO3 nano powder was deposited onto the fiber using a pneumatic micro-powder sprayer (Xiaoling powder sprayer, Guangzhou, China, Fine tube), where each coating operation delivered approximately 10 mg of powder onto the stripped grating region. Prior to deposition, the polymer jacket of the fiber was mechanically removed over a 12 mm section, and the bare silica surface was cleaned with ethanol without applying any further chemical pretreatment. The sprayer dispersed the nano powder directly in a controlled compressed-air stream, enabling uniform deposition while rotating the fiber to avoid directional accumulation. The following are some detailed parameters: the working air pressure of the pneumatic sprayer is 0.1 MPa, the sprayer-to-fiber distance is 2 cm, the number of coating passes is 3, the rotation speed of the fiber during deposition is 1 rpm, and the total deposition duration is 30 s. Environmental conditions during coating is room temperature (22 °C) and 40% relative humidity. Post-deposition, no annealing or curing was performed, as the Pt/WO3 material had already undergone high-temperature sintering during synthesis. In Supplementary Materials, based on the thickness markers in the SEM image (Figure S1), five independent measurements of the coating thickness were obtained, giving values of 5.582, 6.141, 5.862, 5.917, and 6.085 μm. These correspond to an average thickness of 5.92 ± 0.22 μm (mean ± standard deviation, N = 5), with a variation in the range of approximately 5.6–6.1 μm. The thickness was calculated using the calibrated measurement tool of the SEM software (ZEISS GeminiSEM 300), by measuring the vertical distance of the Pt/WO3 coating at different lateral positions. This quantitative analysis further confirms that the coating thickness is well controlled and sufficiently uniform along the sensing region.
In Supplementary Materials, Figure S2a shows the optical microscopic image of the Pt/WO3 layer coated on the stripped FBG region. The coating forms a continuous and uniform film along the grating area, confirming successful adhesion of the nanomaterial to the silica surface. Figure S2b presents the SEM morphology of the coated material, revealing its characteristic flake-assembled porous structure, which remains intact after deposition and is beneficial for hydrogen diffusion and heat release. These images confirm that the Pt/WO3 nanomaterial is effectively and uniformly integrated onto the FBG surface, ensuring reliable sensor operation.
Fiber Bragg Gratings (FBG) achieve selective reflection of light at specific wavelengths by creating periodic refractive index modulations within the core of an optical fiber. The central wavelength of its reflection is known as the Bragg wavelength, which satisfies the Bragg condition: λB = 2neffΛ. λB is the Bragg wavelength, neff is the effective refractive index of the optical fiber core, Λ is the grating period. Temperature changes can cause two types of effects. The first is the thermal expansion effect, where an increase in temperature causes the physical length of the optical fiber to increase, thereby enlarging the grating period. The second type is the thermo-optic effect, where temperature changes simultaneously alter the effective refractive index of the fiber core. The combined effect of the two phenomena causes the Bragg wavelength to drift with temperature:
α = 0.55 × 10⁻⁶/°C represents the coefficient of thermal expansion of the optical fiber material. ξ = 8.6 × 10⁻⁶/°C is the thermal-optic coefficient. For the three typical C-band FBGs (grating region length is 10 mm) at 1530 nm, 1540 nm, and 1550 nm, their grating periods are approximately 528 nm, 531 nm, and 534 nm, respectively. Their fabrication processes are the same, with the main difference being the use of phase masks with different periods, which results in slightly different refractive index modulation periods of the gratings and thus achieves different center wavelengths. The writing light source (TuiLaser BraggStar 200, TuiLaser, Munich, Germany, 248 nm), modulation depth (~30 dB) and exposure process remain consistent, making them suitable for multi-channel temperature/hydrogen sensing and other scenarios.
When the Pt/WO3 sensitive film absorbs and catalyzes the hydrogen reaction, the Bragg wavelength of the FBG will shift due to the thermal effect, and the shift is correlated with the hydrogen concentration, enabling the detection of hydrogen concentration. The parameters of the FBG itself can significantly affect the performance of the sensor. FBG is usually inscribed in a fiber segment several millimeters long (commonly about 5–10 mm). Appropriately lengthening the grating (for example, using an FBG about 10 mm long in this work) can increase the total surface area reacting with hydrogen, generating a greater total thermal effect, thereby enhancing sensitivity. Therefore, the length of the grating needs to be balanced to ensure uniform heating of the entire FBG. The depth of refractive index modulation determines the reflectivity and spectral bandwidth of the grating. In the design, a moderate grating length and sufficient refractive index modulation are usually selected to obtain a narrowband and highly reflective FBG, improving the sensor’s resolution and stability for wavelength shifts.
The material parameters of the Pt/WO3 sensitive film are also key factors influencing the sensing performance. The thicker the sensitive film is, the more catalytic active sites can be provided per unit volume, and a more thorough exothermic reaction can occur at a higher hydrogen concentration, thus resulting in a greater total drift of the Bragg wavelength. However, an overly thick film layer will lead to a slower response time. On the one hand, hydrogen molecules need more time to diffuse through the thick film to reach the underlying catalytic active sites; on the other hand, the heat capacity and thermal resistance of the film layer increase, delaying the heat conduction to the optical fiber. In addition, the morphology and thermal conductivity of the sensitive film also affect the performance. The addition of Pt nanoparticles not only provides catalytic centers but also, due to their metallic thermal conductivity, facilitates the rapid conduction of heat to the optical fiber. Therefore, in the design of the membrane material, we use nanostructures to regulate the thermal conductivity and diffusion characteristics, introduce a loose structure to increase the specific surface area and diffusion channels, thereby enhancing the sensitivity while accelerating the response speed. The Pt/WO3 coating, relying on the stable oxide framework of WO3, can maintain good adhesion and reversibility even after repeated exposure to 0.5–3.5% hydrogen cycles in air, without incurring irreversible damage. Therefore, this sensor can safely cover the range from lower concentrations to the lower explosive limit of hydrogen.
As shown in Figure 2, it is the schematic diagram of the system structure for the FBG hydrogen sensing experiment. The optical signal output by the broadband light source (Max-ray photonics, Hefei, China, ASE-CL-10-T-SM-B) is first coupled into the optical circulator via an optical fiber, and the optical circulator guides the optical signal into the sensing branch. In the experiment, three FBG hydrogen sensor channels are set up to achieve multi-point hydrogen detection. The incident light is modulated and reflected in each sensor, and the reflected light is returned through the optical circulator and enters the spectrometer (Yokogawa, Tokyo, Japan, AQ6370D). The spectrometer collects and analyzes the reflected spectrum in real time to obtain the center wavelength changes in each sensing channel, which is used to determine the hydrogen concentration and sensing performance. Three sensors presented are not different structural or functional designs, but rather three replicates of the same Pt/WO3-coated FBG hydrogen sensor. All sensors were fabricated using identical materials, coating procedures, and structural configurations. The only intentional difference among them lies in their initial Bragg wavelengths, which were selected to demonstrate the feasibility of a multi-wavelength, wavelength division-multiplexed sensing architecture.
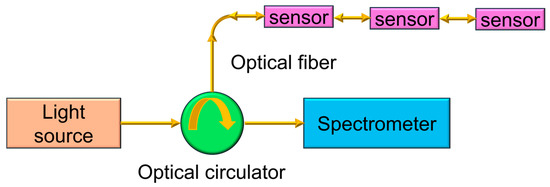
Figure 2.
Schematic diagram of the experimental setup for the FBG hydrogen sensing system.
3. Results
Figure 3 presents the reflection spectrum characteristics of a hydrogen sensor constructed by integrating Pt/WO3 nanomaterials with an FBG. Under ambient air conditions, the initial characteristic reflection wavelength of the FBG is 1530.055 nm. As the hydrogen concentration increases, the platinum catalyst effectively facilitates the dissociation and adsorption of hydrogen molecules, thereby initiating an exothermic hydrogenation reaction. This process raises the temperature of the sensitive layer, leading to changes in both the effective refractive index and the grating period of the FBG. These combined effects result in a systematic shift in the sensor’s reflection spectrum toward longer wavelengths, manifesting as a distinct redshift phenomenon. When the hydrogen concentration reaches 3.5%, the characteristic wavelength of the FBG stabilizes at 1530.971 nm. The observed redshift exhibits a clear correlation with increasing hydrogen concentration, demonstrating that the sensor can reliably and sensitively detect variations in hydrogen levels.
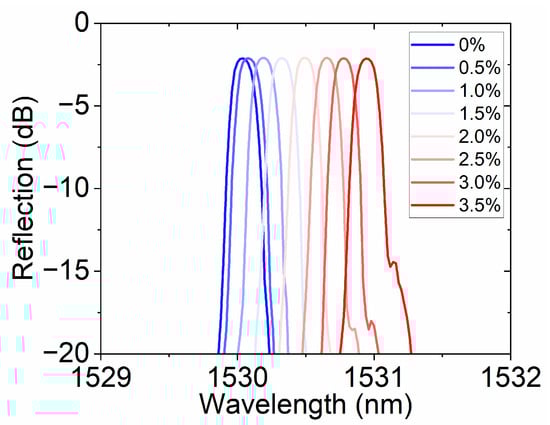
Figure 3.
Hydrogen-induced redshift in the Pt/WO3 coated fiber Bragg grating.
Figure 4 shows the continuous response characteristics of the FBG hydrogen sensor based on Pt/WO3 nanomaterials at different hydrogen concentrations. In the experiment, for each concentration, hydrogen was introduced for 3 min followed by air for another 3 min, with each cycle lasting 6 min, and this was repeated for three cycles. It can be observed that as hydrogen concentration gradually increases (from 0.5% to 3.5%), the wavelength shift gradually increases, showing a stable periodic change and good reversibility. With the increase in hydrogen concentration, both the reaction rate and the reaction amount of hydrogen molecules significantly increase, making the exothermic effect more pronounced and thus resulting in a greater wavelength shift. The cyclic experiments further indicate that this process can be repeatedly carried out in an alternating hydrogen–air environment, demonstrating that the sensor has good reversibility and stability.
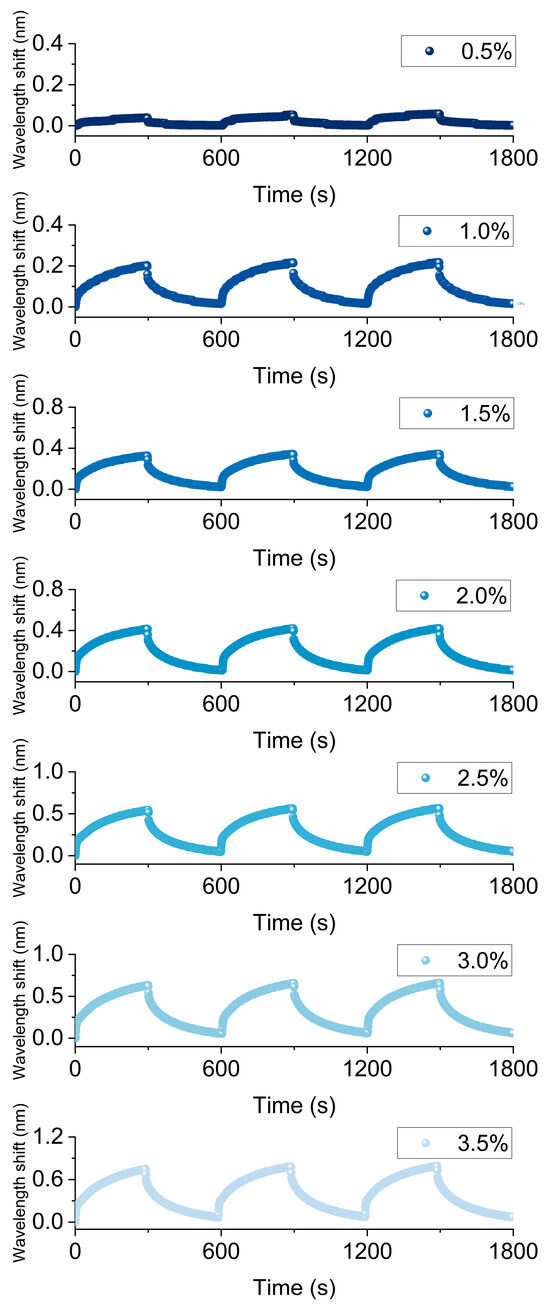
Figure 4.
Continuous response of the Pt-loaded WO3 FBG hydrogen sensor at 0.5–3.5% H2.
The experimental results in Figure 5 systematically demonstrate the response characteristics of the Pt/WO3 FBG to different hydrogen concentrations, reflecting the wavelength shift and its dynamic behavior caused by the hydrogen-induced exothermic effect. Figure 5a shows the wavelength shift. As the hydrogen concentration increases from 0.5% to 3.5%, the wavelength shift shows a clear increasing trend, indicating that the sensor has good concentration dependence and high sensitivity. Especially in the medium and high concentration range, the wavelength response is more significant, demonstrating a strong amplification effect of the material on hydrogen molecules, which provides a reliable basis for precise concentration discrimination. Figure 5b shows the response time. At low concentrations, the response time is slightly longer, but it tends to stabilize at 1% and above concentrations, indicating that the sensor has rapid and stable response characteristics in the actual working range. This short and stable response time is crucial for real-time monitoring of hydrogen leakage. Figure 5c shows the recovery time. The recovery time slightly increases with the increase in concentration, but it remains relatively stable throughout the entire concentration range and can still quickly return to the initial state at high concentrations, indicating that the sensor has good reversibility and repeatability. This stable recovery behavior ensures the reliability of the sensor in multiple cycle tests and its feasibility for long-term use.
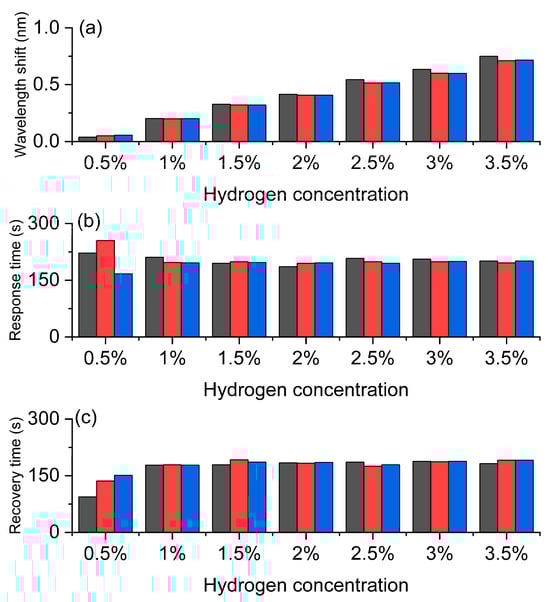
Figure 5.
Hydrogen sensing characteristics of the Pt-loaded WO3 FBG sensor. (a) Wavelength shift increases with hydrogen concentration, confirming high sensitivity. (b) Response time remains relatively fast and stable. (c) Recovery time shows good reversibility and repeatability. The gray, red, and blue bars correspond to the three repeated test cycles, respectively.
Figure 6 shows the correspondence between hydrogen concentration and wavelength shift. The experimental data are represented by blue dots with error bars, and the red line is the result of linear fitting. According to the fitting parameters, the linear equation obtained is (y = −0.016 + 0.218x), with a positive slope, indicating that the wavelength shift significantly increases with the increase in hydrogen concentration. The goodness of fit is high, with a coefficient of determination (R2 = 0.990), suggesting that the linear model can well describe the experimental results. Overall, the sensor exhibits stable and good linear response characteristics within the hydrogen concentration range of 0.5% to 3.5%, facilitating quantitative detection and calibration of hydrogen concentration.
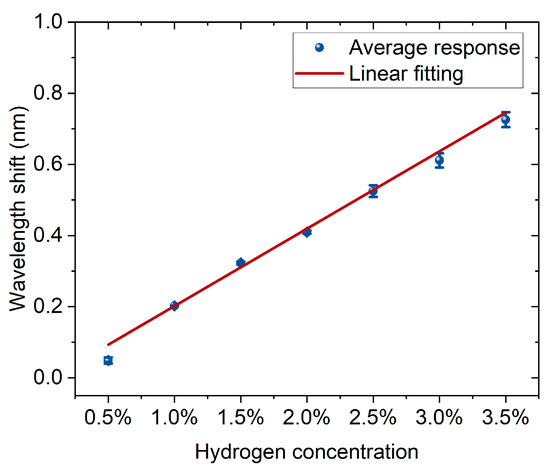
Figure 6.
The linear relationship between hydrogen concentration and wavelength shift. Blue dots with error bars represent the average responses, and the red line indicates the linear fitting.
As shown in Figure 7, the experimental results clearly demonstrate the typical concentration dependence and kinetic characteristics of this optical fiber hydrogen sensor under the hydrogen-induced exothermic mechanism. Figure 7a presents the continuous response curves of the optical fiber hydrogen sensor at different hydrogen concentrations. As the hydrogen concentration gradually increases from 0.5% to 3.5%, the redshift amplitude of the resonance wavelength significantly increases and reaches its maximum at the highest concentration. When the hydrogen concentration gradually decreases back to 0.5%, the wavelength response decreases and approaches the initial state, indicating that the sensor not only has good sensitivity but also maintains excellent reversibility and repeatability in concentration cycles. The statistical results shown in Figure 7b further verify the monotonic dependence of the wavelength shift on the hydrogen concentration, demonstrating that the sensor can effectively distinguish different concentration levels and exhibit outstanding quantitative detection capability.
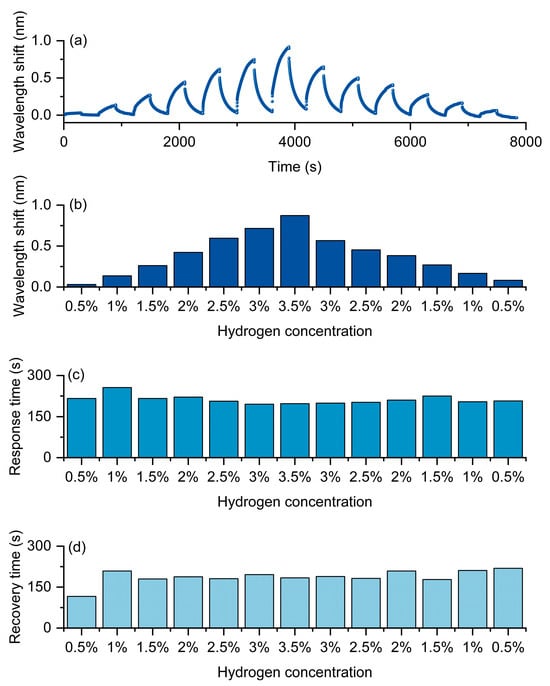
Figure 7.
Hydrogen sensing of the Pt/WO3-coated FBG sensor. (a) Continuous wavelength response during cyclic H2 exposure (0.5–3.5%). (b) Wavelength shift versus concentration. (c) Response time. (d) Recovery time.
In terms of dynamic characteristics, Figure 7c,d, respectively, present the variations of response time and recovery time. The results show that both remain relatively stable within different concentration ranges, without significant prolongation or fluctuation as the concentration increases. This indicates that the device exhibits a balanced kinetic process during adsorption and desorption, demonstrating rapid and stable response characteristics. This is of great significance for achieving real-time hydrogen concentration monitoring.
From a mechanism perspective, the improvement in sensor performance is attributed to the hydrogen-induced exothermic effect. When hydrogen molecules dissociate on the Pt catalyst surface and react with WO3, the released heat causes a local temperature rise, which in turn alters the refractive index distribution of the sensitive layer and the FBG, resulting in a redshift in the characteristic wavelength. The higher the hydrogen concentration, the more intense the reaction and heat release, and the greater the wavelength shift. When the hydrogen concentration decreases, the desorption process and heat release weaken, and the wavelength gradually recovers.
Figure 8 shows the reflection spectral response of the FBG hydrogen sensor based on the hydrogen-induced exothermic effect at different hydrogen concentrations. As the hydrogen concentration gradually increases from 0% to 3.5%, the resonance peak position gradually redshifts, demonstrating the sensor’s high sensitivity to hydrogen concentration. This response characteristic driven by the hydrogen-induced thermal effect not only ensures a fast wavelength response speed but also has a strong concentration dependence, reflecting the sensor’s excellent sensitivity and stability. Traditional fiber optic hydrogen sensors often rely on a single channel or fixed band for monitoring. In this work, by changing the central wavelength position, channel expansion was achieved. This method not only enhances the sensor’s applicability in a wide concentration range but also provides experimental evidence for multi-channel parallel detection based on wavelength division multiplexing.
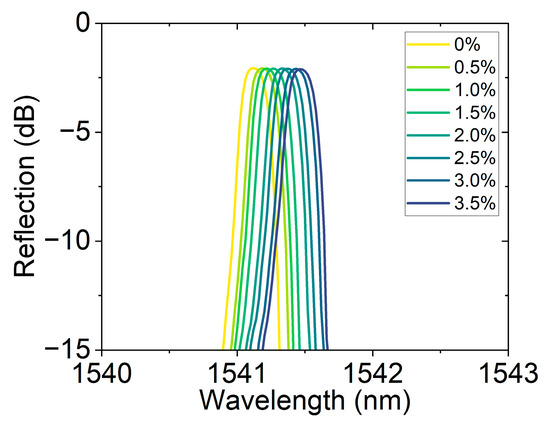
Figure 8.
Reflection spectra of the hydrogen sensor at different concentrations (0–3.5%), showing resonance wavelength shifts with concentration, enabling channel extension through center wavelength variation.
As illustrated in Figure 9, the FBG hydrogen sensor exhibits favorable response characteristics under varying hydrogen concentrations. Figure 9a demonstrates a progressive increase in hydrogen-induced wavelength shift with rising hydrogen concentration, indicating the sensor’s capability to effectively differentiate between different hydrogen levels and reflect its pronounced concentration dependence and sensitivity. Figure 9b reveals a moderate extension in response time with increasing hydrogen concentration, suggesting that the diffusion and catalytic reaction processes of hydrogen molecules become more pronounced at higher concentrations. Figure 9c shows consistent reversibility in recovery time across different concentrations, confirming the sensor’s excellent repeatability and stability during cyclic detection operations.
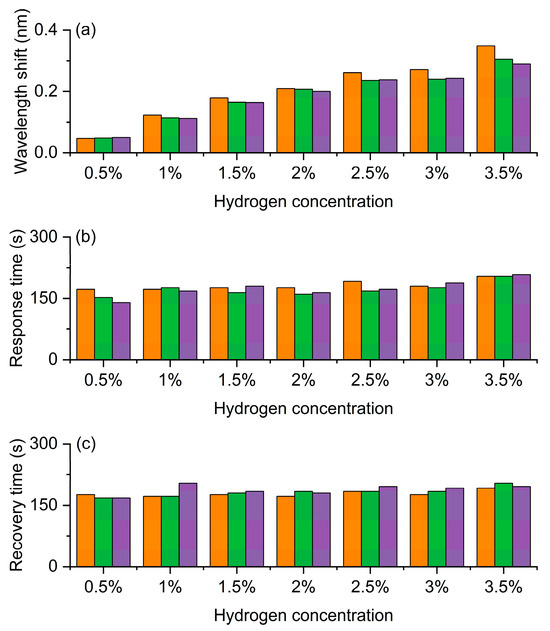
Figure 9.
Experimental results of the FBG hydrogen sensor based on exothermic hydrogen-sensitive nanomaterials with a central wavelength of 1541 nm. (a) Wavelength shift as a function of hydrogen concentration. (b) Response time at different hydrogen concentrations. (c) Recovery time corresponding to hydrogen concentration. The orange, green and purple bars represent the first, second, and third measurement cycles, respectively.
As shown in Figure 10, the hydrogen-induced exothermic FBG sensor exhibits a good linear response within the hydrogen concentration range of 0.5% to 3.5%. According to the linear fitting results, the correlation coefficient between the wavelength shift and hydrogen concentration reaches 0.992, and the coefficient of determination R2 is 0.984, indicating that the fitting curve can explain more than 98% of the data variation, with extremely high credibility. Its slope is 0.102 nm/%, indicating that the sensor has high sensitivity to hydrogen concentration changes. In the experiment, the data points at different concentrations are basically consistent with the linear fitting curve, with a small error range, proving that the sensor has good repeatability and stability in both low and high concentration ranges. Therefore, this result indicates that the sensor can not only achieve sensitive detection of hydrogen concentration but also has reliable linear response characteristics.
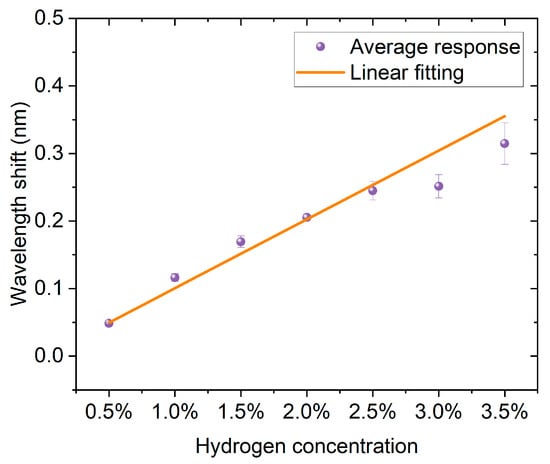
Figure 10.
Linear response of the FBG hydrogen sensor based on hydrogen-induced exothermic effect.
Figure 11 shows the hydrogen detection performance of the FBG hydrogen sensor based on hydrogen-induced exothermic nanomaterials at a central wavelength of 1541 nm. During the experiment, the sensor was exposed to hydrogen gas at different concentrations (0.5–3.5%) for 3 min each, followed by air for 3 min, completing a full cycle before gradually reducing the hydrogen concentration. As shown in Figure 11a, during the hydrogen concentration increase phase, the hydrogen-induced wavelength shift significantly increases with the concentration, reaching the maximum at 3.5%, indicating that the exothermic reaction is stronger at higher concentrations, leading to an increase in grating temperature and refractive index change, thus causing a greater red shift. During the hydrogen concentration decrease phase, the wavelength shift gradually decreases with concentration, demonstrating the sensor’s good reversibility and stability. Figure 11b indicates that the response time increases with the hydrogen concentration and slightly rises at high concentrations (about 3.5%), then gradually decreases during the concentration reduction process, which is related to the diffusion and desorption rates of hydrogen in the sensitive layer. Figure 11c shows that the recovery time remains stable overall and varies little at different concentrations, indicating that the sensor has good dehydrogenation ability and thermal stability in air. Overall, the sensor exhibits high sensitivity, good repeatability and reversibility during the increase and decrease cycles, verifying its feasibility for reliable hydrogen detection over a wide concentration range.
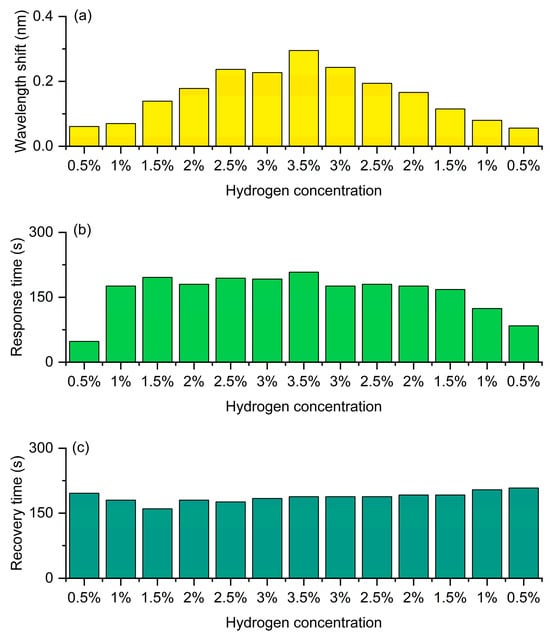
Figure 11.
Hydrogen sensing performance of the FBG coated with heat-generating nanomaterials at a central wavelength of 1541 nm. (a) Wavelength shift. (b) Response time. (c) Recovery time.
Figure 12 shows the reflection spectrum changes in the hydrogen sensor based on hydrogen-induced exothermic nanomaterials loaded on FBG at different hydrogen concentrations. The initial central wavelength of the sensor is approximately 1550 nm. As the hydrogen concentration gradually increases from 0% to 3.5%, the spectrum undergoes a significant redshift, that is, the reflection peak shifts towards the long-wave direction. This phenomenon is attributed to the exothermic reaction of the platinum-loaded oxide nanomaterials during the hydrogen absorption process, which leads to a local temperature rise and thus causes a change in the effective refractive index of the FBG. As the hydrogen concentration increases, the exothermic effect intensifies, and the refractive index change becomes more significant, resulting in a gradually increasing wavelength shift. Additionally, the spectral curve shapes at each concentration remain good, and the reflection intensity changes smoothly, indicating that the sensor has high spectral stability and repeatability.
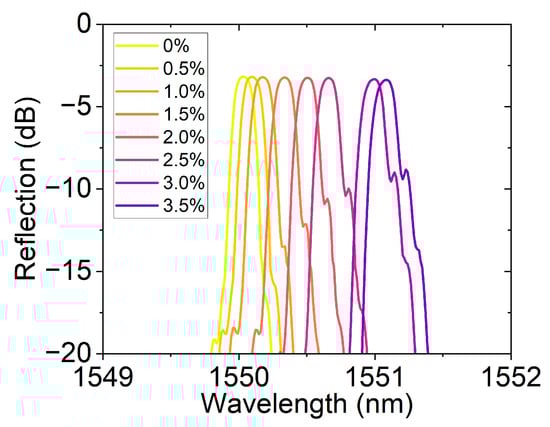
Figure 12.
Reflection spectra of the FBG hydrogen sensor at different hydrogen concentrations (0–3.5%).
Figure 13 shows the results of the repeatability test. As shown in Figure 13a, the wavelength response is presented. As the hydrogen concentration increases from 0.5% to 3.5%, Δλ increases monotonically overall. Under the same concentration, the column heights of the three cycles are close, with a very small dispersion, indicating good repeatability and short-term stability, and no obvious drift was observed, suggesting that there is no cumulative effect or irreversible attenuation of the material during the hydrogen absorption cycles. From a physical perspective, the hydrogen-induced exothermic reaction causes a local temperature rise and an increase in the effective refractive index, resulting in a redshift in the grating resonance. The higher the concentration, the greater the reaction exothermicity and hydrogen absorption, and the larger the Δλ. As shown in Figure 13b, the response time is presented. The response times of the three measurements at each concentration are close to each other and remain within a similar range as the concentration changes. This indicates that the kinetics of heating/absorption of hydrogen are mainly controlled by the combined effect of heat conduction and surface reaction rate, rather than being strongly dependent on concentration. This is beneficial for adopting a fixed time window for reading in engineering applications. As shown in Figure 13c, the recovery time varies little among different concentrations and shows good consistency in three cycles, indicating that the dehydrogenation and heat dissipation processes are stable and reproducible. At most concentrations, the recovery time is comparable to or slightly shorter than the response time, which is conducive to increasing the frequency of cyclic detection.
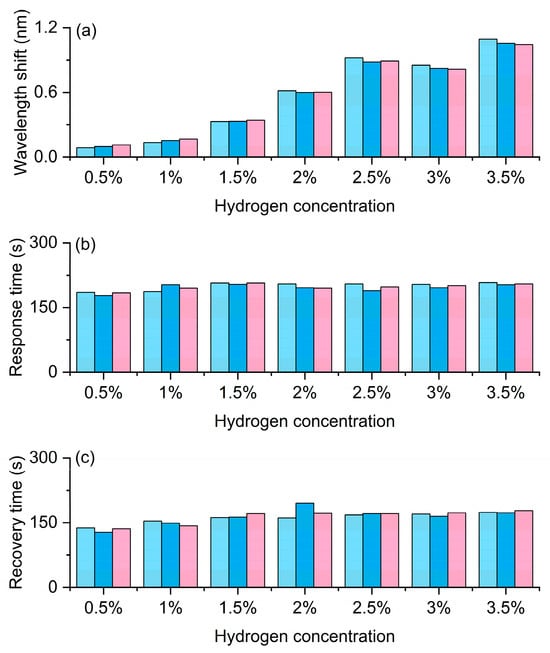
Figure 13.
Hydrogen sensing performance of the FBG sensor based on exothermic nanomaterials under repeated cycles. (a) Wavelength shift. (b) Response time. (c) Recovery time. Light blue, dark blue and pink columns denote the first, second, and third cycles, respectively.
Figure 14 shows the linear relationship between hydrogen concentration and the average wavelength response. By averaging the wavelength shift for each concentration over three experiments, it can be observed that the wavelength increases significantly with the rise in hydrogen concentration, showing a good linear growth trend. The linear fitting results indicate that the fitting equation is y = −0.154 + 0.355x, with a slope of 0.355, which means the sensitivity of the wavelength shift to hydrogen concentration is approximately 0.355 nm/%. The coefficient of determination R2 = 0.932, indicating a high degree of fitness and good consistency of the data. The results demonstrate that this fiber optic hydrogen sensor has a stable and linear spectral response characteristic to hydrogen concentration changes, enabling quantitative analysis of hydrogen concentration.
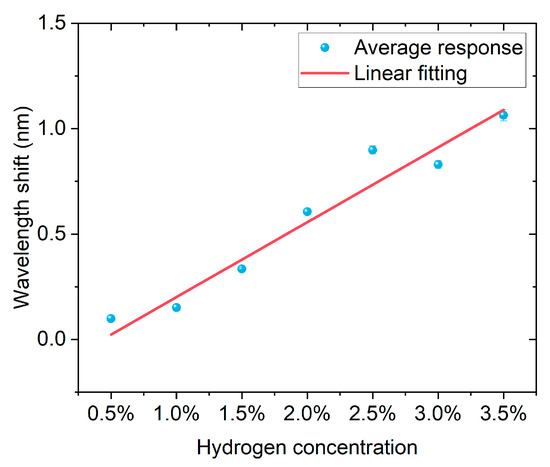
Figure 14.
Linear relationship between the average wavelength shift and hydrogen concentration of the FBG hydrogen sensor.
Figure 15 presents the wavelength and kinetic responses of the same device to an increasing and then decreasing concentration sequence in a continuous hydrogen/air cycle. Figure 15a shows the shift in the resonant wavelength during the process where the hydrogen concentration gradually increases from 0.5% to 3.5% and then gradually decreases back to 0.5%. It can be clearly seen that during the rising stage of concentration, the wavelength shift significantly increases with the increase of hydrogen concentration, showing an approximately linear growth trend, reaching the maximum value (about 1.03 nm) at a concentration of 3.5%. Subsequently, during the descending stage of concentration, the wavelength shift gradually decreases and basically returns to the initial level. The overall curve is almost symmetrical between the rising and falling processes, with only a slight lag, indicating that the fiber optic hydrogen sensor has good reversibility and repeatability in the hydrogen absorption and desorption processes. This symmetry reflects that the hydrogen-induced exothermic effect and the resulting grating refractive index change can be stably reproduced in the cycle, demonstrating the excellent stability of the sensor. Figure 15b shows the variation trend of response time at different concentrations. Throughout the entire concentration range, the response time remains generally stable (approximately 150–180 s), indicating that the response rate is not significantly affected by concentration and is mainly determined by the hydrogen absorption kinetics and heat release rate of the material. Notably, the distribution of response times during the concentration increases and decreases phases is basically consistent, without significant delay or drift, demonstrating that the sensor has excellent kinetic stability in multi-cycle detection. Figure 15c shows the variation in recovery time at different concentrations. The recovery time slightly increases with the rise of hydrogen concentration, reaching a maximum value (about 170 s) around 3.5%, and then gradually decreases as the concentration drops. The recovery process corresponds to the desorption of hydrogen from the sensitive layer and the dissipation of heat. Therefore, at high concentrations, dehydrogenation and heat dissipation require more time. When the concentration drops from 3.5% back to 0.5%, the trend of the recovery time change is nearly symmetrical to the ascending stage, without obvious hysteresis or irreversible behavior, indicating that the sensor has good recovery ability and cycling stability.
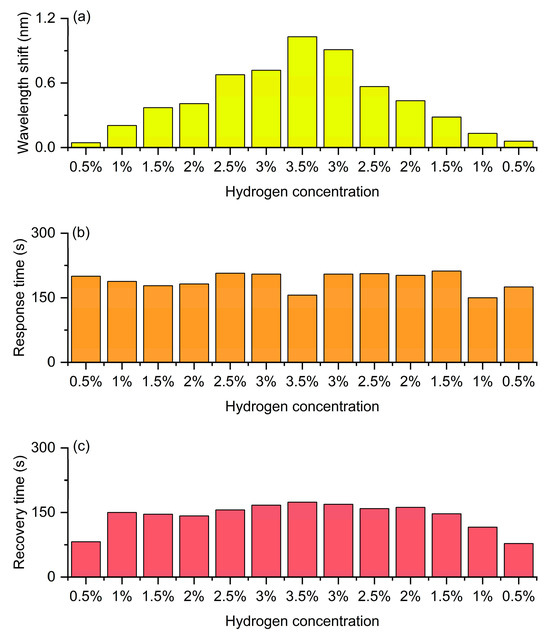
Figure 15.
Continuous cyclic detection of the FBG hydrogen sensor with hydrogen concentration increasing from 0.5% to 3.5% and then decreasing to 0.5%. (a) Wavelength shift. (b) Response time. (c) Recovery time.
To verify the cross-sensitivity of the sensor, considering its potential application scenarios and the experimental conditions in the laboratory, we chose ammonia (NH3), carbon dioxide (CO2) and methane (CH4) to test the performance of the sensor. As shown in Supplementary Materials, Figure S3, a selective experiment was conducted using a sensor with a central wavelength of 1530.29 nm. In the experiment, air was introduced for 3 min first to stabilize the atmosphere, followed by the introduction of 0.5% NH3 (Figure S3a), 0.5% CO2 (Figure S3b), and 0.5% CH4 (Figure S3c). The experimental results indicated that the sensor was not sensitive to the above gases. Therefore, this sensor has good selectivity.
Further, in Supplementary Materials, we have carried out research related to humidity interference, as shown in Figure S4. The initial central wavelength of the sensor is approximately 1550 nm. We performed an additional humidity–interference experiment by exposing the Pt/WO3-coated FBG sensor to a high-humidity (Relative humidity 90%) environment before hydrogen testing, as shown in Figure S4a. The measured wavelength shifts at hydrogen concentrations of 0.5–3.5% were compared directly with the baseline measurements. The results show that humidity induces only minimal variation and does not alter the monotonic and linear dependence of wavelength shift on H2 concentration. This indicates that although WO3 can physiosorbed water molecules, the hydrogen-induced exothermic reaction on Pt nanoparticles remains unaffected. Therefore, the sensor exhibits strong robustness against humidity, validating that water vapor does not compromise its sensing accuracy or functional stability.
We performed an additional humidity-interference experiment to directly evaluate whether water vapor affects the Pt/WO3-coated FBG sensor, as shown in Figure S4b. The FBG sensor was exposed sequentially to 40% RH and 90% RH. The wavelength shift remains essentially unchanged (<0.001 nm variation) when humidity increases from 40% to 90%. This result demonstrates that water vapor does not introduce observable interference to the Pt/WO3-coated FBG sensor. These results confirm that the developed sensor maintains stable hydrogen response under large humidity fluctuations and is therefore suitable for real-world environments.
4. Discussion
In Supplementary Materials, as shown in the SEM and EDS mapping images (Figure S5), the Pt/WO3 nanomaterial retains a highly stable microstructure, with no observable cracking, detachment, agglomeration, or coating loss after repeated thermal cycling induced by hydrogen oxidation. Nanoscale morphology remains nearly unchanged. The EDS elemental maps further confirm that Pt, W, and O remain homogeneously distributed across the fiber surface after cycling, demonstrating that neither Pt migration nor material peeling occurred.
The EDS quantitative results before hydrogen exposure (O: 16.08 wt%, W: 62.83 wt%, Pt: 21.09 wt%) and after more than 30 hydrogen–air cycles (O: 14.81 wt%, W: 65.37 wt%, Pt: 19.81 wt%) show only minor variations within the expected experimental uncertainty range of SEM–EDS analysis. The slight decrease in oxygen content (≈1.27 wt%) and platinum content (≈1.28 wt%), together with a corresponding small increase in tungsten content (≈2.54 wt%), indicates that no measurable material loss, powder detachment, or Pt aggregation occurred during cycling. Importantly, the Pt proportion remains essentially unchanged, demonstrating that active catalytic sites were preserved. The nearly constant W/O ratio further confirms that the WO3 framework remained structurally intact.
Although all three FBG hydrogen-sensing channels demonstrate clear concentration-dependent wavelength shifts, their linear response characteristics show observable differences at higher hydrogen concentrations. The 1530 nm channel exhibits the best linearity (R2 = 0.990), while the 1541 nm and 1550 nm channels present relatively lower linearity (R2 = 0.984 and R2 = 0.932, respectively). This inconsistency can be attributed to several factors. First, slight variations in the Pt/WO3 coating thickness and uniformity among different FBGs result in different thermal capacities. A thicker sensitive layer tends to exhibit partial thermal saturation at higher concentrations, reducing the linear increment of wavelength shift. Second, the intrinsic temperature sensitivity of FBGs depends on their center wavelength because the thermo-optic coefficient and mode-field distribution vary slightly across different grating bands, leading to different wavelength–temperature conversion efficiencies. Third, the hydrogen-induced exothermic reaction of Pt/WO3 becomes less linear at higher concentrations due to the gradual reduction in active catalytic sites, which weakens the correlation between concentration and temperature rise.
During the concentration cycling process, there are slight differences in the wavelength shift at the same hydrogen concentration point, which is a reversible hysteresis feature under the hydrogen-induced exothermic mechanism. The main reasons for its formation include: (1) Asymmetry in hydrogen adsorption–desorption rates: The hydrogen adsorption rate on the Pt surface during the concentration increase stage is higher than the desorption rate during the concentration decrease stage, resulting in a slightly higher local temperature during the concentration increase; (2) Kinetic differences in hydrogen diffusion and anti-diffusion within the WO3 lattice, leading to differences in the time constants for heat release and dissipation; (3) The lag in the decay of local heat accumulation, causing the temperature recovery during the concentration decrease stage to lag slightly behind the concentration change. Multi-cycle tests show that the hysteresis curve has no cumulative drift and exhibits good repeatability, indicating that this hysteresis is a reversible thermodynamic effect rather than an irreversible change in the material. Through bidirectional calibration (fitting for both concentration increase and decrease), the error caused by hysteresis can be further eliminated, ensuring the sensor’s reliable and stable quantitative detection capability in engineering applications.
To further demonstrate the effectiveness of the multi-channel structure, the three FBG sensors (with central wavelengths of 1530 nm, 1541 nm, and 1550 nm) adopted in this study are completely identical to the devices characterized in the independent experiments described earlier, featuring the same grating writing process, reflection bandwidth characteristics, and Pt/WO3 sensitive layers fabricated by the same process. Therefore, their responses driven by the hydrogen-induced thermal effect are highly comparable, ensuring the reliability of the multi-channel structure. During the multi-channel demodulation process, the three reflection spectra are simultaneously read using wavelength division multiplexing. As the center wavelengths of each channel are approximately 10 nm apart and the reflection bandwidth of a single FBG is less than 0.3 nm, the spectral peaks of all channels remain completely separated without any spectral overlap, and optical crosstalk can be ignored. Additionally, the three sensing heads are physically spaced apart, and the hydrogen-induced exothermic effect of the Pt/WO3 sensitive layer is a local phenomenon, which does not form a conductive thermal diffusion in the optical fiber, thus eliminating the issue of thermal crosstalk. Moreover, since all three sensors are made of the same materials and fabricated using the same process, their sensitivity levels and linear ranges are highly consistent. The multi-channel system only requires a one-time calibration of the linear coefficient for each channel to achieve quantitative detection, without the need for cross-calibration. Based on the independent channel experimental results presented earlier, it can be proven that the response characteristics of the three channels are consistent and repeatable, thereby supporting the feasibility of the multi-channel parallel detection structure. This result indicates that the multi-wavelength FBG array structure proposed in this study has good scalability and engineering application potential.
Semiconductor-type sensors such as SnO2 and ZnO often need to operate at high temperatures to maintain their reactivity, although they can achieve high sensitivity, the high-temperature operation increases energy consumption and explosion-proof requirements, which is not conducive to intrinsically safe application scenarios [26]. In contrast, the multi-wavelength hydrogen sensor based on Pt/WO3 nanomaterials coupled with fiber Bragg grating in this study can stably detect 0.5–3.5% H2 at room temperature, with a sensitivity as high as 0.355 nm/%, and shows good linearity (R2 > 0.98) and repeatability, effectively covering the critical concentration range near the lower explosive limit of hydrogen. Notably, compared with graphene or Pd-modified two-dimensional material sensors, the Pt/WO3 nano sensitive layer used in this work has stronger chemical stability, avoiding the problems of noble metal agglomeration or carrier aging, and achieves wavelength-type optical output through the FBG structure, naturally possessing anti-electromagnetic interference and intrinsic safety, making it suitable for flammable environments [27].
5. Conclusions
Research has demonstrated that the FBG sensor based on the hydrogen-induced exothermic mechanism of Pt/WO3 nanomaterials exhibits high sensitivity, good linearity, and excellent repeatability. As the hydrogen concentration increases, the grating reflection wavelength shifts steadily towards the red, and it shows outstanding reversibility in cyclic tests. This sensor achieves rapid response and recovery within the concentration range of 0.5% to 3.5%, and the multi-channel structure significantly enhances monitoring capability and system scalability. Experimental results verify the application potential of this scheme in hydrogen energy safety monitoring and distributed sensing, laying the foundation for the construction of intrinsically safe and highly reliable hydrogen detection systems.
Supplementary Materials
The following supporting information can be downloaded at: https://www.mdpi.com/article/10.3390/photonics13010022/s1. Figure S1. SEM images and thickness measurements of the Pt/WO3 coating. Figure S2. Morphology of the Pt/WO3 coating applied on the FBG sensor. (a) Optical microscopy image showing the Pt/WO3 layer uniformly deposited on the exposed FBG region. (b) SEM image of the Pt/WO3 nanostructures, revealing their sheet-like particulate morphology. Figure S3. A selective experiment with NH3, CO2 and CH4. Figure S4. The influence of humidity on wavelength response. (a) Comparison of wavelength shifts under normal and high-humidity conditions. (b) Wavelength response of the Pt/WO3-coated FBG hydrogen sensor under varying humidity conditions. Figure S5. SEM morphology and EDS mapping of Pt/WO3 nanomaterials. (a) Before hydrogen exposure and (b) after >30 hydrogen–air sensing cycles.
Author Contributions
Conceptualization, X.Z.; methodology, X.Z.; validation, X.Z., F.M., and S.W.; formal analysis, X.Z.; investigation, X.Z., F.M., and S.W.; resources, X.Z., J.W., and W.P.; data curation, X.Z. and F.M.; writing—original draft preparation, X.Z.; writing—review and editing, X.Z., Y.L., J.W., and W.P.; visualization, X.Z.; supervision, J.W. and W.P.; funding acquisition, X.Z., Y.L., J.W. and W.P. All authors have read and agreed to the published version of the manuscript.
Funding
This research was funded by the Bolian Research Funds of Dalian Maritime University (3132024605), Liaoning Provincial Doctoral Research Initiation Project (2025-BS-0237), Fundamental Research Funds for the Central Universities (3132024605, 3132023506), National Natural Science Foundation of China (NSFC) (52171343, 62171076), National Key Research and Development Program of China (2024YFF0510100, 2023YFB3209500), Liaoning Revitalization Talents Program (XLYC2202007), and Dalian key field innovation team (2021RT05).
Data Availability Statement
The original contributions presented in this study are included in the article. Further inquiries can be directed to the corresponding author.
Conflicts of Interest
The authors declare no conflicts of interest.
References
- Huang, B.; Wang, Y.; Wang, C.; Wang, L.; Yan, S. Catalytic Combustion Hydrogen Sensors for Vehicles: Hydrogen-Sensitive Performance Optimization Strategies and Key Technical Challenges. Processes 2025, 13, 2384. [Google Scholar] [CrossRef]
- Yan, S.; Cao, Y.; Su, Y.; Huang, B.; Chen, C.; Yu, X.; Xu, A.; Wu, T. Hydrogen Sensors Based on Pd-Based Materials: A Review. Sensors 2025, 25, 3402. [Google Scholar] [CrossRef]
- Sun, C.; Xu, B.; Li, P. Hydrogen Sensor Based on NTC Thermistor with Pt-Loaded WO3/SiO2 Coating. Micromachines 2022, 13, 2219. [Google Scholar] [CrossRef] [PubMed]
- Zhong, X.; Yang, M.; Huang, C.; Wang, G.; Dai, J.; Bai, W. Water photolysis effect on the long-term stability of a fiber optic hydrogen sensor with Pt/WO3. Sci. Rep. 2016, 6, 39160. [Google Scholar] [CrossRef]
- He, X.; Yuan, J.-H.; Li, Q.; Yang, Y.; Tang, W.; Wu, S.; Chen, Q.; Xia, Y.; Zhang, Z.; Zhang, Y.; et al. A resistivity-Type Palladium Decorated WSe2 Device for Ultralow Concentration Hydrogen Detection. Adv. Compos. Hybrid Mater. 2025, 8, 354. [Google Scholar] [CrossRef]
- Wang, C.; Yang, J.; Li, J.; Luo, C.; Xu, X.; Qian, F. Solid-state electrochemical hydrogen sensors: A review. Int. J. Hydrogen Energy 2023, 48, 31377–31391. [Google Scholar] [CrossRef]
- Del Orbe Henriquez, D.; Cho, I.; Yang, H.; Choi, J.; Kang, M.; Chang, K.S.; Jeong, C.B.; Han, S.W.; Park, I. Pt Nanostructures Fabricated by Local Hydrothermal Synthesis for Low-Power Catalytic-Combustion Hydrogen Sensors. ACS Appl. Nano Mater. 2021, 4, 7–12. [Google Scholar] [CrossRef]
- Wei, X.; Liang, Y.; Zhang, X.; Li, R.; Wei, H.; He, Y.; Shen, L.; Fang, Y.; Xu, T.; Peng, W. Multi-resonance enhanced photothermal synergistic fiber-optic Tamm plasmon polariton tip for high-sensitivity and rapid hydrogen detection. Opto-Electron. Sci. 2025, 4, 240029. [Google Scholar] [CrossRef]
- Zhang, X.; Li, X.; Zhang, X.; Peng, W. Fiber Optics-Mechanics Coupling Sensor for High-Performance Hydrogen Detection. Photonic Sens. 2025, 15, 250314. [Google Scholar] [CrossRef]
- Duan, Z.-D.; Zhou, Z.-J.; Zhu, S.; Diao, W.-Q.; Liu, Z.; Fan, L.; Zhang, S.-Y.; Cheng, L.-P.; Xu, X.-D. A low-temperature hydrogen sensor based on an acoustic topological material. Appl. Phys. Lett. 2023, 123, 172201. [Google Scholar] [CrossRef]
- Li, H.; Li, Y.; Wang, K.; Lai, L.; Xu, X.; Sun, B.; Yang, Z.; Ding, G. Ultra-high sensitive micro-chemo-mechanical hydrogen sensor integrated by palladium-based driver and high-performance piezoresistor. Int. J. Hydrogen Energy 2021, 46, 1434–1445. [Google Scholar] [CrossRef]
- Dai, J.; Chen, Z.; Yang, R.; Wu, Z.; Tang, Z.; Hu, W.; Cheng, C.; Wang, X.; Yang, M. Early Detection of Hydrogen Leakage Using Fiber Optic Hydrogen Sensor Based on WO3-PdPt-Pt Nanocomposite Films. Nanomaterials 2025, 15, 836. [Google Scholar] [CrossRef]
- Kim, J.H.; Lee, J.Y.; Kim, E.S.; Jeong, M.Y. Electric field enhancement of coupled plasmonic nanostructures for optical amplification. PhotoniX 2023, 4, 8. [Google Scholar] [CrossRef]
- Yao, J.; Ou, J.-Y.; Savinov, V.; Chen, M.K.; Kuo, H.Y.; Zheludev, N.I.; Tsai, D.P. Plasmonic anapole metamaterial for refractive index sensing. PhotoniX 2022, 3, 23. [Google Scholar] [CrossRef]
- Liang, H.; Zhou, L.; Chen, P.; Zheng, J.; Huang, Y.; Liang, J.; Zhong, J.; Huang, Y.; Yu, M.; Guan, B.-O. Optical Microfiber with a Gold Nanorods–Black Phosphorous Nanointerface: An Ultrasensitive Biosensor and Nanotherapy Platform. Anal. Chem. 2022, 94, 8058–8065. [Google Scholar] [CrossRef] [PubMed]
- Huang, Y.; Liang, J.; Wu, H.; Chen, P.; Xiao, A.; Guan, B.-O. Microscale insight into the proton concentration during electrolytic reaction via an optical microfiber: Potential for microcurrent monitoring by a dielectric probe. Light Sci. Appl. 2025, 14, 73. [Google Scholar] [CrossRef]
- Mattoni, G.; de Jong, B.; Manca, N.; Tomellini, M.; Caviglia, A.D. Single-Crystal Pt-Decorated WO3 Ultrathin Films: A Platform for Sub-ppm Hydrogen Sensing at Room Temperature. ACS Appl. Nano Mater. 2018, 1, 3446–3452. [Google Scholar] [CrossRef] [PubMed]
- Darmadi, I.; Nugroho, F.A.A.; Langhammer, C. High-Performance Nanostructured Palladium-Based Hydrogen Sensors—Current Limitations and Strategies for Their Mitigation. ACS Sens. 2020, 5, 3306–3327. [Google Scholar] [CrossRef]
- Lee, E.-B.; Hwang, I.-S.; Cha, J.-H.; Lee, H.-J.; Lee, W.-B.; Pak, J.J.; Lee, J.-H.; Ju, B.-K. Micromachined catalytic combustible hydrogen gas sensor. Sens. Actuators B Chem. 2011, 153, 392–397. [Google Scholar] [CrossRef]
- Yamazoe, N.; Sakai, G.; Shimanoe, K. Oxide Semiconductor Gas Sensors. Catal. Surv. Asia 2003, 7, 63–75. [Google Scholar] [CrossRef]
- Jun-Seo, L.; Jin Woo, A.; Sukang, B.; Seoung-Ki, L. Review of Hydrogen Gas Sensors for Future Hydrogen Mobility Infrastructure. Appl. Sci. Converg. Technol. 2022, 31, 79–84. [Google Scholar] [CrossRef]
- Horprathum, M.; Srichaiyaperk, T.; Samransuksamer, B.; Wisitsoraat, A.; Eiamchai, P.; Limwichean, S.; Chananonnawathorn, C.; Aiempanakit, K.; Nuntawong, N.; Patthanasettakul, V.; et al. Ultrasensitive Hydrogen Sensor Based on Pt-Decorated WO3 Nanorods Prepared by Glancing-Angle dc Magnetron Sputtering. ACS Appl. Mater. Interfaces 2014, 6, 22051–22060. [Google Scholar] [CrossRef]
- Shuangjiao, W.; Zhenglan, B.; Xingquan, W.; Xiaokang, M.; Guilin, Z.; Liang, X.; Anduo, H.; Gaofang, L.; Fenghong, C. Study of WO3/Pt hydrogen sensitive film fabricated by Sol-Gel method. Optik 2022, 271, 170124. [Google Scholar] [CrossRef]
- Ma, J.; Zhou, Y.; Bai, X.; Chen, K.; Guan, B.-O. High-sensitivity and fast-response fiber-tip Fabry–Pérot hydrogen sensor with suspended palladium-decorated graphene. Nanoscale 2019, 11, 15821–15827. [Google Scholar] [CrossRef]
- Liyanage, D.N.; Thathsara, T.; Harrison, C.J.; Kingshott, P.; Shafiei, M. Recent advances in hydrogen gas sensors based on molybdenum disulfide (MoS2). Int. J. Hydrogen Energy 2025, 161, 150685. [Google Scholar] [CrossRef]
- Lee, B.; Cho, S.; Jeong, B.J.; Lee, S.H.; Kim, D.; Kim, S.H.; Park, J.-H.; Yu, H.K.; Choi, J.-Y. Highly responsive hydrogen sensor based on Pd nanoparticle-decorated transfer-free 3D graphene. Sens. Actuators B Chem. 2024, 401, 134913. [Google Scholar] [CrossRef]
- Luo, Y.; Zhang, C.; Zheng, B.; Geng, X.; Debliquy, M. Hydrogen sensors based on noble metal doped metal-oxide semiconductor: A review. Int. J. Hydrogen Energy 2017, 42, 20386–20397. [Google Scholar] [CrossRef]


Disclaimer/Publisher’s Note: The statements, opinions and data contained in all publications are solely those of the individual author(s) and contributor(s) and not of MDPI and/or the editor(s). MDPI and/or the editor(s) disclaim responsibility for any injury to people or property resulting from any ideas, methods, instructions or products referred to in the content. |
© 2025 by the authors. Licensee MDPI, Basel, Switzerland. This article is an open access article distributed under the terms and conditions of the Creative Commons Attribution (CC BY) license.